1. Introduction
The application of advanced data analytics in football has significantly enhanced the capacity to objectively evaluate player performance. Metrics such as expected goals (xG) and expected goals on target (xGOT) have become fundamental tools in the quantification of scoring opportunities and goalkeeper (GK) performance, respectively [
1,
2]. While the xG metric measures the probability of a shot resulting in a goal based on pre-shot conditions, such as shooting location, shot type, and the preceding play [
3,
4], the xGOT metric refines this estimate by incorporating post-shot information [
5,
6]. Specifically, xGOT assesses the shot’s actual placement and the degree of difficulty it presents to the GK. It considers factors like the exact target area within the goal (e.g., top corner vs. central zone), the GK’s positioning and response at the moment of the shot, and technical aspects of the strike, including power and ball trajectory, which influence the complexity of a potential save [
7,
8]. By accounting for these post-shot variables, xGOT offers a more nuanced evaluation of shot quality and GK performance, thus enhancing our understanding of match dynamics and player impact.
Despite these advancements, a critical limitation persists: current metrics did not sufficiently isolate and quantify the quality of the shooter’s technical execution under match conditions [
3,
4,
5,
6]. Specifically, there remains a need for a model capable of assessing the complexity and difficulty of the shooting action itself, independently of the final outcome (goal or no goal) or the GK’s intervention.
To address this gap, the present study introduces a novel metric: the Expected Shot Impact Timing (xSIT). This metric was designed to evaluate the shooting action by considering the spatial configuration of the shooter, the GK, and all outfield players, as well as incorporating dynamic variables such as ball velocity and player reaction time. Specifically, this metric analyzes the time interval between the execution of a shot and the onset of player movement, which is primarily governed by the reaction time of both GK and outfield players [
9]. In doing so, xSIT captures the degree of difficulty and situational constraints faced by the shooter at the moment of execution, offering a more comprehensive analysis of technical performance.
The xSIT model builds upon existing approaches to spatial modeling and dynamic analysis in football [
10], introducing methodological innovations such as the construction of a shooting triangle, the integration of player reaction time (GK and outfield players), and the consideration of ball velocity. These enhancements enable a finer-grained evaluation of the post-shot context, situating xSIT conceptually between the existing xG and xGOT metrics.
The main objective of this study was to develop and validate an innovative metric, termed Expected Shot Impact Timing (xSIT), designed to assess the shooting action in football under dynamic match conditions. The model’s accuracy was evaluated through statistical analyses and further validated through consultations with professional match analysts who possess over 25 years of experience across various competition levels. Expert feedback was also integrated into the feature selection process and the interpretation of their influence on predictive outcomes. As a secondary objective, this study compared the performance and discriminative capacity of two existing post-shot expected goal metrics (xSIT and xGOT, expected goals on target) in evaluating the probability of scoring for shots on target after the moment of execution. Additionally, practical applications of the model were showcased using data from the 2023 Women’s World Cup and the 2022 Men’s World Cup, demonstrating its relevance to coaching staff and decision makers within the field of football analytics.
2. Materials and Methods
The sample for the present study comprised all national professional teams that participated in the 2023 Women’s World Cup and the 2022 Men’s World Cup tournaments. Specifically, data were collected from 32 national teams, both men’s and women’s, corresponding to 64 matches analyzed across both tournaments. This study analyzed a total of 3059 shot events recorded across both tournaments. The dataset included all matches from the group stage through to the final, explicitly excluding penalty kicks. Of the total shots, 1437 were registered in the men’s tournament (488 shots on target and 949 shots off target) and 1622 in the women’s tournament (510 shots on target and 1112 shots off target).
Team-level data were retrieved from the open access repository StatsBomb Open Data [
11] (
https://github.com/statsbomb/open-data/blob/master/data/competitions.json) (10 February 2025). This platform is widely used in sports performance analysis across multiple disciplines, including football, and its reliability has been previously validated in the scientific literature [
12,
13]. Below,
Table 1 presents a detailed account of the variables derived from synchronized positional and event data, which were incorporated into the development and training of the xSIT model.
In line with established ethical research standards, no personally identifiable information concerning individual players was included in the study. The research protocol received approval from the local ethics committee (Approval Code: 2025-0019).
3. Expected Shot Impact Timing (xSIT) Modeling
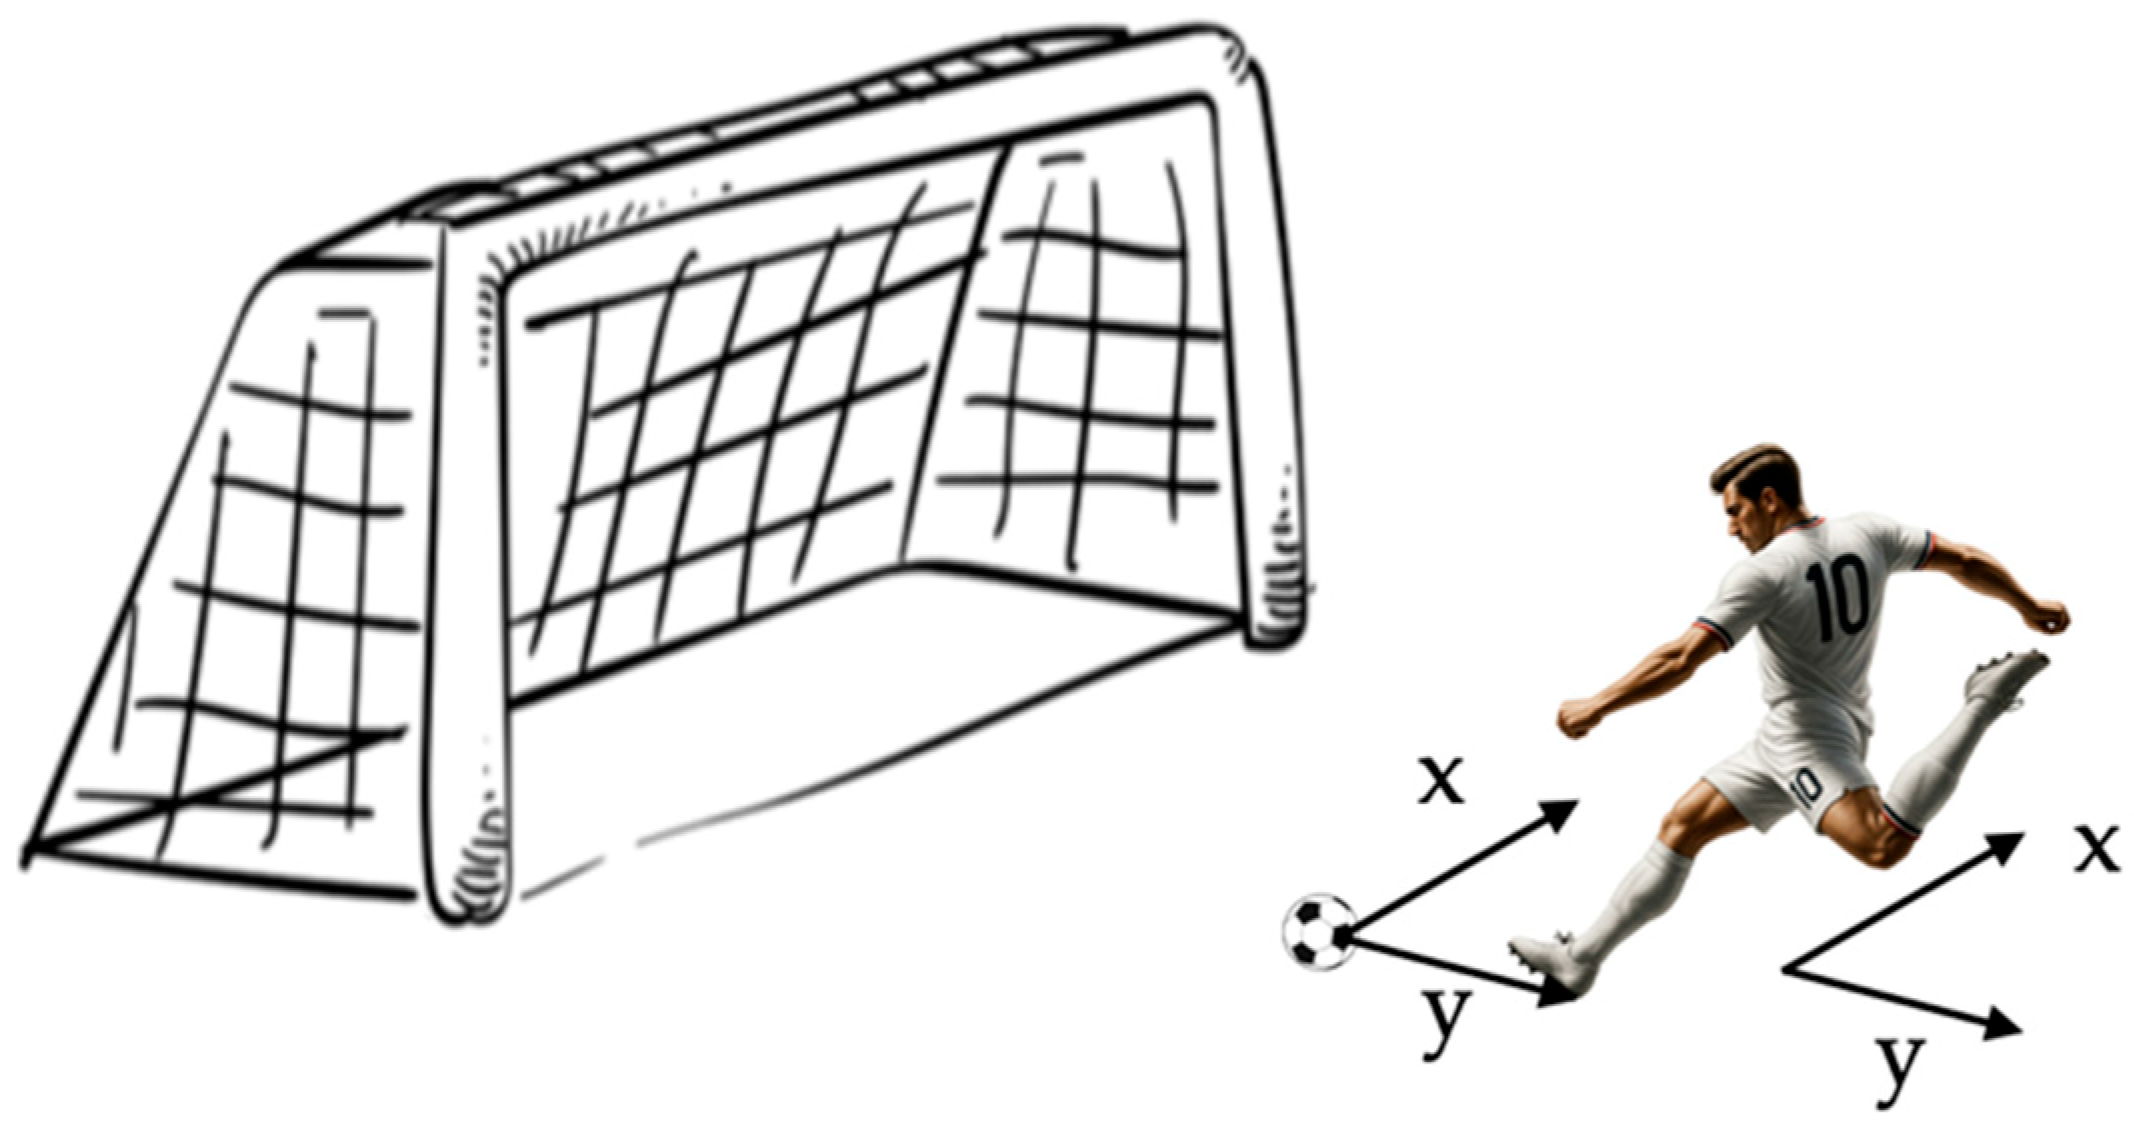
For the development of our model, we utilized and examined various types of data related to factors influencing goal scoring. Prior to proceeding, it is important to clarify that we assumed all players and GKs to be homogeneous. Thus, under identical initial conditions, any player taking a shot would yield the same expected outcome.
Based on regulatory standards and the average dimensions of professional football fields, spatial measurements were extracted accordingly. The coordinate system was defined with the origin (0,0,0) located at one corner of the pitch, depending on the data provider’s convention. In this system, the x-axis represents the lateral (frontal) width of the field, the y-axis corresponds to the longitudinal (sagittal) depth toward the goal, and the z-axis denotes the vertical height of players and the ball relative to the ground. For our study, the x-coordinate was not necessary to use, as it was not relevant to the analysis (
Figure 1).
Based on the data described in the table above (
Table 1), we can now pose the following questions:
How effective was the shot? Was the player positioned optimally? To address these questions, we generated an image representing the range of possible player movements. By applying pixel classification techniques to this image, we will assess the quality of the shooting position.
In developing this model, the following steps were undertaken:
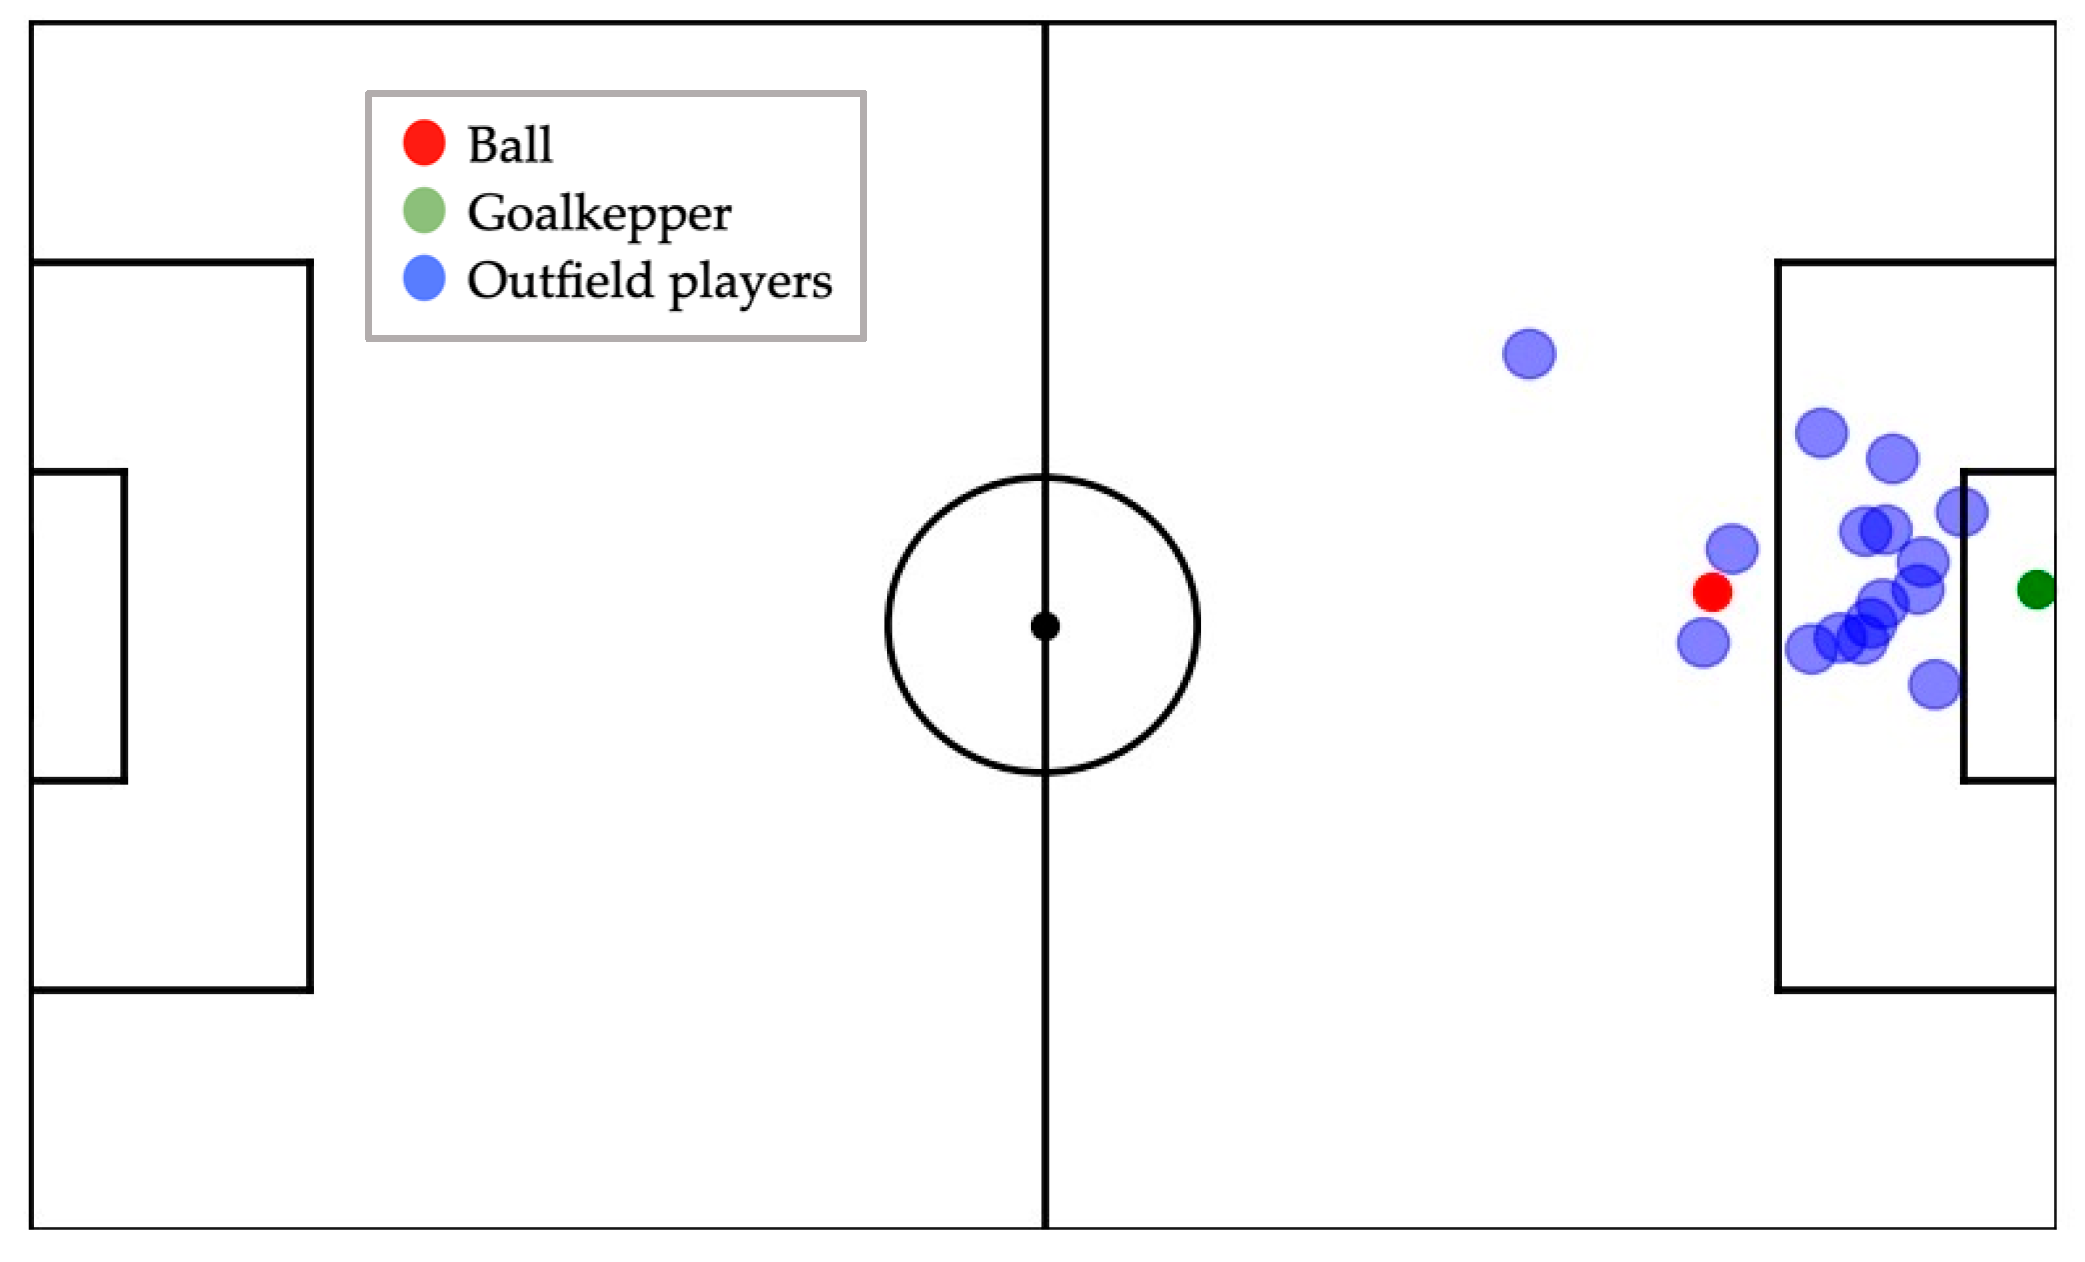
Step 1. Data Extraction. Using the aforementioned database, the positions of all players at the moment of each shot were identified.
Step 2. Field Mapping. Each player’s position was mapped onto a representation of the football field.
Step 3. Role Differentiation. Different roles were visually distinguished by color coding:
- -
The GK was represented by a green point.
- -
Outfield players were represented by blue points.
- -
The shooter (ball) was represented by a red point.
Step 4. Graphical Representation. All players and the GK were modeled as points, following the methodology described in previous studies (
Figure 2) [
14].
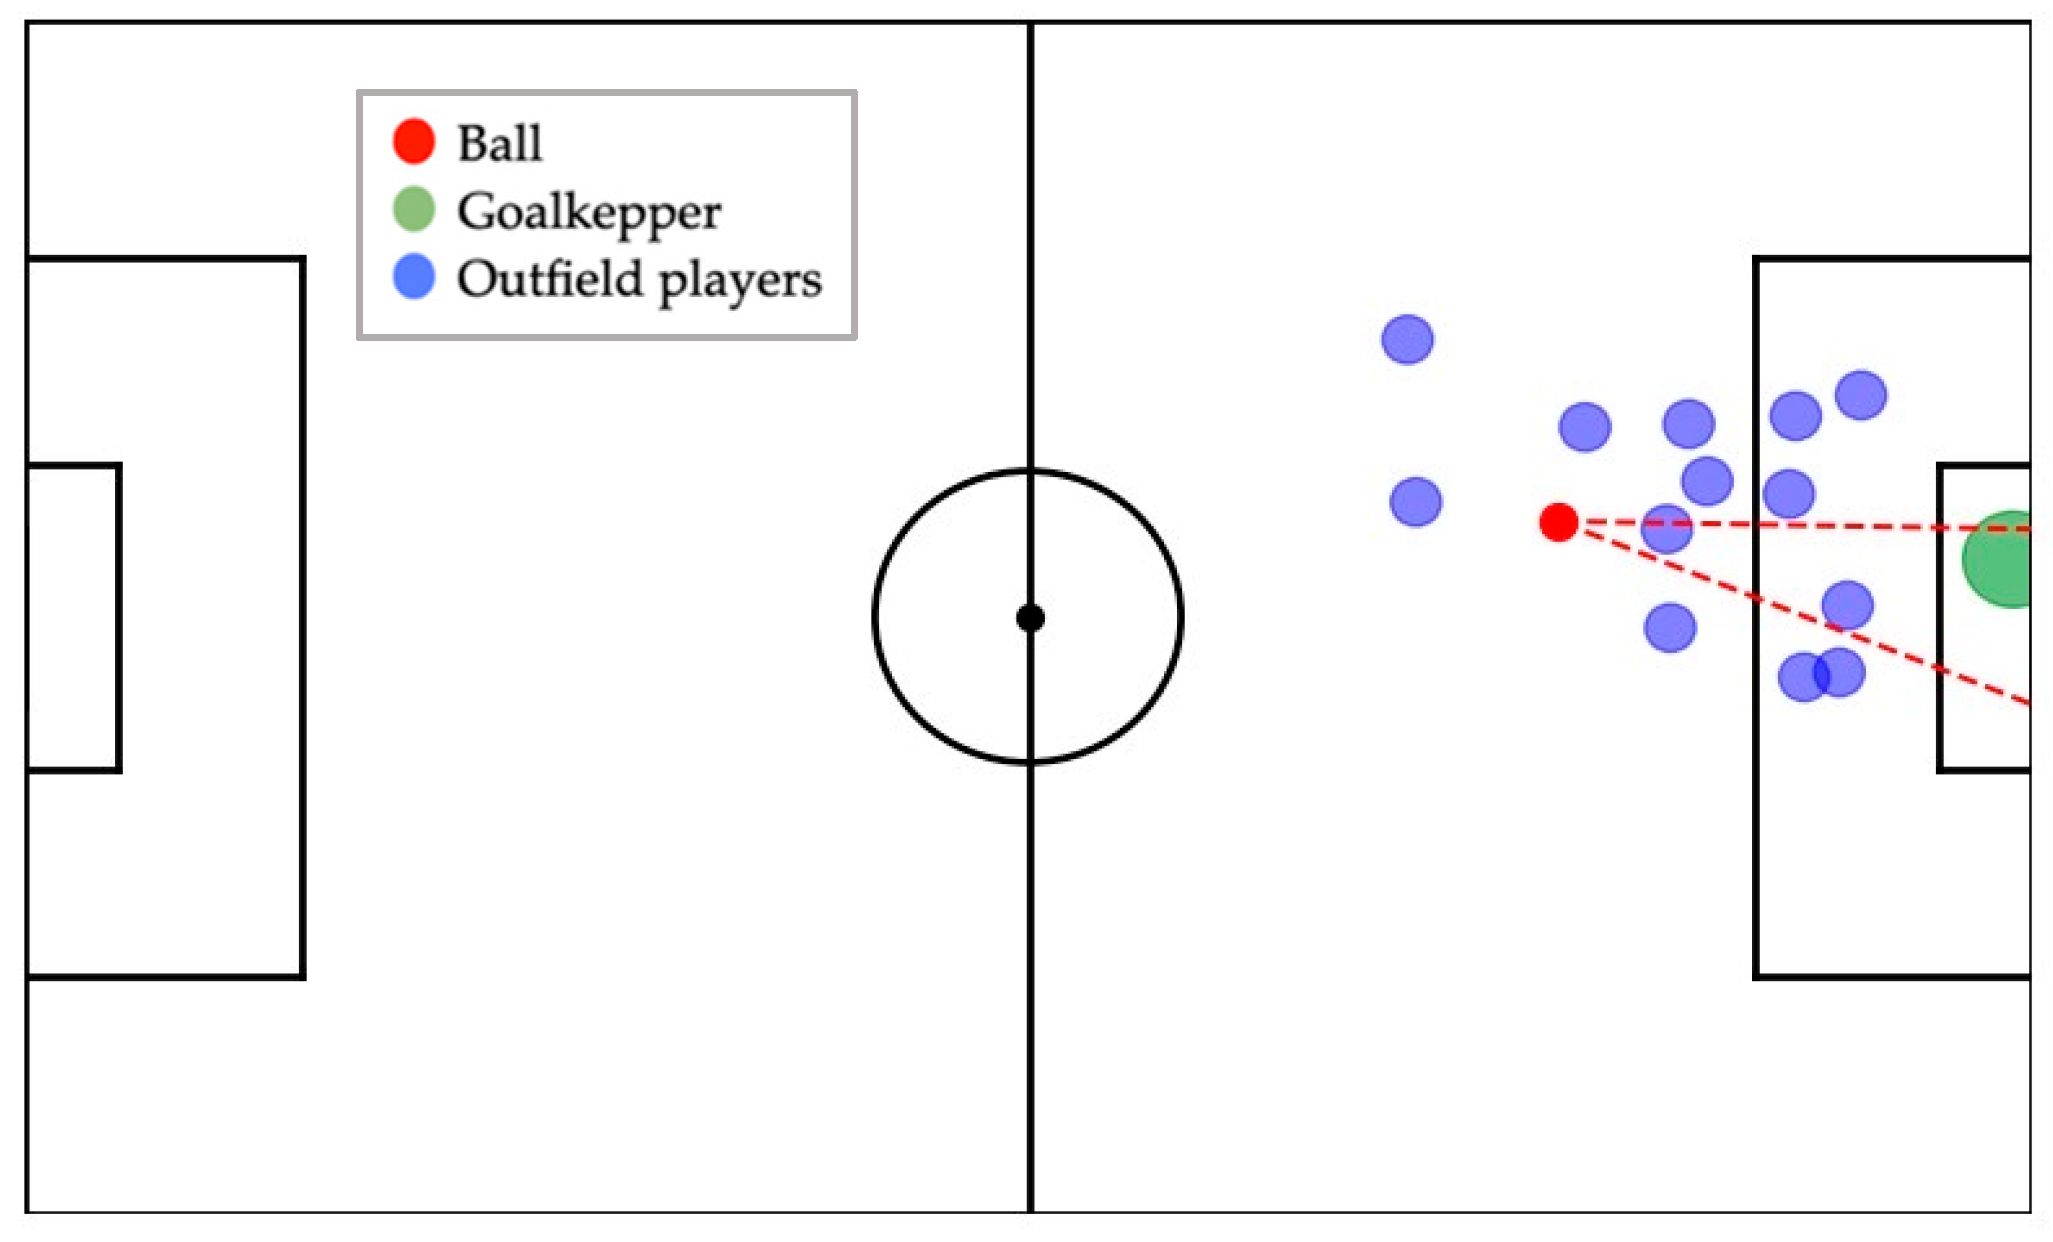
Step 5. Generation of the Shooting Triangle. After obtaining the previous image, we generated a triangle defined by the following vertices (
Figure 3):
- -
The shooter (the position of the player taking the shot);
- -
The left post of the goal;
- -
The right post of the goal.
This triangle represents the theoretical zone through which the ball could travel toward the goal, assuming no obstacles. Following the creation of the triangle, we incorporated the players who may act as obstacles, and the ball’s trajectory was adjusted to account for them.
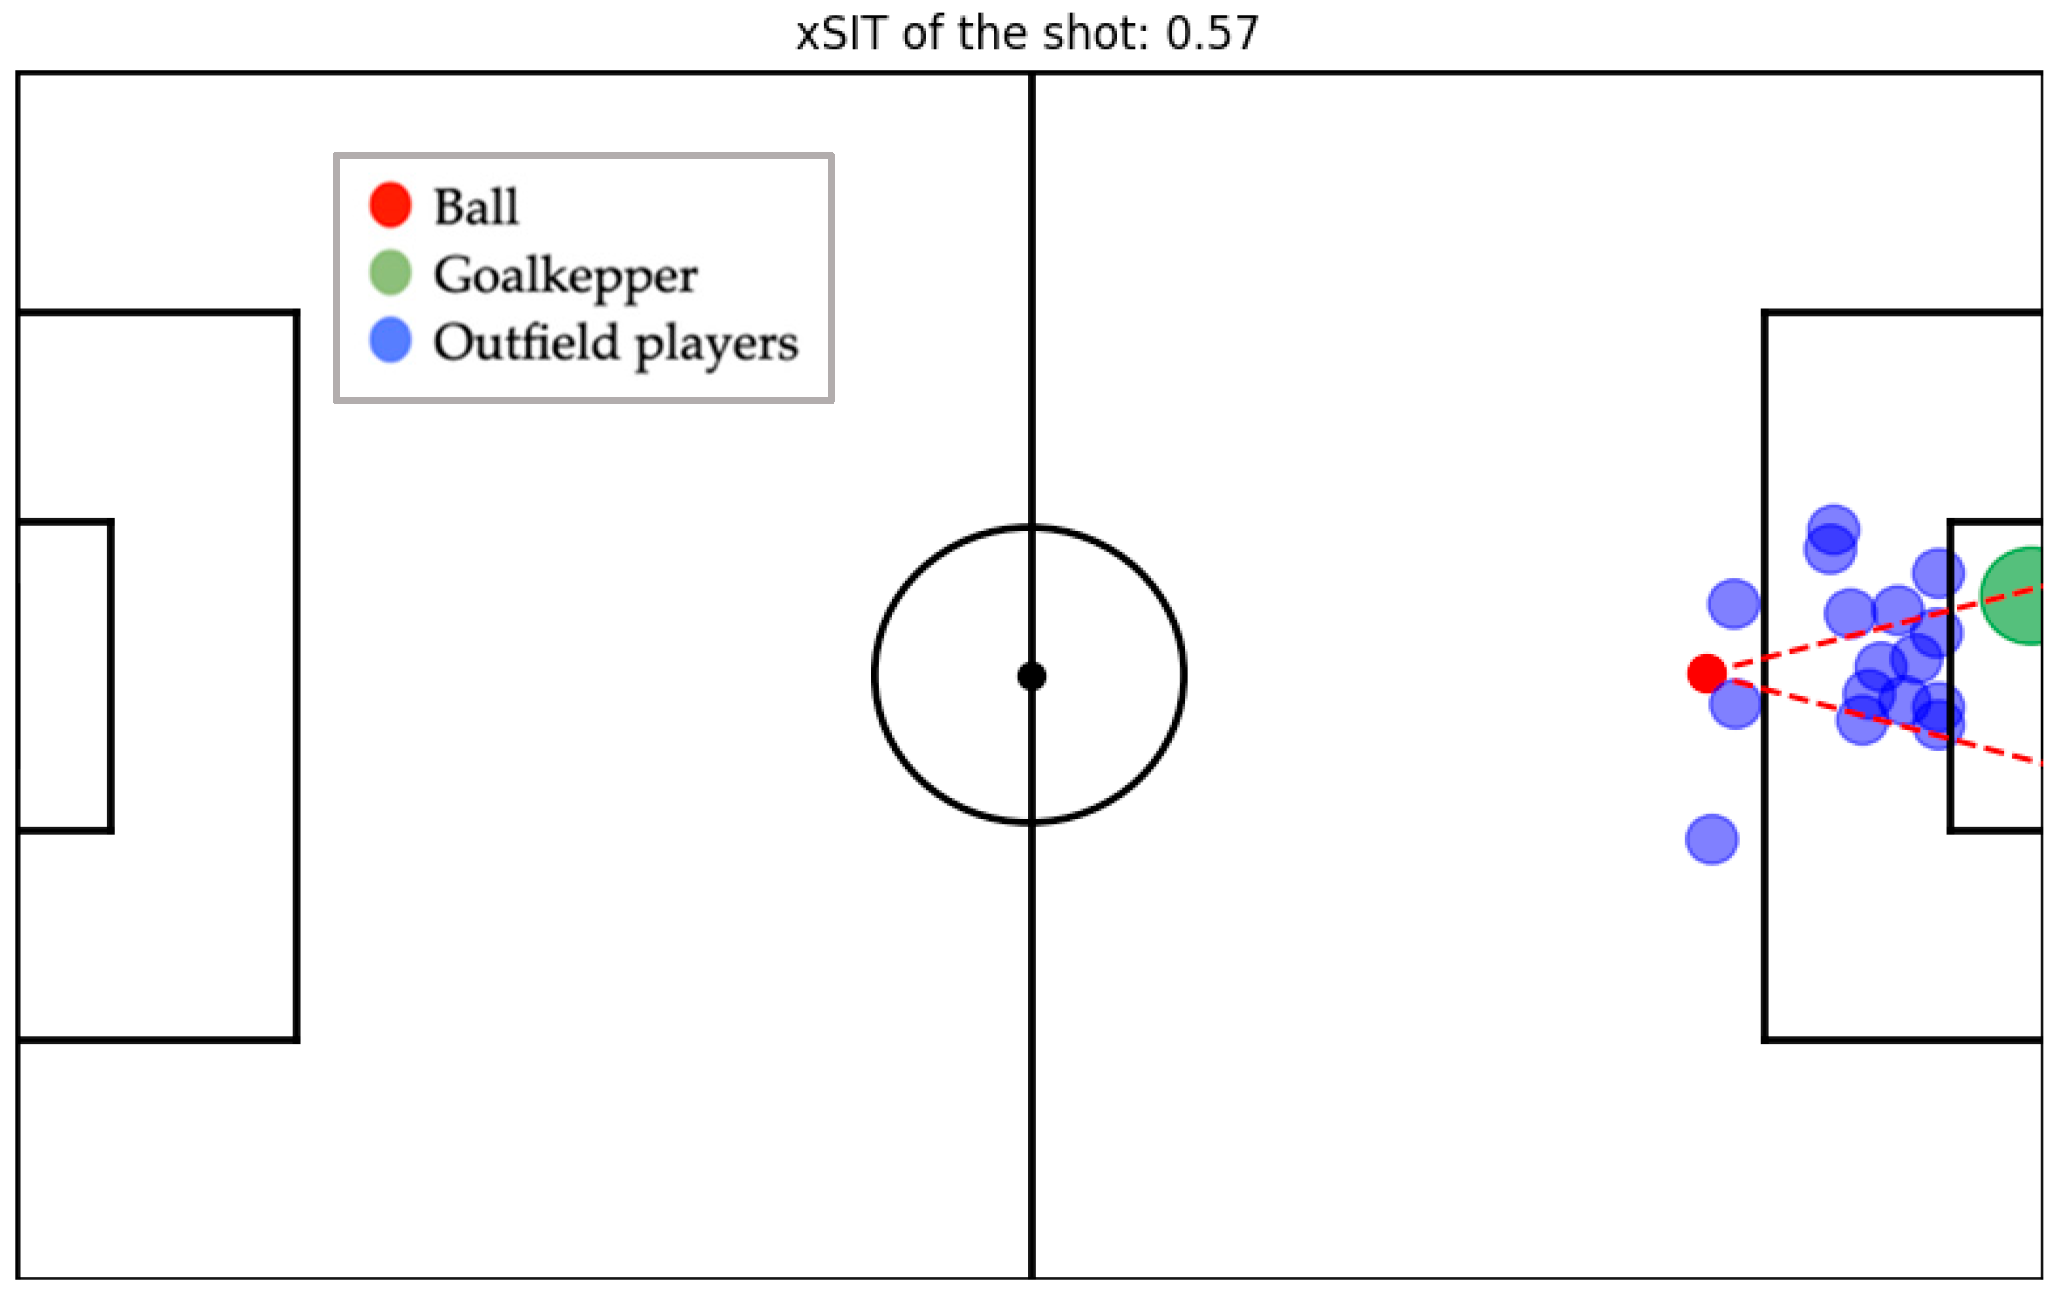
At this stage, we were able to address the research question previously formulated: how can the shooter’s action be analytically assessed? To this end, the model was initially developed based solely on contextual variables during shooting (Step 7). Subsequently, ball velocity and player reaction time were introduced to capture post-execution dynamics and refine the evaluation of shot quality, respectively (Step 8).
Step 6. The xSIT model at the moment of shot execution. Using the information gathered, we analyzed the image and calculated the area of the triangle formed by excluding the obstacles, i.e., the area available for player movement. In the example illustrated in
Figure 4, the xSIT metric yielded a value of 0.57.
Step 7. The xSIT model considering the potential movement range. The possible player’s reaction movement is not strictly circular. Once players perceive the stimulus, their range of movement becomes more constrained. According to the guidelines provided in previous studies [
15], players are capable of moving approximately 60 cm forward or backward and 120 cm sideways in response to the stimulus. This information was incorporated into our program to enhance the accuracy of data interpretation and computational analysis (
Figure 5).
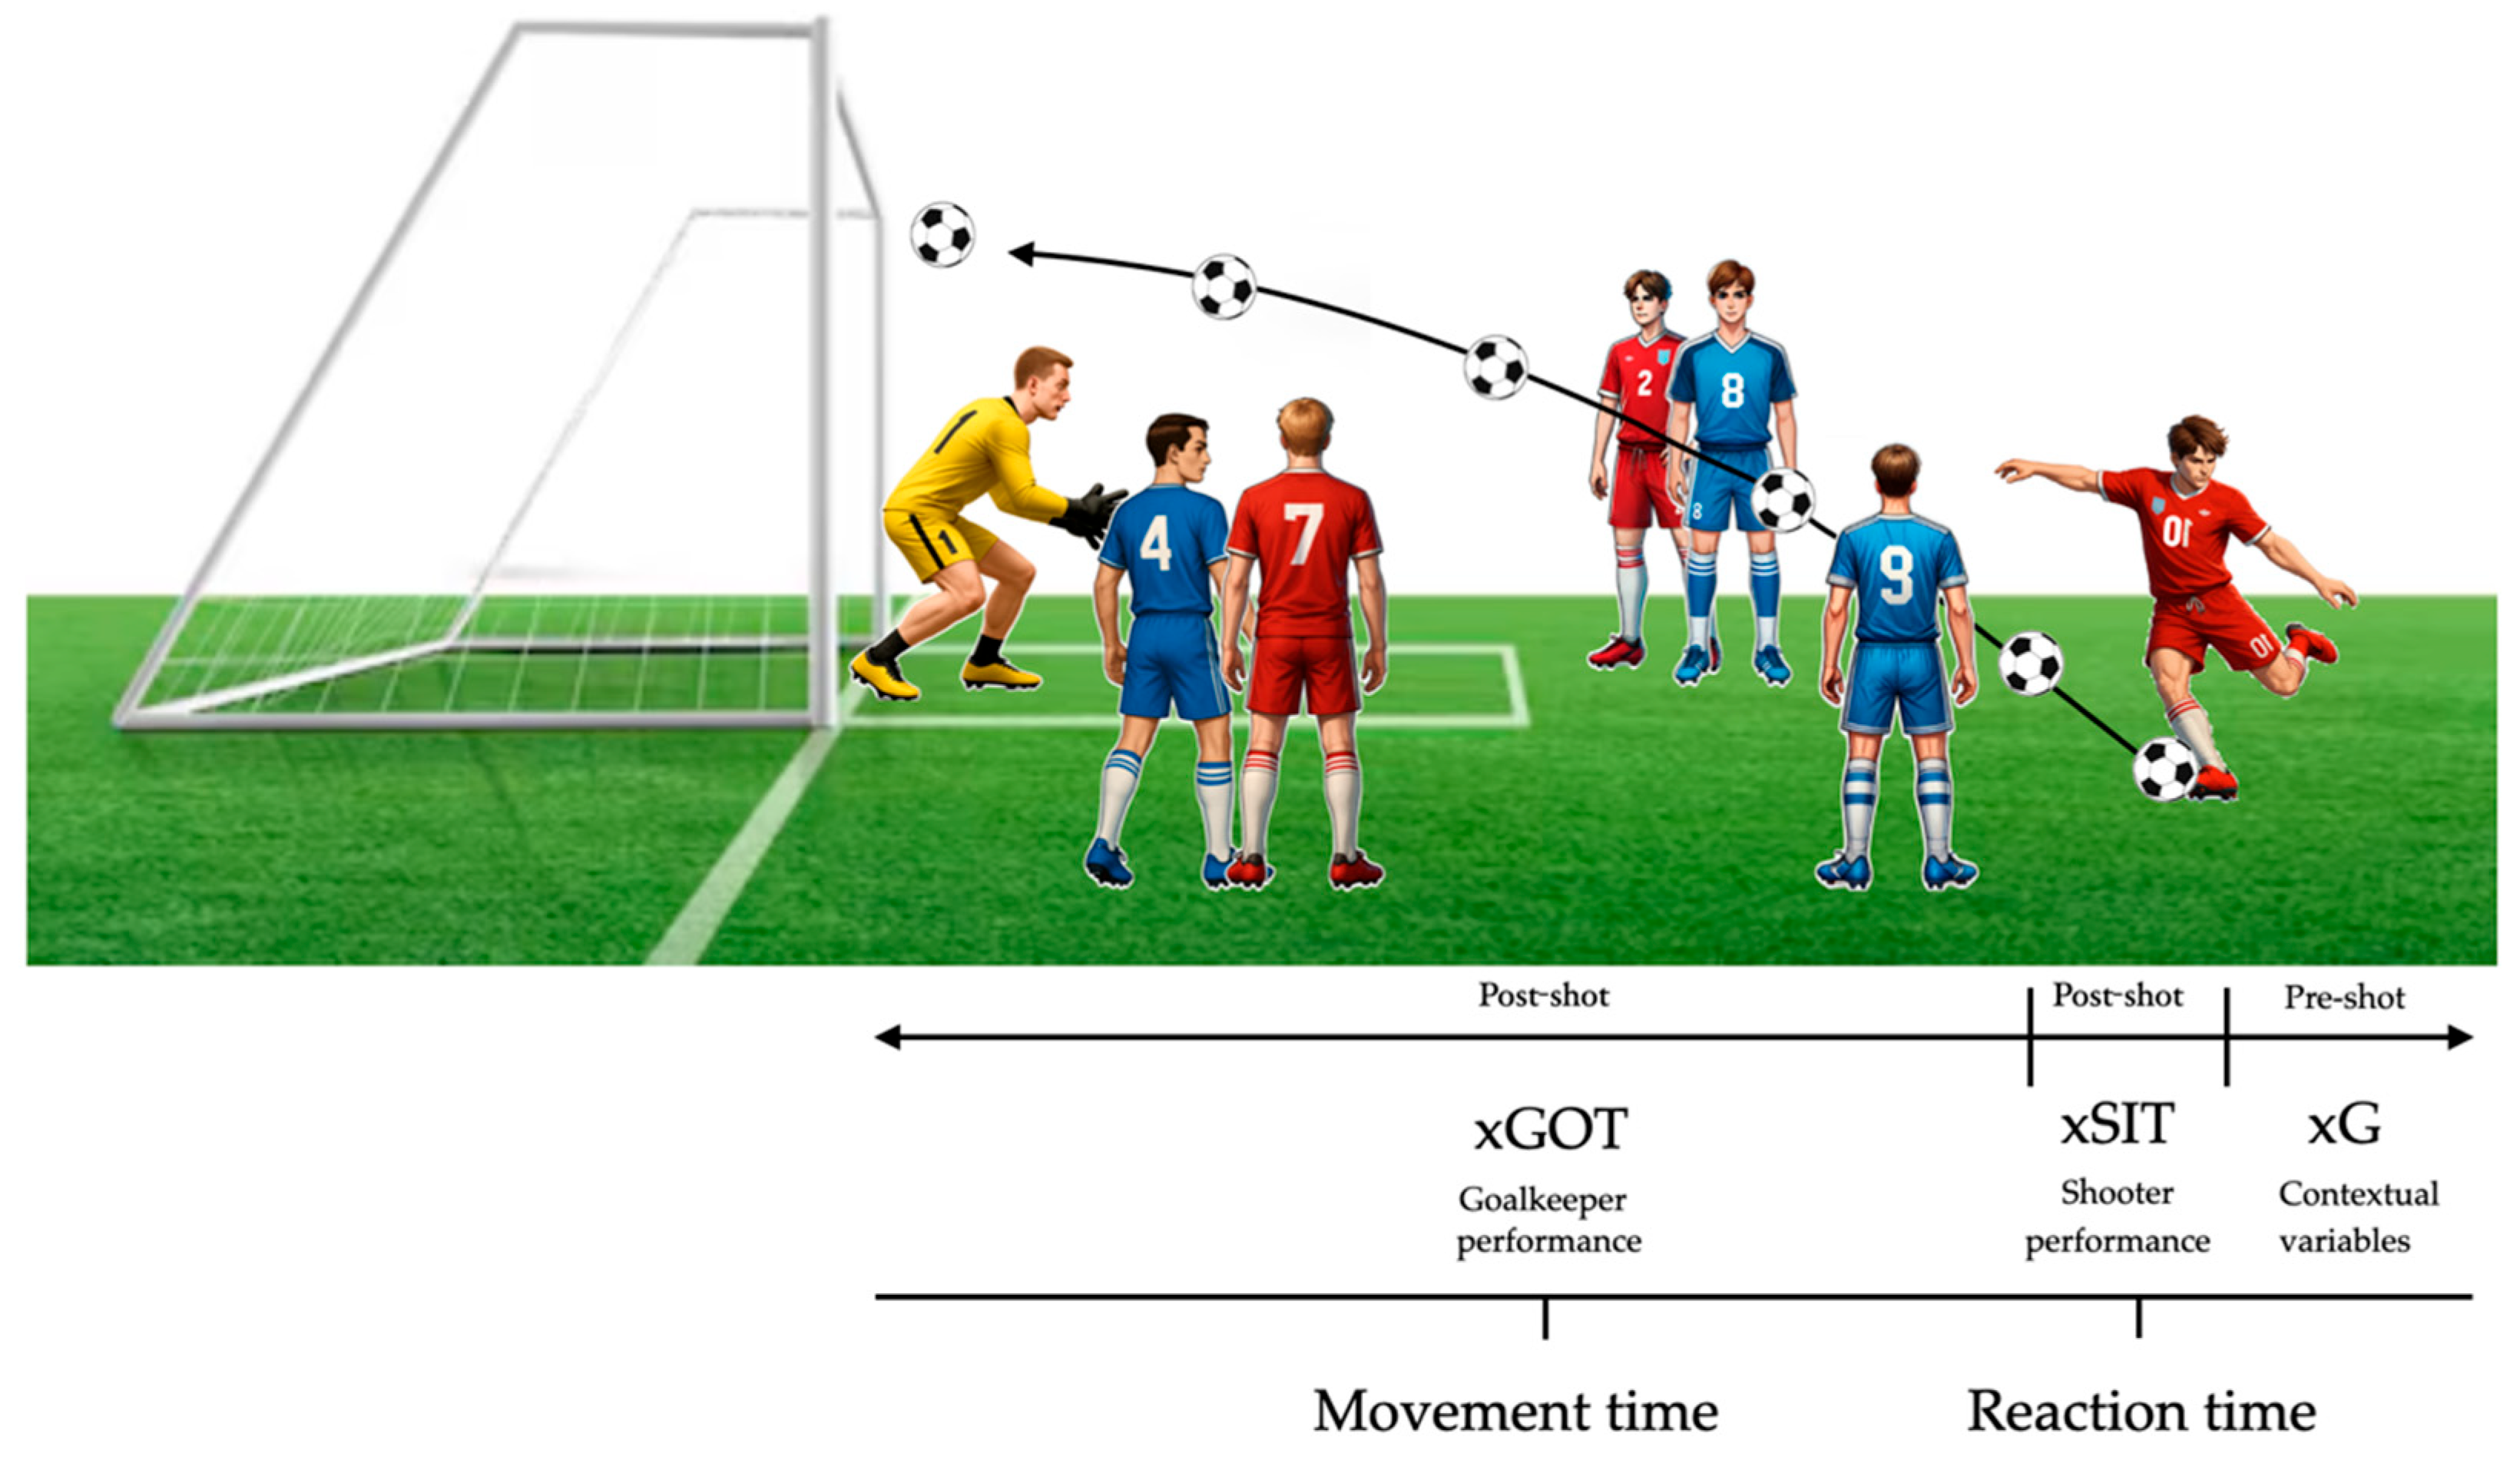
Step 8. The xSIT model considering ball velocity and player reaction time. The xSIT value was computed as a function of both ball velocity and the players’ reaction times (
Figure 6). Regarding reaction time, 200-milliseconds (ms) has been established as a reference value. In elite football performance analysis, the use of a 200 ms threshold was supported by scientific evidence on the neurophysiological limits of perceptual–motor processing in high-speed sports. Research indicated that professional football players typically exhibited simple visual reaction times between 150 and 250 ms, with 200 ms commonly used as a benchmark to differentiate between reactive and anticipatory responses [
16,
17,
18]. Therefore, in this study, the reaction time was set at 230 ms for GKs and 250 ms for outfield players [
9]. Additionally, studies have shown that this reaction time measure remains consistent across both women’s and men’s football leagues [
19].
4. Practical Applications of the Model
The xSIT model (
Figure 7) was designed to evaluate shooter performance by integrating key contextual and execution-based variables. In this study, critical inputs included the shooter’s position, the GK’s positioning, the spatial distribution of other players, and the ball velocity.
To illustrate the model’s application, two examples of shots (one resulting in a shot on target and the other in a shot off target) were presented, detailing the resulting xG, xSIT and xGOT values derived from each scenario.
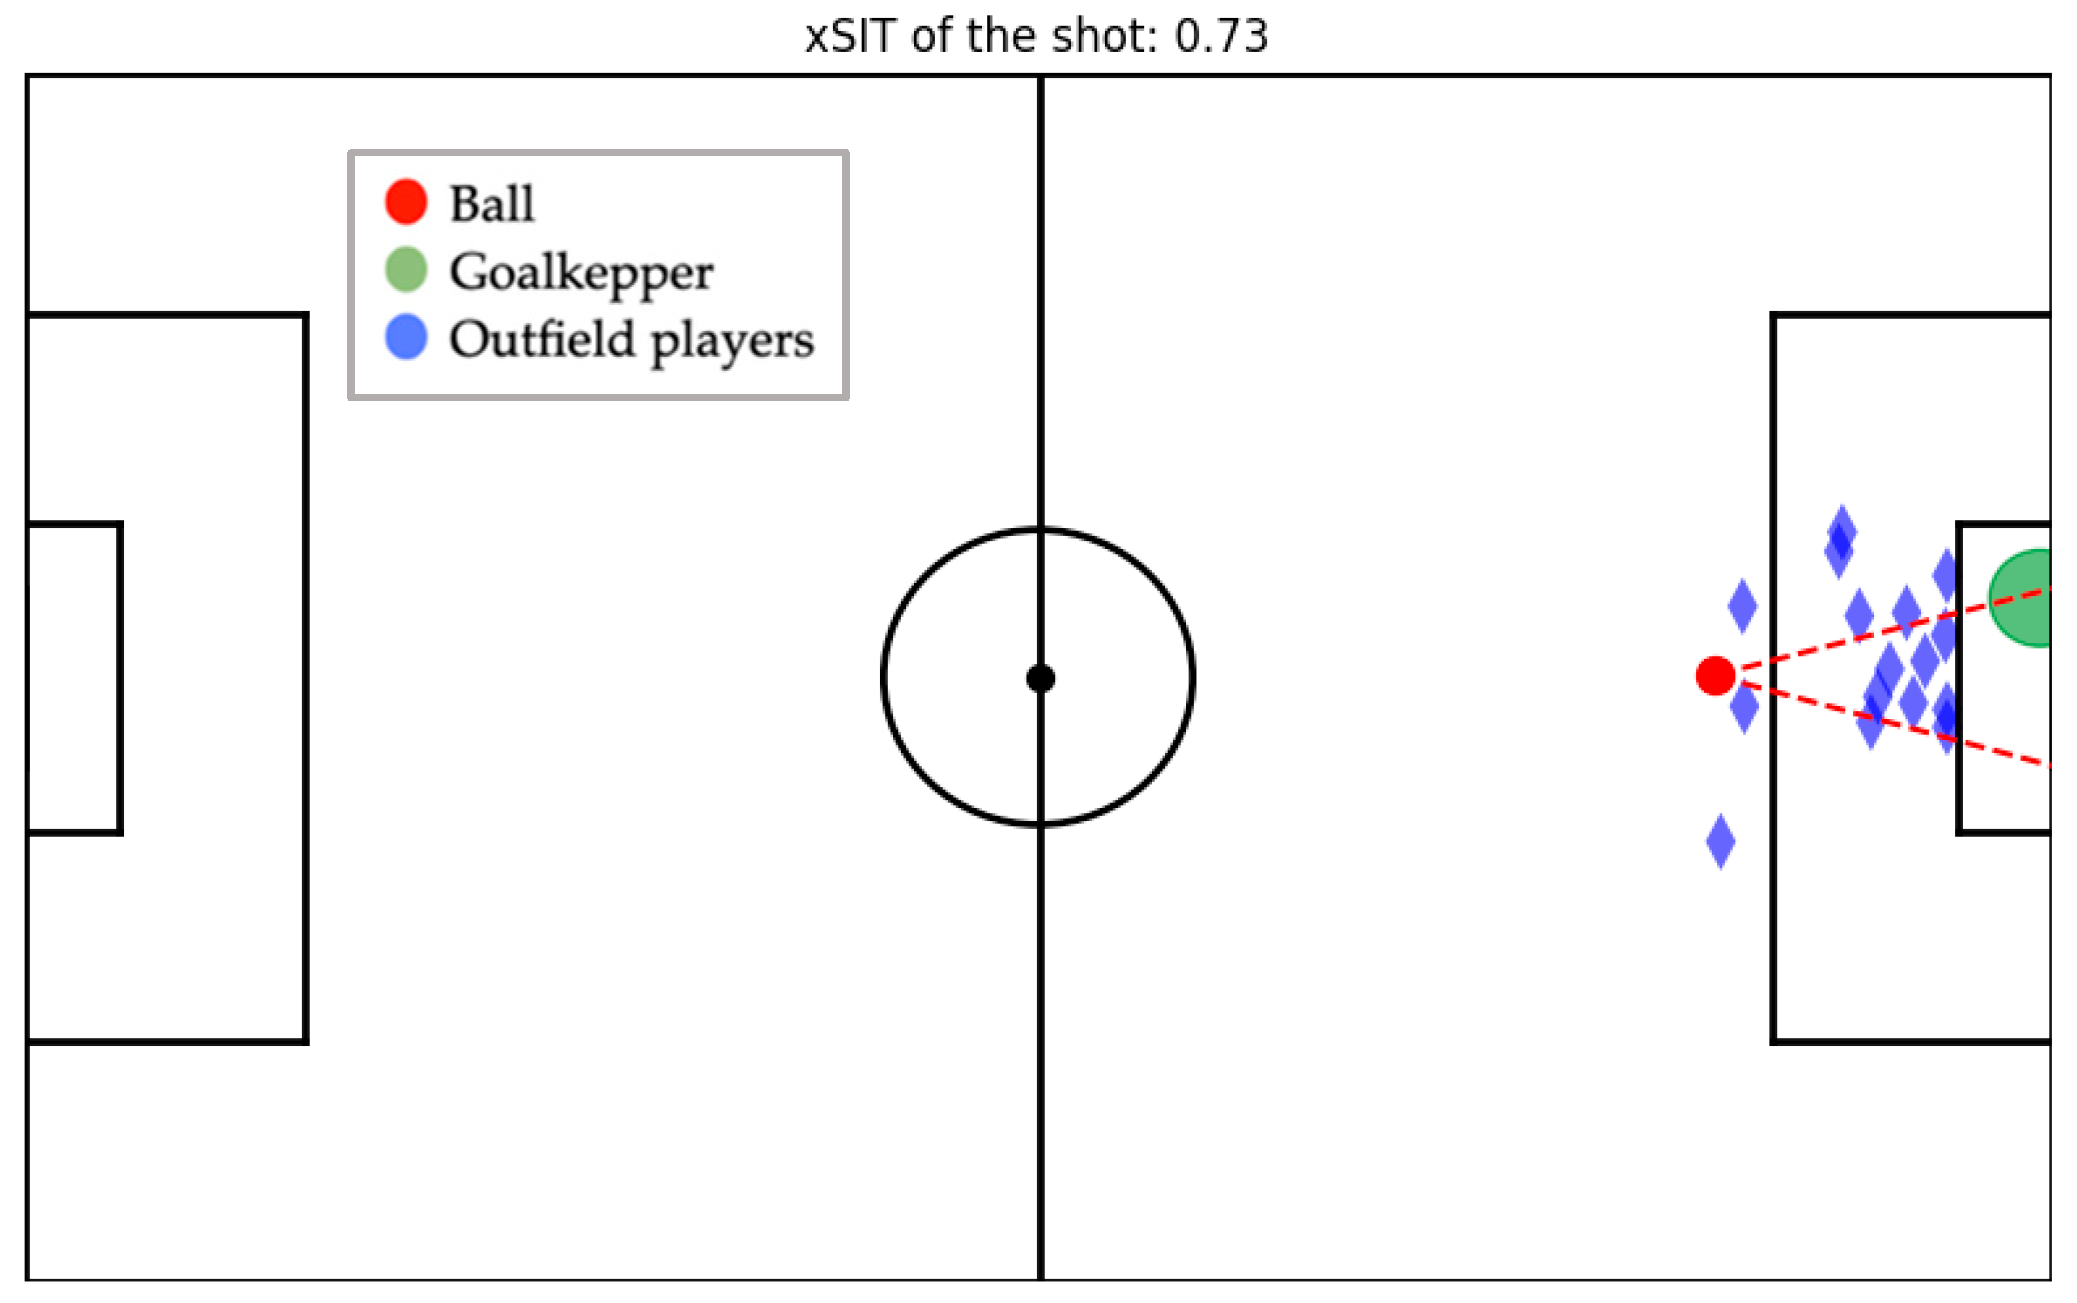
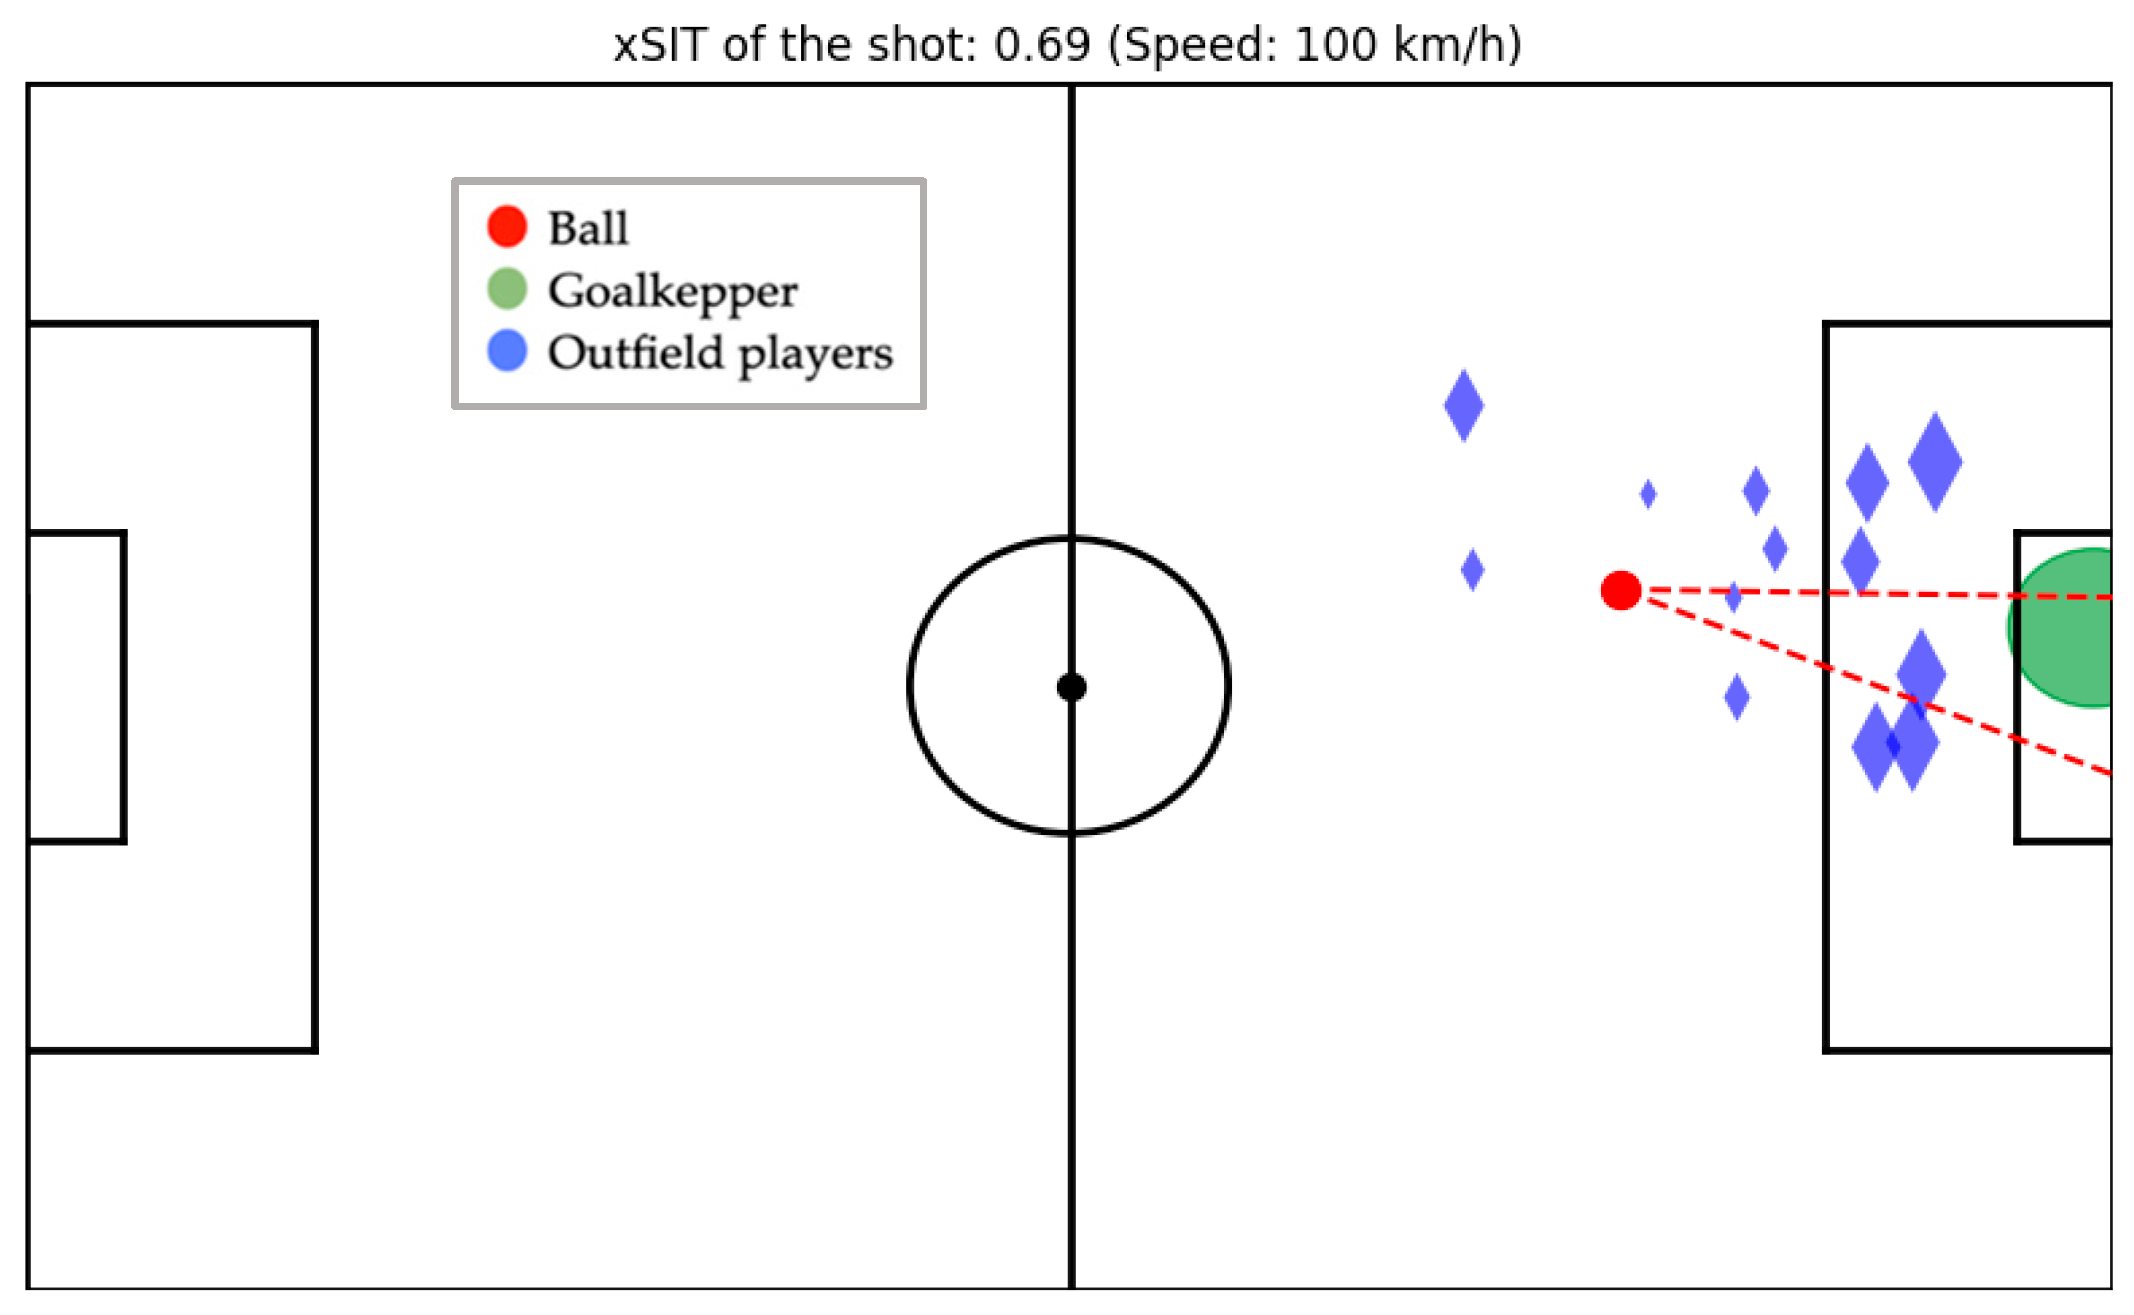
Figure 8 presents an illustrative example of the xSIT metric calculation, alongside the established xG and xGOT metrics commonly referenced in the scientific literature:
Figure 8A illustrates a shot that misses the target but is taken under favorable conditions, as the shooter has a largely unobstructed shooting area. In this scenario, the advanced metrics yielded the following values: xG = 0.02, xSIT = 0.69, and xGOT = 0.
Figure 8B, by contrast, depicts a shot that is directed on target but taken under high defensive pressure, with multiple opposing players surrounding the shooter. The corresponding metric values in this case were: xG = 0.70, xSIT = 0.22, and xGOT = 0.63.
Based on the model’s estimations, its principal practical application lies in supporting coaches and performance analysts in the systematic evaluation of shooting behavior, both within their own team and among opposing players. This enables the development of tailored training protocols and tactical strategies, grounded in objective data. By identifying individual shooting tendencies, such as spatial preferences, execution timing, and technical patterns, training interventions can be customized to reinforce specific strengths and address detected weaknesses. In addition, the model provides valuable insights for tactical decision making, allowing for the anticipation of potential constraints imposed by opposing defensive systems and for the strategic modulation of shooting techniques in response to the behavior of defenders and GKs.
Beyond tactical preparation, the xSIT model contributes to the enhancement of in-game decision making. Training scenarios can be designed to simulate high-pressure conditions, fostering players’ ability to execute technically optimal actions in real time. This promotes more effective shot selection and spatial awareness under defensive pressure.
Ultimately, the integration of this model into performance workflows enhances both offensive and defensive planning. By leveraging these data-driven insights, teams can gain a competitive advantage through improved match preparation, adaptive in-game strategies, and optimized player development.
Statistical Evaluation of the Shot Evaluation Model
The shot evaluation model estimates the probability of a shot resulting in a goal by incorporating both spatial and temporal variables, including the ball’s initial and final positions, ball velocity, and GK and outfield player positions. The primary aim of this algorithm was to assess shooter performance at the precise moment of shot execution, independently of the actual outcome (goal or no goal). To evaluate the model’s performance, a 5-fold cross-validation procedure was applied, yielding an Area Under the Receiver Operating Characteristic Curve (AUC-ROC) of 0.92 and an overall accuracy of 84%. The metrics were computed using the 2023 Women’s World Cup and the 2022 Men’s World Cup dataset, as outlined in
Section 2. Data ingestion and shot classification were carried out using Python version 3.11.9. To comprehensively evaluate the model’s performance, statistical analyses were conducted using the R library within the Python environment.
5. Validation of Relevance of the Proposed Metric
To evaluate the robustness and practical relevance of the proposed metric within a performance analysis framework, a comparative assessment was conducted against the two principal post-shot expected goals models. Both the xGOT and xSIT metrics were developed to quantify critical post-shot attributes that influence shot outcomes. Based on their respective theoretical and mathematical formulations, xGOT primarily reflects GK performance, whereas xSIT was intended to assess the shooter’s execution quality. To empirically support this distinction and validate the relevance of the proposed metric, a comparative analysis of both metrics was conducted using the dataset described in
Section 2.
The required sample size was estimated using G*Power 3.1, based on an a priori power analysis with an assumed effect size of d = 0.8, an alpha level of 0.05, and a desired statistical power of 80%. This calculation yielded a minimum sample of 50 shots. Nevertheless, in order to maximize the robustness of the analysis, all shots on target recorded across both tournaments were included.
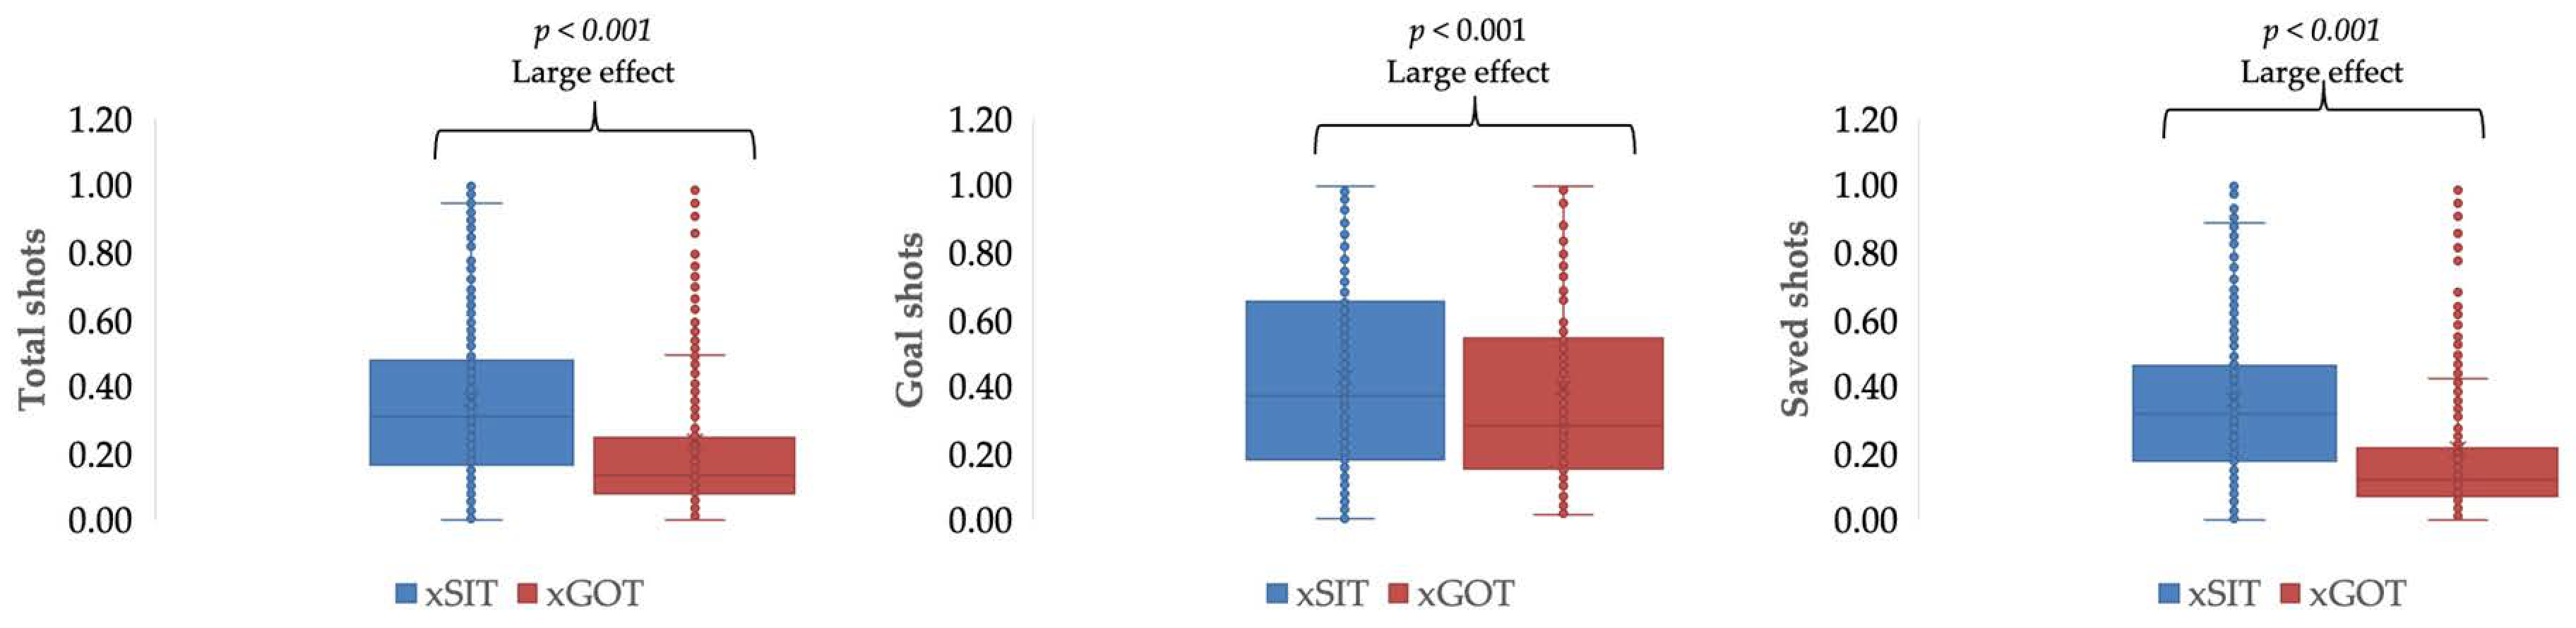
Figure 9 presents the outcomes of a comparative analysis between the xGOT values generated by the STATSBOMB model and the xSIT metric produced by the proposed model.
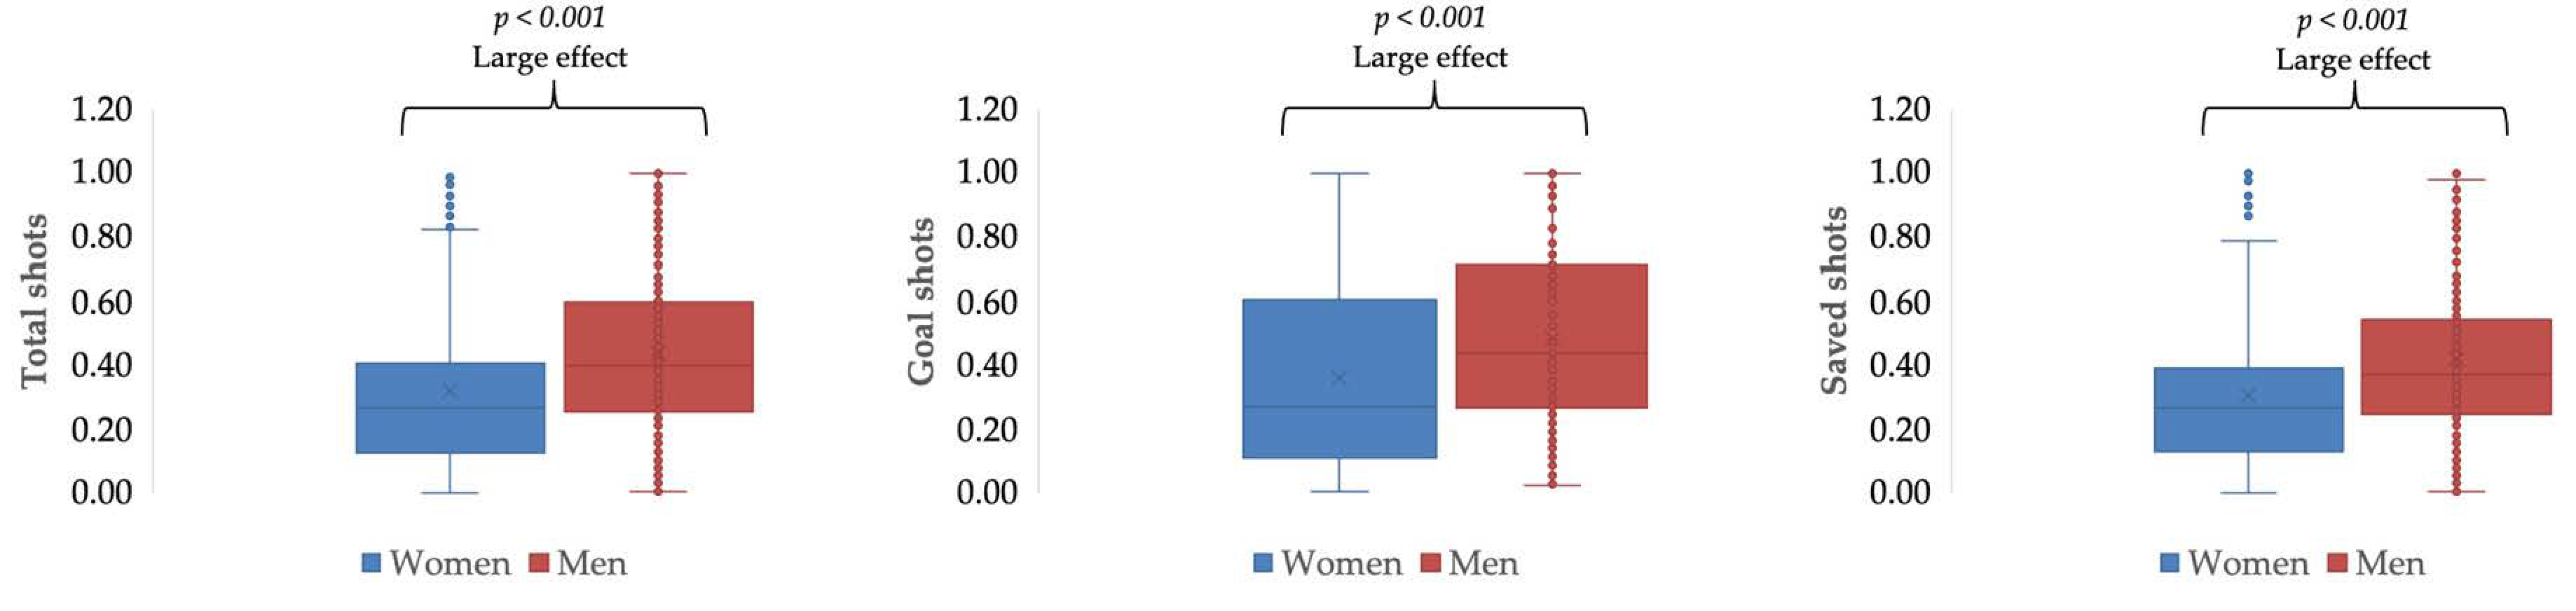
Figure 10 presents a gender-based comparative analysis of the xSIT metric to examine potential differences between men’s and women’s tournaments. The variables studied included the following: total shots on target, shots resulting in goals, and shots resulting in saves. Descriptive statistics (mean and standard deviation) were computed, and inferential analysis was performed using an independent Student’s t-test. Statistical significance was set at
p < 0.05. To assess the practical significance of the results, effect sizes (Cohen’s d) were calculated and interpreted using standard thresholds: small (<0.2), medium (0.5), and large (>0.8). Data normality was confirmed via the Shapiro–Wilk test. Based on the results obtained, statistically and clinically significant differences were observed between the xSIT and xGOT metrics across all analyzed variables, including total shots on target, goal shots, and saved shots. These findings supported the notion that, while both metrics assess post-shot-related performance, they capture distinct aspects of the action. Consequently, the authors propose that xSIT and xGOT should be considered as complementary tools within football performance analysis. Also, the analysis revealed significant differences between men’s and women’s competitions.
6. Discussion of the Model
The xSIT model proposed in this study aims to provide a more accurate evaluation of shooter performance in shooting situations. This model was developed based on a large-scale dataset comprising high-resolution positional and event data, systematically captured and accurately synchronized using a proprietary algorithm. In contrast to prior models [
20,
21], which often obscure the underlying computational processes and report only aggregate outputs, our approach was characterized by full methodological transparency. Specifically, we provided a detailed account of the input variables and the step-by-step procedures involved in the calculation of each metric. This level of detail facilitated a more nuanced interpretation of player performance, particularly in evaluating the contextual factors that influence the effectiveness of a shot. Such transparency not only enhances the model’s interpretability but also allows for its application in both talent identification and individualized performance optimization. For instance, targeted training interventions, such as drills aimed at enhancing moment reaction and positional adaptability in both GKs and defenders, could effectively reduce xSIT values, thereby reflecting improved anticipatory behavior and spatial control. Similarly, exposing strikers to high-pressure shooting scenarios involving dynamic obstacles can refine technical execution and decision making under stress, ultimately contributing to increased offensive efficiency.
The findings derived from the present study (
Figure 9) suggested that the xSIT metric complements other advanced metrics like xGOT by incorporating not only shot characteristics but also key variables related to ball velocity and player reaction times. The xGOT focuses on assessing the GK’s movement time, that is, the time interval between the execution of the shot and the moment the GK is able to attempt to stop the ball [
5,
7,
8,
22]. The xGOT accounts for factors such as the distance between the GK and the ball’s trajectory and positioning. The xSIT assesses the ball velocity and the reaction times of both the GK and outfield players in response to the shot. This metric evaluates the ability of all involved players to anticipate and react to the shot, including the potential for outfield players to block, intercept, or deflect the ball before it reaches the goal. In this sense, xSIT provides a more comprehensive view of reaction time during shot situations, taking into account not only the GK’s skill but also the collective defensive response. Through this approach, an integrated assessment was provided, taking into account both the conditions of the shot and the context in which it occurs.
One of the main advances of the xSIT model was the inclusion of ball velocity and player reaction times, two factors that have generally been overlooked in previous shot analysis models. Other advanced metrics, such as xG, typically focus on pre-shot characteristics, such as distance, angle, and the initial speed of the shot, without considering the impact of the shooter’s technical quality or the GK’s and outfield players’ reactions [
3,
4]. However, the xSIT model adds an additional layer of complexity by integrating how quickly players react, which can alter the likelihood of a shot resulting in a goal. This makes the model a more precise tool for evaluating shooter performance in dynamic situations.
An additional strength of this study lies in the inclusion of match data from both elite men’s and women’s international tournaments. This approach enabled the exploration of potential gender differences in the application of the xSIT metric to men’s and women’s football. As shown in
Figure 10, the results revealed lower xSIT values for women players compared to their male counterparts. Unlike the xGOT metric, which has been shown to yield comparable values across sexes [
6], the authors hypothesize that the observed difference in xSIT was primarily attributable to the incorporation of ball velocity into the model. Previous research has consistently reported significant gender-based differences in ball velocity during shooting actions [
23,
24,
25]. Male players typically generate higher ball and foot speeds, which are associated with greater segmental velocities, muscular strength, and anthropometric characteristics. For instance, the average ball velocity in instep kicks has been reported to be approximately 17% higher in male players compared to female players [
23]. These biomechanical disparities have important implications for shot execution, GK response, and overall match dynamics [
24,
25]. Consequently, accounting for such differences is essential when developing models aimed at evaluating shot difficulty across sexes.
The professionalization of football represents a critical and inevitable evolution aimed at enhancing both individual and team performance [
26]. This shift has been driven by the demand for deeper player engagement and a more advanced understanding of match dynamics [
27]. A key aspect of this progression is the growing emphasis on performance metrics [
22,
28]. To facilitate this, the integration of sports science and computer science is essential to advancing player behavior analysis in modern football, as demonstrated in this study, through the development of data-driven models, simulations, and performance metrics [
29,
30].
6.1. Practical Implications of Sex-Based Differences
This study’s findings have important implications for performance analysis, training, and model development in elite soccer. The observed differences in xSIT values between men’s and women’s matches, mainly linked to ball velocity, highlight the need for gender-specific models when assessing shot effectiveness using contextual metrics.
First, performance models incorporating dynamic variables such as ball velocity should be calibrated separately for men and women players, as biomechanical disparities (e.g., in segmental velocities, muscle strength, and anthropometry) substantially influence the probability of scoring after a shot. Generic models can generate biased estimates if applied uniformly across genders.
Second, training programs focused on shot execution should consider these contextual differences. In women’s football, specific interventions aimed at improving shot velocity and timing can improve shot effectiveness. In contrast, in men’s football, coaching may place greater emphasis on shot selection and decision making under pressure, given the GK’s shorter reaction time.
Tactically, coaches can use xSIT analysis to refine offensive strategies by identifying the shot types and locations most likely to be impactful in each competition context. This can facilitate evidence-based decision making in shot selection, space creation, and attacking patterns.
Finally, xSIT can be a valuable tool for talent identification and player development. By quantifying the contextual danger of each shot, regardless of the outcome, this metric provides a robust indicator of shot quality that can facilitate scouting, longitudinal tracking, and individualized technical feedback.
6.2. Limitation Section
The authors recognize several limitations inherent to the present study: 1. The dataset employed originates from the 2023 Women’s World Cup and the 2022 Men’s World Cup, a high-level international tournament with publicly accessible data. Extending the application of the xSIT model to other competitive contexts, such as youth or lower-tier leagues, presents challenges due to the limited availability of synchronized event and positional data. 2. The real-time application of the complete xSIT model in live match scenarios is constrained by the unavailability of instantaneous ball velocity and player’s reaction time data. 3. While the theoretical development of advanced performance metrics in football analytics has advanced considerably in recent years, their real-world applicability remains underexplored. Further research is needed to validate these models in practical contexts and to assess their effectiveness in informing coaching decisions and training interventions.


