1. Introduction
Coffee is a widely enjoyed beverage, with approximately 10 million tonnes consumed worldwide in the years 2020/2021 [
1]. It is well known that the vast array of chemical components within coffee has notable impacts on global human health [
2,
3,
4]. In particular, coffee contains over 1000 bioactive compounds, the two most notable of which are caffeine (for its nootropic effects) and the array of antioxidants present in the beverage. In fact, coffee has been noted as ‘the most relevant source’ of dietary antioxidant compounds [
5]. The significance of these antioxidants stems from their ability to counteract the negative effects of reactive oxygen species.
Reactive oxygen species (ROS) are a by-product derived through essential cellular biochemical reactions involving oxygen and can cause significant harm to the human body if levels are left unbalanced [
6]. They carry the ability to damage biologically significant molecules, including DNA, proteins, and lipids. Hence, prolonged durations of oxidative stress have been found to trigger serious diseases, including cancer, diabetes, and premature aging [
5,
6].
Antioxidants, as the name suggests, can neutralise ROS via electron donation, suppressing their negative effects. As such, the consumption of antioxidant compounds is crucial to many facets of maintaining a healthy lifestyle. Coffee’s antioxidant properties may be linked to specific compounds, most notably
n-coumaric, chlorogenic, caffeic, and ferulic acid, which are naturally present in the bean [
7]. However, additional antioxidants may be introduced during the roasting process. Roasting the beans allows the signature aroma and flavour known in coffee to be produced [
8,
9]. As a consequence of the high temperature of the roasting process, the Maillard reaction occurs. This reaction changes the formation of bioactive compounds, termed Maillard Reaction Products (MRPs). These products have also been found to be a leading contributor to the antioxidant activity in coffee [
7,
8,
9,
10]. Given the benefits and variety of antioxidants available in a cup of coffee, it is highly important that these compounds are analysed, be it for quality control, product testing, assessment of the ‘healthiness’ of the beverage, or another such measure of quality.
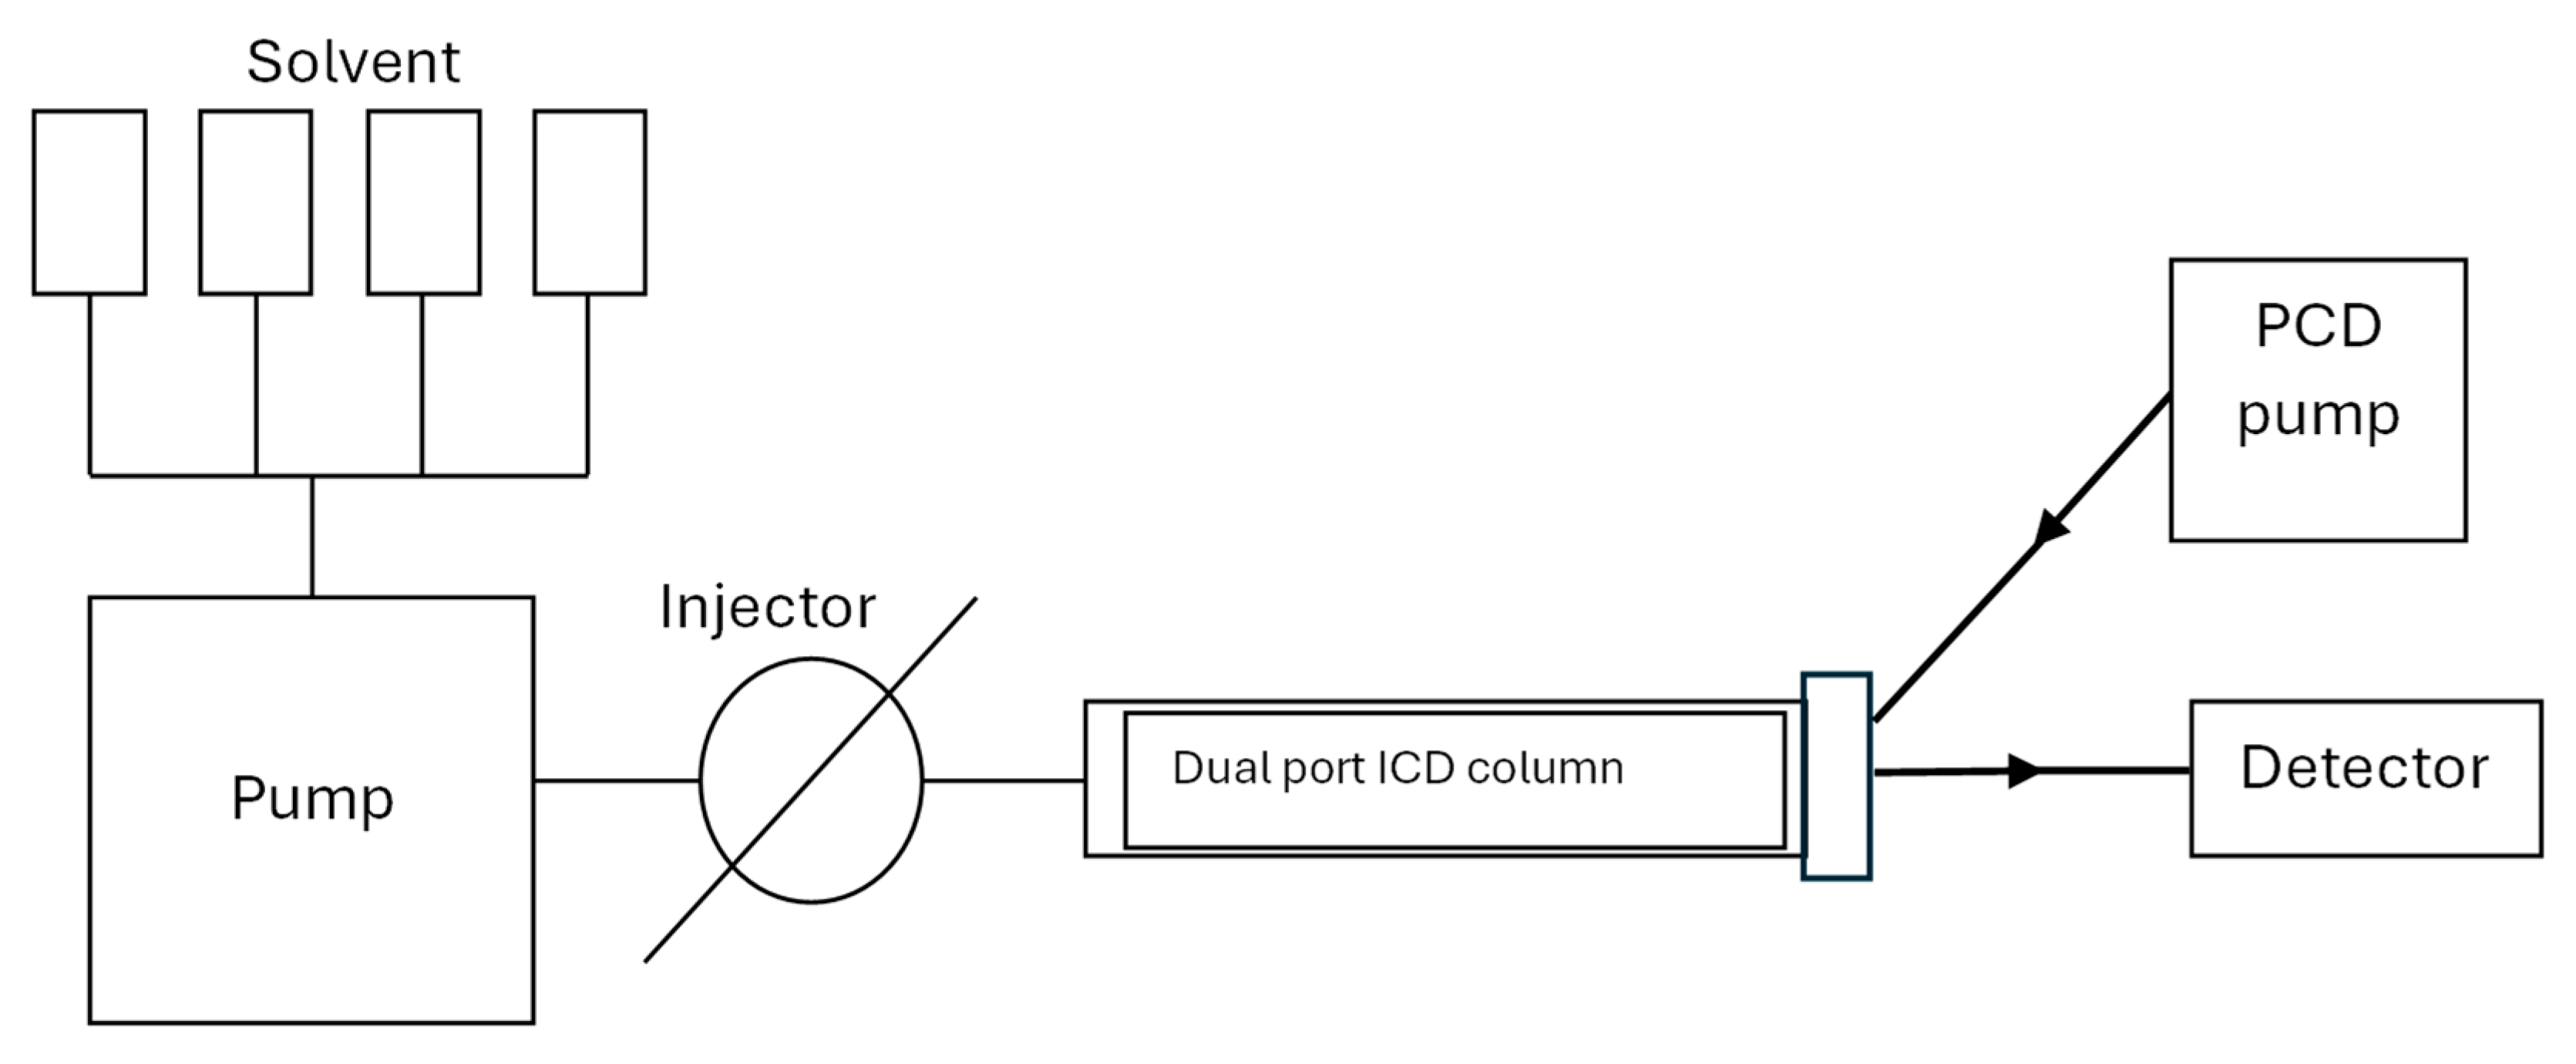
Antioxidants can be analysed by testing their capability to react with either a free radical or a metal ion. The method used in the current study is the Cupric reducing antioxidant capacity assay (CUPRAC) assay. In the presence of antioxidants, copper (II)-neocuproine (Cu (II)-Nc) is reduced to copper(I)-neocuproine (Cu(I)-Nc), which has a maximum observable response at 450 nm [
11,
12,
13]. There are many advantages to using the CUPRAC assay as opposed to others; compared to the Ferric Reducing antioxidant process (FRAP) assay, CUPRAC has less observable noise and more sensitivity when analysing coffee [
13]. Further, there is more benchtop stability and a lower possibility of precipitation when compared to other assays. This property is a crucial advantage as instability and precipitation significantly increase variability in the analysis. When coupled to HPLC, in a post-column derivatisation mode of analysis, precipitation increases the risk of damage to a detection flow cell [
13,
14].
There are a few published analyses on the antioxidant activity of coffee [
7,
13]. Most analyses of coffee, with respect to antioxidant content, have been benchtop tests, and only total antioxidant content was identified. In contrast, in this study we utilise HPLC for separation and specific antioxidant detection using a feed of CUPRAC reagent in a ‘post-column derivatisation’ mode, whereby only compounds that are antioxidants will respond to the detection protocol. The post-column detection protocol utilised here allows for the quantitative detection of specific antioxidants, and in doing so, greater detail in relation to the nature of the sample can be ascertained, rather than the simple total antioxidant response that is obtained in a benchtop test [
13,
14].
Cold-drip coffee differs from a hot brew in that cold water slowly filters a bed of coffee under gravitational flow at atmospheric pressure [
13,
15]. As noted by Angeloni et al. [
15], the temperature at which coffee is prepared influences the type of compounds extracted from the beans, resulting in a beverage with varying flavours and chemical properties. This study explores the compositional differences between cold-drip and standard hot-brew coffees using testing protocols specific for antioxidants that employ HPLC separation with the CUPRAC assay in a post-column derivatisation mode of analysis.
3. Results
All chromatograms represent the first 25 min of the separations, as no peaks were observable after 20 min for any of the samples tested. Since compounds detected at 450 nm following the post-column derivatisation indicate the presence of antioxidants, the chromatograms can be used to compare the presence, absence, and relative intensity of antioxidants present in the coffee samples [
9,
10]. In the CUPRAC assay, the same compound (the Cu(Nc)2(I)) complex) is detected regardless of the particular antioxidant under investigation, allowing a direct comparison between peak heights as a measure of antioxidant concentrations. Hence, this information relates, in part, to the biofunctional aspect of the samples under study.
Throughout this study, Ristretto coffee samples were used as the ‘reference’ coffee. Tests were conducted using Ristretto samples to verify batch-to-batch reliability in respective coffee samples, the preparation method of the coffee itself, and the reliability of the analytical method used to measure the antioxidant content. Typical antioxidant chromatograms are shown in
Figure 2. Aside from the abundance of antioxidants present in this coffee sample, the data demonstrates the high level of reproducibility in the testing process since the three chromatograms are replicate analyses of the same coffee sample extracted from a single coffee pod derived from hot-brew preparation. Each of the chromatograms were recorded at 450 nm. To verify the absence of compounds interfering with the analysis and detection at 450 nm, the sample was also assayed without the CURPAC PCD reagent and detection at 450 nm. The resulting chromatogram, shown in
Figure 3, shows the presence of no detectable compounds.
A high level of repeatability in the instrumental analysis and antioxidant profiles derived from different Ristretto coffee preparations was observed. The chromatograms in
Figure 4 show a very high level of similarity in the antioxidant profiles derived from two different Ristretto coffee pods prepared using the hot-brew method. This high-level reproducibility in the different coffee samples, and in the instrumental method of analysis itself, was previously verified in a separate study wherein we built a ‘fingerprinting library’ of more than 32 different types of coffees [
16].
The antioxidant chromatograms in
Figure 5a (hot brew) and 5b (cold drip) illustrate ‘typical’ differences between these modes of coffee preparation. Although the antioxidant profiles derived from the Ristretto coffee prepared using the hot-brew method were highly reproducible across two coffee pods, significant differences were apparent when the coffee sample was prepared using a cold-drip method. The overall intensity of the antioxidant peaks derived from the cold-drip method is generally lower in concentration than in the hot-brew method. This is indicative of chemical differences between the hot-brew and cold-brew extracts, and there are notably lower concentrations of the antioxidants extracted using cold-drip extraction.
Furthermore, the variation in the antioxidant profiles obtained for cold-drip Ristretto coffee was more significant than for hot-brew coffee samples. This is illustrated in
Figure 6a–c, which detail the antioxidant profiles for three replicates of cold-drip coffee preparations. From this data, it might be concluded that a reliable ‘coffee experience’ for a general consumer would be highly variable for those who prefer their coffee derived using the cold-drip method as opposed to the highly reproducible ‘hot-brew experience’.
In order to numerically determine the degree of variation in the cold-brew coffees versus the hot-brew coffees, we utilised a simple correlation test that compared the normalised peak heights of the antioxidants in one coffee to the normalised peak heights of the same antioxidants in a second coffee. We used this process with great success in an earlier study that built a coffee ‘fingerprint’ library that could be used to authenticate any particular coffee sample that was prepared using a standardised preparation process [
16]. In that case [
16], hot-brewed coffee was made from coffee pods in the same coffee machine utilised in this study. The purpose of the prior work [
16] was to establish a methodology to identify fraudulent coffee, and/or to study the reliability of the manufacturing process. The outcome of that work was the library of data produced using the same testing protocol as used in this study, which was very successful in identifying differences between even very closely related coffee samples. Subsequently, eleven antioxidants were selected from the analysis of the hot-brew Ristretto samples, as shown in
Figure 4.
The plot in
Figure 7a shows the correlation between the normalised amounts of each of the selected antioxidants separated in the coffee samples, whose chromatographic separation is illustrated in
Figure 4a,b. The data shows strong alignment along the main diagonal of the correlation plot, where the r
2 value was 0.9944 and the slope was 1.036, indicating that the coffee samples had a very high likelihood of being the same coffee, noting that each of the samples were derived from the same batch of Ristretto pods, although two separate coffee pods were used to prepare the two coffee samples tested.
In comparison, the plot in
Figure 7b shows the correlation plot of the normalised amounts of the antioxidants in the hot-brew Ristretto coffee sample relative to that of the normalised amounts of the antioxidants in the cold-brew Ristretto coffee sample. The data, with respect to the amounts of the antioxidants, was derived from the separations shown in
Figure 5a,b. In this instance, the r
2 value was 0.5546 and the slope was 1.0224. While the near unit value of the relationship suggests similarity in the basic constituents within the coffee, the low correlation suggests very different levels of extraction between the two methods of preparation.
Lastly, similarity in the repetition of the preparation process in the cold-brew coffee was assessed in the same manner. In this case (
Figure 7c) the correlation between the normalised amounts of the antioxidants in the separations in
Figure 8a,b was tested. The r
2 value was 0.6845 and the slope was 1.1287. These differences ascertain that the end product of the coffee preparation process yielded very different outcomes with respect to the antioxidant content of the coffee. A similar divergence in the antioxidant concentrations was apparent in comparisons between each of the three coffee preparation replications, with r
2 values ranging from 0.6845 to 0.9352, which at no stage represent a reliable indication of the coffee being prepared from a single source of coffee (according to the ruggedness of the testing protocols in reference [
16]). The data in
Table 3 shows numerically the comparison between the normalised intensities of each of the 11 peaks used in the analysis presented in
Figure 6.
As a final stage of this study, various coffee ‘flavours’ were tested using both hot-brew and cold-drip preparation methods. It is important to note that across all tests undertaken (hot brew vs. cold brew), the source of the ground coffee beans was the same; the coffee used for the cold-drip process was extracted from the coffee pods used for the hot-brew preparations. Further, the amount of coffee used in both techniques was the same; the entire contents of the coffee pod were used in the cold-drip process.
The antioxidant profiles for five different coffee flavours derived from a hot-brew method of preparation are shown in
Figure 8. Not surprisingly, there were substantial differences in these profiles, reflecting that the coffee for testing was prepared from different types of coffee beans or roasting processes, as initially noted in
Table 1.
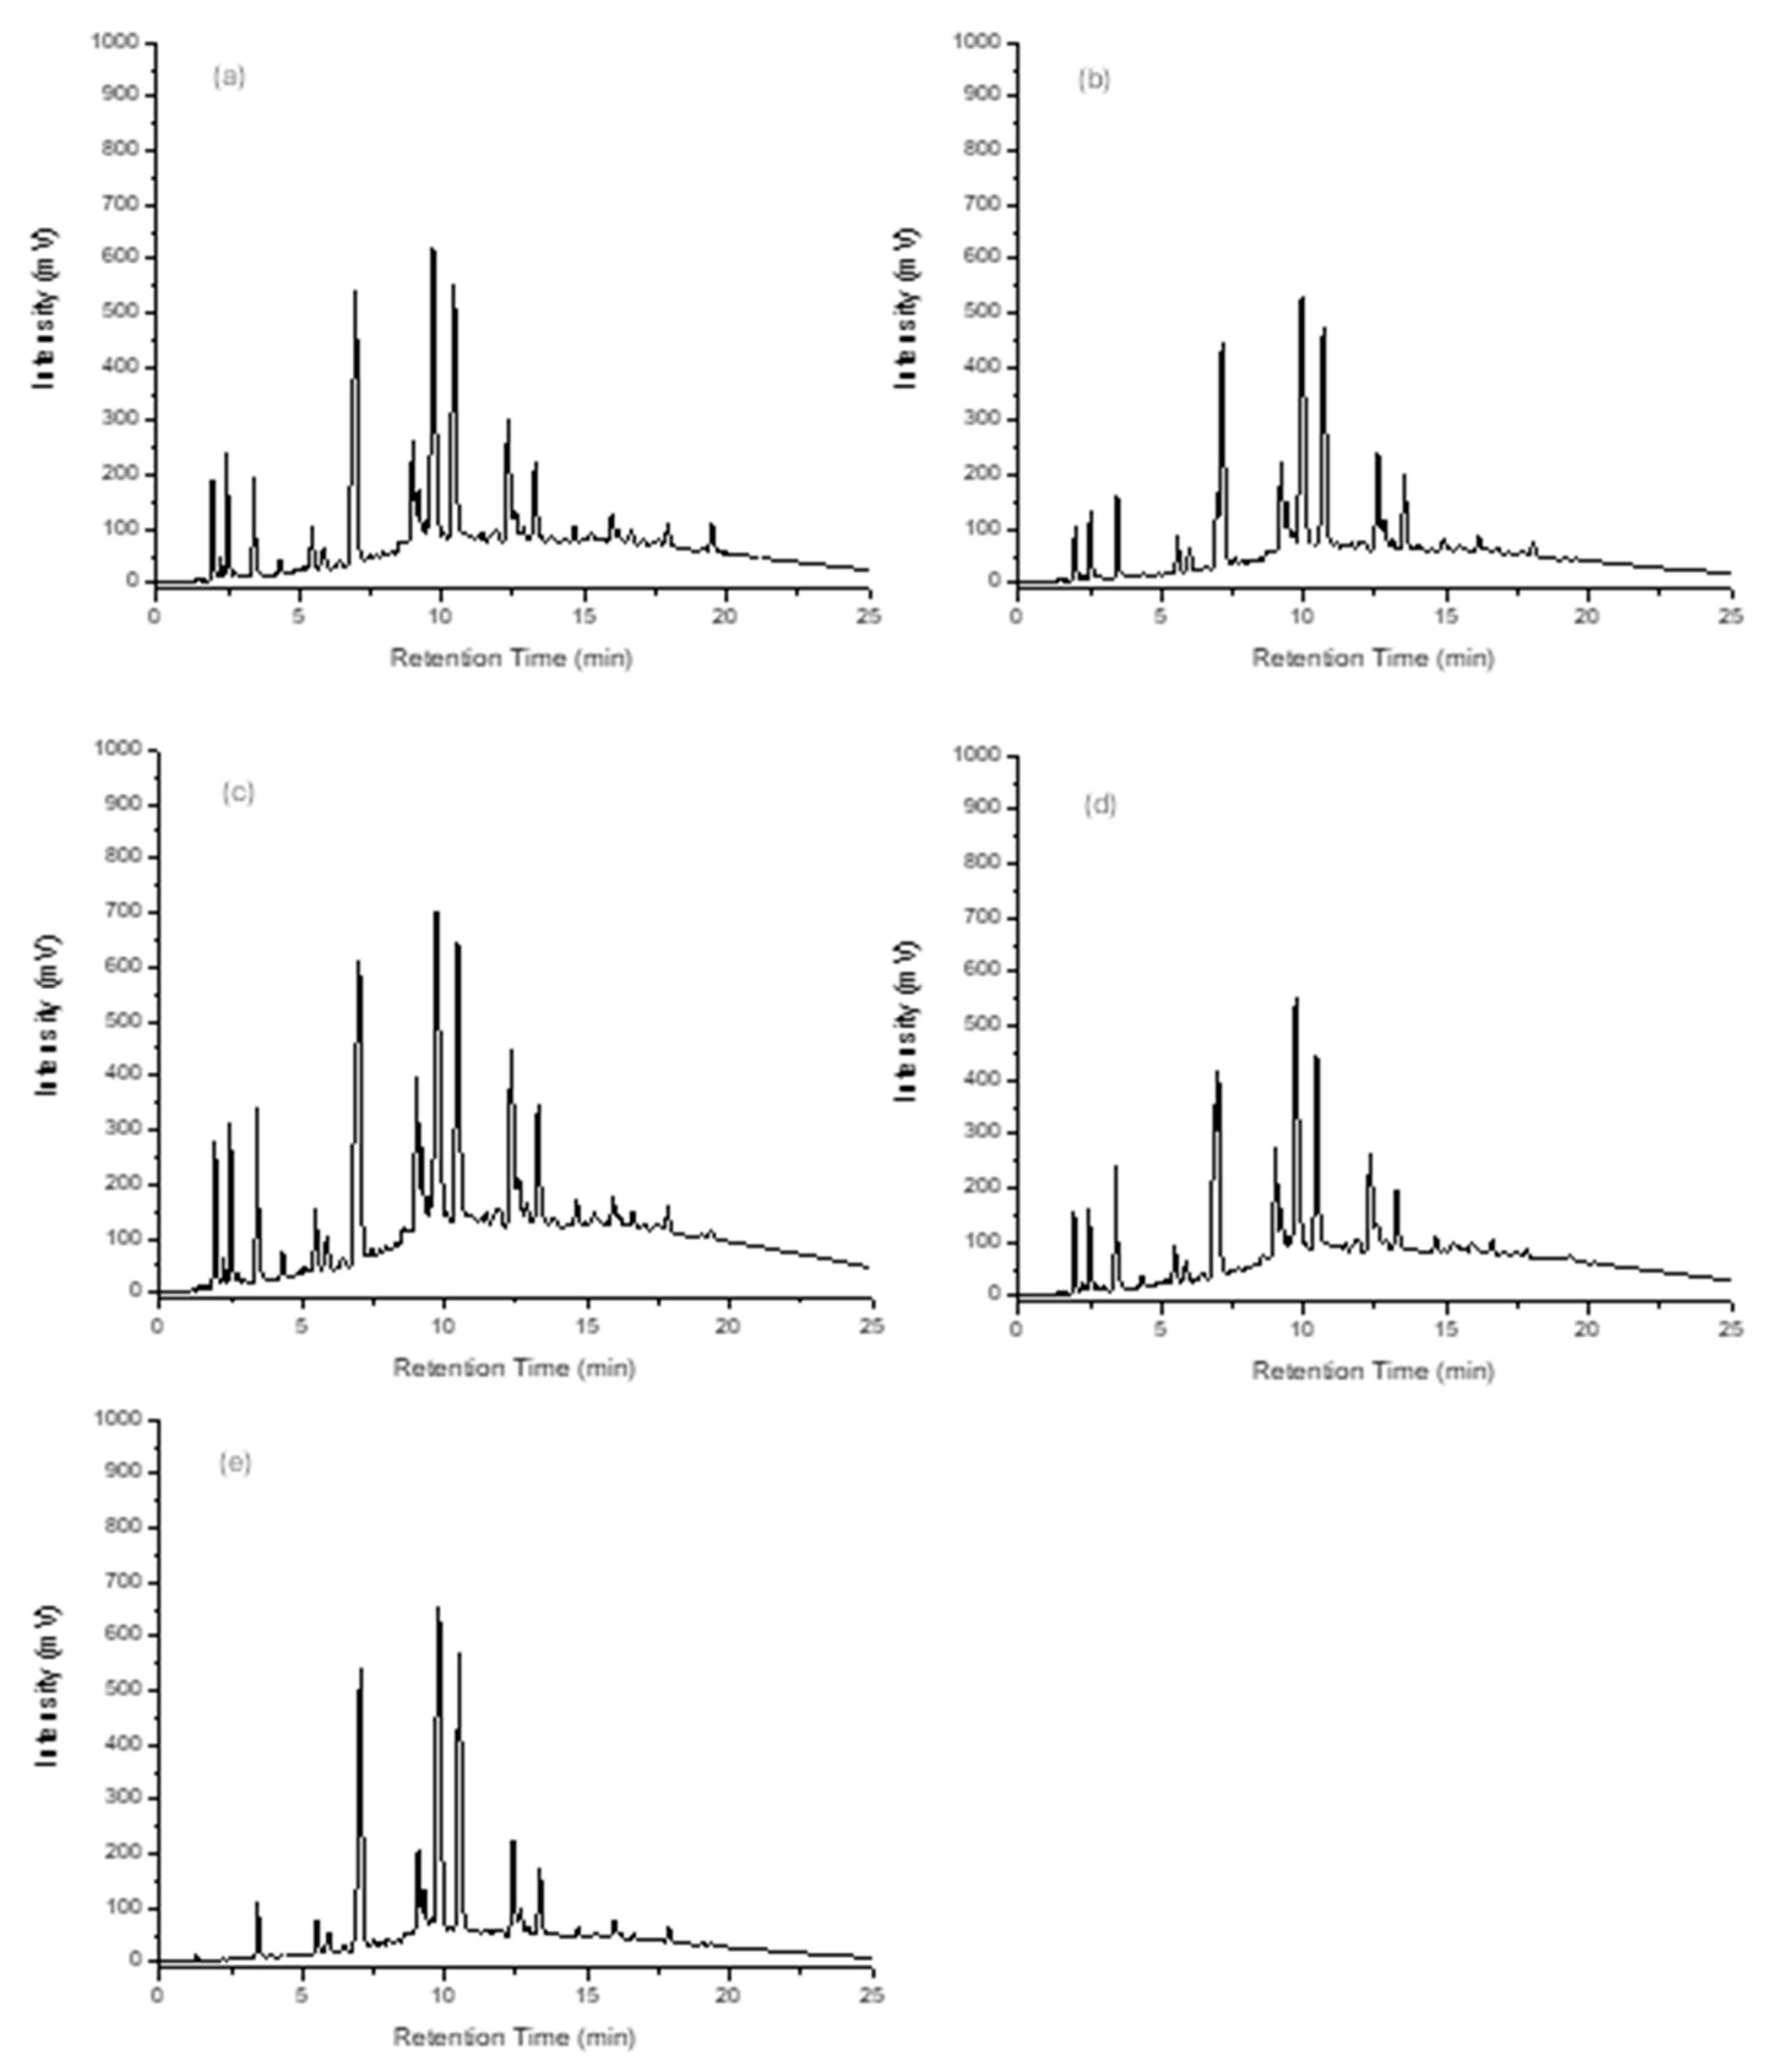
The same five coffees (fresh coffee samples) were used to prepare cold-drip coffees. Again, there were substantial differences in the antioxidant profiles derived from each of the coffees, as illustrated in
Figure 9a–e. In addition to the differences between the coffee flavours, there were also substantial differences in the antioxidant profiles of the same coffees prepared using either the hot or cold-drip processes, and this was consistent with the information derived from the correlation plots of the normalised amounts of the antioxidants in each of the coffee samples.
An important outcome for this testing regime is that analysts who are involved in the testing of complex samples, perhaps especially samples that are derived from nature, where variability between samples is expected to be high, should necessarily take a great deal of care with the sample preparation. In this work we systematically tested the antioxidant content in samples of coffee using hot- and cold-brew protocols. While these two approaches in sample preparation resemble the procedures used in typical cafes, it is important to note that in essence, the ideal coffee shot should be reproducible in production. Clearly, the work here demonstrates that while the hot brew was highly reproducible, the cold brew was the opposite—highly variable. In fact, the variation from one preparation to the next in the case of the cold brew was so high that the outcome, from a scientific analysis perspective, was as if the samples were from different origins even though they were sourced from the exact same coffee—for both the cold-brew and the hot-brew preparations. Beyond the process of sample preparation for coffee, analysts must carefully consider the nature of the sample preparation, especially for complex samples, so that the outcome truly describes the sample under study.
4. Conclusions
The results presented herein align with the recent literature in noting that the CUPRAC post-column derivatisation testing process showed much promise and was found to have high reproducibility and repeatability in instrument analysis [
12,
13]. While there was significant repeatability across samples prepared using the hot-brew method, a more significant variance was visible in samples prepared using the cold-drip method.
Further, similar to observations by Angeloni et al. [
15], coffee extraction methods resulted in differences in observable traits. Compared to hot-brew, cold-drip coffee contained a lower concentration of antioxidants, with some absent that were present in the hot brew. There were also differences observed between the different brands of coffee sampled, irrespective of the extraction process (hot vs. cold), possibly due to differences in the bean roasting process and origin. In the case of the hot brew, we detailed these in prior studies. When considering consumer experience, it can be concluded that a reliable coffee experience, at least with respect to antioxidants, is more likely with hot-brew rather than cold-drip coffee.
Ultimately, this study successfully explored the difference in antioxidant concentrations between cold-drip and hot-brew coffee. More investigation can be performed on the effect of the length of percolation on final antioxidant concentrations, followed by differences in antioxidant profiles according to the origin of the beans and the roasting process used. Importantly, this study also highlights that for reliable analysis of complex samples the process of sample treatment prior to testing is critical, in that the process must enable the extraction of components in a way that represents the sample itself.


