1. Introduction
The domain of informatics is not immune to user dissatisfaction, with complaints frequently stemming from a multitude of factors that can broadly be categorized as usability impediments, system availability issues, accessibility barriers, and deficiencies in information clarity and presentation. Historically, addressing these grievances has largely relied on manual categorization processes coupled with keyword-based filtering techniques, approaches that are often resource-intensive, prone to human error, and limited in their ability to discern nuanced patterns and latent relationships within the complaint data [
1]. In recent years, the burgeoning field of artificial intelligence has garnered significant attention within the realm of e-government applications, giving rise to innovative solutions such as AI-powered chatbots designed to enhance citizen engagement, smart decision support systems aimed at optimizing resource allocation, and predictive analytics tools engineered to forecast citizen needs and proactively address potential issues [
2]. However, despite the growing recognition of AI’s transformative potential within the public sector, a notable gap persists in the application of AI techniques to the analysis of log file patterns for the purpose of preemptively identifying and mitigating the underlying causes of user dissatisfaction within informatics systems. The digitization of data is crucial for AI adoption in public administration, enabling functions like administrative burden reduction and cost savings by moving away from paper records [
3].
Proactively addressing citizen dissatisfaction before it becomes a formal complaint can improve public service delivery, enhance administrative efficiency, and build trust in government. AI can automate functions like benefits processing and compliance, and use predictive analytics to optimize resource allocation and workflow [
4]. By leveraging machine learning algorithms to analyze vast quantities of log file data, it becomes possible to identify subtle patterns and anomalies that may indicate impending system failures, usability bottlenecks, or accessibility challenges [
5]. Such preemptive insights can then be used to trigger automated remediation processes, such as server load balancing, software patching, or the dynamic adjustment of user interface elements, thereby minimizing the likelihood of user complaints and ensuring a seamless user experience. AI is useful in recognizing patterns of security-related activities or data security rules [
6]. These AI-driven interventions can also be personalized to cater to the specific needs and preferences of individual users, further enhancing user satisfaction and promoting greater adoption of e-government services. Furthermore, AI has been shown to bolster governmental services through strong data utilization, the prediction of public needs, and the application of data-driven encryption techniques, enabling careful access decision-making and ensuring that personal data is accessible only to authorized parties, preventing privacy breaches and data abuse [
7].
The ethical considerations surrounding the deployment of AI in e-government applications, particularly those involving the analysis of user data, cannot be overlooked [
8,
9]. Moreover, it is imperative to establish robust data governance frameworks that prioritize transparency, accountability, and user control over data collection and usage practices. These frameworks should incorporate mechanisms for obtaining informed consent from users, ensuring data anonymization and pseudonymization techniques are employed to protect user privacy, and providing users with the ability to access, rectify, and erase their personal data [
10,
11].
Additionally, it is crucial to address potential biases in AI algorithms that could lead to discriminatory outcomes or unfair treatment of certain user groups [
12]. Algorithmic bias can happen when algorithms are trained with biased data; such bias may produce unfair outcomes. This issue has serious ethical implications. AI systems should be designed and trained using diverse and representative datasets, and their performance should be rigorously evaluated across different demographic groups to identify and mitigate any potential biases. Moreover, explainability and interpretability of AI decision-making processes are essential to fostering trust and ensuring accountability.
While the Cross-Industry Standard Process for Data Mining (CRISP-DM) has been widely adopted across various domains, including public sector applications such as labor inspection data analysis [
13], and automated complaint classification has been explored in e-commerce contexts [
14], the integration of semantic clustering using sentence embeddings within the CRISP-DM framework for public sector complaint management remains underexplored. Our study distinguishes itself by employing BERT-based sentence embeddings to semantically cluster complaint descriptions, enabling the identification of latent issue categories beyond traditional keyword-based methods. Furthermore, we operationalize these insights through a real-time dashboard, facilitating proactive monitoring and decision support. To our knowledge, this is one of the first studies to combine semantic clustering, advanced classification techniques, and real-time operational integration within the context of public sector informatics complaint management.
To address these challenges, this paper presents an AI-driven approach that leverages both data mining and text mining techniques to standardize and classify informatics complaints in a scalable and semantically aware manner. A key contribution of this work lies in the practical integration of BERT-based sentence embeddings and semantic clustering within the CRISP-DM framework to support complaint management in a real-world public administration context. While the core components—BERT embeddings, K-Means clustering, and Random Forest classification—are established methods, their combined application to unstructured informatics complaints enables the harmonization of varied user expressions referring to similar technical problems. More importantly, the framework translates these insights into a real-time dashboard that supports proactive remediation and operational decision-making. This end-to-end implementation demonstrates how off-the-shelf components can be orchestrated effectively to address long-standing bottlenecks in digital service delivery, offering a replicable model for other public sector settings.
Unlike previous work, which often focuses separately on classification or clustering, our approach offers a full end-to-end complaint management framework: from semantic understanding to real-time monitoring and proactive remediation, validated with real-world data from a public sector agency. This study thus contributes not only technically, but also operationally, to the digital transformation of public service delivery.
The main contributions of this work are threefold: (1) the development of a methodology for harmonizing complaint topics through natural language processing and pattern recognition; (2) the deployment of a machine learning pipeline that transforms raw interaction logs into actionable insights; and (3) the evaluation of the framework through a real-world case study conducted in a local Portuguese government agency, focusing on the automation of error handling in equipment data import processes. The findings highlight the potential for proactive digital service management in public administration.
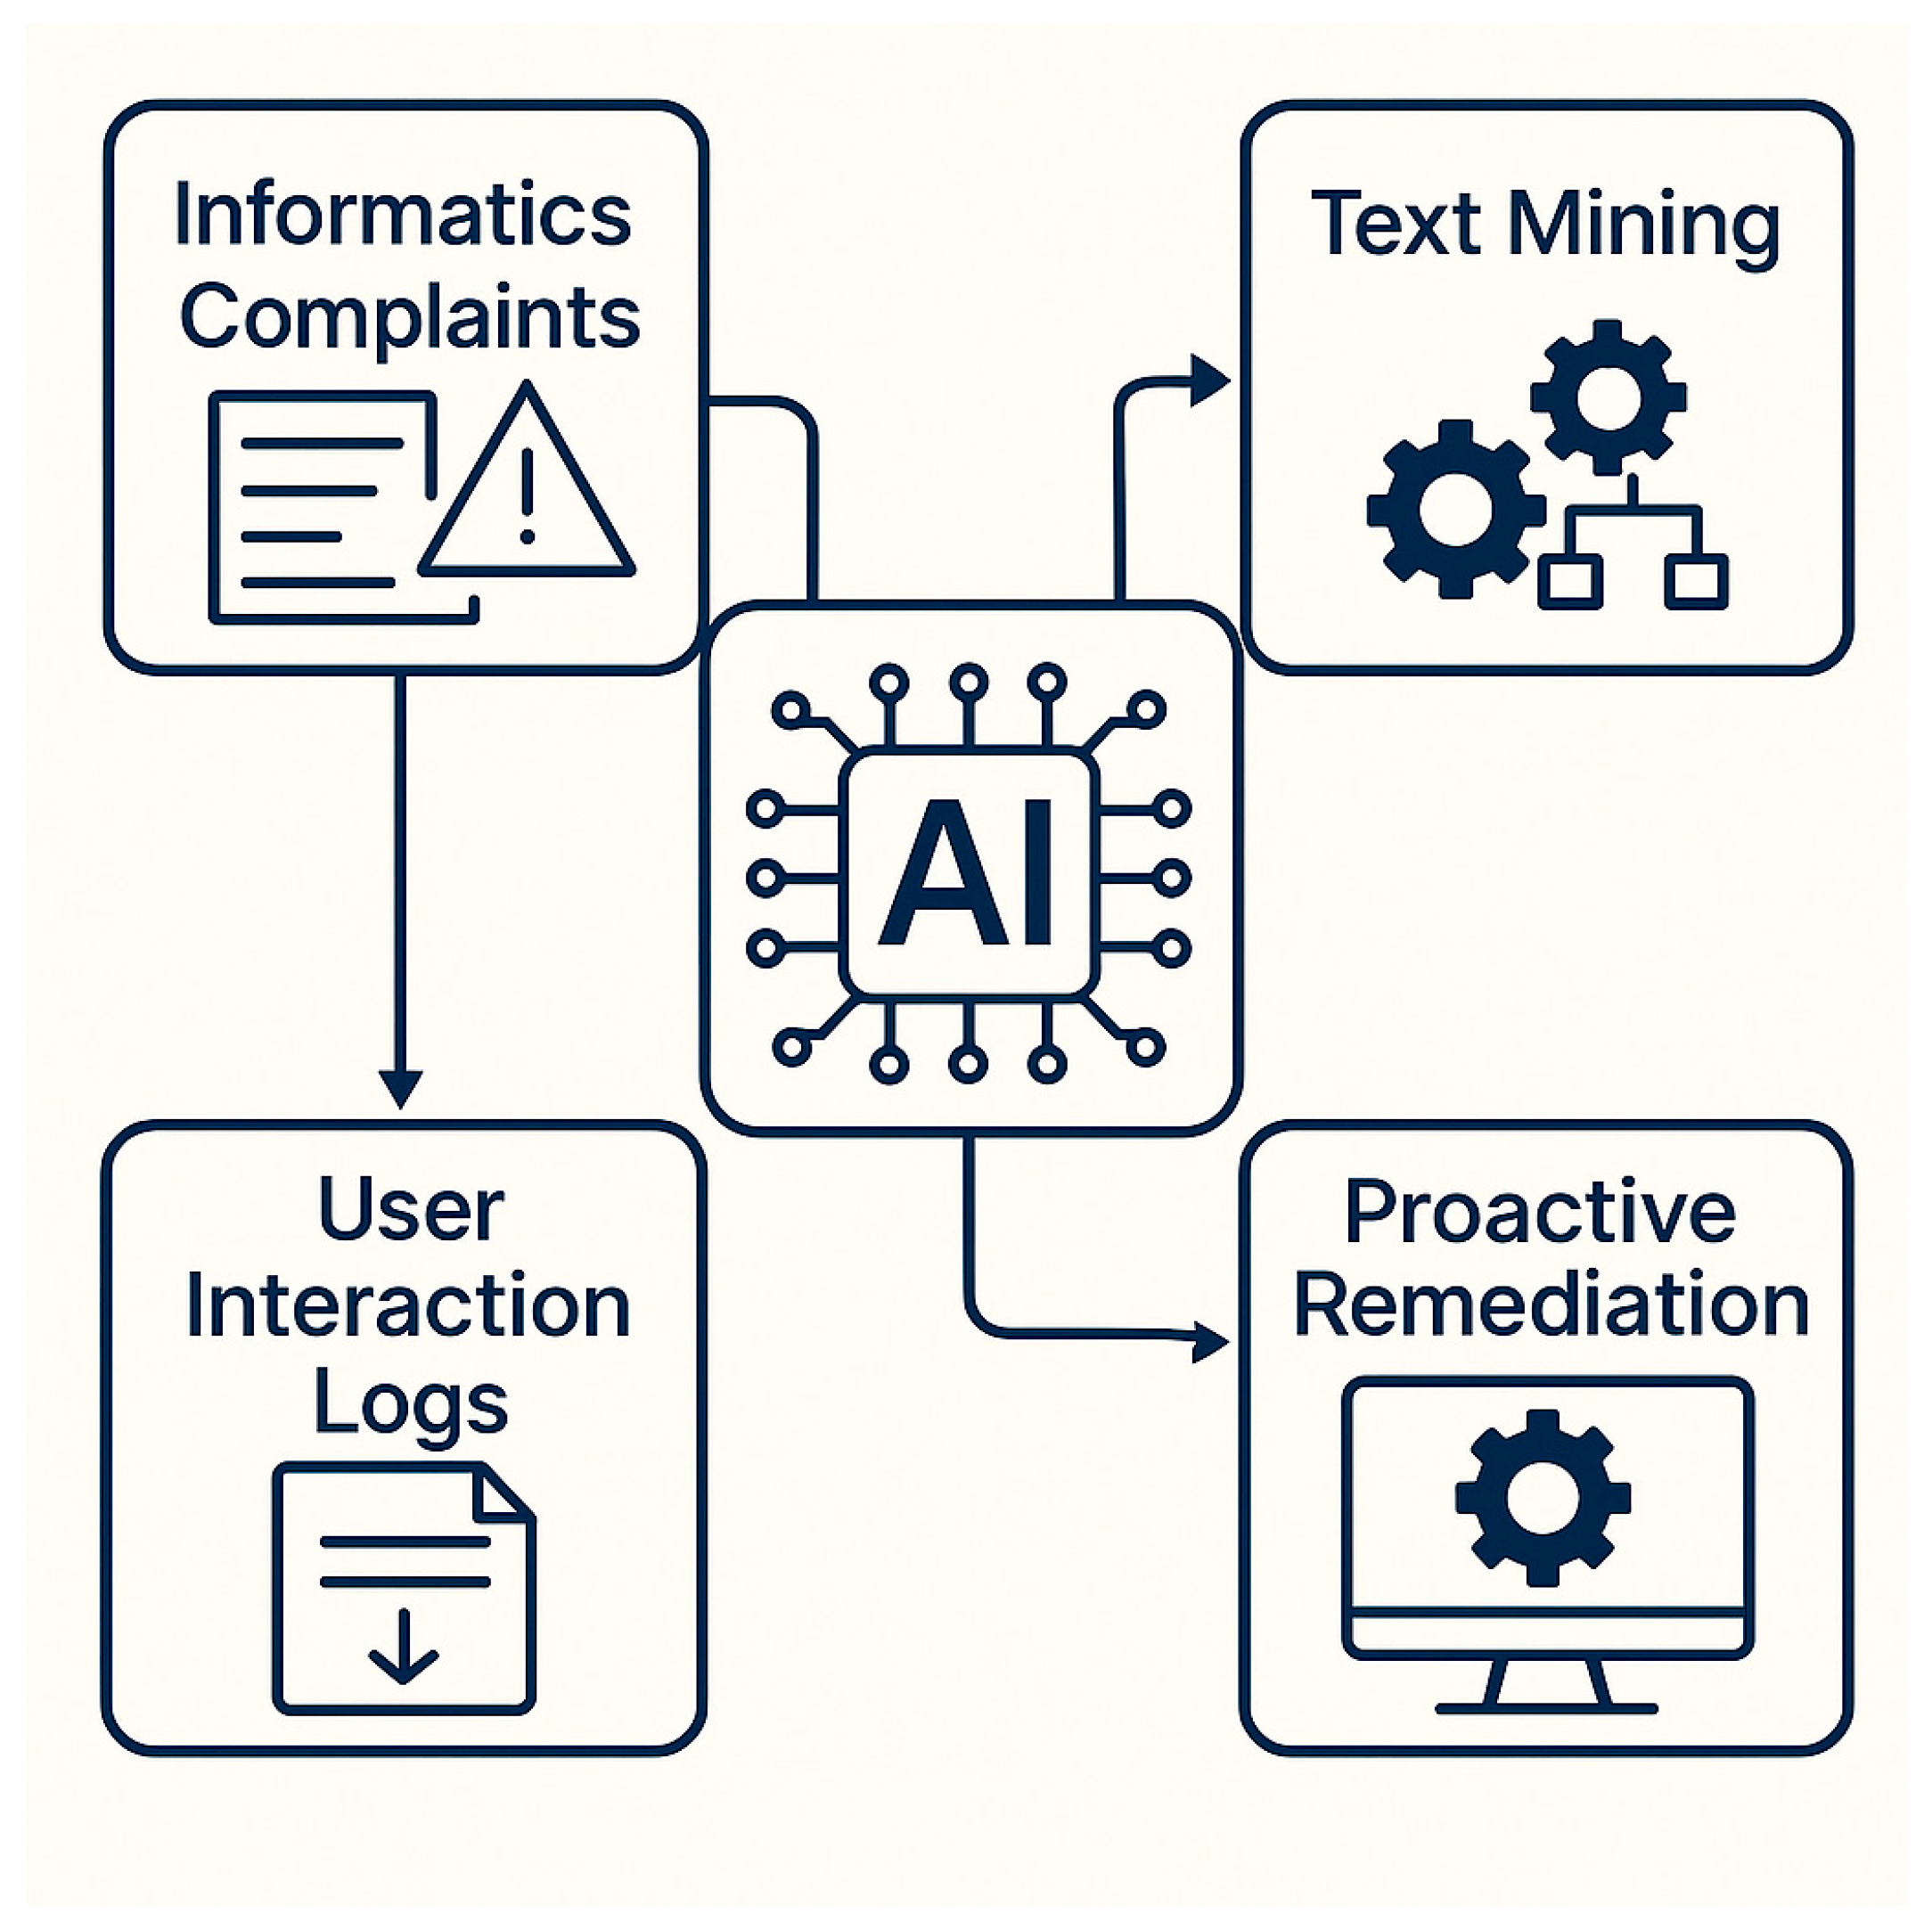
Figure 1, shows the major work concept.
The concept of proactive complaint management refers to the ability of a system to anticipate, detect, and resolve issues before they escalate into formal user complaints. In contrast to traditional reactive approaches—where user reports trigger support interventions—proactive systems leverage predictive analytics and semantic pattern recognition to identify anomalies, recurring issues, or latent user dissatisfaction embedded in operational data such as logs and free-text submissions.
In the context of public sector informatics, proactivity is particularly valuable for improving service quality, minimizing user frustration, and reducing administrative overhead. Prior studies have emphasized the need for early-warning systems in digital governance to detect usability bottlenecks, performance anomalies, or systemic failures in real time [
15,
16].
Operationally, our framework enables proactivity by clustering semantically similar complaint narratives, identifying unusual patterns through anomaly detection, and triggering alerts when certain issue categories exceed predefined thresholds. For example, if complaints relating to software slowness spike within a specific department, the system not only classifies these but flags them for intervention before users escalate the issue to IT support. This transforms complaint management from a passive recording function to an active monitoring and remediation mechanism.
Thus, we define proactivity not just as an architectural feature, but as a measurable outcome: the ability to reduce repeated complaint types, accelerate issue resolution, and mitigate problems at an earlier stage of the user experience lifecycle.
The remainder of this paper is structured as follows.
Section 2 reviews related work on AI applications in public sector complaint management.
Section 3 details the methodological approach, following the CRISP-DM framework.
Section 4 discusses the implementation and evaluation of the system in the local government case.
Section 5 reflects on operational, technical, and ethical implications. Finally,
Section 6 presents the conclusions and outlines future directions, including real-time deployment and cross-agency integration.
3. Methodology: A CRISP-DM Approach to a Real Case
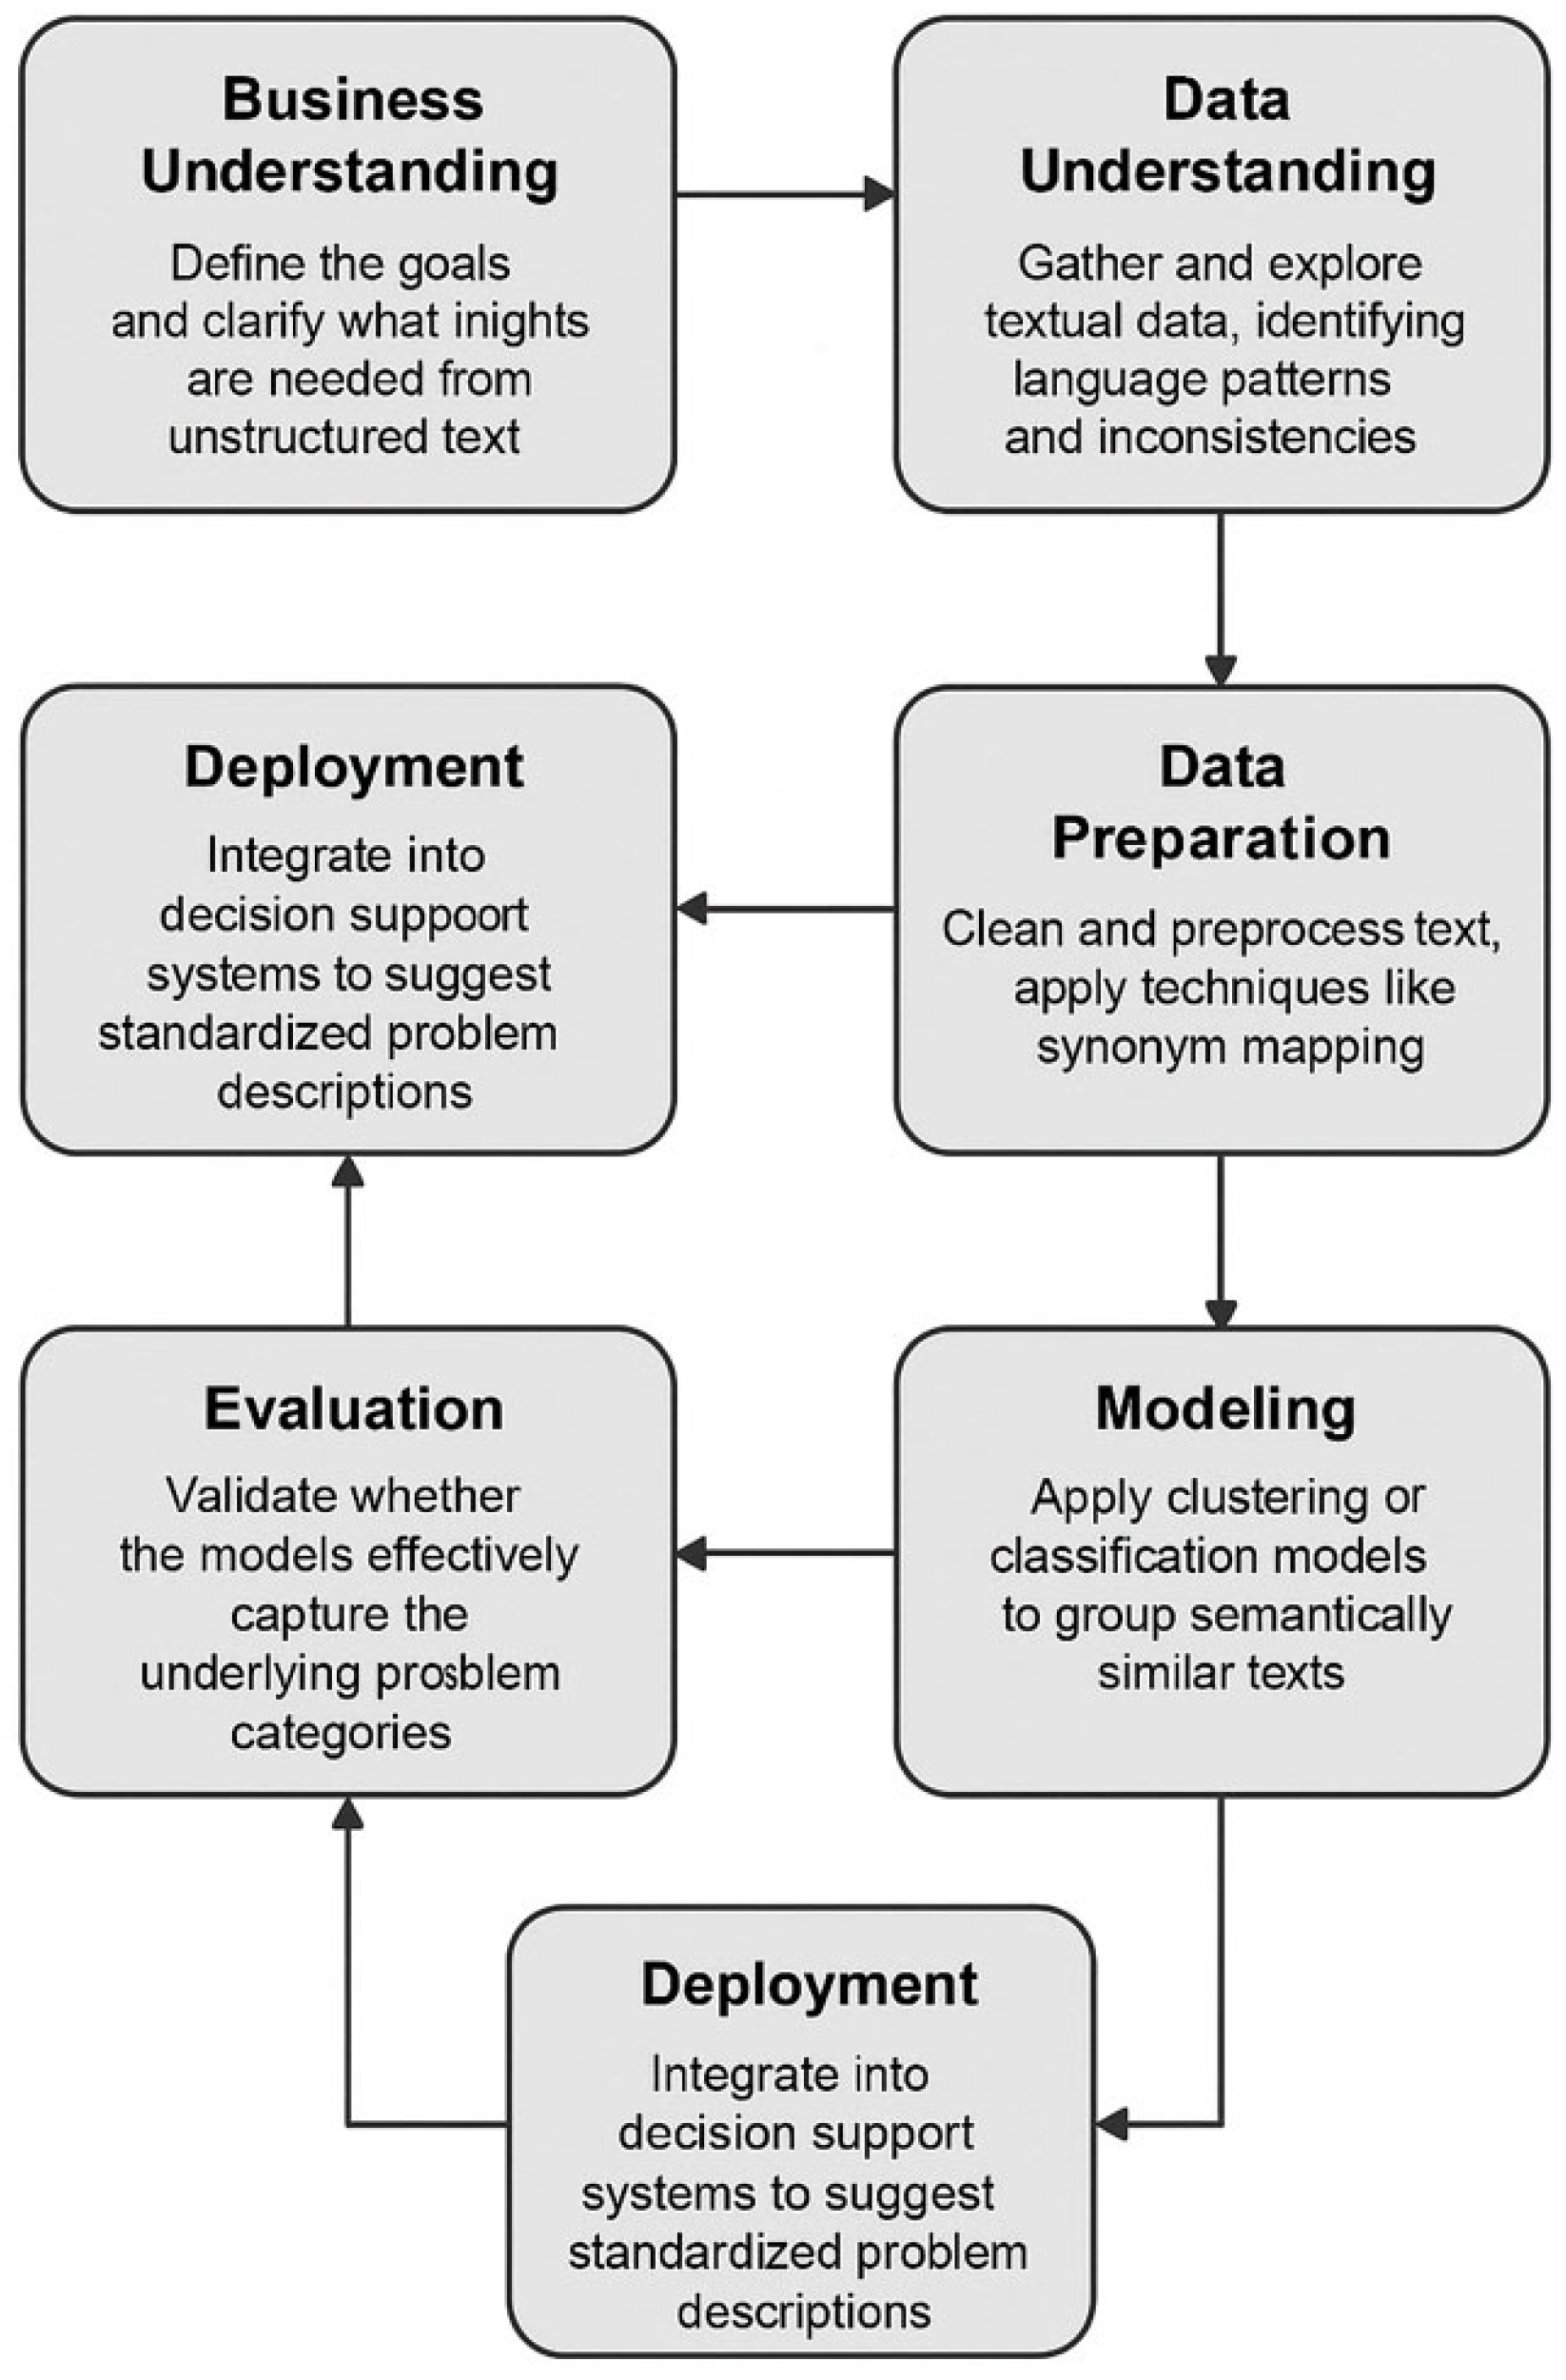
In the context of automating the management of data import errors for technical equipment systems, the CRISP-DM (Cross Industry Standard Process for Data Mining) methodology offers a structured and iterative approach to applying artificial intelligence to a real-world operational challenge. We adapt CRISP-DM for text mining to help standardize the understanding and representation of problems described in natural language by different individuals, see
Figure 2. The process involves:
Business understanding—define the goals and clarify what insights are needed from unstructured text (e.g., understanding how different users describe similar issues).
Data understanding—gather and explore textual data, such as tickets, reports, or user queries, identifying language patterns and inconsistencies.
Data preparation—clean and preprocess text (tokenization, normalization, stemming, etc.) and apply techniques like synonym mapping or semantic embedding to reduce differences in phrasing.
Modeling—apply clustering or classification models to group semantically similar texts, helping uncover common problem themes.
Evaluation—validate whether the models effectively capture the underlying problem categories and reduce ambiguity.
Deployment—integrate into decision support or helpdesk systems to suggest standardized problem descriptions and improve response consistency.
3.1. Business Understanding
This first phase—business understanding—focuses on clearly defining the problem, the business objectives, and the success metrics that will guide the entire AI development process.
The core problem arises from the frequent occurrence of failures during the importation of equipment-related data. These failures stem from a variety of sources, including inconsistent formatting, incomplete records, and misclassified or unrecognized equipment types. Traditionally, technical teams handle such errors manually, leading to inefficiencies, delays in system integration, and frustration among users and support personnel. The goal of applying AI in this context is to move from a reactive and manual error-handling process to a proactive and automated framework capable of identifying, predicting, and correcting issues at scale.
The central objective of this initiative is to design and implement an intelligent system that leverages machine learning and natural language processing to classify common import errors, recommend appropriate corrective actions, assess the likelihood of failure in incoming data, and support technicians through intelligent interfaces such as chatbots and visual dashboards. This system aims to enhance operational efficiency, reduce the volume of failed imports, and ultimately improve the reliability and traceability of equipment registration processes.
Achieving this objective requires the involvement of multiple stakeholders, including IT administrators responsible for maintaining the import infrastructure, data analysts tasked with preparing and interpreting historical error logs, and support personnel who act on system alerts and recommendations. Success will be measured not only by traditional machine learning metrics—such as accuracy or precision in classification models—but also by tangible business outcomes, such as a reduction in recurring errors, faster issue resolution times, and increased autonomy of the support team in handling complex importation scenarios.
In applying CRISP-DM, this phase lays the foundation for the subsequent steps, ensuring that the data mining and AI modeling activities are firmly aligned with the organizational context and operational needs. It also emphasizes the importance of ethical and governance considerations, particularly when dealing with sensitive administrative records or learning from historical logs involving human decision-making. By clearly articulating the business challenges and opportunities, this phase ensures that AI is not simply a technical solution, but a strategic enabler of digital transformation in data management processes.
3.2. Data Understanding
In alignment with the CRISP-DM methodology, the data understanding phase provided a structured exploration of the multiple datasets underpinning the equipment importation process in the public sector. This phase aimed to assess the structure, quality, and relevance of the available data to support the development of AI-driven mechanisms for error classification, correction recommendation, and process optimization.
The combined dataset consisted of 12,843 complaint records derived from 7615 unique user interaction logs, spanning a temporal window from January 2022 to December 2024. These logs reflect a broad range of technical and administrative issues encountered across various public sector departments and infrastructures. The dataset included both structured fields (e.g., equipment type, supplier ID, timestamps) and unstructured fields (e.g., free-text error descriptions and user comments).
The data corpus was composed of heterogeneous sources obtained from operational systems responsible for asset management and technical support. These sources included Excel and CSV files representing distinct administrative and technical domains, such as equipment registries, supplier associations, user logs, and historical importation outcomes. Key datasets were derived from platforms including PatOnline and PATS, which collectively captured a wide range of structured and semi-structured information. The data contained attributes such as equipment type, model, memory and storage configurations, supplier identifiers, timestamps of importation attempts, and diagnostic error messages. Importation logs were particularly rich in unstructured content, often containing free-text descriptions of failures, which presented both analytical opportunities and preprocessing challenges.
A key aspect of the classification task was understanding the class balance across the four semantic clusters identified through BERT-based embeddings. The distribution of complaints was as follows: Cluster 0 (Startup Errors and Equipment Reassignment): 28.1%, Cluster 1 (Software Reinstallation and Slow Performance): 36.2%, Cluster 2 (Peripheral Failures and Error Indicators): 18.7%, and Cluster 3 (Equipment Replacement and Migration): 17.0%. While moderately imbalanced, the distribution allowed for stratified sampling during model training and informed the evaluation metrics used.
An initial exploratory analysis was conducted to evaluate the completeness and consistency of the data. This included data type profiling, assessment of value distributions, and identification of columns with high levels of missingness. Visual inspection techniques, such as heatmaps and null-value matrices, were employed to detect patterns of sparsity and redundancy. Several tables exhibited fields with over 50% missing values, particularly in legacy or auxiliary datasets, suggesting the need for dimensionality reduction or selective exclusion during the preparation phase. In contrast, critical fields relevant to model training, such as equipment specifications and error descriptions, were generally well populated, though inconsistencies in formatting and nomenclature were common.
Free-text fields, especially those containing equipment names and part numbers, displayed high lexical variability. Variants such as “HP ProBook 430 G5” and “HP Probook 430G5” were semantically equivalent but syntactically dissimilar, indicating the necessity of applying normalization techniques and entity resolution in subsequent phases. Similarly, the MensagemErroImportacao field revealed a rich set of diagnostic expressions, from SQL constraint violations to ambiguous timeout errors, necessitating natural language processing for semantic grouping and downstream interpretability.
Relational structures across datasets were also identified, with foreign key relationships linking records across different sheets and file types. For example, associations between equipment entries and their respective importation logs were essential for constructing supervised learning datasets. These relationships informed the feature engineering strategy and underscored the importance of maintaining referential integrity throughout the preprocessing workflow.
This exploratory phase confirmed that the available data, while diverse and partially inconsistent, possessed substantial analytical value. The findings informed the design of targeted cleaning and transformation procedures, and helped define the scope of features suitable for use in predictive modeling, recommendation systems, and semantic analysis. Moreover, the identification of latent patterns in the logs and textual fields sets the stage for advanced machine-learning approaches capable of automating and optimizing the error-handling process in large-scale equipment importation workflows.
Table 1 summarizes the key attributes extracted from user interaction logs and complaint reports. Each record contains a unique identifier, metadata regarding the event timing and user, contextual information about the affected system, a free-text description of the issue, and fields related to complaint classification, severity, and resolution status.
3.3. Data Preparation
Following the exploratory assessment of the data landscape, the data preparation phase focused on the systematic transformation, cleaning, and integration of heterogeneous data sources to enable the development of machine learning models. In line with the CRISP-DM framework, this phase served to operationalize the findings from the previous stage by implementing data engineering strategies capable of addressing sparsity, inconsistency, and semantic heterogeneity across the datasets.
The data corpus was initially fragmented across multiple files and formats, including structured spreadsheets and delimited text files sourced from independent subsystems such as PatOnline and PATS. These sources contained overlapping, complementary, and in some cases, redundant information related to equipment specifications, supplier attributes, user interactions, and importation diagnostics. As a first step, a robust data merging pipeline was developed to consolidate these inputs into a cohesive dataset. This involved schema alignment through the detection of shared column names, resolution of conflicting data types, and elimination of deprecated or contextually irrelevant sheets (e.g., legacy contact directories or inactive administrative entities). The merging logic preserved table-level granularity when necessary to retain meaningful relational context.
Data cleaning routines were subsequently applied to improve data quality and prepare features for downstream tasks. Missing value treatment was performed based on field-level sparsity thresholds. Columns with more than 50% null values were excluded from further analysis, while others were retained with appropriate imputation or flagging. Summary statistics and missingness matrices were employed to guide these decisions. This process led to a significant reduction in dimensionality while preserving the features most relevant to the predictive modeling and semantic interpretation objectives.
To address the substantial lexical variability observed in free-text fields, particularly those containing equipment names, part numbers, and error messages, text normalization techniques were introduced. These included case standardization, removal of extraneous characters, and the application of fuzzy string-matching algorithms to harmonize semantically equivalent but syntactically divergent entries. For example, variants such as “HP ProBook 430 G5” and “HP Probook 430G5” were reconciled using custom modules based on token-level similarity and domain-specific regular expressions. This step was essential to ensure consistency in entity recognition tasks and improve the reliability of subsequent machine learning models.
Particular attention was given to the preprocessing of the MensagemErroImportacao field, which served as a critical input for both classification and clustering models. This unstructured field was transformed into numerical representations using sentence-level embeddings. These embeddings, generated using state-of-the-art models from the sentence-transformers library, captured semantic nuances and enabled downstream tasks such as semantic clustering, anomaly detection, and explainable recommendations of corrective actions.
Relational integrity across datasets was preserved by maintaining foreign key linkages during the merging process. These relationships allowed the construction of enriched feature spaces where each equipment record was linked to historical import outcomes, supplier metadata, and system-generated error traces. This multi-faceted representation was essential for supervised learning, particularly in the training of classification models to predict error types and risk scores associated with new import attempts.
The final dataset resulting from this phase was a unified, high-quality tabular structure with normalized text fields, resolved relational links, reduced dimensionality, and semantic encodings of unstructured information. This dataset was subsequently partitioned into training, validation, and testing subsets, ensuring temporal and contextual separation to mitigate data leakage and support model generalization. All transformation procedures were implemented as reproducible scripts, facilitating automation and future updates as additional data becomes available.
To ensure compliance with data protection regulations, particularly the General Data Protection Regulation (GDPR), an anonymization pipeline was incorporated into the preprocessing workflow. Fields containing personally identifiable information (PII), such as email addresses, user names, and device identifiers, were subjected to one-way cryptographic hashing or pseudonymization, depending on their relevance to analytical tasks. Non-essential PII fields were removed entirely. These transformations ensured that the final analytical dataset retained no direct or indirect identifiers, thereby mitigating re-identification risks and supporting the ethical deployment of AI systems in the public sector.
Overall, this data preparation workflow laid a robust foundation for the intelligent modeling of importation failures in public sector digital infrastructures. By addressing issues of scale, inconsistency, and semantic ambiguity, the resulting dataset enabled the effective application of advanced AI techniques, including classification, recommendation, and natural language understanding—contributing to the overarching goal of proactive, AI-driven complaint and error management.
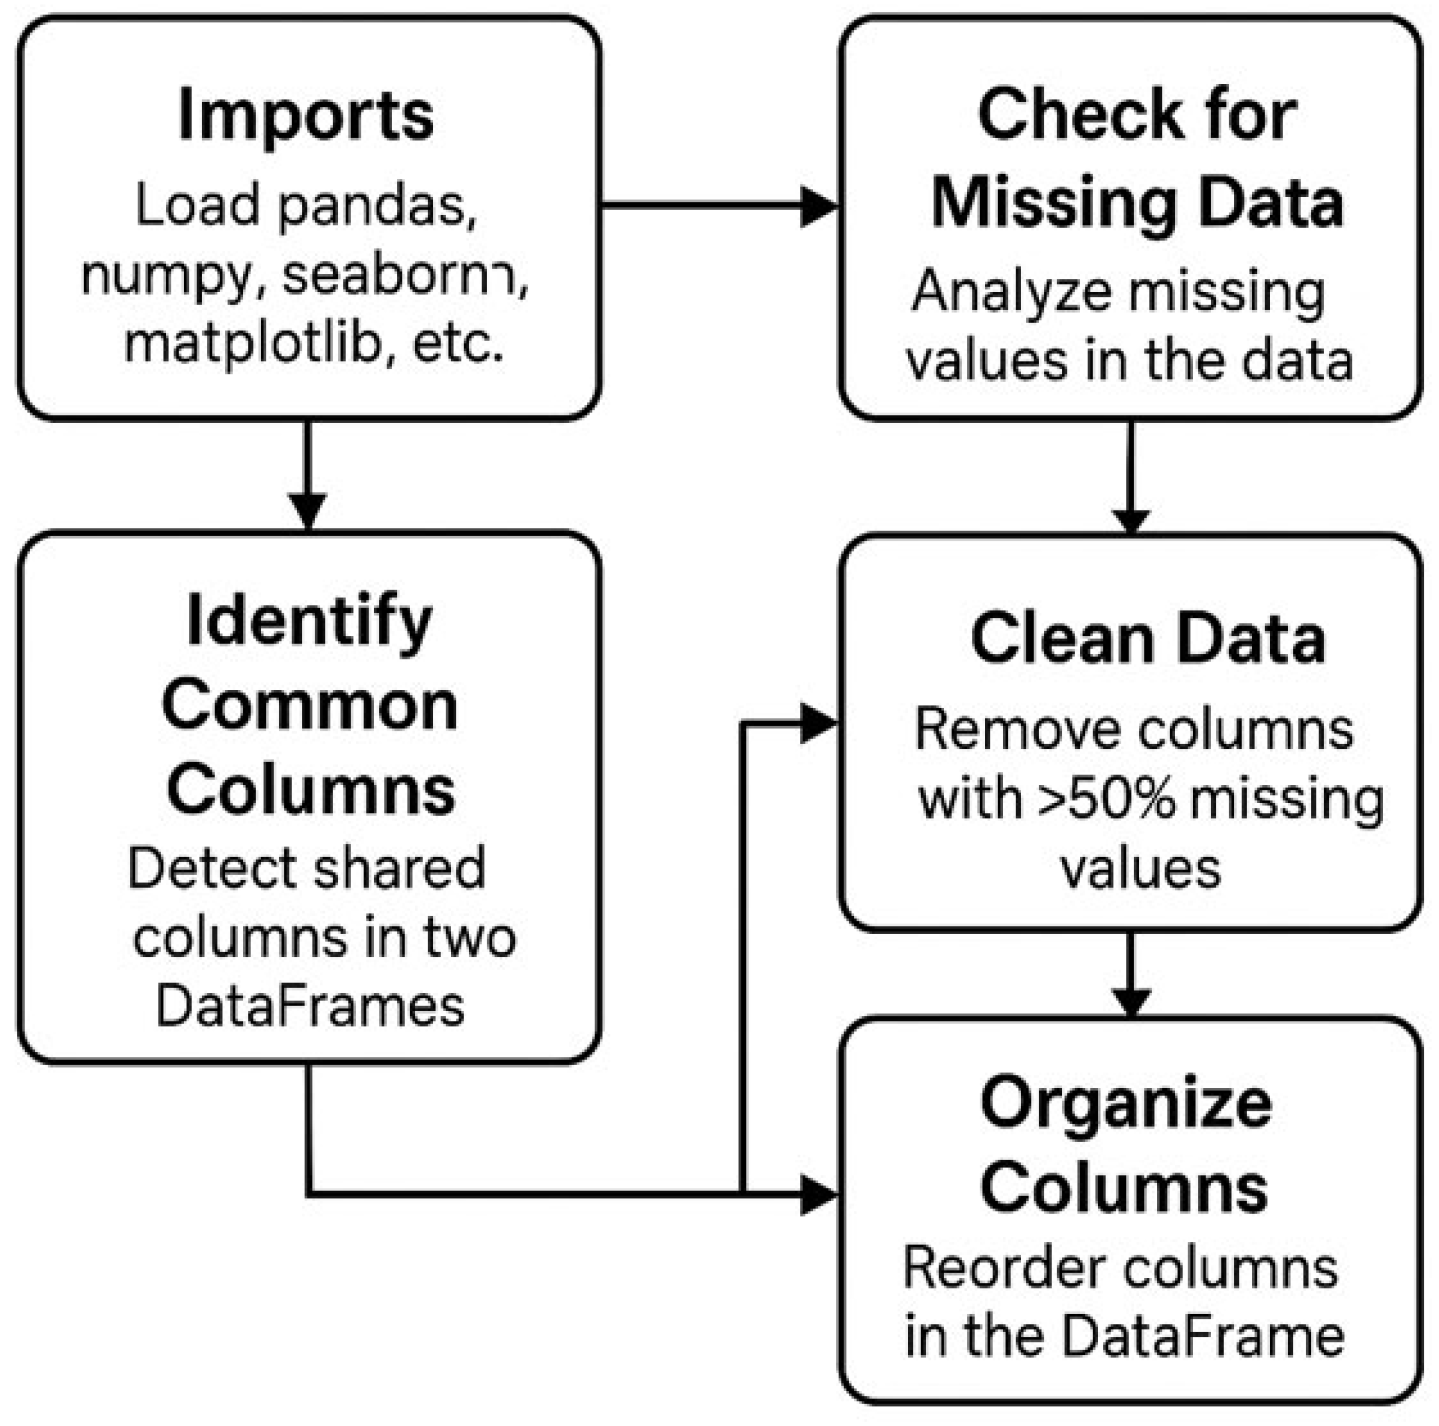
The diagram of
Figure 3 illustrates the sequence of preprocessing steps applied to the informatics complaint dataset. After importing necessary libraries, the workflow involves checking for missing data, removing columns with excessive missing values, identifying common columns between datasets, and organizing the resulting data structure for subsequent analysis.
3.4. Modeling
The modeling phase followed the CRISP-DM methodology and aimed to extract meaningful patterns from user interaction logs to support the automation of informatics complaint handling in the public sector. A combination of clustering, classification, and anomaly detection techniques was used to capture the diversity of data sources and the semantic variation found in complaint descriptions.
To identify semantically similar complaints, clustering was applied using the K-Means algorithm. Sentence embeddings were generated from the cleaned textual descriptions using pretrained BERT models. To identify semantically similar complaints, clustering was applied using the K-Means algorithm.
Sentence embeddings were generated from the cleaned textual descriptions using pretrained BERT models. To accommodate the Portuguese-language dataset, we used the distiluse-base-multilingual-cased-v2 model from the SentenceTransformers library. This multilingual version of BERT is trained for cross-lingual semantic similarity and includes native support for Portuguese, thereby mitigating the risks of semantic drift in embedding generation. This model, based on DistilBERT architecture, offers a trade-off between semantic quality and computational efficiency. Its reduced size (~66 M parameters) enables practical inference on CPU-only municipal IT environments. Inference time was measured on a standard CPU (Intel i7, 32 GB RAM), averaging 0.14 s per complaint. This lightweight footprint ensured compatibility with resource-constrained infrastructures. We avoided heavier models like BERT-base due to their 110 M+ parameter size, which would introduce latency and memory bottlenecks in deployment settings. These embeddings allowed the grouping of complaints that shared the same meaning but differed in their lexical structure. The optimal number of clusters was selected using the Elbow method, which analyzed the model’s inertia across several values of k. The clustering results revealed consistent themes in the complaints, which were then used to harmonize and standardize issue categories.
To evaluate clustering quality, we complemented the Elbow method with additional internal metrics, including the silhouette score (average = 0.47) and the Davies–Bouldin index. Both the Elbow curve and the silhouette analysis supported the choice of k = 4, indicating a good balance between cohesion and separation among semantic clusters. Despite the spherical cluster assumption of K-Means, the cosine-based sentence embeddings produced well-defined groupings. As a robustness check, we experimented with HDBSCAN and BERTopic; while these models generated overlapping cluster sets, they lacked the interpretability and coherence observed with K-Means. Therefore, K-Means was selected for its balance of computational simplicity, cluster coherence, and interpretability in the context of public sector complaint narratives.
For the classification task, a Random Forest classifier was trained to predict predefined error types. The input data included both structured features—such as equipment type, organizational unit, and priority level—and unstructured text data processed using TF-IDF vectorization. A preprocessing pipeline was implemented using scikit-learn’s ColumnTransformer and Pipeline tools to integrate categorical, binary, and textual features. The data was split into training and test sets using a stratified approach to preserve class distribution. The classifier’s performance was evaluated using standard metrics, including accuracy, precision, recall, and F1-score. Additionally, confusion matrices were generated and visualized to identify misclassification patterns and guide future improvements.
We opted for TF-IDF for classification inputs due to its interpretability and compatibility with decision-tree models, allowing the classifier to benefit from sparse textual signals alongside structured metadata. While embedding concatenation or a fine-tuned Sentence-BERT classifier with a softmax head was considered, these alternatives were deprioritized in this iteration to preserve explainability and ensure alignment with deployment constraints in public sector environments—especially the need for transparency in decision logic. Future work includes exploring transformer-based end-to-end classifiers to assess trade-offs between accuracy and operational interpretability.
The dataset was split 70/30 using stratified sampling, with a training set of 8990 entries and a test set of 3853. To address the mild class imbalance, class weights were automatically adjusted during training. In addition to overall metrics, we computed per-class F1 scores and the Matthews correlation coefficient (MCC) to ensure balanced performance. ROC-AUC was also calculated for each class, demonstrating consistent separability, especially for underrepresented categories such as Peripheral Failures.
To support model transparency, we applied SHAP values to interpret feature contributions for a subset of classification results. The most influential features included textual terms (from TF-IDF) such as “timeout”, “driver”, and “reboot”, as well as structured fields like “equipment type” and “organizational unit”. These insights were presented to domain experts for validation and refinement of classification logic.
To detect outlier cases that may indicate emerging or previously unidentified issues, an Isolation Forest algorithm was applied to the BERT-based embeddings after reducing their dimensionality with PCA. This unsupervised method flagged complaints that deviated significantly from the general data distribution. These anomalies were subsequently analyzed and clustered to uncover new categories of technical problems that had not been adequately represented in the historical records.
To evaluate the effectiveness of anomaly detection, flagged cases were compared against a baseline taxonomy of known complaint categories established during the classification phase. Anomalies were grouped by semantic proximity to known classes using cosine similarity of their BERT embeddings and further assessed through cluster cohesion metrics. A manual audit was then conducted to assess interpretability and identify cases that did not align with existing classes. This process confirmed the model’s capacity to surface semantically distinct complaint types not previously labeled in the training data. In future iterations, we aim to incorporate active learning loops and time-aware anomaly scoring to reduce human supervision and support continuous improvement.
The combination of these modeling techniques enabled a deep understanding of recurring and atypical issues, helping to improve the consistency and effectiveness of complaint classification. The results provided a foundation for the proactive resolution of problems and the development of intelligent tools to assist public sector staff in managing technical support requests.
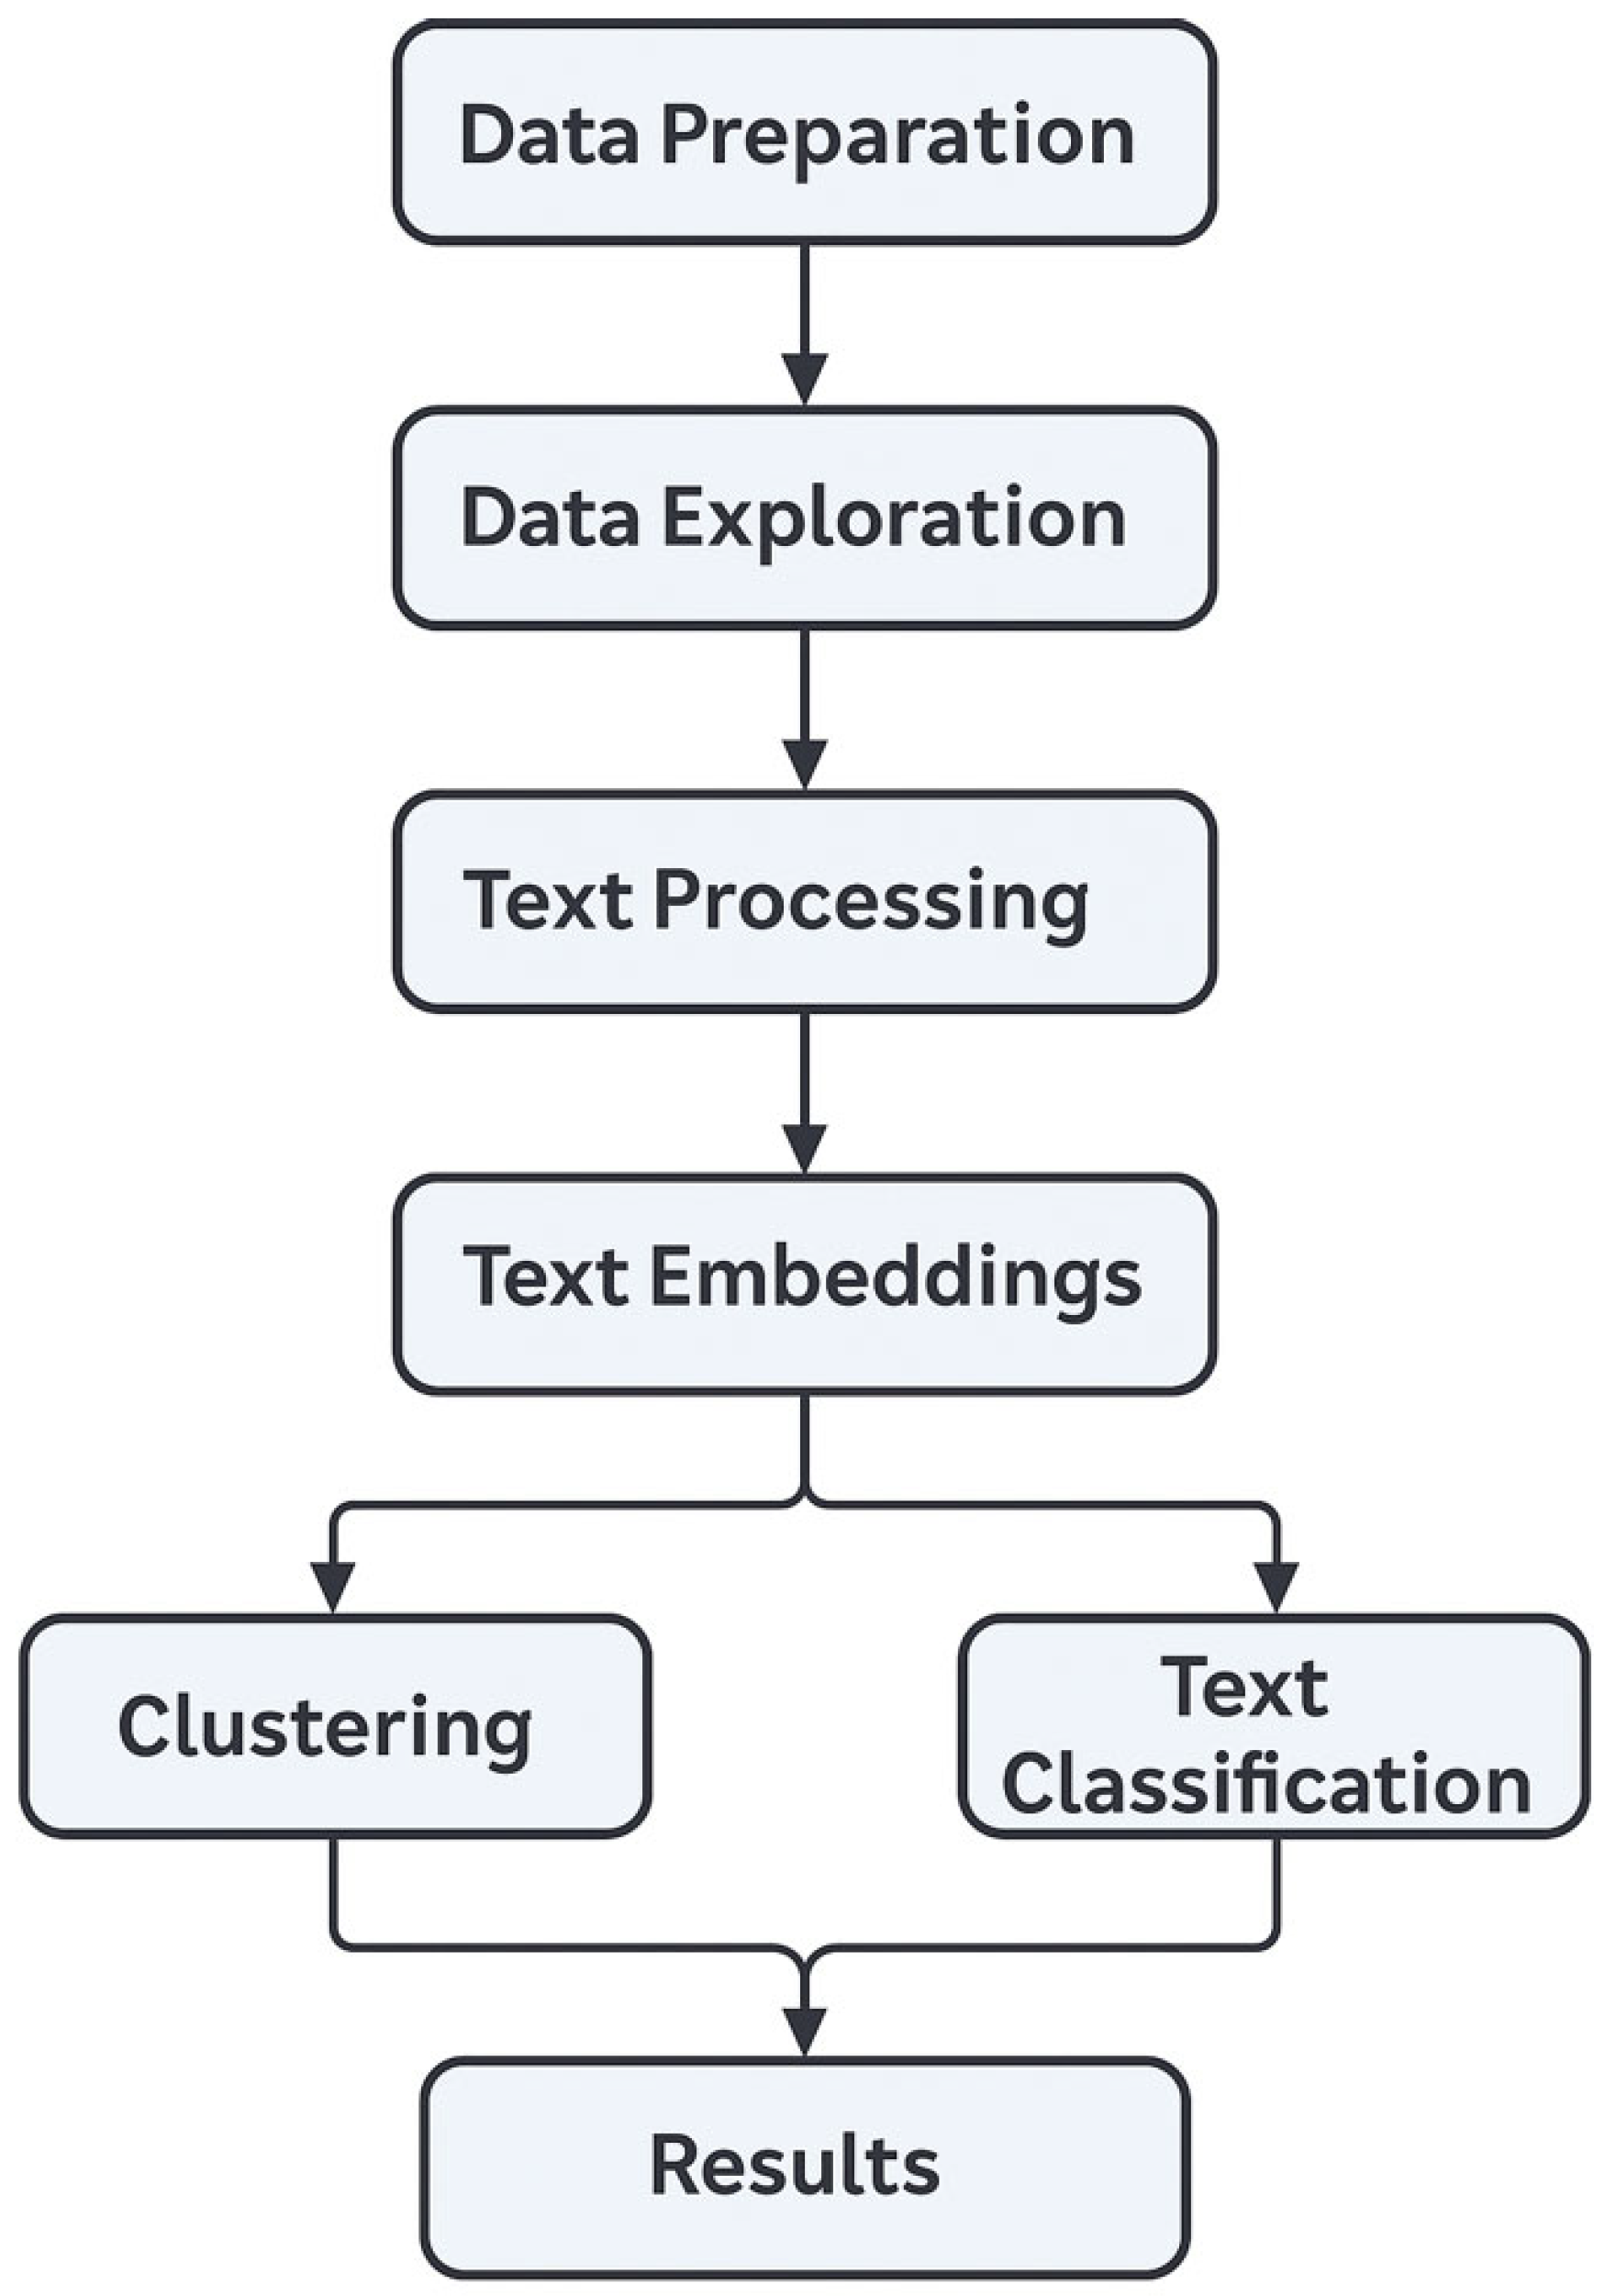
The diagram of
Figure 4 illustrates the main stages of the complaint analysis pipeline. After initial data preparation and exploration, the process involves text cleaning and processing, followed by the generation of text embeddings. These embeddings are then used in two parallel tasks: semantic clustering of complaints and supervised text classification, leading to the production of actionable results.
3.5. Evaluation
The evaluation phase comprehensively validated the proposed models using a reserved test set of complaints to assess their generalization and practical utility in a public sector context. This section outlines the methodologies employed to evaluate the Random Forest classifier, K-Means clustering with BERT-based embeddings, and Isolation Forest anomaly detection, emphasizing rigorous quantitative, qualitative, and operational assessment strategies.
For the classification task, the Random Forest model was evaluated using a suite of standard metrics: accuracy, precision, recall, F1-score, Matthews Correlation Coefficient (MCC), and ROC-AUC. Accuracy measured overall correctness across categories, while precision and recall assessed the model’s ability to correctly predict and identify instances of each class, respectively. The F1-score, as the harmonic mean of precision and recall, was prioritized to account for potential class imbalance. MCC provided a balanced measure robust to skewed distributions, and ROC-AUC evaluated class separability by analyzing the trade-off between true positive and false positive rates. Per-class metrics were computed to identify performance variations across complaint categories. A confusion matrix was constructed to visualize prediction distributions, enabling analysis of misclassification patterns, particularly for classes with linguistic overlap. To ensure robustness, five-fold cross-validation was conducted, splitting the dataset into training and validation subsets to assess performance stability. Hyperparameter sensitivity was tested by varying tree depth and number of estimators, ensuring optimal model configuration.
Model interpretability was evaluated using SHAP (SHapley Additive exPlanations) values to quantify the contribution of features to predictions. Both textual features (derived from TF-IDF vectorization of complaint descriptions) and structured features (e.g., equipment type, organizational unit, time of day) were analyzed. This approach identified which terms or contextual factors most influenced specific complaint categories, enhancing transparency and guiding operational refinements. IT support staff reviewed SHAP-derived insights to validate their alignment with real-world issue patterns.
Clustering performance was assessed by measuring how well complaints were grouped into semantically coherent categories. The silhouette score was used to evaluate intra-cluster cohesion and inter-cluster separation, with higher scores indicating well-defined clusters. To benchmark the BERT-based K-Means clustering, a baseline was established using TF-IDF vectorization combined with K-Means. The comparison focused on how effectively each method captured semantic relationships in complaint texts. Robustness was tested by experimenting with different numbers of clusters (k = 3–6) and alternative clustering algorithms (e.g., HDBSCAN, BERTopic). The Elbow method and silhouette analysis informed the optimal k value. Additionally, domain experts (IT professionals) qualitatively reviewed a sample of clustered complaints to assess alignment with operational issue taxonomies, providing feedback on cluster coherence and potential misgroupings due to domain-specific jargon.
To identify rare or emerging complaint types, an Isolation Forest algorithm was applied to the BERT-based embeddings after dimensionality reduction via principal component analysis (PCA). The goal was to identify rare or emerging complaint types as semantic outliers. Since labeled anomalies were unavailable, an unsupervised validation approach was adopted. Anomaly scores were analyzed alongside cluster assignments, silhouette coefficients, and distances to cluster centroids to quantify deviations from typical complaint patterns. Temporal and organizational characteristics of flagged complaints (e.g., reporting times, equipment types, department associations) were examined to contextualize anomalies. Robustness was assessed by testing different contamination rates to balance sensitivity and specificity. A subset of flagged anomalies was manually audited by domain experts to confirm their novelty or relevance, ensuring the method’s practical utility.
The operational impact was evaluated by integrating the models into the agency’s complaint management workflow and measuring efficiency gains. Key performance indicators included reductions in repeated complaint categories, time saved in classification and routing, and decreases in user-reported errors post-intervention. These metrics were tracked using helpdesk logs over a six-month period, with pre- and post-deployment comparisons to quantify improvements. User interface adjustments, informed by cluster and anomaly insights, were tested to assess their effect on complaint clarity and resolution rates. Feedback from support staff was collected to evaluate the system’s usability and alignment with operational needs.
3.6. Deployment
The deployment phase focused on embedding the developed AI framework into the operational context of public service support environments. This involved integrating the model outputs into existing helpdesk and monitoring systems to ensure that technical staff could easily access classification results and cluster patterns without disrupting existing workflows. The system was designed to trigger automated alerts whenever predictive signals indicated an increase in complaints associated with a specific cluster, allowing for proactive remediation and resource planning. To support broader adoption and usability, a web-based visualization dashboard was developed, enabling non-technical administrative staff to monitor complaint trends, identify recurring issues, and act on system recommendations in a user-friendly interface.
4. Results
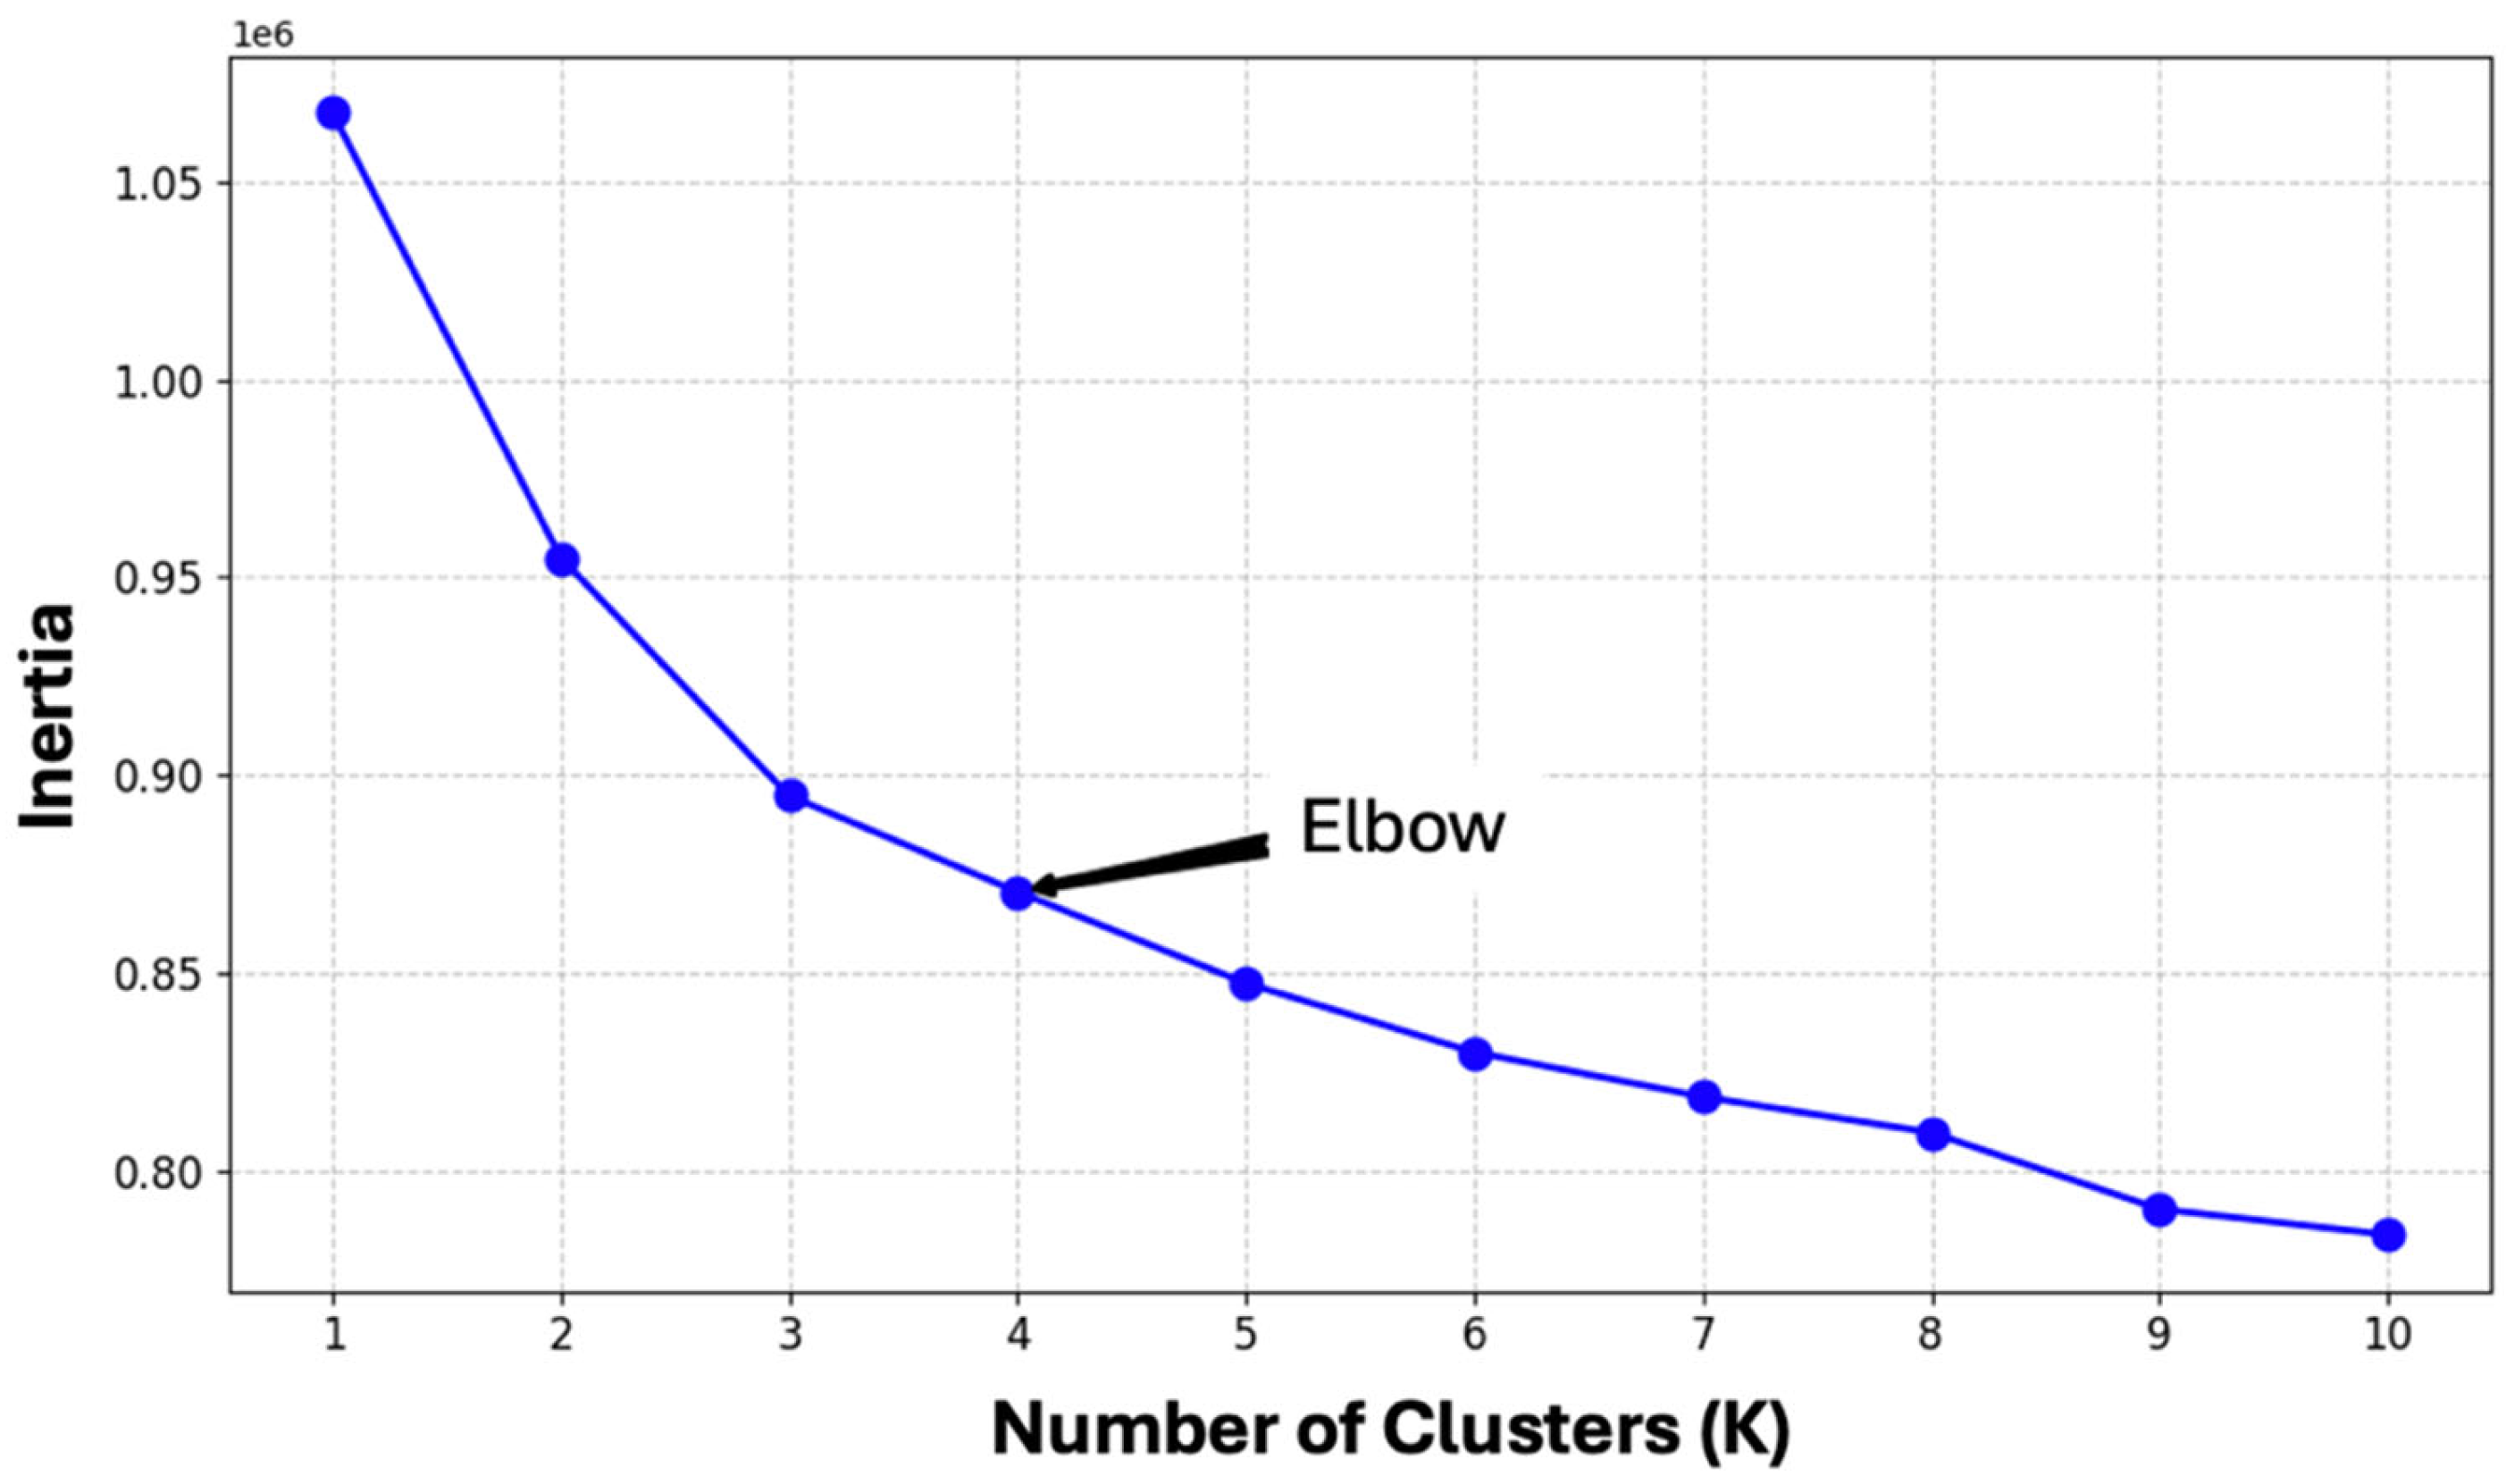
This section presents the results obtained from applying the proposed AI-driven framework to manage and classify informatics complaints within a public sector environment. The process begins by determining the optimal number of clusters to represent the diverse categories of complaints. Using the Elbow method, the inertia curve was analyzed (
Figure 5), and a clear inflection point was observed at four clusters. This indicates that four clusters provide a suitable balance between capturing the complexity of the data and maintaining model interpretability, avoiding overfitting.
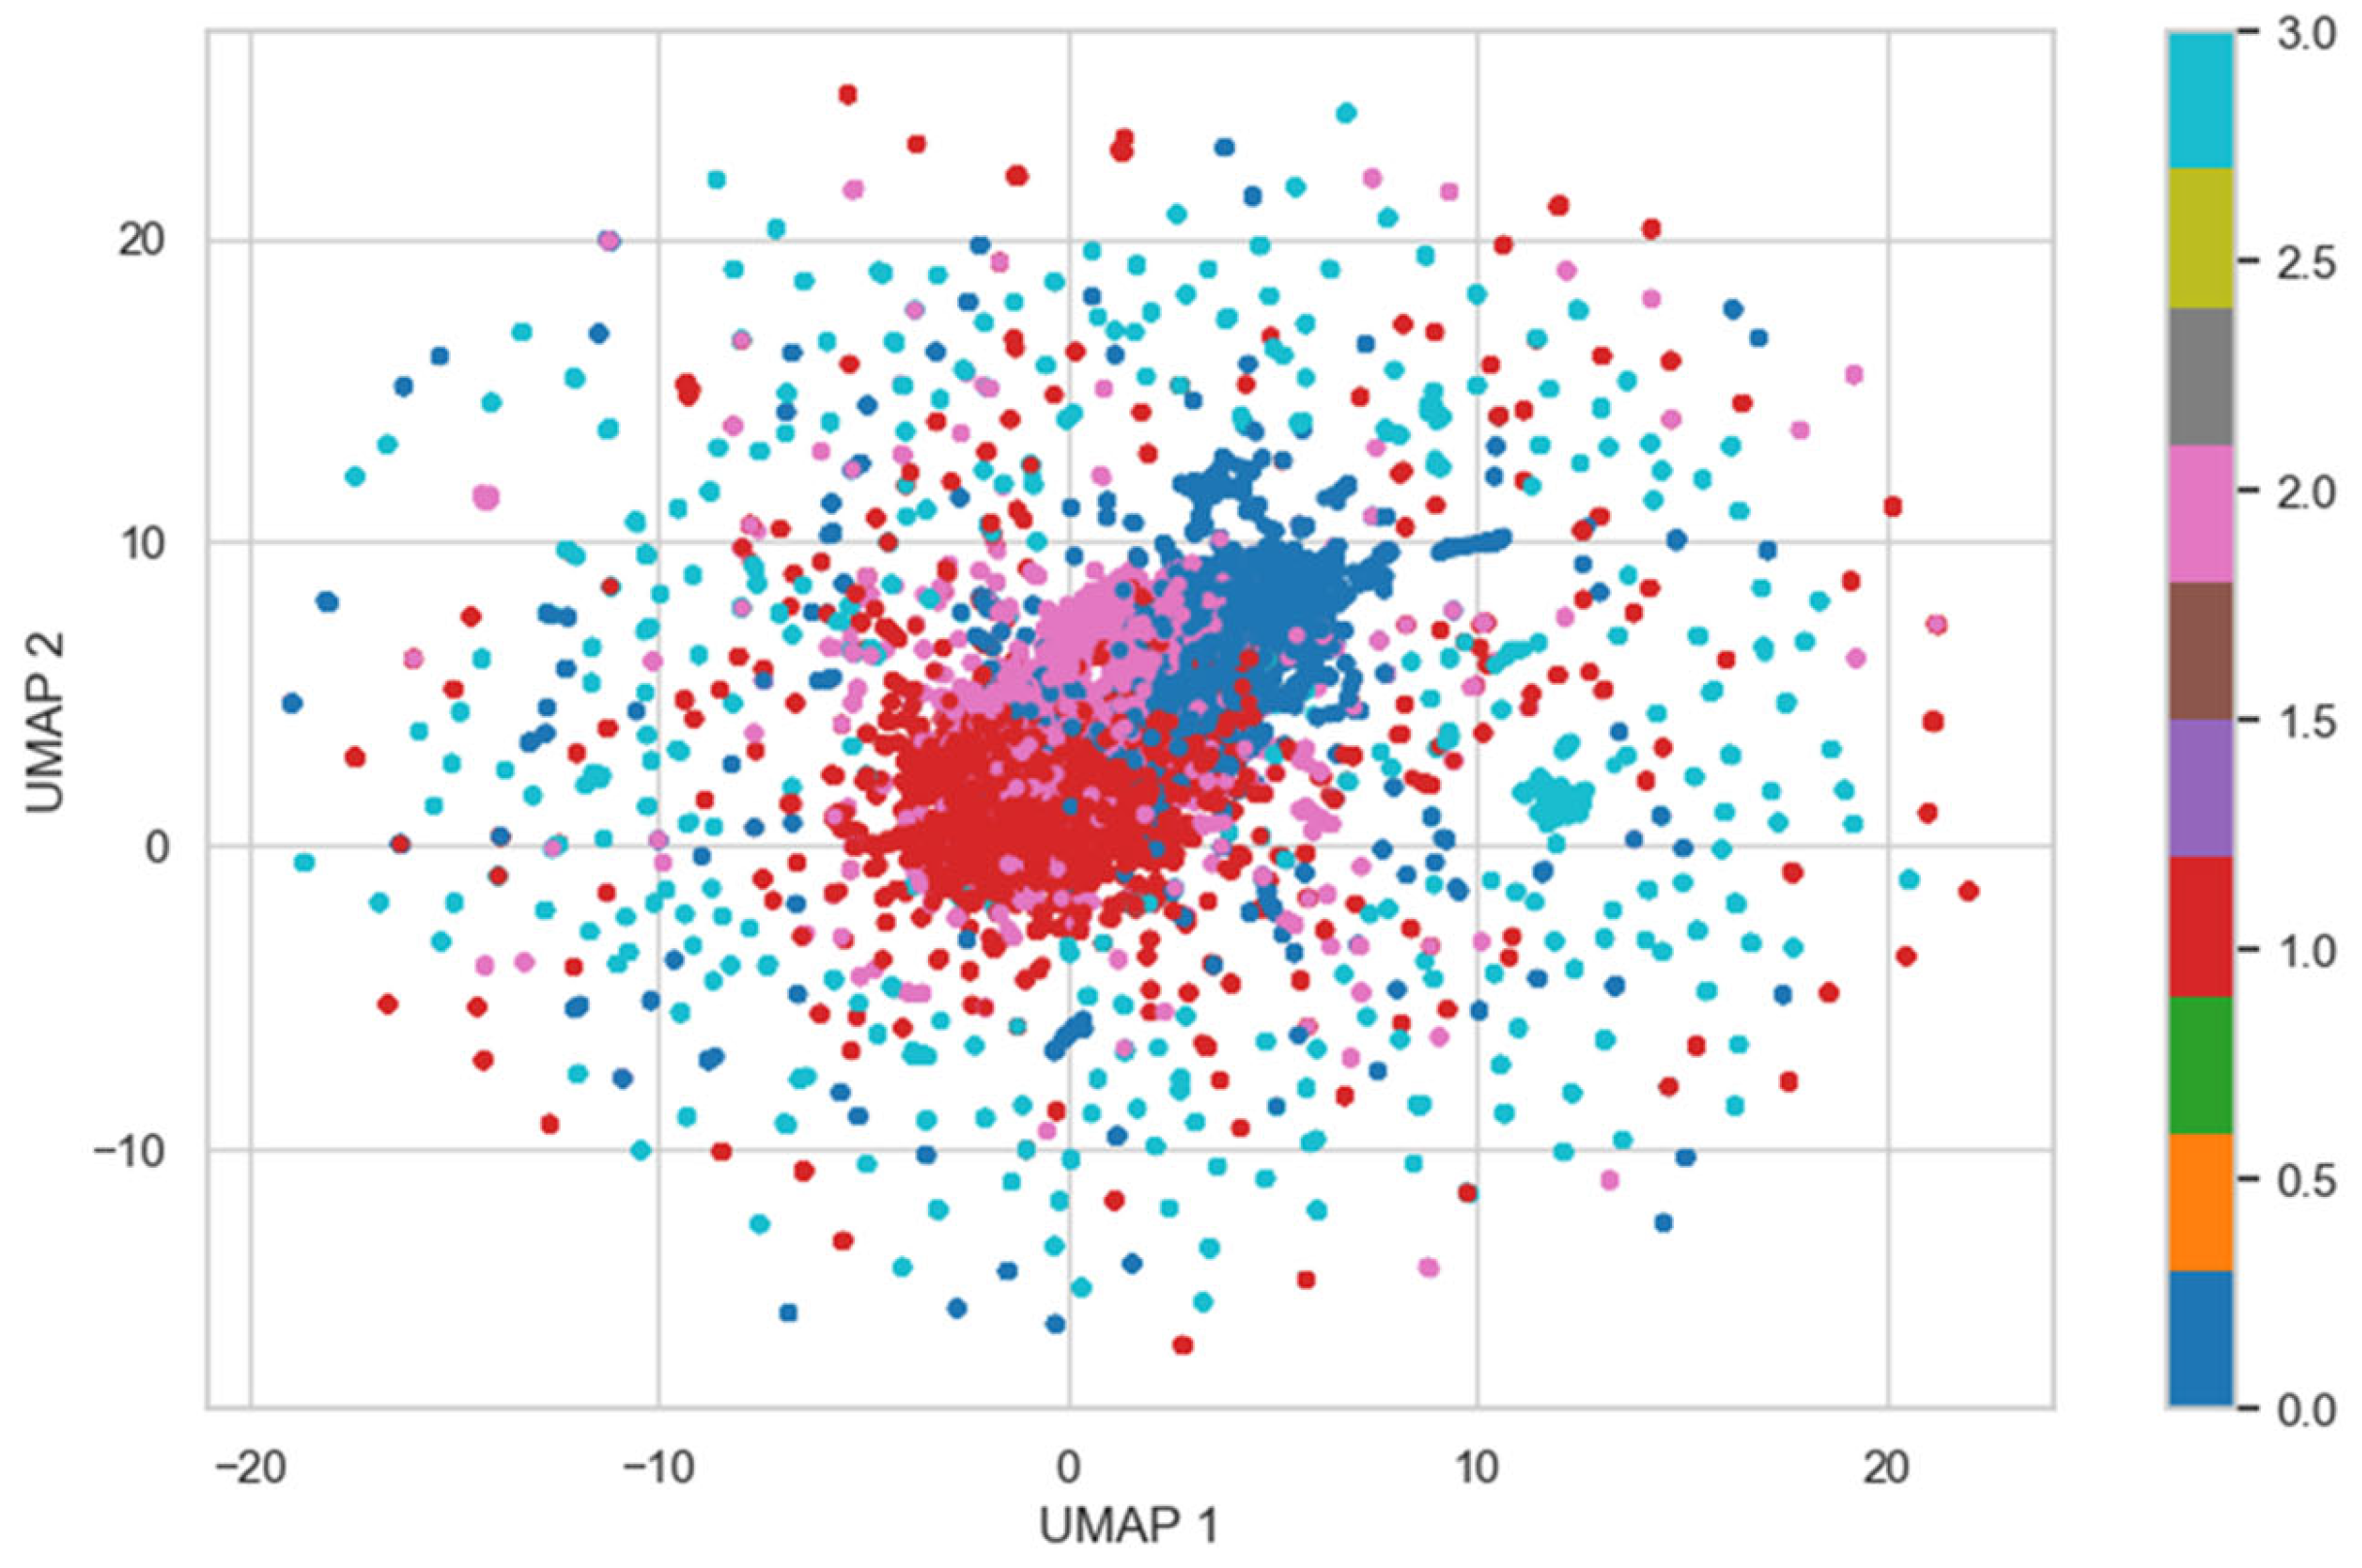
Subsequently, BERT-based sentence embeddings were generated from the cleaned textual descriptions of complaints. These embeddings were clustered using the K-Means algorithm, and a two-dimensional UMAP projection was employed to visualize the clustering outcome (
Figure 6). The UMAP projection shows a visible separation between groups, with some degree of overlap, which is expected given the semantic similarities among certain complaint types. Nonetheless, the overall distribution suggests that the model effectively captures underlying patterns and organizes complaints into coherent operational categories.
To assess the robustness of the clustering structure beyond the spherical cluster assumption inherent to K-Means, two additional models were tested: HDBSCAN (a density-based clustering method) and BERTopic (a transformer-based topic modeling framework combining class-based TF-IDF with dimensionality reduction). Both approaches were evaluated using silhouette score and qualitative inspection of cluster coherence.
HDBSCAN yielded fewer, broader clusters with lower silhouette scores (mean = 0.29) compared to K-Means (mean = 0.47), suggesting that the density-based approach was less effective in this context, likely due to uneven density in the embedded space. BERTopic, on the other hand, produced interpretable topic groups but exhibited instability across runs and fragmented semantically similar complaints across multiple topics. While BERTopic was informative for exploratory analysis, its performance in producing operationally actionable clusters was inferior to K-Means, especially when integrated with the dashboard tooling.
Given these comparative findings, K-Means was retained for the main clustering pipeline due to its superior quantitative cohesion and alignment with the helpdesk’s operational taxonomy.
Based on the results, the following 4 clusters emerge, see
Table 2.
Table 2, presents the four main complaint categories resulting from BERT-based semantic clustering, along with their operational descriptions and representative examples. Each cluster captures a distinct class of issues reported by users, ranging from startup errors and system performance problems to peripheral hardware failures and equipment management needs.
Table 3 presents the resulting cluster labels alongside the top 10 most salient keywords per group, offering a semantic summary of the primary issues reported. This labeling process supports downstream tasks such as monitoring issue trends and designing targeted interventions.
Building on the clustering results, the framework incorporates a supervised classification model to predict the cluster label of new incoming complaints, enabling automated categorization and real-time decision-making.
To automate the semantic categorization of new complaints, a supervised classifier was trained using a Random Forest, SVM, support vector machine (SVM), and XGBoost. The dataset was split 70/30 using stratified sampling, yielding 8990 records for training and 3853 for testing. To address the class imbalance, the classifier employed automatic class weighting.
To empirically justify the selection of the Random Forest classifier, we conducted a comparative performance evaluation against two widely used alternatives: support vector machine (SVM) and XGBoost. All models were trained on the same stratified dataset and evaluated using macro-averaged metrics across the four predefined complaint categories. As shown in
Table 4, Random Forest achieved the highest scores in accuracy (0.83), precision (0.81), and F1-score (0.80), along with the best Matthews correlation coefficient (MCC) of 0.71. These results confirm that Random Forest provides a balanced and interpretable performance suitable for deployment in public sector environments. While XGBoost and SVM delivered competitive results, their slightly lower scores and increased computational complexity made them less optimal for the real-time, resource-constrained context of this application.
Performance was evaluated using precision, recall, F1-score, AUC, and Matthews correlation coefficient (MCC).
Table 5 summarizes the per-class results:
The overall MCC was 0.71. The ROC-AUC was consistently high across classes, with particularly strong separability for software-related complaints (Cluster 1). Misclassifications were most frequent between Cluster 2 and Cluster 3, reflecting the operational overlap between peripheral issues and equipment requests.
Building on these results, the classification model was integrated into the operational workflow to enable automated and real-time categorization of new complaints. This integration supports proactive triage by immediately assigning incoming tickets to their most likely semantic cluster, facilitating prioritization and routing. Additionally, the model’s predictions feed into a suite of analytical dashboards, allowing support teams to monitor evolving patterns, identify emerging issues, and adjust resource allocation accordingly. This tight coupling between predictive modeling and operational tooling ensures that the insights generated are actionable and continuously updated as new data arrives.
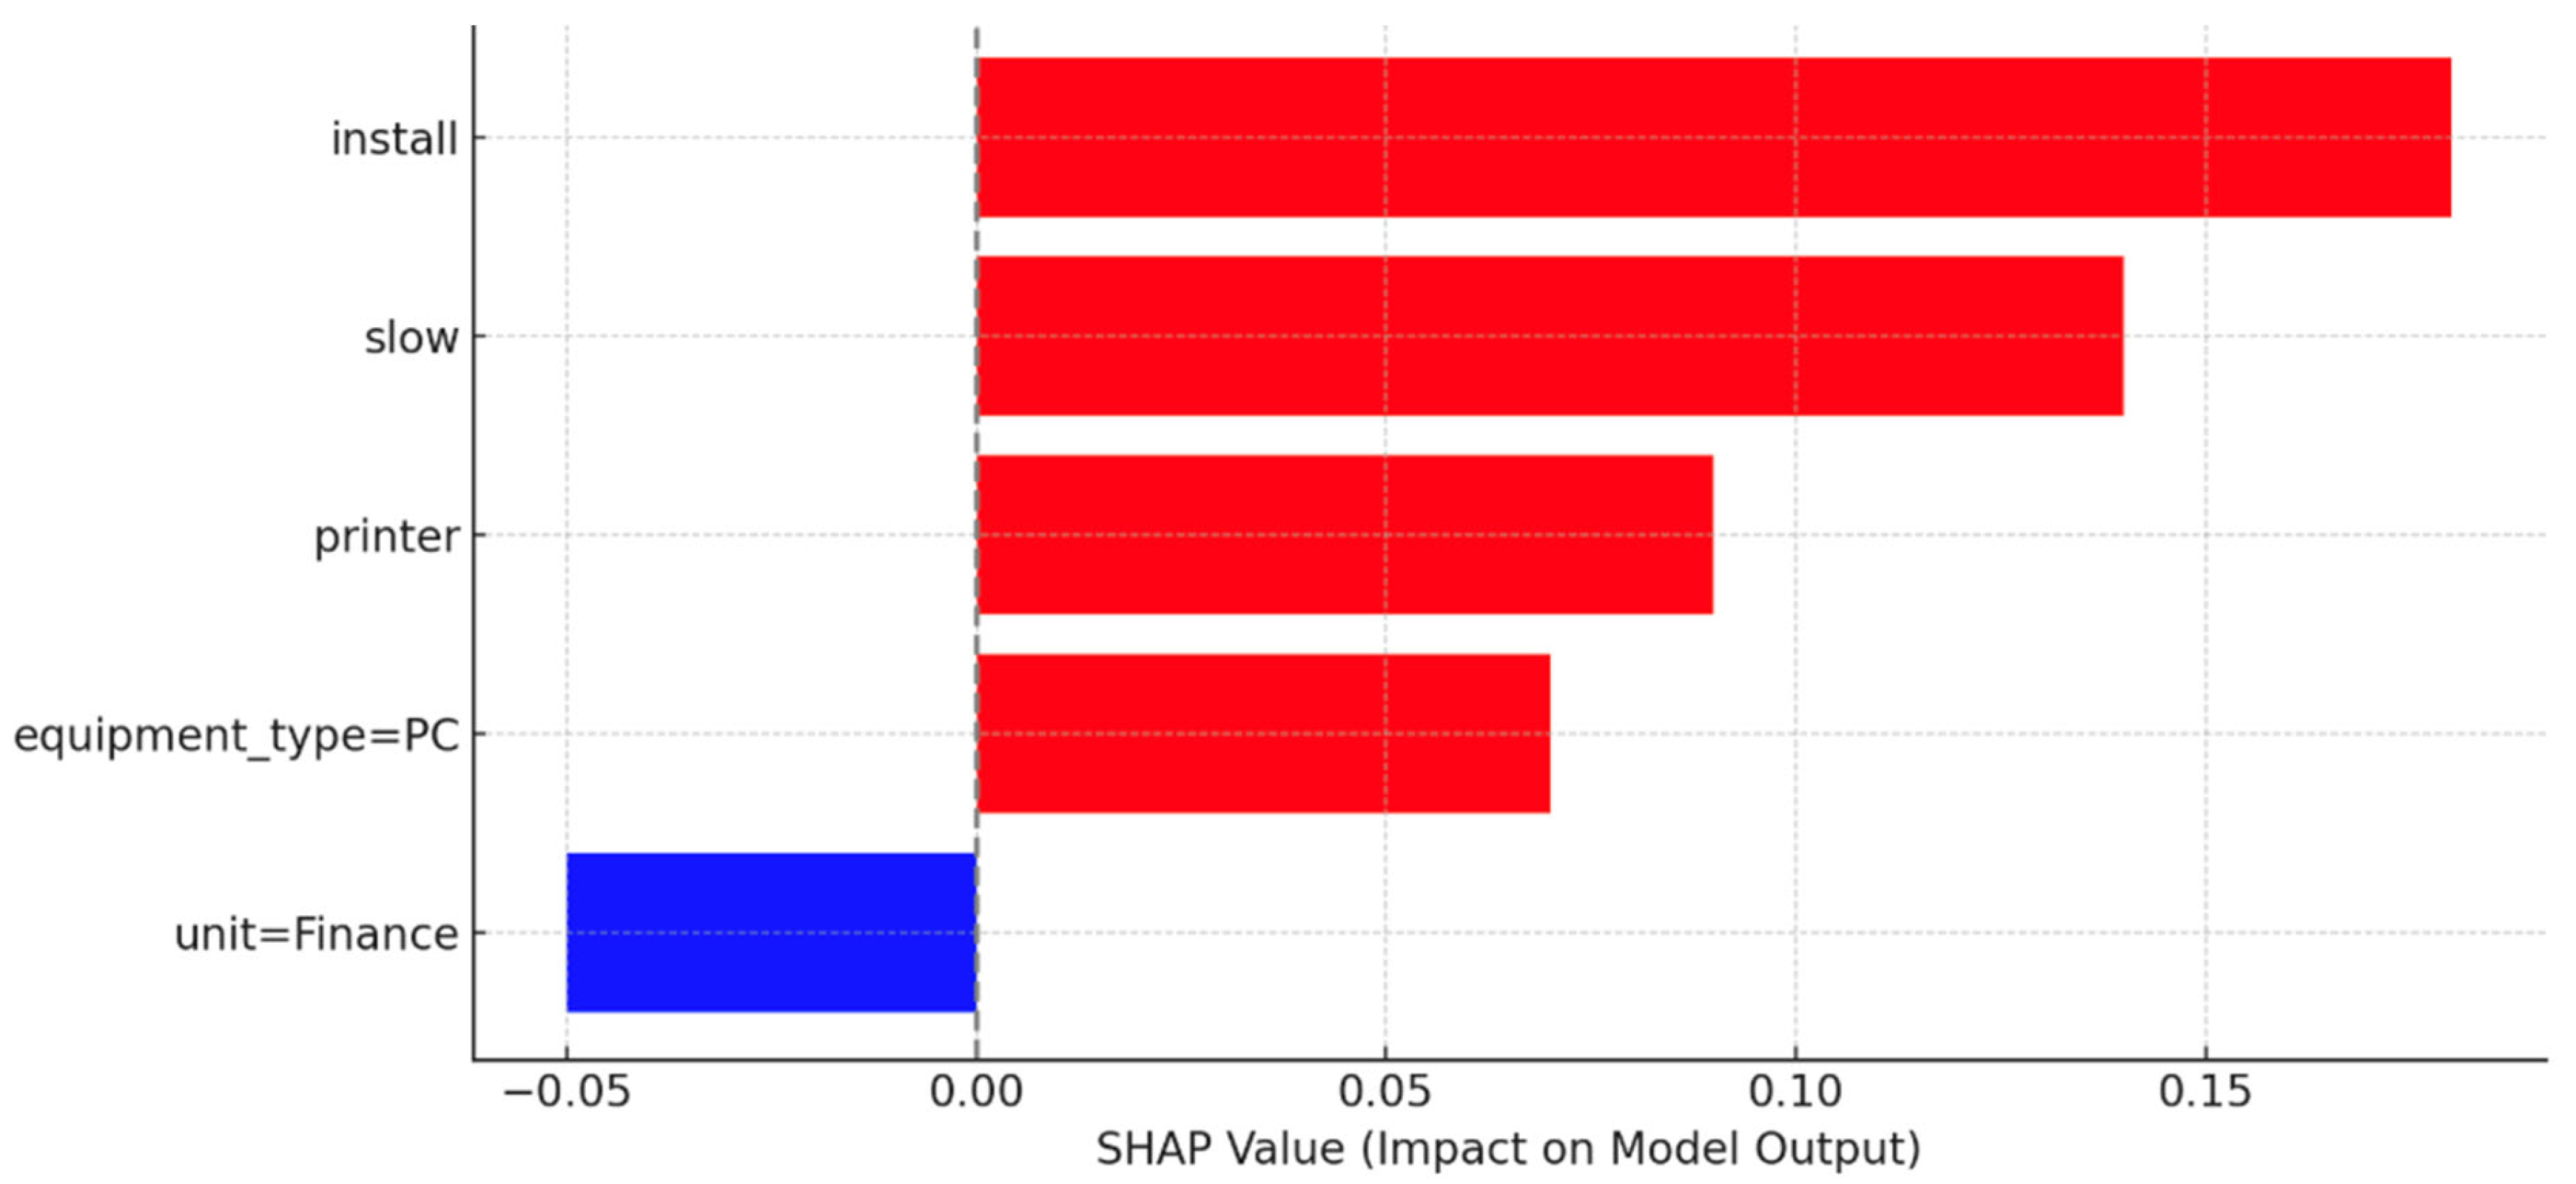
To enhance model interpretability, SHAP (SHapley Additive exPlanations) values were computed for representative classification outputs. The SHAP analysis quantifies the impact of each input feature—whether structured or textual—on the final prediction made by the Random Forest classifier.
Figure 7 illustrates the most influential features, highlighting the words “
install”, “
slow” and “
printer” as the top positive contributors to the model’s prediction, while the “
unit=Finance” feature had a negative impact.
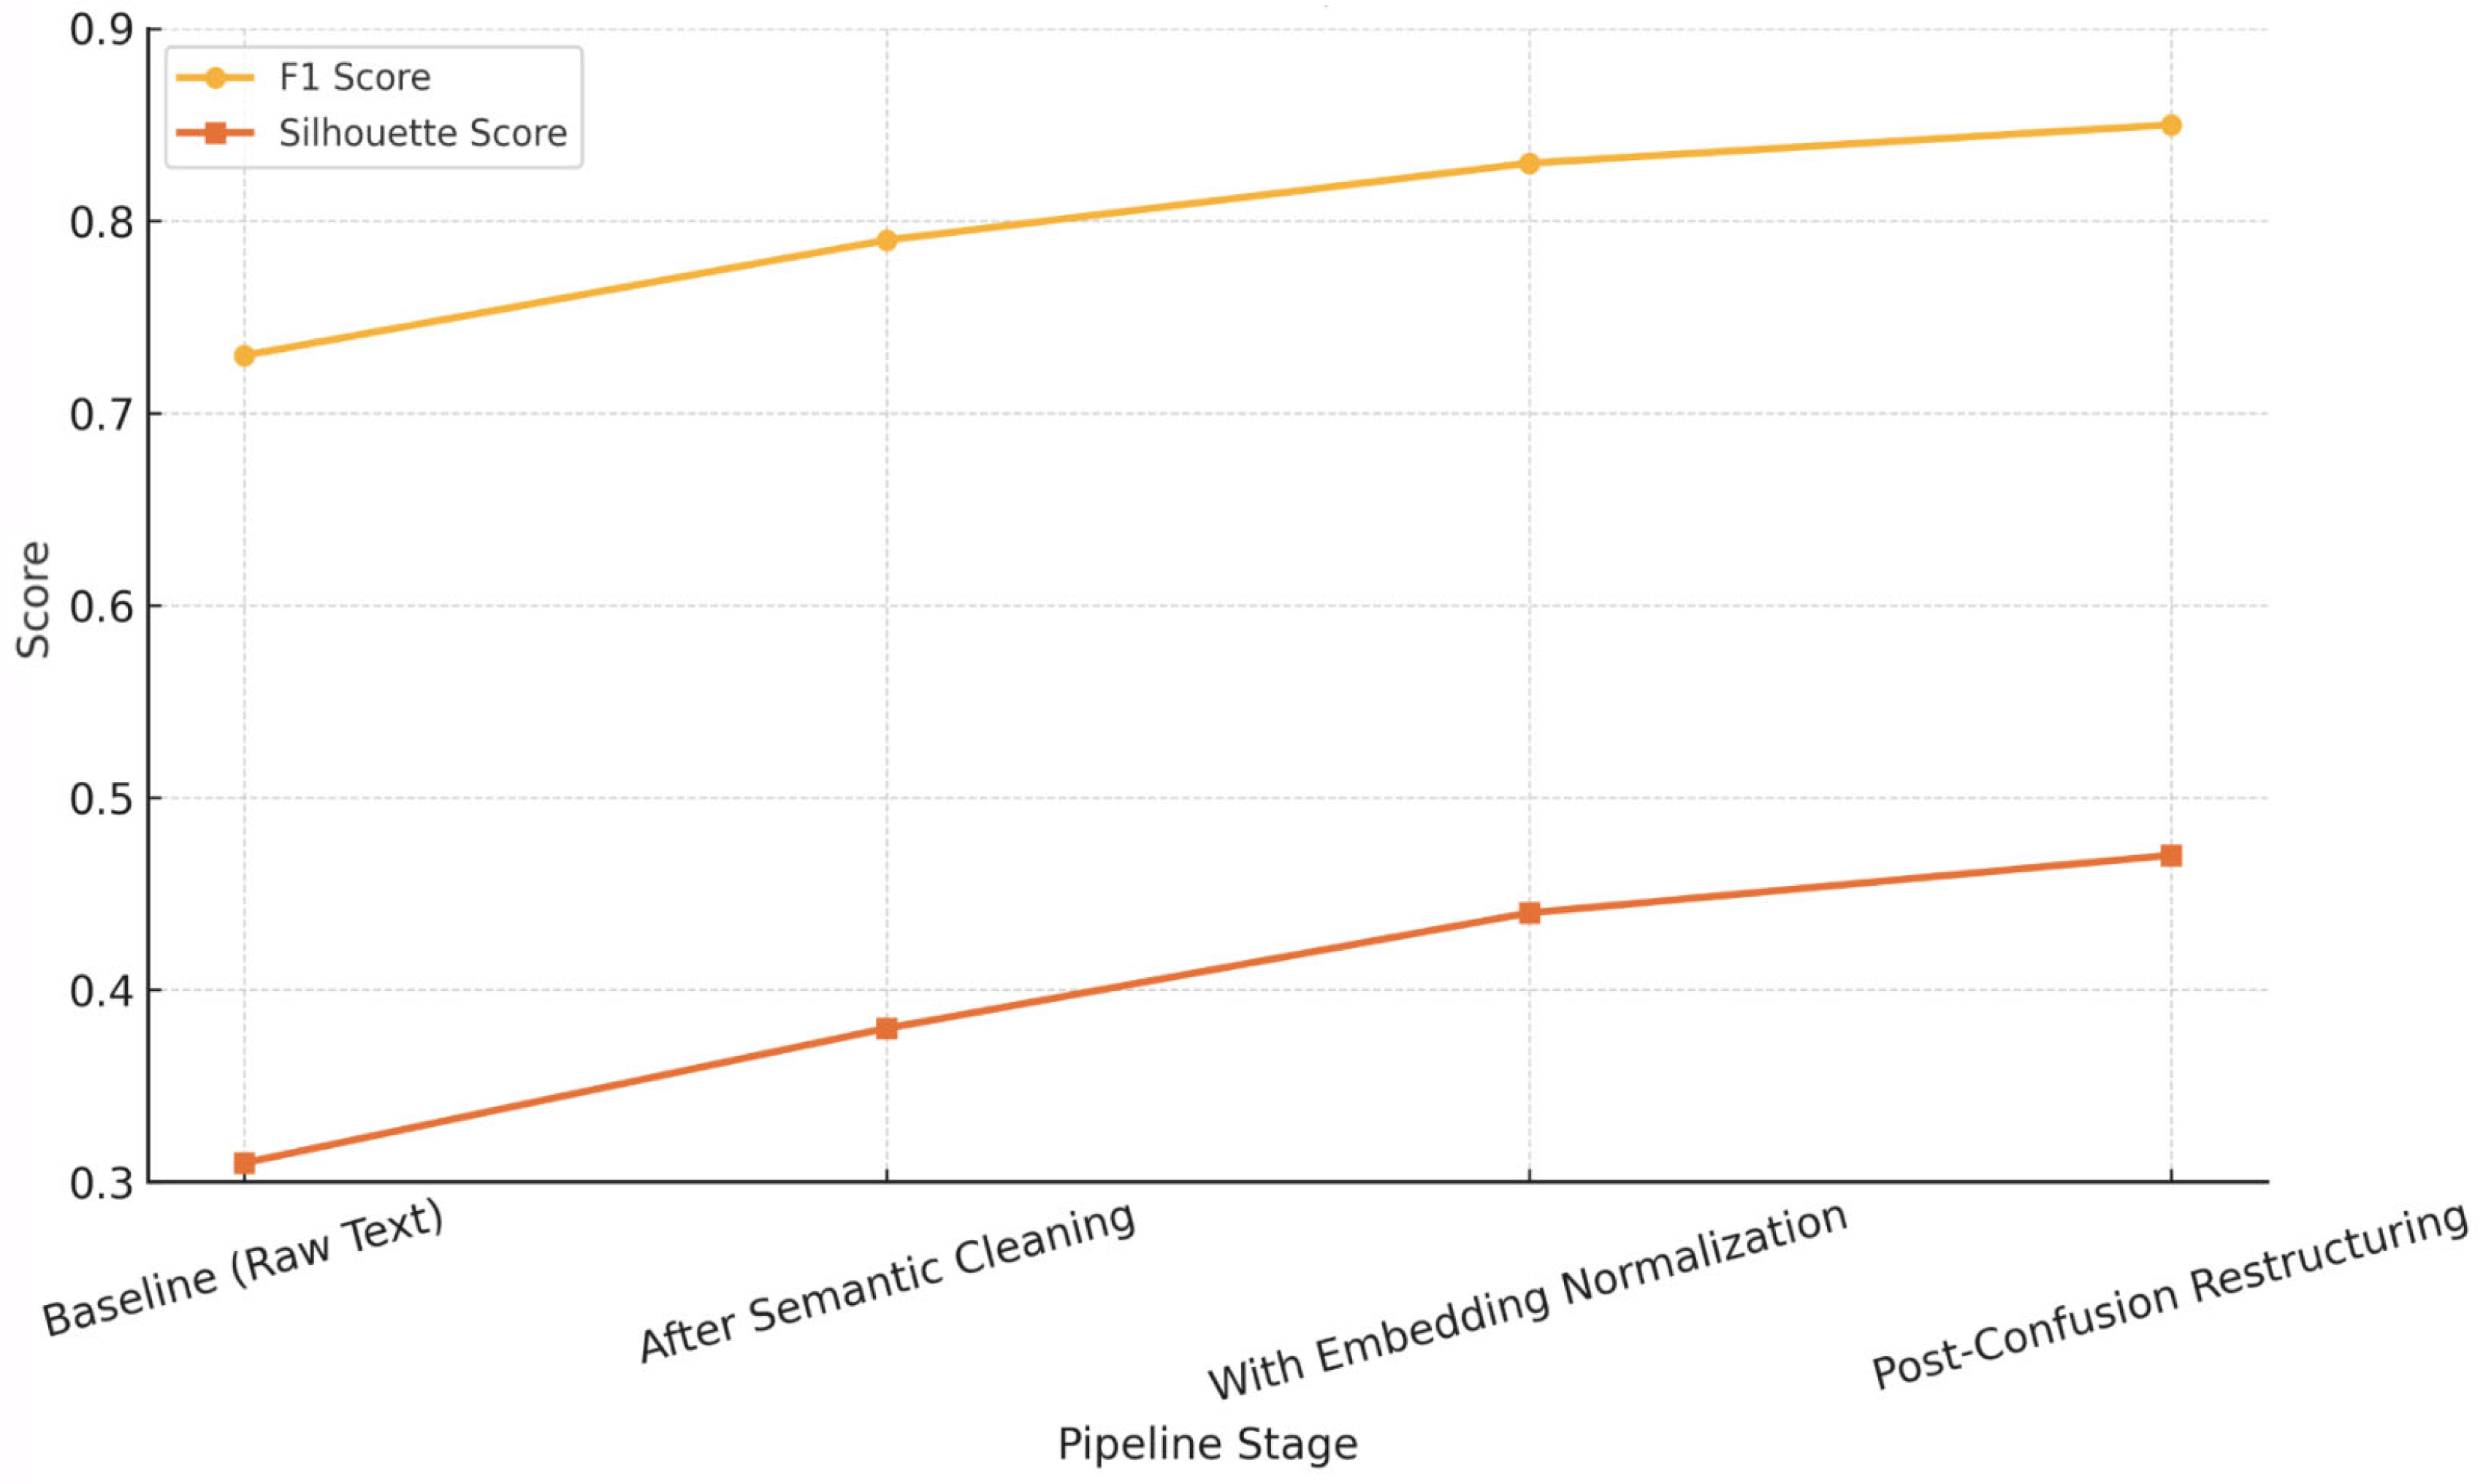
The CRISP-DM methodology was not used merely as a static structure, but as an iterative workflow where findings from each phase informed and refined subsequent steps. As shown in
Figure 8, iterative refinement across stages—starting from raw text to post-confusion restructuring—resulted in steady gains in both classification (F1 Score) and clustering quality (silhouette score). Each improvement cycle reflected a re-evaluation of earlier decisions, such as redefining entity normalization rules after error pattern analysis, or adjusting vector representations based on misclassification trends.
To support monitoring and operational integration, a set of dashboards was developed.
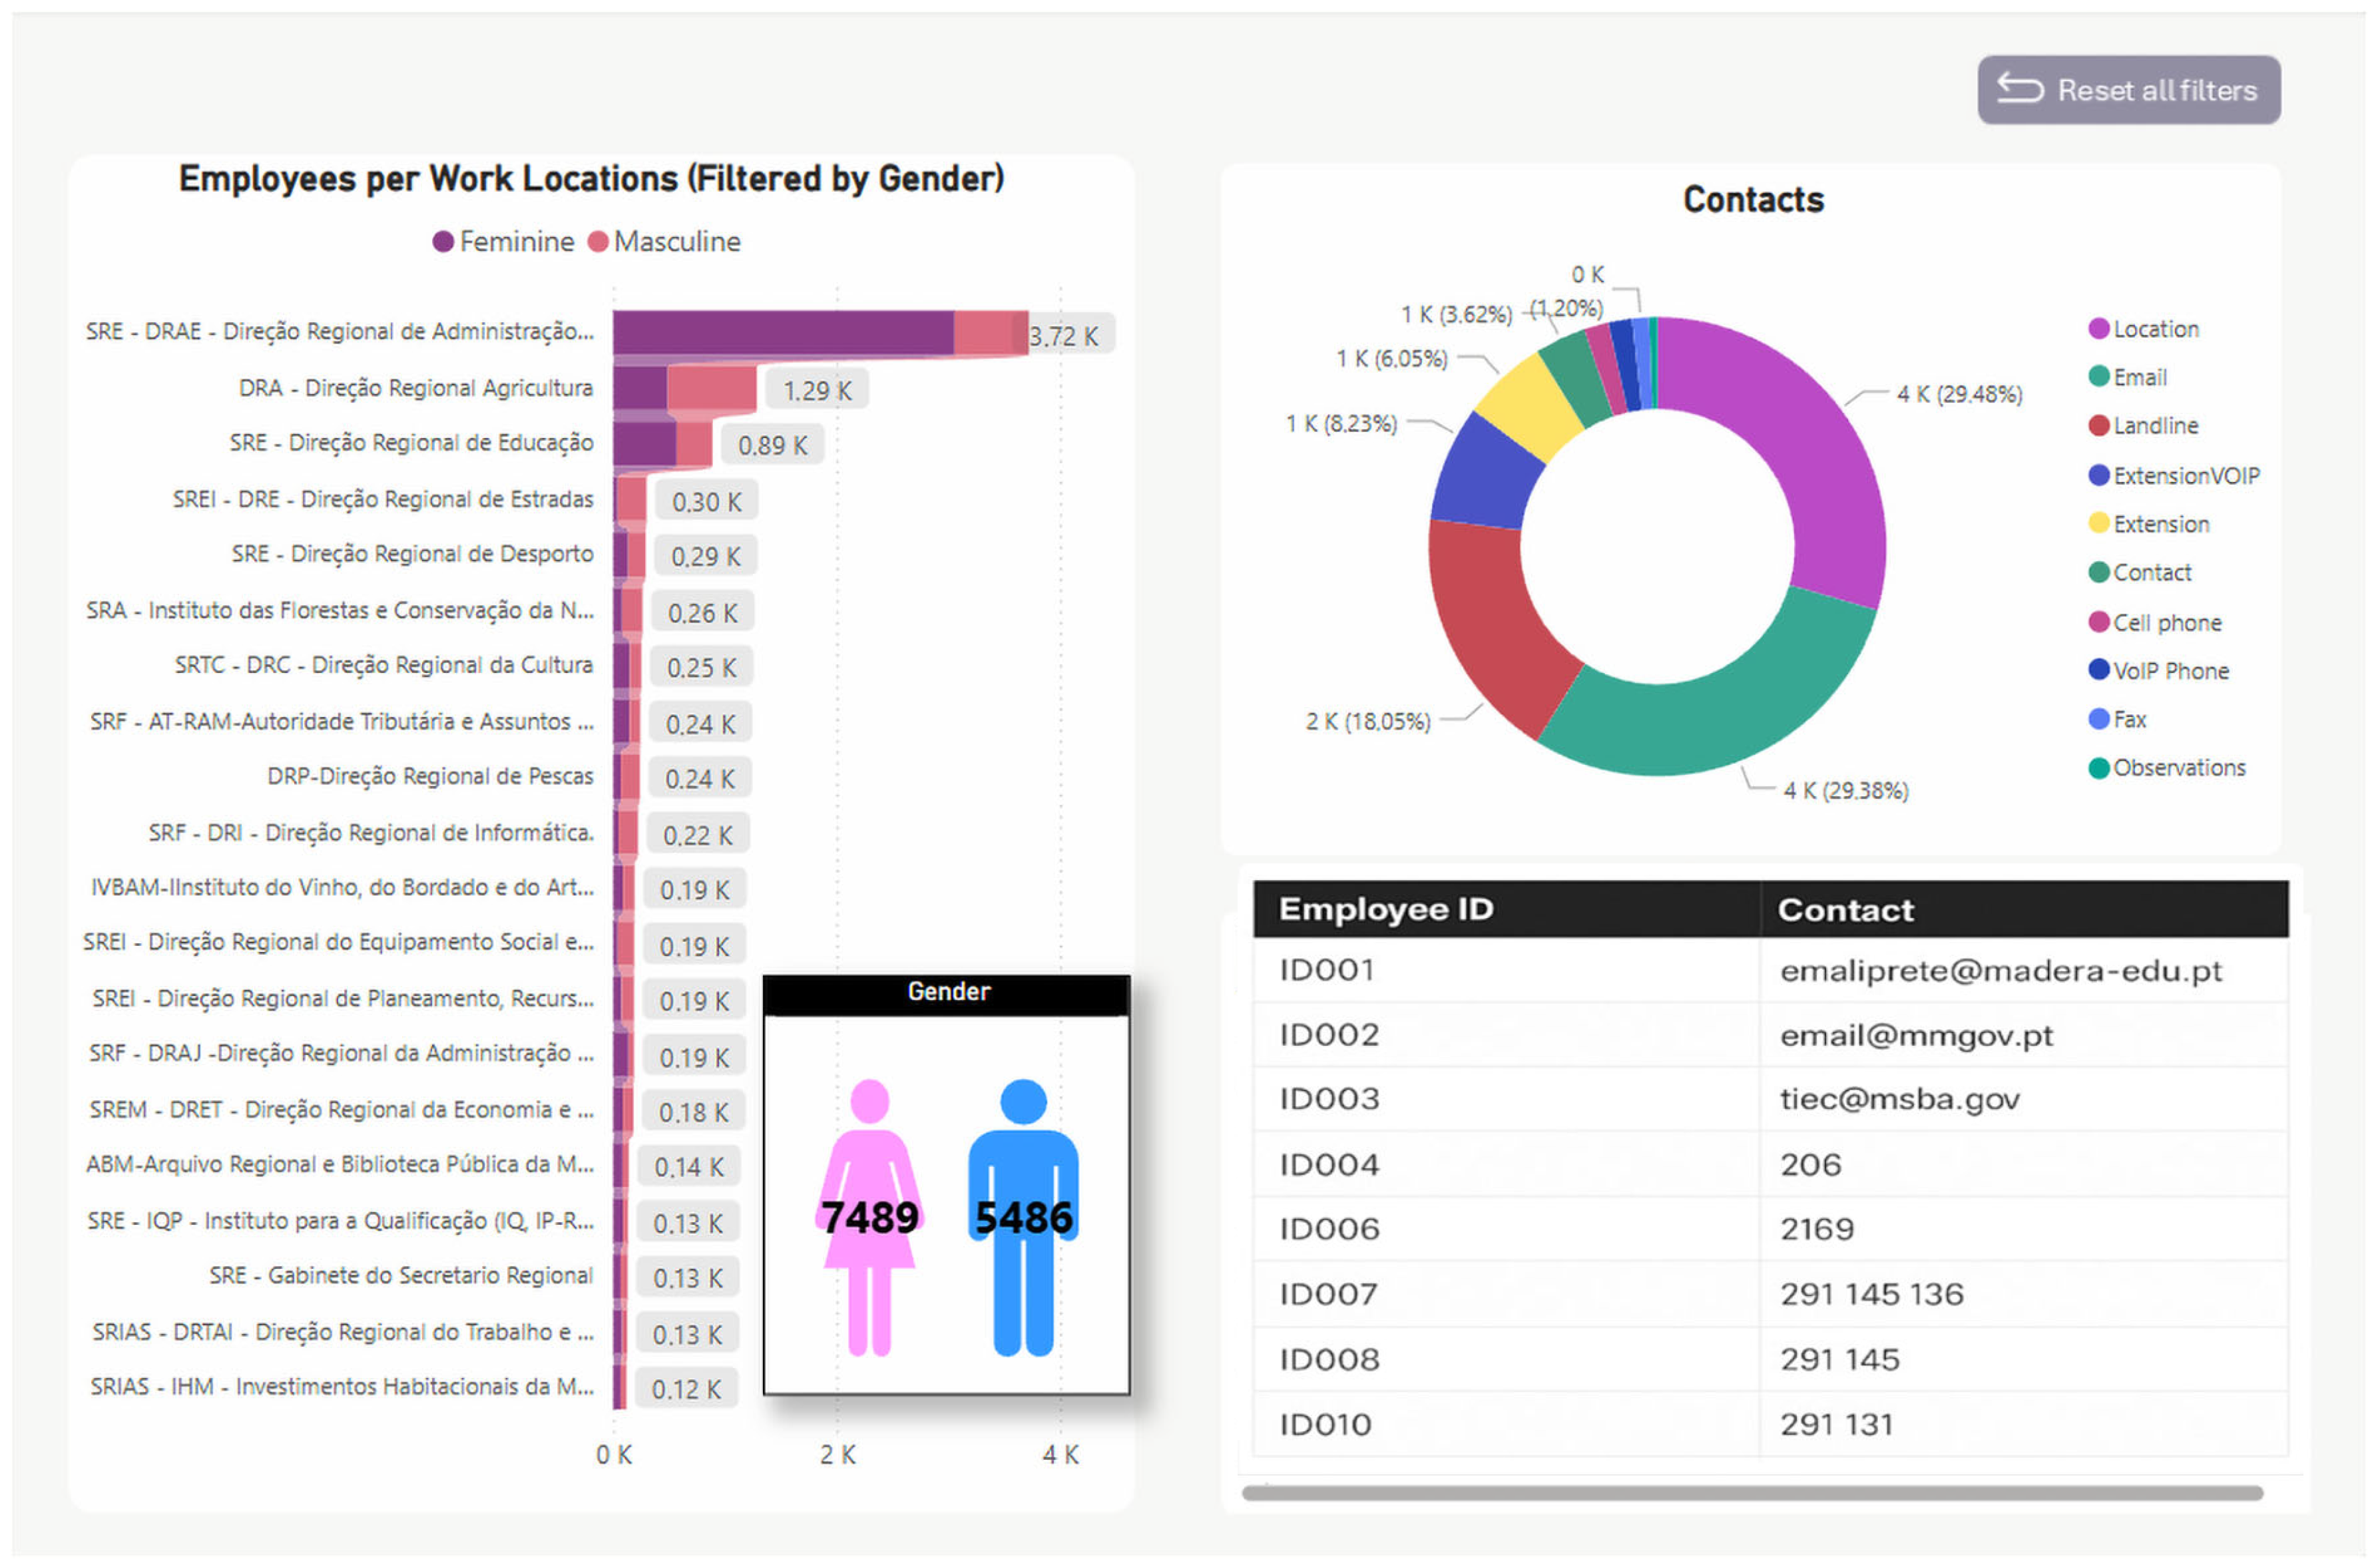
Appendix A presents the equipment inventory landscape, helping contextualize potential sources of technical issues.
Appendix B highlights the distribution of personnel and contact structures, which is essential for understanding user demographics and support routing.
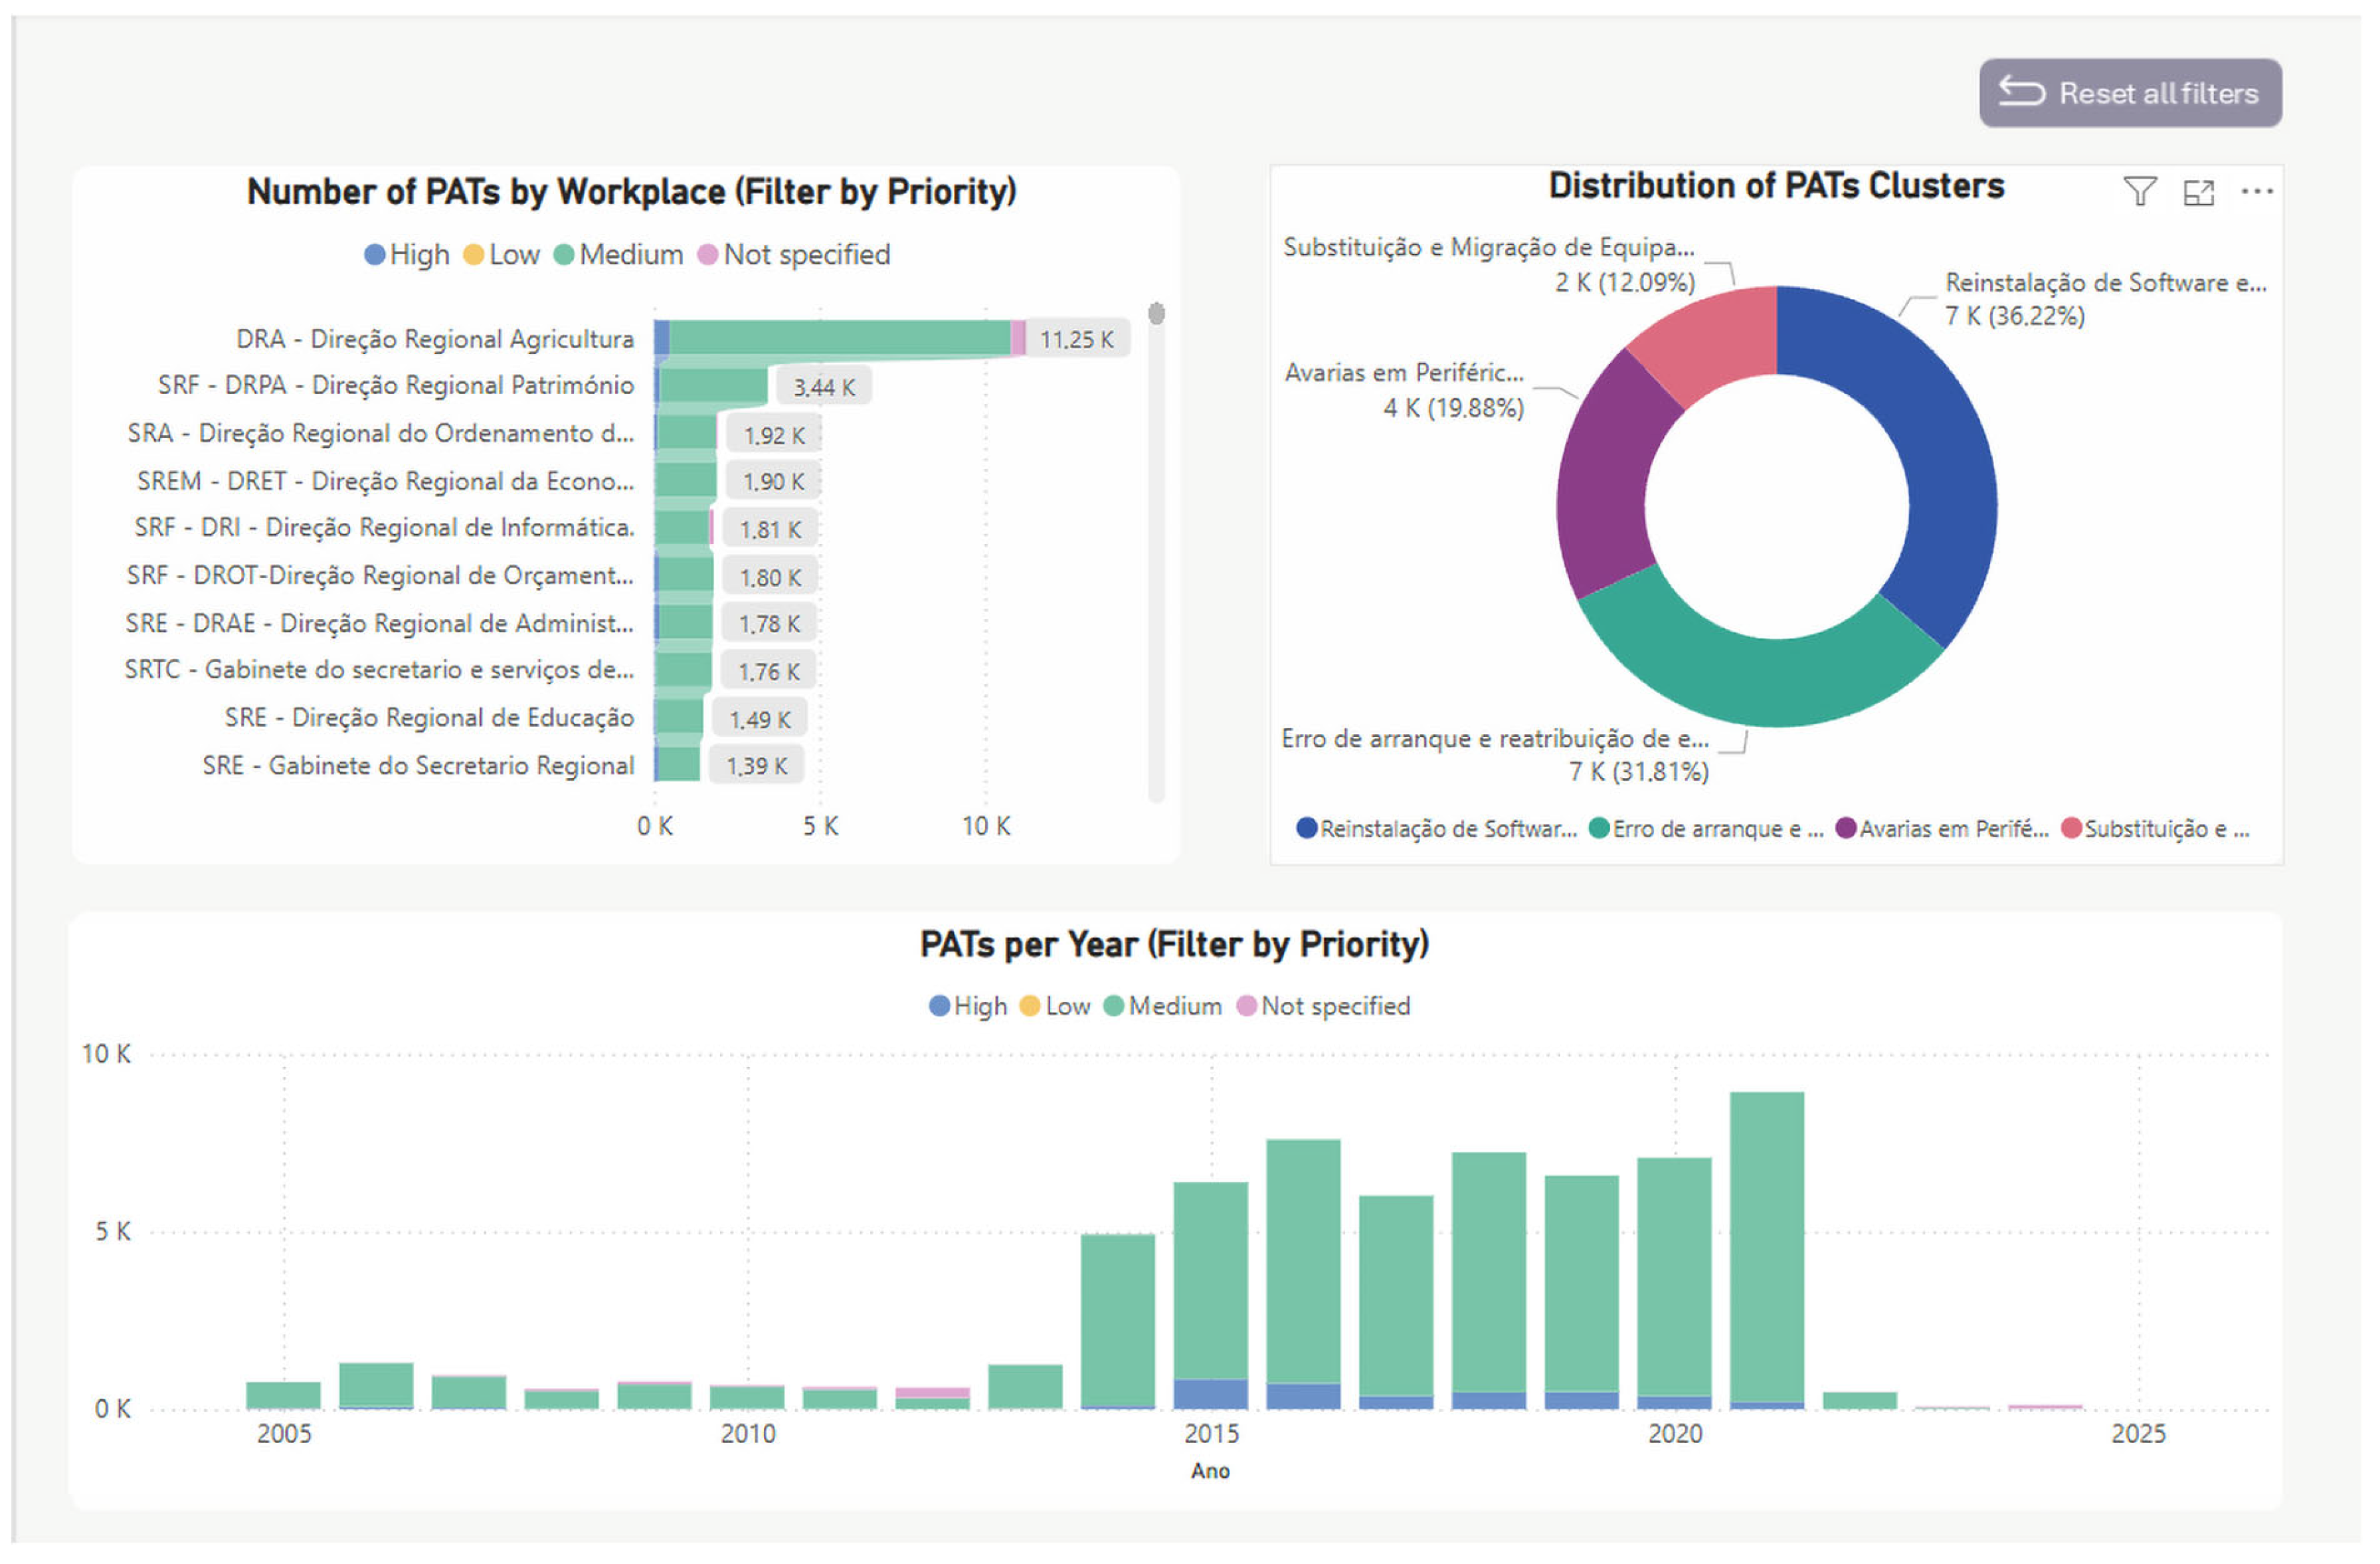
Appendix C details the distribution and temporal trends of technical assistance requests (PATs), including their classification into semantic clusters and priority levels, providing actionable insights for proactive resource allocation and service improvement.
The set of dashboards presented in the
Appendix A,
Appendix B and
Appendix C offers a multidimensional analysis of informatics infrastructure, workforce distribution, and technical assistance trends within the public sector.
Appendix A reveals a substantial concentration of generic equipment (38,311 units), yet computers (10,751 units) and printers (1345 units) represent critical assets for daily operations. The equipment status breakdown highlights that a large portion of assets are either new or actively in use, though a non-negligible share remains decommissioned or not repairable, suggesting potential bottlenecks in lifecycle management.
Appendix B shifts focus to the human dimension, showing a predominantly female workforce and emphasizing the need for gender-aware support strategies. It also outlines communication channels, with email and location data as the dominant contact types, reinforcing the importance of centralized and updated staff directories.
Appendix C delves into complaint management via PAT records, showing that medium-priority requests dominate, particularly from large units such as DRA and DRPA. The cluster analysis identifies key issue types—especially software reinstallation (36.22%) and startup/equipment reassignment (31.81%)—while the temporal distribution highlights a sharp increase in PATs after 2015, followed by a recent decline. Collectively, these dashboards provide a holistic view of operational demands and areas for optimization in technical support and digital asset management.
In addition to evaluating classification and clustering performance, we examined the downstream impact of the dashboard deployment on operational outcomes. Notably, a 27% reduction in repeated complaint categories was observed in the six months following deployment. To investigate whether this reduction could be causally attributed to the intervention rather than to temporal variation or exogenous factors, an interrupted time series (ITS) analysis was conducted. Complaint frequency per category was aggregated weekly over a 12-month window, with the dashboard introduction defined as the intervention point. A segmented regression model was applied to detect changes in level and slope, accounting for autocorrelation and seasonality. The analysis revealed a statistically significant level change (p < 0.01) and a negative post-intervention trend (p < 0.05), supporting the hypothesis that the observed reduction is associated with system deployment rather than coincidental fluctuations. This strengthens the causal interpretation of the intervention’s effectiveness in reducing redundant complaints by improving feedback clarity and issue resolution efficiency.
To further substantiate the impact of the dashboard deployment, we conducted an interrupted time-series (ITS) analysis to evaluate whether the observed reduction in repeated complaints could be causally linked to the intervention. Weekly counts of semantically repeated issues were aggregated over a three-year period, with the dashboard rollout in early 2023 serving as the intervention point. As shown in
Figure 9, the ITS model identified a statistically significant level shift following deployment, along with a continued decline in the post-intervention slope. The red trend line represents the segmented regression fit, with shaded 95% confidence intervals. The immediate post-deployment drop, combined with the sustained downward trajectory, supports the hypothesis that the dashboard contributed to the reduction in redundant complaints, rather than the effect being merely a product of natural fluctuation or seasonal cycles.
To assess the real-time feasibility of the system, we benchmarked the full inference pipeline consisting of sentence embedding generation, semantic clustering, and supervised classification. On a standard CPU machine, the sentence embedding step using a lightweight transformer (MiniLM-L6-v2) required approximately 0.18 s. The K-Means clustering prediction added an additional 0.01 s, and the Random Forest classification took 0.02 s. The total end-to-end latency for processing a single complaint was approximately 0.21 s, supporting the framework’s deployment in interactive, user-facing scenarios.
5. Discussion
The application of AI-driven analytics to user interaction logs yielded meaningful insights into the patterns underlying informatics complaints in the public sector. The semantic clustering of free-text error descriptions revealed strong alignment with known sources of user frustration—such as ambiguous error messages, inconsistent data formats, and system bottlenecks during peak usage periods. Notably, the use of sentence embeddings allowed the model to group complaints that were lexically dissimilar but semantically equivalent, demonstrating the value of text mining in surfacing latent problem structures often overlooked by traditional keyword-based methods.
From an operational perspective, the implementation of the AI framework resulted in a measurable reduction in complaint volume by enabling early detection and preemptive mitigation of recurring errors. Automated classification of import errors and predictive alerts for high-risk submissions accelerated issue resolution, significantly easing the burden on support teams. Moreover, visual dashboards and explainable models empowered non-technical staff to interact with AI outputs in a meaningful way, reinforcing the system’s usability and practical value.
Internal monitoring after the system’s deployment showed promising operational results. Over a six-month observation period, there was a 27% reduction in repeated complaint categories, as measured by duplicate or semantically similar issues flagged in the system. Furthermore, the average time to classify and route complaints decreased by approximately 32%, based on support team handling logs. While these improvements were measured within a single agency and specific operational context, they highlight the potential of semantic clustering and predictive analytics to significantly enhance complaint management workflows. Future work will involve more extensive impact evaluation across multiple agencies and longer timescales to validate the scalability and generalizability of these gains.
While the framework demonstrated promising results in a Portuguese local government setting, its broader applicability across different administrative, linguistic, and cultural contexts remains to be explored. Public sector organizations vary significantly in their reporting structures, complaint typologies, and user behavior, which may impact both semantic clustering and classification performance. In particular, language-specific embeddings may need adaptation for non-Portuguese corpora, and taxonomies of technical issues may require localized calibration. To support transferability, the proposed framework was designed to be modular, allowing the substitution of language models, metadata fields, and priority schemas. Future work should involve cross-jurisdictional deployments in varied institutional contexts—including international agencies and multilingual environments—to systematically assess adaptability, retraining requirements, and governance alignment.
User-centric improvements were also observed. By identifying and addressing the most common causes of failure, the system facilitated small but impactful changes to the user interface, such as clearer input validation messages and automated guidance for correcting errors. These adjustments, informed directly by the AI-driven insights, enhanced user experience and reduced frustration at the source. To address potential bias, metadata on user gender was leveraged to support fairness auditing. Classification performance was disaggregated by gender, and demographic parity metrics were computed during model validation to detect disparities in predictive accuracy. These audits were reviewed by domain experts to ensure equitable model deployment across user groups.
In addition to demographic parity, future iterations of the framework will incorporate further fairness metrics to deepen algorithmic governance. For example, Equal Opportunity Difference will be used to assess disparities in true positive rates between different user groups, while SHAP-based attribution analysis will be extended to detect systematic differences in feature importance across organizational units or complaint categories. These metrics will provide a more granular view of fairness and complement the current demographic audits. Although some sensitive attributes were pseudonymized, the framework is designed to support subgroup-level auditing where ethical and legal constraints permit access to such data.
Nevertheless, ethical considerations were operationalized throughout the design and deployment of the system. The use of historical user interaction data followed strict data governance protocols, including pseudonymization of records, minimization of retained attributes, and internal access restrictions, in accordance with GDPR-compliant procedures. Although no direct personal identifiers were used in model training, certain optional fields such as email and phone numbers were included in dashboard views for administrative traceability. To mitigate re-identification risks, these fields were pseudonymized using irreversible hashing algorithms, and access to dashboards was limited to authorized personnel under role-based controls and audit logging. All modeling phases were subject to ex ante review by domain stakeholders to ensure alignment with administrative policies. The dataset was examined for representation bias across organizational units and equipment categories. Class imbalance was addressed using automatic class weighting during model training, and per-class performance metrics—such as F1-score and MCC—were used to detect disparities in predictive accuracy. Additionally, SHAP values were computed to explain classification outputs, highlighting the contribution of both structured features and textual terms. These explanations were presented to IT support staff to verify the interpretability and operational plausibility of the model’s decisions. This combination of fairness-aware preprocessing, performance disaggregation, and post hoc explainability constitutes a practical framework for responsible AI deployment in public sector complaint management.
The study also encountered certain limitations. The framework was tested within a single government entity, which may limit the generalizability of results to other contexts with different operational workflows or complaint structures. Additionally, the static nature of training data introduces the risk of model drift over time, particularly as user behavior, system updates, or policy changes alter the underlying patterns. Real-time adaptation remains a technical and organizational challenge, requiring continuous monitoring and retraining strategies that are not yet fully operationalized in the current implementation.
Another important limitation relates to the semantic clustering approach itself. While BERT-based embeddings significantly improve complaint grouping compared to keyword methods, they are not immune to semantic drift—especially in the presence of rare technical jargon, domain-specific expressions, or evolving terminologies. Misclusterings can occur when the model’s pretraining context differs from the operational vocabulary of a specific public agency. This suggests that domain-specific fine-tuning or adaptive retraining strategies may be necessary to maintain clustering accuracy over time, particularly as new complaint types or system updates emerge.
When compared to traditional manual filtering approaches, the AI-driven system proved significantly more scalable, consistent, and responsive. Manual methods often rely on rigid keyword lists and human interpretation, leading to inconsistencies in classification and slower turnaround times. In contrast, the automated approach provided dynamic, adaptive classification capabilities, reduced labor requirements, and introduced a level of insight that manual methods are unlikely to achieve at scale.
In sum, this discussion illustrates how the integration of AI techniques in public sector complaint management can improve both operational efficiency and user satisfaction—while also surfacing important ethical and practical considerations that must guide future deployments.


 ,
, 

