1. Introduction
The increasing implementation of infrastructure construction has led to a growing demand for coal resources. Given its significant role in supporting the rapid development of the national economy, it is crucial to mine coal in a rational and efficient manner. Furthermore, coal mining has significantly impacted groundwater, leading to potential mine water disasters [
1]. Understanding the mechanical properties and fracture mechanism of fractured coal and rock is essential in ensuring the safe and reliable operation of underground reservoirs.
There are a large number of irregular microcracks in coal and rock masses, which have different effects on their stability and failure characteristics. The joints and holes greatly affect the strength, cracking process, and failure mode of rock samples [
2,
3]. Scholars have extensively investigated this phenomenon and obtained important findings about the influence of various parameters (such as crack length, angle, confining pressure, freeze–thaw cycles, and multi-crack conditions) on the mechanical properties, crack propagation mechanisms, and failure modes of rock masses [
4,
5,
6]. These comprehensive studies have yielded remarkable insights into this intricately complex subject matter. The strength theory put forward by Griffith [
7,
8] points out that rock mass fracture was mainly caused by stress concentration near the crack tip. The compression–shear tests of random fractured rock samples made of cement mortar material revealed the internal relations among compression–shear angle, fracture distribution, and crack propagation [
9]. Based on uniaxial and biaxial compression tests conducted by Brace et al. [
10] on brittle rock specimens with a single inclined fracture, the fracture propagated away from the original fracture surface at a deviation angle of about 70. Loading conditions and crack geometry affect the mechanical properties of the specimen. The loading condition controlled the fracture tendency of rock macroscopically, while the crack geometry shape significantly affected the fracture behavior and failure mode of rock locally [
11]. Fracture depth had a significant influence on rock strength and deformation characteristics. The existence of the horizontal joint plane directly led to a significant reduction in the strength of the jointed rock sample, and the fracture depth played an important role in controlling the failure mode of the jointed rock specimens [
12]. Gu et al. [
13] studied the mechanical and acoustic emission evolution characteristics of coal–rock composite samples with different interface angles. With the increase in interface angle, the failure mode changed from matrix cracking to interface sliding failure. According to the study by Li et al. [
14] on the energy evolution of fractured sandstone with different angles, the strength and elastic modulus of sandstone decreased with the increase in fracture angle.
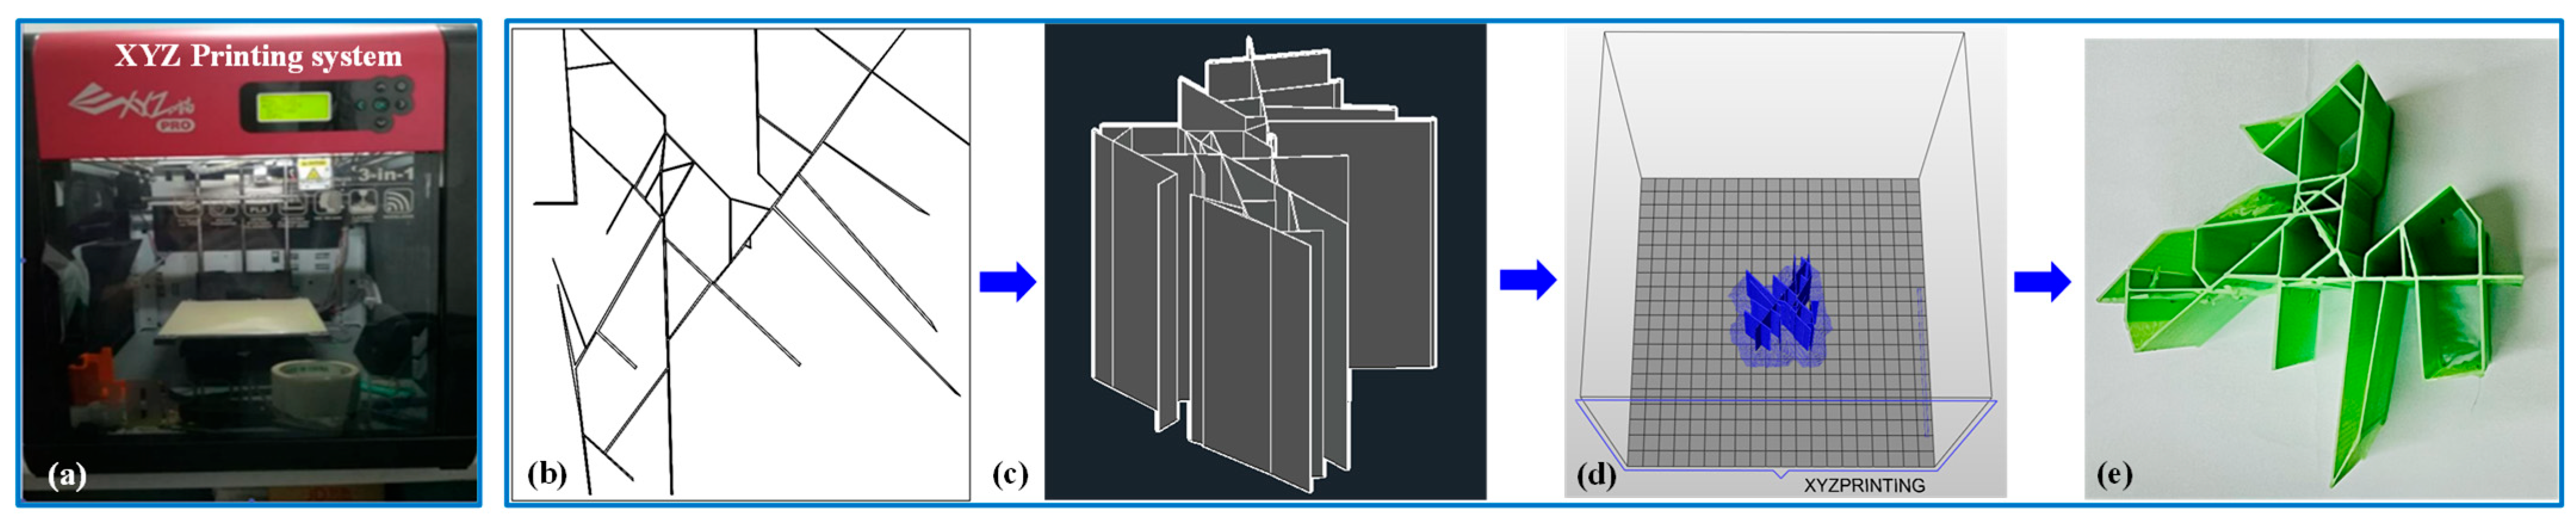
There are a large number of randomly distributed spatial structural planes with different scales in the rock mass. Similar simulation research on tests of rock mass materials has always been a focus and challenge in the field of rock mechanics, and it is one of the important tasks to solve the field engineering problems. Due to the limitations of modeling means, it is difficult to obtain a complex fracture distribution test model by traditional methods. Three-dimensional printing technology is gradually being used in the field of rock mechanics [
15,
16,
17].
Materials used for 3D printing in geotechnical engineering primarily include photosensitive resin, polylactic acid (PLA), ABS materials, and powder materials such as gypsum and sand. Researchers have focused on utilizing these materials for fracture network simulation and rock mechanics characterization [
18,
19,
20]. Zhang et al. [
21] developed modified sand-based 3D-printed rock-like specimens that successfully replicated the brittle mechanical properties of high-strength rocks, providing a critical tool for fracture network studies. Wang et al. [
22] innovatively established a Rough Discrete Fracture Network (RDFN) model incorporating joint roughness. Through comparative analysis of shear behaviors between RDFN and DFN models, their work highlighted the critical influence of joint roughness on fracture network mechanics. Zhu et al. [
23] further combined fractal principles with 3D printing to construct rough fracture networks, achieving stress–strain curves closely matching natural rock samples. In fracture simulation technology, Jiang et al. [
24] proposed a 3D Internal-Laser-Crack (3D-ILC) method to fabricate controllable crack propagation paths. Their study validated the regulatory effects of ultrasonic parameters on crack evolution using the Paris fatigue model. Wang et al. [
25] prepared multi-type joint physical models via 3D printing, systematically revealing strength evolution patterns of different fracture network configurations through uniaxial compression and direct shear tests. Notably, Zhou et al. [
26] achieved real-time 3D crack visualization in transparent resin specimens, quantitatively demonstrating that wing crack propagation lengths were 1–1.5 times the initial defect size, with slower propagation observed in multi-defect systems. These breakthroughs established new paradigms for visualizing complex fracture networks. Scholars have also emphasized material compatibility. Currently, 3D printing technology advances rock mechanics research by enabling precise control over fracture network geometries and material responses, driving the field toward higher-precision physical simulations.
In this study, the geometrical–mechanical inhomogeneity of the 3D fracture field is accurately reconstructed by constructing a discrete fracture network (DFN) model considering the geometrical roughness of the fracture and innovatively adopting the gradient ratio design of PLA molds and coal dust–AB adhesive mixture, combined with the digital image correlation (DIC) technology to capture the surface deformation field and internal fracture expansion in high resolution during the loading process, the system reveals the combined with digital image correlation (DIC) technology to capture the surface deformation field and internal fracture expansion in the loading process with high resolution. It systematically reveals the mechanism of fracture network–material component synergy on the brittle-delayed transition behavior of coal rock under a freeze–thaw environment. Cubic/cylindrical coal rock specimens with different ratios were prepared, and the similarity of the artificial model in terms of stress–strain response, peak strength, and damage mode was verified by comparing the mechanical properties of natural coal samples, while it was found that the brittle characteristics of the DFN model specimens were significantly enhanced by the low-temperature conditions, which contributed to the preferential extension of the main crack along the preformed fissure. This multi-scale method breaks the technical bottleneck of traditional models in complex fracture topology reproduction and cross-scale damage monitoring and provides a new paradigm for predicting the mechanical behavior of fractured coal rock in freeze–thaw zones and evaluating the stability of underground reservoirs.
3. Experimental Tests
3.1. Test Loading System
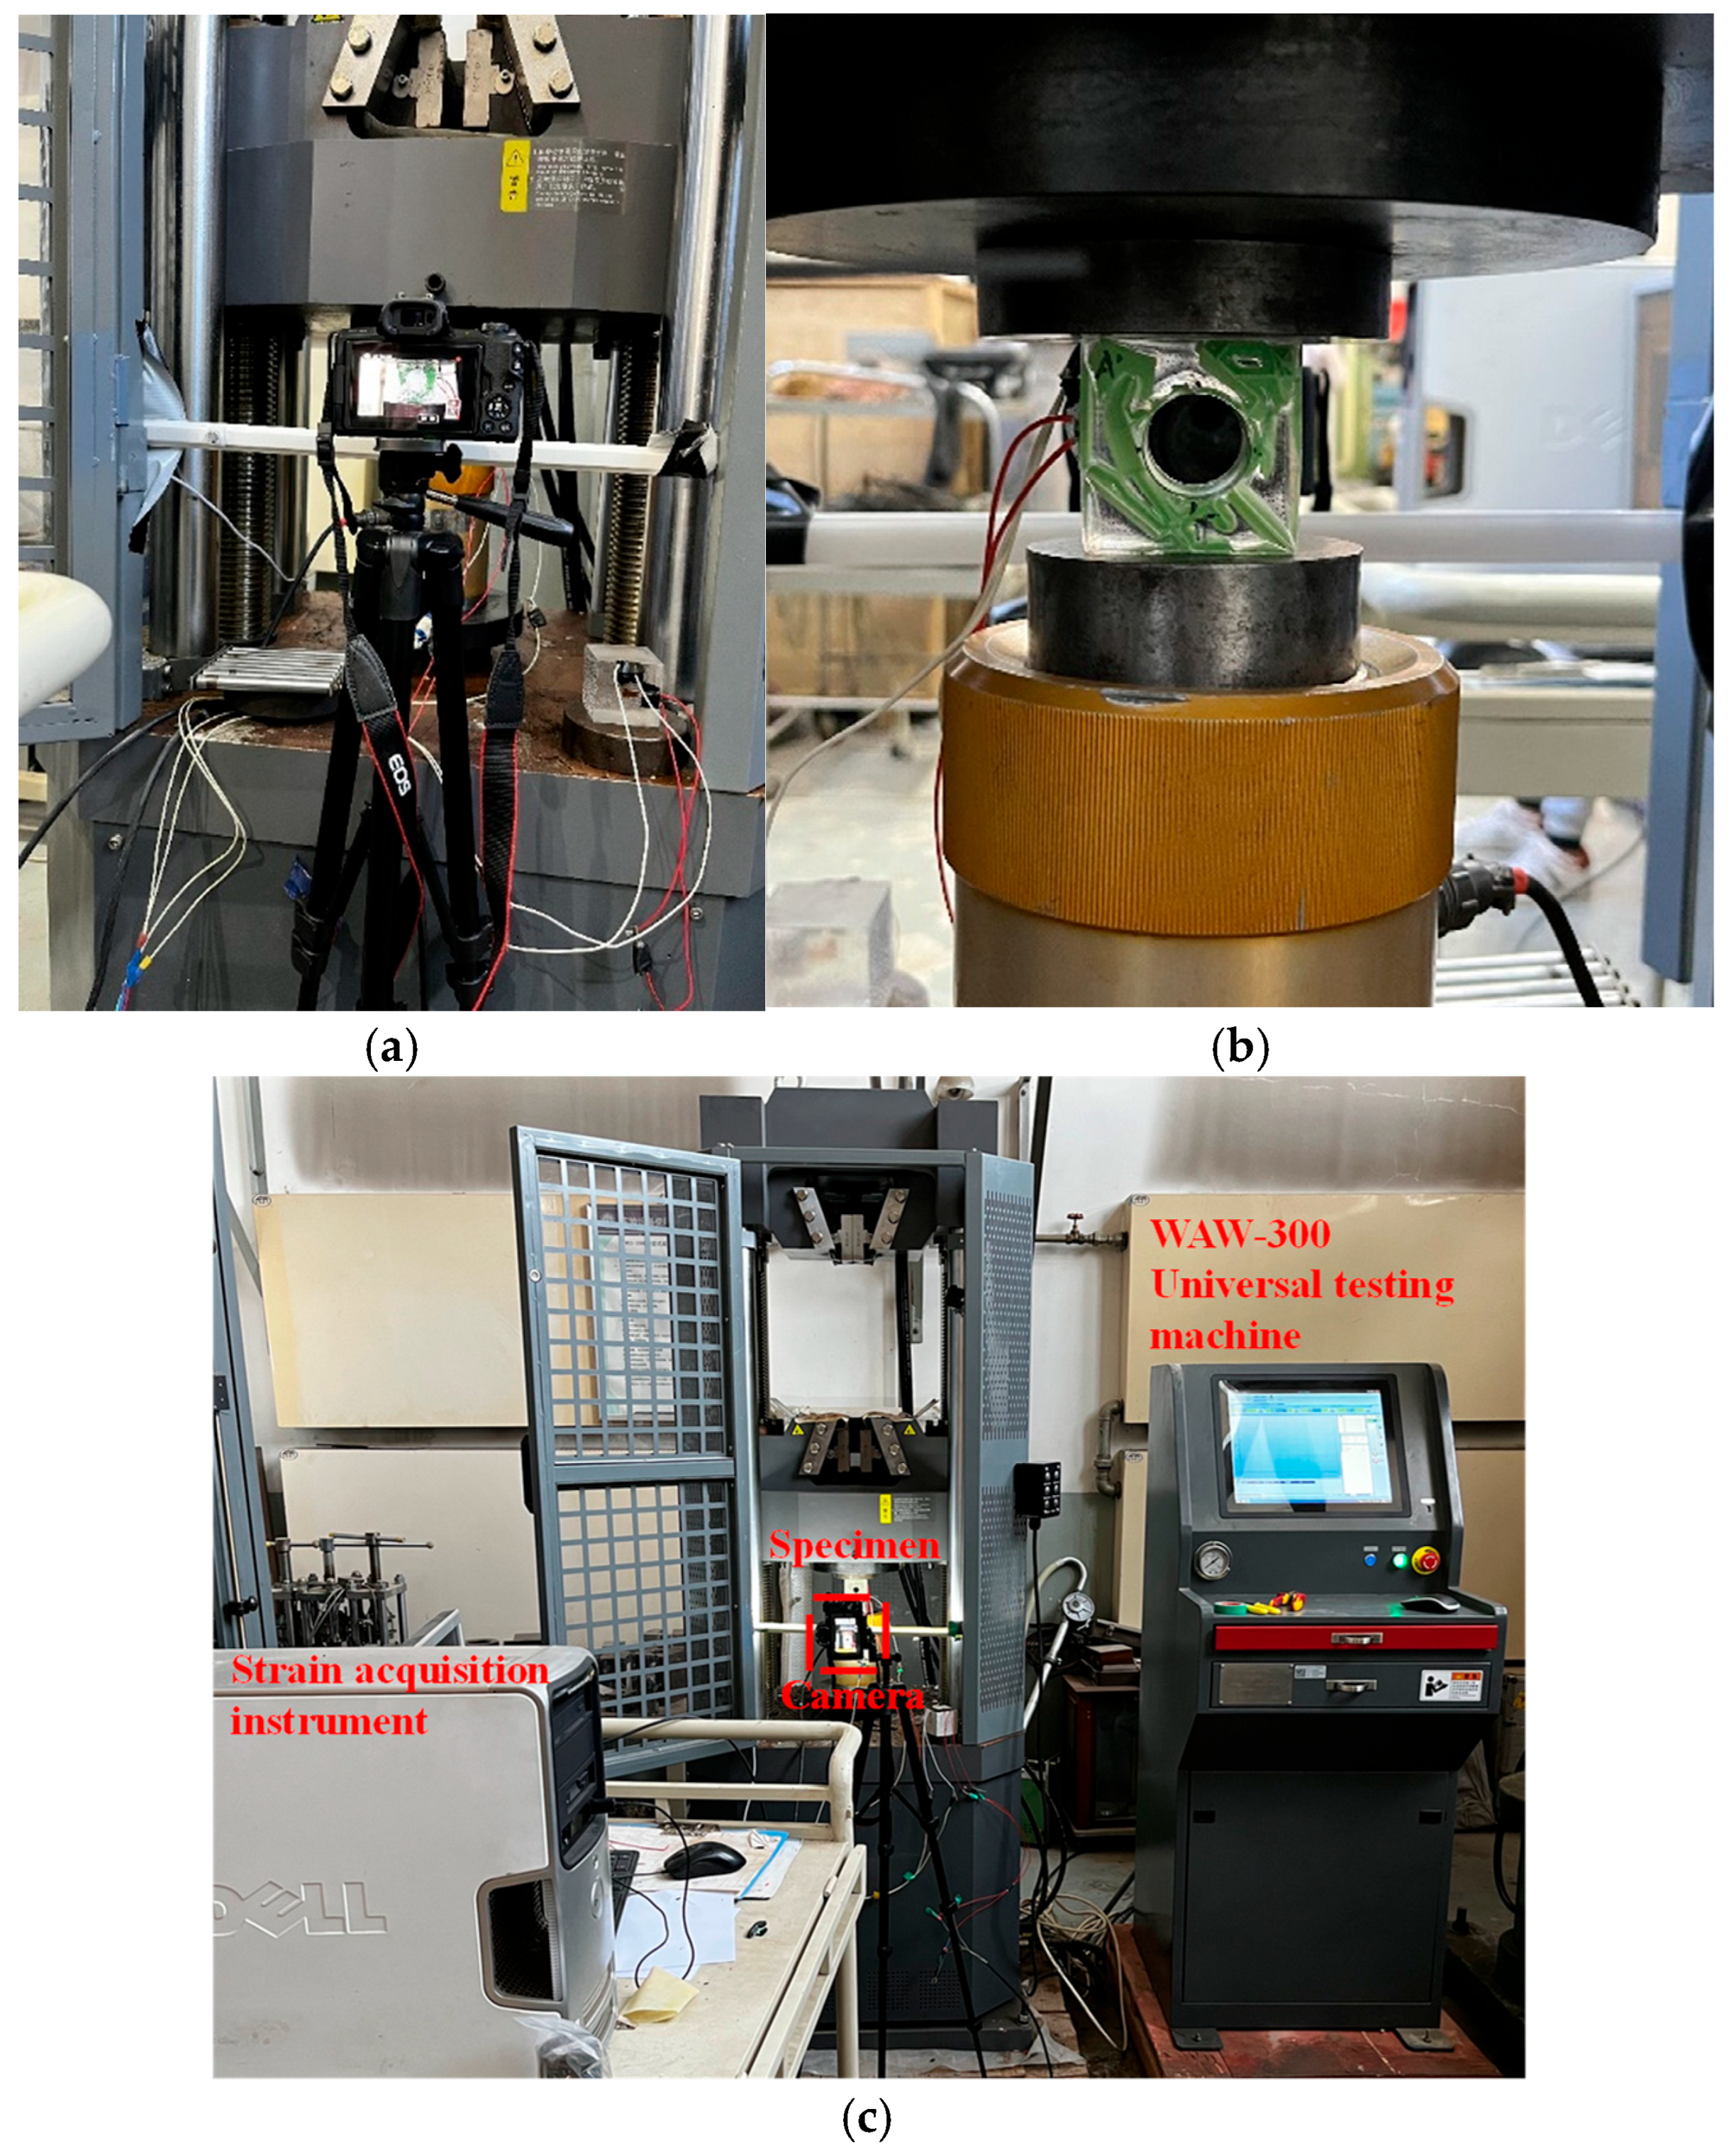
The WAW-300 universal testing machine and strain collector (
Figure 3) were used for loading, and the maximum loading was 300 kN. A 1920 × 1080 resolution camera was used for video recording during the experiment at the following location. The image acquisition rate is 60 fps. The camera displacement is nearly 30 cm, considering the settlement of the camera and the compression machine. Uniaxial compression tests were performed on three different model specimens. The initial loading rate was 1 kN/s by load control and displacement control, and when it reached 250 kN, it was changed to displacement control to ensure that the loading rate of the target load was 0.2 mm/min.
3.2. Mechanical Properties
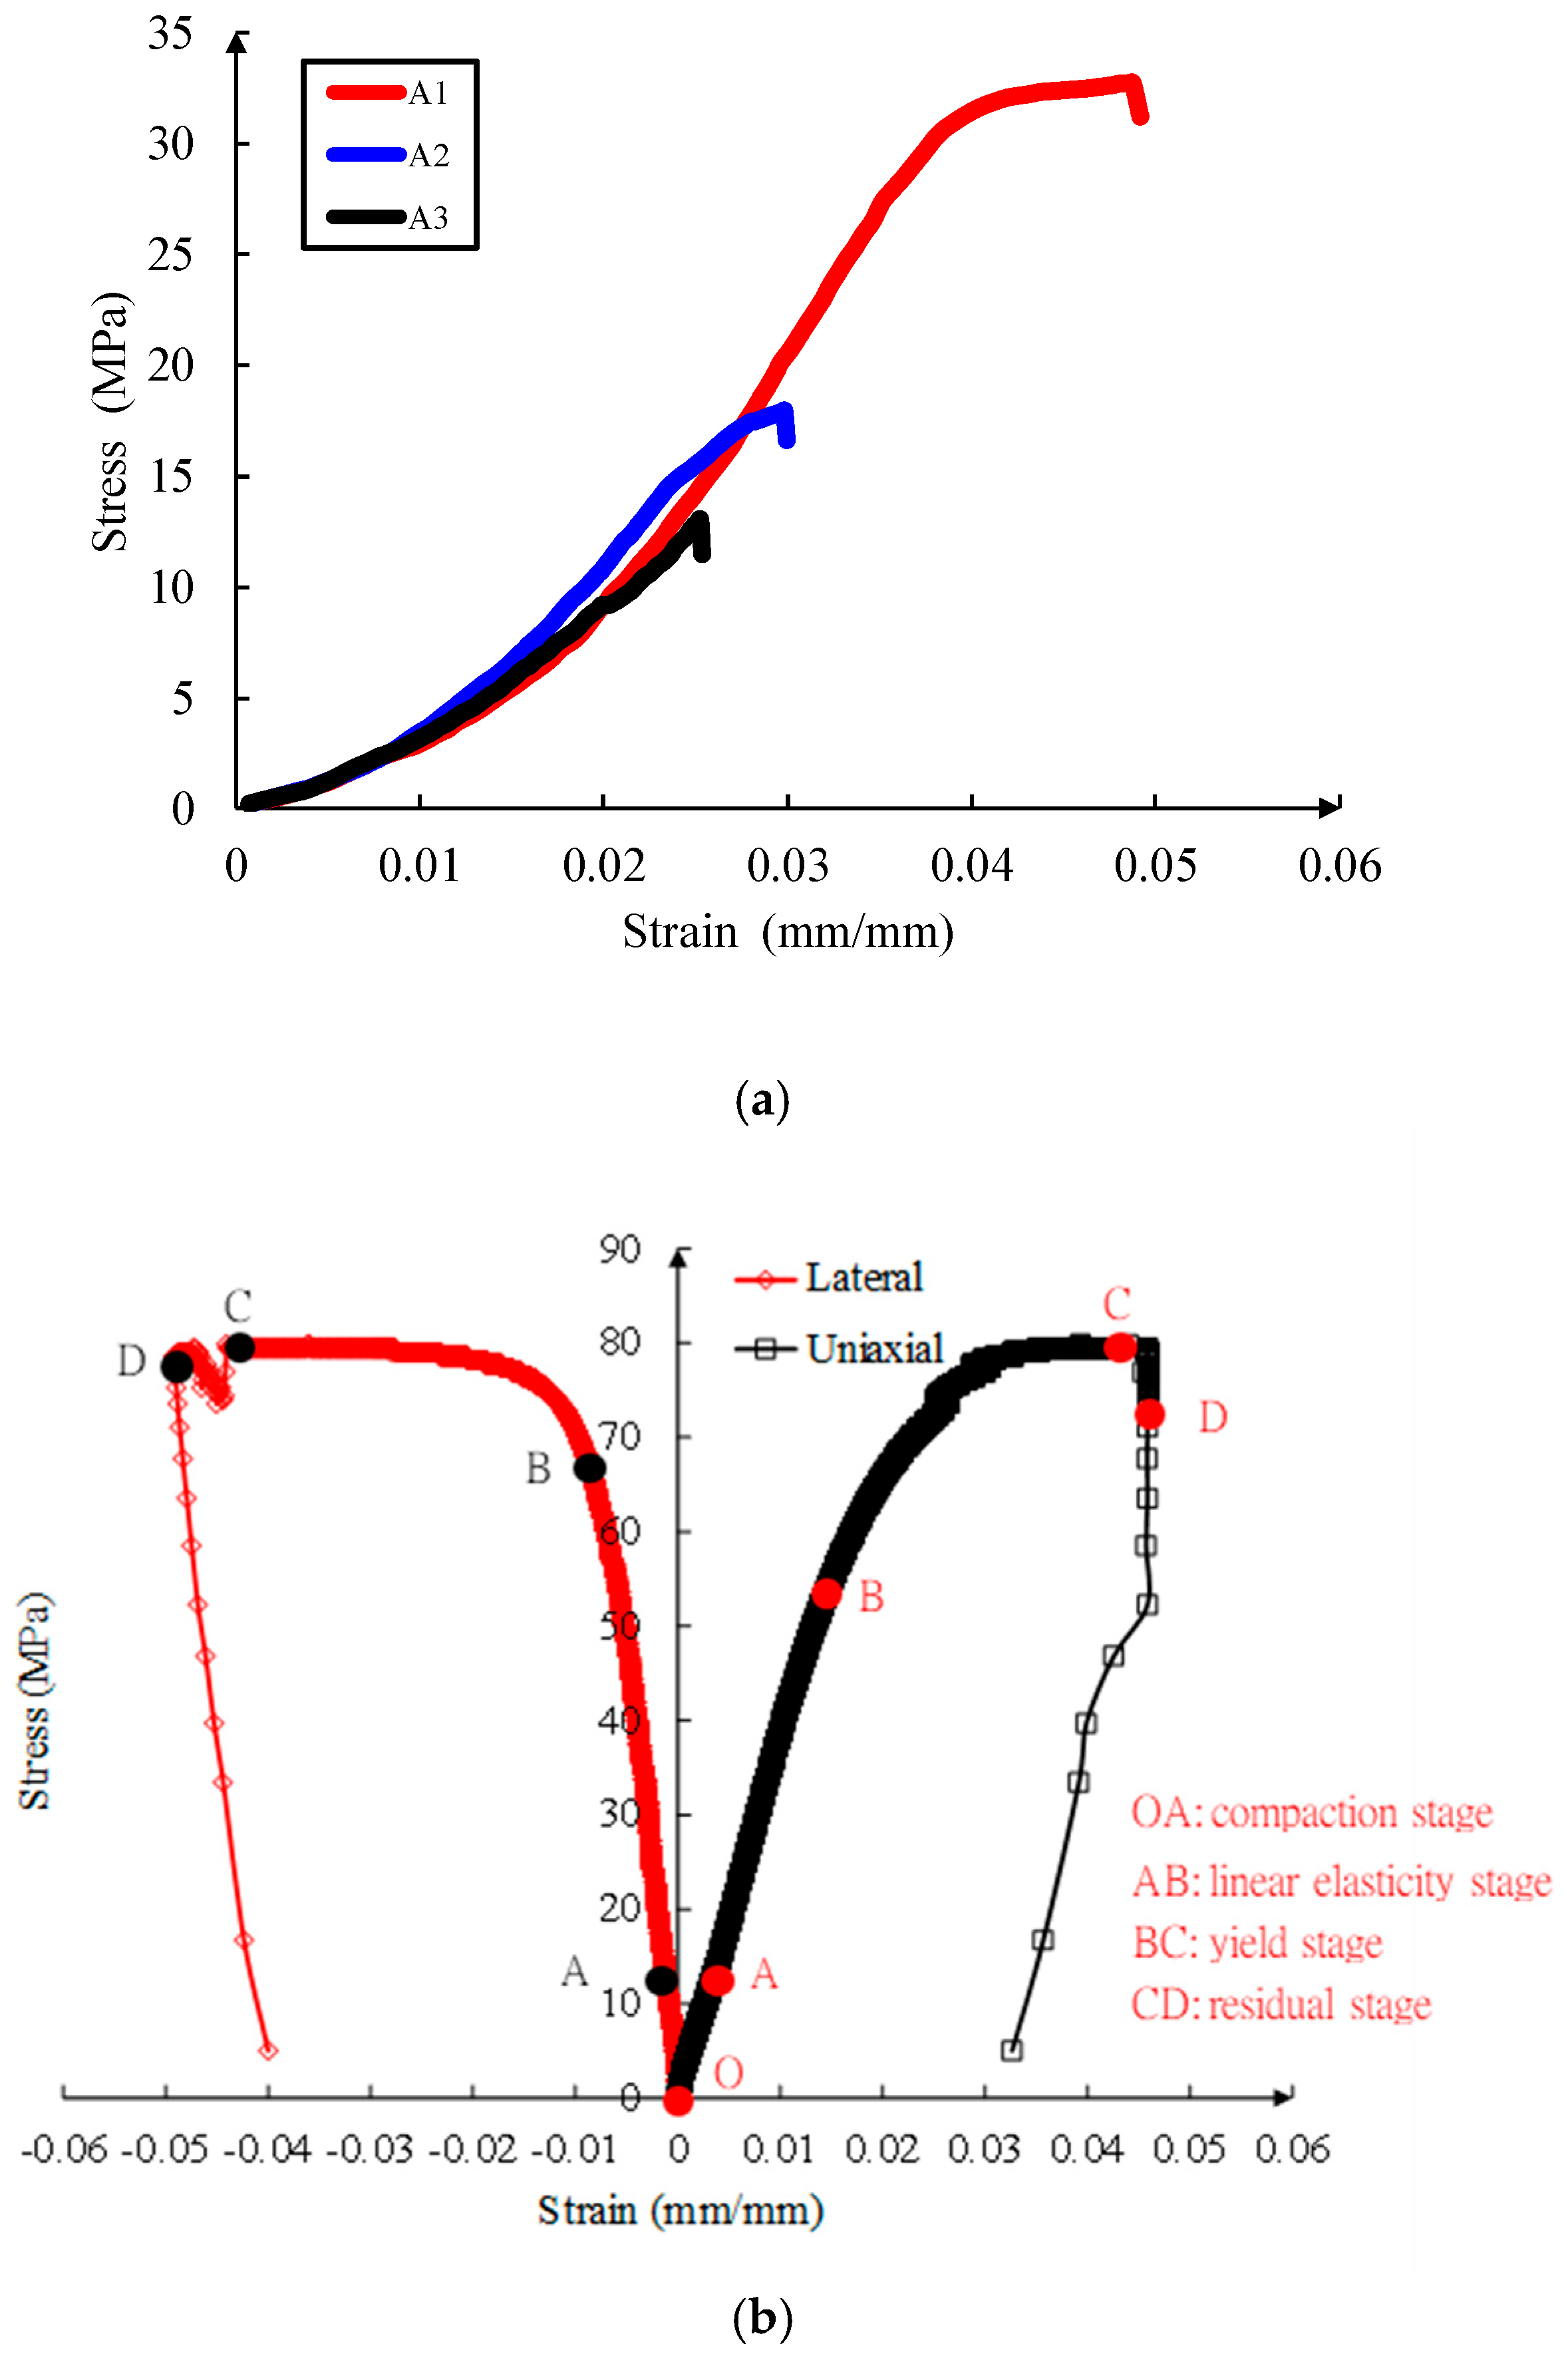
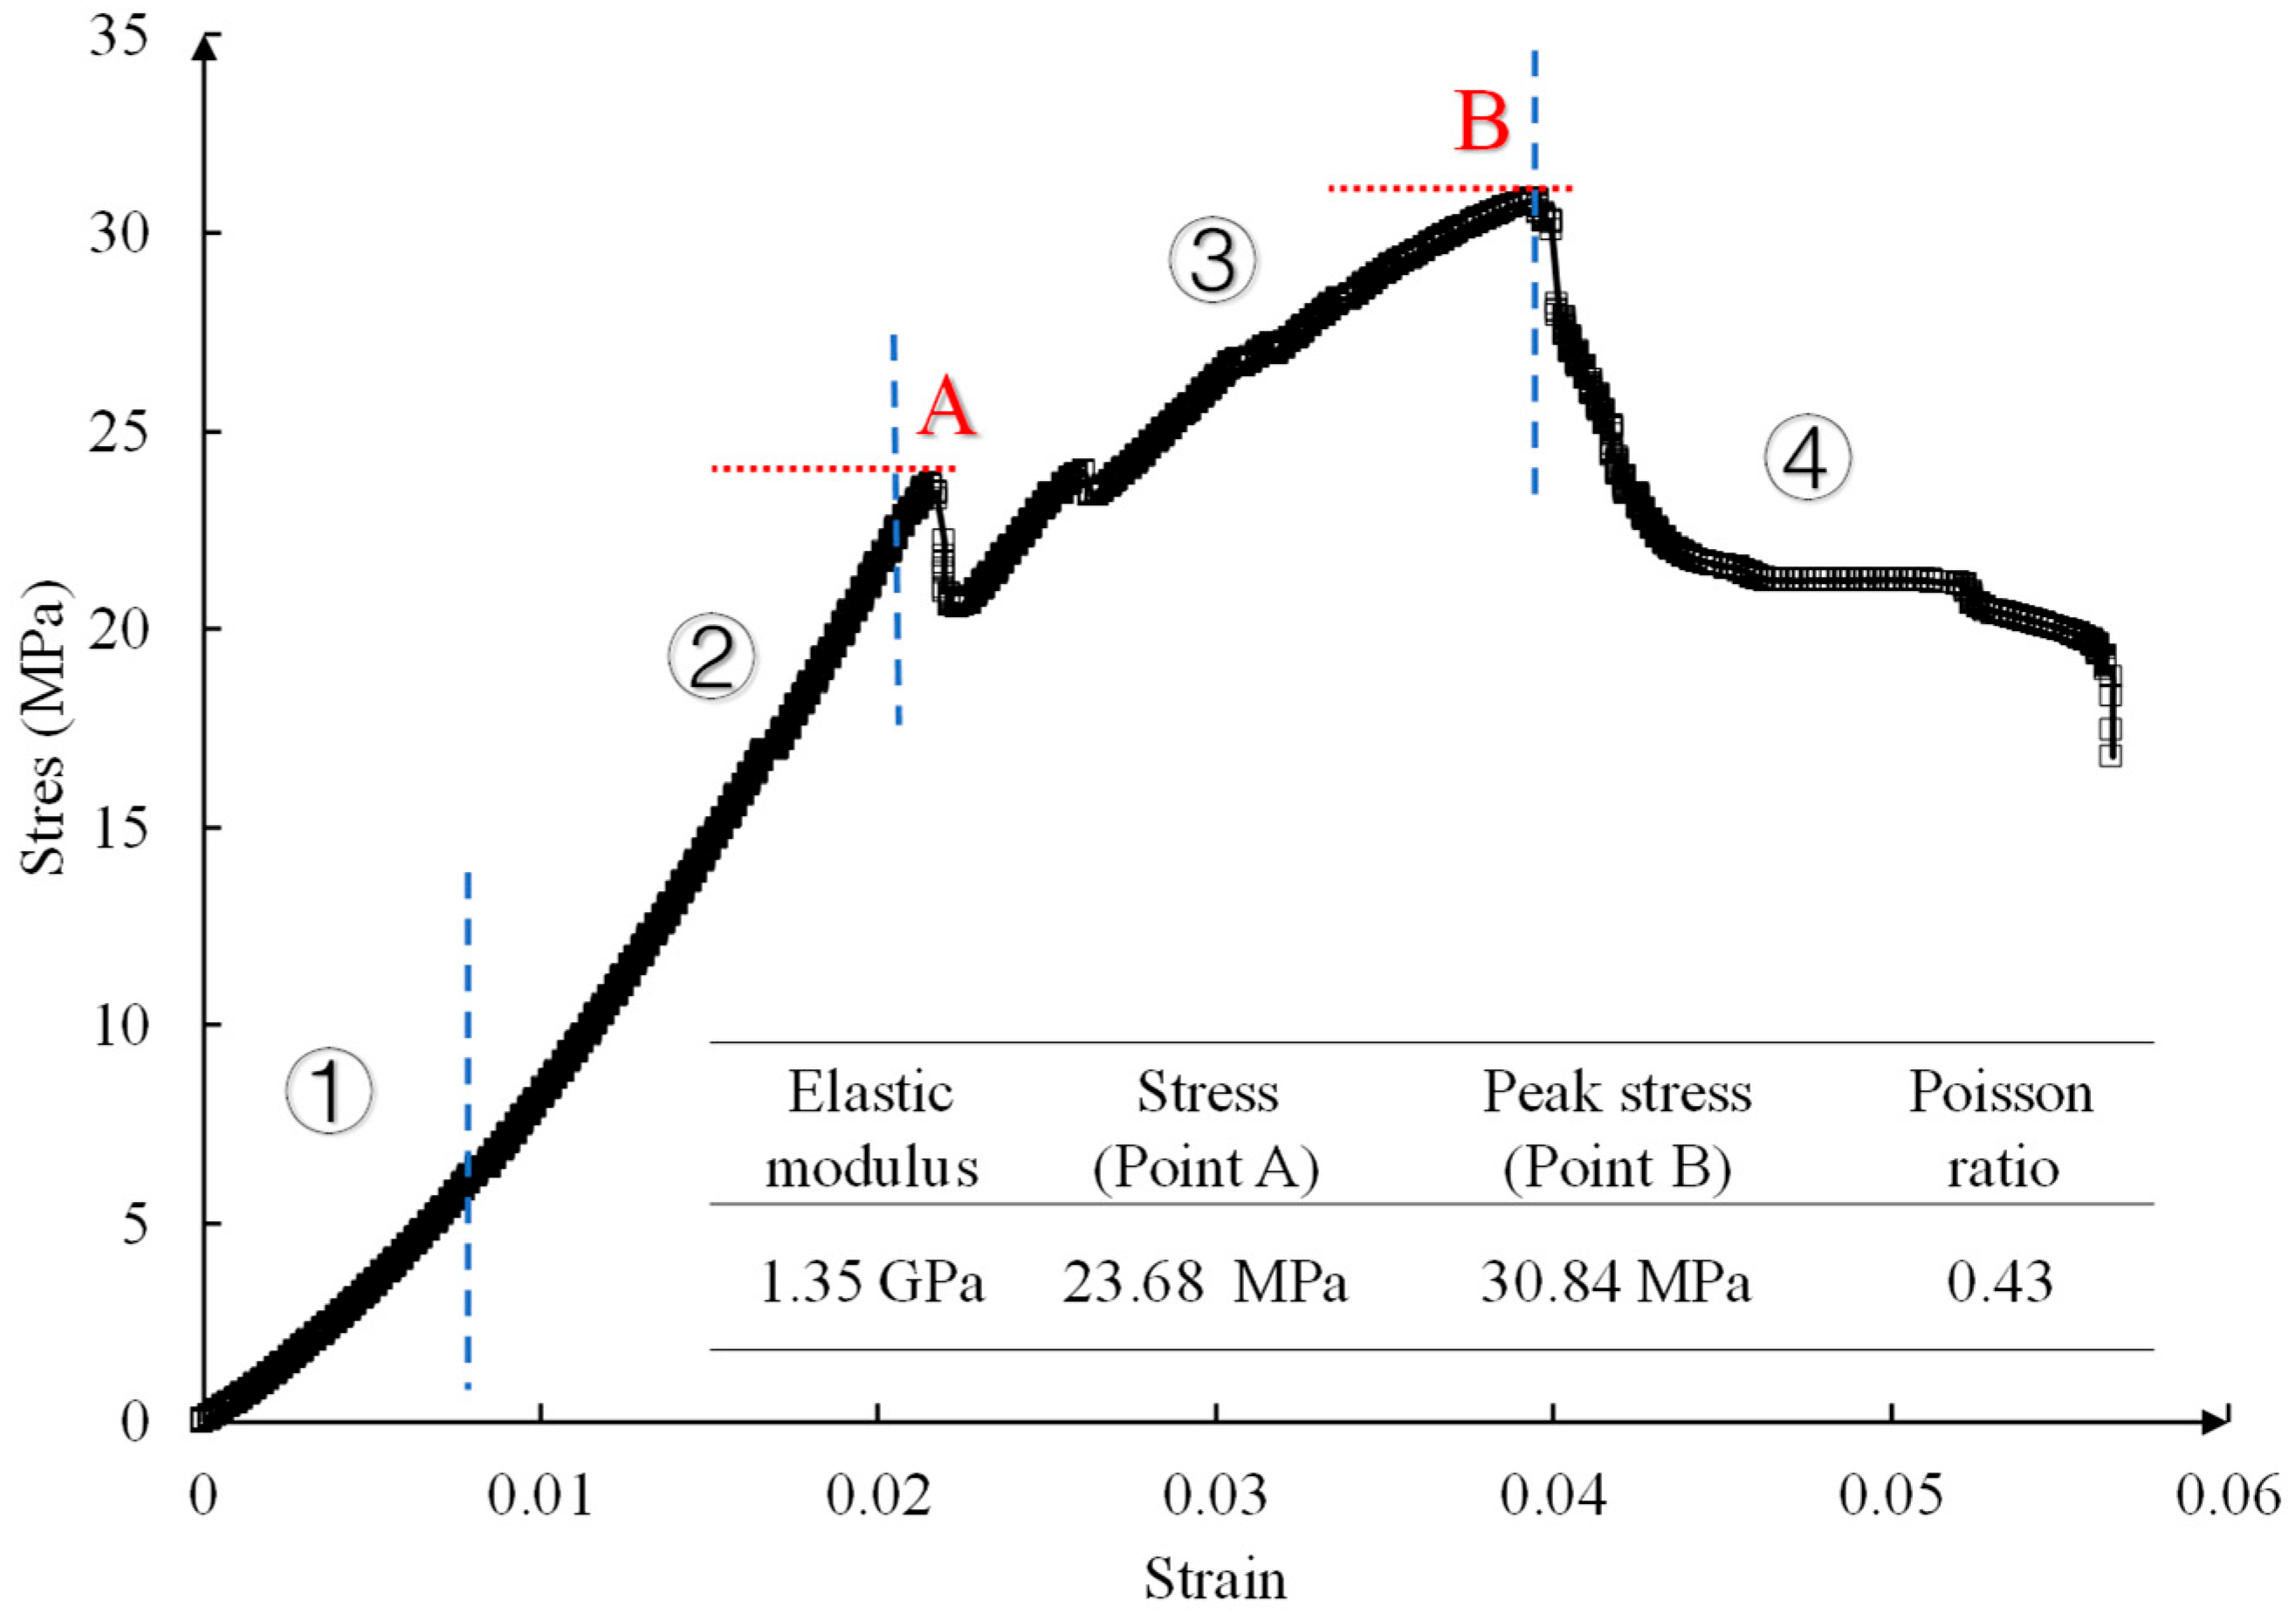
Figure 4a shows the stress–strain curve of the cubic DFN model sample. The formulas for calculating the elastic modulus and Poisson’s ratio were Equations (1) and (2).
where
E is determined by calculating the secant slope of the linear elastic stage of the stress–strain curve;
is the ultimate stress on the linear elastic line segment, MPa;
is the initial stress on the linear elastic line segment, MPa;
is the ultimate strain value on the linear elastic portion of the straight line segment, mm/mm;
is the initial strain value on the linear elastic portion of the straight line segment, mm/mm; and Poisson’s ratio (
v) is the ratio of the absolute value of circumferential strain (
) to the absolute value of axial strain (
) of the specimen corresponding to the linear elastic stage.
Table 3 provides the mechanical parameters of the DFN model and solid cube model obtained from the test. The A1 sample contained pulverized coal in a ratio of 1:1.2. Its mechanical parameters, which include peak compressive strength, elastic modulus, and Poisson’s ratio, were higher than those of A2 and A3. This suggests that increasing the pulverized coal content during sample preparation enhances the sample’s mechanical properties. The stress–strain curves of samples A1, A2, and A3 can be classified into four stages: compaction stage, linear elasticity stage, yield stage, and failure stage. During the compaction stage, all samples showed compaction of the pulverized coal particles with different sizes, causing a decrease in the gap between particles and an increase in their strength. During the linear elastic stage, the stress in the sample increased proportionally with the compression applied. There was significant progress in the A1 sample, which demonstrated a sharper increase and a larger elastic modulus. Due to the trial preparation error, the curve trends of the A2 and A3 samples were almost identical, except for a few minor distinctions. There was a significant difference among the three samples at the yield stage, with the A1 sample’s curve slowly increasing to its peak compressive strength during this stage. Its peak compressive strength was 1.78 times higher than that of A2 and A3. During the failure stage, the strength of the sample decreased, and cracks appeared on the surface along the Discontinuous Fracture Network (DFN) model.
Figure 4b shows the stress–strain curve of the solid cube model sample. The solid sample had a peak compressive strength of 79.86 MPa, an elastic modulus of 3.70 GPa, and a Poisson’s ratio of 0.37 (
Table 3). Compared with the cubic model of the DFN model, the compressive strength of solid samples was increased by 1.44 times, indicating that the existence of the random fracture network model (DFN model) significantly reduced the compressive strength. The stress–strain curve of the solid cube model is also divided into four different stages: compaction stage, linear elasticity stage, yield stage, and residual stage. Compared with cubic DFN model samples, solid cubic samples featured a shorter compaction stage, longer linear elastic stage, and similar yield stage. At peak strength, the sample exhibited observable cracks, culminating in a shear failure. The post-peak axial stress–axial strain curve depicted simultaneous stress and strain reduction, suggesting that the material’s plasticity triggered the post-peak expansion of the sample. During the residual stage, the compressive stress experienced a sudden decrease, followed by a significant, continuous deformation stage in the post-peak stage.
Figure 5 shows the stress–strain curve of the cylinder model sample. The mechanical parameters of the cylinder model were given in
Table 3. In particular, the B2 sample, with an AB glue to pulverized coal mixture ratio of 1:1.2, achieved a peak compressive strength, elastic modulus, and a Poisson’s ratio of 77.97 MPa, 2.36 GPa, and 0.37, respectively. Moreover, the B3 sample, with an AB glue to pulverized coal mixture ratio of 1:1, demonstrated a peak compressive strength, elastic modulus, and a Poisson’s ratio of 61.09 MPa, 1.03 GPa, and 0.31, respectively. It was found that increasing the pulverized coal content of the sample increased the strength of the sample by 0.28 times, the peak stress by 16.88 MPa, and the strain by 0.05. This indicated that the increase in pulverized coal content improved the mechanical properties of the sample.
The stress–strain curve of the cylinder model sample was similar to that of rock in the compression process, which consisted of four stages: compaction stage, linear elastic stage, crack propagation stage, and post-failure stage. The slope of the sample curve gradually increased with the increase in stress in the compaction stage, indicating that the bubbles in the sample had burst, the microcracks had closed, and the strain had increased slightly after compression in this stage. In the linear elastic stage, the sample curve increases linearly with stress. In the crack propagation stage, the specimen was subjected to plastic deformation, new cracks appeared in the specimen, stress concentration occurred at the crack, and the specimen exhibited the maximum compressive strength. In the failure stage, the stress of the specimen decreases slowly while the strain continues to increase, and the crack continues to increase until it is completely destroyed.
3.3. Fracture Patterns
The uniaxial compression failure mode of normal temperature samples was shown in
Figure 6. The speckle is prepared manually, and the density is nearly 40~50 /cm
2. The ROI area was chosen based on the whole area of the rock specimens.
Figure 6a shows the failure mode diagram of the standard cylindrical specimen. Two typical failure modes, longitudinal splitting and shear failure, occurred in the compression process of the specimen. The B2 sample, with a content ratio of AB glue and pulverized coal of 1:1.2, contained two tensile fracture planes and a shear failure plane that traversed the entire rock sample. The B1 sample, with a ratio of 1:1, was not pressurized after being compacted to produce transverse cracks. Sample B3 with a 1:1 ratio experienced shear failure, and the form of failure was section shear failure, accompanied by a local shear failure surface. Comparison of the damage patterns of the B2 and B3 specimens at low temperatures revealed a tendency for specimen brittleness to increase proportionally with the coal dust content and to produce indicative rock compression damage.
Figure 6b shows the failure mode diagram of the cubic specimen. Different material ratios of samples demonstrated distinct failure modes. Both specimen A1 and solid specimen C exhibited varying surface fracture shapes under compression. The A1 specimen exhibited shear failure along the joint, while the C specimen of the solid model revealed two cracks at the apex, but no penetration. The above findings demonstrated that the incorporation of a complex fracture network modified the sites of crack formation in the sample. The A2 sample, with a 1:1 AB glue to pulverized coal ratio, presented longitudinal fractures, while the middle of the sample exhibited incomplete microcracks. Comparison of the failure modes of A1 and A2 samples revealed that the adjustment of the material ratio altered the samples’ failure modes. Furthermore, the uniaxial compressive strength of the samples increased with the increase in pulverized coal content. The WAW-300 universal testing machine and strain collector (
Figure 3) were used for loading, and the maximum loading was 300 kN. A 1920 × 1080 resolution camera was used for video recording during the experiment. Uniaxial compression tests were performed on three different model specimens. The initial loading rate was 1 kN/s by load control and displacement control, and when it reached 250 kN, it was changed to displacement control to ensure that the loading rate of the target load was 0.2 mm/min. The open MATLAB v2018b source, termed as the Ncorr code [
27], is used to calculate displacement and strain by using the digital image correlation function. The strain error of this program is less than 0.05%.
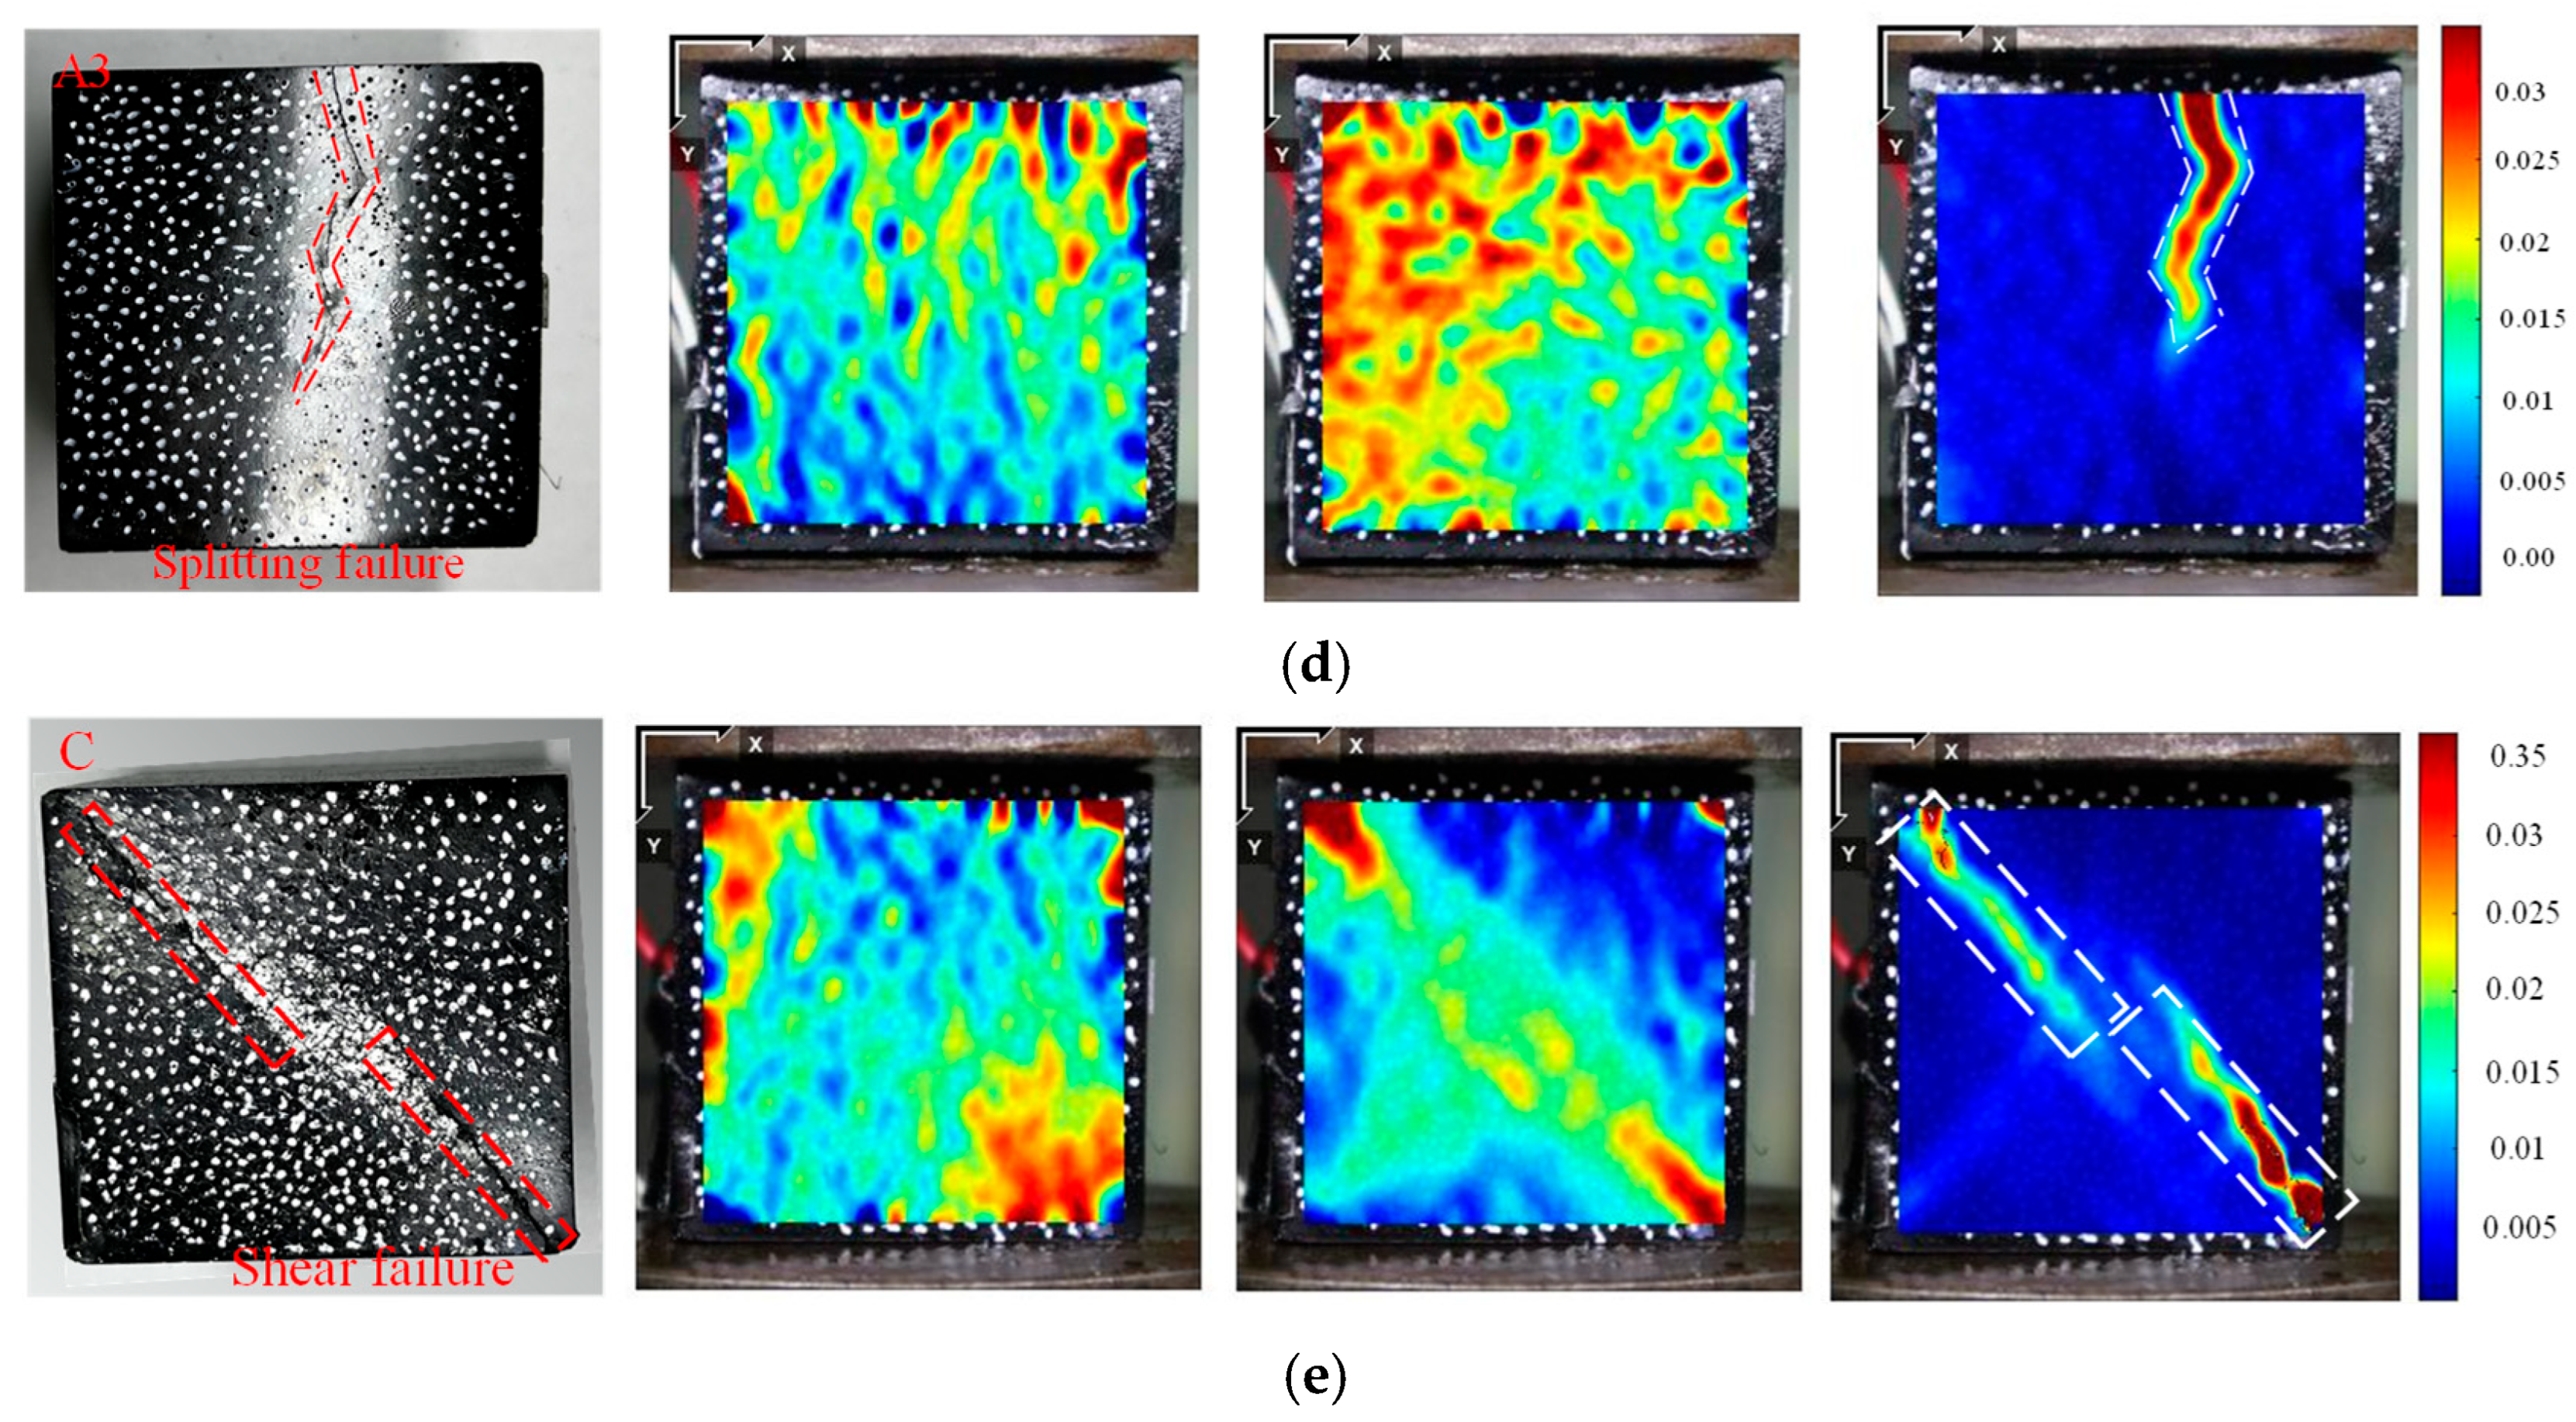
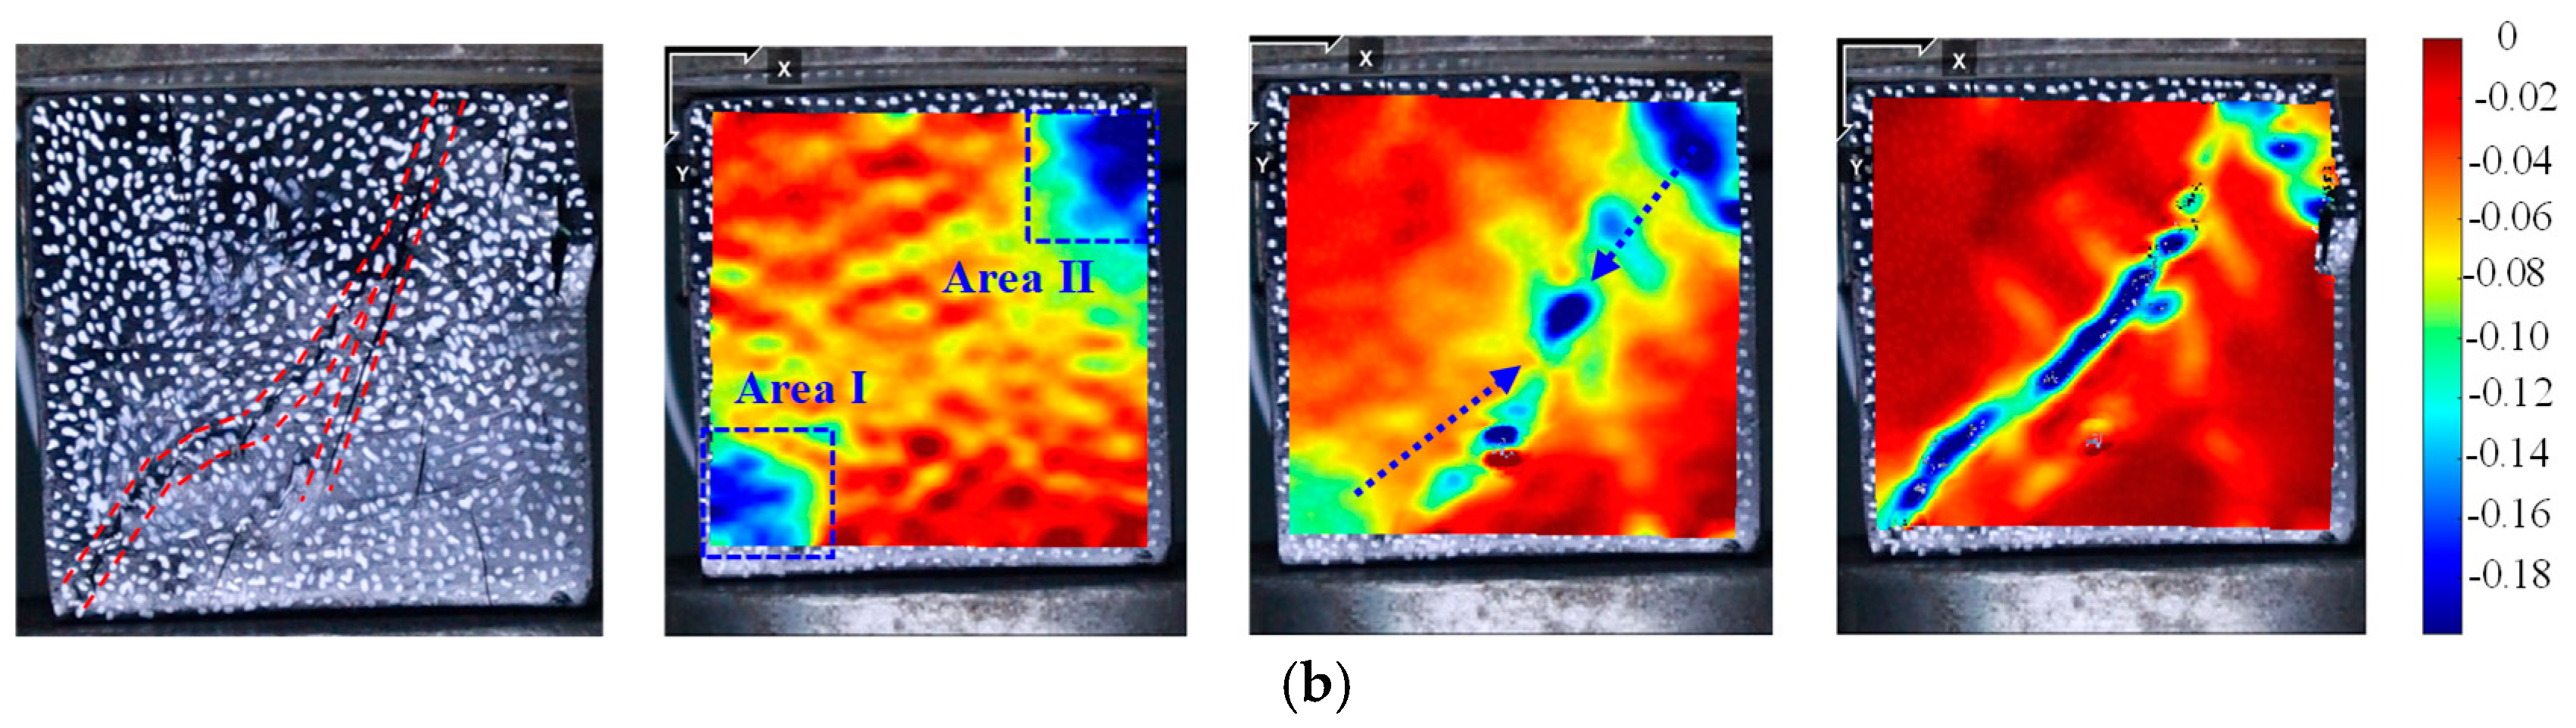
Figure 7 displays the y-direction strain nephogram of samples with similar material ratios. The y-direction strain cloud of the specimen changed uniformly during the compaction stage and the linear elastic stage. The compressive strain of the B2 specimen increased uniformly. There was a strain localization area in the upper right corner (Area I), which corresponded to the crack position of the specimen. No strain localization band appeared in the other regions. The strain cloud shows a downward strain (Area I) at the top, which corresponds to the strain localization area inside the B3 sample after compression. The uneven strain distribution of the A1 and A3 samples caused failure along the prefabricated discrete fracture network (DFN) cracks. Localized areas appeared in the center of the samples, corresponding to the surface cracks of the samples. A downward-inclined strain localization band that was 45 degrees inclined appeared in the strain cloud of specimen C, corresponding to the surface crack area.
The strain nephogram analysis was combined with an investigation of various stages of specimen failure and the evolution of cracks. In the yield stage, the internal cracks of the sample increased, microcracks appeared on the surface and began to expand, and the strain continued to increase. The strain localization area appeared at the top of the B2 and B3 samples and gradually expanded. During this period, the internal DFN model of the A1 and A3 samples was compressed, resulting in plastic deformation while the sample volume expanded without any cracks. Microcracks were generated in the strain localization region of the C sample and began to propagate.
The cracks were entirely developed during the post-peak stage, while y-direction clouds exhibited a marked difference. Both sides of the stress concentration area of the B2 specimen showed inclination cracks, which caused the specimen to crack longitudinally. The top of the B3 specimen showed significant cracking. This cracking penetrated the specimen and caused the specimen block to fall off, resulting in shear failure.
The y-direction cloud was capable of clearly identifying the larger strain localization area. A longitudinal fracture was observed in the A1 sample, and the strain cloud clearly indicated the development of through cracks. The upper part of specimen A3 developed cracks, and the strain was highest at the top but gradually decreased downwards, consistent with the crack development in
Figure 7. The cracks at the upper and lower vertices of sample C began to develop in the middle but did not penetrate, and there were two obvious strain bands in the strain cloud. This research showed that DIC detection could effectively analyze the crack development on the surface of the sample. Different mixture ratios and different model samples caused different crack development paths and failure modes.
5. Analysis and Discussion
To further investigate the similarity in fracture evolution and strength characteristics between natural coal samples and 3D-printed prefabricated coal samples, uniaxial compression tests were carried out on natural coal samples. The natural coal sample, weighing 323.9 g, was a cylindrical specimen measuring 50 mm in diameter and 100 mm in height. The procedures for the uniaxial compression test were the same as those for the 3D-printed coal specimens. The elastic modulus of natural coal samples was 3.50 GPa, and the Poisson’s ratio was 0.19.
Figure 10 displays a scatter diagram of peak compressive strength, elastic modulus, and peak strain across samples with varying material ratios. The stress–strain curve of uniaxial compression samples yielded three mechanical parameters: compressive strength, peak strain, and elastic modulus. These parameters were obtained under different ratios and conditions.
Figure 10 depicts fitting curves and formulas for the mechanical parameters of distinct models at different ratios. The trend of growth of specimens with different proportions in
Figure 8 showed that increasing the amount of coal dust improved the compressive strength, modulus of elasticity, and peak strain of the specimens. Therefore, increasing the coal dust content could increase the brittleness and decrease the plasticity of the sample. The comparison between the DFN (discrete fracture network) model sample and the solid sample clearly indicated that sample cracks significantly decreased the compressive strength, elastic modulus, and peak strain. Under low temperatures, there was a small decrease in the average compressive strength of the sample, but the average elastic modulus and peak strain showed an increase. Based on the fitted curves, it was verified that the specimens were significantly affected by low temperatures and that the damage pattern of the low-temperature-treated DFN model specimens was similar to that of the nodular rock mass.
As shown in
Figure 11, the stress–strain curves of three different types of specimens, namely standard cylindrical specimens, natural coal specimens, and low-temperature DFN model cubic specimens, were normalized to obtain the trend of each curve. According to the findings, self-made cylindrical samples had the highest elastic modulus, followed by low-temperature DFN model cubic samples, while natural coal samples were the lowest. The results revealed that a high AB glue content increased the elastic–plastic ability and hardness of the sample. The elastic–plastic ability was reduced under low-temperature conditions, but it remained slightly higher than that of the natural coal sample. Three-dimensional printing technology was used in the laboratory to prepare self-made samples with a complex fracture network model, which exhibited similar failure modes as coal rock samples with natural fractures. The creation of artificial specimens was fast and convenient, but there were still some differences in the mechanical properties of natural specimens. To enhance the plasticity of the materials used in 3D printing and the brittleness of the self-made specimens, further research is needed.


