Article

Research on the Seismic Performance of Precast RCS Composite Joints Considering the Floor Slab Effect

by
Yingchu Zhao
,
Jie Jia
* and
Ziteng Li
College of Civil Engineering and Transportation, Northeast Forestry University, Harbin 150040, China
*
Author to whom correspondence should be addressed.
Appl. Sci. 2025, 15(12), 6669; https://doi.org/10.3390/app15126669
Submission received: 15 May 2025 / Revised: 5 June 2025 / Accepted: 10 June 2025 / Published: 13 June 2025

Abstract

Under the impetus of achieving global sustainable development goals, the civil construction industry is accelerating its transition towards high-quality, green, and low-carbon practices. Prefabricated, modular building technology has become a key tool due to its advantages in energy conservation, emission reduction, and shortened construction periods. However, existing research on the seismic performance of prefabricated, modular, reinforced concrete column–beam (RCS) composite structures often focuses on the construction form of beam–column joints, paying less attention to the impact of floor slabs on the seismic performance of joints during earthquakes. This may make joints a weak link in structural systems’ seismic performance. To address this issue, this paper designs a prefabricated, modular RCS composite joint considering the effect of floor slabs and uses the finite element software ABAQUS 2023 to perform a quasi-static analysis of the joint. The reliability of the method is verified through comparisons with the experimental data. This study examines various aspects, including the joint design and the material’s constitutive relationship settings, focusing on the influence of parameters, such as the axial compression ratio and floor slab concrete strength, on the joint seismic performance. It concludes that the seismic performance of the prefabricated, modular RCS composite joints considering the effect of floor slabs is significantly improved. Considering the composite effect of the slabs, the yield loads in the positive and negative directions for node FJD-0 increased by 78.9% and 70.0%, respectively, compared to that of the slab-free node RCSJ3. The ultimate bearing capacities improved by 13.2% and 9.98%, respectively, and the energy dissipation capacity increased by 23%. Additionally, the variation in the axial load ratio has multiple effects on the seismic performance of the joints. Increasing the slab thickness significantly enhances the seismic performance of the joints under positive loading. The bolt pre-tensioning force has a crucial impact on improving the bearing capacity and overall stiffness of the joints. The reinforcement ratio of the slabs has a notable effect on the seismic performance of the joints under negative loading, while the concrete strength of the slabs has a relatively minor impact on the seismic performance of the joints. Therefore, the reasonable design of these parameters can optimize the seismic performance of joints, providing a theoretical basis and recommendations for engineering application and optimization.

1. Introduction

In the context of global sustainable development strategies and “dual carbon” goals, civil engineering structures in the new era are undergoing a profound transformation towards industrialization and greening. Prefabricated, modular construction technology, with its significant energy-saving and emission reduction benefits, as well as advantages in project duration, has become an important vehicle for new building industrialization [1]. Some studies show that the construction industry accounts for a significant proportion of global terminal energy consumption, and that the level of carbon emissions during the construction phase is also relatively high, which creates an urgent need for the promotion of prefabricated technologies [2]. Among these, the reinforced concrete column–beam (RCS) composite structure achieves a synergistic balance between concretes’ high compressive strength and steels’ superior tensile properties through optimized material configuration [3]. The lifecycle analysis of these materials shows that compared to the traditional cast-in-place frames, this structural form has significant environmental advantages, effectively reducing embodied carbon emission levels. Its modular construction characteristics also demonstrate considerable potential in improving work efficiency. More notably, this structural form has shown unique damage control and rapid repair capabilities in recent earthquake disasters; for example, during the 2016 Ecuador earthquake, the RCS structure demonstrated good seismic performance, with minimal inter-story displacement angles, and the key nodes were quickly repaired after the quake [4]. The new energy-consuming RCS building used in the 2023 Turkey earthquake demonstrated its excellent seismic capacity [5].
In terms of research methods, the ABAQUS nonlinear finite element analysis platform, with its mature concrete damage plasticity model (CDP) and multiple-contact algorithm, provides an effective tool for solving the problem of simulating RCS nodes in a complex stress state [6]. At the same time, the latest developments in multi-scale modeling technology (such as the embedded reinforcement constitutive model) have significantly improved the simulation accuracy of the longitudinal reinforcement bonding slip effect, which is also crucial for the analysis of the core force of nodes.
However, the current construction industry still faces severe challenges, such as high energy consumption and high-level pollution, caused by traditional cast-in-place construction. Although prefabricated, modular RCS structures are considered a solution by many scholars, the key technical bottleneck lies in the reliability of the node connections. Extensive research has been conducted both domestically and internationally; this includes early studies on the beam-through and column-through node methods by Japanese scholars. The scholars Parrar-Montesinos and Weight in the United States conducted low-cycle repeated loading tests on several proportional RCS composite frame edge joints to investigate the effects of joint construction and other factors on the seismic performance of RCS edge joints [7,8]. The Chinese researcher Xu Jindong and others employed experiments and finite element simulation to analyze the steel–concrete composite joints of concrete-filled steel tube columns and steel beams under the influence of floor assembly [9]. Wang Jingfeng et al. in China conducted experimental simulation and seismic performance research on the single-sided bolted connection of a hollow core steel tube, a concrete column, and a column node considering the floor [10]. These represent the advanced research and outstanding discoveries of experts and scholars in the field of civil engineering throughout history, guiding us to explore and learn even more diligently. However, there are two significant limitations in analysis and research: First, over half of the existing studies focus on optimizing the construction of beam–column joints, while severely neglecting the critical factor of floor slab interaction effects. The experimental data from Zhong Weihui et al. show that considering the floor slab interaction effect increases the peak load-bearing capacity of beam mechanisms by more than 40% compared to that of specimens without floor slabs, and increases the peak load-bearing capacity of catenary mechanisms by nearly 50% [11]. Secondly, a systematic understanding of the stiffness degradation mechanism and the failure mode of semi-rigid joints with high-strength bolt connections under seismic action is still lacking. Bahman Farahmand Azar et al. conducted a nonlinear static analysis to investigate the seismic performance of RCS frames, highlighting the influence of node deformation on the overall structural behavior [12]. Recent vibration test results have shown that when a floor slab is involved, the rate of bolt preload loss increases more significantly compared to conditions without a floor slab. This time-varying characteristic has a significant effect on the seismic performance of the structure [13].
In response to the aforementioned critical issues, this paper innovatively establishes a refined analysis model for RCS nodes that considers the composite effect of floor slabs. By integrating core research content such as using high-strength bolt connections and considering the shear force transmission mechanism of shear studs under real slab composite effects, this study systematically analyzes the curve influence patterns of key parameters like the axial compression ratio, bolt preload, and reinforcement ratio. The research employs a combination of experimental verification and numerical simulation to validate the reliability of the model, followed by comparative parameter analysis. Ultimately, it constructs an earthquake-resistant design method for nodes that takes into account the floor slab effect, achieving a multi-scale correlation analysis of the micro-mechanism to macro-response, providing a parametric optimization approach for prefabricated composite structure design. We hope these findings and analyses will fill the gap in existing standards regarding composite node design, offering robust technical support for the safe construction of prefabricated buildings in high-seismic zones, and promoting advancements in this structural form in the field of seismic resistance [14,15].

2. Finite Element Model of Prefabricated Modular RCS Composite Node

2.1. Overview of Node Design

2.1.1. Mechanical Properties of Materials

The material properties of the finite element model in this paper are defined based on the experimental data in relevant literature [16]. The performance tests for concrete and steel are conducted in accordance with the “Standard Test Methods for Mechanical Properties of Ordinary Concrete” (GB/T 50081-2002) and the “Room Temperature Tensile Test Methods for Metallic Materials” (GB/T 228-2002) [17,18], respectively. The test results show that the compressive strength of the C30 concrete cube sample used in the prefabricated RCS node RCSJ3 without a floor slab is 30.2 MPa, and the material mechanical properties of steel are shown in Table 1.

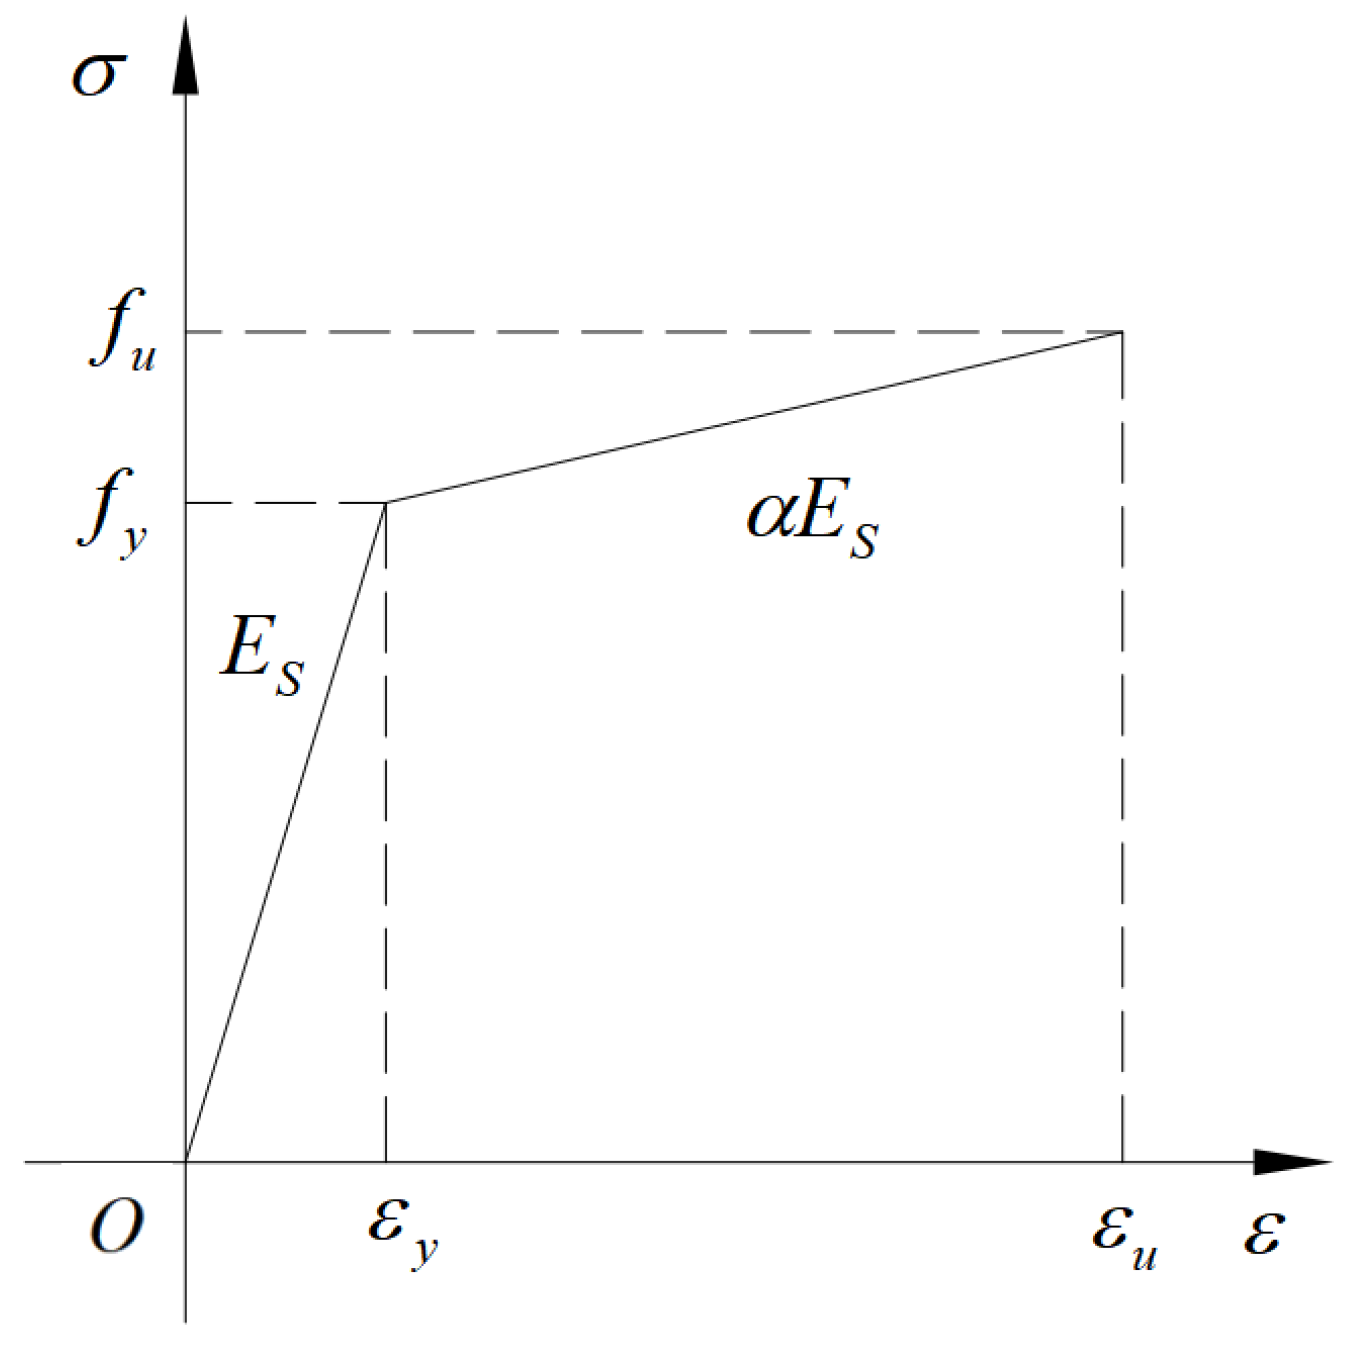
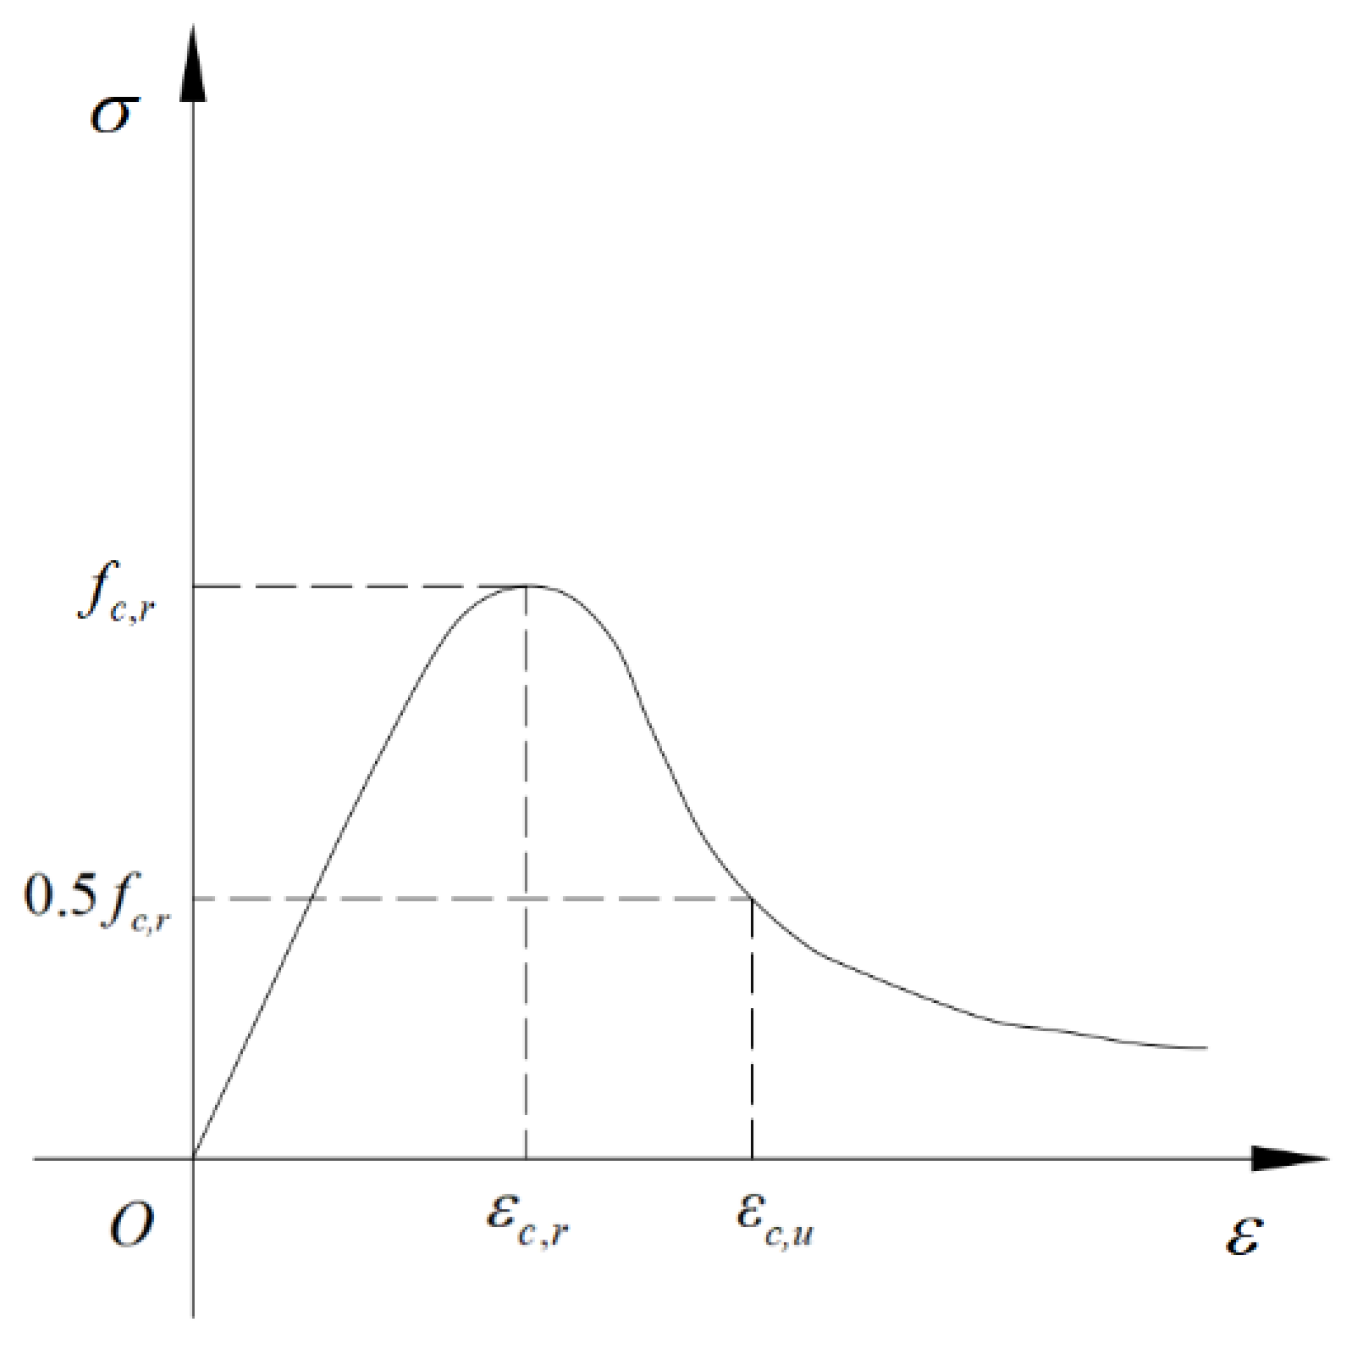
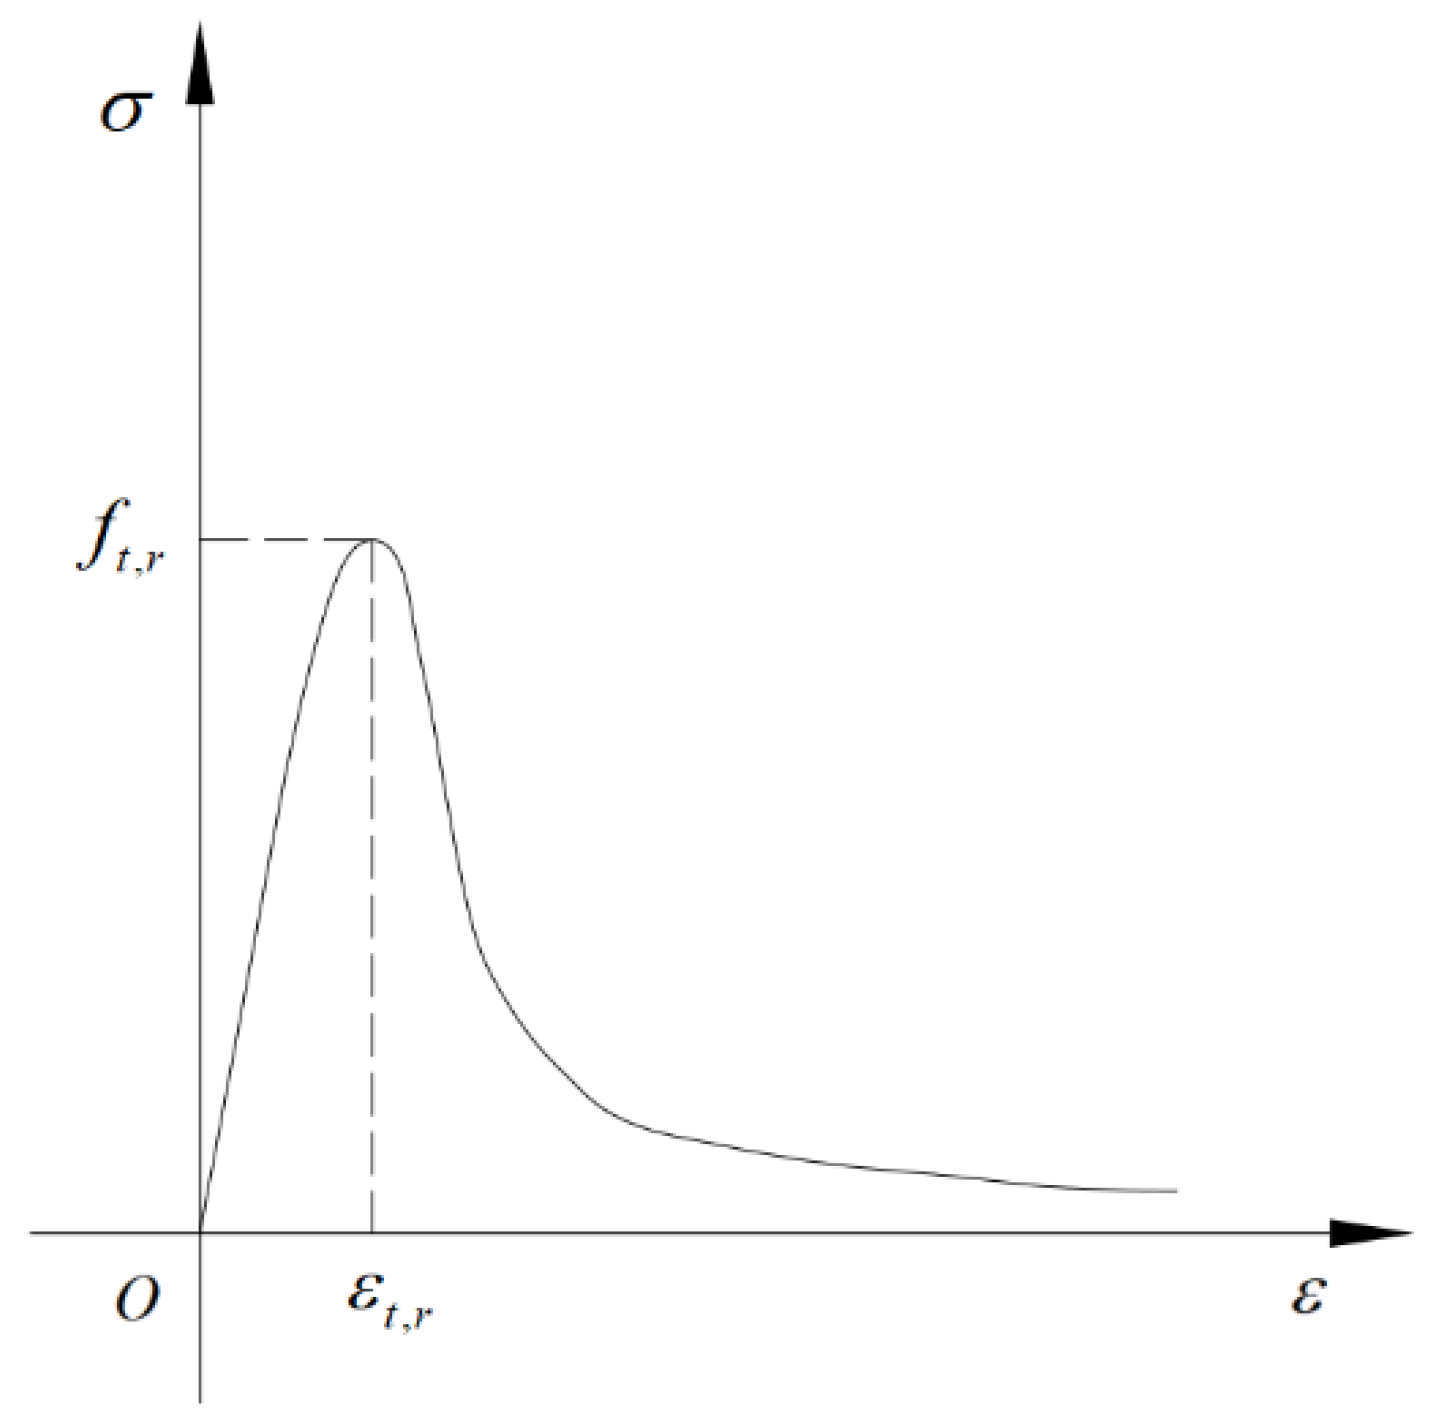
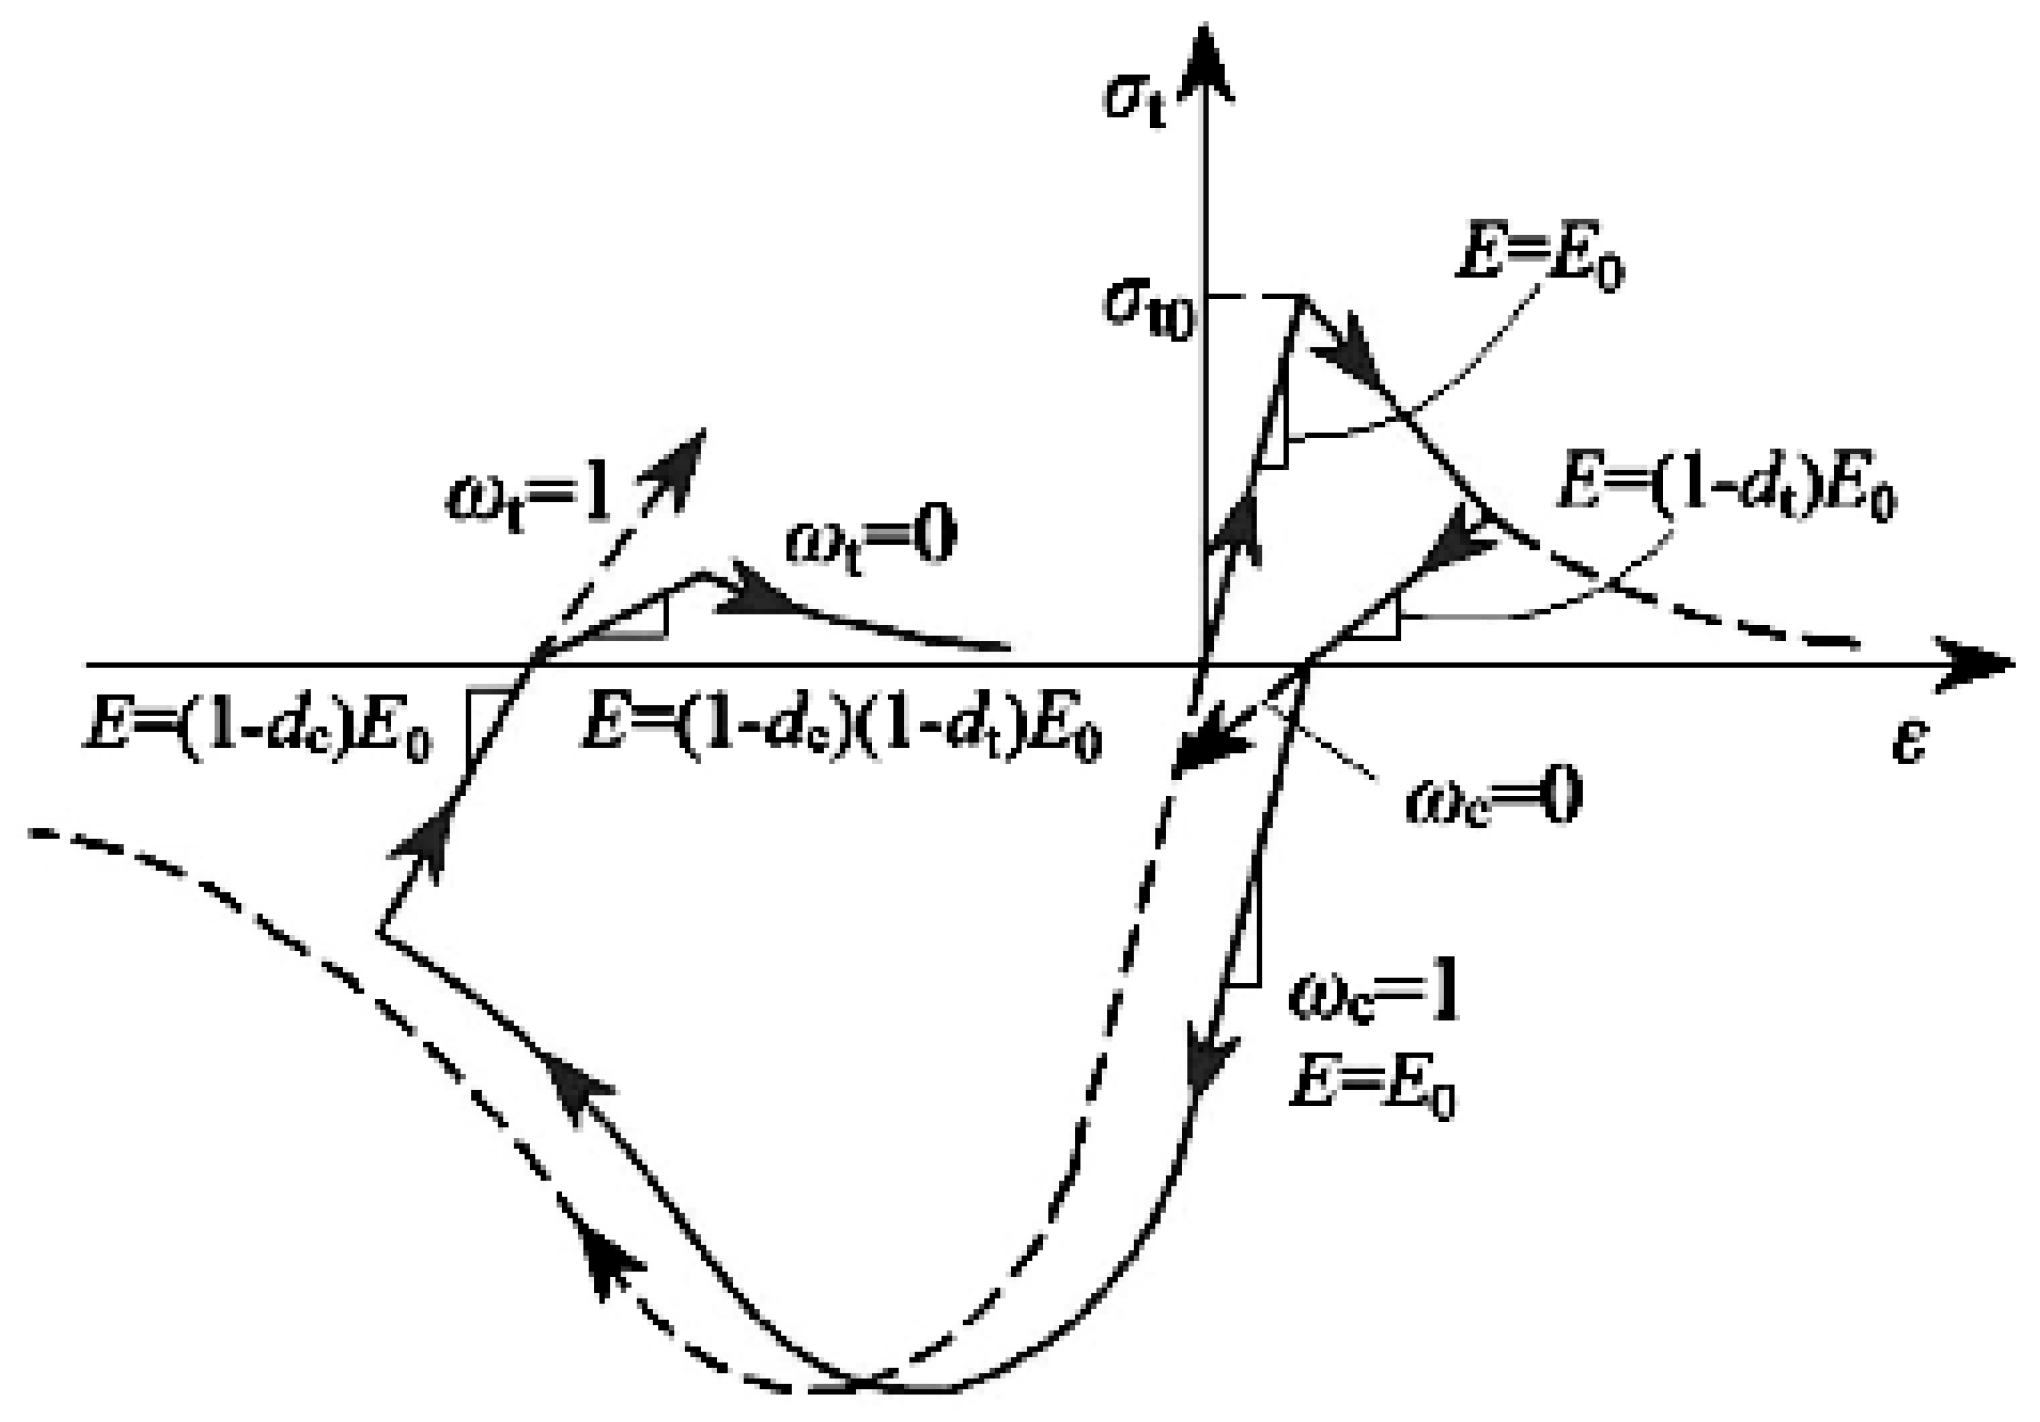
2.1.2. The Constitutive Relationship of Steel, Bolt Material and Concrete

In this paper, the elastic–plastic behavior of steel is defined in ABAQUS as follows: during the small deformation loading stage, it exhibits linear elasticity; after exceeding the yield point, stiffness decreases, and strain is divided into elastic and plastic components. At the end of unloading, elastic strain disappears, and plastic strain is irrecoverable; when reloading, the yield stress increases. The constitutive relations for the steel columns and beams are modeled using the double broken-line model based on experimental data. The Mises yield criterion and the dynamic strengthening criterion are applied [19], assuming that the Young’s modulus is the same in both the tension and compression directions, and that the stress–strain curve is linear. This setting effectively simulates the mechanical behavior of steel in different loading stages and provides reliable theoretical help for the subsequent analysis.
In the figure, E s represents the Young’s modulus of the steel and high-strength bolts, with a Poisson’s ratio of 0.3. f y denotes the yield strength of the steel. α E s refers to the modulus in the strengthening phase of the steel, f u indicates the tensile strength of the steel and ε u represents the tensile strength strain, α = 0.01 , as shown in Equation (1). The specific constitutive relationship curve of the steel material is shown in Figure 1.
ε u = f y E S + ( f u f y ) α E s
This paper studies the plastic model of concrete damage based on ABAQUS software [20]. The model is suitable for monotonic and repetitive loading, with good convergence, making it particularly appropriate for simulating the behavior of concrete structures under low-frequency repetitive loads. Although ABAQUS provides various concrete constitutive models, it does not specify the stress–strain relationship of concrete, which needs to be defined independently. Therefore, given that the constitutive relationship of concrete has not yet been unified, this paper refers to the “Code for Design of Concrete Structures” (GB50010-2010) [21]. The single-axis compressive and tensile stress–strain relationship curves define the relevant equations (Figure 2 and Figure 3). The following equations describe in detail the behavior of concrete under different stress states, including the stress–strain relationship under compression and tension, as well as the method used for calculating damage factors.
Under compression, the stress–strain relationship of concrete is given by Equations (2)–(5), which include key parameters such as the uniaxial compressive strength, peak tensile strain, and damage evolution parameters. Under tension, the stress–strain relationship is described by Equations (6)–(9), involving similar parameters. These equations and parameters together form the mechanical behavior model of concrete under different loading conditions. Additionally, this paper is based on the principle of Sidiroff energy equivalence [22]. The formula (10) for calculating the tensile and compressive damage factors of concrete was derived. These damage factors are crucial for simulating the damage evolution and stiffness recovery characteristics of concrete under repeated loads, and can more accurately reflect the actual behavior of concrete materials. The illustrative diagram is shown in Figure 4 below.
Through these detailed models and equations, we aim to provide a reliable theoretical basis and numerical simulation method for the performance analysis of concrete structures under complex loading conditions, so as to promote the in-depth understanding and application of concrete materials and structures in civil engineering [23].
σ = ( 1 d c ) E c ε
d c = 1 ρ c n n 1 + x n x 1 1 ρ c α c ( x 1 ) 2 + x x > 1
ρ c = f c , r E c ε c , r
n = E c ε c , r E c ε c , r f c , r
where α c is the parameter value of the decreasing section of the single-axis tensile stress–strain curve of concrete; f c , r is the representative value of the single-axis tensile strength of concrete; ε c , r is the representative value of the single-axis tensile strength representing the peak tensile strain of the concrete; and d c is the concrete uniaxial tensile damage evolution parameters.
Equation for uniaxial tensile stress–strain relationship of concrete.
σ = ( 1 d t ) E c ε
d t = 1 ρ t ( 1.2 0.2 x 5 ) x 1 1 ρ t α t ( x 1 ) 1.7 + x x > 1
x = ε ε t , r
ρ t = f t , r E c ε t , r
where α t is the parameter value of the decreasing section of the single-axis tensile stress-strain curve of concrete; f t , r is the representative value of the uniaxial tensile strength of concrete; ε t , r is the representative value of the single-axis tensile strength that represents the peak tensile strain of the concrete; and d t is the concrete’s uniaxial tensile damage evolution parameters.
d = 1 σ ( E 0 ε )
where d is the concrete damage factor; σ is the true stress of concrete; ε is the true strain of concrete; and E 0 is the initial elastic modulus of concrete.
When analyzing with ABAQUS, the concrete plastic damage model requires the setting of five material parameters, which are the dilation angle, offset value, viscosity coefficient, biaxial to uniaxial initial yield strength ratio, and the ratio of the second stress invariant on the tensile and compressive meridians. This is shown in Table 2 below.

2.1.3. Node Design

To accurately assess the actual load-bearing performance, this study follows the “Building Seismic Design Code” and the “Design Code for Composite Structures [24,25]. The selected side node is the prefabricated assembled RCS composite beam and column node (Figure 5). The node is located at the anti-bending point of the beam and column, and the forces include N (concrete column axial force), V (beam anti-bending point shear force), and P (column anti-bending point shear force).
According to the experimental conclusions in the literature [26], increasing the thickness of the lateral cover layer significantly enhances the anchorage strength of hooked steel bars and reduces the risk of concrete cracking in the core area of the joint. This design employs reasonable arrangements of shear studs, with longitudinal bars symmetrically arranged within the column using HRB335 bars and stirrups made of HPB235 bars with a spacing of 100 mm. The core area of the concrete column node adopts a new construction form known as “field steel plate” and is welded to prefabricated short beams, ensuring coordinated work between the floor slab and steel beams, further improving the overall performance of the node. The relevant material parameters are listed in Table 3 [27].

2.2. Finite Element Analysis and Verification of Prefabricated RCS Composite Joints

We used ABAQUS software to perform finite element analysis on the prefabricated modular reinforced concrete column–steel beam composite node. The stress distribution of the concrete, steel beams, and connecting components was simulated using an eight-node three-dimensional solid element C3D8R. The internal reinforcement in the concrete was modeled using a two-node linear truss element T3D2. To improve computational accuracy, the mesh was densified in the node area and at the steel beam connections, with specific dimensions of 50 mm for the concrete and steel beams, 30 mm for the connecting steel plates, and 10 mm for bolts. Figure 6 shows the meshing details.
In the ABAQUS finite element analysis software, the analysis step module provides functional components for defining the analysis steps, setting result output parameters, and monitoring the solution process. In this study, the load application on the prefabricated RCS nodes consists of three main aspects: first, the application of pre-tension for high-strength bolts; second, the axial force applied to the column components; and finally, the low-cycle cyclic load applied at the ends of the beams. The entire analysis process includes six independent analysis steps, namely Initial, Step 1 to Step 5. In each analysis step, the geometric nonlinearity calculation option is enabled to account for deformation effects.
In the initial analysis step (Initial), temporary fixed boundary conditions are applied to keep the various components of the node in their initial fixed state during assembly. Subsequently, in Step 1, an initial pre-tension of 5 Kn is applied to the bolts. In Step 2, the pre-tension of the bolts is gradually increased to 155 Kn. In Step 3, the current length of the fixed bolts is selected to maintain their pre-tension state. Following this, in Step 4, the temporary boundary conditions for the bolts are removed, and axial pressure is applied at the top of the column. Finally, in Step 5, a cyclic displacement load is applied to the reference point at the ends of the beams (refer to JGJ 82-2011) [28].
In the model, contact between components is defined through the Interaction module. The contact between the core area reinforcement cage and concrete is handled using the Embedded Region command. Surface contact is set between the steel beams, high-strength bolts, and pressure-bearing steel plates, with the stiffer surface being the primary contact surface, and the friction coefficient is 0.35 (Figure 7). The loading steps include initial boundary setting, a gradual increase in the bolt preload, and setting the column axis and applying cyclic load at beam ends; the loading and boundary conditions are adjusted according to the test conditions.
To minimize the stress concentration and enhance the effectiveness of load application, reference points RP-1, RP-2, and RP-3 are established at the center of the column bottom of the RCS combination node, the center of the column top, and the loading center at the beam end, respectively. These reference points are connected to the loading surfaces, allowing for the application of constraints and loads at each of the three points. Additionally, to avoid instability and torsional effects at the beam end during loading, constraints are imposed on the y-direction displacement as well as the rotation angles in the x and z directions at the beam end loading point via the coupling point RP-3 (U2 = 0, UR1 = 0, UR3 = 0).
To verify the effectiveness of the finite element model, the simulation results were compared with experimental data. The failure mode at the nodes showed that the maximum stress at the high-strength bolt was 990 MPa and that the maximum stress in the steel beam and core plate was 420 MPa, which is consistent with the experimental observations. Although there are minor differences, it is preliminarily assumed that these differences are due to initial defects and slip phenomena in the specimens, indicating that the finite element model has reference value (Figure 8). In reference [29], the study on reinforced T-shaped CFST column–steel beam joints verified the model’s reliability through comparisons between finite element simulations and experimental data. In addition, based on the stress distribution of the simulated nodes, the stress values in the steel beams are uniformly distributed between 155 MPa and 285 MPa. The average errors in initial stiffness and ultimate load capacity met the required standards, similar to the validation presented in this paper, further confirming the effectiveness and accuracy of the finite element model in joint studies.
The hysteretic curve reflects the behavior of the structure under repeated loading, with the simulation results consistent with the experimental trends, demonstrating excellent seismic performance. The finite element model did not exhibit significant shrinkage, due to the loosening between components in the experiment. The skeleton curves evaluate the mechanical properties of components at different load stages, and both the simulation and experimental skeleton curves are effective. As loading increases, stiffness degradation becomes more pronounced, but the two curves remain consistent (Figure 9).
The analysis of stiffness degradation generally reflects the degradation of node stiffness by examining the variation in the loop stiffness under the condition of uniform displacement, as expressed by the following Formula (11).
K j = i = 1 n P j i i = 1 n Δ j i
where K j is the loop stiffness under the j-th level of loading, measured in Kn/m;
p j i is the maximum load during the i-th cycle under the j-th level of loading;
Δ j i is the maximum displacement during the i-th cycle under the j-th level of loading;
n is the number of loading cycles.
Through the above comparison and analysis, it appears that the flanges of steel beams and the pressure-bearing steel plates are buckled when the nodes are destroyed, and the bolt holes gradually expand. The plastic hinges and the location of damage are consistent with the test results. The method of verifying the finite element model in this study is similar to that in the literature [30], where the C3D8R element was used to simulate concrete and steel beams, and the model reliability was verified through the comparison of hysteretic curves and skeleton curves. The results indicate that the difference in the bearing capacity between the simulations and experiments is less than 9%, and that the pattern in the degradation of node stiffness is consistent. These findings support the effectiveness and reliability of the finite element model, laying a foundation for our subsequent seismic performance analysis.

3. Seismic Performance of RCS Composite Joints Under Floor Effect

Based on the specifications, a floor slab is designed for node FJD-0 (Figure 10), with dimensions of 1315 mm × 1040 mm and a thickness of 100 mm. The concrete strength is C25, and it contains double-layer HRB355 reinforcement with a diameter of 10 mm and a spacing of 100 mm, with a reinforcement ratio of 1.1 2%. The cover thickness is 20 mm. To coordinate the performance of the floor slab and steel beams, double-row shear studs are designed, using arc weld studs with a diameter of 16 mm and a height of 80 mm. According to Formula (12)–(14), 14 studs are required, and their spacing is reasonable.
n f = V s / N v c
N v c = 0.43 A s E c f c 0.7 A s f u
V s = min A f , b e h c f c + A s t f s t
where V s is the longitudinal shear force in the cross section; N v c is the design value of the shear bearing capacity of the anchor bolt; E c is the concrete’s elastic modulus; b e is the effective width of the steel beam; h c is the floor thickness; f is the tensile strength of the steel beam; f c is the design value of the concrete’s compressive strength; f s t is the tensile strength of the steel bar; f u is the design value of the ultimate tensile strength of the cylindrical head rivet; A s is the section area of the anchor bolt; A is the section area of the steel beam.
In the model, the contact between each component is simplified to ensure the convergence of calculation. The specific settings are as follows:
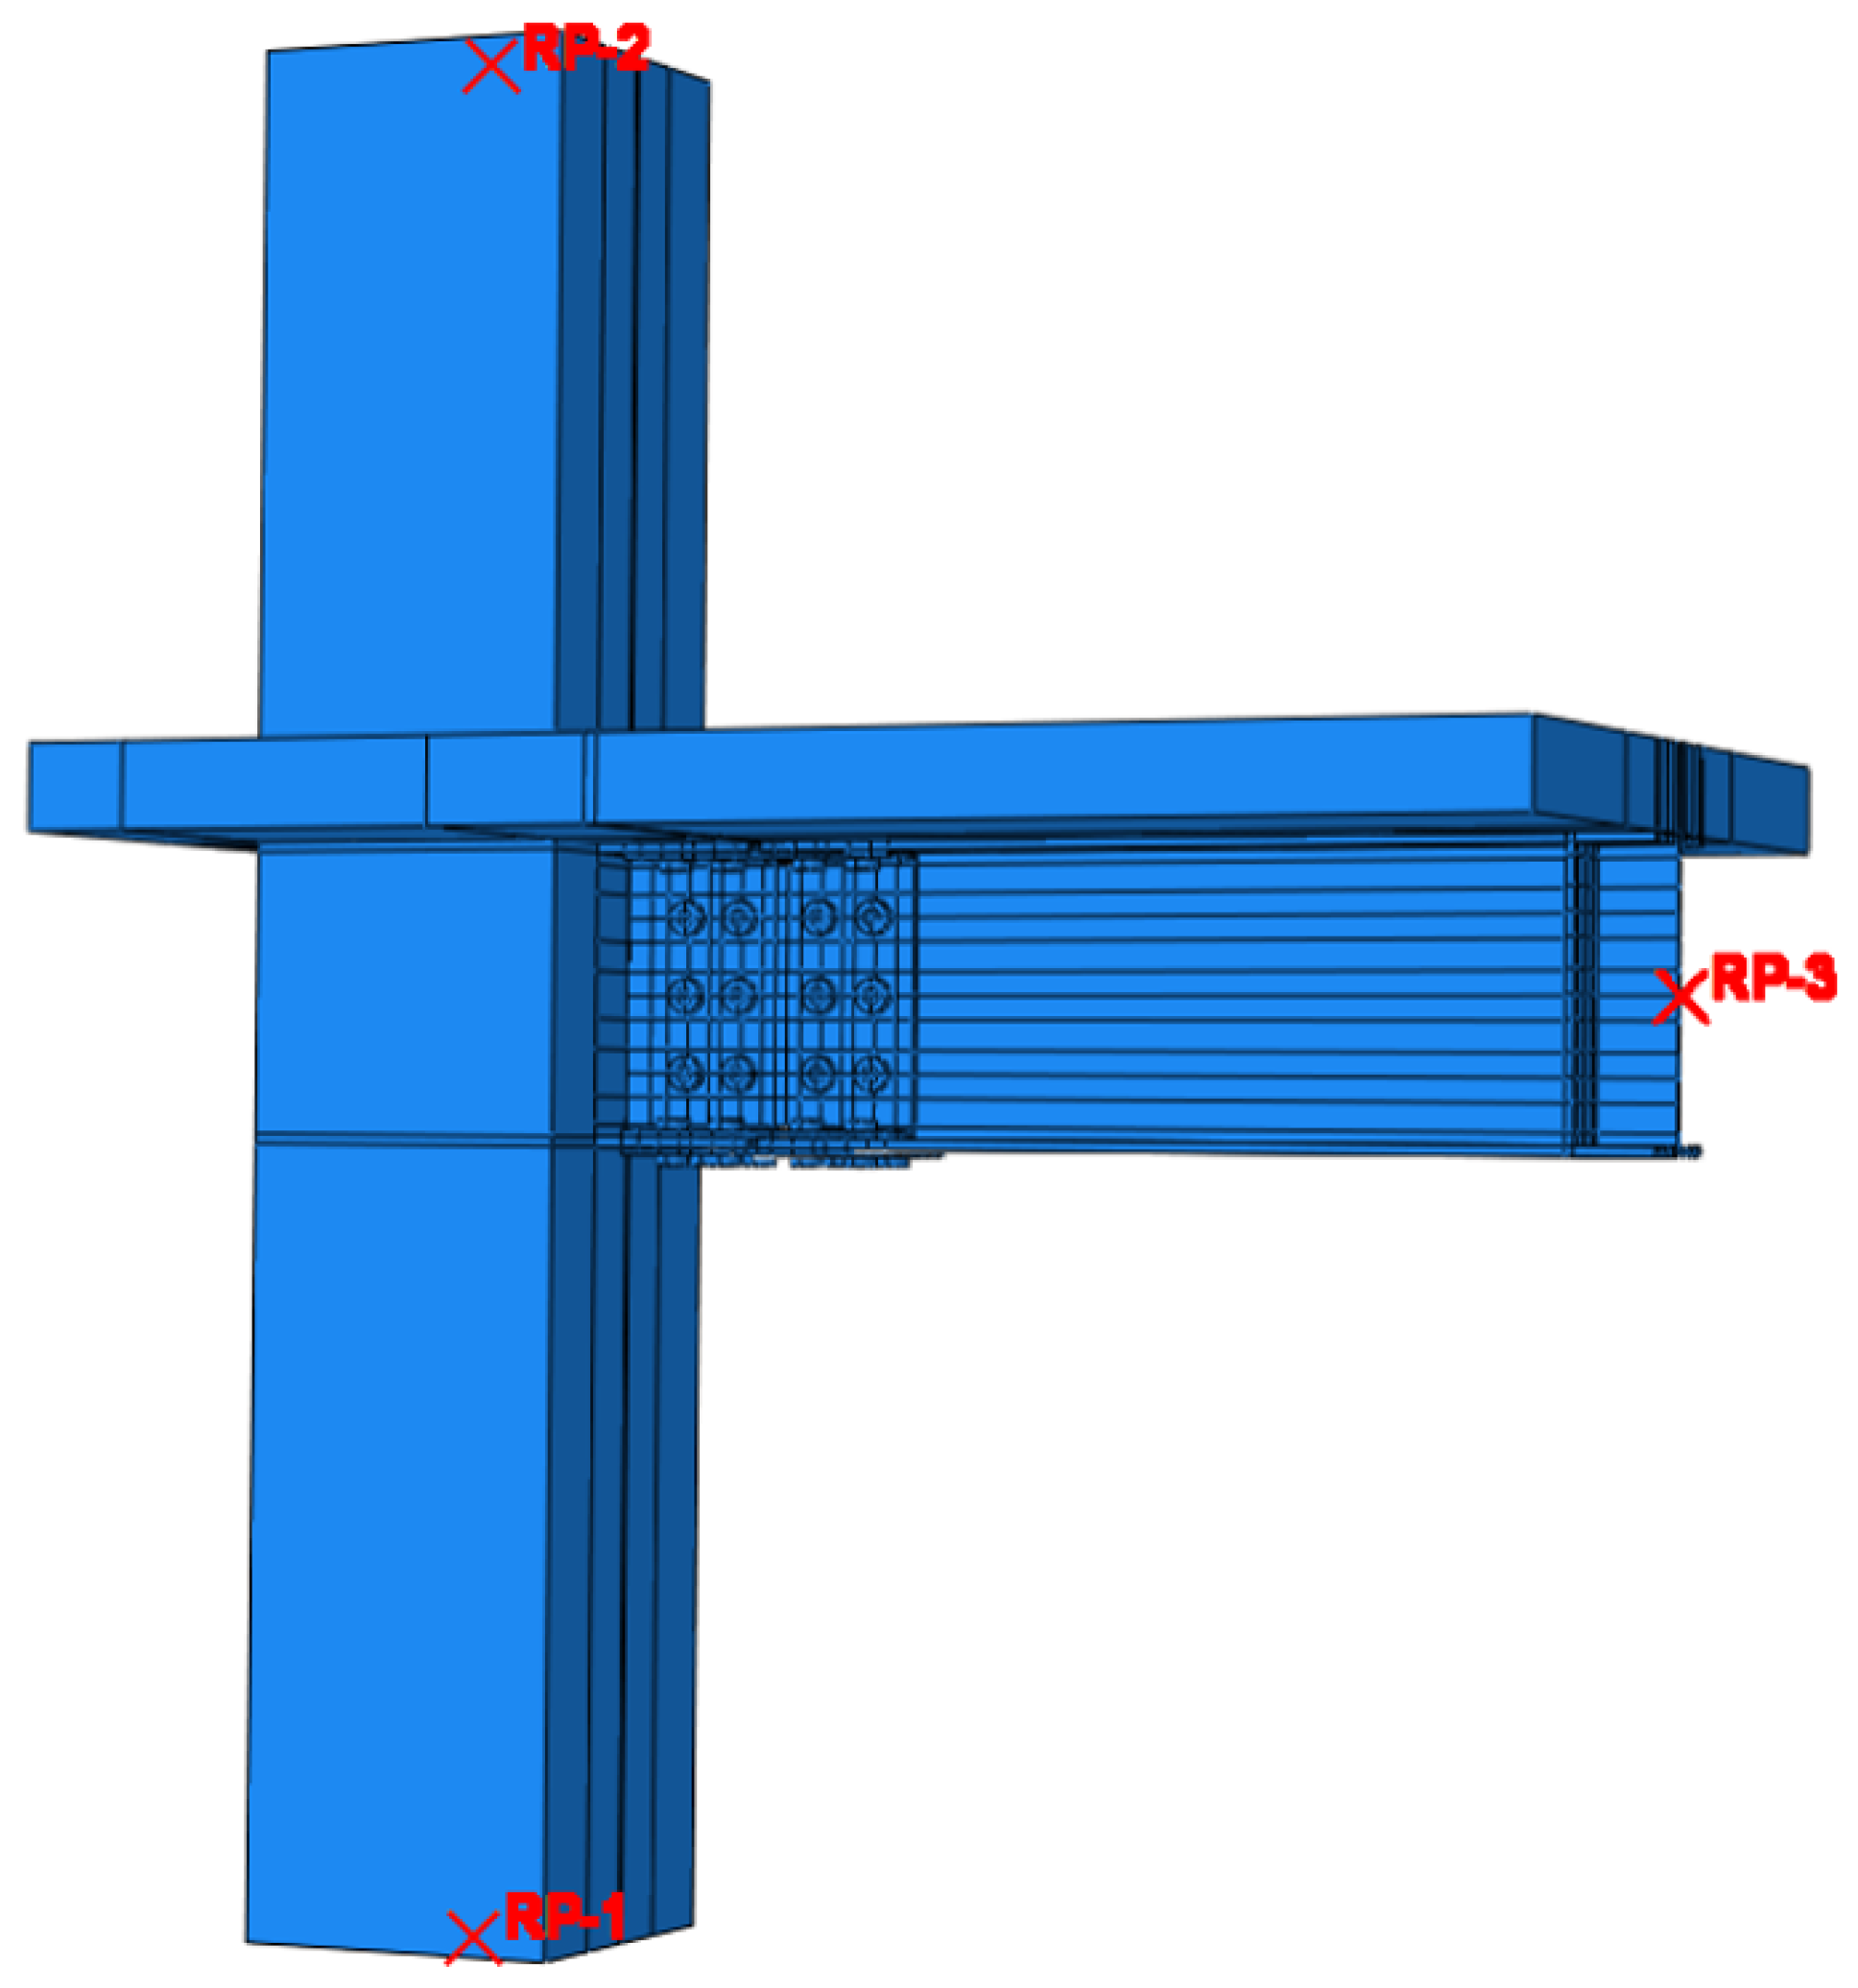
  • The concrete floor is bound to the column Tie;
  • The reinforcing bars in the floor slab are combined into a reinforcing bar layer and embedded in the concrete area;
  • The rivet contacts the tie binding the bottom of the floor slab with the upper flange of the steel beam. The finite element model of node FJD-0 is shown in Figure 11.
In addition, the strength degradation calculation is given by Formula (15).
λ j = P j P m a x
where λ j is the overall strength degradation coefficient; P j is the peak load value of each level of cyclic loading; and P m a x is the peak load value of the entire loading process.
Node FJD-0 exhibits a uniform stress distribution under low cyclic loading, with a concentration of stress at the flange connection and the significant deformation of the steel beam bolt holes. The neutral axis shifts upward, leading to increased tensile stress. Failure is characterized by buckling and plastic hinges, consistent with the “strong column, weak beam” design principle. Concrete slab damage extends from the node to the distal end, with stress concentrated at the root of the connection (Figure 12).
By comparing the hysteresis curves, skeleton curves, stiffness degradation, and strength degradation of the prefabricated assembled RCS joint RCSJ3 without slab effects and the combined joint FJD-0 considering slab effects, it is evident that FJD-0 exhibits a higher peak load, stiffness, and ductility. Additionally, its energy dissipation capacity is enhanced, along with an overall increase in the stiffness of the combined joint, which improves its ability to resist strength degradation. This indicates that the presence of the slab significantly enhances the load-bearing capacity of the joint. For specific data, please refer to Figure 13 and Figure 14.
From the above research, we can draw the following conclusions:
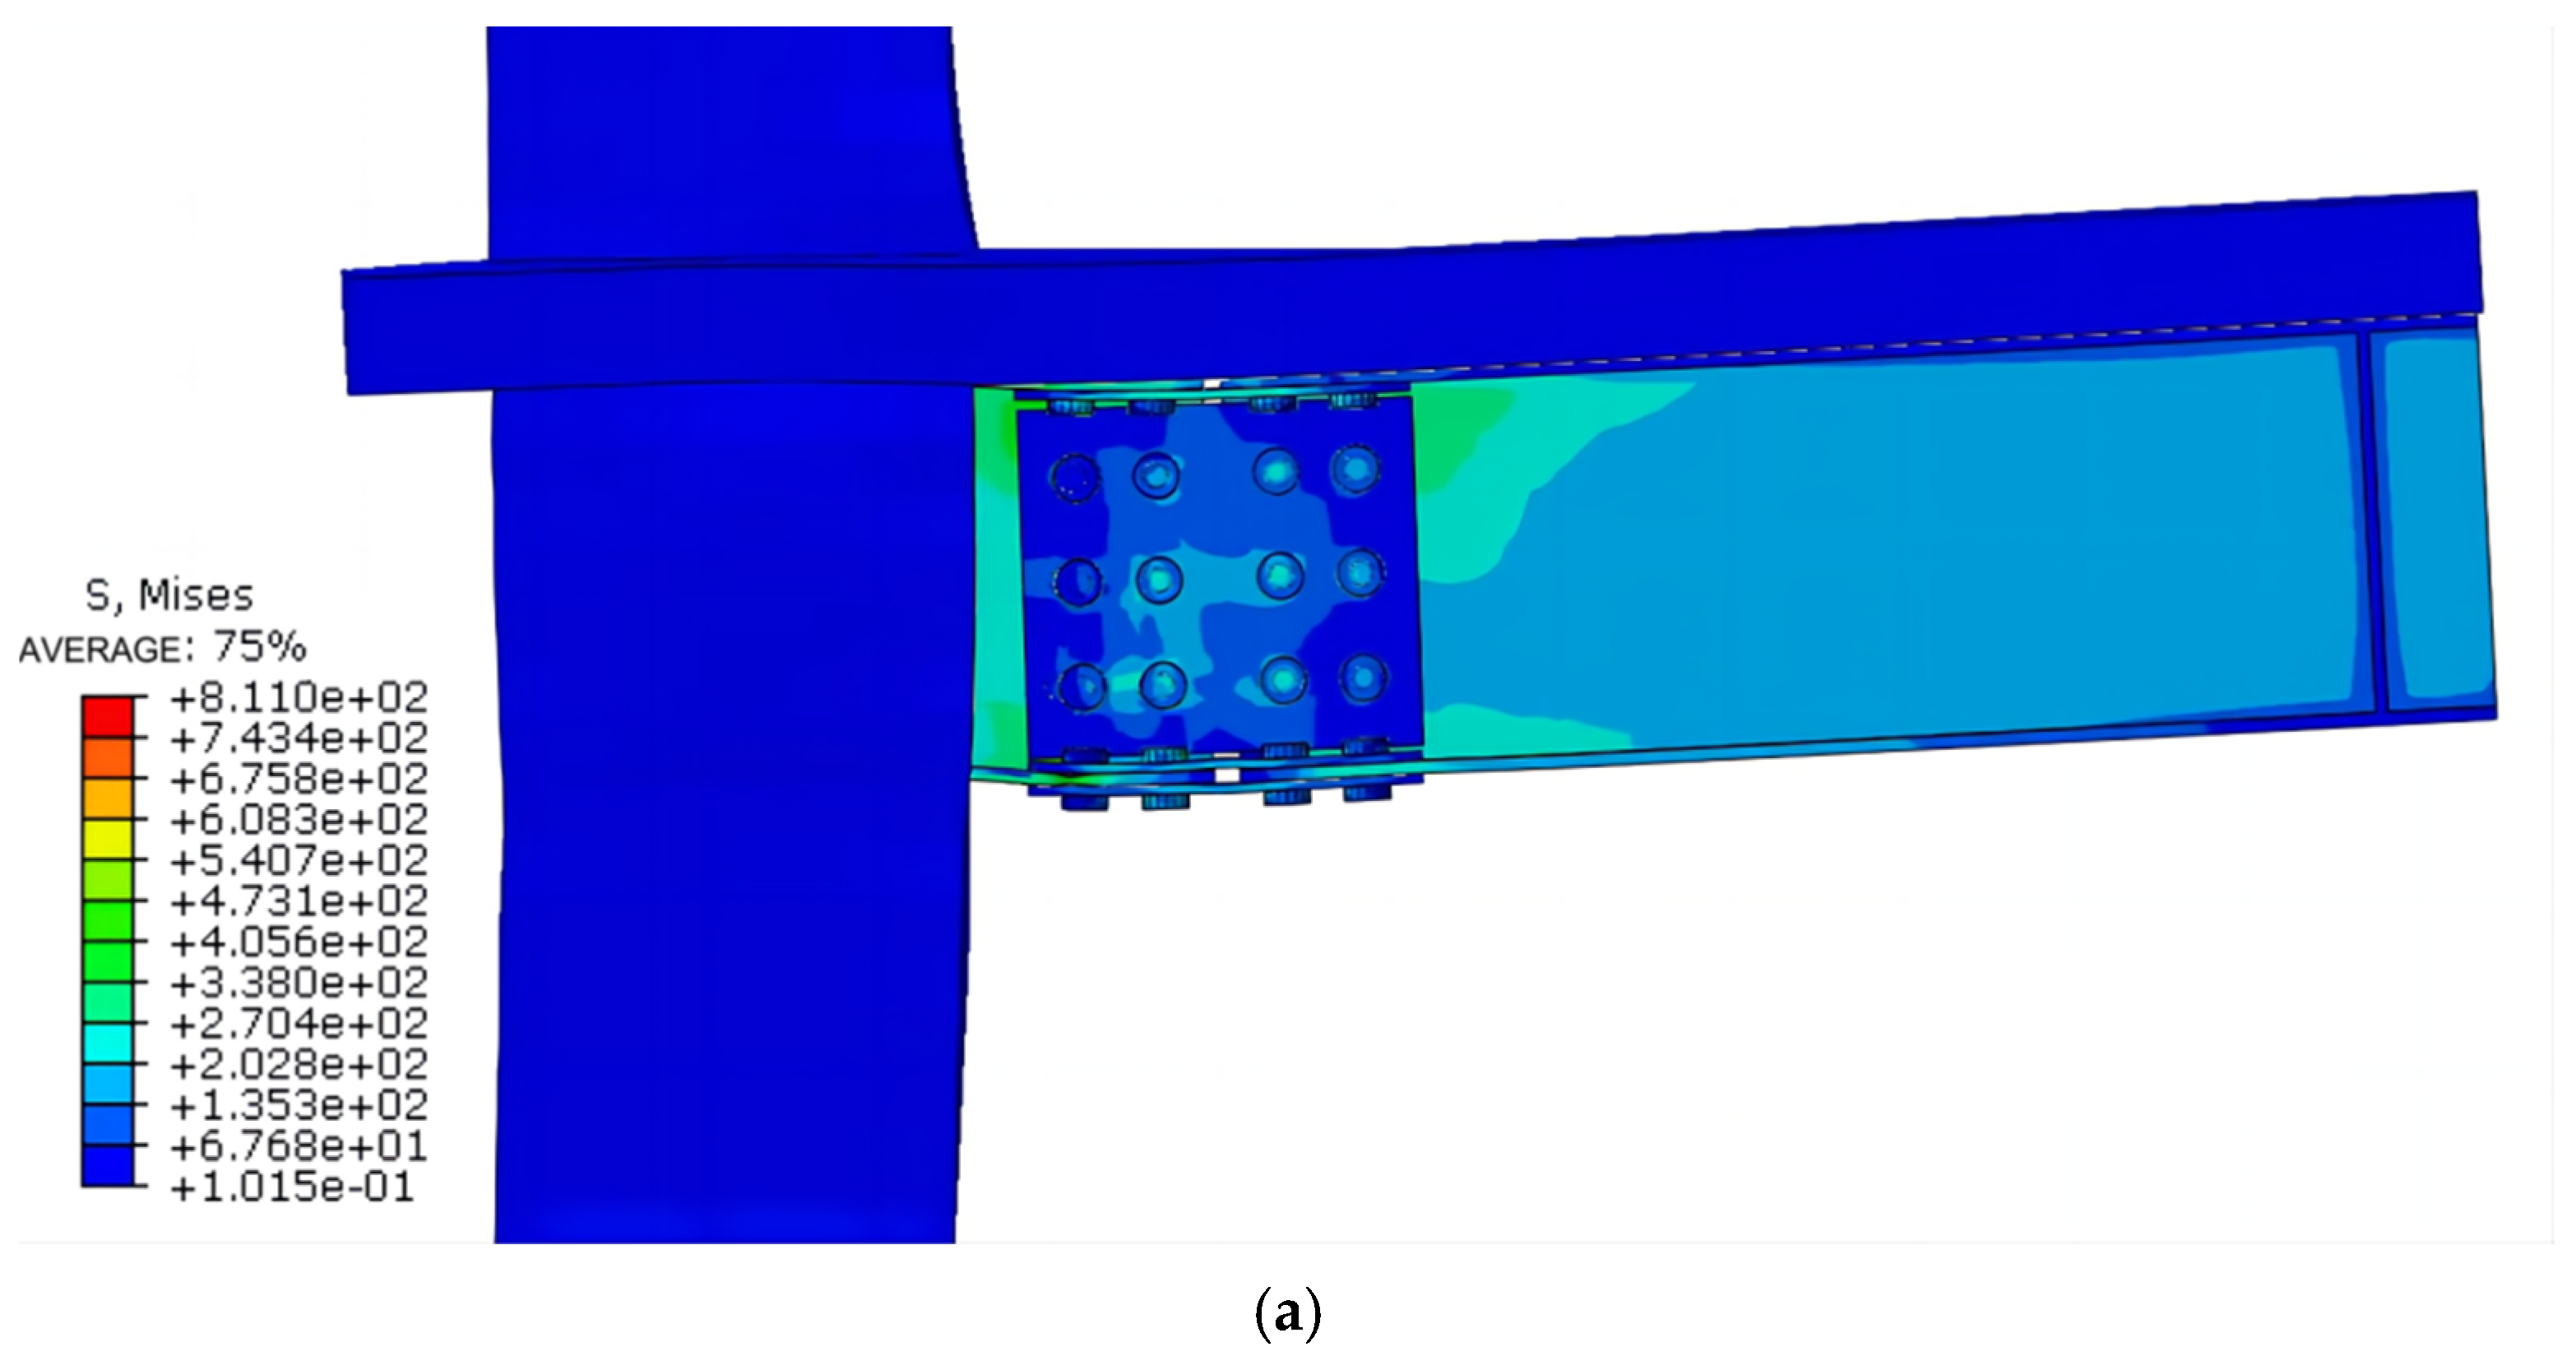
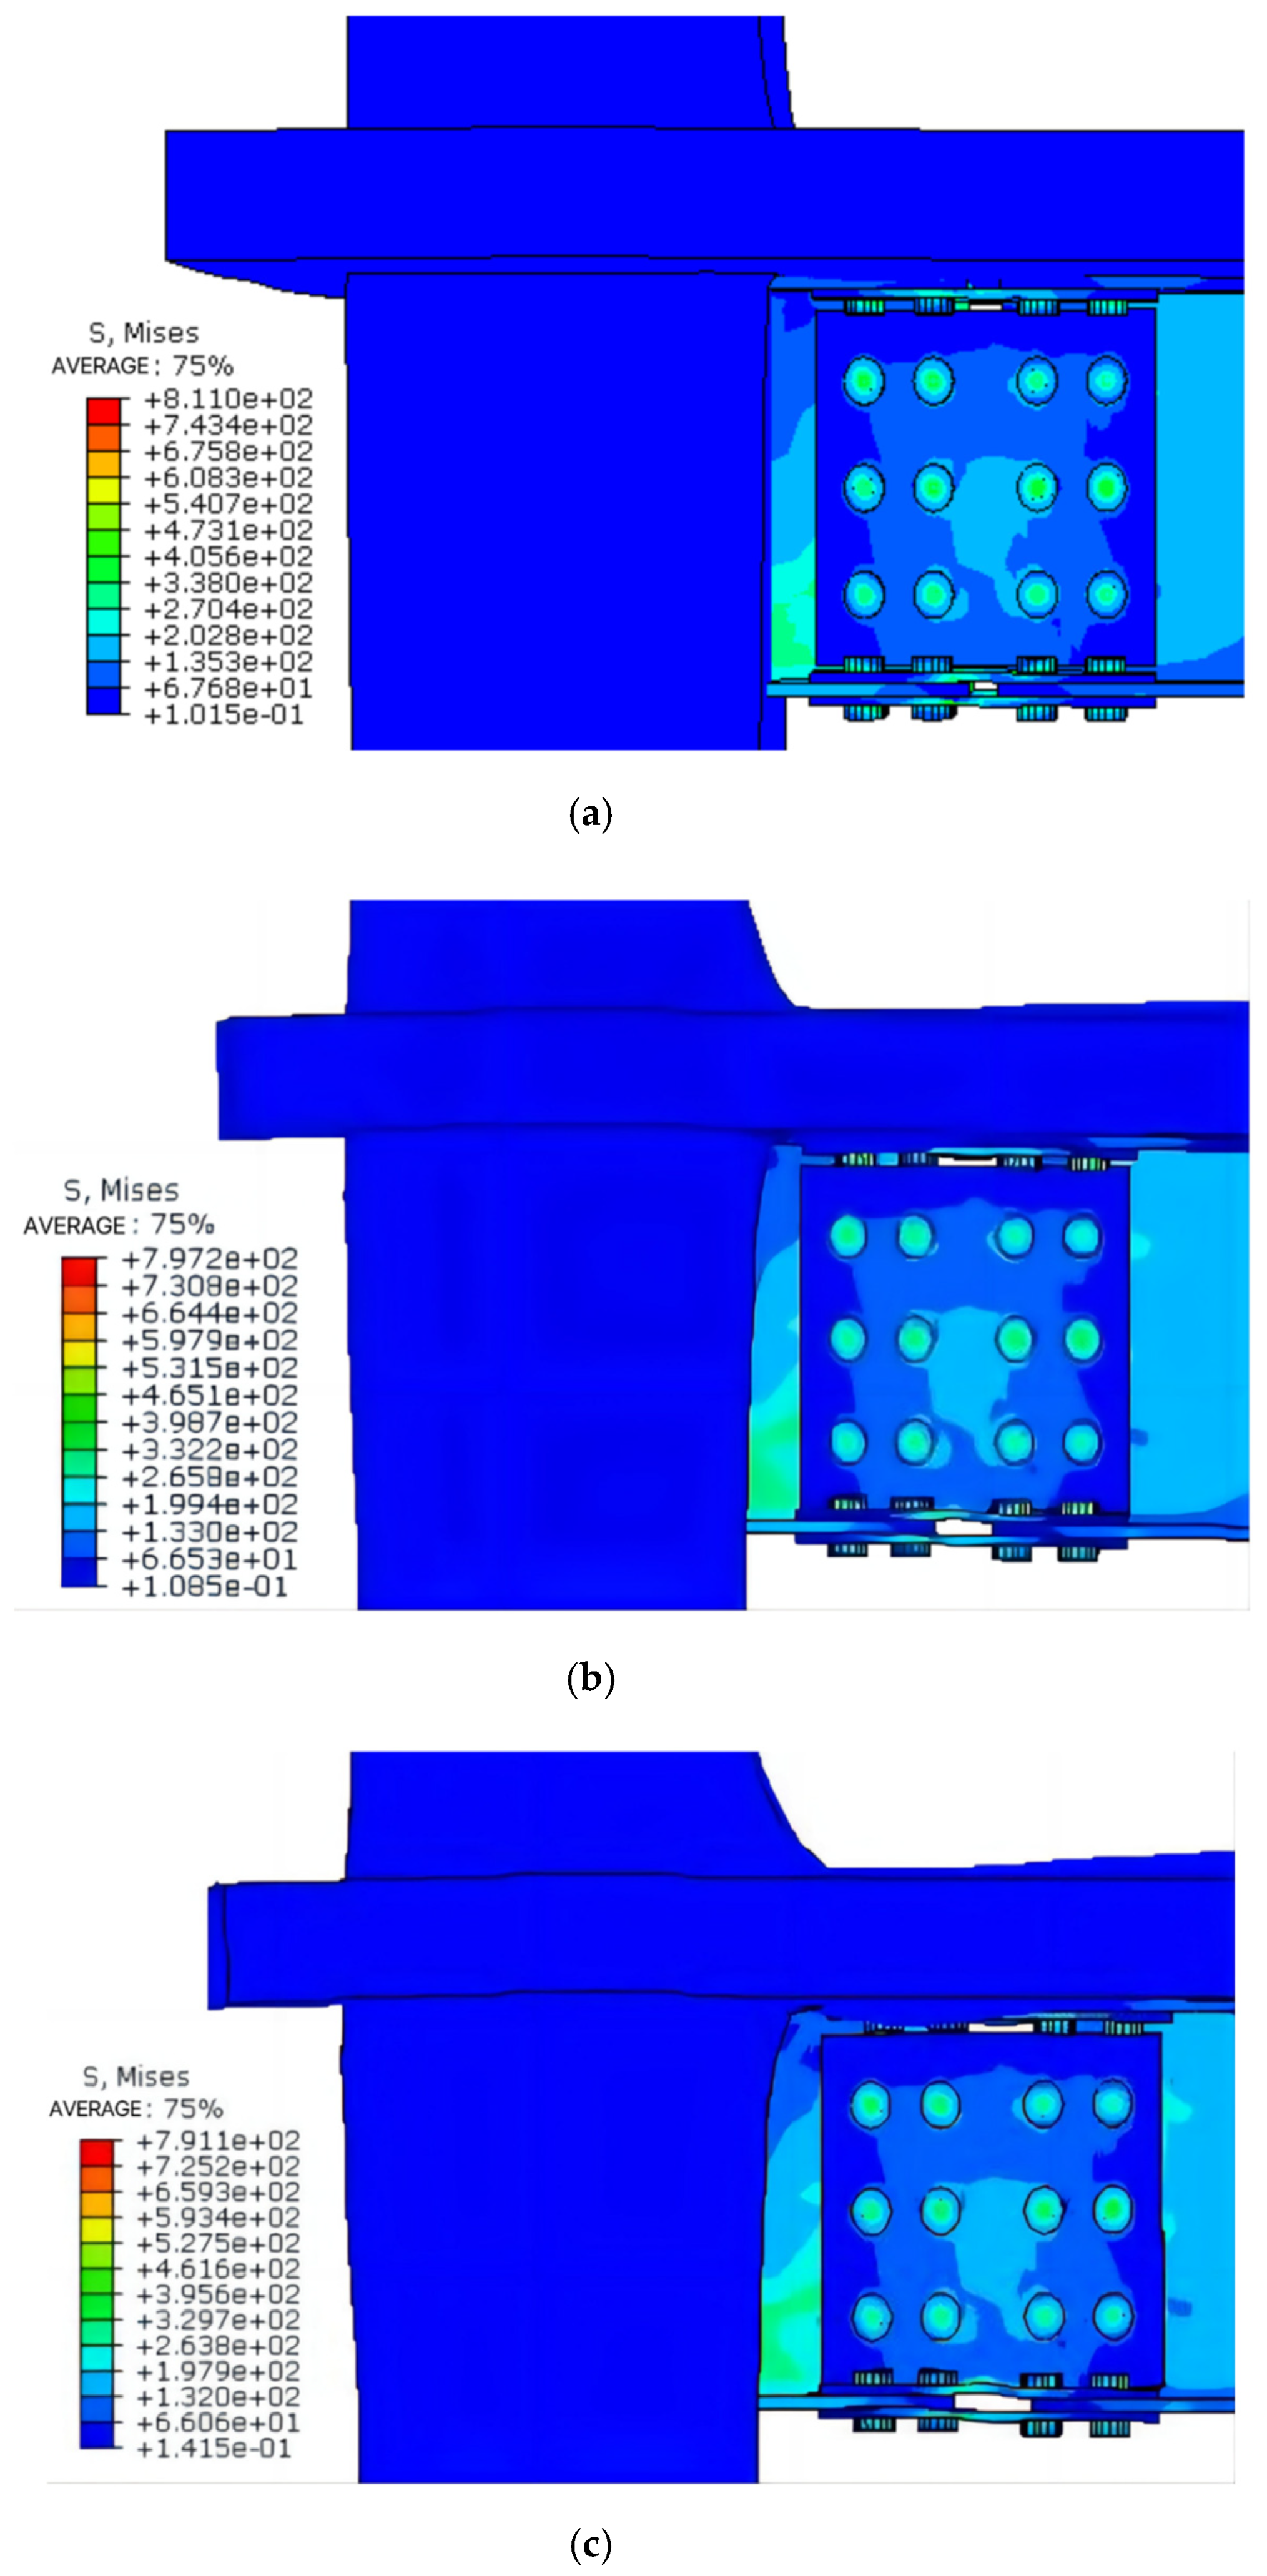
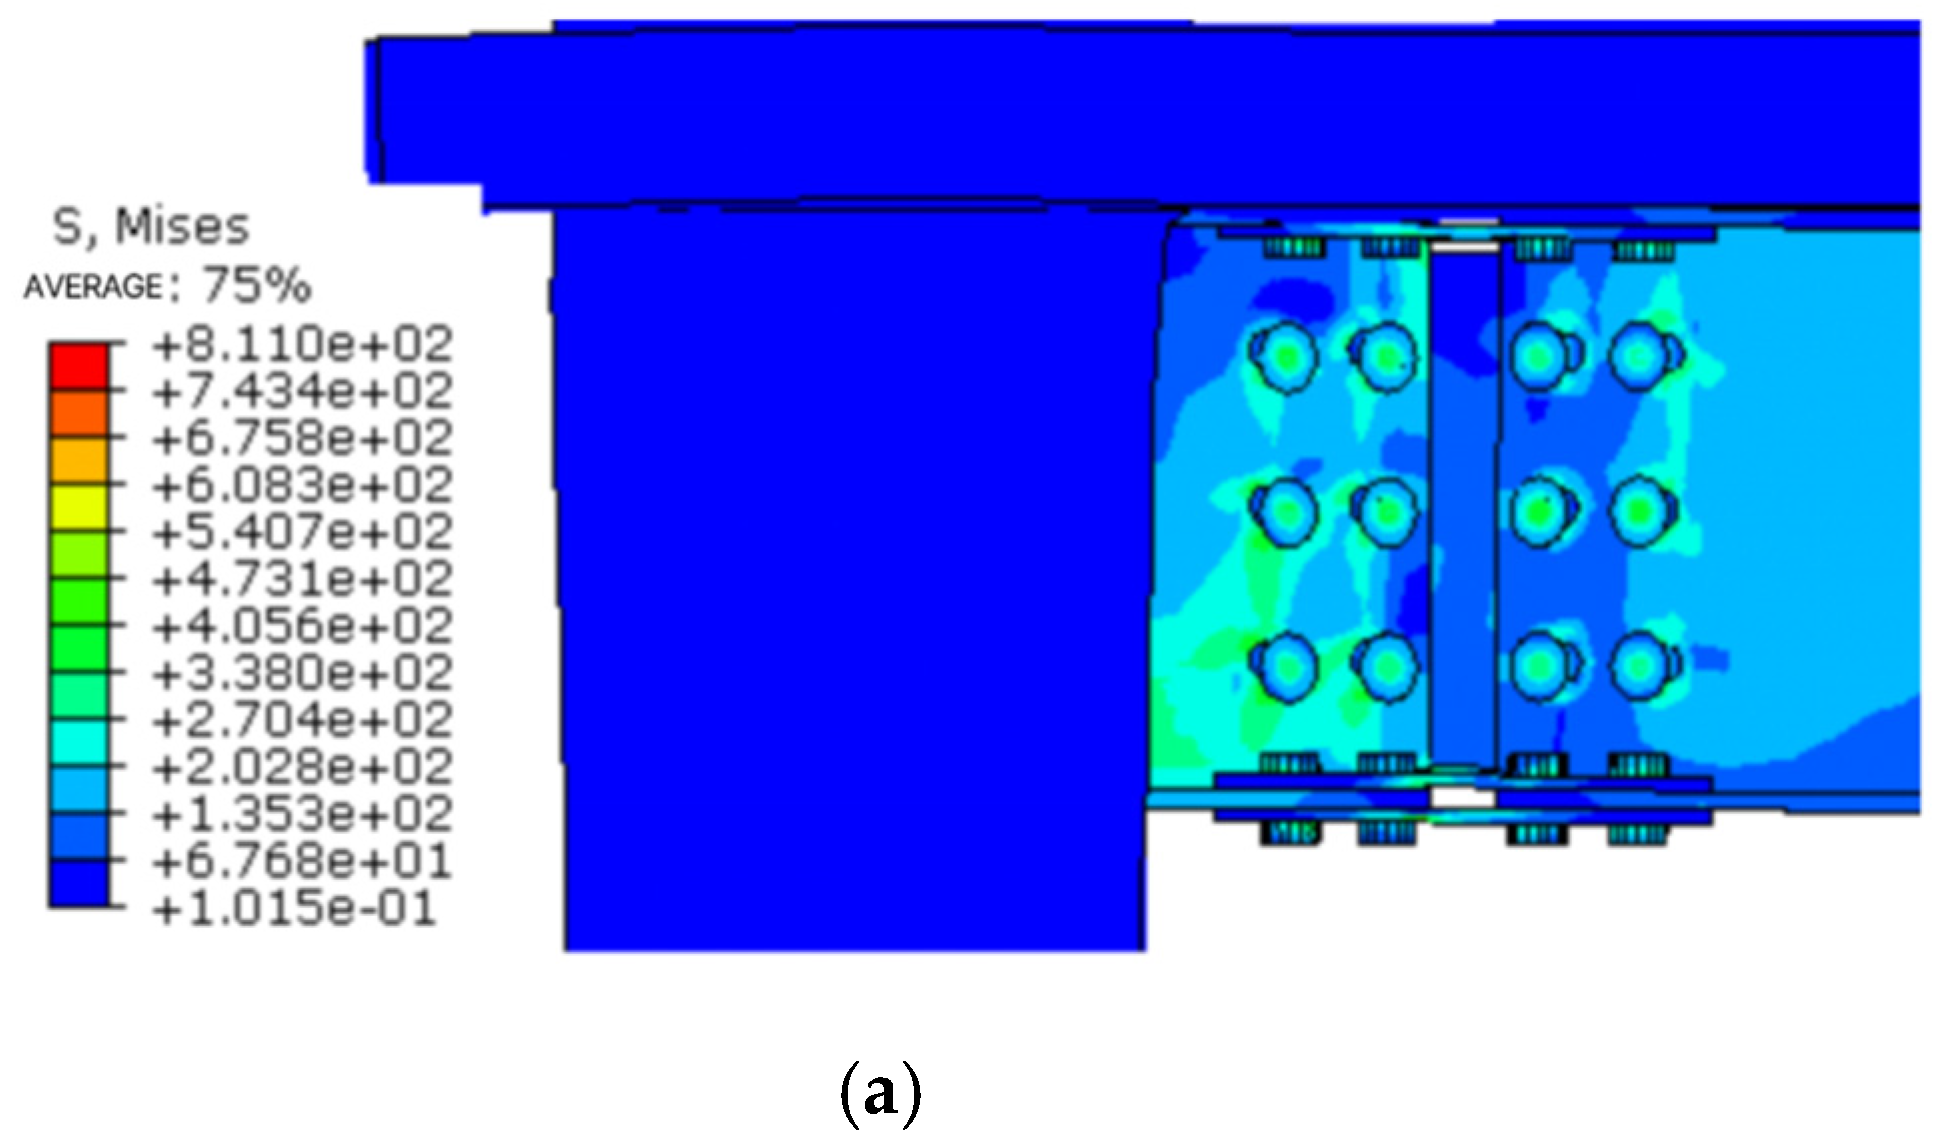
  • The floor effect changes the node damage form and enhances the connection strength, with the maximum stress concentrated in the connecting bolt and the plastic hinge occurring at the end of the beam, which conforms to the design code of “strong column weak beam”. The strength of the connecting bolt should be strengthened.
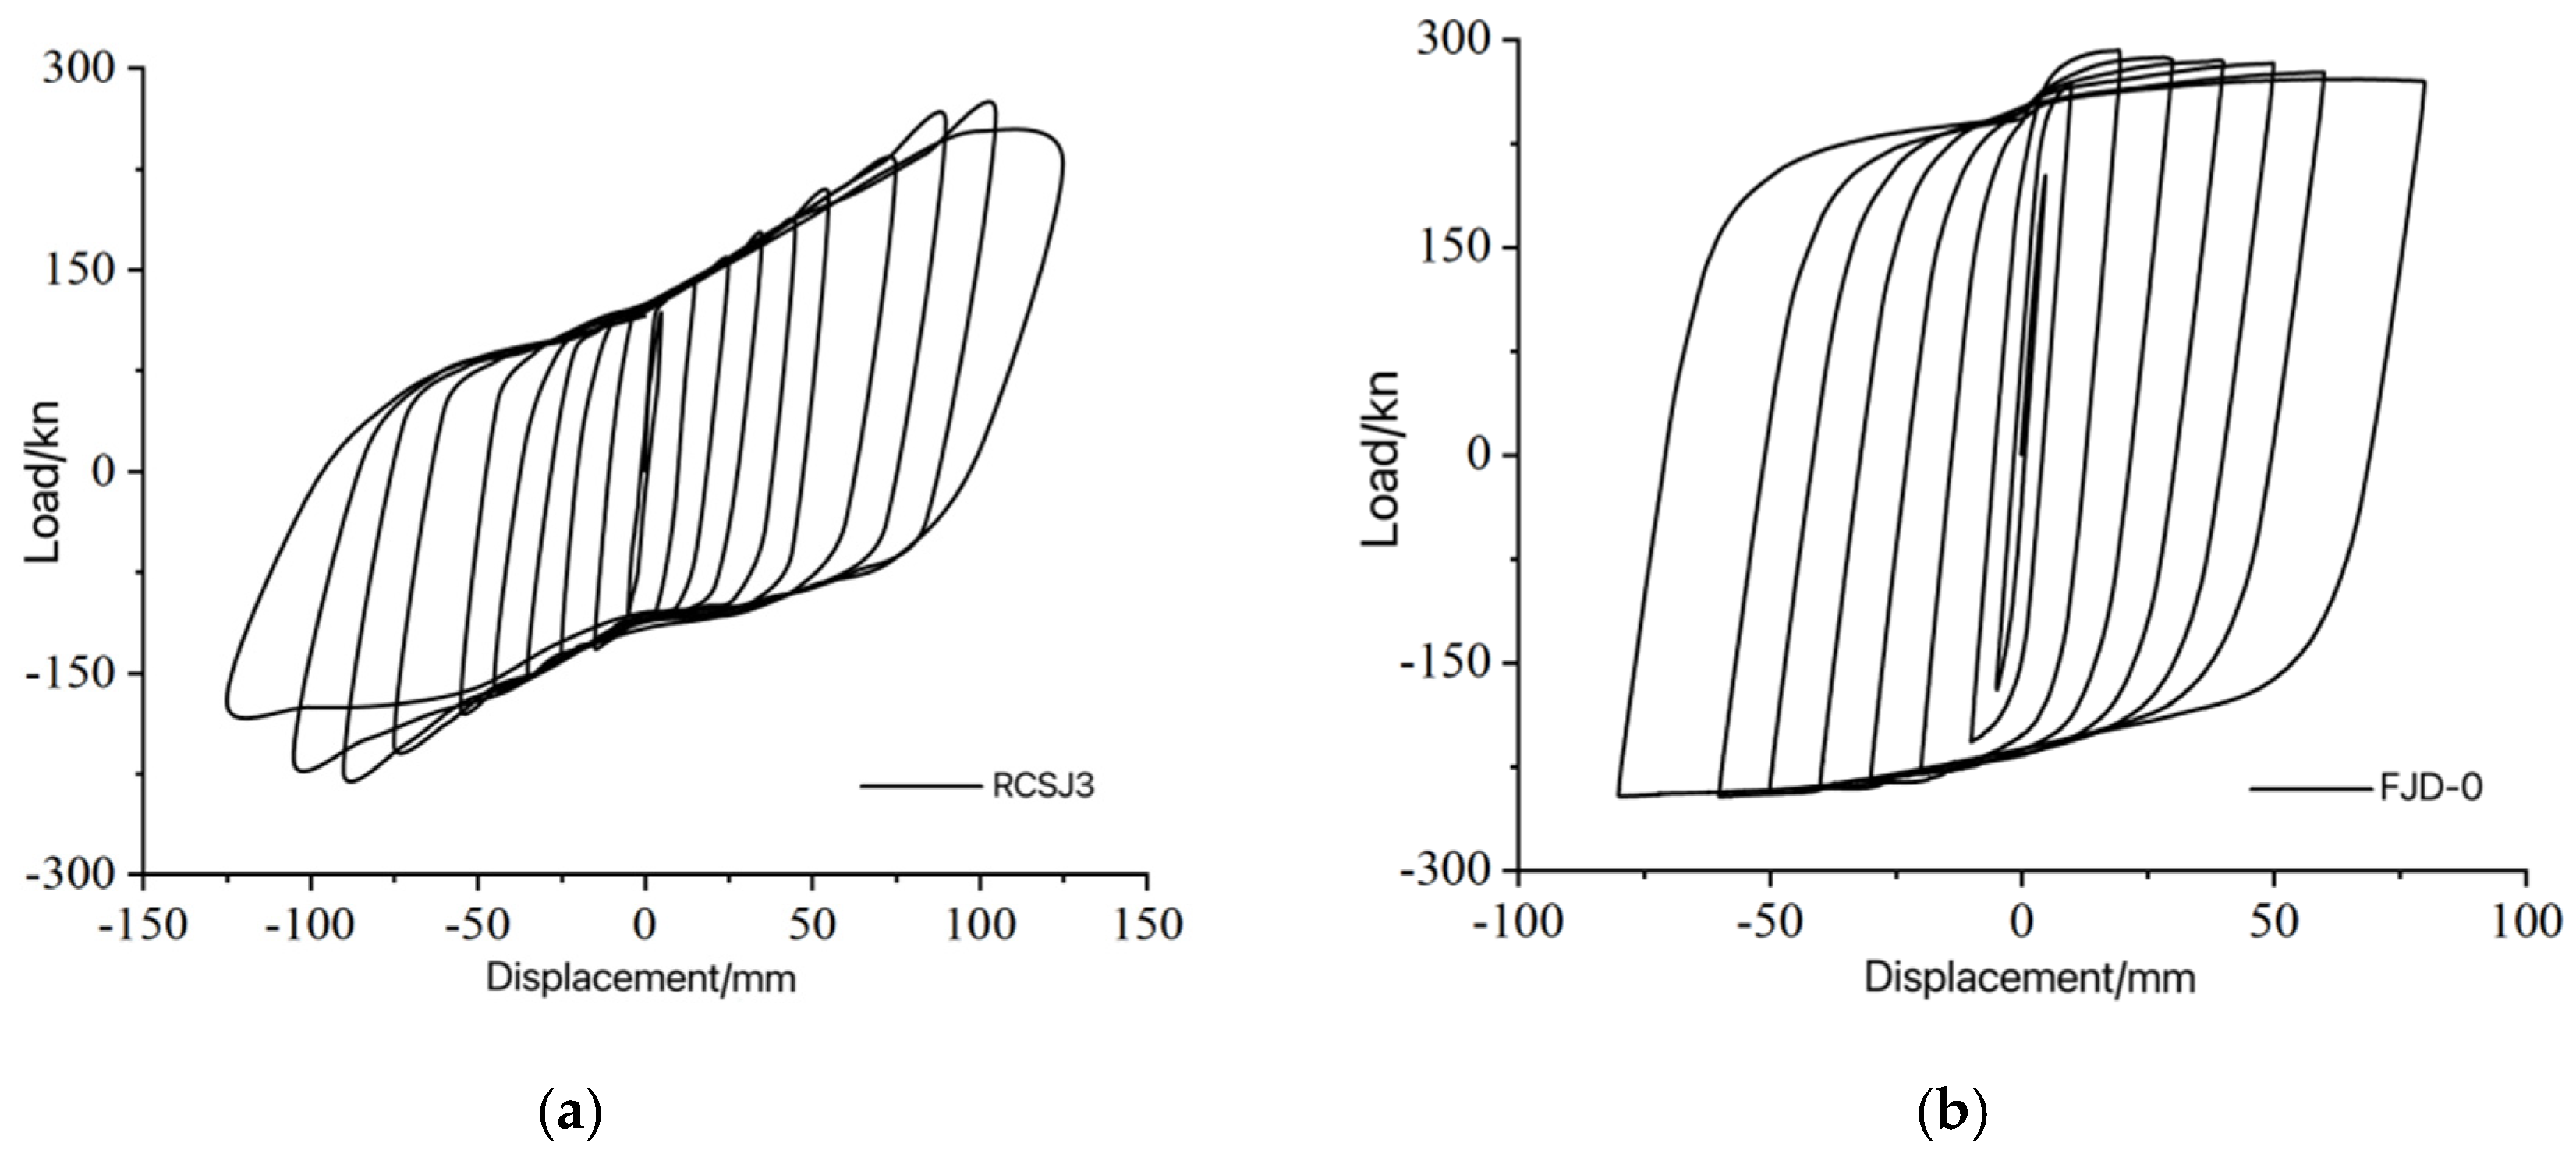
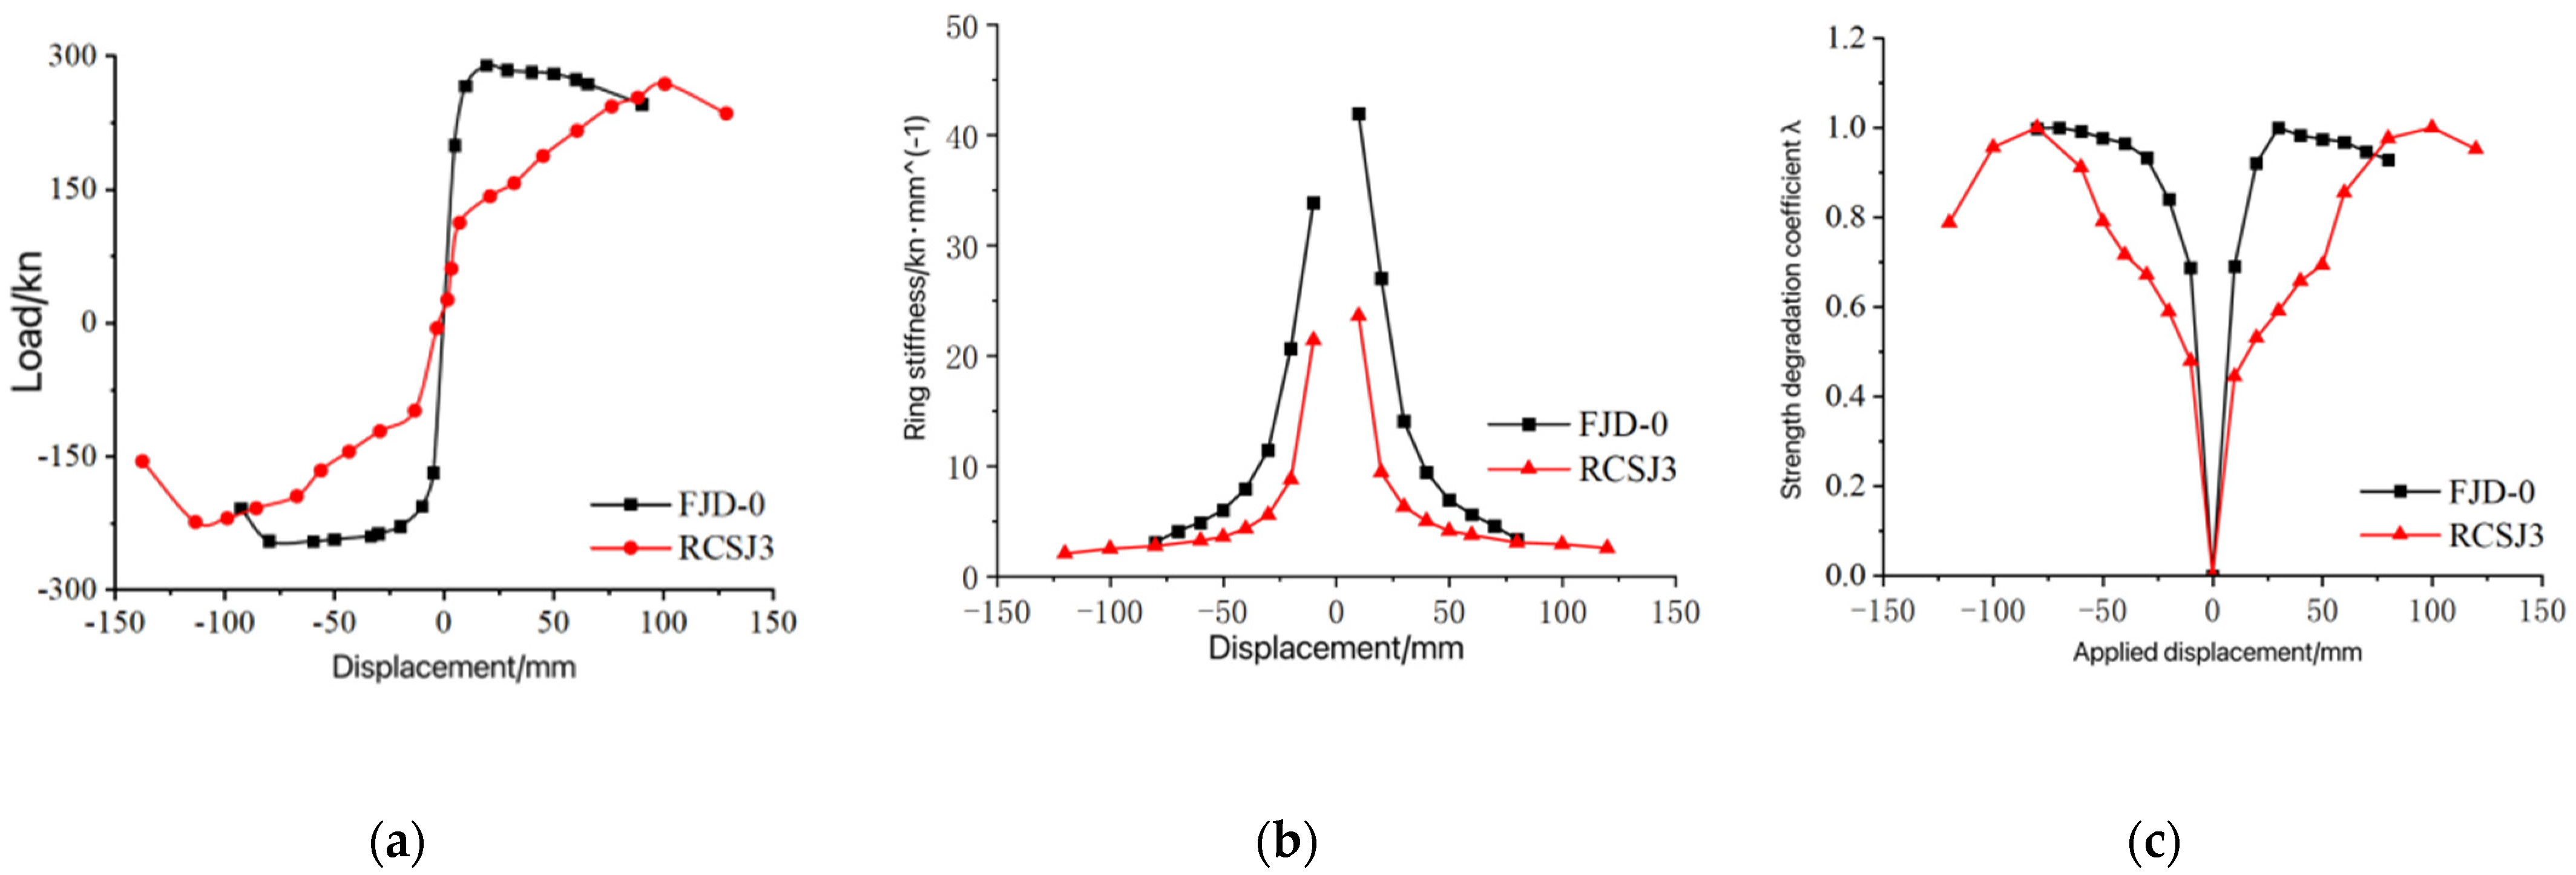
  • Compared with RCSJ3, FJD-0 significantly improves the bearing capacity and stiffness, and improves the seismic performance.
  • The positive and negative direction yield loads of node FJD-0 increased by 78.9% and 70.0%, respectively, while the ultimate bearing capacity improved by 13.2% and 9.98%. The energy dissipation capability increased by 23%, and the stiffness of all loading loops was enhanced, leading to a significant improvement in overall stiffness and a slower rate of strength degradation, as well as enhanced strength retention. The participation of the floor slab slightly reduced ductility, but to a minor extent, still meeting seismic design requirements. In seismic design, attention should be paid to the interaction effects of the floor slab to optimize the node structure and enhance the overall seismic performance [31].

4. The Seismic Performance Parameters of RCS Composite Joints Under Floor Effect Are Studied

The following analysis mainly considers the influence of parameters such as the axial compression ratio, floor thickness, high-strength bolt preload, floor reinforcement rate and floor concrete strength grade. The seismic performance analysis results of FJD-0 are taken as a reference, and the analysis is combined with ABAQUS. The main parameter values are shown in Table 4.

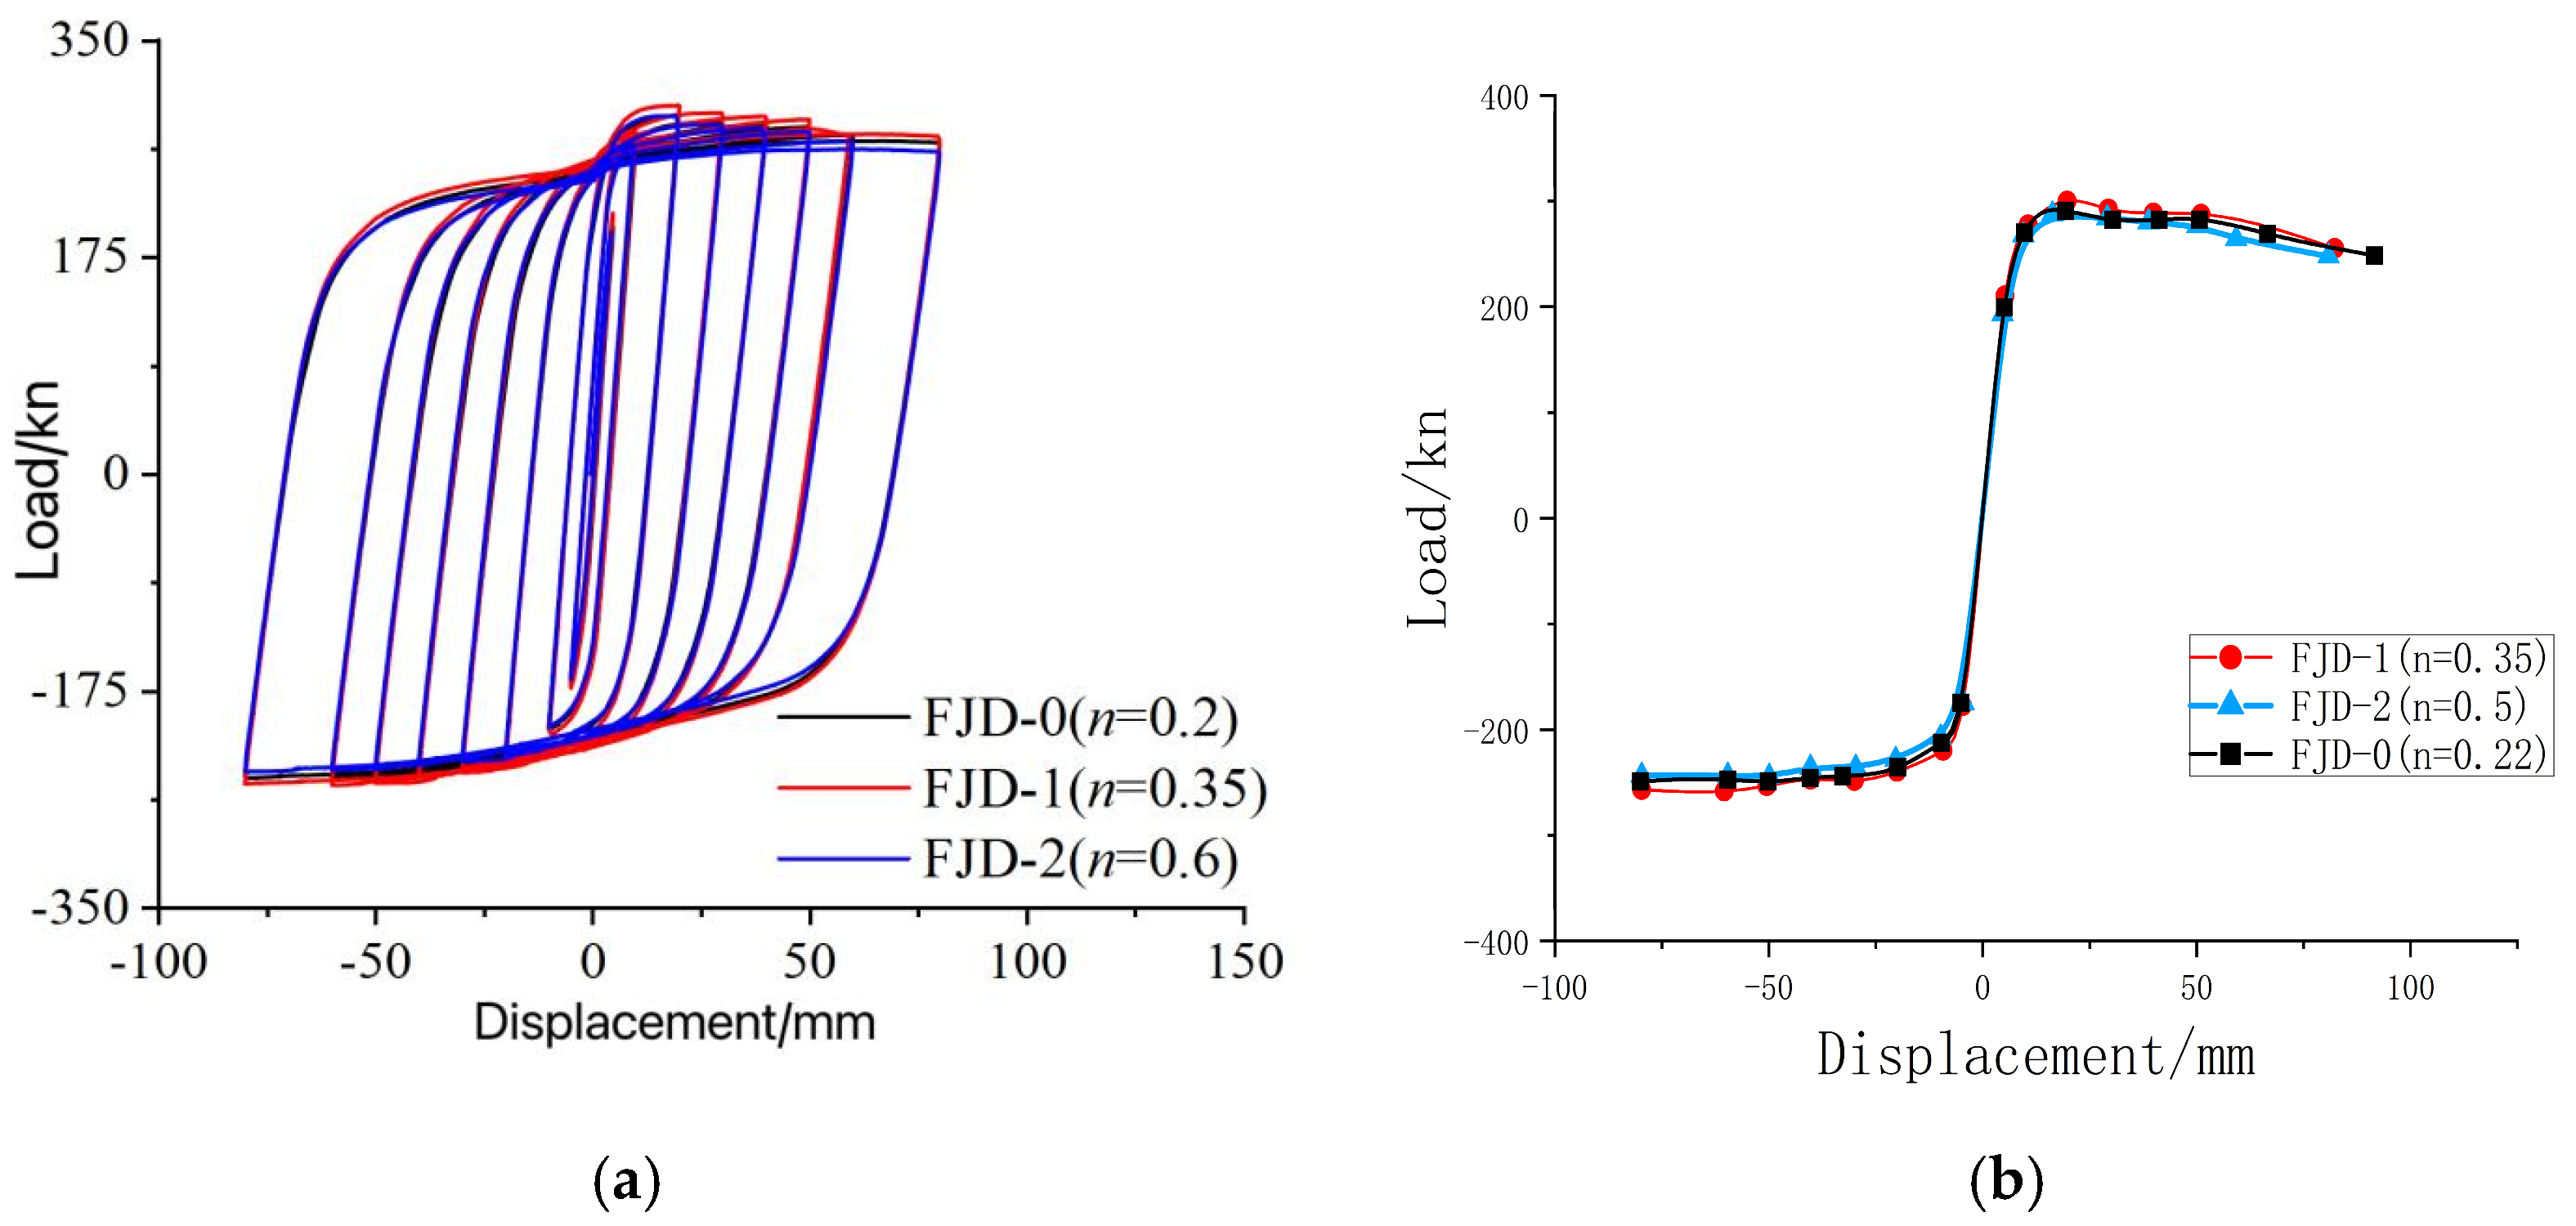
4.1. The Influence of Axial Compression Ratio on Seismic Performance of Nodes

The calculation formula for the axial compression ratio is as shown in Formula (16).
n = N f c A c
where n is the axial compression ratio; N is the axial force in the column cross-section;
f c is the design value of the concrete’s compressive strength;
A c is the area of the concrete’s compressive zone.

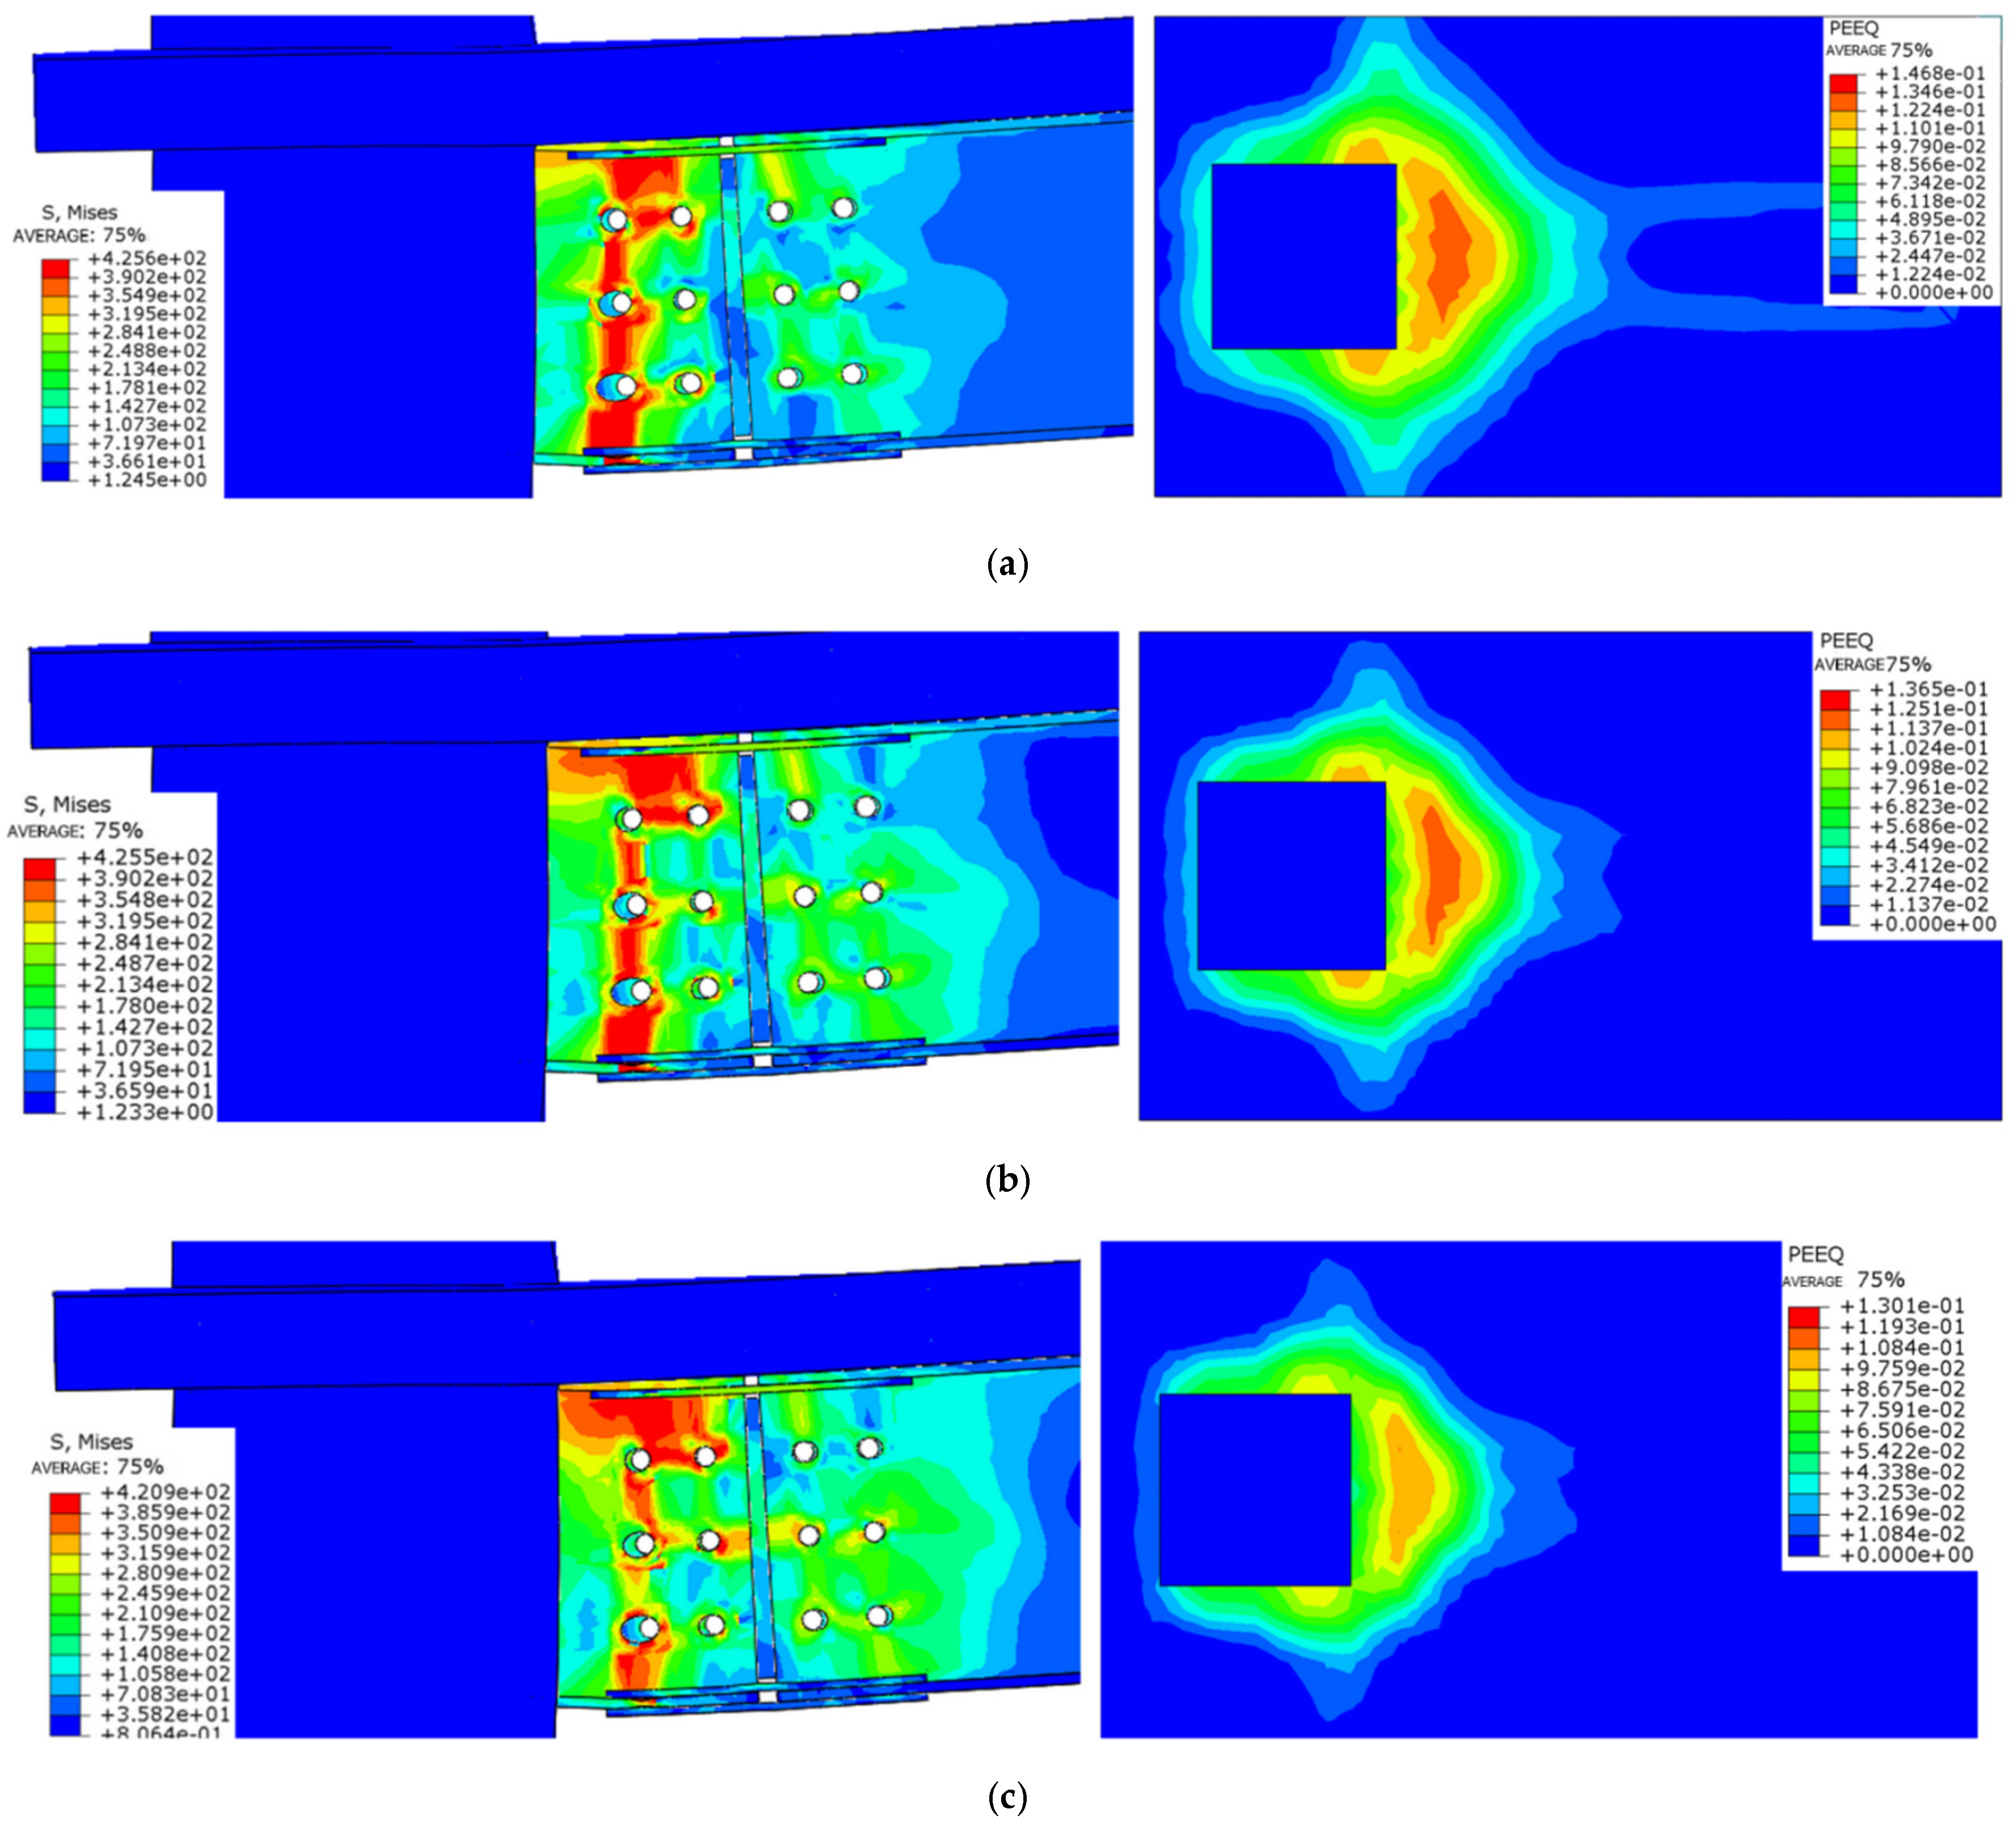
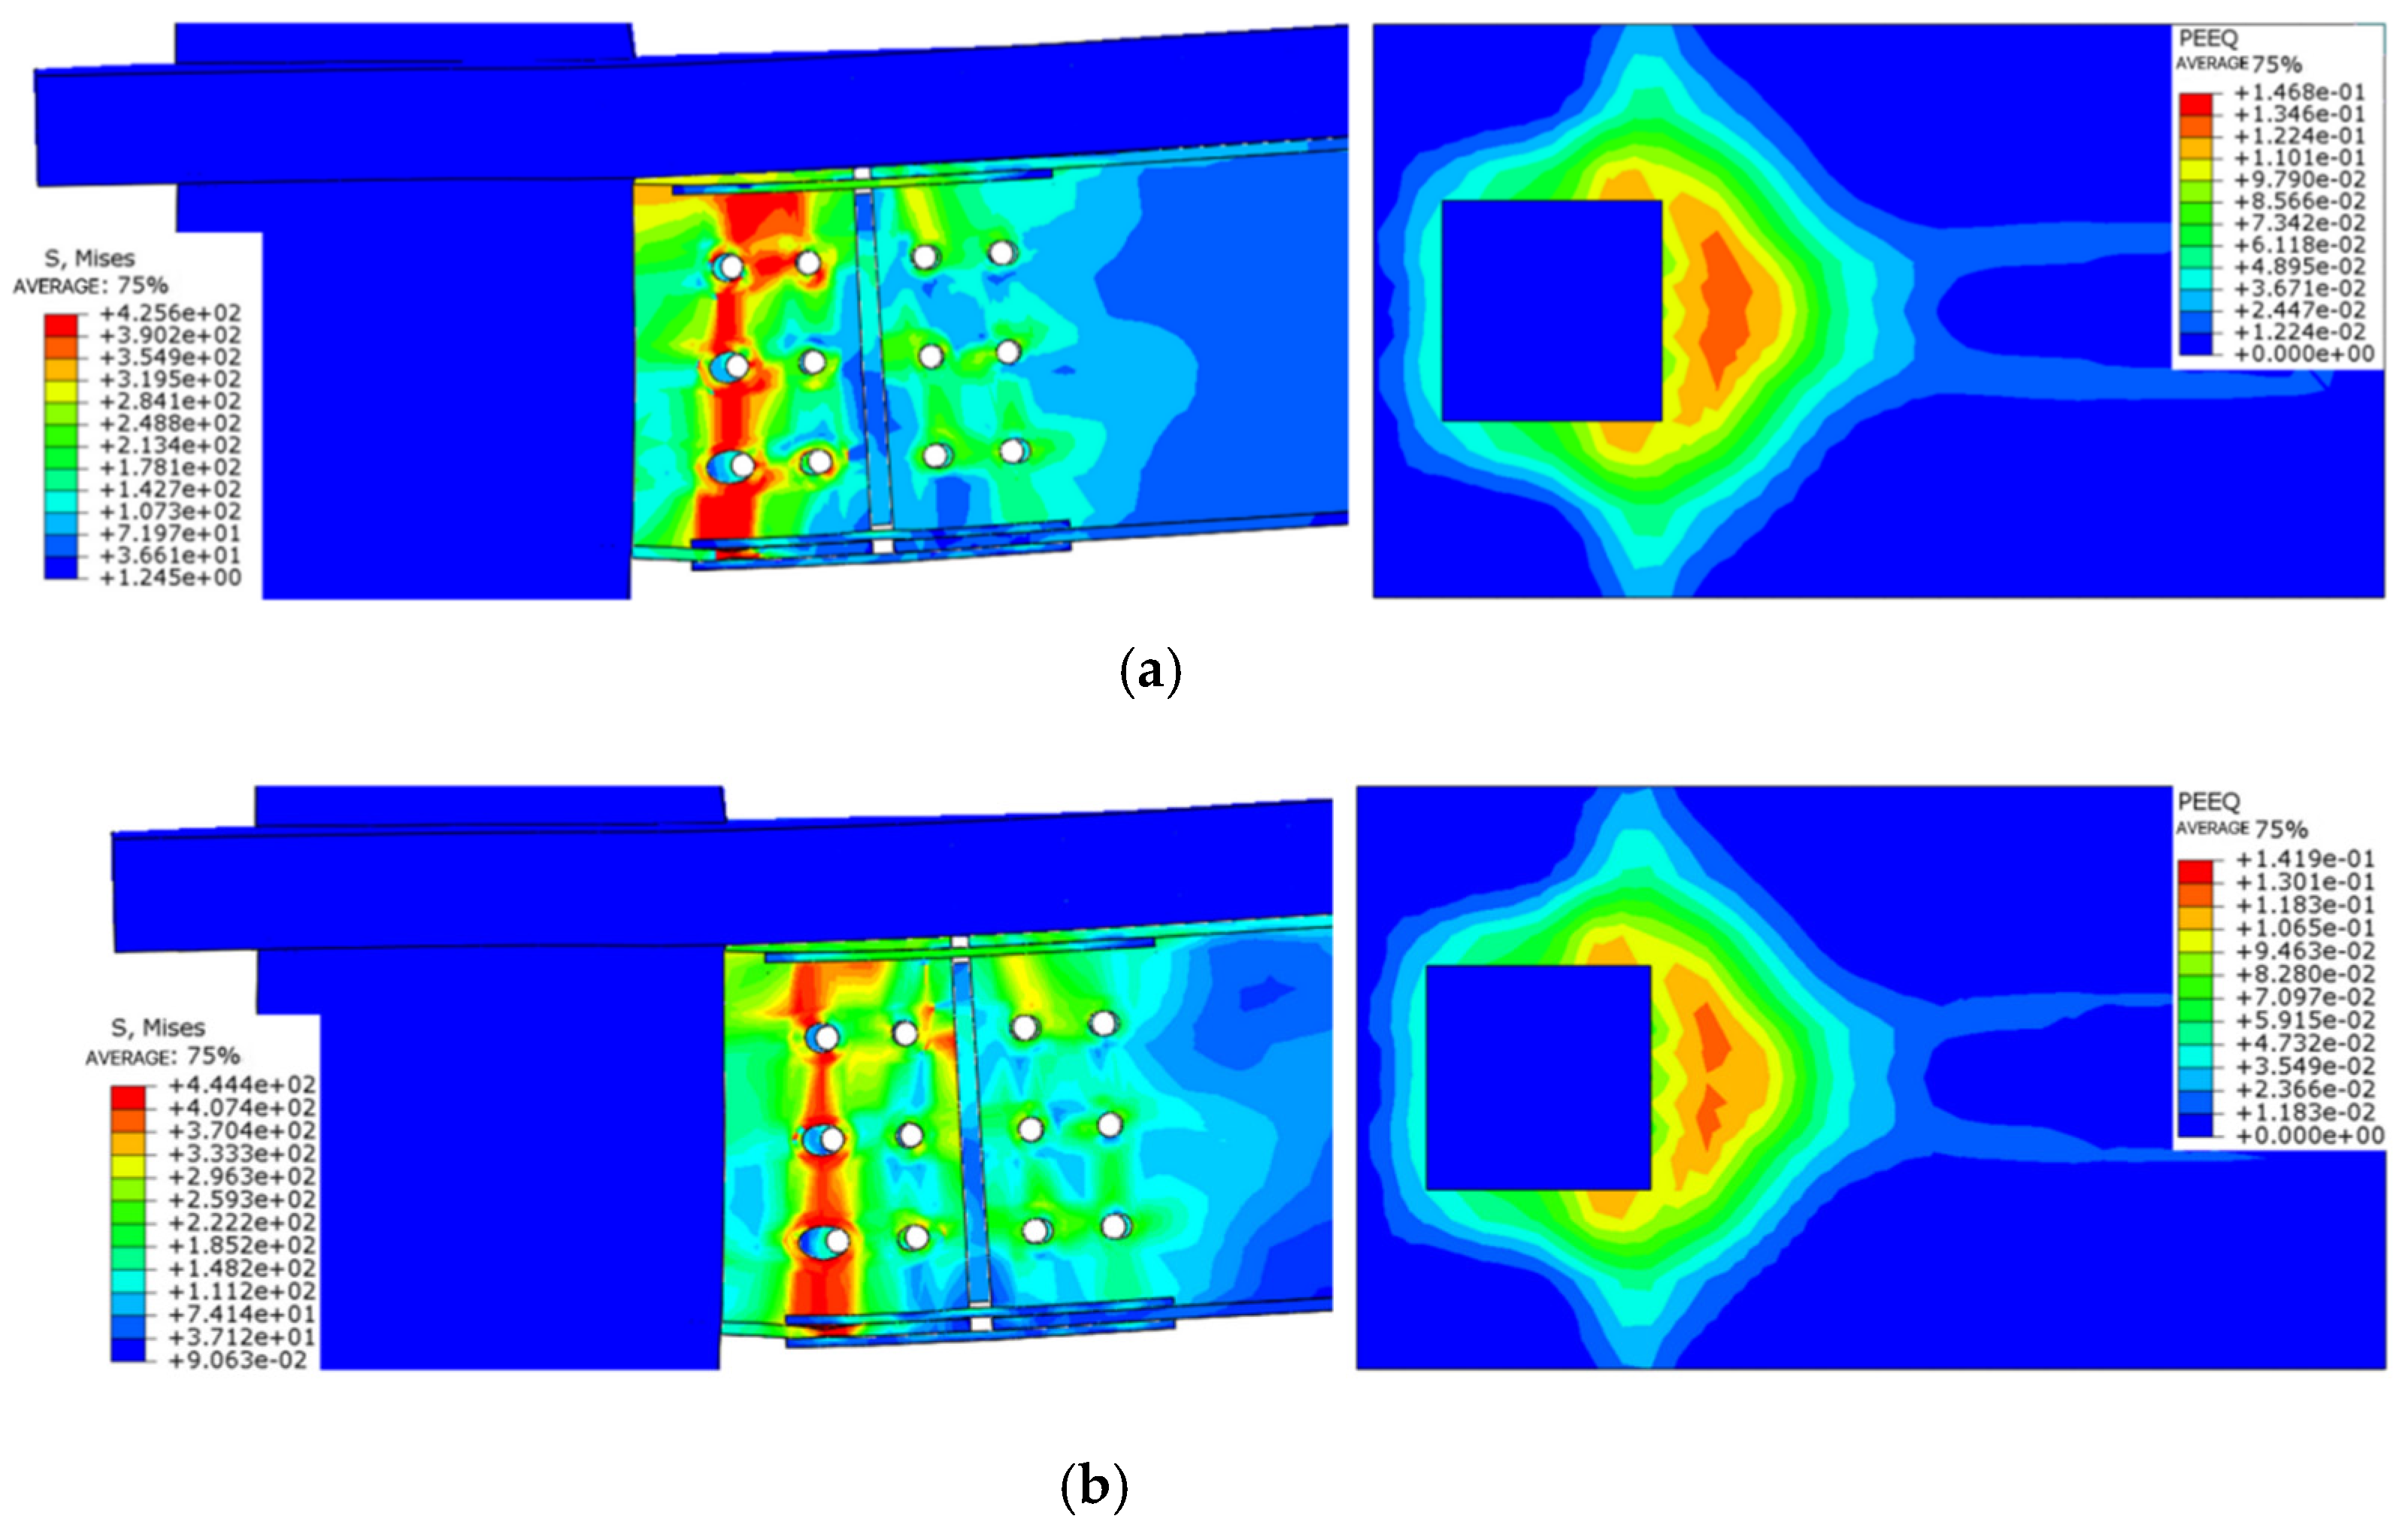
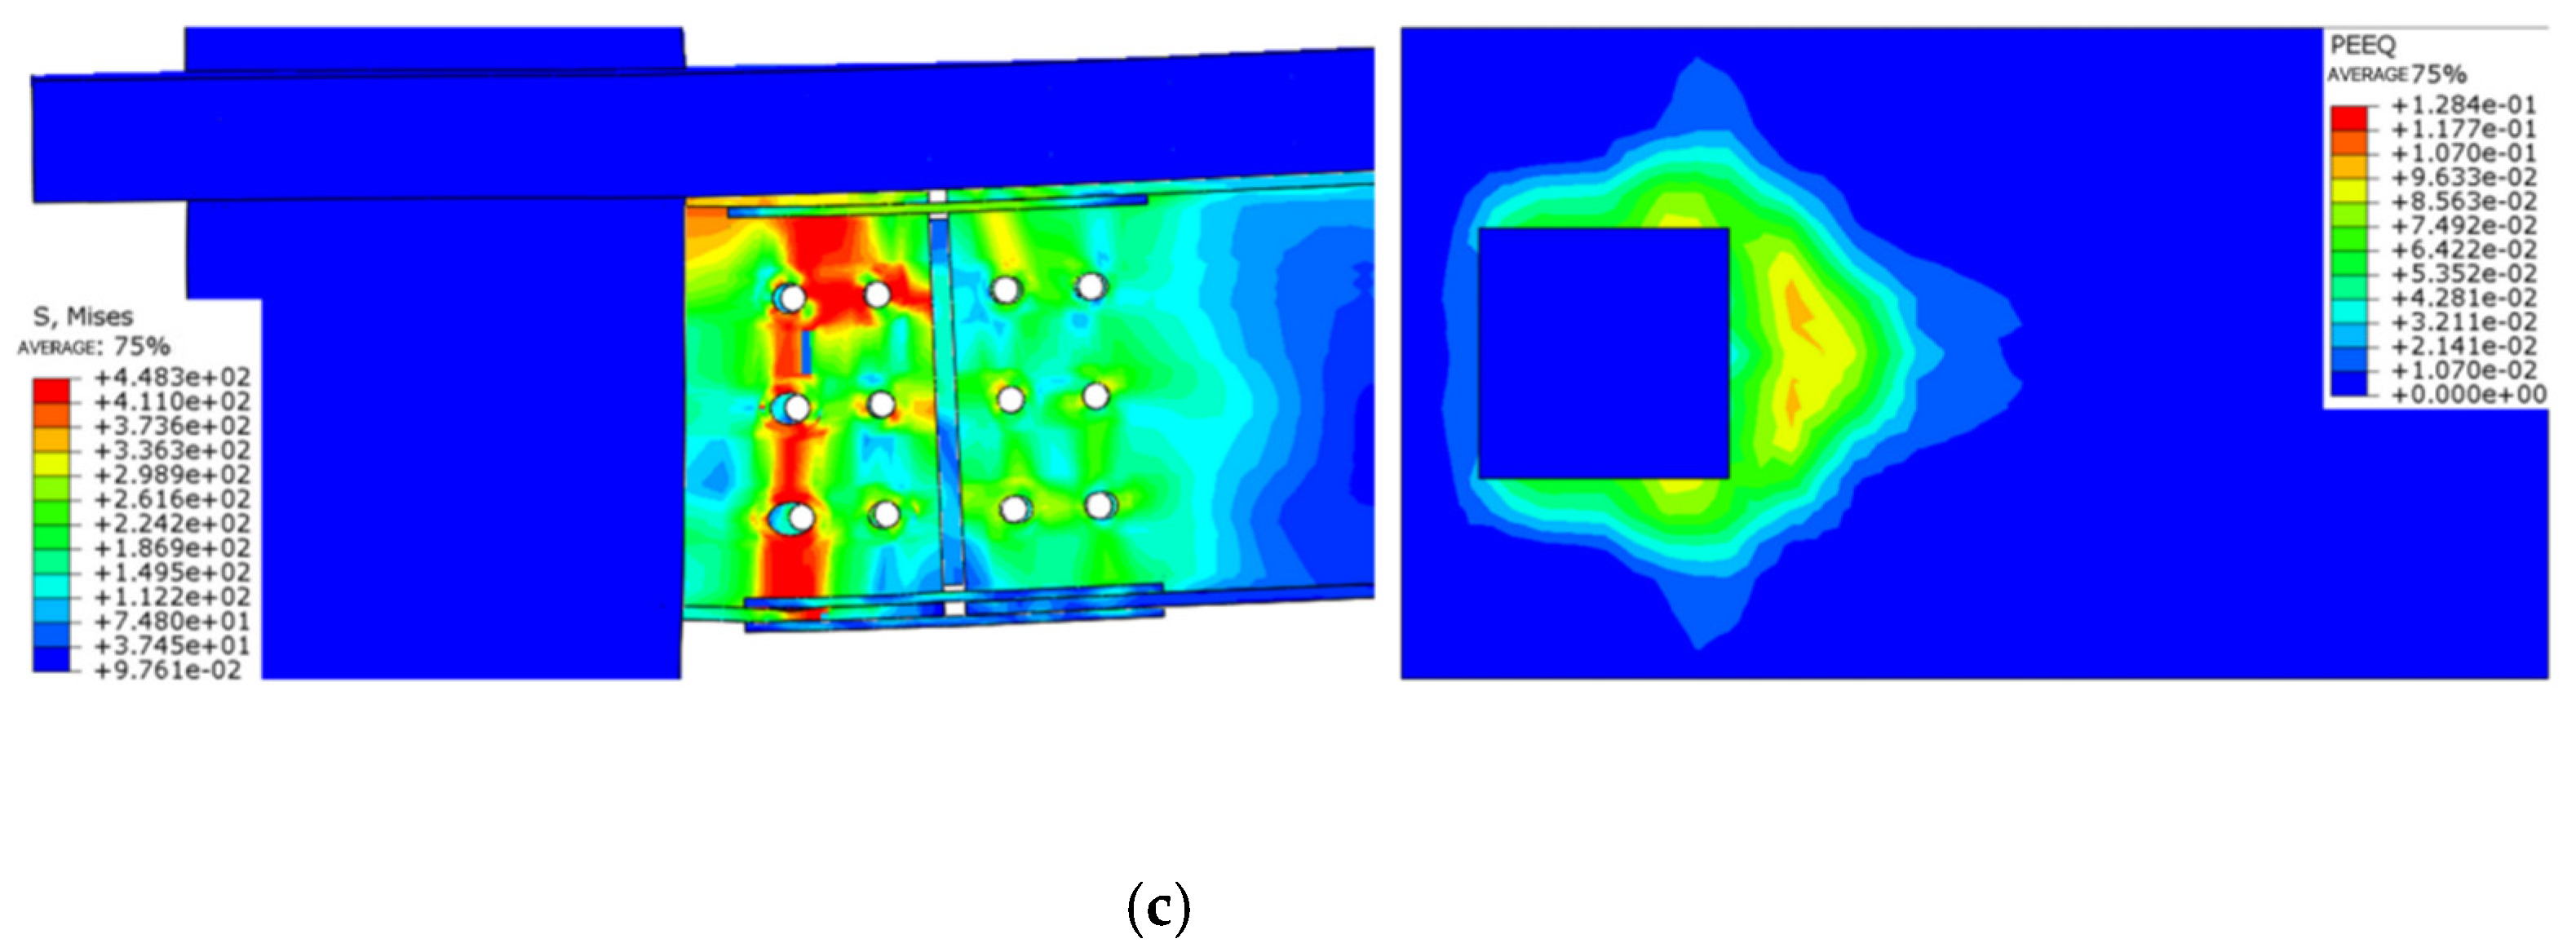
4.1.1. Axial Compression Ratio Failure Pattern

When studying the seismic performance of high-rise structural nodes, the axial compression ratio has a significant influence on the failure mode of the node. With an increase in the axial compression ratio, plastic hinges and the buckling deformation of steel beams generally appear at the node [32]. Excessively high axial pressure ratios enhance stiffness, which reduces the strain and stress responses of the joint, consequently decreasing its deformation capacity and toughness (Figure 15). Therefore, the optimization of the axial compression ratio should be balanced in the design to give full play to the seismic capacity of the node and ensure the overall safety and durability of the structure.

4.1.2. Curve Characteristics and Ductility

Observing the ductility performance of nodes under different axial compression ratios, it can be found that the data distribution of the hysteresis curve and the skeleton curve almost perfectly overlaps. In the elastic stage, the load and displacement show a linear relationship, indicating that the node exhibits good elastic characteristics. As the load continues to increase, the node gradually enters the yielding stage. At this point, there is a slight difference in the ultimate bearing capacity; the axial load on the column end increases, enhancing the compressive stress in the core area of the node, thereby improving its bearing capacity within a certain range. However, when the axial load becomes too large, concrete is prone to fatigue damage during repeated loading, leading to performance degradation (Figure 16).

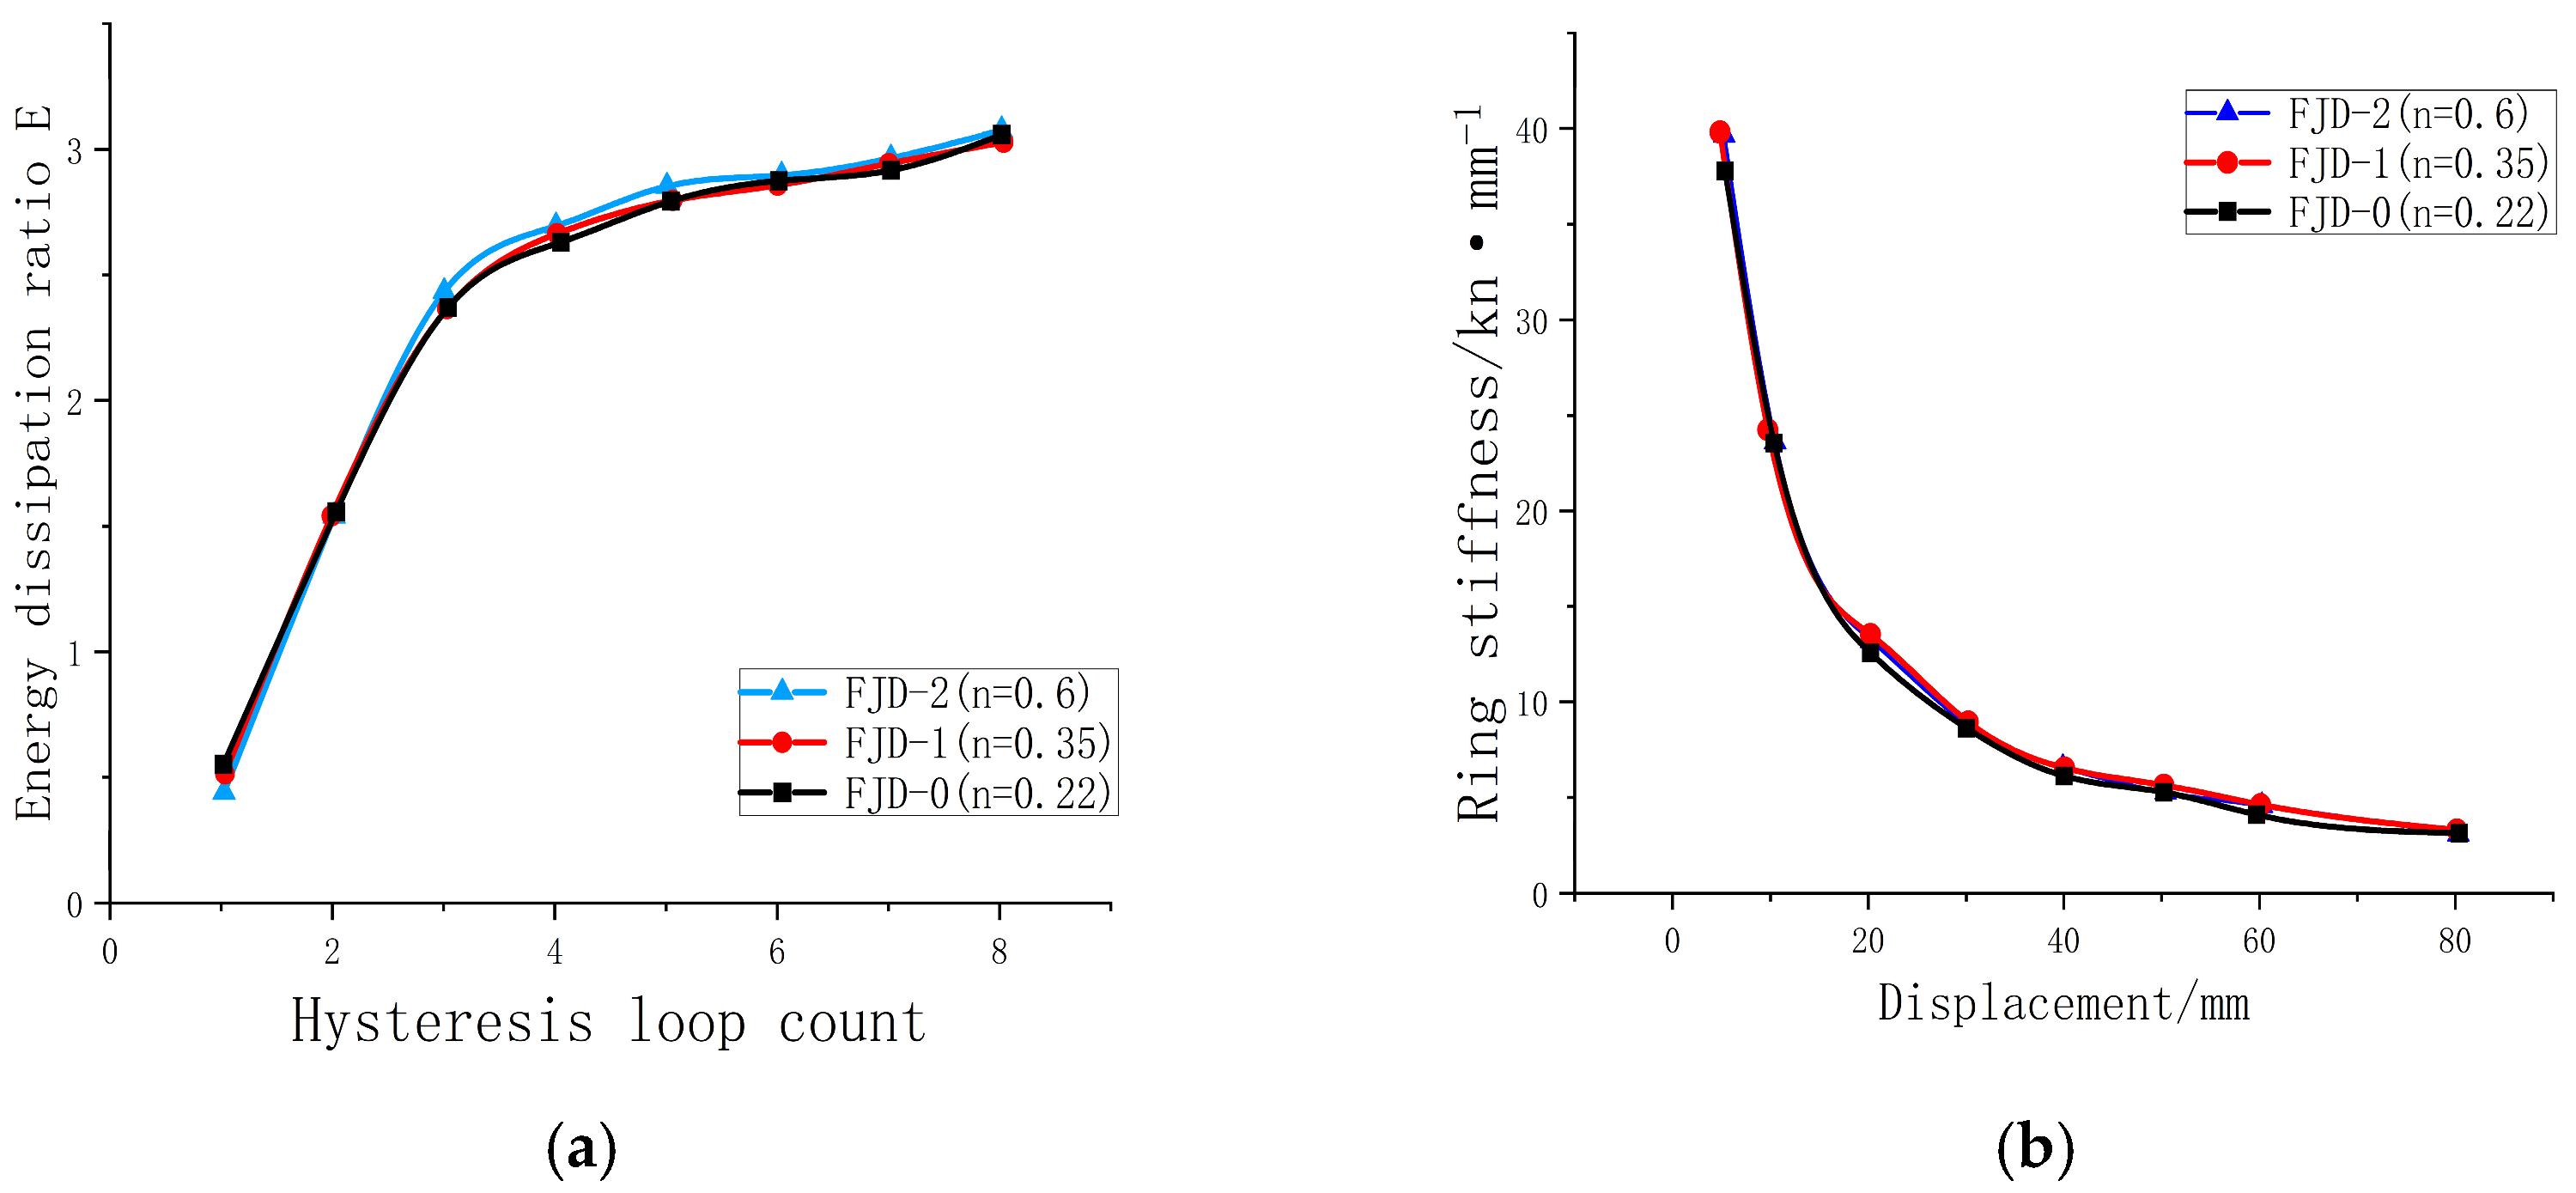
4.1.3. Energy Consumption Capacity and Stiffness Degradation

The research shown in Figure 17 indicates that the energy dissipation coefficient does not vary significantly under different axial compression ratios. The energy dissipation coefficients of the three nodes range from 3.02 to 3.09, while the equivalent viscous coefficients range from 0.481 to 0.491, with a variation of less than 2.32%, all meeting the standard requirements. This suggests that the axial compression ratio has a limited impact on the energy dissipation performance of the nodes. In terms of stiffness degradation, a higher axial pressure ratio significantly enhances the initial stiffness of the joint, demonstrating a stronger resistance to deformation overall. As the load increases, the stiffness of the joint gradually diminishes. However, joints with high axial pressure ratios can still maintain a satisfactory stiffness level, which contributes to an improved seismic performance. This phenomenon is attributed to the increased vertical axial force at the top of the column, leading to an elevation of compressive stress in the core region of the joint. Consequently, this suppresses lateral displacement during cyclic loading, thereby enhancing its deformation resistance.

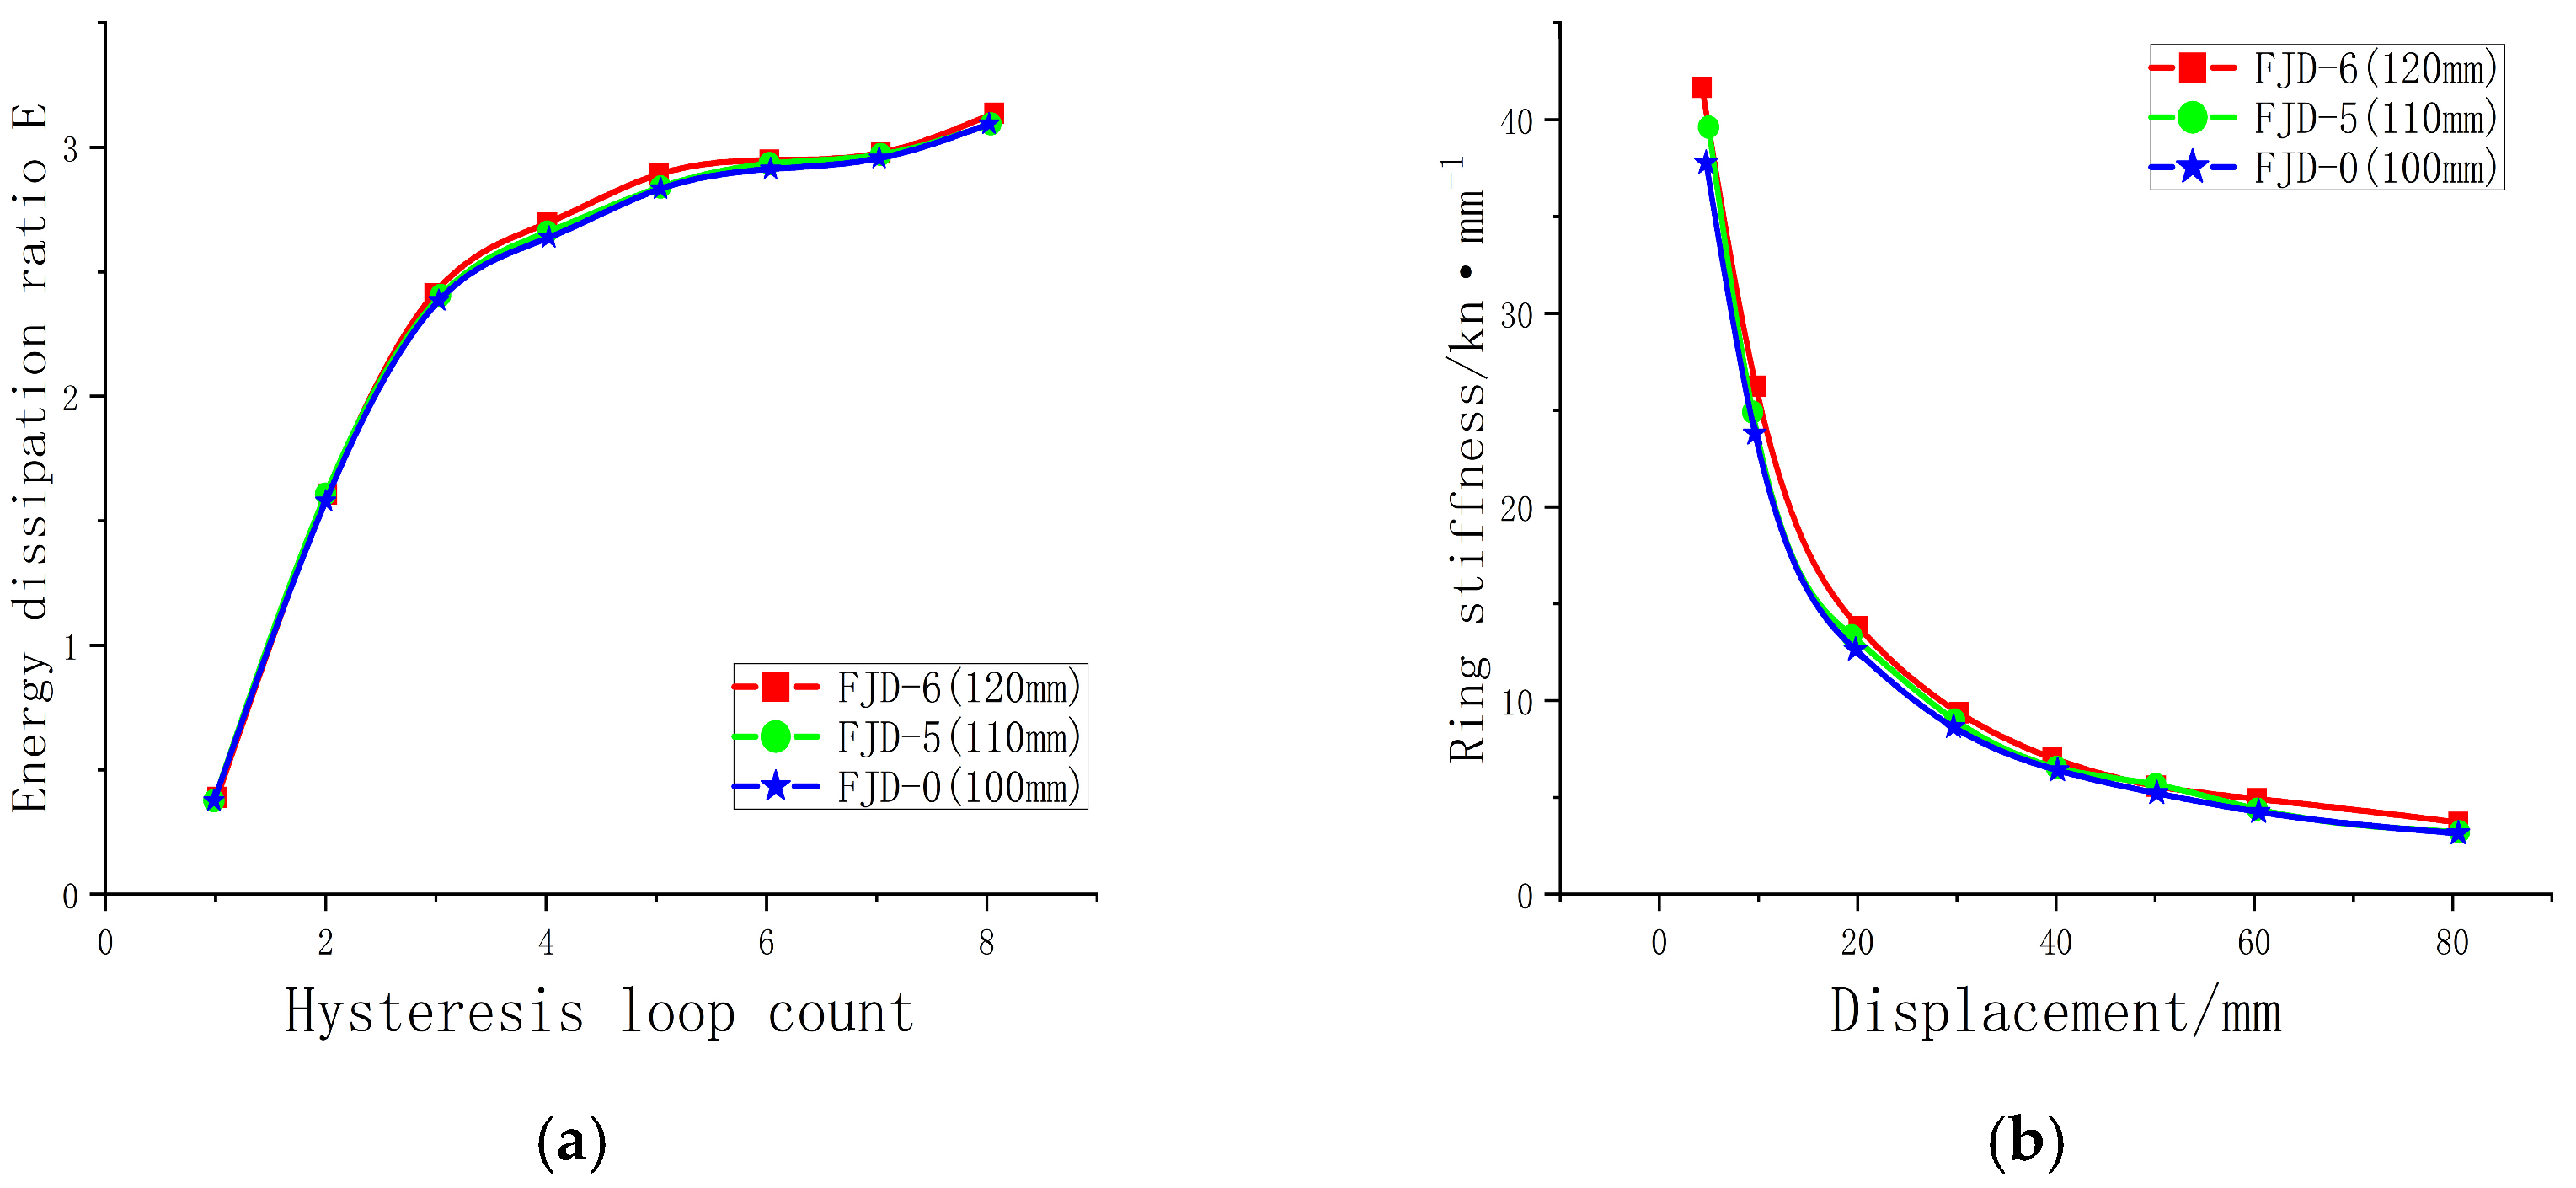
4.2. The Influence of Floor Thickness on Seismic Performance of Nodes

In order to study the influence of floor thickness on the seismic performance of nodes, this section takes node FJD-0 with a 100 mm floor thickness as the basis, takes floor thickness as the parameter, and designs node FJD-5 and FJD-6 with 110 mm and 120 mm floor thicknesses, respectively, which are consistent with the original design in other parameters, and conducts a comparative analysis of the seismic performance.

4.2.1. Destructive Morphology

By comparing the stress contour maps and equivalent plastic strain distributions of the steel beams at various slab thicknesses (Figure 18), it can be observed that the modes of failure exhibit limited variation. Buckling and plastic hinges appear at the lower flange of the steel beam and the bearing plate, with stress concentrations occurring near the bolt holes of the web plate close to the column. As the slab thickness increases, the composite beam’s sectional stiffness improves, enhancing the joint’s resistance to deformation. Consequently, the plastic range of the steel beam decreases, and the area of plastic deformation in the concrete slab also diminishes accordingly.

4.2.2. Curve Characteristics and Ductility

Under cyclic loading, the increase in slab thickness has a minimal effect on the shape and trend of the hysteresis curves. However, the improvement in the joint’s bearing capacity during positive loading is more pronounced compared to negative loading. Different slab thicknesses enhance the load-bearing capacity of nodes (increasing by 4.8–9.5% in the positive direction), primarily due to the improved compressive strength and the shift of the neutral axis. The fullness of the hysteretic curve increases, demonstrating stronger load-bearing and energy dissipation capabilities, though it has a lesser impact on the shape of the curve. The skeleton curve shows that the thicker the slab, the higher the ultimate load-bearing capacity, but ductility slightly decreases (by about 1.7–3.7%). Therefore, the slab thickness should be reasonably selected to balance stiffness and toughness (Figure 19). The tabulated data showing the characteristic values of the skeleton curves for different slab thicknesses is represented in Table 5.

4.2.3. Energy Consumption and Stiffness Degradation

The energy dissipation capability of the nodes under different slab thicknesses initially increases linearly. As cracks develop, the energy dissipation slope slows down and then rises again as damage approaches. The energy dissipation coefficient ranges from 3.05 to 3.10, with an equivalent viscous coefficient of 0.485 to 0.493, both meeting the standards, indicating the good energy dissipation performance of the nodes. Increasing the slab thickness by 20 mm (node FJD-6) only results in a slight increase of about 1.64 in energy dissipation, with minimal impact.
The stiffness degradation shows that with the load, the stiffness of the node deteriorates rapidly, and the relaxation change trend tends to be consistent. The thicker the floor plate is, the higher the stiffness of the node (such as FJD-6). This is because the thicker floor plate increases the effective height of the beam, enhances its bending resistance, and improves its deformation resistance (Figure 20).

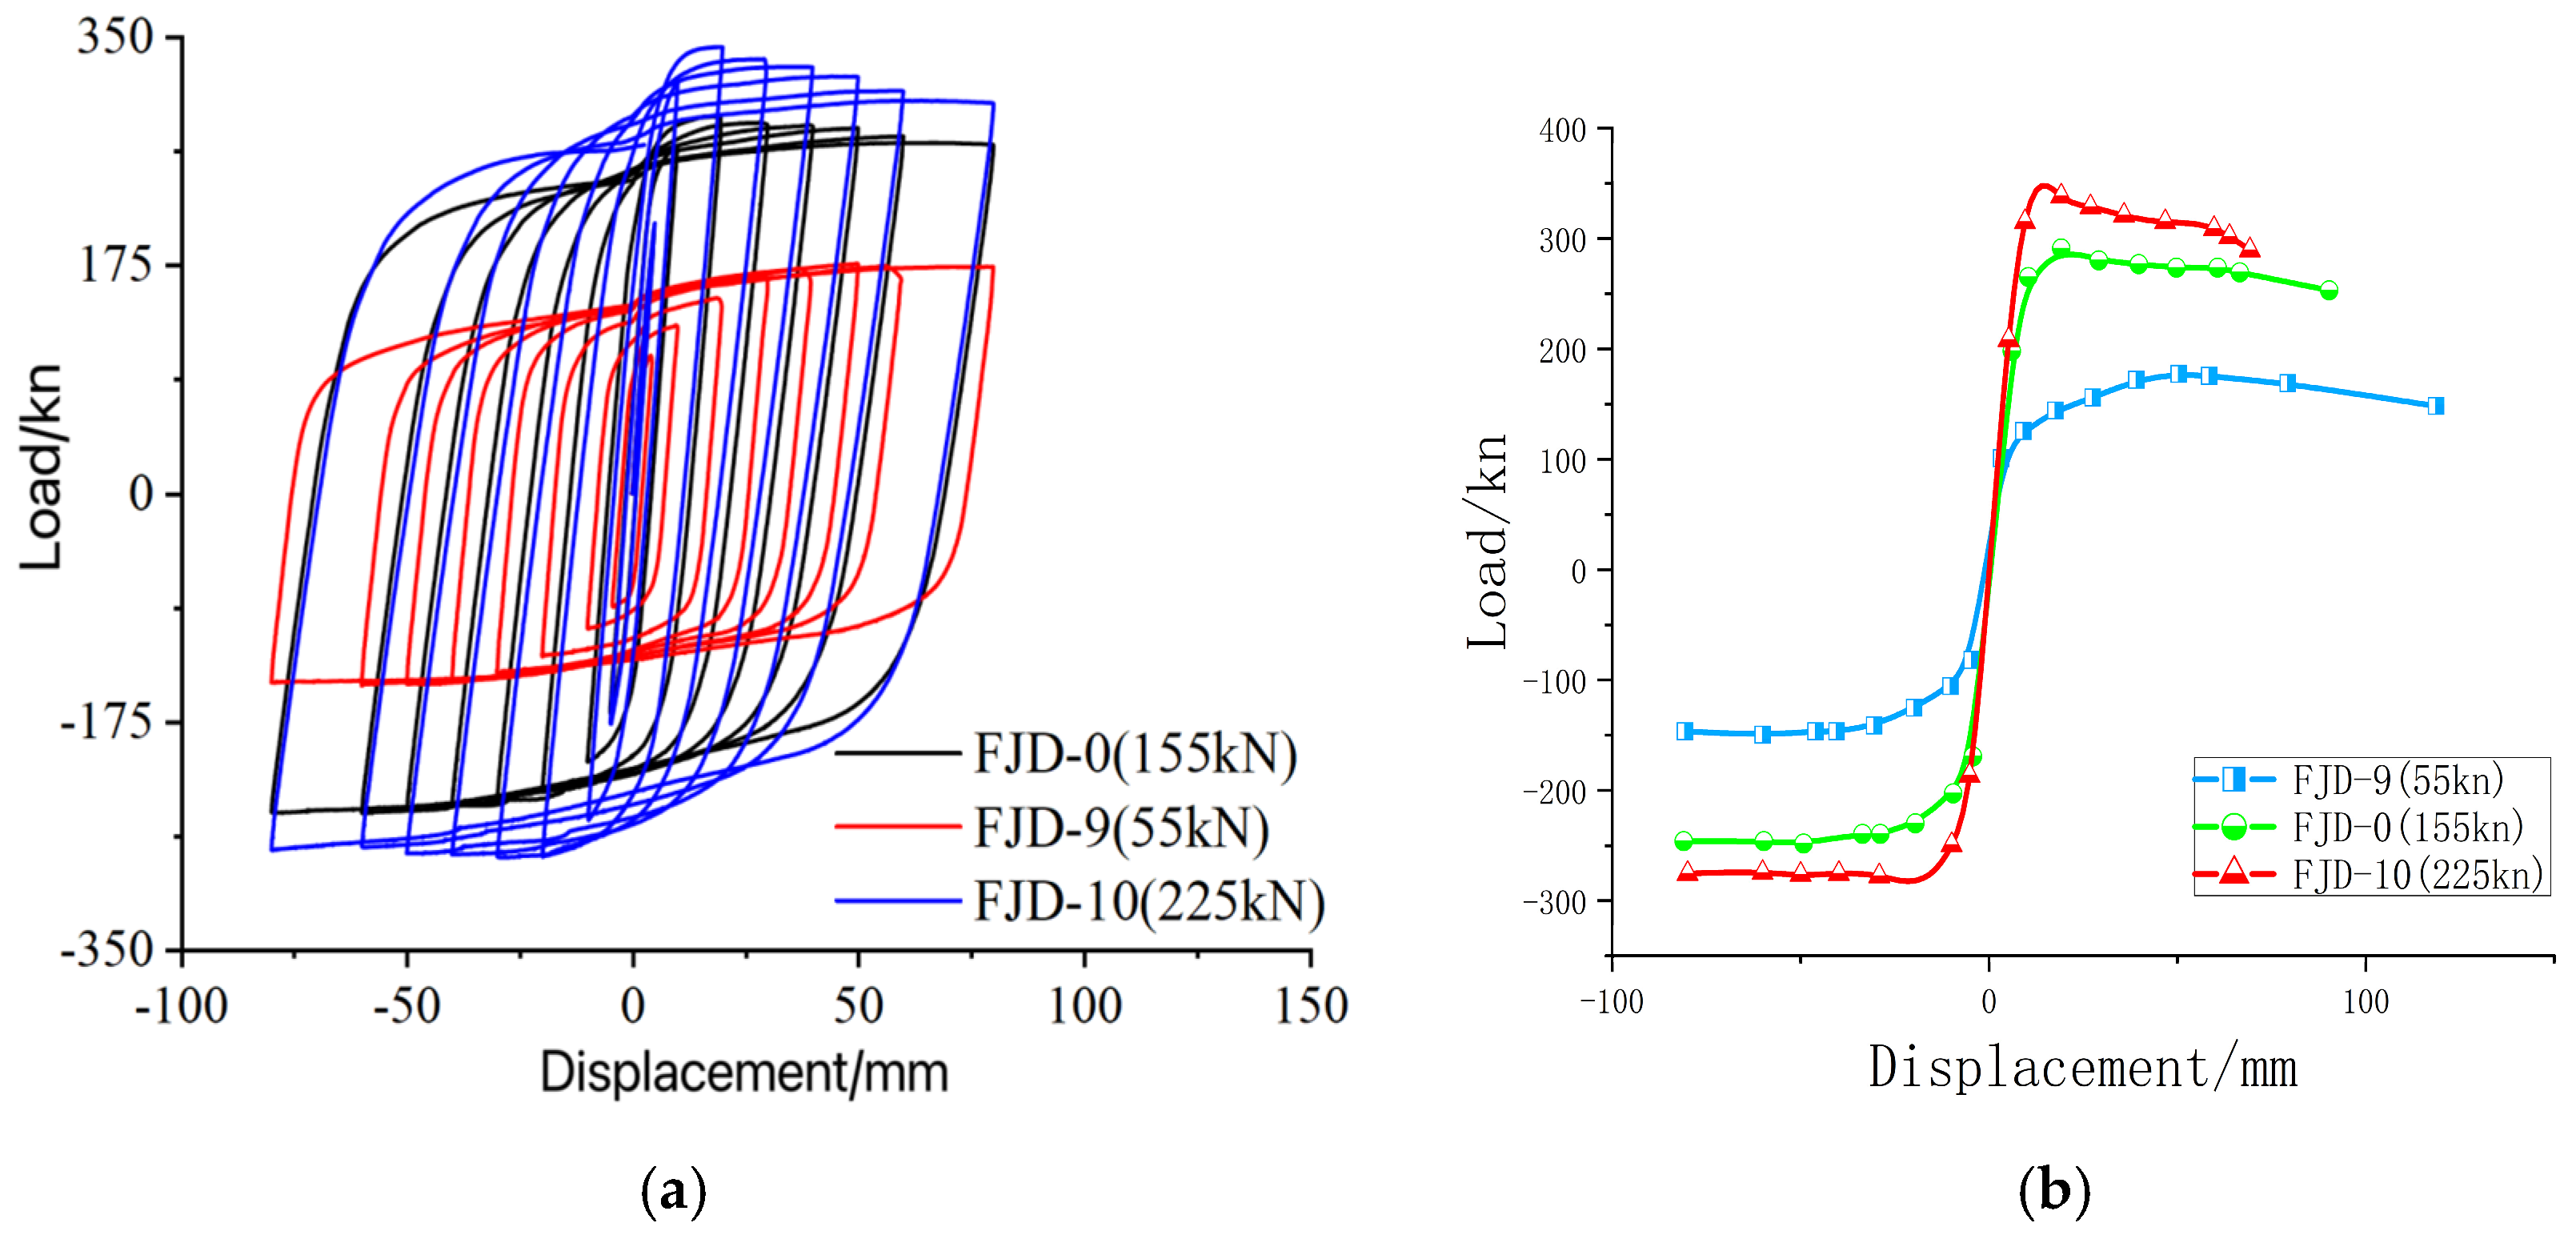
4.3. The Influence of Bolt Preload on Seismic Performance of Nodes

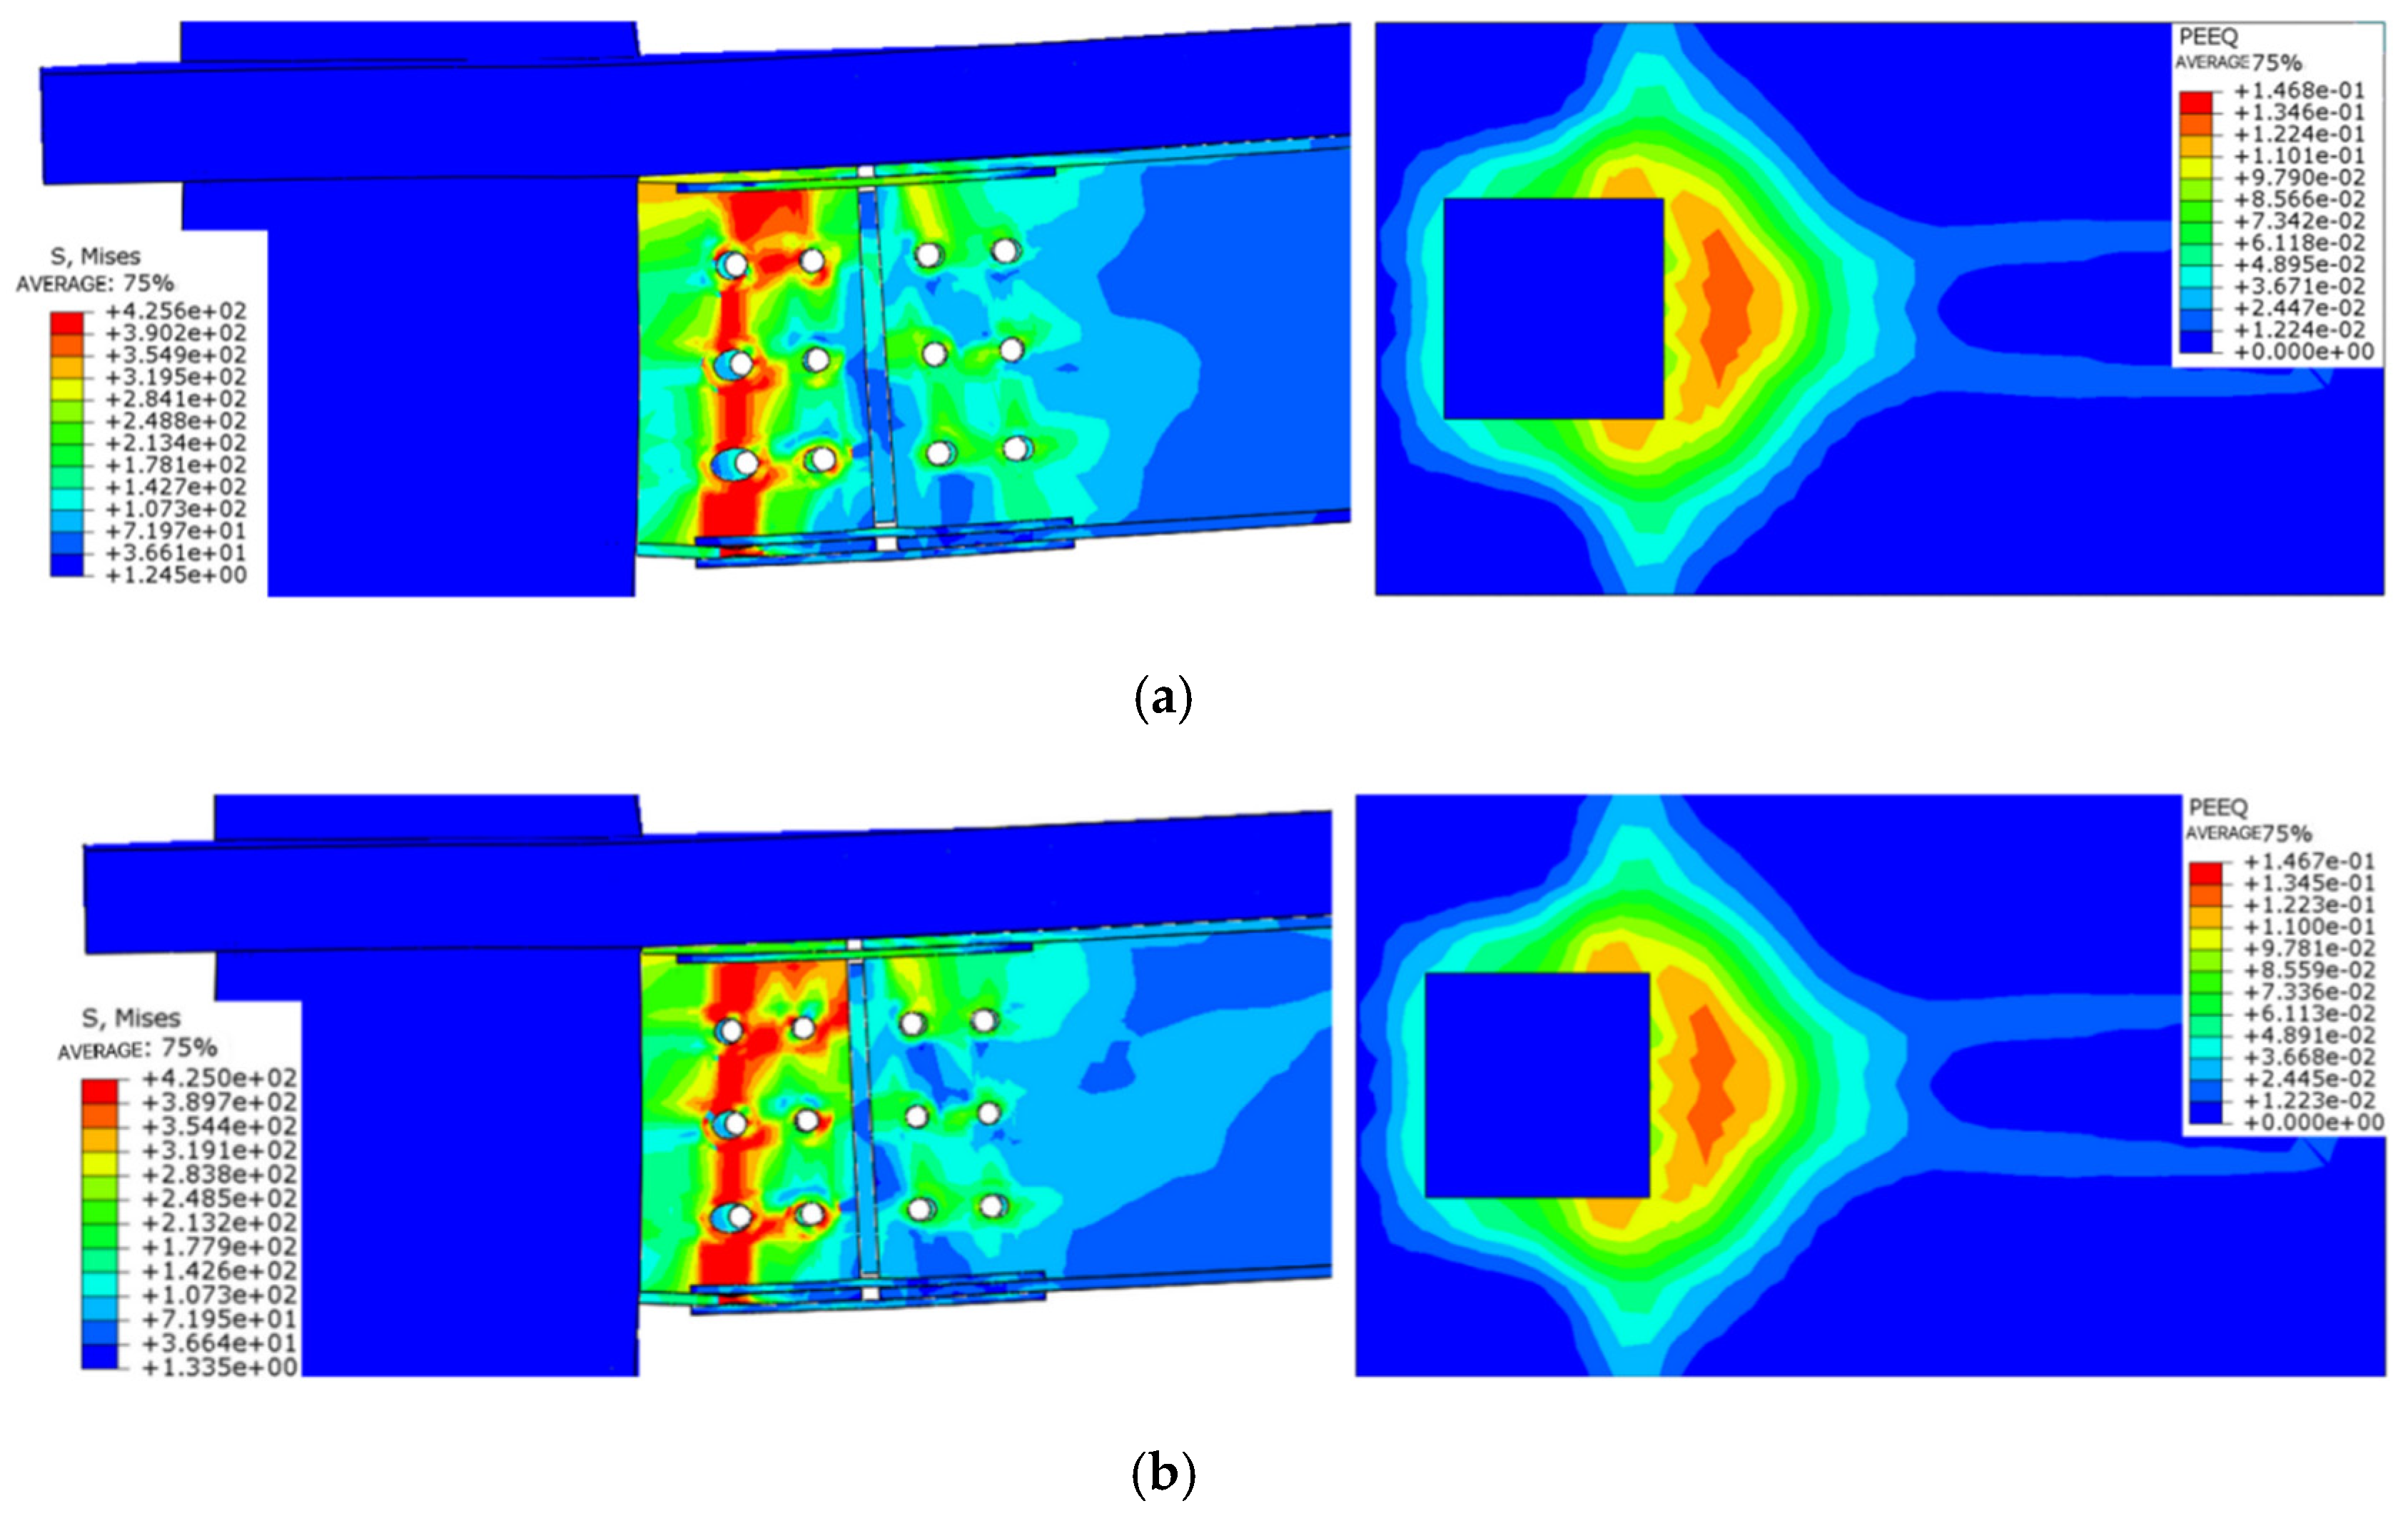
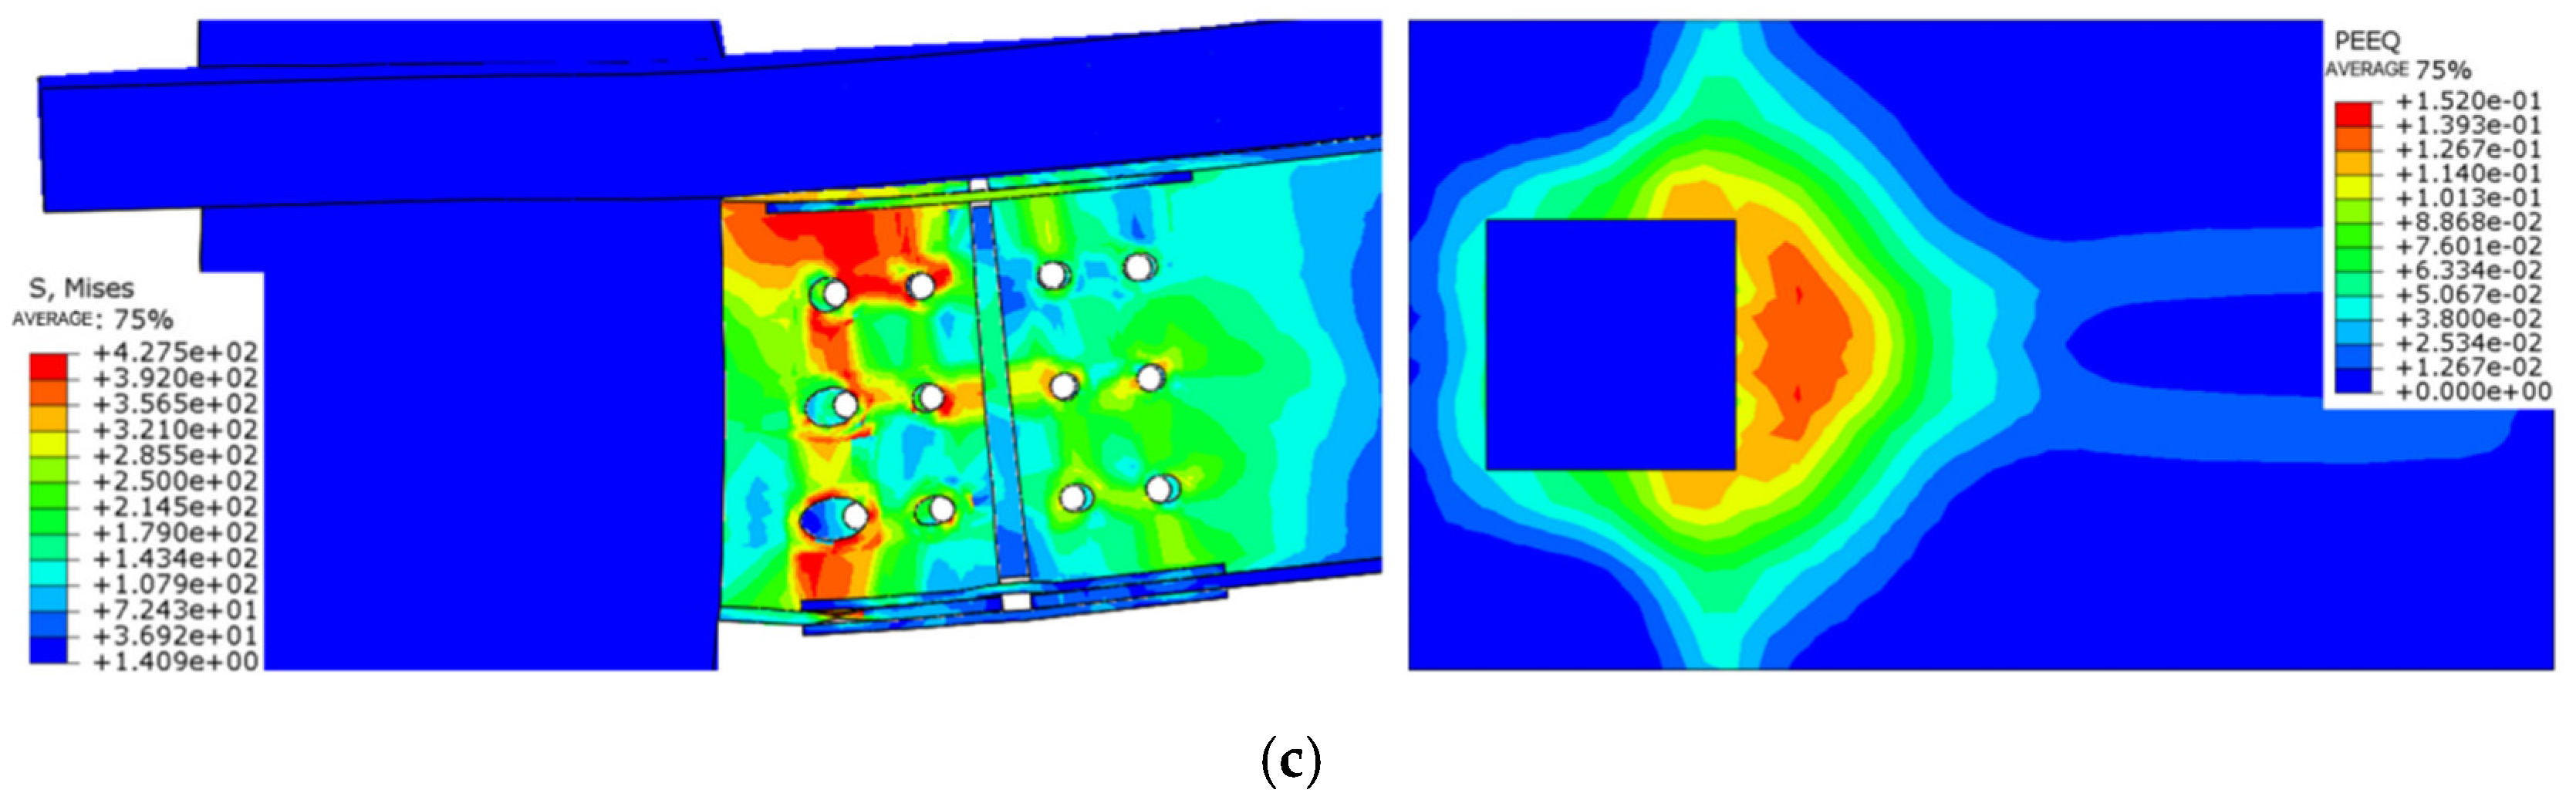
4.3.1. Destructive Form

In this node model, high-strength bolts are used to tighten the bearing steel plate at the connection of the steel beam, ensuring complete contact between the plate and the beam for effective stress transfer. Plastic hinges develop at the lower flange of the beam in all three joints, leading to buckling deformation in the lower flange bearing plate. Analysis indicates that increasing the preload effectively enhances the joint’s stiffness and load-bearing capacity by strengthening the normal contact between the steel beam and the connecting plate. The resulting failure modes are illustrated in Figure 21.

4.3.2. Curve Characteristics and Ductility

The increase in the high-strength bolt preload significantly optimizes the hysteresis curve of the RCS composite joint and improves the ultimate bearing capacity and seismic performance of the joint.
Increasing the preload of the high-strength bolt can significantly improve the initial stiffness and ultimate bearing capacity of the RCS composite node, as shown in Figure 22.
An excessively high preload on the high-strength bolts can reduce the ductility of the RCS composite joint when the slab interaction effects are considered. Specifically, the ductility of joint FJD-10 is found to be 26.3% and 30.7% lower than that of joints FJD-0 and FJD-9, respectively (Table 6). Therefore, in practical engineering applications, it is essential to adjust the bolt preload appropriately to balance the joint’s stiffness, load capacity, and ductility, thereby optimizing its seismic performance.

4.3.3. Energy Consumption and Stiffness Degradation

Under cyclic loading, increasing the preload of the high-strength bolts can reduce the energy dissipation capacity of the joint. During the initial loading phase, the energy dissipation capacity of joint FJD-9 is significantly greater than that of joints FJD-0 and FJD-10. However, as the loading continues, the energy dissipation capacities of joints FJD-0 and FJD-10 begin to increase, while the energy dissipation curve for joint FJD-9 flattens, approximating a stable linear profile. Regarding stiffness degradation, a higher preload leads to the increased initial stiffness of the joint. Although this results in higher initial energy dissipation, joints FJD-0 and FJD-10 exhibit a faster rate of stiffness degradation once they enter the elastic–plastic stage (Table 7). As the steel beams continue to develop plastic deformation, the trend of stiffness degradation stabilizes. Implementing a greater bolt preload reduces the likelihood of localized failure, demonstrating that an appropriate preload is crucial for optimizing the energy dissipation performance of the joint (Figure 23).

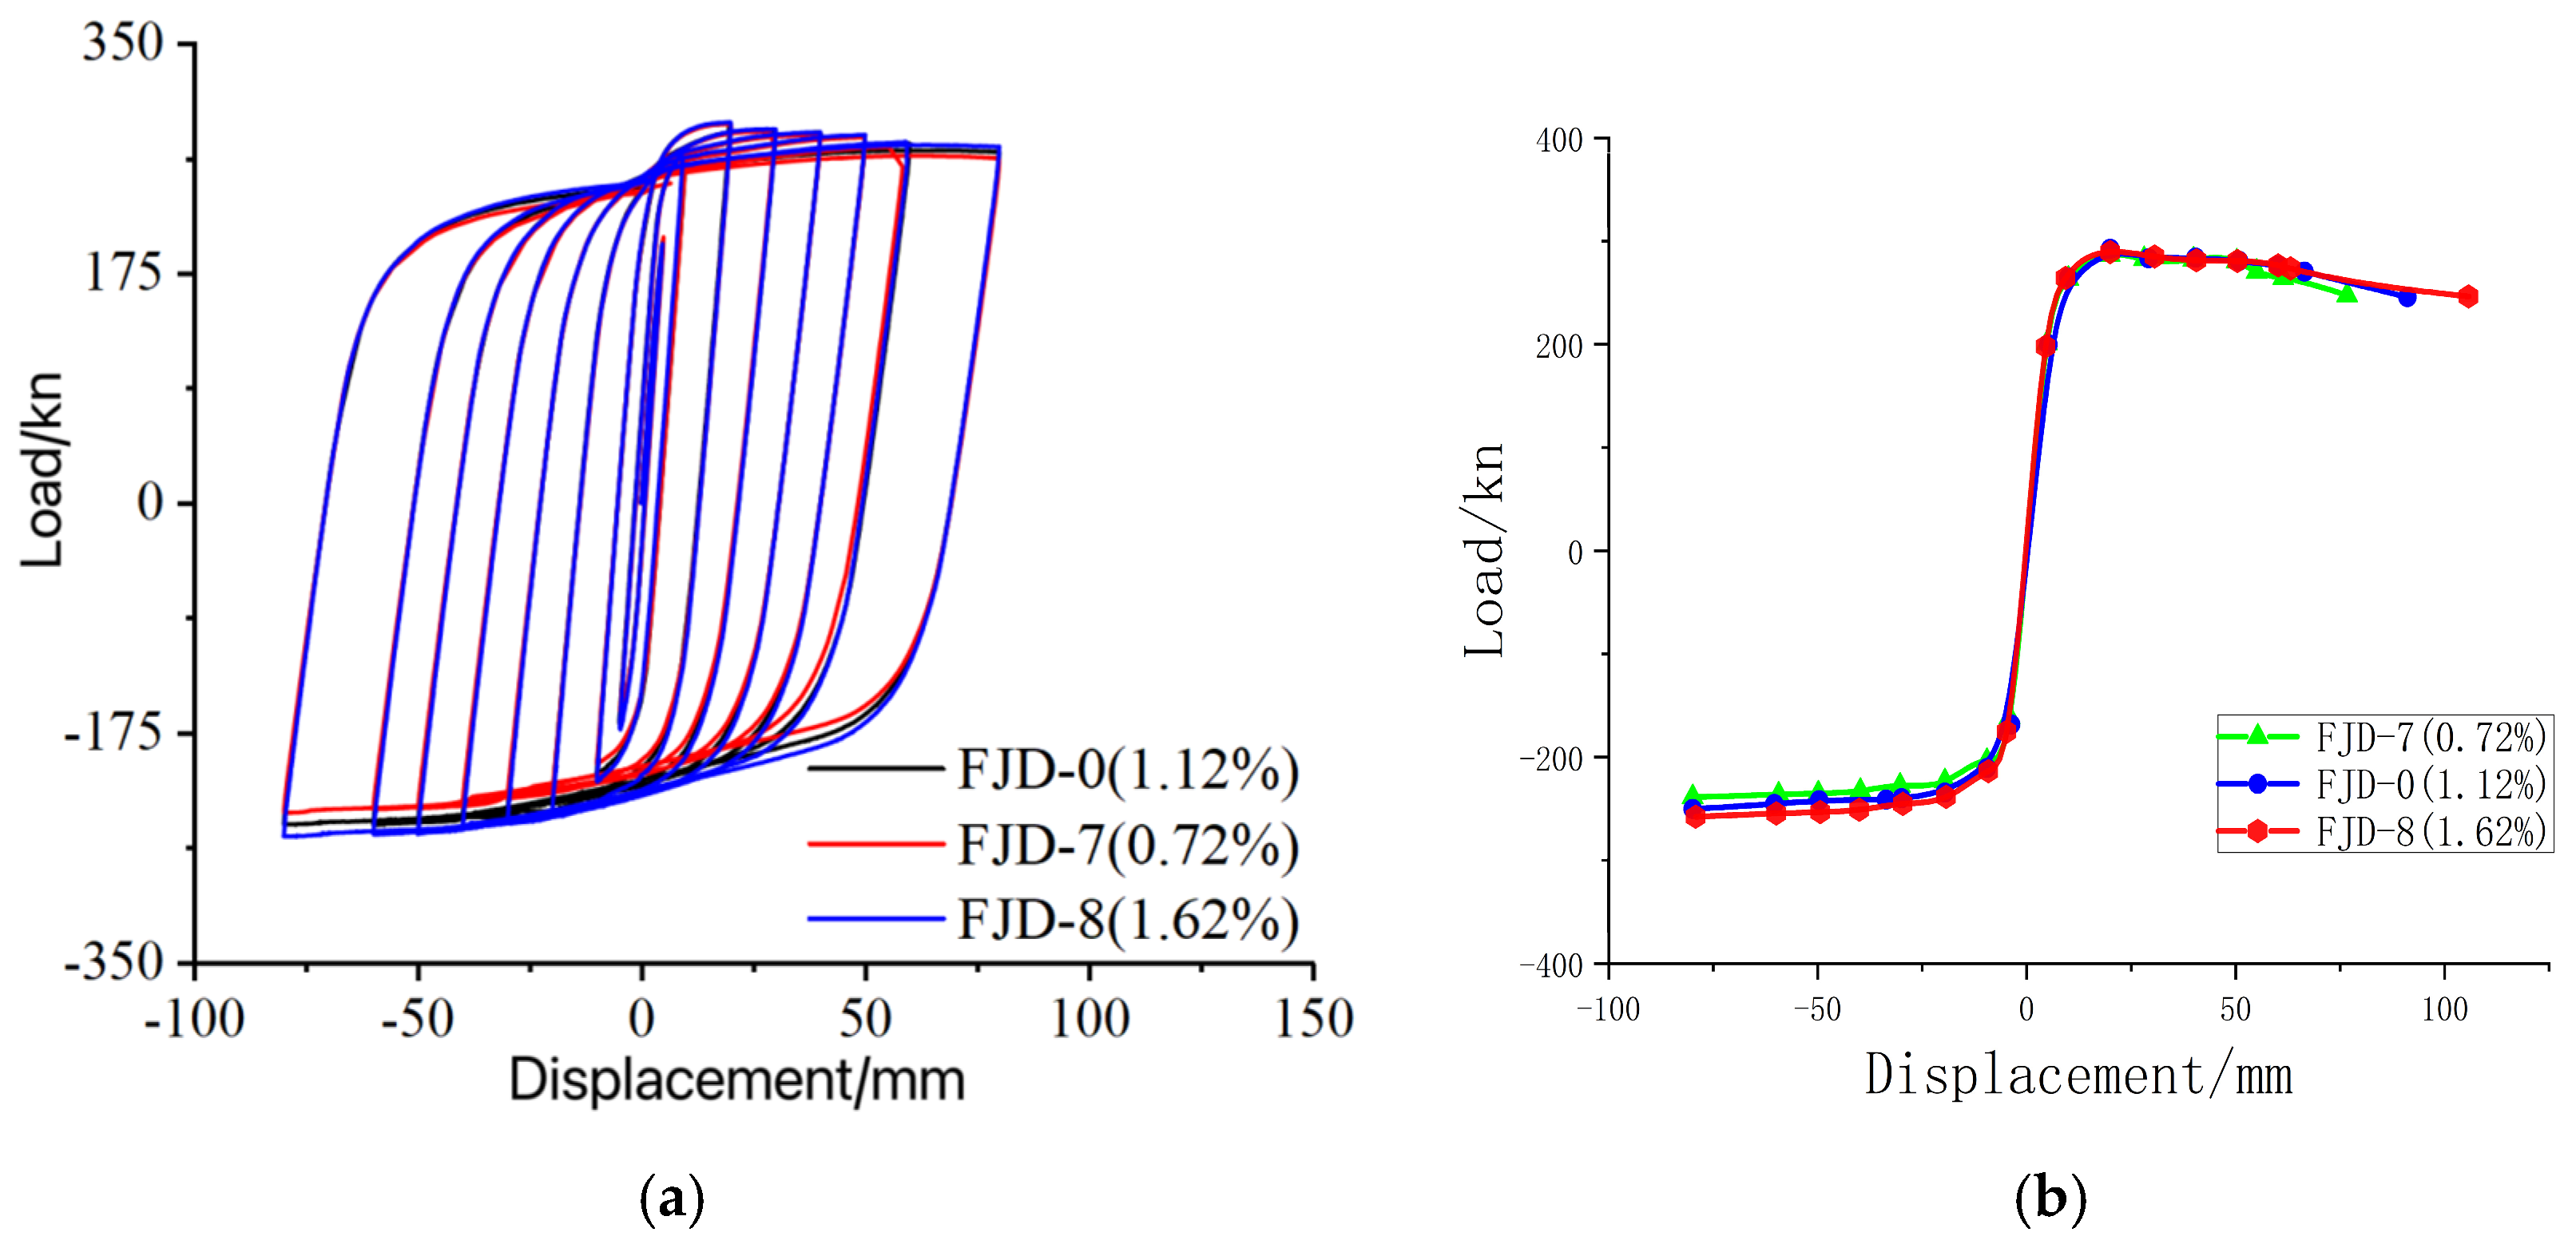
4.4. The Influence of Slab Reinforcement Rate on Seismic Performance of Nodes

This section, based on node FJD-0, uses the slab reinforcement ratio as the analysis parameter. By changing the diameter of the load-bearing reinforcement, two different combinations of nodes FJD-7 and FJD-8 with varying slab reinforcement ratios are designed. The diameters of the load-bearing reinforcement for each node are 10 mm, 8 mm, and 12 mm, respectively, with slab reinforcement ratios of 1.12%, 0.72%, and 1.62%. Other parameters remain unchanged for seismic performance comparison analysis.

4.4.1. Destructive Form

The influence of the slab reinforcement rate on the failure mode of the node is limited (Figure 24). Although the buckling deformation and stress concentration of the lower flange and pressure steel plate of the steel beam do not change significantly, the increase in the reinforcement rate slightly improves the tensile strength of the concrete, resulting in local buckling and narrowing the maximum stress distribution range.

4.4.2. Energy Consumption and Stiffness Degradation

The hysteresis curves demonstrate that the impact of different slab reinforcement ratios on joint performance is most pronounced during the negative loading phase. Under cyclic loading, variations in the slab reinforcement ratio have a minimal effect on the shape and trend of the hysteresis curves. However, during negative loading, an increase in the reinforcement ratio enhances the joint’s negative load-bearing capacity (Figure 25).

4.4.3. Energy Consumption and Stiffness Degradation

The trends in the equivalent damping coefficients and energy dissipation coefficients for joints with different reinforcement ratios are similar, with the initial energy dissipation curves overlapping. An increased reinforcement ratio enhances the energy dissipation capacity. However, during the yield phase, the degradation rate accelerates, ultimately converging to a similar value. Notably, the energy dissipation coefficient for joint FJD-7, with a slab reinforcement ratio of 0.72%, is slightly lower than the seismic design requirement of 3.0. Overall, variations in reinforcement ratios have a limited impact on stiffness (Table 8). This indicates that reasonable reinforcement can improve the seismic performance to some extent, but the effect is limited (Figure 26).

4.5. The Influence of Floor Concrete Strength on Seismic Performance of Nodes

4.5.1. Destructive Form

Figure 27 shows the stress cloud diagrams of steel beams and the equivalent plastic strain of floor slabs under different concrete strengths, as well as the impact on node failure. The results indicate that with an increasing concrete strength, the degree of buckling deformation at steel beam nodes decreases, while the stress values increase, and the plastic deformation area in concrete floors significantly narrows. This suggests that enhancing the strength of floor concrete can effectively limit the propagation of floor cracks, while also improving the stiffness and load-bearing capacity of the nodes.

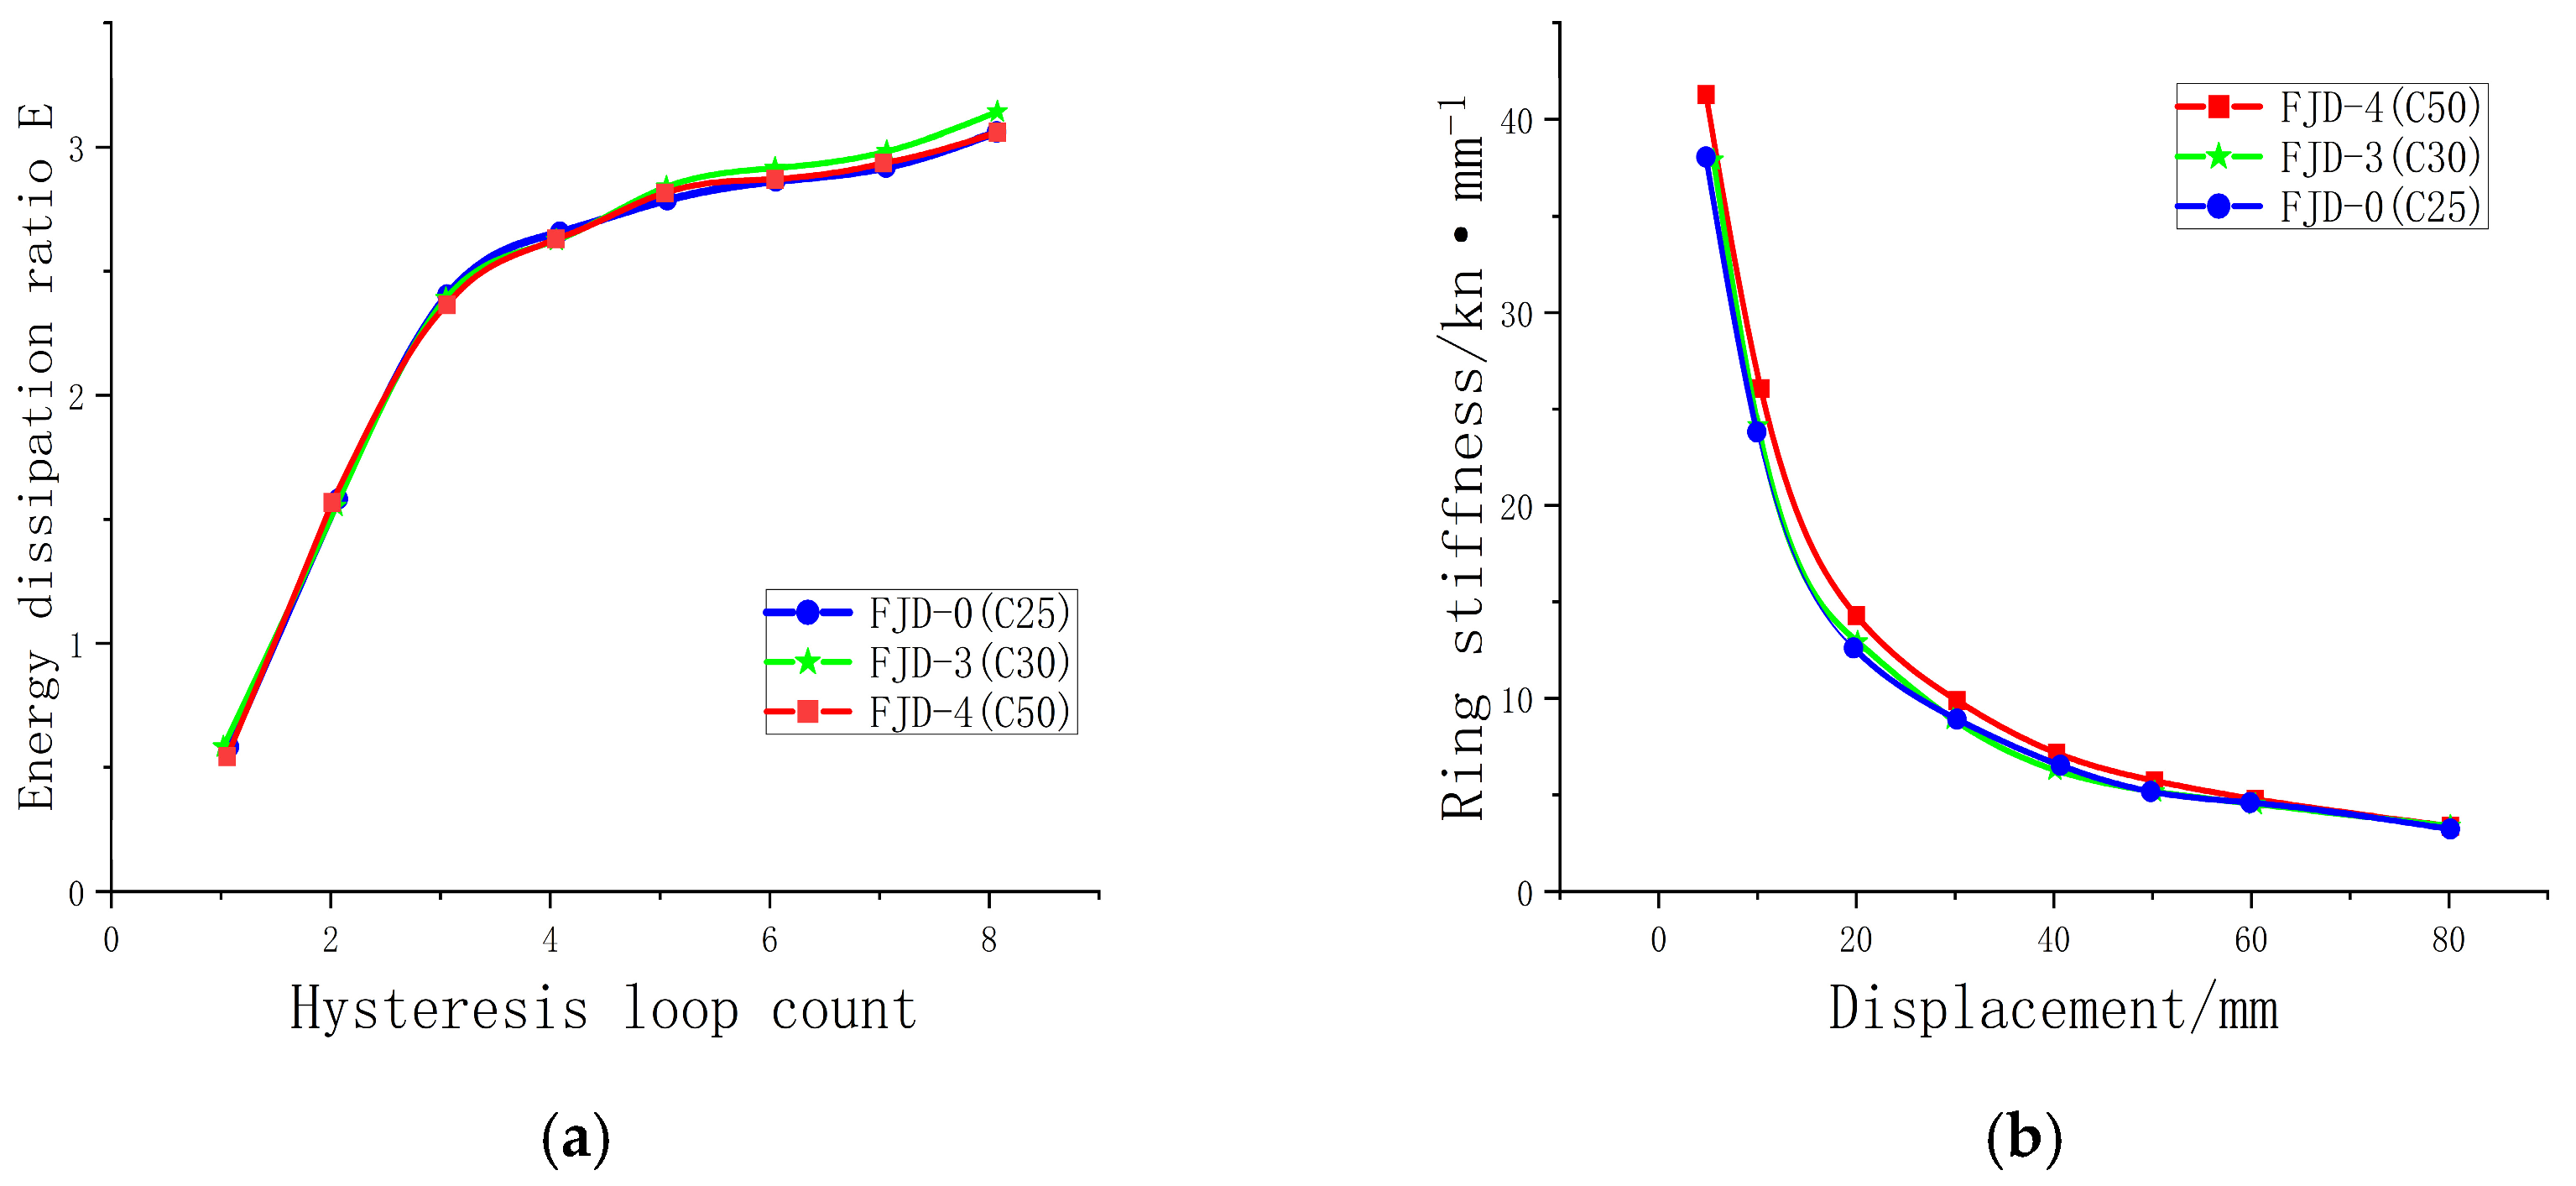
4.5.2. Curve Characteristics and Ductility

The hysteresis curves of each joint model are evaluated considering the effects of different concrete strength grades in the slabs. Under cyclic loading, it is observed that with the increase in concrete strength, the bearing capacity of the joints shows a slight improvement, and the energy dissipation capacity is enhanced as well. Notably, the increase in bearing capacity during positive loading is more pronounced than that during negative loading.
When studying the impact of different slab concrete strengths on the skeleton curve of prefabricated modular RCS composite joints, as shown in Figure 28, we found that during the early stage of cyclic loading, when the displacement is less than 20 mm, the skeleton curves of all joints are basically consistent, demonstrating a linear relationship between load and displacement. As the load continues to be applied, the joints enter the yielding phase, and the increase in the slab concrete strength leads to an increase in the slope of the skeleton curve. Additionally, for peak differences between positive and negative loading directions, the improvement in joint capacity under positive loading is more significant than that under negative loading. Increasing the concrete strength slightly enhances the joint capacity (model shows a 4.5–7.5% increase in positive loading), but weakens ductility (reducing by about 5.8–6.3%). The enhancement of slab strength has a more significant impact on the positive loading capacity and shortens the deformation cycle both during yielding and failure. Overall, ordinary concrete meets seismic requirements, while high-strength concrete has a limited effect, and design should balance cost and performance. These observations indicate that increasing the slab concrete strength can enhance the load-bearing capacity of prefabricated modular RCS composite joints when considering the combined effect of slabs to some extent.

4.5.3. Energy Consumption and Stiffness Degradation

Analyzing the impact of different concrete strengths on the node energy dissipation performance (Table 9) reveals that the energy dissipation capability in the elastic stage slightly increases with the increase in the slab concrete strength. In the elastoplastic stage, Node FJD-3 (ordinary concrete C30) shows a significant improvement in energy dissipation, increasing by 2.95% compared to Node FJD-0; in contrast, Node FJD-4 (high-strength concrete) experiences a rapid decrease in energy dissipation. This is because the higher stiffness of high-strength concrete may lead to stiffness mismatch between the slab and beam–column nodes, causing stress concentration and reducing energy dissipation capabilities. Therefore, it is essential to ensure that the slab strength grade matches the node during design.
Compared to the stiffness degradation (Figure 29), the stiffness trends of nodes FJD-3 and FJD-0 are similar, while node FJD-4 initially has higher ring stiffness, but as the load increases, the stiffness degradation accelerates. Ultimately, the stiffness degradation trends of all joints converge, primarily due to the brittle nature of the concrete material. This brittleness leads to the gradual fatigue failure of the concrete under cyclic loading, causing it to eventually withdraw from its effective bearing capacity.

5. Conclusions and Prospect

This study focuses on a new type of prefabricated modular RCS hybrid structural node. By designing a RCS composite node that considers the combined effect of floor slabs, we used the finite element software ABAQUS for detailed modeling. The effectiveness and reliability of the adopted research methods were verified through comparison with existing experimental data. We further analyzed the seismic performance of prefabricated modular RCS nodes with or without floor slab involvement, and explored the impact of various parameters such as the axial compression ratio, bolt preload, reinforcement ratio, and floor slab concrete strength on the seismic performance of the nodes through numerical simulations. Based on the above research, we draw the main conclusions.
First of all, the comparison between the results of the low-cycle repetitive loading failure mode, hysteresis curve and skeleton curve of the finite element simulation, and the existing test data shows that the failure position is consistent, the curve shape is similar, and the nodes show good seismic performance in line with the design principle of “strong column and weak beam”.
Additionally, the participation of the floor transforms the steel beam into a composite section formed by the concrete slab and the steel beam, significantly increasing the effective height and stiffness, thereby greatly improving the seismic performance of the RCS composite joints. The hysteresis loops of the RCS joints accounting for the floor slab exhibit fuller shapes compared to those without a floor slab, demonstrating an enhanced energy dissipation capacity, ultimate load capacity, and stiffness. Although ductility experiences a slight decrease, it still meets practical application requirements.
Our research has revealed that both the axial compression ratio and the concrete strength of the slab significantly influence the seismic performance of the joints. A moderate increase in the axial compression ratio can enhance the core confinement and shear capacity of the joint. However, excessively high axial compression ratios may lead to concrete failure, thereby compromising the seismic performance. At the same time, increasing the strength of the slab concrete can improve compressive performance, but too much strength can result in stiffness mismatch, reducing energy dissipation and ductility. Therefore, it is necessary to reasonably select relevant parameters during design to achieve optimal performance. The thickness of the slab, reinforcement ratio, and bolt preload are equally crucial for the seismic performance of the joints. Increasing the slab thickness enhances the effective height of the composite beam section, thereby improving both the load-carrying capacity and energy dissipation capabilities. Elevating the reinforcement ratio bolsters the tensile strength of the concrete, which improves performance under negative loading. Additionally, increasing the bolt preload directly influences the stability of the connections, enhancing the seismic performance of the joints. Therefore, a rational combination of these design parameters will contribute to optimizing the seismic performance of the joints.
Despite the phased achievements of the research, further exploration is still needed in the following areas: First, the current model does not consider the impact of assembly errors within a certain range during construction on the long-term performance of nodes. Future studies could integrate digital twin technology to conduct lifecycle performance evolution research. Second, this study primarily relies on finite element simulation. In the future, experimental validation should be combined to enhance the reliability of conclusions. Third, machine learning algorithms such as neural networks can be integrated to intelligently optimize hundreds of parametric samples, breaking through the efficiency bottleneck of traditional trial-and-error methods.
At the same time, we also recognize that the seismic design of full-scale structural systems faces multiple challenges. The installation accuracy of precast and assembled RCS combination nodes is influenced by factors such as the difficulty in controlling pre-tensioning forces, and variations in environmental factors may lead to the abnormal development of concrete strength. While increasing the thickness of floor slabs or the pre-tensioning force of bolts can enhance seismic performance, it may also lead to higher construction costs. Uncertainties such as construction sequencing and personnel changes can impact construction quality and progress, which in turn affects seismic performance. Therefore, it is essential to optimize structural design, reasonably select relevant parameters, strengthen construction management, improve stiffness and load-bearing capacities, and enhance energy dissipation capabilities. The use of precise equipment and information technology, along with stringent quality control measures, is necessary to ensure that construction accuracy meets standards and to promote the development of actual engineering projects.
As prefabricated RCS composite structures increasingly meet the high standards of modern engineering, their widespread application becomes ever more critical. We will continue to strive towards further exploring the mechanical performance of new types of joints in frame structures and analyzing their dynamic responses under seismic loading. We aim to contribute to the overall enhancement of safety and sustainability in building projects.

Author Contributions

Conceptualization, J.J. and Y.Z.; methodology, Y.Z. and Z.L.; software, Y.Z.; validation, Y.Z. and Z.L.; formal analysis, J.J. and Y.Z.; investigation, Y.Z.; resources, J.J.; data curation, Y.Z.; writing—original draft preparation, Y.Z.; writing—review and editing, J.J. and Z.L.; visualization, Y.Z.; supervision, J.J. and Z.L.; project administration, J.J. and Y.Z.; funding acquisition, J.J. and Y.Z. and Z.L. All authors have read and agreed to the published version of the manuscript.

Funding

This research was funded by the National Natural Science Foundation of China (Grant No. 51908108).

Institutional Review Board Statement

Not applicable.

Informed Consent Statement

Not applicable.

Data Availability Statement

The data presented in this study are available on request from the corresponding author. The data are not publicly available due to privacy.

Conflicts of Interest

The authors declare no conflicts of interest.

References

  1. Jayawardana, J.; Sandanayake, M.; Jayasinghe, J.; Kulatunga, A.K.; Zhang, G. Sustainability Drivers and Sustainable Development Goals-Based Indicator System for Prefabricated Construction Adoption—A Case of Developing Economies. Buildings 2025, 15, 1037. [Google Scholar] [CrossRef]
  2. Yang, Z.; Hu, S.; Xu, T.; Yan, D.; Jiang, Y. Method and application of global building operation energy use and carbon emissions comparison in the context of carbon neutrality. Adv. Clim. Change Res. 2023, 19, 749–760. [Google Scholar]
  3. Mostafaei, H.; Ashoori Barmchi, M.; Bahmani, H. Seismic Resilience and Sustainability: A Comparative Analysis of Steel and Reinforced Structures. Buildings 2025, 15, 1613. [Google Scholar] [CrossRef]
  4. Cando-Jácome, M.; Martínez-Graña, A. Differential Interferometry, Structural Lineaments and Terrain Deformation Analysis Applied in Zero Zone 2016 Earthquake (Manta, Ecuador). Environ. Earth Sci. 2019, 78, 499. [Google Scholar] [CrossRef]
  5. Ibrahim, A.R.; Makhloof, D.A.; Ren, X. Seismic Performance and Collapse Analysis of RC Framed-Wall Structure Excited with Turkey/Syria Destructive Earthquake. Structures 2024, 59, 105774. [Google Scholar] [CrossRef]
  6. Labibzadeh, M.; Zakeri, M.; Shoaib, A.A. A New Method for CDP Input Parameter Identification of the ABAQUS Software Guaranteeing Uniqueness and Precision. Int. J. Struct. Integr. 2017, 8, 264–284. [Google Scholar] [CrossRef]
  7. Parra-Montesinos, G.; Wight, J.K. Seismic Response of Exterior RC Column-to-Steel Beam Connections. J. Struct. Eng. 2000, 126, 1113–1121. [Google Scholar] [CrossRef]
  8. Parra-Montesinos, G.; Wight, J.K. Modeling Shear Behavior of Hybrid RCS Beam-Column Connections. J. Struct. Eng. 2001, 127, 3–11. [Google Scholar] [CrossRef]
  9. Xu, J.D.; Ping, T.J.; Liao, H.; Dong, F.F.; Li, K.; Du, G.F. Seismic Behavior of Concrete Filled Steel Tubular Columns with Consideration of Floor Combination. Sci. Technol. Eng. 2020, 20, 10864–10870. [Google Scholar]
  10. Wang, J.F.; Jiang, S.; Guo, L.; Zhang, M. Experimental study on seismic performance of concrete-filled double steel tubular column composite connections with high strength blind bolts. J. Build. Struct. 2021, 42, 93–102. [Google Scholar]
  11. Zhong, W.H.; Tan, Z.; Song, X.Y.; Meng, B.; Zhang, Y.H. Anti-collapse performance of beam-column substructures based on the composite effect of floor slabs. J. Vib. Shock 2021, 40, 261–270. [Google Scholar]
  12. Azar, B.F.; Ghaffarzadeh, H.; Talebian, N. Seismic Performance of Composite RCS Special Moment Frames. KSCE J. Civ. Eng. 2013, 17, 450–457. [Google Scholar] [CrossRef]
  13. Du, K.P.; Wang, T.L.; Shi, J.M.; Qiu, J.P.; Qi, Z.C. Effects of Bolt Preload on Plate Fretting Behavior of 2024 Aluminum Alloy Laminates Based on Numerical Model. Mach. Build. Autom. 2024, 53, 164–167+184. [Google Scholar]
  14. Ruggieri, S.; Porco, F.; Uva, G. A practical approach for estimating the floor deformability in existing RC buildings: Evaluation of the effects in the structural response and seismic fragility. Bull. Earthq. Eng. 2020, 18, 2083–2113. [Google Scholar] [CrossRef]
  15. Ruggieri, S.; Vukobratović, V. Acceleration demands in single-storey RC buildings with flexible diaphragms. Eng. Struct. 2023, 275, 115276. [Google Scholar] [CrossRef]
  16. Pan, Z.H.; Li, A.Q. Performance-based seismic design method for buildings:Discussion on application of “general rule for performance based seismic design of buildings” To design of buildings. Ind. Constr. 2008, 38, 103–106. [Google Scholar]
  17. GB/T 50081—2002; Standard for Mechanical Properties Test of Ordinary Concrete. Ministry of Housing and Urban-Rural Development, PRC China Architecture & Building Press: Beijing, China, 2003.
  18. GB/T 228—2002; Method for Tensile Test of Metal Materials at Room Temperature. Ministry of Housing and Urban-Rural Development of the Peoples Republic of China China Architecture & Building Press: Beijing, China, 2002.
  19. Pashazad, H.; Kharazi, M. A Peridynamic Plastic Model Based on von Mises Criteria with Isotropic, Kinematic and Mixed Hardenings under Cyclic Loading. Int. J. Mech. Sci. 2019, 156, 182–204. [Google Scholar] [CrossRef]
  20. Liu, C.; Nie, X.; Wang, J.; Fan, J.; Tao, M. State-of-the-Art of Macroscopic Constitutive Models of Concrete. Jianzhu Jiegou Xuebao/J. Build. Struct. 2022, 43, 29–41. [Google Scholar] [CrossRef]
  21. GB 50010—2010; Code for Design of Concrete Structures. Ministry of Housing and Urban-Rural Development, PRC China Architecture & Building Press: Beijing, China, 2010.
  22. Supartono, F.; Sidoroff, F. Anisotropic Damage Modelling for Brittle Elastic Materials. Arch. Mech. 1985, 37, 521–534. [Google Scholar]
  23. Abramowicz, M.; Pełka-Sawenko, A. Comparison of the Finite Element Method and Rigid Finite Element Method During Dynamic Calculations of Steel–Concrete Composite Beams Based on Experimental Results. Materials 2024, 17, 6081. [Google Scholar] [CrossRef]
  24. GB50011-2010; Seismic Design Code for Buildings. Ministry of Housing and Urban-Rural Development, PRC China Architecture & Building Press: Beijing, China, 2010.
  25. JGJ 138—2016; Code for Design of Composite Structures. Ministry of Housing and Urban-Rural Development, PRC China Architecture & Building Press: Beijing, China, 2016.
  26. Zhou, K.P.; Yi, W.J.; Yi, F.; Sun, J.M.; Huang, Y.; Zhang, W.X. Experimental Study on Anchorage Performance and Mechanism of Hooked Bars with a Pre-Yield Anchorage Failure. Structures 2023, 57, 105067. [Google Scholar] [CrossRef]
  27. Furukawa, S.; Iwami, R.; Kimura, Y. Development of an Environmentally Friendly Steel Structural Framework: Evaluation of Bending Stiffness and Yield Bending Moment of Cross-Laminated Timber Slab–H-Shaped Steel Composite Beams for Component Reuse. Sustainability 2025, 17, 2073. [Google Scholar] [CrossRef]
  28. JGJ 82—2011; Technical Specification for High Strength Bolted Connections in Steel Structures. Ministry of Housing and Urban-Rural Development, PRC China Architecture & Building Press: Beijing, China, 2011.
  29. Wang, B.; Gao, X.; Chen, A.; Yuan, L.; Wan, H.; Wang, Z. Optimization Study of Strengthened T-Shaped Concrete-Filled Steel Tubular (CFST) Column-Steel Beam Joint. J. Constr. Steel Res. 2024, 223, 109020. [Google Scholar] [CrossRef]
  30. Ling, Y.; Zheng, W.; Li, Y.; Zhou, L.; Zhou, J. Study on Seismic Behavior of Reinforced Concrete Column-Steel Beam Side Joints. J. Asian Archit. Build. Eng. 2020, 19, 187–202. [Google Scholar] [CrossRef]
  31. Chepurnenko, A.; Turina, V.; Akopyan, V. Optimizing the Location of Supports under a Monolithic Floor Slab. CivilEng 2024, 5, 502–520. [Google Scholar] [CrossRef]
  32. Yu, S.J.; Chen, S.S.; Zhou, F.; Liu, J.M.; Wu, C.L.; Wang, P.F. Analysis of the influence of axial compression ratio on the seismic performance of assembled SRC column to composite beam joints. Concrete 2021, 116–122. [Google Scholar]
Figure 1. Node detailing.
Applsci 15 06669 g001
Figure 2. Stress–strain curve of concrete under uniaxial compression.
Applsci 15 06669 g002
Figure 3. Uniaxial tensile stress–strain curve of concrete.
Applsci 15 06669 g003
Figure 4. Schematic diagram of concrete stiffness recovery under tension and compression.
Applsci 15 06669 g004
Figure 5. Framework model node selection.
Applsci 15 06669 g005
Figure 6. Grid division. (a) Grid encryption area; (b) Overall grid.
Applsci 15 06669 g006
Figure 7. Boundary condition settings.
Applsci 15 06669 g007
Figure 8. Comparison of test and simulation node damage morphology.
Applsci 15 06669 g008
Figure 9. (a) Comparison chart of experimental and simulated hysteresis curves; (b) Comparison of experimental and simulated skeleton curves; (c) Comparison of stiffness degradation curves.
Applsci 15 06669 g009
Figure 10. Design diagram of node FJD-0.
Applsci 15 06669 g010
Figure 11. FEM model of 3-node FJD-0.
Applsci 15 06669 g011
Figure 12. The damage pattern of node FJD-0. (a) Stress cloud map of node FJD-0; (b) Stress cloud map of node steel beam; (c) Stress cloud map of node connection bolts.
Applsci 15 06669 g012aApplsci 15 06669 g012b
Figure 13. Comparison of hysteresis curves. (a) Hysteresis curve of node RCSJ3; (b) Hysteresis curve of node FJD-0.
Applsci 15 06669 g013
Figure 14. (a) Comparison of node skeleton curves; (b) Comparison of stiffness degradation of seven nodes; (c) Comparison of strength degradation of eight nodes.
Applsci 15 06669 g014
Figure 15. Comparison of failure modes of different axial compression ratio nodes; (a) Destruction pattern of node FJD-0; (b) Destruction pattern of node FJD-1; (c) Destruction pattern of node FJD-2.
Applsci 15 06669 g015
Figure 16. (a) Comparison of hysteresis curves of different axial compression ratio nodes; (b) Comparison of skeleton curves of different axial compression ratio nodes.
Applsci 15 06669 g016
Figure 17. (a) Comparison of energy dissipation coefficients of different axial compression ratio nodes; (b) Comparison of stiffness degradation of different axial compression ratio nodes.
Applsci 15 06669 g017
Figure 18. Comparison of failure modes of different floor thickness nodes. (a) Destruction morphology of node FJD-0; (b) Destruction morphology of node FJD-5; (c) Destruction morphology of node FJD-6.
Applsci 15 06669 g018
Figure 19. (a) Comparison of nodal hysteresis curves for different floor thicknesses; (b) Comparison of node skeleton curves with different floor thicknesses.
Applsci 15 06669 g019
Figure 20. (a) Comparison of energy consumption coefficients at different floor thickness nodes; (b) Comparison of stiffness degradation at different floor thickness nodes.
Applsci 15 06669 g020
Figure 21. Comparison of failure modes of different bolt preload nodes. (a) Destruction morphology of node FJD-0; (b) Destruction morphoFJD-9; (c) Destruction morphology of node FJD-10.
Applsci 15 06669 g021aApplsci 15 06669 g021b
Figure 22. (a) Comparison of hysteresis curves of different bolt preload nodes; (b) Comparison of skeleton curves of different bolt preload nodes.
Applsci 15 06669 g022
Figure 23. (a) Comparison of energy consumption coefficients of different bolt preload nodes; (b) Comparison of stiffness degradation curves of different bolt preload nodes.
Applsci 15 06669 g023
Figure 24. Comparison of failure modes of different slab reinforcement ratio nodes. (a) Destruction morphology of node FJD-0; (b) Destruction morphology of node FJD-7; (c) Destruction morphology of node FJD-8.
Applsci 15 06669 g024aApplsci 15 06669 g024b
Figure 25. (a) Comparison of hysteretic curves of different slab reinforcement nodes; (b) Comparison of node skeleton curves with different slab reinforcement rates.
Applsci 15 06669 g025
Figure 26. (a) Comparison of energy consumption coefficients of different slab reinforcement nodes; (b) Comparison of stiffness degradation of different slab reinforcement nodes.
Applsci 15 06669 g026
Figure 27. Comparison of failure modes of different floor concrete strength nodes. (a) Destruction morphology of node FJD-0; (b) Destruction morphology of node FJD-3; (c) Destruction morphology of node FJD-4.
Applsci 15 06669 g027aApplsci 15 06669 g027b
Figure 28. (a) Comparison of hysteretic curves at different concrete strength nodes; (b) Comparison of skeleton curves of different concrete strength nodes.
Applsci 15 06669 g028
Figure 29. (a) Comparison of dissipation coefficients of different concrete strength floor nodes; (b) Comparison of stiffness degradation of different concrete strength floor nodes.
Applsci 15 06669 g029
Table 1. Mechanical properties of steel materials.
Type of Steel f y / M P a f u / M P a E s / M P a
Steel beam305.8431.32.1 × 105
Load-bearing steel plate271.8428.02.0 × 105
HPB235289.5445.62.0 × 105
HRB335383.1558.22.0 × 105
Table 2. Parameters for the plastic damage model of concrete.
Model ParameterValue
expansion angle30°
deviation value0.1
σ b 0 / σ c 0 1.16
K c 2/3
coefficient of viscosity μ 0.005
Table 3. Node component material parameters.
Component NameComponent Materials and Properties
steel productsQ235B
steel sectionNH350 × 175 × 7 × 11 mm
short beams are embedded in the column590 mm
extruded steel beam1100 mm
steel stiffening rib332 × 84 × 10 mm
steel plate A345 × 175 × 8 mm
steel plate B345 × 80 × 8 mm
steel plate C330 × 300 × 6 mm
concrete strengthC30
concrete column2200 × 400 × 400 mm
reinforcing bars in columnsHRB335
column hoop reinforcementHPB235
High-strength friction grip boltGrade 10.9 M20
Table 4. Node number and parameter settings.
Node
Number
Column Axial
Pressure
(kn)
Column Shaft
Compression Ratio
Floor
Thickness (mm)
Reinforcement Diameter
of Floor
(mm)
Bolt
Preload (kn)
Reinforcement Ratio
of Floor
(%)
Floor
Concrete Strength Grade
FJD-05000.22100101551.12C25
FJD-18000.35100101551.12C25
FJD-214400.6100101551.12C25
FJD-34500.2100101551.12C30
FJD-44500.2100101551.12C50
FJD-54500.2110101551.12C25
FJD-64500.2120101551.12C25
FJD-74500.210081550.72C25
FJD-84500.2100121551.62C25
FJD-94500.210010551.12C25
FJD-104500.2100102251.12C25
Table 5. Characteristic values of node skeleton curves for different floor thicknesses.
Node NumberDirection of Load P y /kn Δ y /mm P u /kn Δ u /mmDuctility Factor μ Average
Ductility
Coefficient μ ¯
FJD-0forward
direction
254.88.98245.890.1910.048.11
negative
direction
212.912.92208.679.876.18
FJD-5forward
direction
267.18.92257.687.379.797.97
negative
direction
219.212.83212.378.796.14
FJD-6forward
direction
279.38.84269.583.619.467.81
negative
direction
225.612.71216.178.146.15
Table 6. Characteristic values of skeleton curves of different bolt preload nodes.
Node NumberDirection of Load P y /kn Δ y /mm P u /kn Δ u /mmDuctility Factor μ Average
Ductility
Coefficient μ ¯
FJD-0forward
direction
254.88.98245.890.1910.048.11
negative
direction
212.912.92208.679.876.18
FJD-9forward
direction
144.112.87149.6117.519.138.39
Negative
direction
119.511.45124.679.957.65
FJD-10forward
direction
314.99.90290.868.546.926.42
negative
direction
251.59.93237.679.985.91
Table 7. Comparison of energy consumption capacity of different bolt preload nodes.
Node NumberCapacity Dissipation Coefficient E Equivalent Viscosity
Coefficient h e
FJD-03.050.485
FJD-93.150.501
FJD-102.990.475
Table 8. Comparison of energy consumption capacity of different slab reinforcement nodes.
Node NumberCapacity Dissipation Coefficient E Equivalent Viscosity Coefficient h e
FJD-03.050.485
FJD-72.960.470
FJD-83.150.502
Table 9. Comparison of energy consumption capacity of different concrete strength floor nodes.
Node NumberCapacity Dissipation
Coefficient E
Equivalent Viscosity
Coefficient h e
FJD-03.050.485
FJD-33.140.499
FJD-43.040.483
Disclaimer/Publisher’s Note: The statements, opinions and data contained in all publications are solely those of the individual author(s) and contributor(s) and not of MDPI and/or the editor(s). MDPI and/or the editor(s) disclaim responsibility for any injury to people or property resulting from any ideas, methods, instructions or products referred to in the content.

