

Comparison of Dimensionality Reduction Approaches and Logistic Regression for ECG Classification
 , , and
Abstract
1. Introduction
2. Dataset Description and Processing
3. Materials and Methods
3.1. Dimensionality Reduction
3.1.1. Principal Component Analysis (PCA)
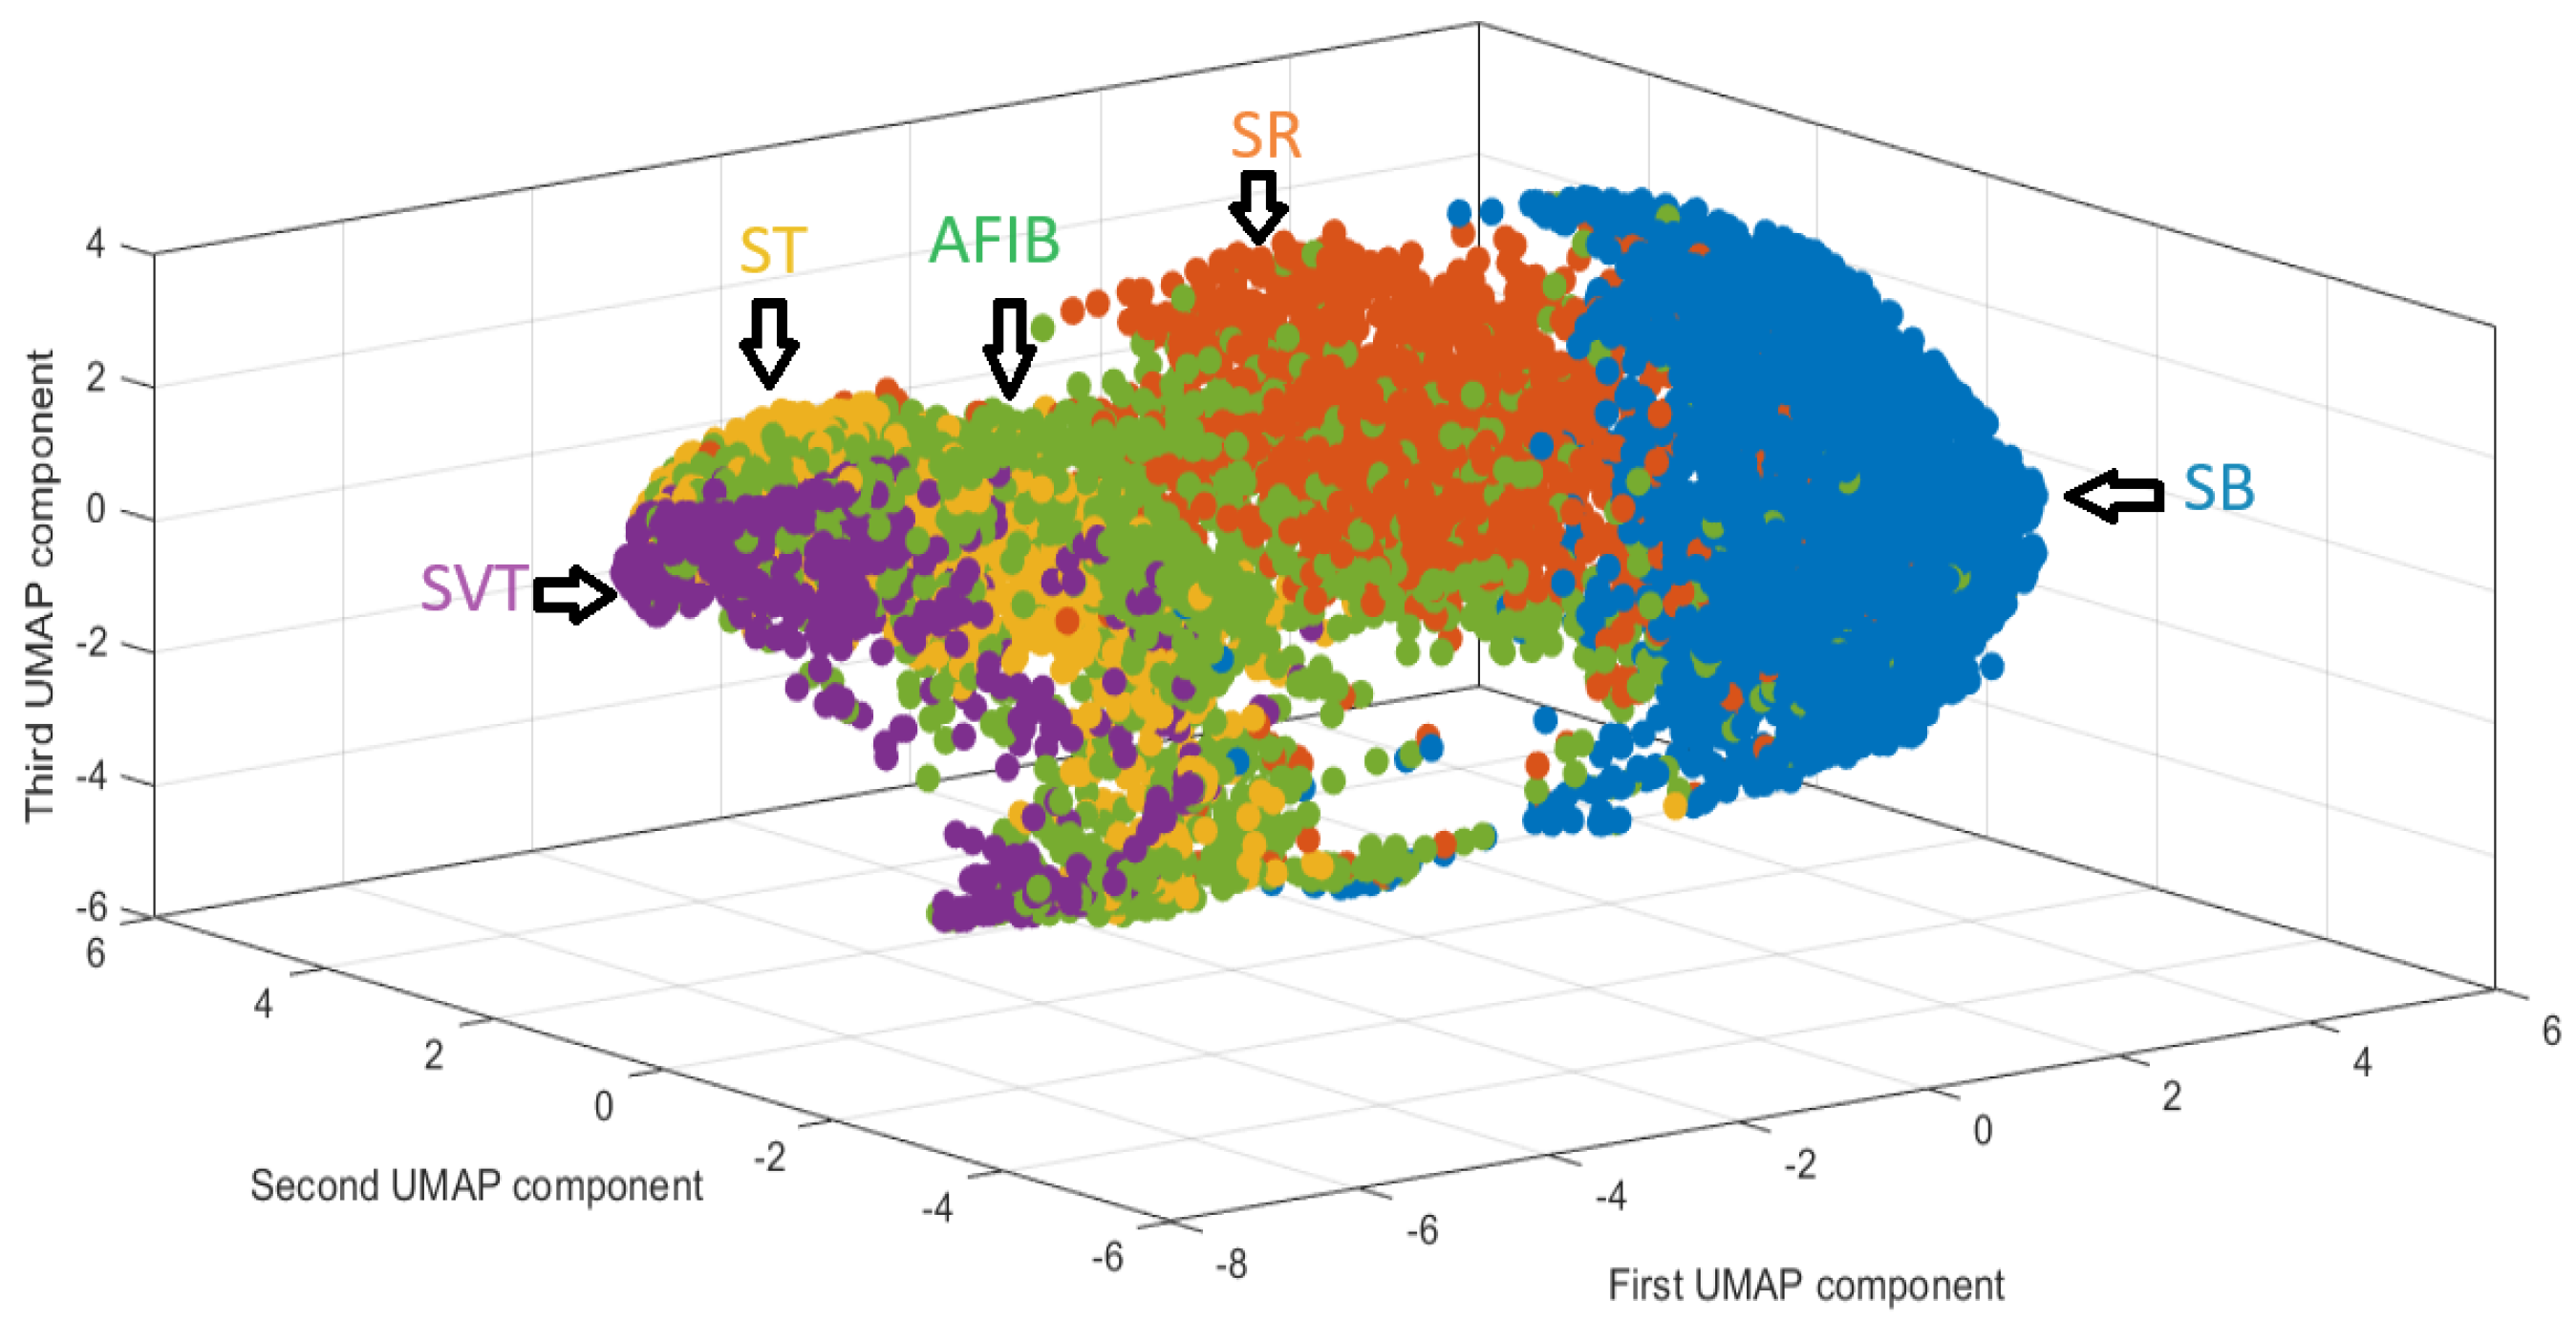
3.1.2. Uniform Manifold Approximation and Projection
| Algorithm 1 UMAP Algorithm |
|
3.2. Logistic Regression (LR)
3.2.1. Frequentist Approach (LR-ML)
3.2.2. Bayesian Logistic Regression
3.2.3. Algorithm Comparison
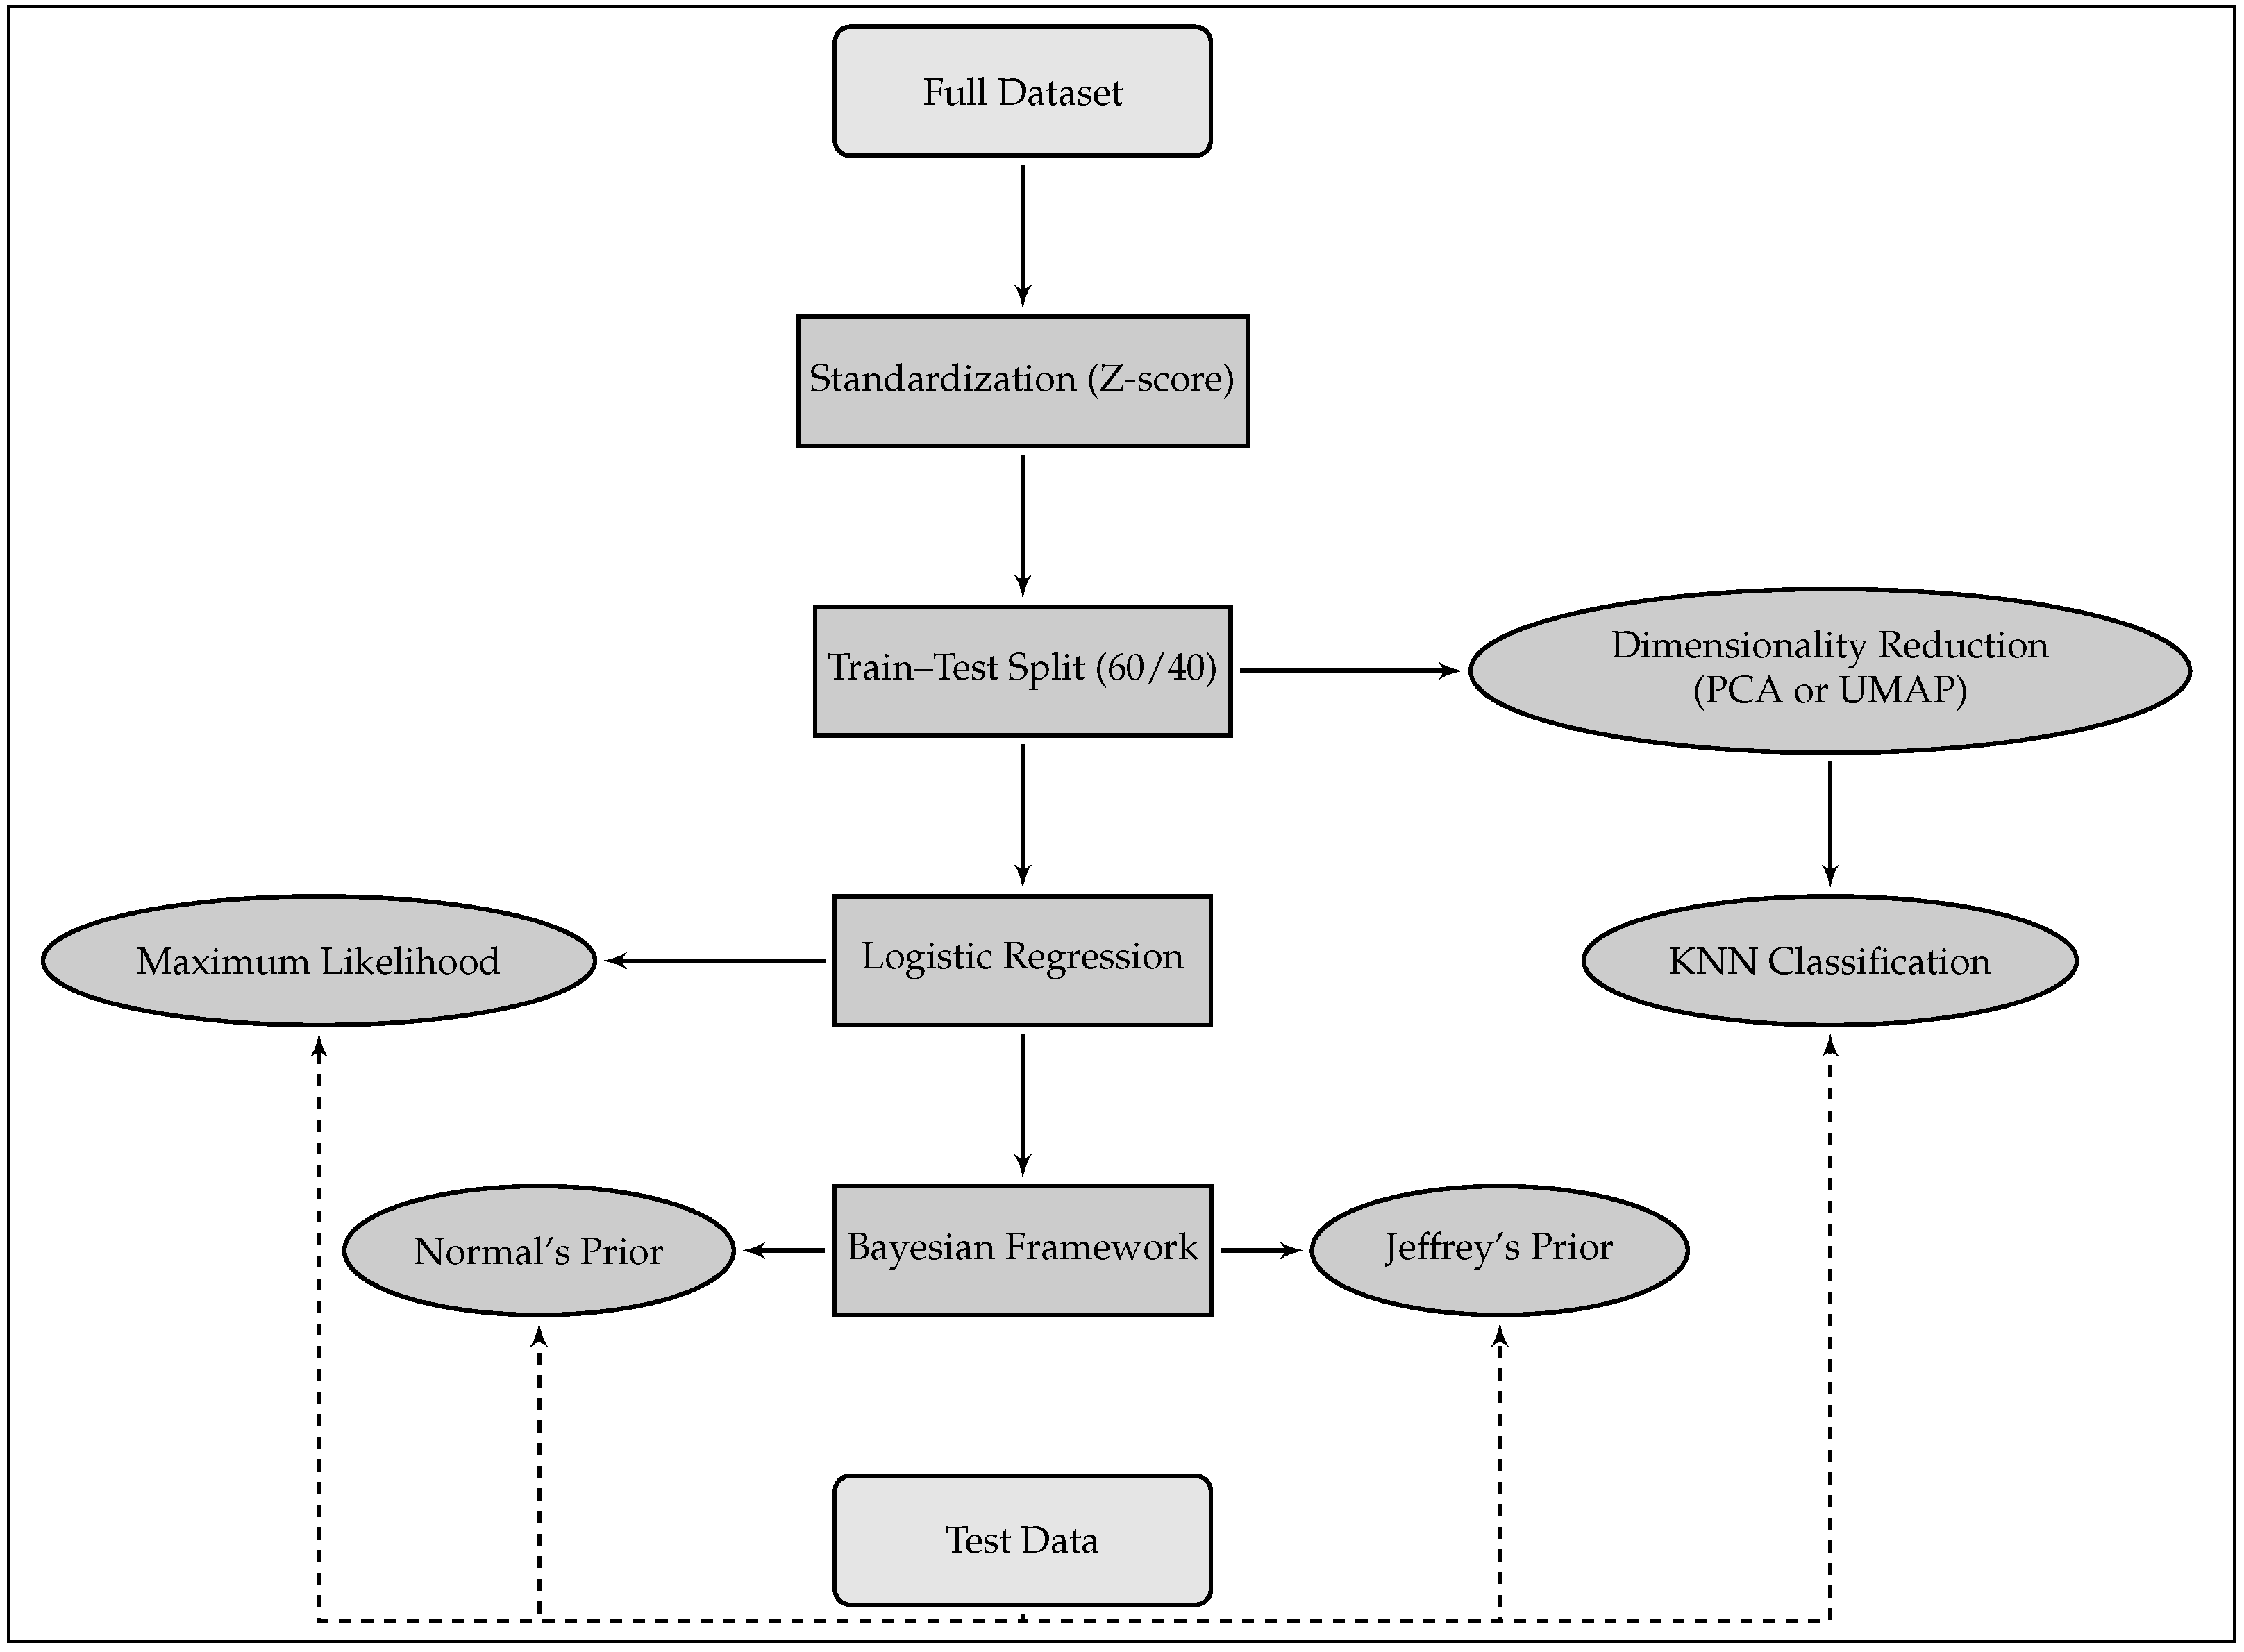
- (a)
- Use of Dimensionality Reduction Techniques (PCA or UMAP): The first step involves applying a dimensionality reduction technique, such as Principal Component Analysis (PCA) or Uniform Manifold Approximation and Projection (UMAP), to project the ECG signals into a three-dimensional space. The associated heart rhythms from the training dataset are mapped into this reduced space, which helps to create a more manageable representation of the ECG signals for further analysis.
- (b)
- Identification of the Most Likely Class for Each ECG in the Validation Group: After the dimensionality reduction step, the next step is to classify the ECG signals in the validation group. Each ECG in this group is projected into the same lower-dimensional space. Using the KNN classification algorithm, with Euclidean distance, the model predicts the most likely class or heart rhythm for each ECG in the validation group.
- (c)
- Measurement of Classification Quality: Once the heart rhythm for each ECG in the validation set has been predicted, the next step is to evaluate how accurately the model has assigned the ECGs to the correct heart rhythm classes. This is achieved by comparing the predicted labels with the true labels of the ECGs in the validation set. The evaluation metrics for this task include Positive Predictive Value (PPV), Negative Predictive Value (NPV), Sensitivity, Specificity, Accuracy, and F1-score, which provide insights into the ability of these models to correctly classify heart rhythms compared to logistic regression approaches.
4. Results and Analysis
4.1. Overall Classification Performance
4.2. Related Work
- Aziz et al. (2021) [19] proposed a hybrid CNN-LSTM architecture and reported an average F1-score of 94.2% on a multi-label classification task involving 11 rhythm classes.
- Gupta et al. (2024) [20] introduced a residual attention-based convolutional network that achieved over 96% accuracy and 95% F1-score across six arrhythmias.
- Ozpolat et al. (2023) [21] developed a temporal CNN with dilated convolutions, reaching 92.4% accuracy and 90.6% F1-score.
- Yildirim et al. (2020) [22] employed a bidirectional LSTM model and reported F1-scores above 94%, though the method required considerable computational time and resources.
5. Discussion and Conclusions
Author Contributions
Funding
Institutional Review Board Statement
Informed Consent Statement
Data Availability Statement
Acknowledgments
Conflicts of Interest
References
- Al-mousa, A.; Baniissa, J.; Hashem, T.; Ibraheem, T. Enhanced electrocardiogram machine learning-based classification with emphasis on fusion and unknown heartbeat classes. Digit. Health 2023, 9, 1–18. [Google Scholar] [CrossRef] [PubMed]
- Varvarousis, D.; Xenos, D.; Varvarousi, G.; Nakos, G. Atrial fibrillation in critical illness: Epidemiology and clinical significance. J. Crit. Care 2020, 58, 125–132. [Google Scholar] [CrossRef]
- Yi, H.; Wang, Y.; Zhang, Y.; Sun, Y. A review on automatic detection and classification of arrhythmias using ECG signals. Phys. Medica 2020, 72, 43–65. [Google Scholar] [CrossRef]
- Mantravadi, R.; Kim, H.; Moon, J. Explainable AI for ECG classification: Challenges and future directions. Comput. Biol. Med. 2024, 168, 107567. [Google Scholar]
- Zheng, J.; Zhang, J.; Danioko, S.; Yao, H.; Guo, H.; Rakovski, C. A 12-lead electrocardiogram database for arrhythmia research covering more than 10,000 patients. Sci. Data 2020, 7, 48. [Google Scholar] [CrossRef] [PubMed]
- Aziz, A.; Al-Ali, A.R.; Al-Nashash, H. Deep learning for electrocardiogram (ECG) analysis: A review. Biomed. Signal Process. Control 2021, 68, 102713. [Google Scholar] [CrossRef]
- Hassaballah, M.; Shaheen, S.I.; Aly, S. A survey of deep learning methods for ECG classification. Artif. Intell. Med. 2023, 140, 102500. [Google Scholar]
- Yildirim, O. A novel wavelet sequence based on deep bidirectional LSTM network model for ECG signal classification. Comput. Biol. Med. 2020, 96, 189–202. [Google Scholar] [CrossRef] [PubMed]
- Hastie, T.; Tibshirani, R.; Friedman, J.H.; Friedman, J.H. The Elements of Statistical Learning: Data Mining, Inference, and Prediction; Springer: New York, NY, USA, 2009. [Google Scholar]
- McInnes, L.; Healy, J.; Melville, J. UMAP: Uniform manifold approximation and projection for dimension reduction. arXiv 2018, arXiv:1802.03426. [Google Scholar]
- Dadu, A.; Satone, V.K.; Kaur, R.; Koretsky, M.J.; Iwaki, H.; Qi, Y.A.; Ramos, D.M.; Avants, B.; Hesterman, J.; Gunn, R.; et al. Application of Aligned-UMAP to longitudinal biomedical studies. Patterns 2023, 4, 100741. [Google Scholar] [CrossRef] [PubMed]
- Jain, R.; Sahu, P.; Jain, S. Dimensionality Reduction Using PCA and t-SNE for Analysis and Prediction of Cardiovascular Disease. J. Phys. Conf. Ser. 2022, 2161, 012003. [Google Scholar] [CrossRef]
- Meehan, C.; Ebrahimian, J.; Moore, W.; Meehan, S. Uniform Manifold Approximation and Projection (UMAP) [MATLAB Code]. 2023. MATLAB Central File Exchange. Available online: https://www.mathworks.com/matlabcentral/fileexchange/71902 (accessed on 11 June 2025).
- Kononenko, I.; Kukar, M. Chapter 10—Statistical Learning. In Machine Learning and Data Mining; Woodhead Publishing: Sawston, UK, 2007; pp. 259–274. [Google Scholar] [CrossRef]
- Saporta, G. Probabilité, Analyse des Données et Statistique, 2nd ed.; Éditions Technip: Paris, France, 2006. [Google Scholar]
- MCCullagh, P. Generalized Linear Models; Routledge: London, UK, 2019. [Google Scholar]
- Chen, M.H.; Ibrahim, J.G.; Shao, Q.M. Properties and Implementation of Jeffreys’s Prior in Binomial Regression Models. J. Am. Stat. Assoc. 2008, 108, 1659–1664. [Google Scholar] [CrossRef] [PubMed]
- Robert, C.P. The Bayesian Choice: From Decision-Theoretic Foundations to Computational Implementation, 2nd ed.; Springer: New York, NY, USA, 2007; p. 303. [Google Scholar]
- Aziz, S.; Haider, S.U.; Yousaf, M.H.; Rauf, H.A.; Rehman, A. Automated cardiac arrhythmia classification using deep learning techniques. Sci. Rep. 2021, 11, 18738. [Google Scholar] [CrossRef]
- Gupta, U.; Singh, R.; Sharma, N. Arrhythmia classification using residual attention CNN on 12-lead ECGs. Heliyon 2024, 10, e26787. [Google Scholar] [CrossRef] [PubMed]
- Ozpolat, E.; Yildiz, O. A temporal CNN with dilated convolutions for ECG arrhythmia classification. Diagnostics 2023, 13, 1099. [Google Scholar] [CrossRef]
- Yildirim, O.; Talo, M.; Baloglu, U.B.; Aydin, G.; Acharya, U.R. Arrhythmia detection using deep bidirectional LSTM network. Comput. Methods Programs Biomed. 2020, 185, 105740. [Google Scholar] [CrossRef]


| Acronym | Rhythm Type | Frequency (%) | Age (Mean ± SD) |
|---|---|---|---|
| SB | Sinus Bradycardia | 3889 (36.53%) | 58.34 ± 13.95 |
| SR | Sinus Rhythm (Normal) | 1826 (17.15%) | 54.35 ± 16.33 |
| AFIB | Atrial Fibrillation | 1780 (16.72%) | 73.36 ± 11.14 |
| ST | Sinus Tachycardia | 1568 (14.73%) | 54.57 ± 21.06 |
| AF | Atrial Flutter | 445 (4.18%) | 54.70 ± 17.35 |
| SI | Sinus Irregularity | 399 (3.75%) | 34.75 ± 23.03 |
| SVT | Supraventricular Tachycardia | 587 (5.51%) | 55.62 ± 18.53 |
| AT | Atrial Tachycardia | 121 (1.14%) | 55.72 ± 19.30 |
| AVNRT | AV Node Re-entrant Tachycardia | 16 (0.15%) | 58.47 ± 13.74 |
| AVRT | AV Re-entrant Tachycardia | 8 (0.07%) | 57.50 ± 16.84 |
| SAAWR | Sinus to Atrial Wandering Rhythm | 7 (0.07%) | 51.14 ± 31.83 |
| All | Total Records | 10,646 (100%) | 51.19 ± 18.03 |
| Diagnostic | Model | PPV | NPV | Sensitivity | Specificity | Accuracy | F1-Score |
|---|---|---|---|---|---|---|---|
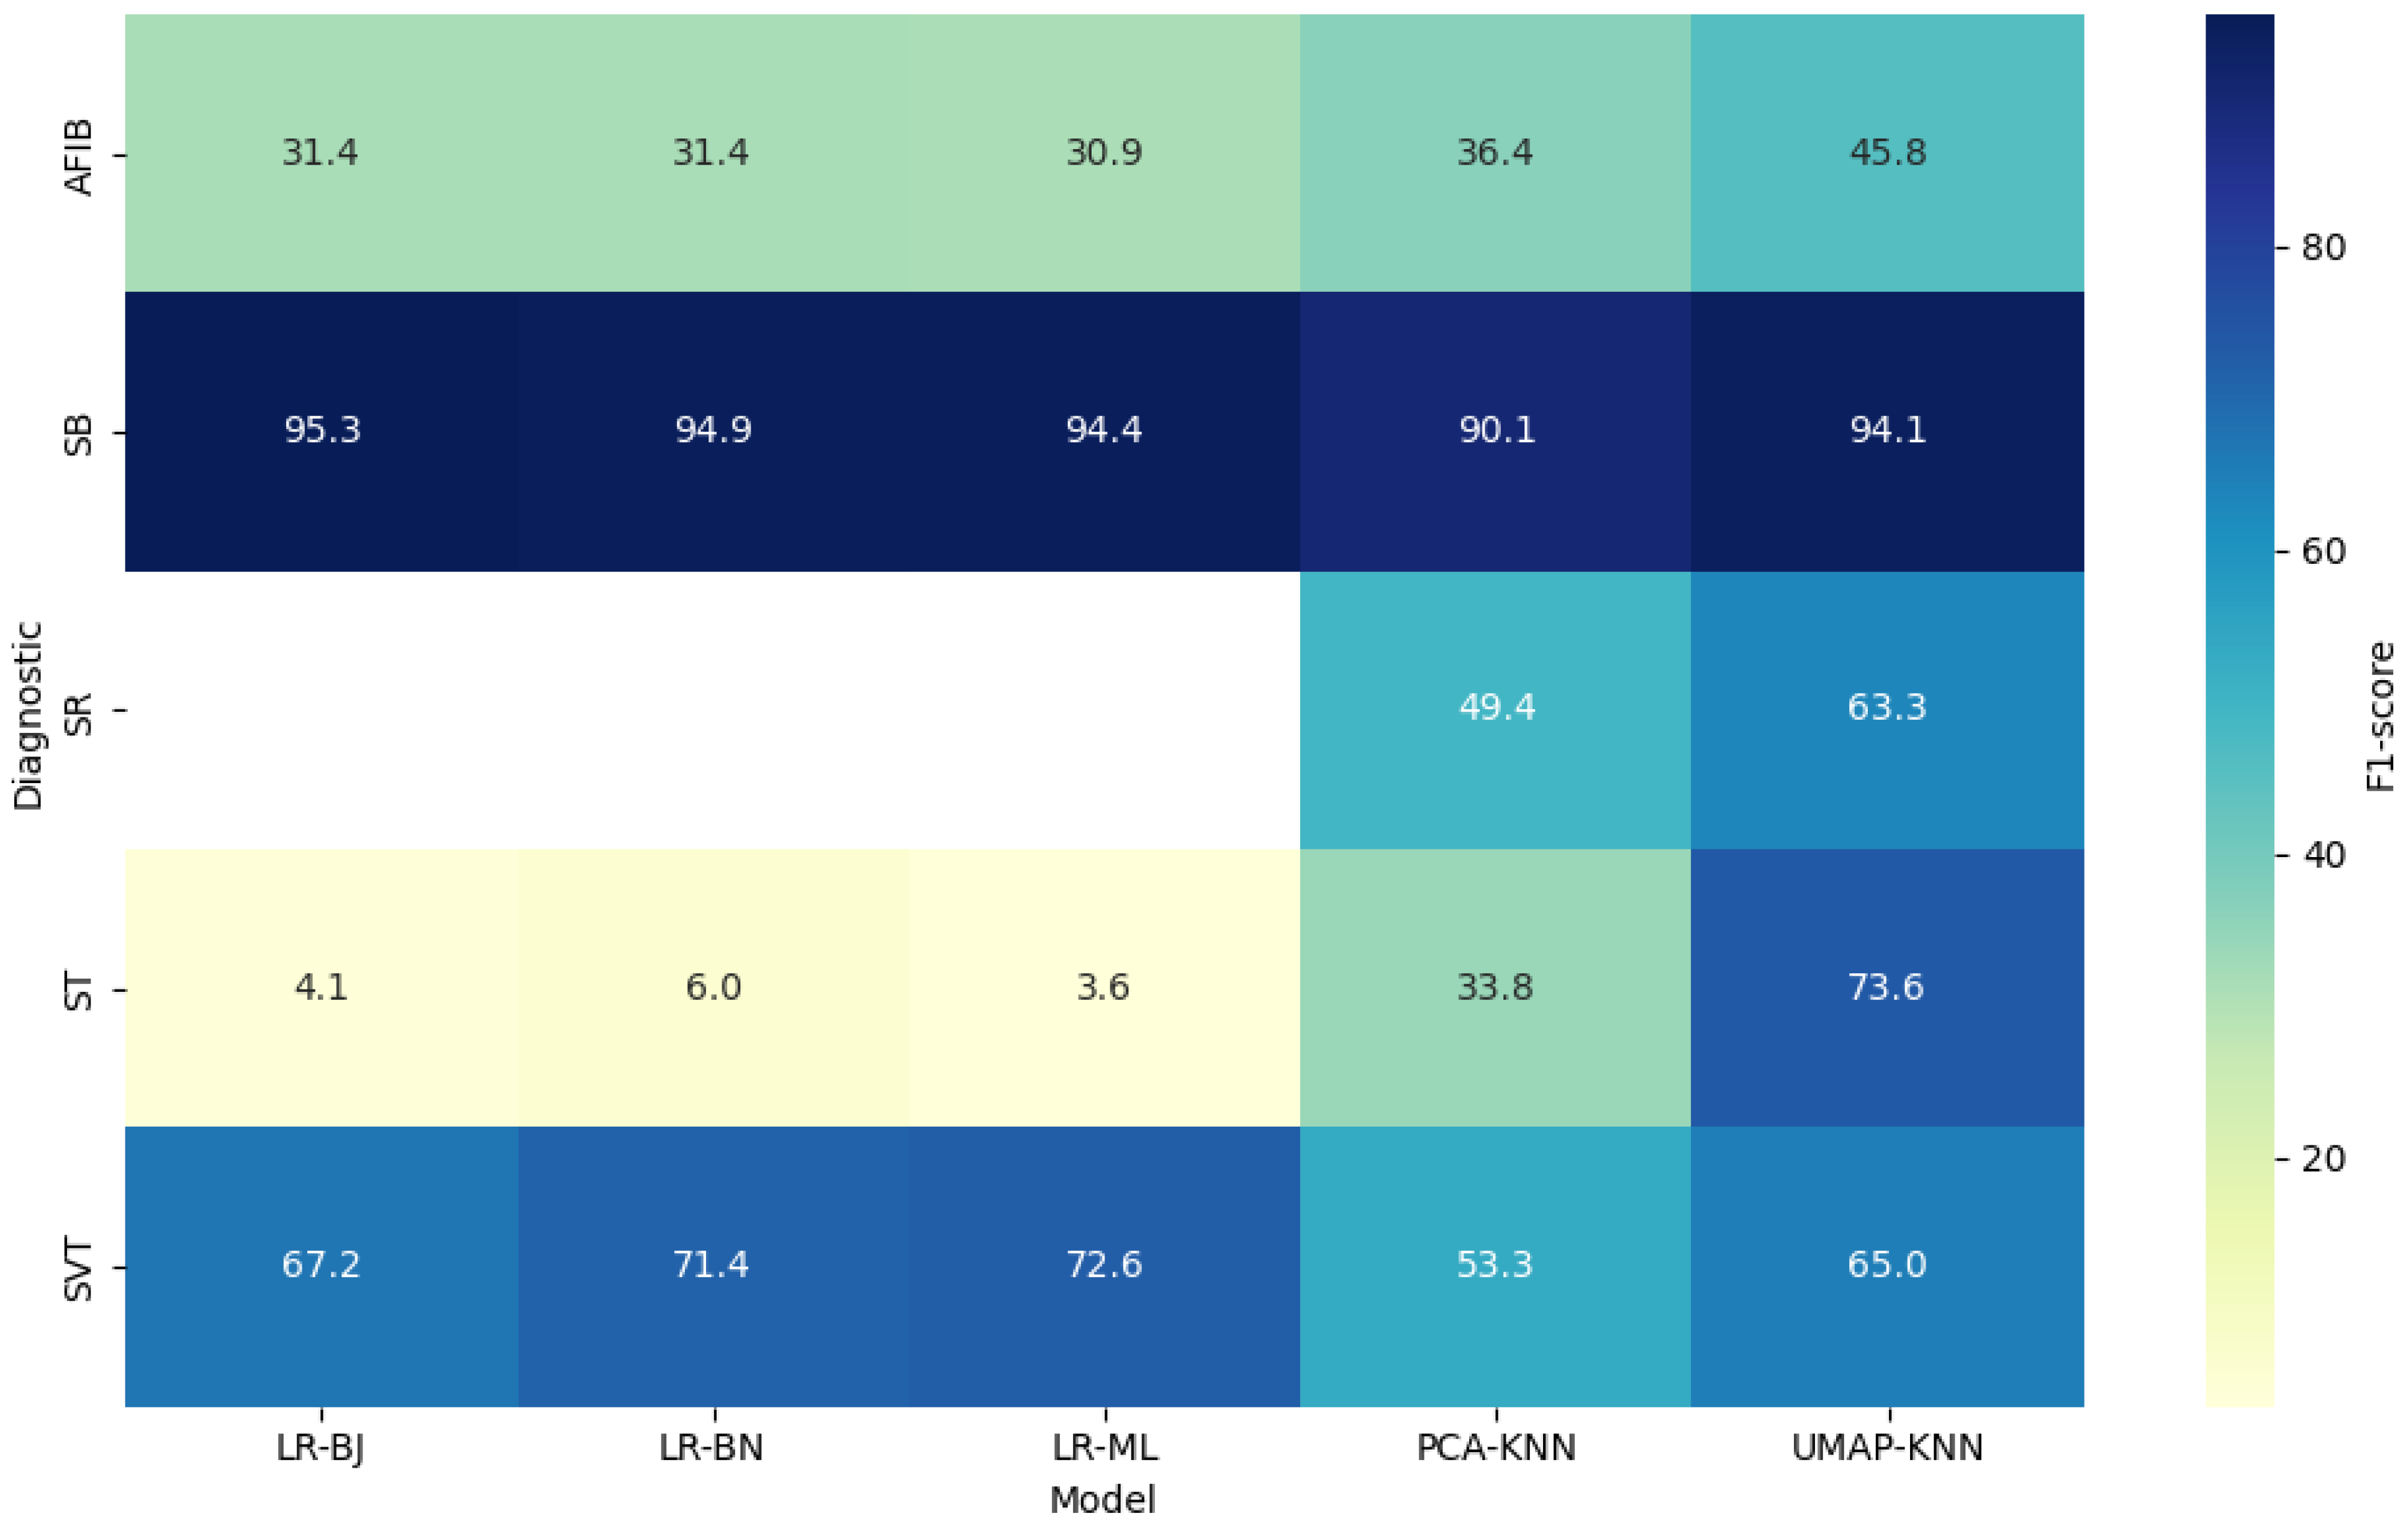
| SB | PCA-KNN | 86.74 | 96.29 | 93.80 | 91.81 | 92.53 | 90.13 |
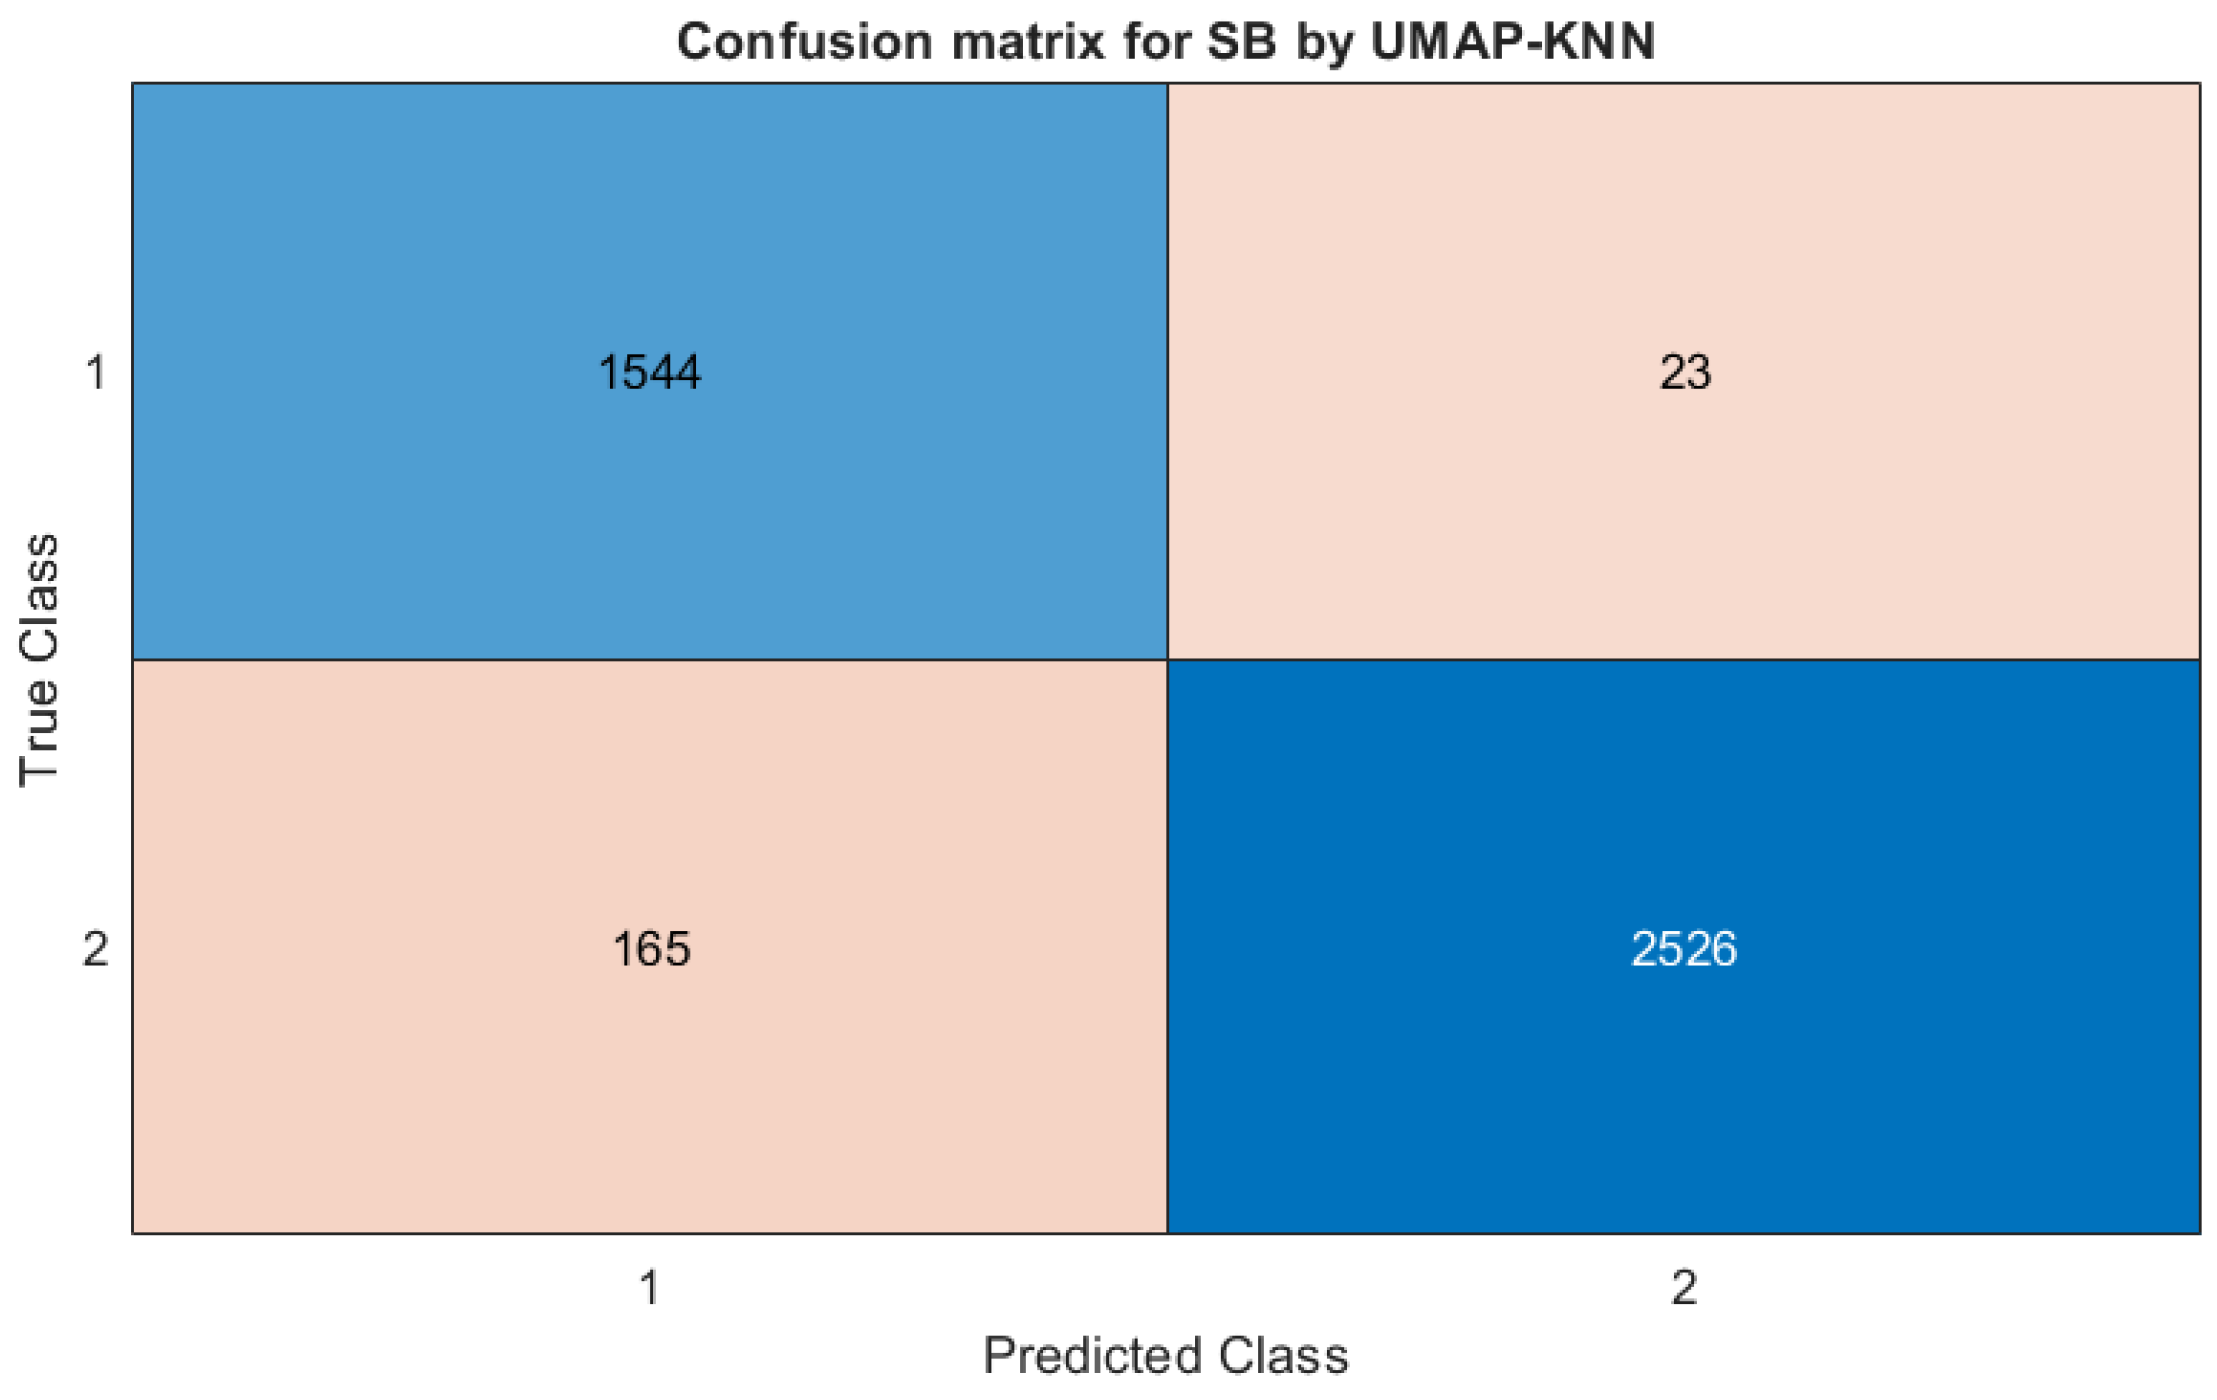
| UMAP-KNN | 98.53 | 93.87 | 90.04 | 99.10 | 95.58 | 93.99 | |
| LR-ML | 89.95 | 99.65 | 99.42 | 93.65 | 95.75 | 94.57 | |
| LR-BJ | 91.30 | 99.81 | 99.68 | 94.58 | 96.43 | 95.27 | |
| LR-BN | 90.61 | 99.80 | 99.68 | 94.10 | 96.13 | 95.07 | |
| SR | PCA-KNN | 57.49 | 89.23 | 43.36 | 93.61 | 86.12 | 49.44 |
| UMAP-KNN | 62.69 | 92.76 | 63.84 | 92.42 | 87.67 | 63.26 | |
| LR-ML | 0.00 | 83.37 | 0.00 | 99.97 | 83.35 | – | |
| LR-BJ | – | 83.37 | 0.00 | 100.00 | 83.37 | – | |
| LR-BN | – | 83.37 | 0.00 | 100.00 | 83.37 | – | |
| AFIB | PCA-KNN | 31.57 | 87.80 | 43.06 | 81.45 | 75.08 | 36.43 |
| UMAP-KNN | 53.08 | 88.67 | 40.23 | 92.93 | 84.19 | 45.95 | |
| LR-ML | 64.00 | 86.07 | 20.40 | 97.72 | 84.90 | 30.84 | |
| LR-BJ | 53.98 | 86.14 | 22.10 | 96.26 | 83.96 | 31.41 | |
| LR-BN | 53.98 | 86.14 | 22.10 | 96.26 | 83.96 | 31.41 | |
| ST | PCA-KNN | 57.85 | 87.97 | 23.89 | 96.97 | 86.12 | 33.82 |
| UMAP-KNN | 72.01 | 95.66 | 75.32 | 94.90 | 91.99 | 73.65 | |
| LR-ML | 36.36 | 85.33 | 1.90 | 99.42 | 84.95 | 3.64 | |
| LR-BJ | 15.96 | 85.18 | 2.37 | 97.82 | 83.65 | 3.98 | |
| LR-BN | 16.43 | 85.21 | 3.64 | 96.77 | 82.95 | 5.91 | |
| SVT | PCA-KNN | 58.10 | 96.89 | 49.19 | 97.81 | 94.97 | 53.28 |
| UMAP-KNN | 73.23 | 97.46 | 58.47 | 98.68 | 96.34 | 64.88 | |
| LR-ML | 64.00 | 98.98 | 83.87 | 98.28 | 96.31 | 72.73 | |
| LR-BJ | 69.70 | 97.84 | 64.92 | 98.25 | 96.31 | 67.23 | |
| LR-BN | 71.84 | 98.21 | 70.97 | 98.28 | 96.69 | 71.37 |
Disclaimer/Publisher’s Note: The statements, opinions and data contained in all publications are solely those of the individual author(s) and contributor(s) and not of MDPI and/or the editor(s). MDPI and/or the editor(s) disclaim responsibility for any injury to people or property resulting from any ideas, methods, instructions or products referred to in the content. |
© 2025 by the authors. Licensee MDPI, Basel, Switzerland. This article is an open access article distributed under the terms and conditions of the Creative Commons Attribution (CC BY) license (https://creativecommons.org/licenses/by/4.0/).
Share and Cite
Lappa Tchoffo, S.; Soucy, É.; Baldé, I.; Jbilou, J.; El Adlouni, S. Comparison of Dimensionality Reduction Approaches and Logistic Regression for ECG Classification. Appl. Sci. 2025, 15, 6627. https://doi.org/10.3390/app15126627
Lappa Tchoffo S, Soucy É, Baldé I, Jbilou J, El Adlouni S. Comparison of Dimensionality Reduction Approaches and Logistic Regression for ECG Classification. Applied Sciences. 2025; 15(12):6627. https://doi.org/10.3390/app15126627
Chicago/Turabian StyleLappa Tchoffo, Simeon, Éloïse Soucy, Ismaila Baldé, Jalila Jbilou, and Salah El Adlouni. 2025. "Comparison of Dimensionality Reduction Approaches and Logistic Regression for ECG Classification" Applied Sciences 15, no. 12: 6627. https://doi.org/10.3390/app15126627
APA StyleLappa Tchoffo, S., Soucy, É., Baldé, I., Jbilou, J., & El Adlouni, S. (2025). Comparison of Dimensionality Reduction Approaches and Logistic Regression for ECG Classification. Applied Sciences, 15(12), 6627. https://doi.org/10.3390/app15126627