Article

Quantitative Analysis of Explosion Characteristics Based on Ignition Location in an Ammonia Fuel Preparation Room Using CFD Simulation

1
Division of Ocean Polytech, Korea Institute of Maritime and Fisheries Technology, Busan 49111, Republic of Korea
2
Division of Education & Planning, Korea Institute of Maritime and Fisheries Technology, Busan 49111, Republic of Korea
3
Division of Marine System Engineering, Korea Maritime and Ocean University, Busan 49112, Republic of Korea
4
Division of Mechanical Engineering, Korea Maritime and Ocean University, Busan 49112, Republic of Korea
5
School of Mechanical Engineering, University of Leeds, Leeds LS2 9JT, UK
*
Authors to whom correspondence should be addressed.
Appl. Sci. 2025, 15(12), 6554; https://doi.org/10.3390/app15126554
Submission received: 25 April 2025 / Revised: 21 May 2025 / Accepted: 29 May 2025 / Published: 11 June 2025

Abstract

:
Ammonia (NH3) is a promising carbon-free marine fuel that is aligned with the International Maritime Organization’s (IMO) decarbonization targets. However, its high toxicity and flammability pose serious explosion hazards, particularly in confined fuel preparation spaces. This study investigates the influence of the ignition source location on the explosion characteristics of ammonia within an ammonia fuel preparation room using computational fluid dynamics (CFD) simulations via the FLACS platform. Nineteen ignition scenarios are established along the X-, Y-, and Z-axes. Key parameters, such as the maximum overpressure, pressure rise rate, reduction rate of flammable gas, ignition detection time, and spatial–temporal distributions of temperature and combustion products, are evaluated. The results show that the ignition location plays a critical role in the explosion dynamics. Ceiling-level ignition (Case 19) produced the highest overpressure (4.27 bar) and fastest pressure rise rate (2.20 bar/s), indicating the most hazardous condition. In contrast, the forward wall ignition (Case 13) resulted in the lowest overpressure (3.24 bar) and limited flame propagation. These findings provide essential insights into the risk assessment and safety design of ammonia-fueled marine systems.

1. Introduction

The maritime industry plays a crucial role in international trade, transporting approximately 80% of global cargo. However, it consumes over 300 million tons of fossil fuels annually and accounts for approximately 2–3% of total global greenhouse gas (GHG) emissions [1]. Large vessels (representing approximately 20% of the global fleet) are responsible for 85% of the sector’s total GHG emissions. This emphasizes the urgent need to implement decarbonisation strategies to promote sustainable development in the shipping industry [2,3,4]. In this context, international organizations, including the International Maritime Organization (IMO), have emphasized the transition to eco-friendly marine fuels. Among these, ammonia has emerged as a potential highly advanced carbon-free marine fuel [5].
Ammonia is a carbon-free fuel. It provides a higher volumetric energy density than hydrogen and can be produced and transported using the existing infrastructure. Furthermore, it serves as an effective hydrogen carrier and has the potential to be pivotal in enabling a future hydrogen-based economy [6,7,8,9]. Based on these advantages, institutions such as the International Transport Forum (ITF) and the International Energy Agency (IEA) have projected that ammonia will become a key marine fuel by 2050. Consequently, the amounts of global research and technological investments in ammonia-powered ships are rapidly increasing [10,11]. Nevertheless, one of the most significant challenges in ammonia commercialization is safety concerns due to its high toxicity and explosiveness [12,13,14]. Although no major accidents involving ammonia-fuelled vessels have been reported, various incidents in land-based facilities provide crucial insights into the potential risks in maritime applications. According to the U.S. Occupational Safety and Health Administration (OSHA), 306 incidents of ammonia leakage have occurred since 1984. Of these, 58 involved fatalities [15]. For example, in 2013, a significant ammonia release at the Yara facility in Texas resulted in 15 deaths and more than 100 injuries. Similarly, in 1992, a catastrophic explosion of an ammonia tank in Dakar, Senegal, resulted in 129 deaths and over 1150 injuries [16,17,18,19]. These severe land-based incidents indicate the need for stringent safety management systems when employing ammonia as a marine fuel.
Fuel preparation rooms (FPRs), which are confined spaces where ammonia is stored, supplied, and mixed, are considered high-risk areas for explosions. To quantitatively assess the explosion hazards in such environments, a systematic analysis of the effect of the ignition location on explosion characteristics is crucial. Prior studies have identified the ignition position as a key parameter that influences the explosion pressure, rate of pressure increase, flame propagation characteristics, combustion behaviour, and thermal losses [20,21,22]. For example, Li et al. [20] observed that central ignition in methane–air mixtures generated the highest explosion pressure and lowest heat loss. In contrast, ignition near the walls or bottom produced lower pressures and higher heat dissipation. Wang et al. [21] observed that the ignition location significantly influences the flame dynamics and pressure distribution in hydrogen–air mixtures. Similarly, Hou et al. [22] reported that the ignition position affects pressure wave interactions and the explosion-induced vibrations in methane–air mixtures. This study provides important insights into the management of flammable gases. These observations collectively emphasize the role of the ignition location as a critical variable in explosion dynamics, regardless of the gas type. However, existing studies have focused primarily on methane or hydrogen explosions, and investigations of ammonia explosions in confined environments remain limited. This study addresses this deficiency by analysing the effect of the ignition location on explosion characteristics, specifically in ammonia fuel preparation rooms that have been modelled for use on LNG-fuelled bulk carriers.
The Flame Acceleration Simulator (FLACS) is a CFD simulation tool that is widely acknowledged for its accuracy in modelling and predicting gas explosion hazards. Its reliability has been validated through analyses of large-scale industrial explosion events across multiple sectors [23,24,25,26,27]. For example, as illustrated in Figure 1, large-scale explosion experiments using ethane, methane, propane, butane, and pentane gases were conducted in the United Kingdom between 1997 and 2000 as part of the BFETS Phase 3A project. These experiments were performed in full-scale offshore compressor modules (28 m × 12 m × 8 m) to investigate the influence of various factors, including the equipment congestion, ventilation openings, ignition location, reproducibility, and effects of different water deluge arrangements. Vyazmina et al. [28], Lv et al. [29], and Hansen et al. [30,31] quantitatively evaluated explosion conditions using the FLACS and verified its accuracy through comparisons with experimental data. Furthermore, Bleyer et al. [32] conducted comparative assessments between FLACS simulations and scaled experimental tests inside a pressurized water reactor (PWR) steam generator casemate under varying hydrogen concentration gradients. This finding reinforces the predictive reliability of the software.
This study aims to quantitatively assess the influence of the ignition source location on explosion characteristics in an ammonia fuel preparation room using computational fluid dynamics (CFD) simulations conducted on the FLACS platform. Nineteen scenarios were developed by systematically varying the ignition positions along the X-, Y-, and Z-axes to evaluate the spatial dependencies of the explosion severity and flame propagation behaviour.
In contrast to previous studies that primarily examined simplified or open geometries, this study investigated the ignition dynamics in a confined and structurally realistic fuel preparation room. The computational domain was modelled after the layout of an LNG-fuelled vessel FPR, serving as a representative configuration for assessing ammonia-related explosion risks. The key parameters, including the maximum overpressure, pressure rise rate, flammable gas reduction, temperature distribution, and combustion product concentration, were comprehensively evaluated.
The findings provide valuable insights into how the ignition location affects the combustion behaviour and explosion severity in complex enclosed environments. These results support the development of safe design strategies and operational guidelines for ammonia-fuelled ships.
Furthermore, the outcomes of this study may contribute to international policies and regulatory frameworks, such as those shared by the International Maritime Organization (IMO), by providing scientific data to enhance the overall safety of ammonia-powered marine systems.

2. Methodology

In this study, the characteristics of explosions were simulated based on the location of the ignition source. This study presents a systematic approach for assessing explosion risk in ammonia FPRs. The workflow is illustrated in Figure 2 and comprises three integrated phases: explosion analysis, sensitivity analysis, and mitigation strategies.
The first step involves defining the structural model of the fuel preparation room. A detailed 3D model was developed which includes key design elements that could affect the explosion behaviour. The initial and boundary conditions were established, including variables such as the ignition location, equivalence ratio, initial temperature and pressure, and gas cloud location. The ignition point was varied systematically to observe variations in the explosion behaviour. To enhance computational accuracy, a mesh was generated and refined through convergence testing to achieve an optimal resolution. CFD simulations were conducted using the FLACS. The maximum explosion pressures were extracted to quantify the effects of the ignition location.
A sensitivity analysis was performed by repeating the simulations at various ignition positions to evaluate the variations in maximum explosion pressure. If convergence was not achieved, the mesh resolution was adjusted. This process enabled the identification of the scenario with the lowest explosion risk and a systematic assessment of the influence of the ignition location on the explosion severity.
Based on the sensitivity analysis, mitigation measures were developed to minimize the impact of explosions and overpressure. These configurations were re-simulated, and the reduction in the explosion hazard was validated. The results verified that the ignition location significantly influenced the explosion pressure and the affected area. Simulation-based evaluations provide a quantitative basis for understanding and mitigating explosion risks. Ultimately, these observations provide practical safety design guidance for real-world applications and thereby contribute to improved risk management in ammonia-fuelled marine systems.

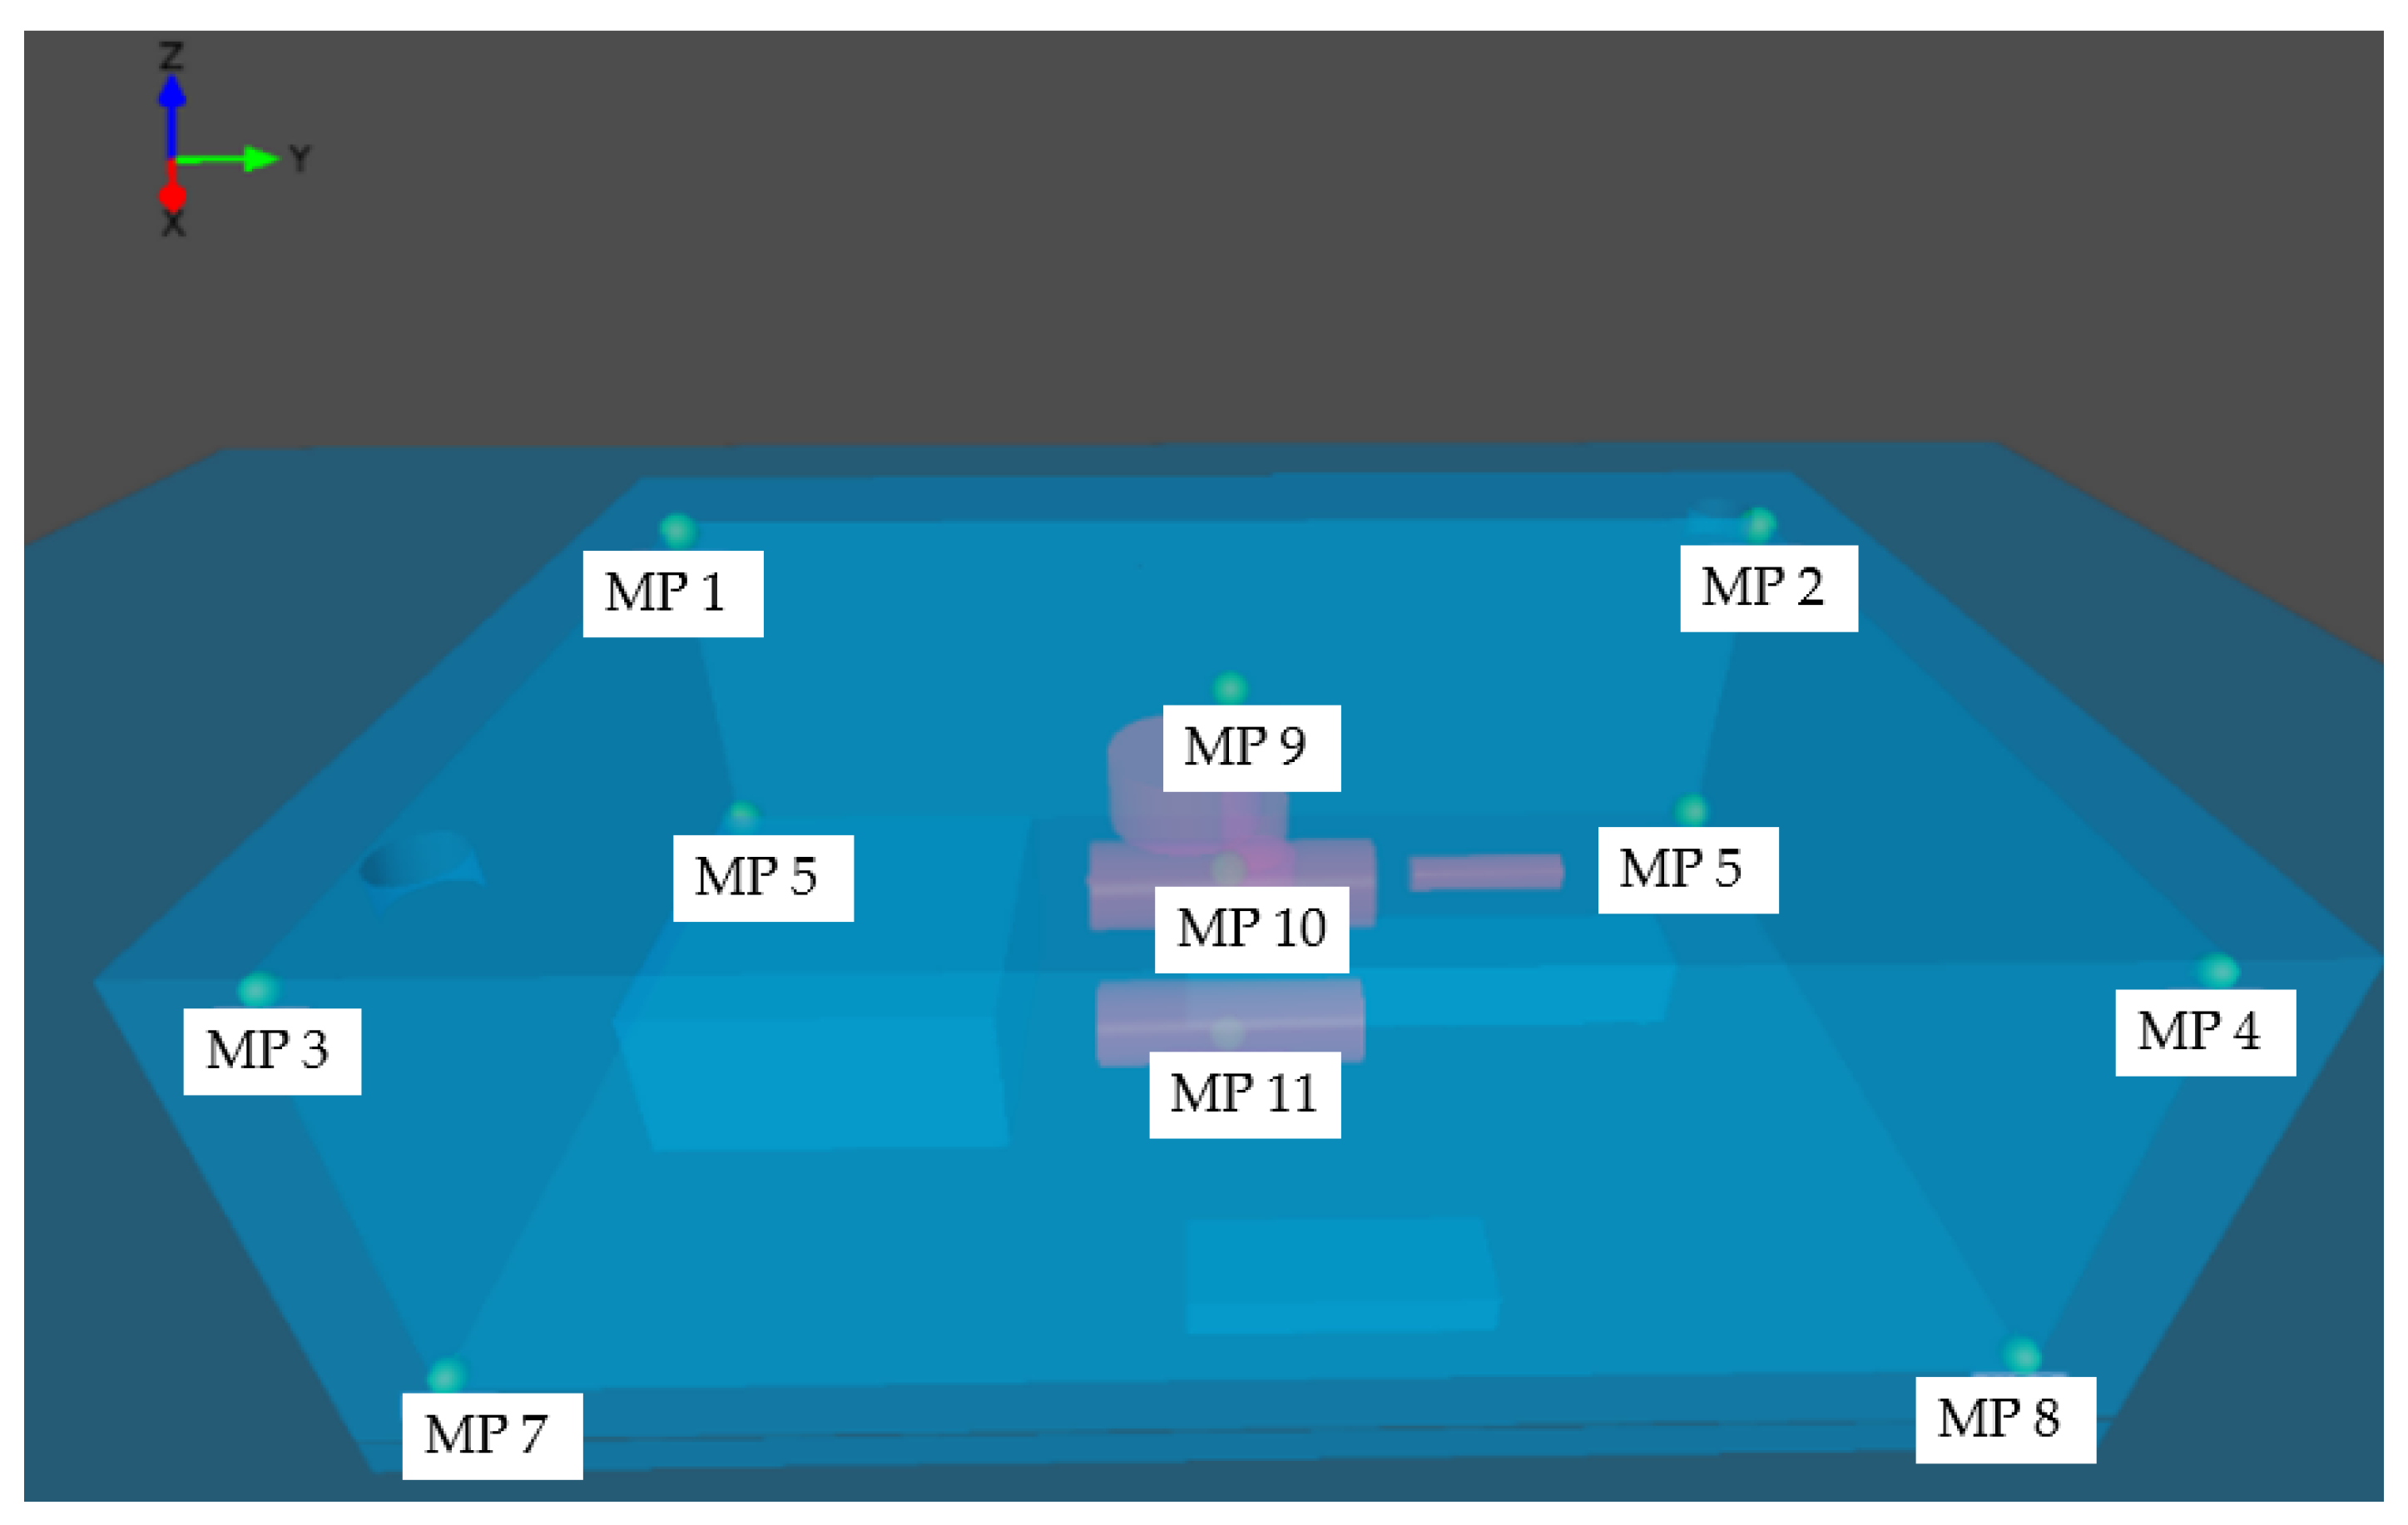
2.1. Design of Ammonia Fuel Preparation Room

The model of the FPR used in this study was based on a fuel preparation space installed on a 180,000 DWT LNG-fuelled bulk carrier equipped with an IMO-type C LNG tank. Jang et al. presented a case study in which an ammonia fuel storage and handling system was retrofitted for ammonia/diesel dual-fuel engine operation on a full-scale A-class general cargo ship. Drawing on this case [34], this study modelled an ammonia FPR based on the equipment layout of a conventional LNG-fuelled vessel.
The geometry and volume of the modelled fuel preparation room were designed to closely replicate those of an actual shipboard FPR and were simplified into a rectangular configuration. The approximate dimensions of the room were 10 m (length) × 15 m (width) × 5 m (height), yielding a total volume of 750 m3. The principal specifications of the reference vessel and FPR are summarized in Table 1. The detailed dimensions and configuration of the ammonia fuel preparation room are shown in Figure 3.
The modelled ship includes a ventilation coaming with an inner diameter of 806 mm. Consequently, the air intake and exhaust ducts were modelled as circular openings with a diameter of 0.8 m and were positioned at distinct locations on the surface of the preparation room. The intake duct was placed on the lower aft-starboard side, and the exhaust duct was positioned on the upper forward port side. This reflects the typical ventilation design standards in marine engineering.

2.2. Scenario Description

In this study, explosion simulation scenarios were designed under the assumption of ammonia gas leakage followed by ignition inside the FPR. The interior was initially filled with 100% ammonia gas at ambient pressure and temperature (101,325 Pa; 288.15 K; equivalent to 15 °C). The flammable gas cloud was defined as a rectangular volume measuring 10 m × 15 m × 5 m, yielding an equivalent gas volume of 750 m3 under stoichiometric conditions (ER = 1). This setting represents a conservative worst-case scenario commonly adopted in explosion risk assessments.
All the computational domain boundaries (XLO, XHI, YLO, YHI, ZLO, and ZHI) were assigned as Euler-type open boundaries to allow for unrestricted gas expansion. The complete sets of initial and boundary conditions are summarized in Table 2.
To investigate the effects of the ignition location, multiple simulation scenarios were constructed in which the ignition positions were varied. In most cases, the Z-coordinate was fixed at 0.1 m to reflect floor-level ignition conditions where key equipment and piping are commonly installed. The ignition time was uniformly set at 0.1 s across all scenarios, enabling consistent comparisons and simulations of near-immediate ignition following leakage. The spatial configurations for each ignition case are listed in Table 3.
This study employed the equivalent gas method to represent the gas cloud, which is a widely adopted approach in industrial explosion modelling. This simplified the simulation process by eliminating the need to explicitly model gas dispersion and ignition separately. Instead, a predefined equivalent volume under stoichiometric conditions was used to represent the realistic and flammable gas accumulation. This method enhanced the computational efficiency while preserving accuracy and scenario consistency [35].
Using this methodology, the explosion risks in an ammonia FPR were quantitatively evaluated based on the ignition location, with specific attention given to pressure distribution and structural impacts. The adopted approach supports a systematic hazard assessment across various ignition scenarios.
One of the critical parameters in explosion simulations is the flammable gas volume. In this study, a stoichiometric equivalent gas volume of 750 m3 was used, which corresponds to the amount of ammonia gas that would participate in complete combustion at an ER of 1. Typically, this equivalent volume is approximately half to one-third of the actual leaked volume, depending on the mixing conditions.
This approach, which is widely adopted in industrial explosion analysis, enables the simulation to bypass separate dispersion modelling and instead assume an immediately ignitable cloud. This ensures consistency across scenarios while significantly reducing the computational cost. Compared with fully coupled dispersion–ignition simulations, this method maintains predictive accuracy while minimizing the complexity and simulation time. Accordingly, it was used in this study to systematically evaluate the influence of the ignition location on the pressure development and structural impact within the ammonia FPR.

2.3. Mathematical Model

The FLACS v22.2 software consists of three main components: the first is the computer-aided scenario design (CASD), a preprocessor used to define the explosion models for the simulation. This stage involves setting up computational grids, the porosity, geometric models, and scenarios based on the input data. The second component is the FLACS simulator, which serves as the core solver module, solving the Navier–Stokes equations and enabling various model modifications. The third component is a flowchart. This is a postprocessor that visualizes the simulation results in 2D or 3D. Moreover, this component enables an intuitive interpretation of explosion outcomes such as tunnel explosion effects. The FLACS employs the finite volume method (FVM) to solve compressible conservation equations on a 3D Cartesian grid. Therefore, accurate simulation results can be guaranteed [36,37].
The cornerstone of the FLACS is the set of fundamental governing equations for fluid dynamics. These include mass, momentum, and energy equations. As a commercial CFD code, the FLACS can be applied to model the release, dispersion, combustion, and explosion processes of gases, liquids, and vapor clouds in both unconfined and confined spaces. The computational tool includes a 3D CFD code that solves the Favre-averaged transportation equations for the mass, momentum, enthalpy, turbulent kinetic energy, rate of dissipation of turbulent kinetic energy, fuel mass fraction, and mixture fraction. These equations are solved on a structured Cartesian grid using the finite volume method [38,39] and can be represented as follows:
t ρ φ + X j ρ u j φ ρ Γ φ φ x j = S φ
Here, φ denotes a general variable such as mass, momentum, energy, or turbulent kinetic energy. ρ represents the gas density, t denotes time, u j is the velocity component in the j-direction, Γ φ is the dispersion coefficient of φ , and S φ refers to the source term.
The FLACS utilizes the kε two-equation model and standard wall functions to simulate turbulence. The kε model consists of two additional transportation equations.
The turbulent pulsation kinetic energy k is defined using the following equation.
t ρ k + x i ρ u i k = x j μ + μ t σ k k x j + G k + G b ρ ε Y M + S k
Additionally, the turbulent pulsation kinetic energy dissipation rate, ε, is defined using the following equation.
t ρ ε + x i ρ u i ε = x j μ + μ t σ ε ε x j + C 1 ε ε k G k + C 3 ε G b C 2 ε ρ ε 2 k + S ε
Here, u denotes the molecular viscosity of fluids (Pa·s) and μ t represents the turbulent viscosity of fluids (Pa·s). σ k and σ ε   correspond to the Prandtl numbers associated with k and ε, which are typically considered as 1 and 1.3, respectively.
G k represents the generation of turbulent kinetic energy owing to the mean velocity gradient, whereas G b represents the generation of turbulent kinetic energy owing to the buoyancy. Y M represents the contribution of pulsatile expansion.
For the constants C 1 ε , C 2 ε , and C 3 ε , we adopt values of 1.44, 1.92, and 0.09, respectively. Additionally, S k and S ε represent the source terms related to turbulent kinetic energy and dissipation.
In this study, ammonia combustion was simulated using a premixed turbulent combustion model implemented in the FLACS-CFD. Despite the inherently poor combustion characteristics of ammonia, such as its low laminar burning velocity and narrow flammability limits, the model incorporates experimentally derived correlations for both laminar and turbulent burning velocities.
An external energy source is not used to initiate ignition. Instead, flame propagation begins when the local thermodynamic conditions meet the flammability criteria, specifically within the lower and upper flammability limits (LFL and UFL). Under these conditions, the flame propagates at a laminar burning velocity.
To provide further clarity, the sub-models implemented in the FLACS-CFD to estimate the laminar and turbulent flame speeds are detailed as follows. The laminar burning velocity S L 0 is modeled as a function of the fuel type and equivalence ratio Φ , which are both set to zero outside the flammability limits to represent non-reactive mixtures:
S L 0 = S L 0 f u e l , Φ
The turbulent burning velocity S T is computed using empirical correlations developed by Bray and Arntzen, which incorporate the turbulence intensity u , integral length scale l I , and kinematic viscosity ν   [40]:
S T 1 = 1.8 S L 0.784 u 0.412 l I 0.196 ν 0.196 ,   S T 2 = 0.96 S L 0.284 u 0.912 l I 0.196 ν 0.196 + S L
S T = min S T 1 , S T 2
Turbulent combustion is modelled based on the turbulent burning velocity, which is calculated from the local diffusion and reaction rates in the numerical flame zone. The model distinguishes between laminar, quasilaminar, and turbulent flow regimes, and accounts for flame surface area enhancement through a flame folding mechanism that includes sub-grid obstructions, turbulence, and Rayleigh–Taylor instabilities.
The interaction between the chemical reactions and turbulence is handled using the flamelet approach, where an array of finite-thickness laminar flamelets represents the turbulent flame. Furthermore, the model employs Bray’s correlation for turbulent flame speed and Arntzen’s β-flame model, which introduces artificial flame thickening by increasing the diffusion and reducing the reaction rate to ensure numerical stability [33]. Although autoignition is not explicitly modelled, the combustion process is initiated when the mixture composition and thermodynamic conditions satisfy the flammability limits.

2.4. Simulation Domain and Mesh

Explosion simulations were conducted using the FLACS-CFD, which employs a structured Cartesian grid for computational fluid dynamics (CFD) analysis. The computational domain was divided into two regions: a core domain surrounding the fuel preparation room and a stretch domain extending outward to minimize boundary reflections and ensure numerical stability.
A uniform grid with an aspect ratio of 1:1 was applied within the core region to achieve high spatial resolution. The outer stretch domain was given a gradually increasing mesh size to reduce the computational load. The overall domain measured 30 m × 45 m × 15 m in the X-, Y-, and Z-directions, respectively, extending more than three times the dimensions of the FPR, to allow the complete dissipation of pressure waves before they reached the boundaries. The mesh strategy and domain layout are shown in Figure 4.
A mesh convergence study was performed using four grid sizes: 0.1 m, 0.2 m, 0.5 m, and 1.0 m. As shown in Figure 5, the peak explosion pressures varied depending on the mesh size, with a maximum difference of approximately 3.0 bar between the coarsest and finest grids. When the grid size was refined to 0.2 m or smaller, this variation became negligible. Therefore, 0.2 m was selected as the final resolution, resulting in 292,110 control volumes, a maximum aspect ratio of 12.45, and a maximum relative difference of 19.24%, all of which are within acceptable limits for engineering applications.
The governing equations were solved using the finite volume method on a staggered grid for velocity and a cell-centred grid for scalar quantities, such as pressure, temperature, and species mass fractions. The model is based on the compressible Favre-averaged Navier–Stokes equations, which include the conservation laws for mass, momentum, energy, and species. The turbulence was modelled using a standard two-equation k–ε approach, and combustion was represented with a premixed turbulent flame model that incorporated laminar flamelet correlations and flame surface area enhancement mechanisms.
The numerical scheme offers second-order spatial accuracy and first-order (optionally, second-order) temporal accuracy. The SIMPLE algorithm was employed for pressure–velocity coupling and extended to account for compressibility. The time stepping followed the Courant–Friedrichs–Lewy (CFL) criteria with CFLC = 5 and CFLV = 0.5, and simulations proceeded until the mass residual decreased below 10−4.
Euler-type open boundaries were applied in all directions to allow free pressure wave propagation and to suppress artificial reflections, whereas solid wall boundaries were defined for the enclosure. Complex internal geometries and unresolved obstructions were modelled using the distributed porosity approach, while accounting for localized flow resistance, turbulence generation, and flame-folding effects. Standard wall functions were used for the near-wall treatment.
To evaluate the explosion dynamics, 11 monitoring points were installed within the FPR, as illustrated in Figure 6 and listed in Table 4. These sensors recorded the pressure, temperature, and species mass fractions over time, enabling the quantitative analysis of flame propagation, overpressure characteristics, and combustion behaviour.
Additionally, radiative heat loss sub-models were activated to account for the quenching effects near the wall-adjacent ignition points, in accordance with the FLACS-CFD recommendations. Although direct flame extinction was not modelled, the use of appropriate sub-models and a fine mesh resolution (0.2 m) indirectly represented thermal losses near solid boundaries while satisfying the minimum requirement for sub-grid modelling (≥1 cm) [33].

3. Result and Discussion

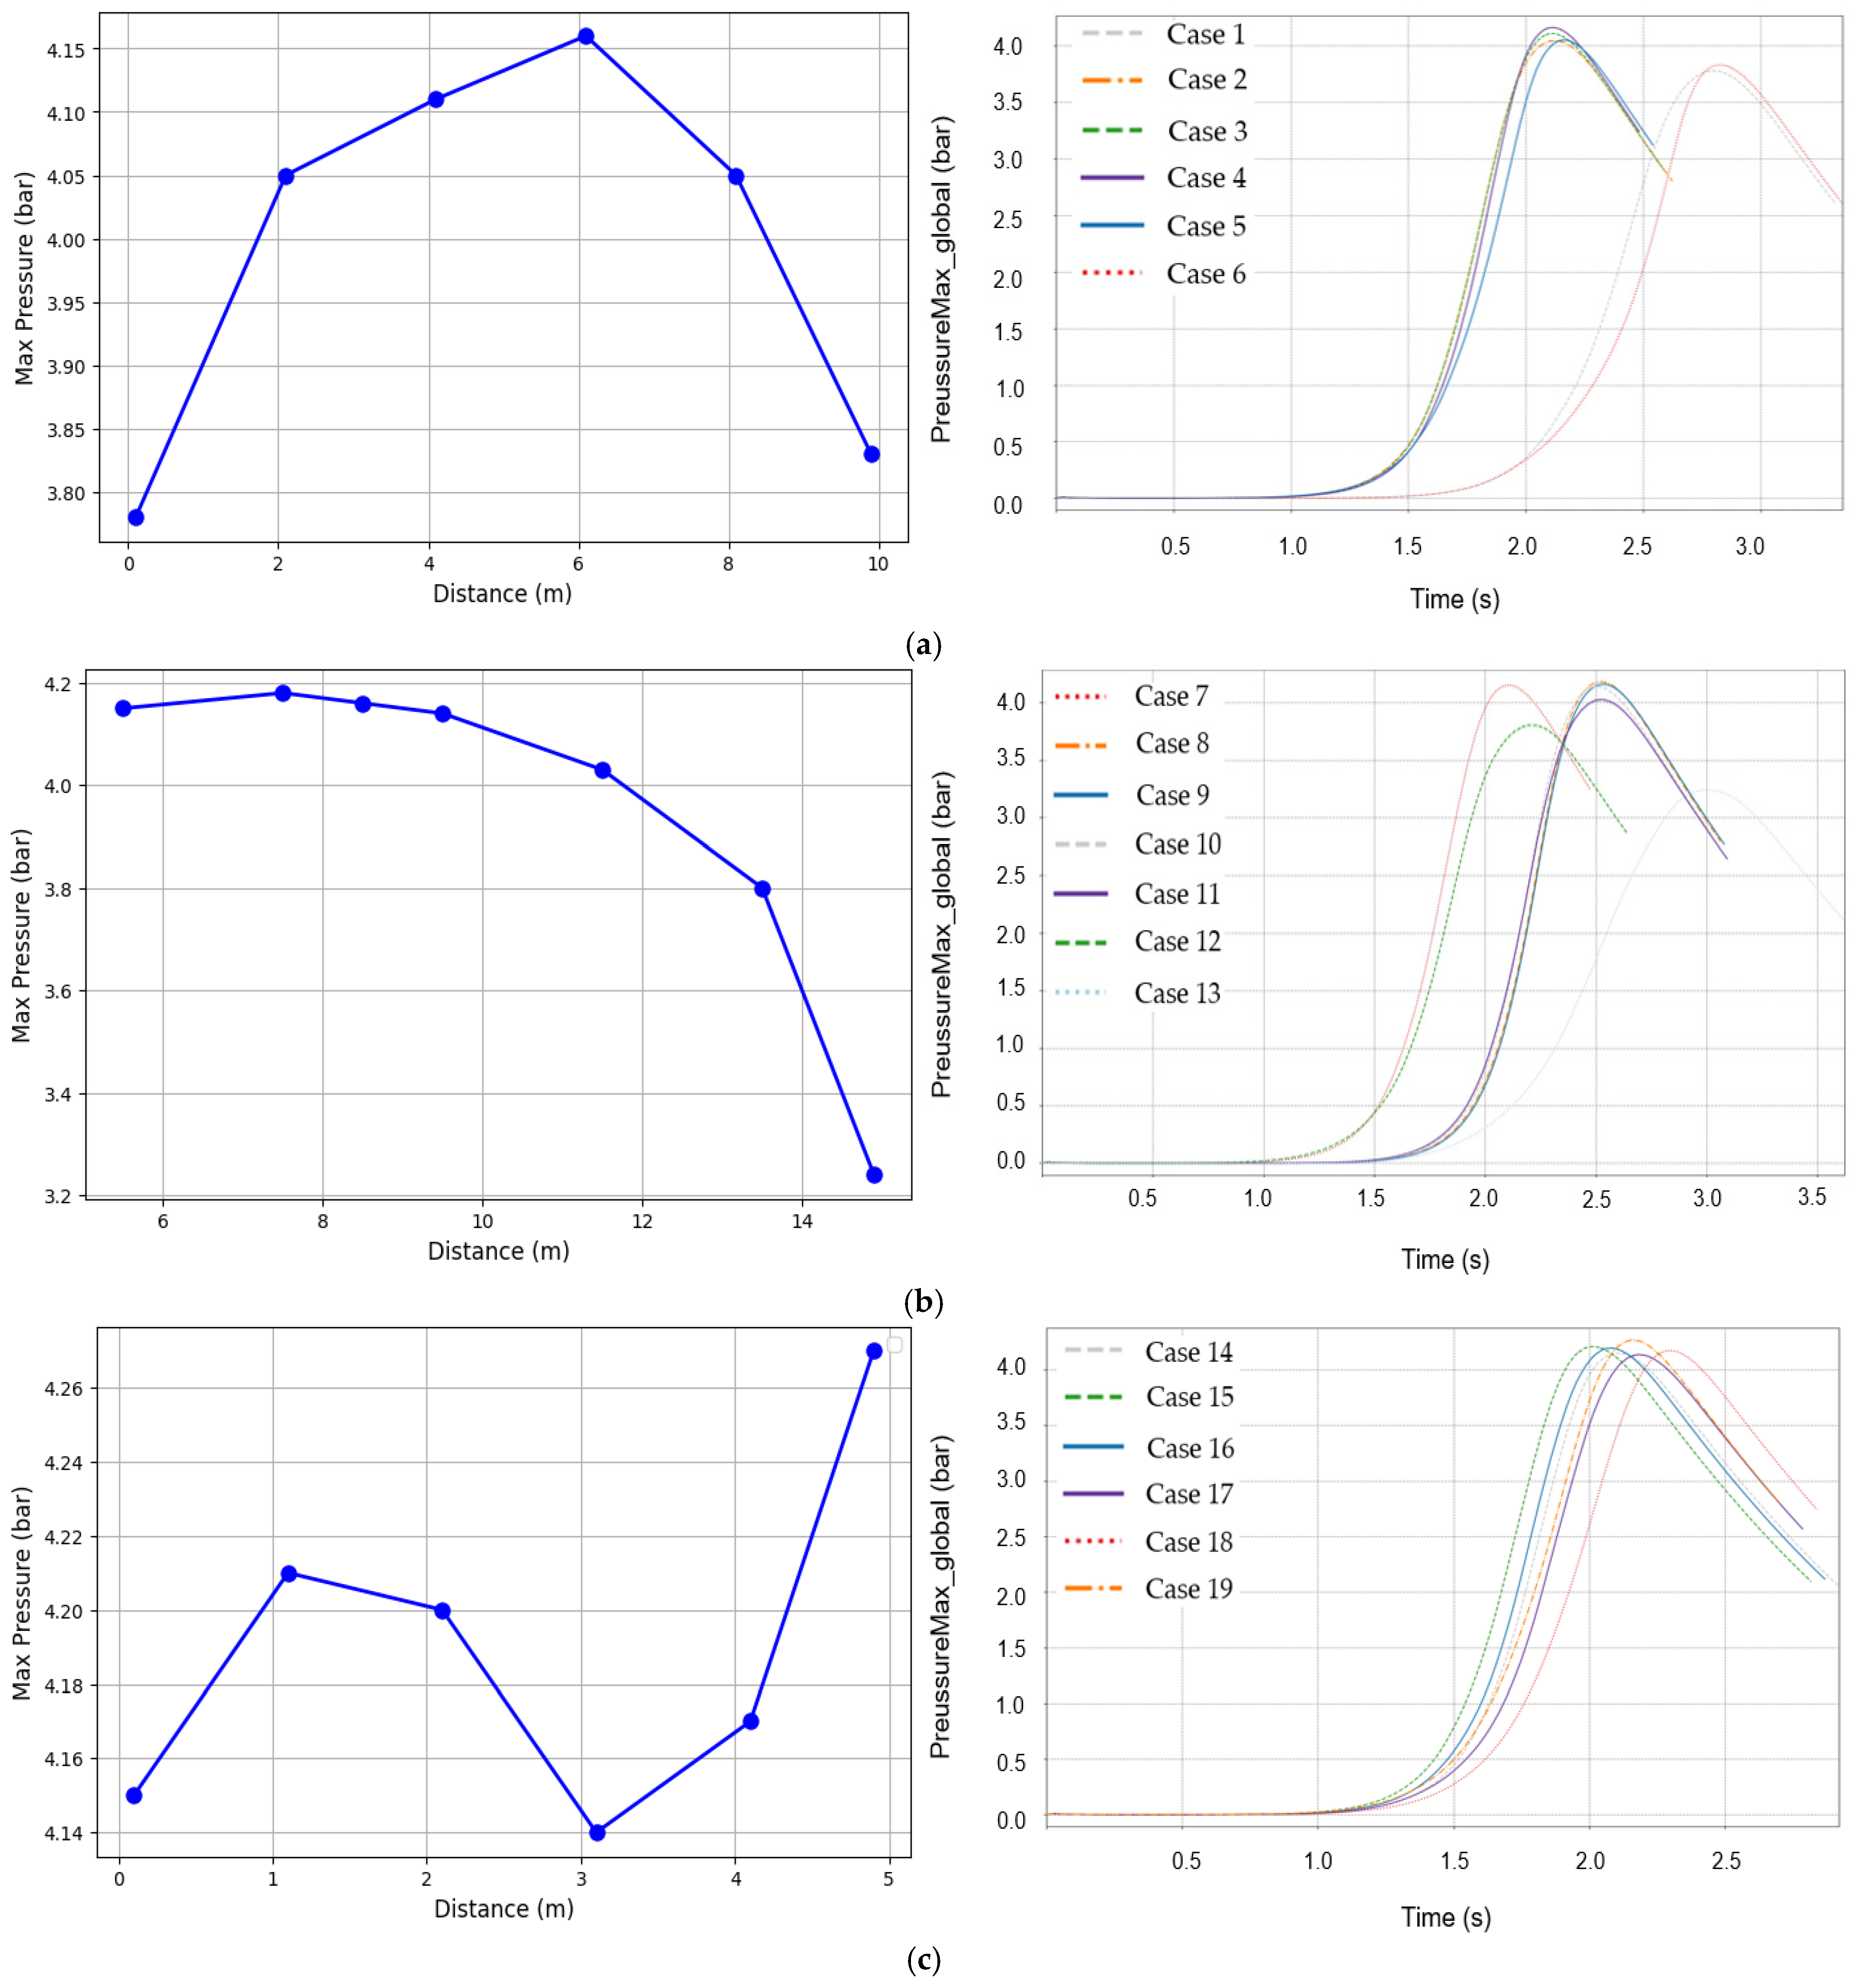
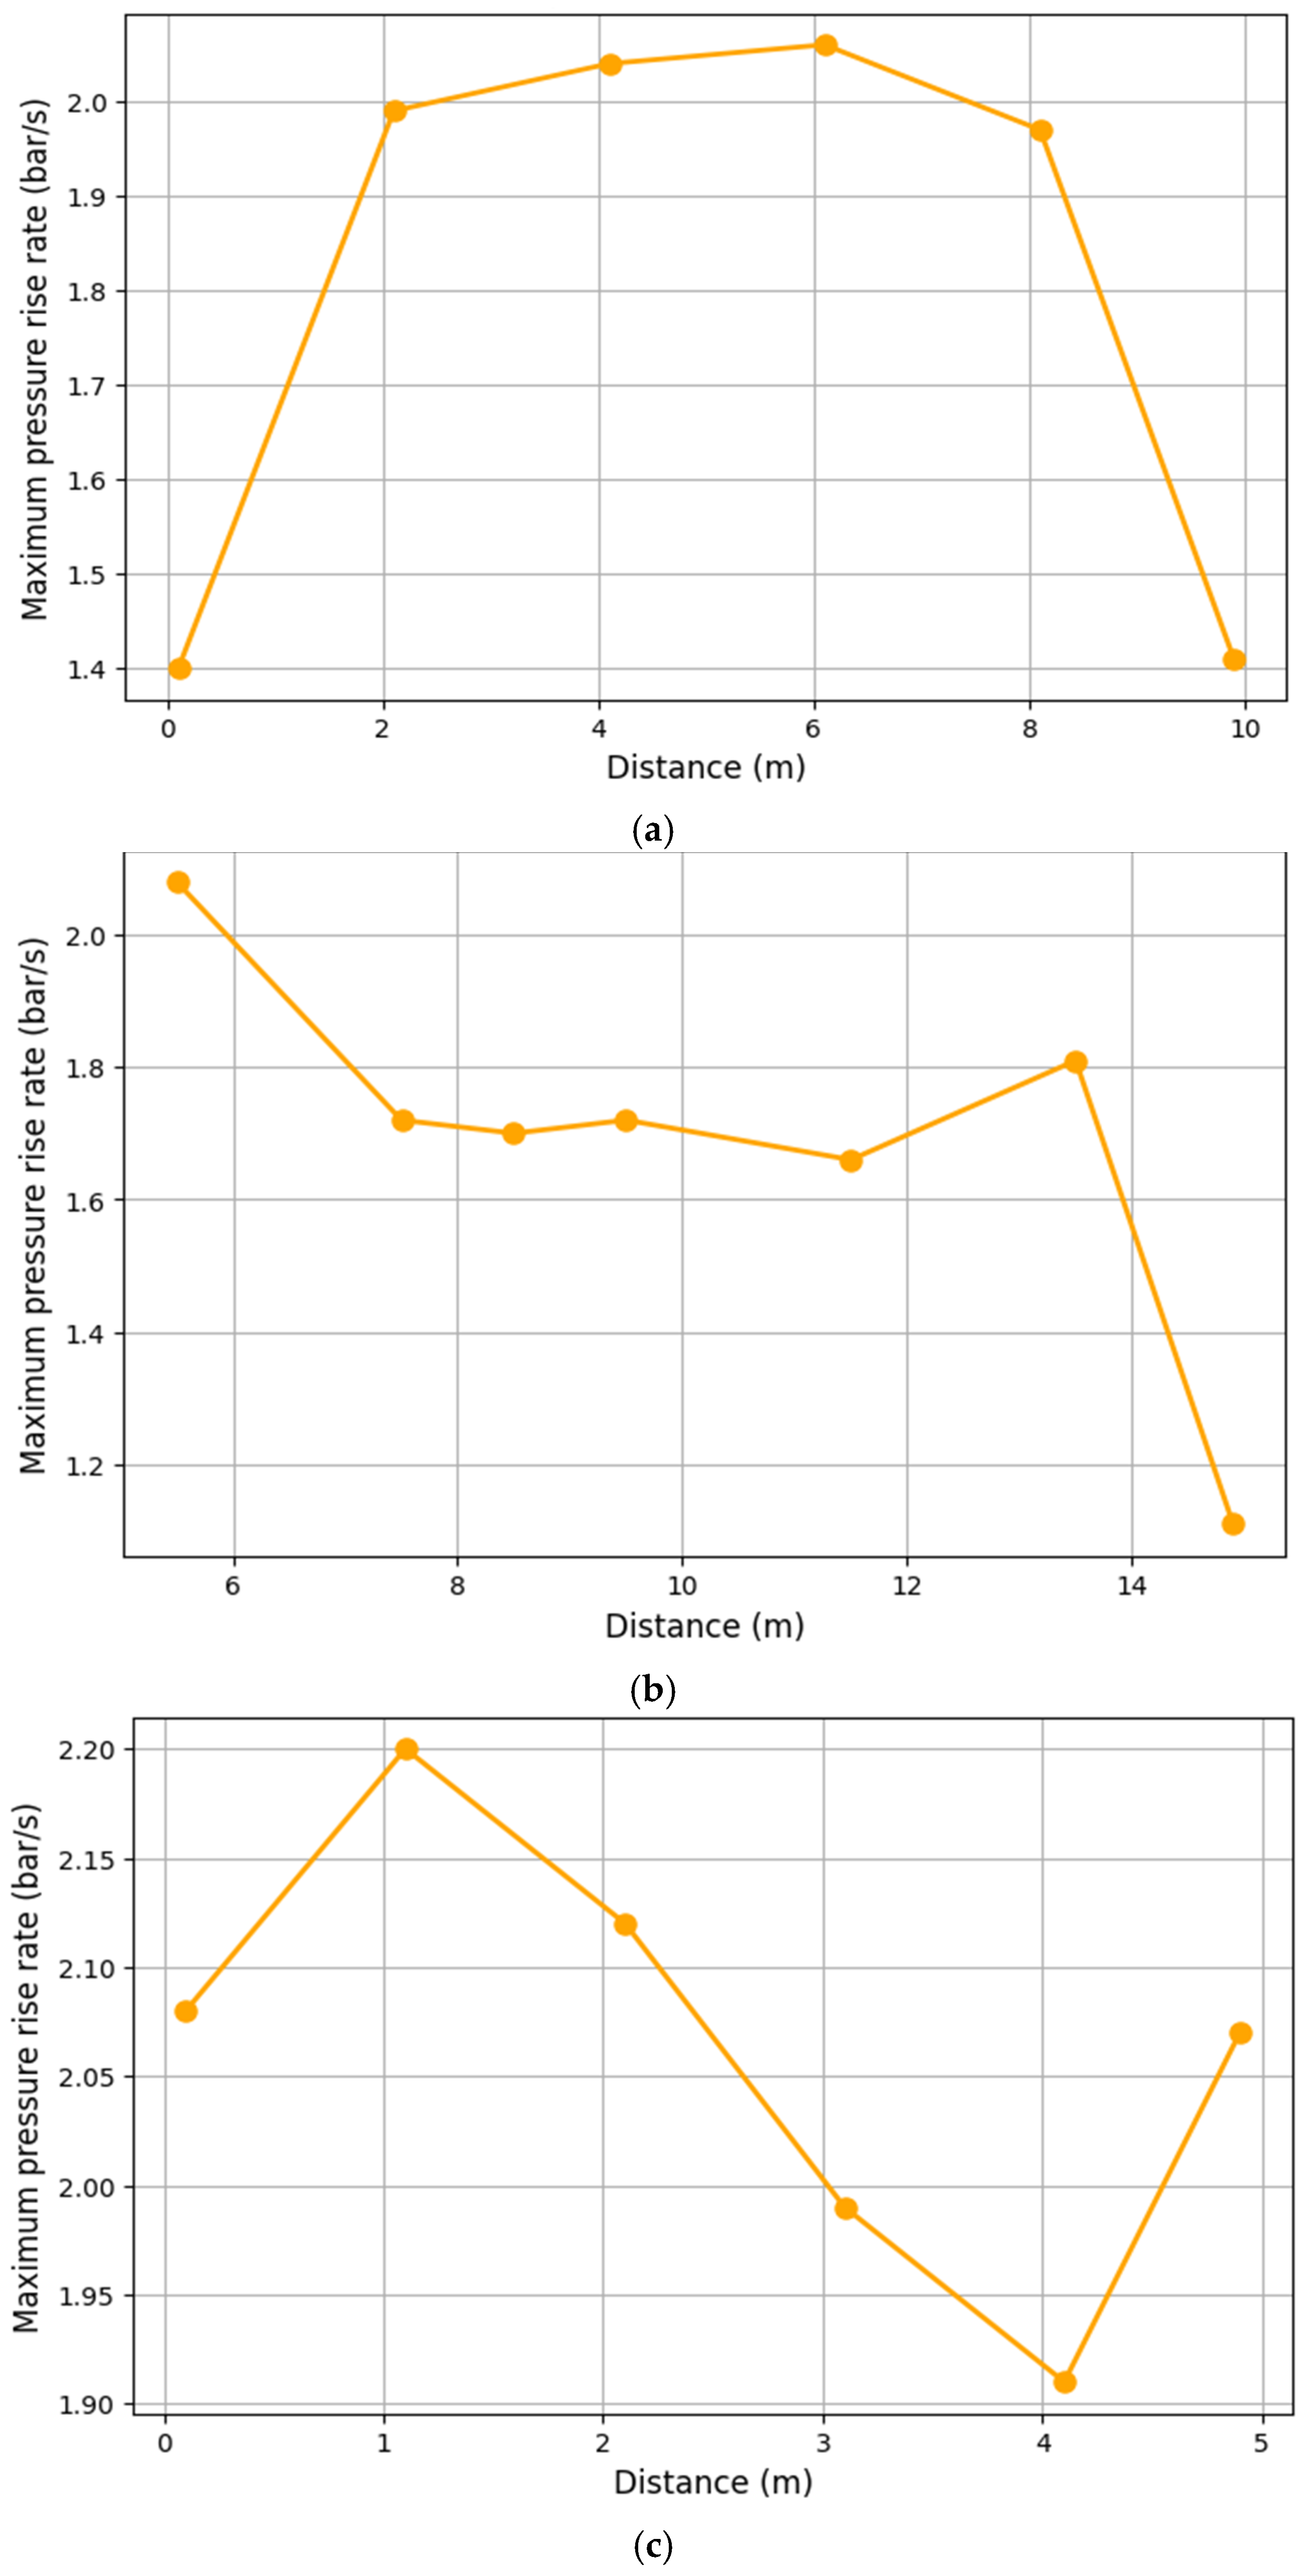
3.1. Analysis of Maximum Pressure and Maximum Pressure Rise Rate

Figure 7 shows the variations in the maximum explosion pressure and pressure–time histories along the X-, Y-, and Z-axes as a result of the the ignition position. The maximum explosion pressure was defined as the peak pressure recorded during the combustion process. It exhibited an evident dependence on the ignition location. Along the X-axis, the maximum pressure of 4.16 bar was observed at the central position (6.1 m), whereas lower values of 3.78 bar and 3.83 bar were obtained near the port side wall (0.1 m) and starboard side wall (9.9 m), respectively. This trend indicates that ignition near the walls resulted in reduced explosion intensity. This is presumably due to energy dissipation and interference from the reflected pressure waves. A similar distribution was observed along the Y-axis. The central region (7.5 m) produced the highest pressure of 4.18 bar. By contrast, a significantly lower pressure (3.24 bar) was measured near the forward wall (14.9 m). The consistent pattern observed along both axes indicates that a symmetrical flame propagation characteristic originating from the centre contributes to higher peak pressures. In the Z-axis direction, the highest pressure (4.27 bar) occurred near the ceiling (4.9 m), whereas the lowest pressure (4.14 bar) was recorded at 3.1 m. The increased pressure near the ceiling can be attributed to structural characteristics that facilitate the accumulation of combustion gases in the upper space. Specifically, the ignition initiated near the ceiling resulted in a higher maximum pressure owing to the accumulation of hot combustion products and reflected pressure waves in the upper region. This structural confinement enhances the pressure build-up because the combustion gases are trapped near the top of the enclosure.
These results imply that ignition at the central or upper locations promotes stronger and more uniform explosions. In contrast, near-wall ignition generates a lower explosion strength owing to asymmetric flame spread and boundary-induced effects. The maximum pressure rise rate (MPRR; defined as the rate of pressure increase from the ignition point to the peak pressure) is an essential indicator of the explosion severity and combustion rate. Figure 8 shows the MPRR distributions at various ignition locations. For the X-axis, ignition at the centre (6.1 m) resulted in the highest MPRR of 2.06 bar/s, whereas lower rates of 1.40 bar/s and 1.41 bar/s were observed at 0.1 m and 9.9 m, respectively. This demonstrates that central ignition promotes rapid and symmetrical combustion development. Along the Y-axis, the highest MPRR of 2.08 bar/s occurred at 5.5 m, and the lowest value of 1.11 bar/s was recorded near the forward wall (14.9 m). The reduction in the MPRR near the wall reflects delayed flame propagation and weaker combustion dynamics in these regions. In the Z-axis, the maximum MPRR of 2.20 bar/s was observed at the lower location (1.1 m), whereas the minimum value of 1.90 bar/s occurred at 4.1 m. This trend may have resulted from interplay between the vertical pressure gradients and fluid dynamics that are specific to the upper and lower regions of the enclosure.
Floor-level ignition creates a confined, low-space environment in which the flame rapidly propagates upward. This leads to a sharp and rapid pressure rise in the early phase of combustion, and resulted in the highest MPRR among all positions.
In explosion safety evaluations, the MPRR is a significant indicator because it reflects the initial intensity of the combustion and the dynamic loading imposed on the structure. Unlike the peak pressure, which reflects the cumulative energy, the MPRR better captures the combustion-induced pressure shock, which can compromise the structural integrity of the area. Therefore, in this study, the MPRR was adopted as a risk marker to emphasize early-stage hazard prediction, particularly in confined enclosures. This approach aligns with recent findings that highlight the importance of the flame acceleration and the fuel depletion rate as key drivers of explosion severity [41,42]. In conclusion, the spatial centre in the X- and Y-directions yielded the highest maximum pressure and MPRR. In the Z-direction, the ceiling region exhibited the highest pressure, whereas the floor region showed the steepest pressure increase. These findings underscore the unique vertical behaviour of flame dynamics, where ceiling ignition intensifies the peak pressure accumulation and floor ignition accelerates the combustion rate. These observations indicate that the ignition position critically influences the characteristics of explosions. Thus, meticulous control of the ignition location could play a pivotal role in improving explosion safety during the design of ammonia FPRs.

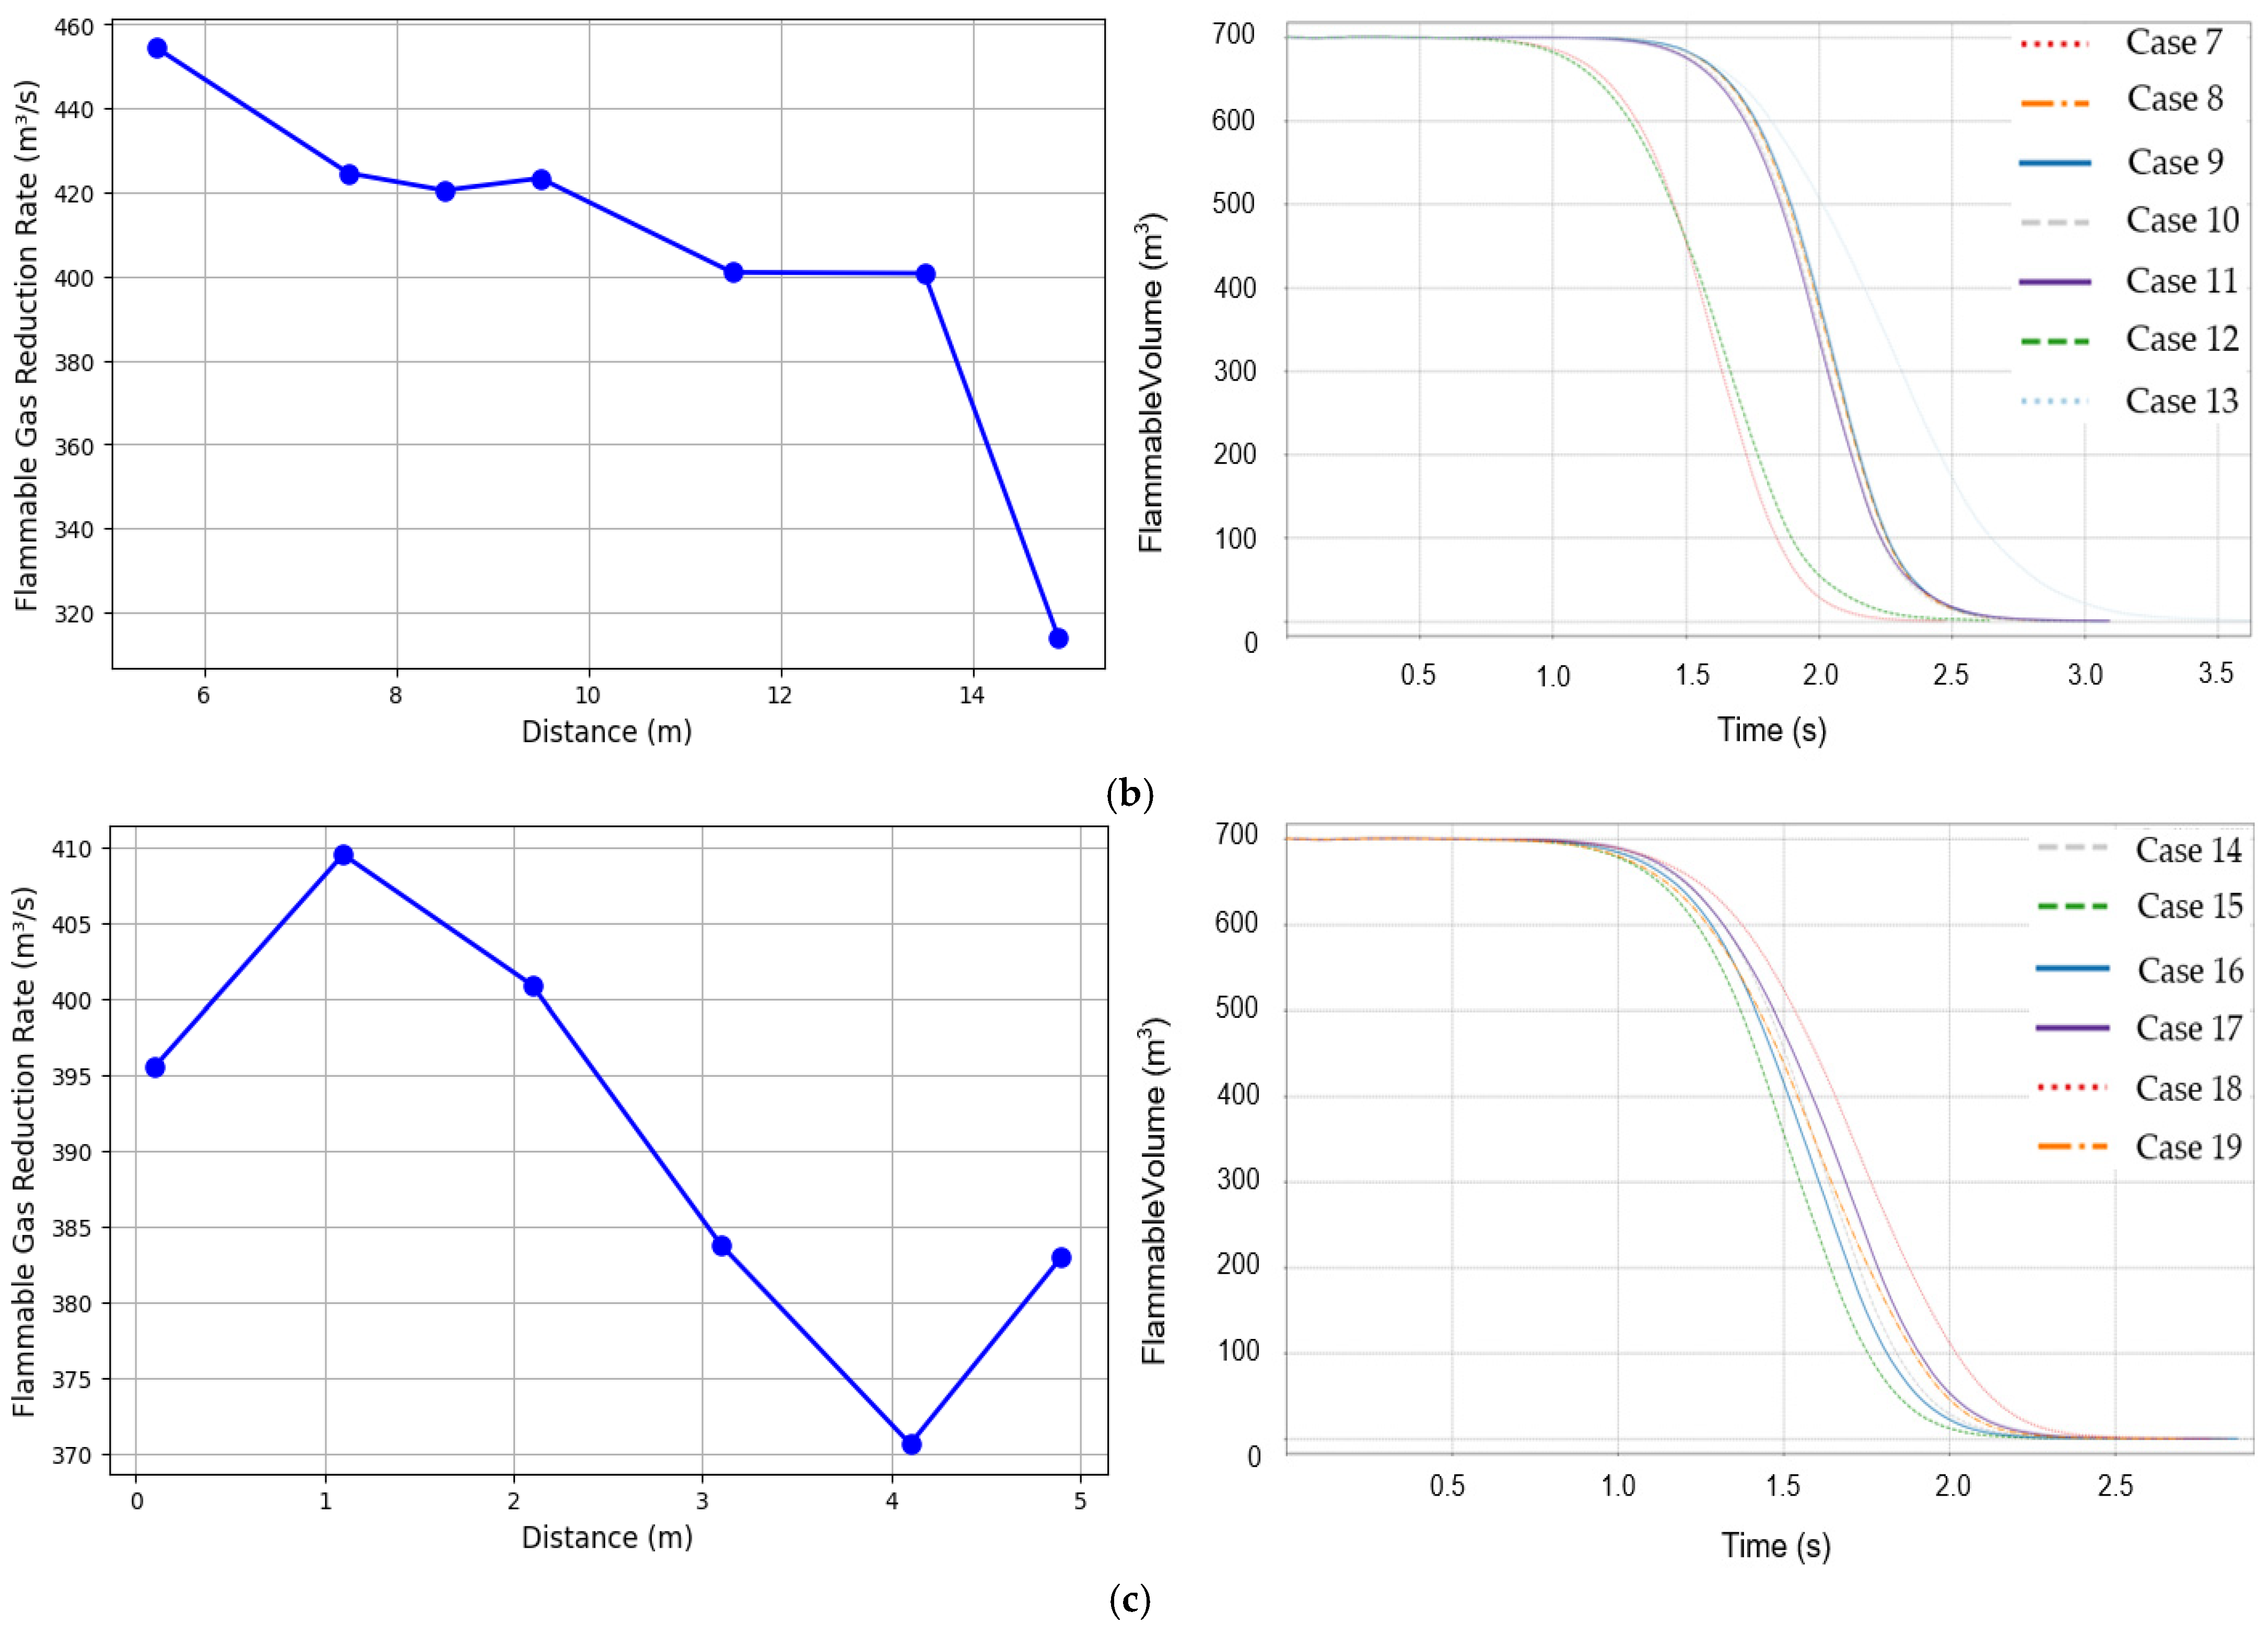
3.2. Variation in Flammable Gas Reduction Rate

In this study, the onset of the explosion was defined as the time at which the flammable gas mixture attained a pressure of 0.01 bar. The flammable gas reduction rate was quantified based on the time elapsed from ignition to complete depletion of the gas. This metric was used to evaluate the influence of the ignition position on the combustion propagation and explosion characteristics. Figure 9 illustrates the variations in the flammable gas reduction rate and gas volume over time for ignition points located along the X-, Y-, and Z-axes. For the X-axis, ignition at the centre (6.1 m) resulted in the highest reduction rate of 456.64 m3/s. In contrast, ignition near the port (0.1 m) and starboard (9.9 m) walls yielded significantly lower rates of 363.37 m3/s and 357.79 m3/s, respectively. These results indicate that central ignition facilitates symmetric and rapid combustion, resulting in a faster depletion of the flammable gas. A similar trend was observed along the Y-axis. Here, ignition at the centre (5.5 m) produced the maximum reduction rate of 454.45 m3/s, whereas the lowest rate of 313.89 m3/s was recorded near the forward wall (14.9 m). The reduction rate decreased consistently as the ignition point shifted toward the FWD direction. This indicates that there is a less favourable combustion environment near the wall. For the Z-axis, ignition near the floor (1.1 m) generated the highest gas reduction rate of 409.55 m3/s, whereas the lowest rate of 370.59 m3/s occurred near the ceiling (4.1 m). This result implies that ignition in the lower region may create favourable conditions for vertical flame propagation and enhanced combustion efficiency. These observations demonstrate that the ignition location has a direct impact on the combustion rate and flame development pathways. This, in turn, influenced the rate of flammable gas depletion. The spatial distribution of the gas reduction rates showed a strong correlation with the previously analysed MPRR. This reinforces the assertion that rapid gas consumption is the primary factor that drives the pressure escalation during an explosion. Therefore, the flammable gas reduction rate can serve as a critical predictive parameter for assessing the explosion severity and risk potential. Optimization of the ignition position based on this metric could contribute significantly to the design of safer fuel preparation systems.

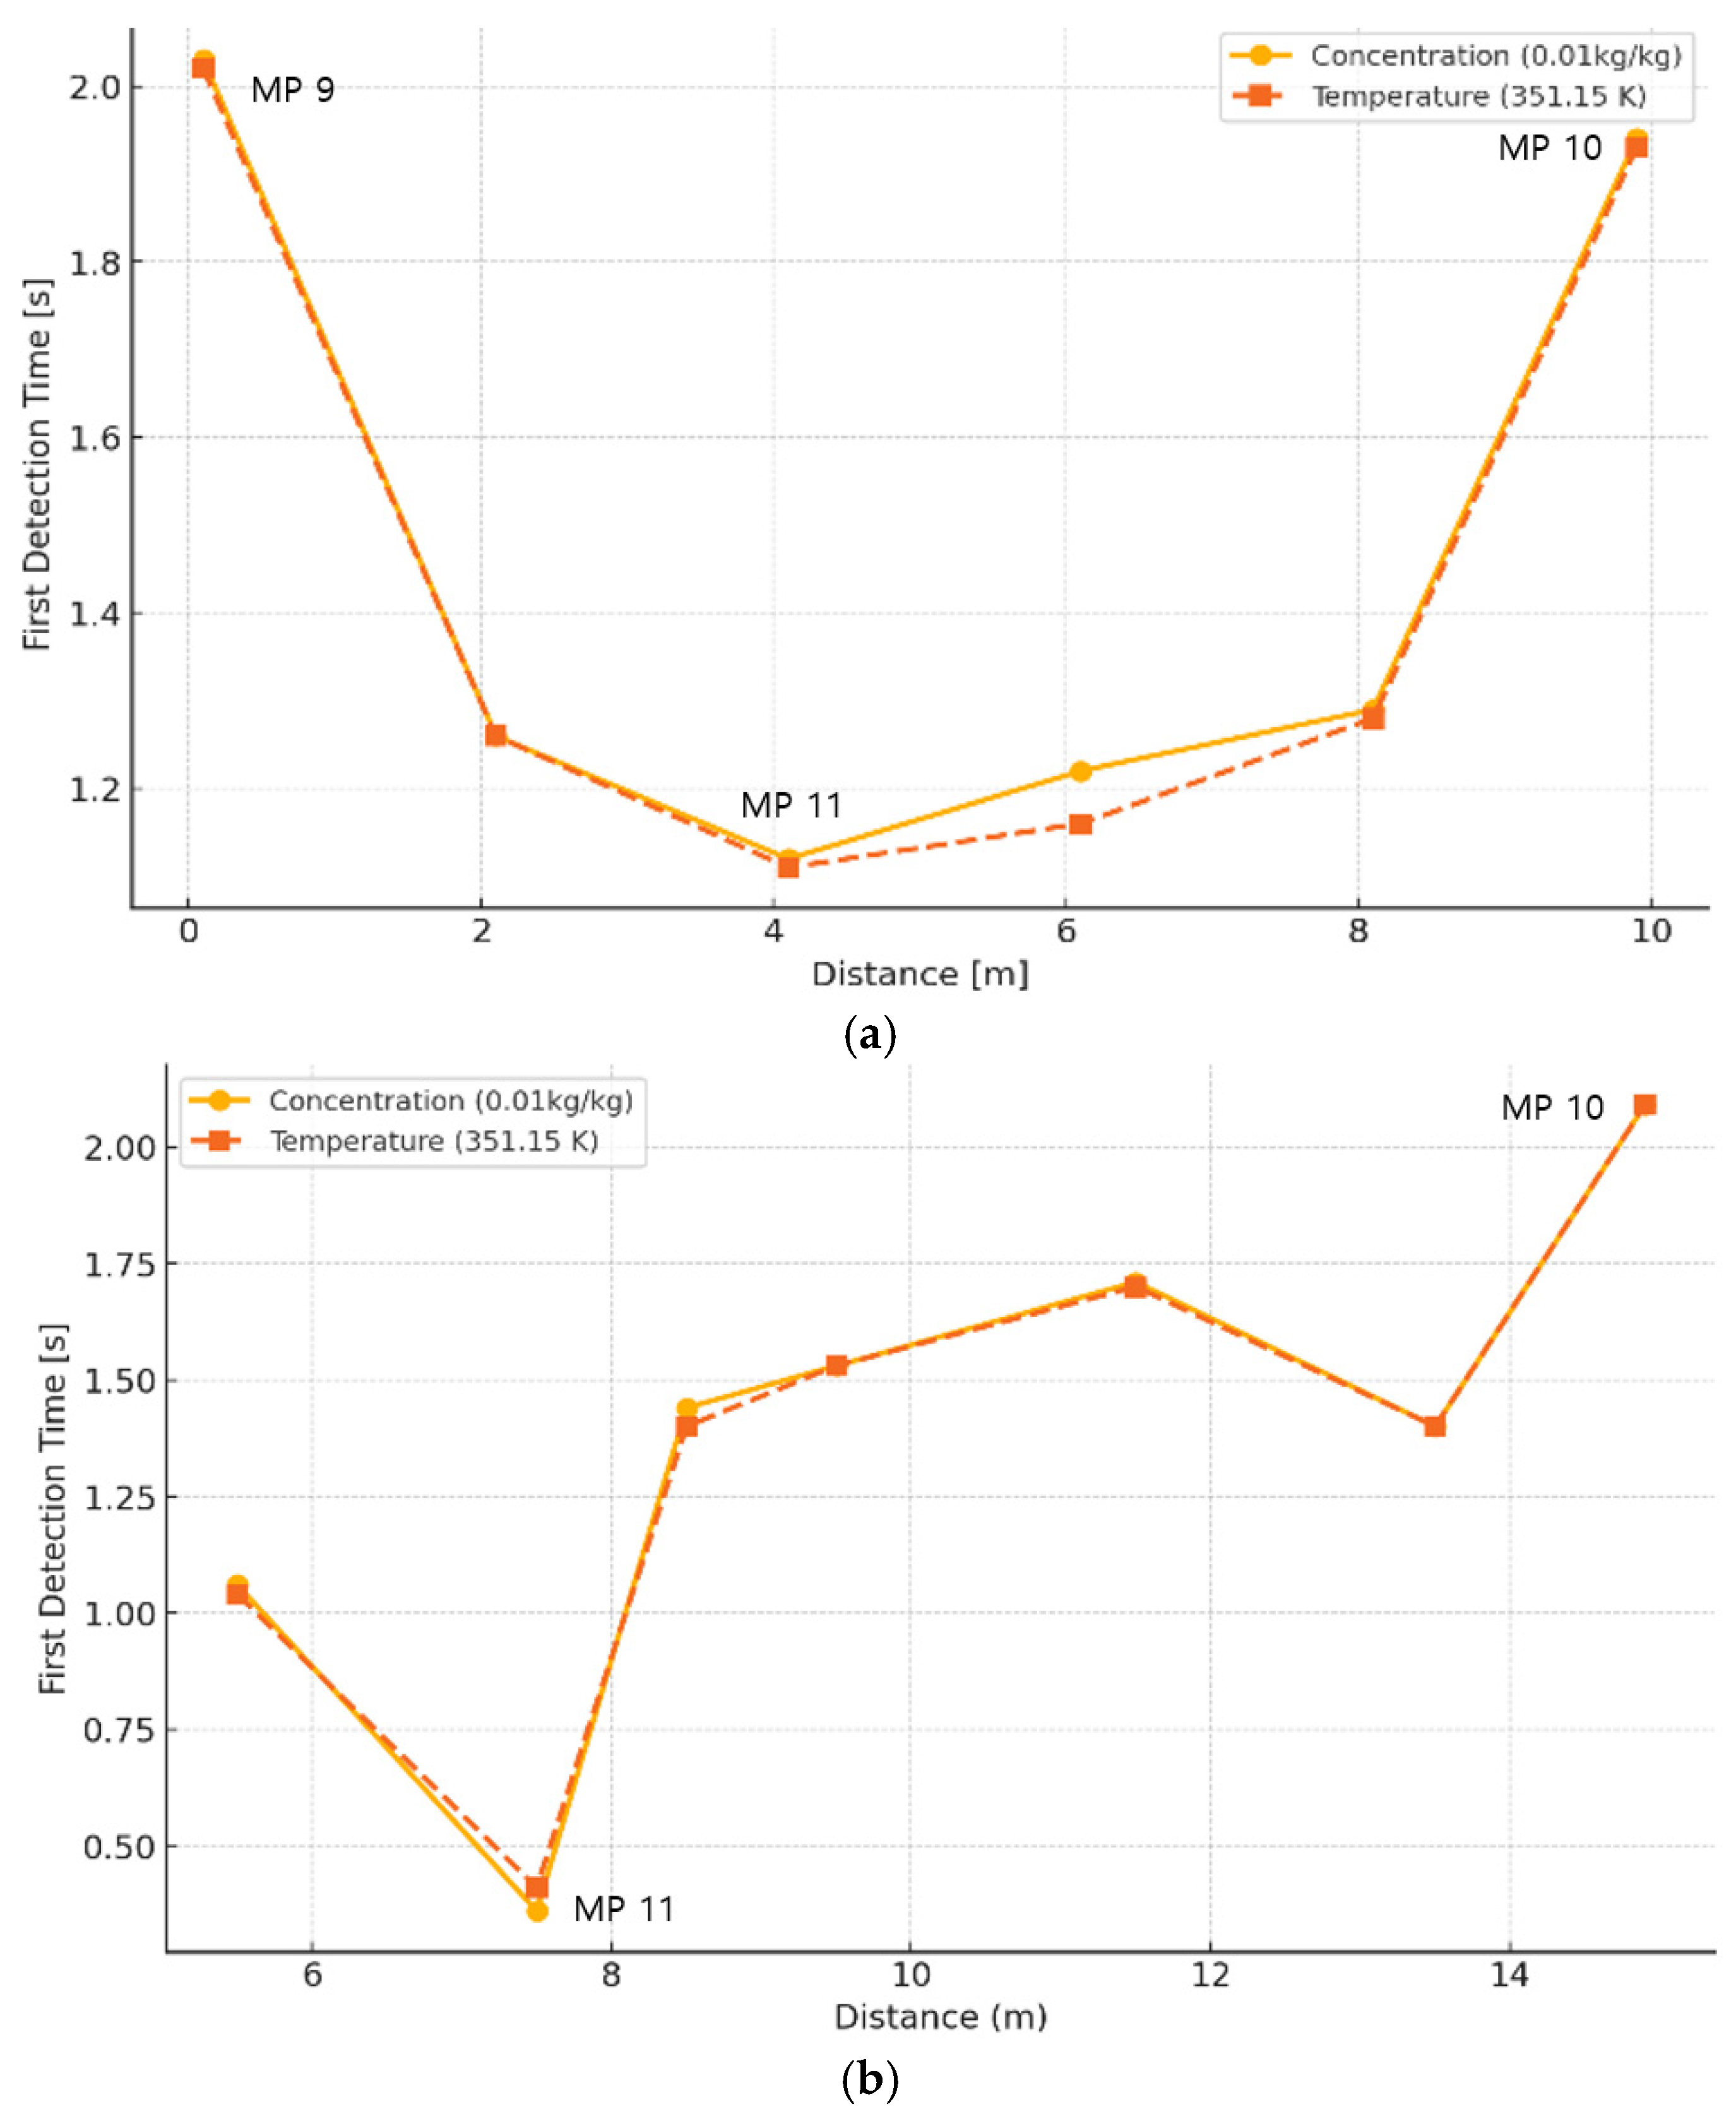
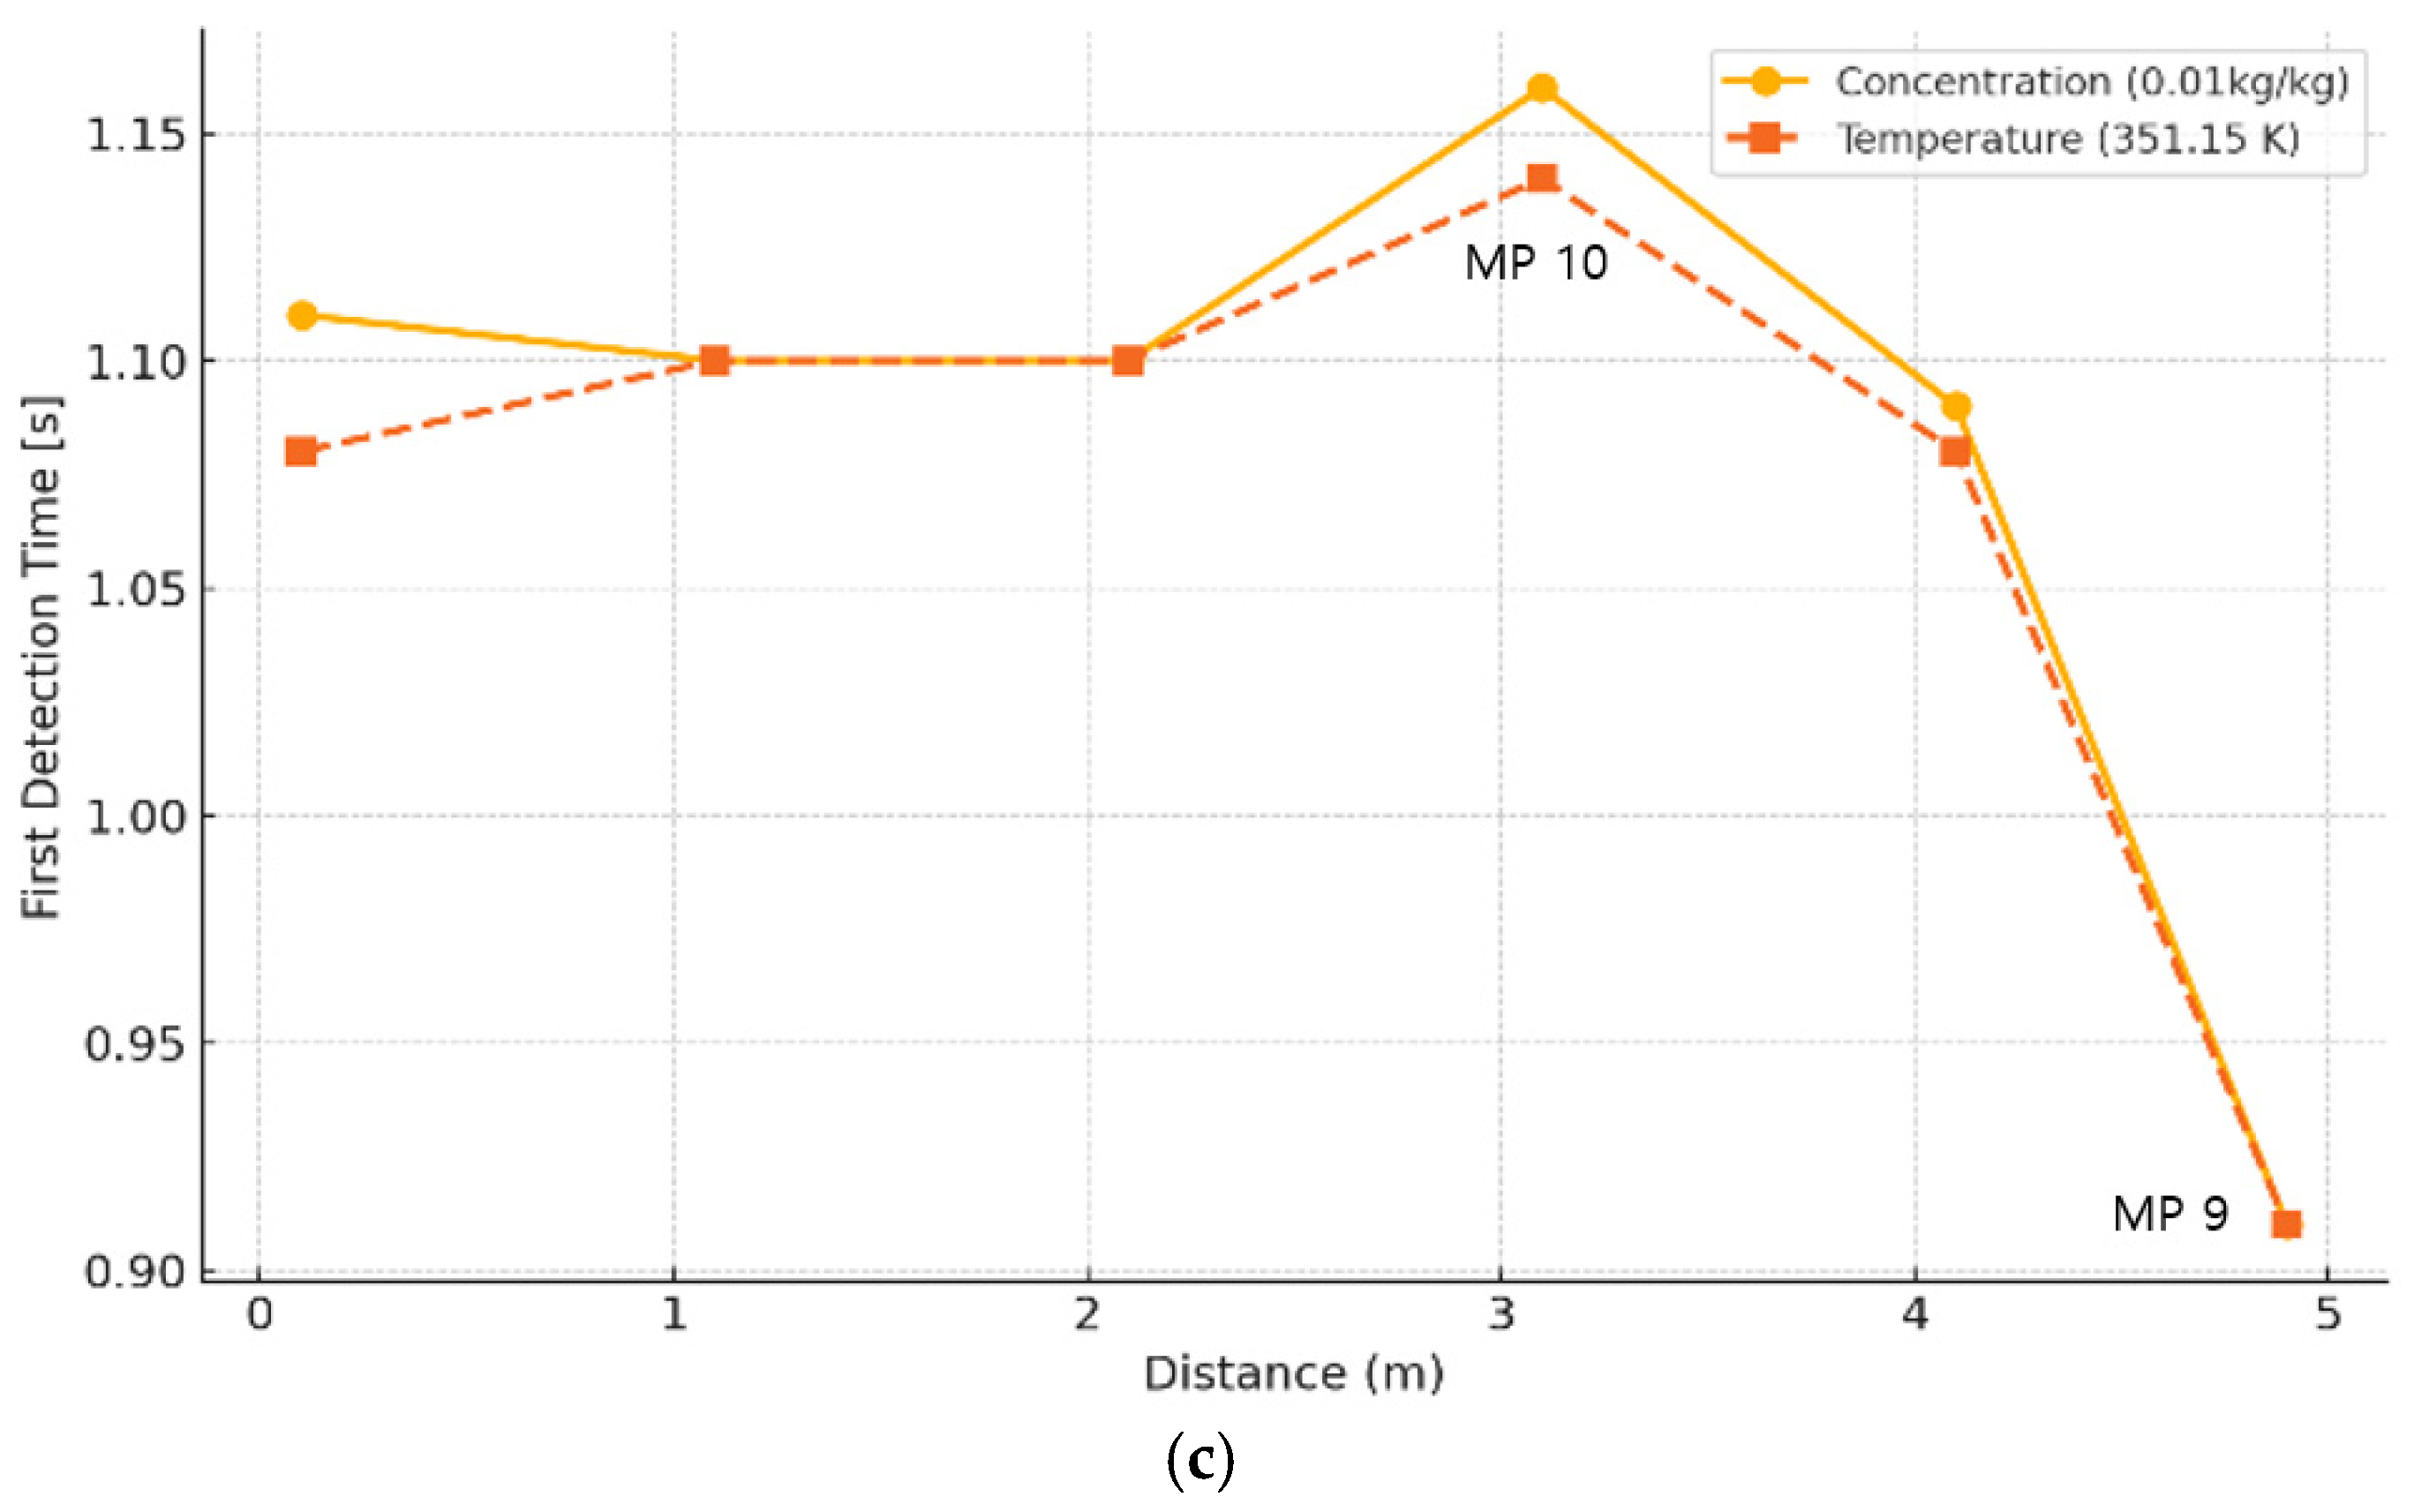
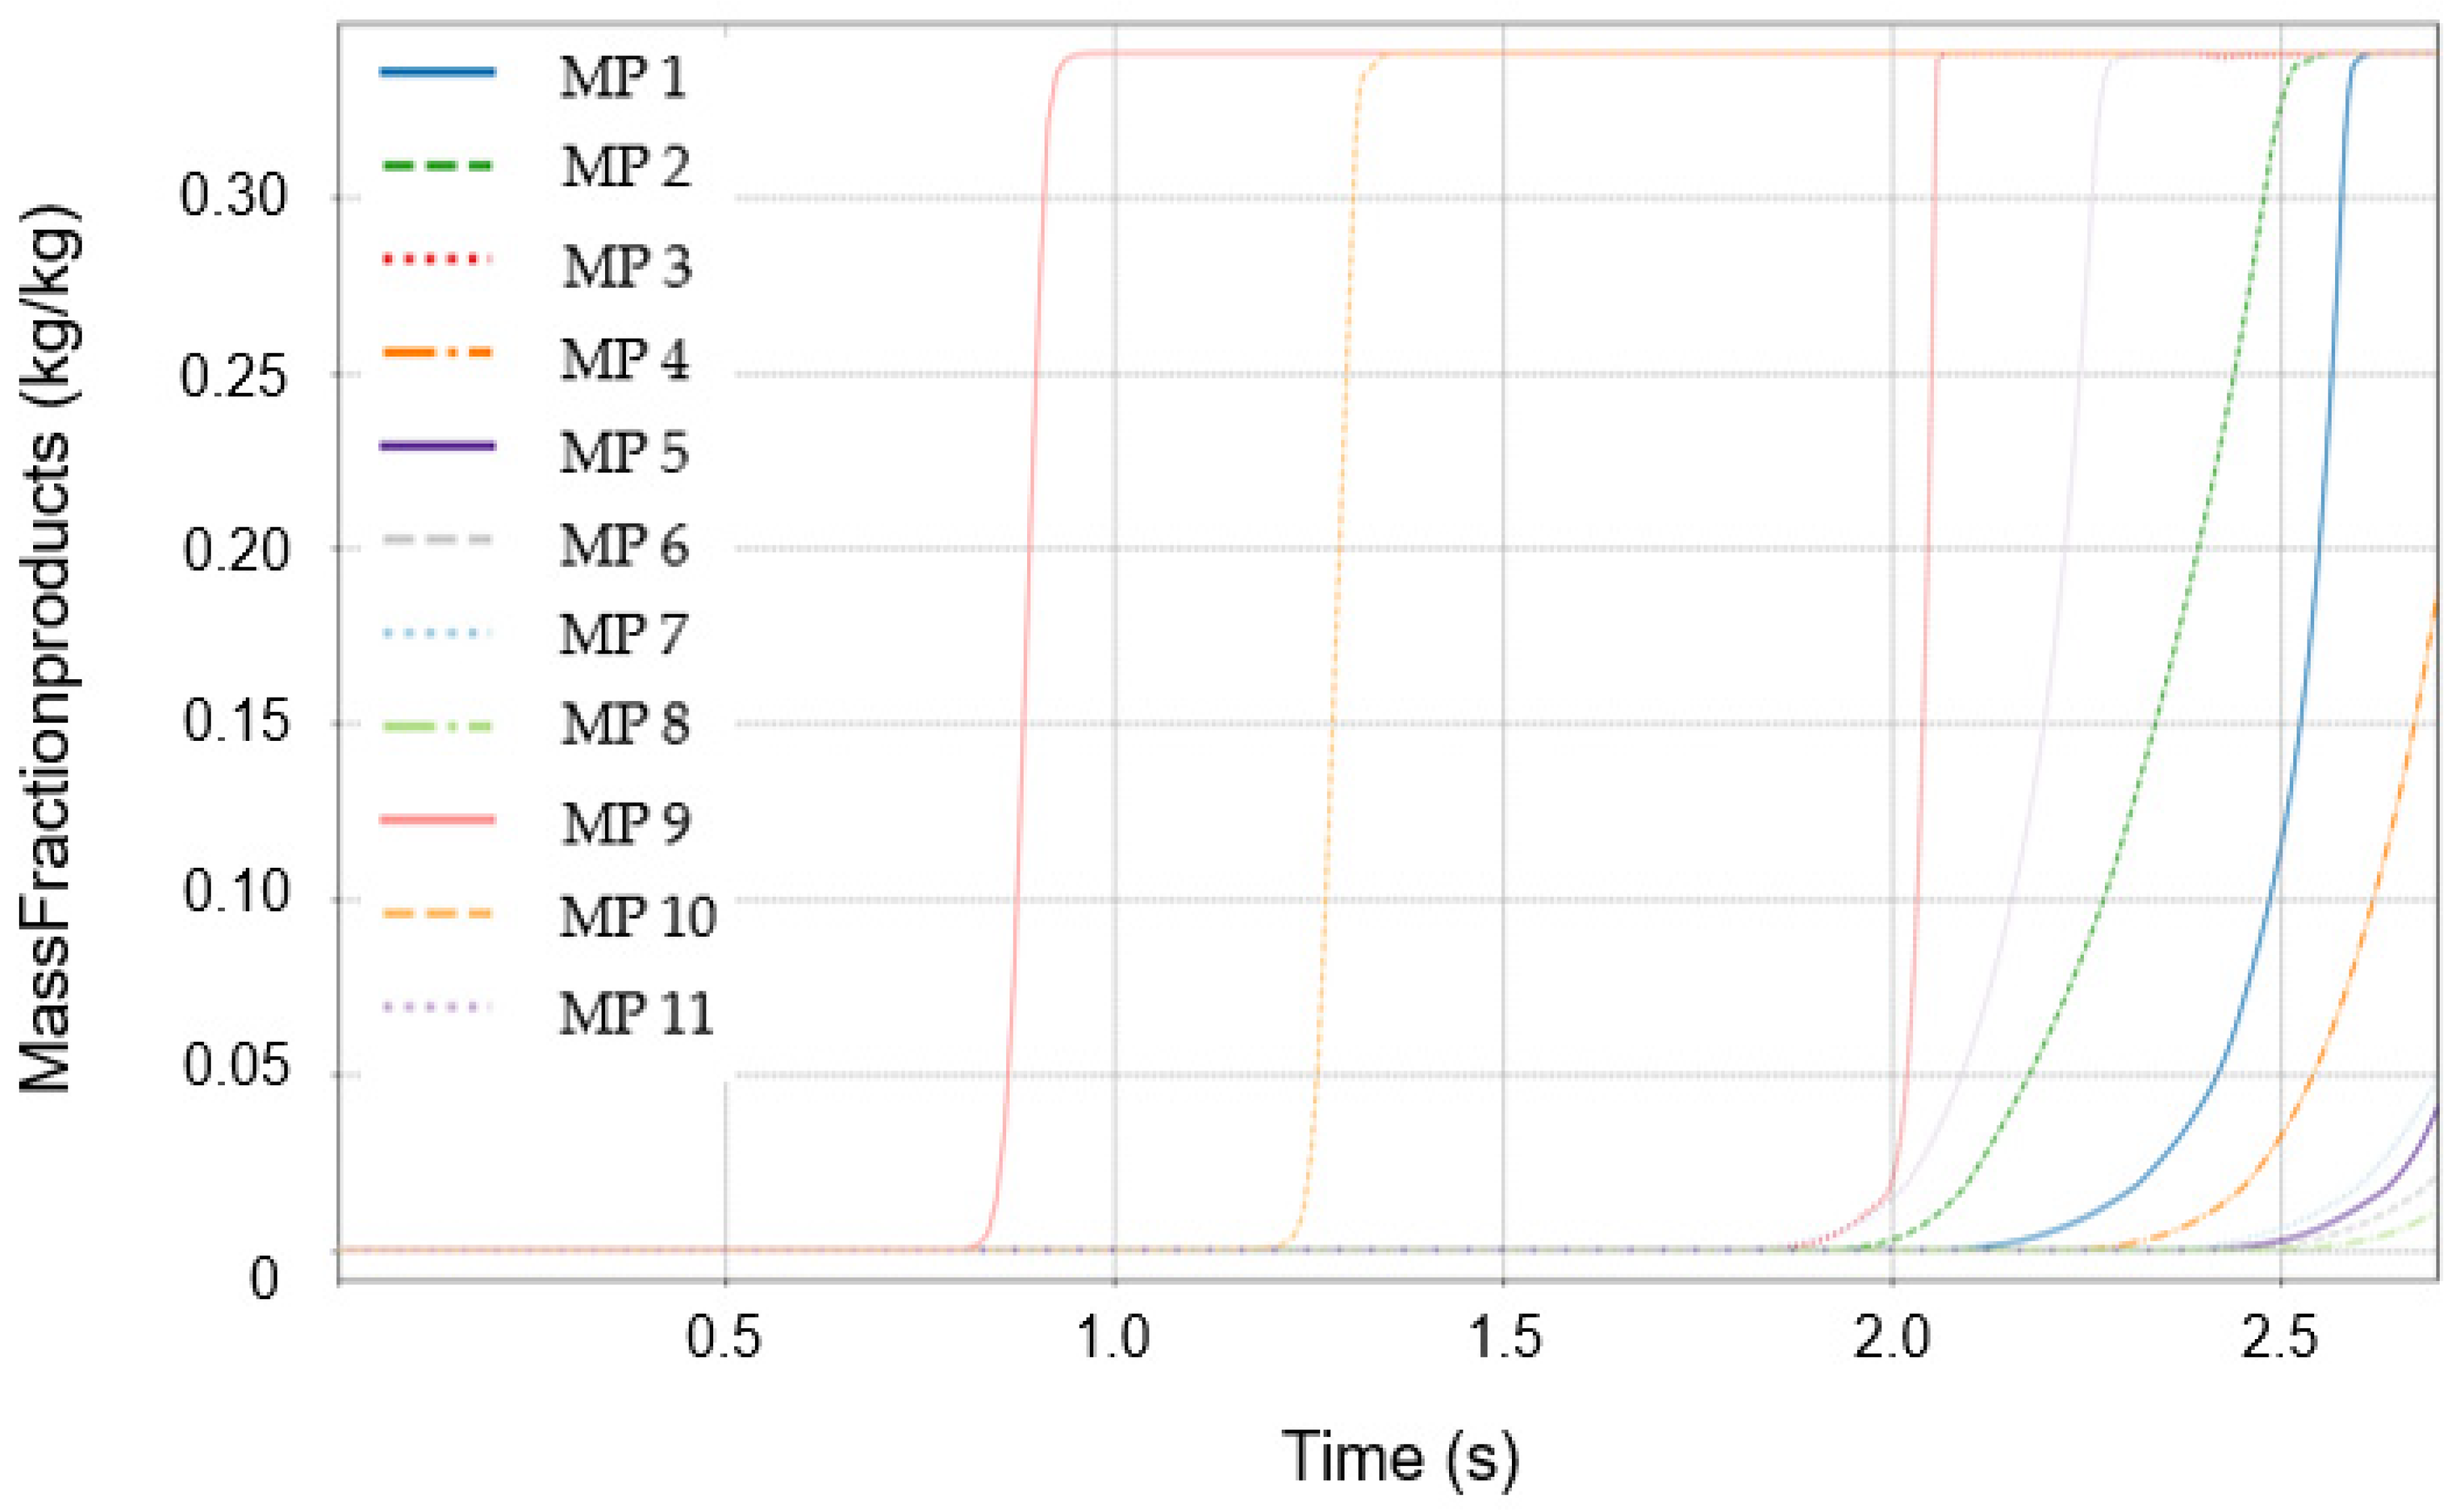
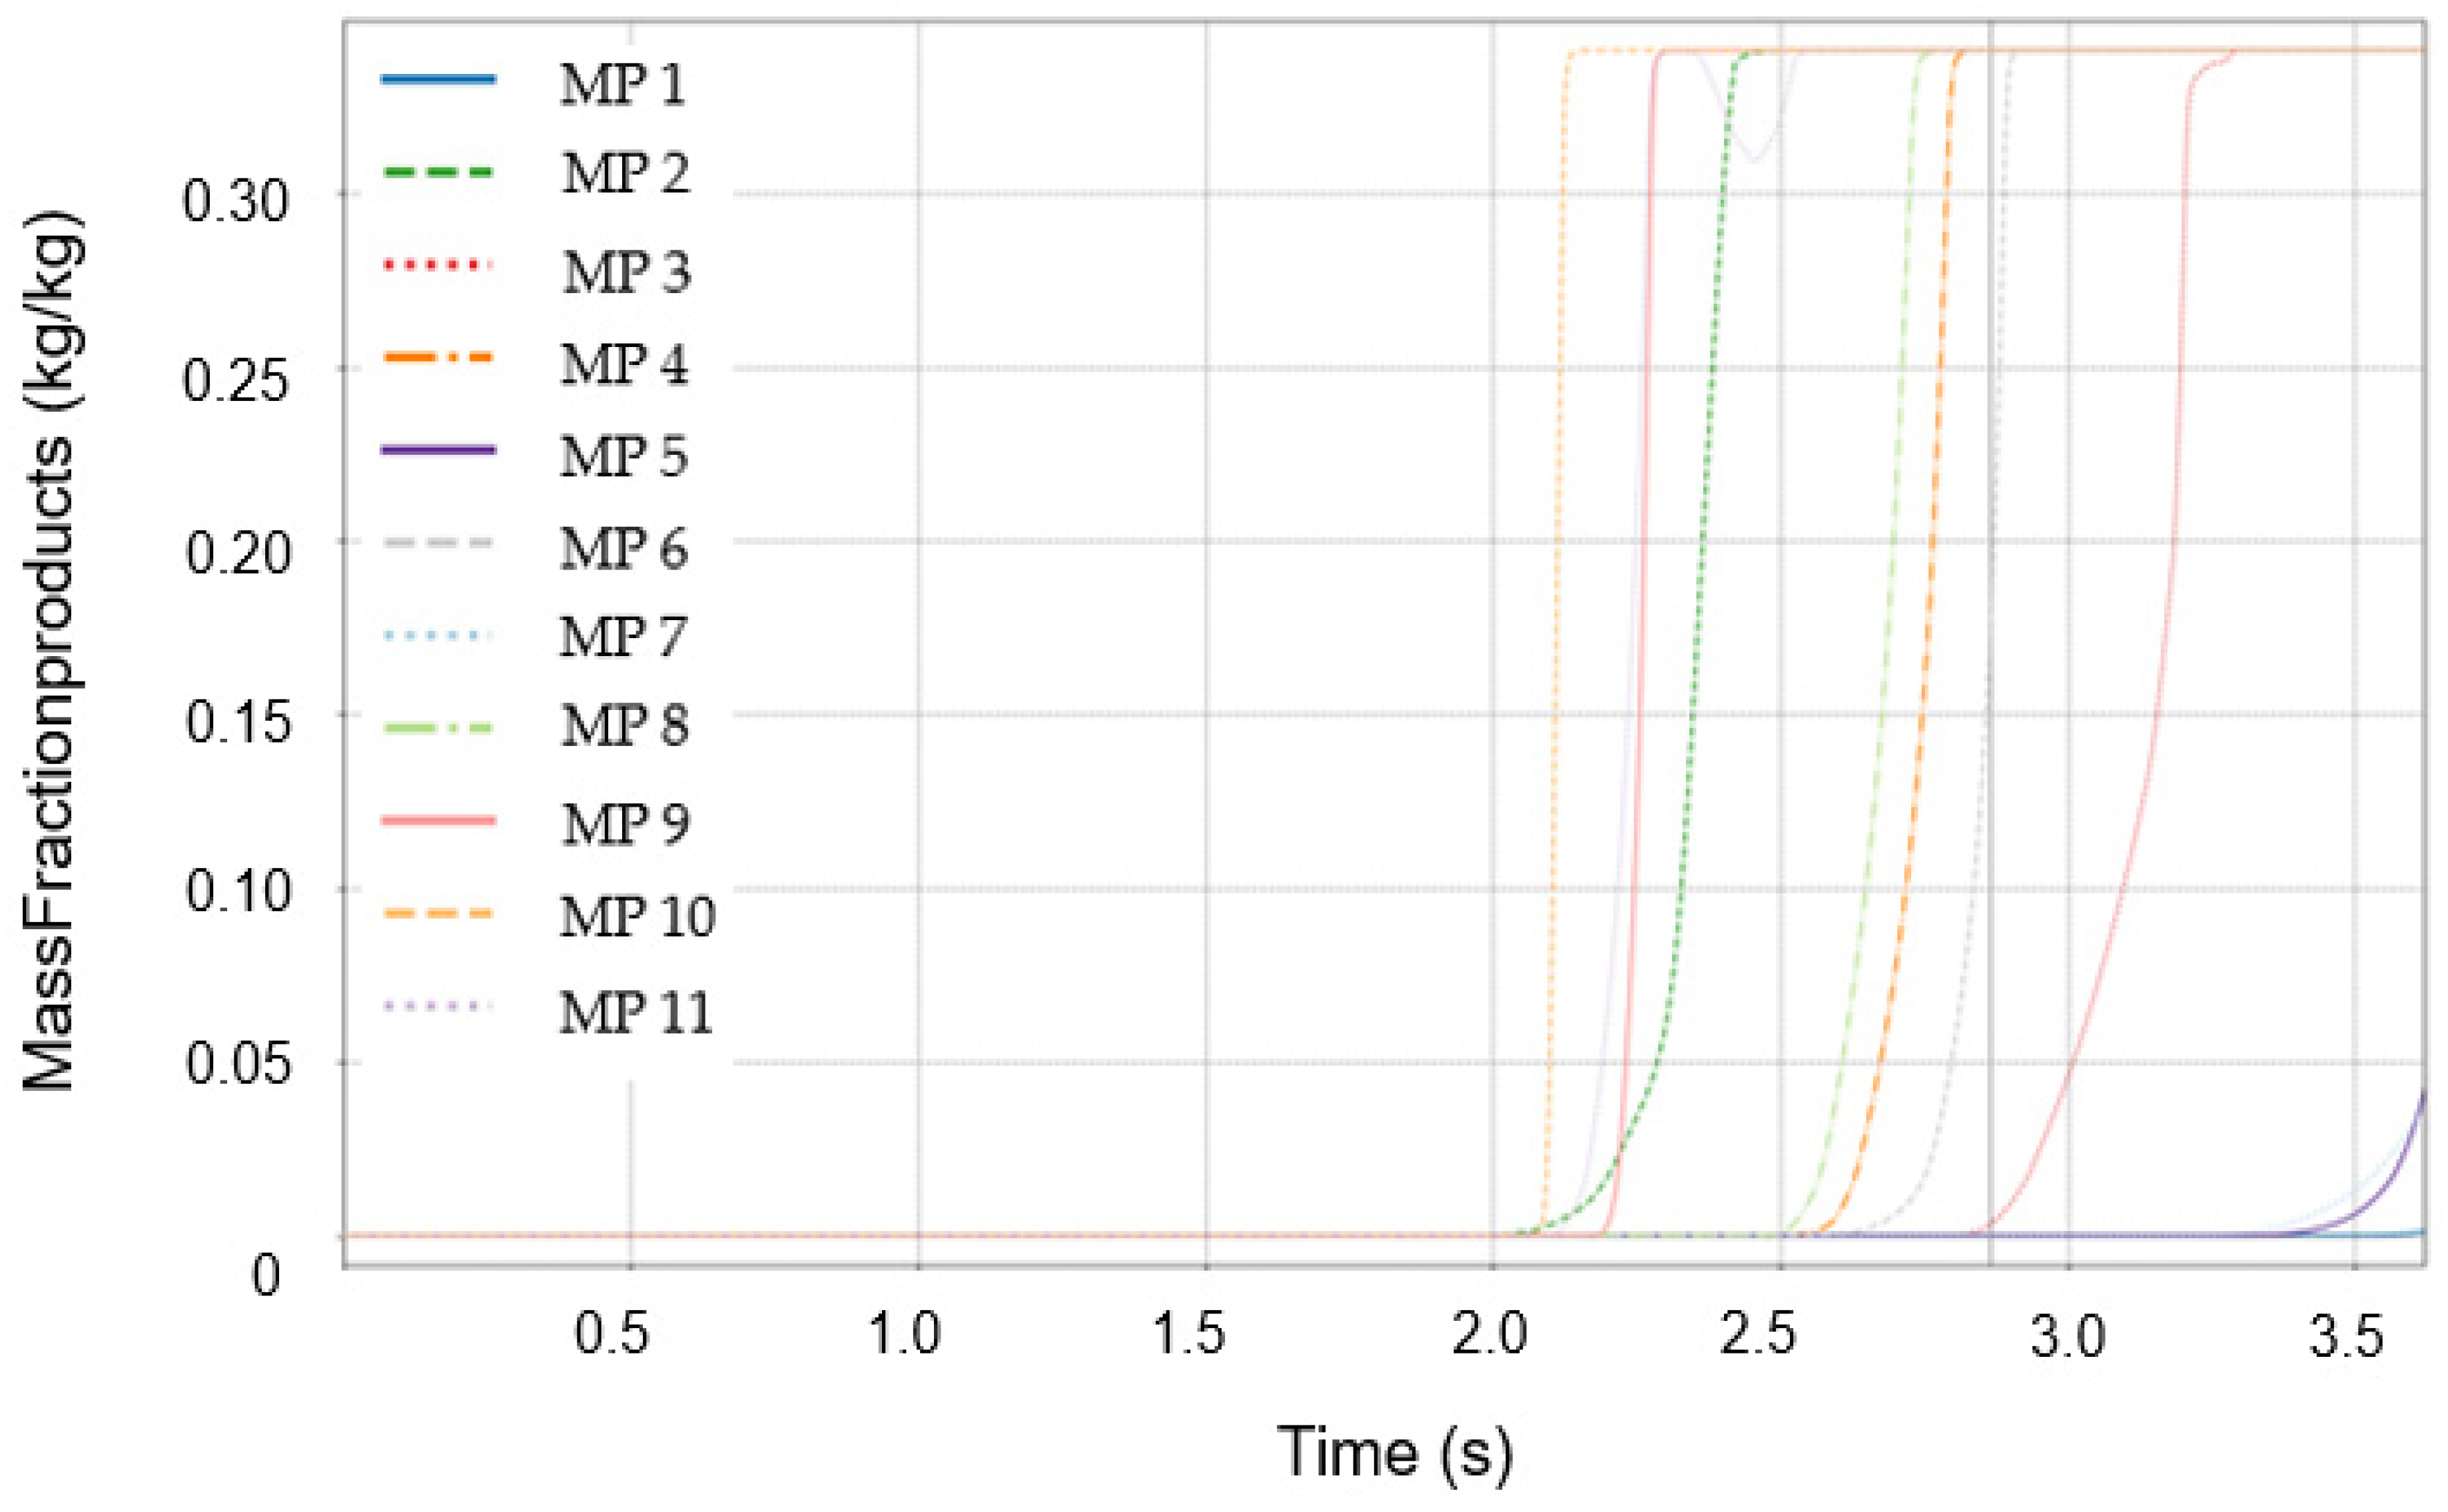
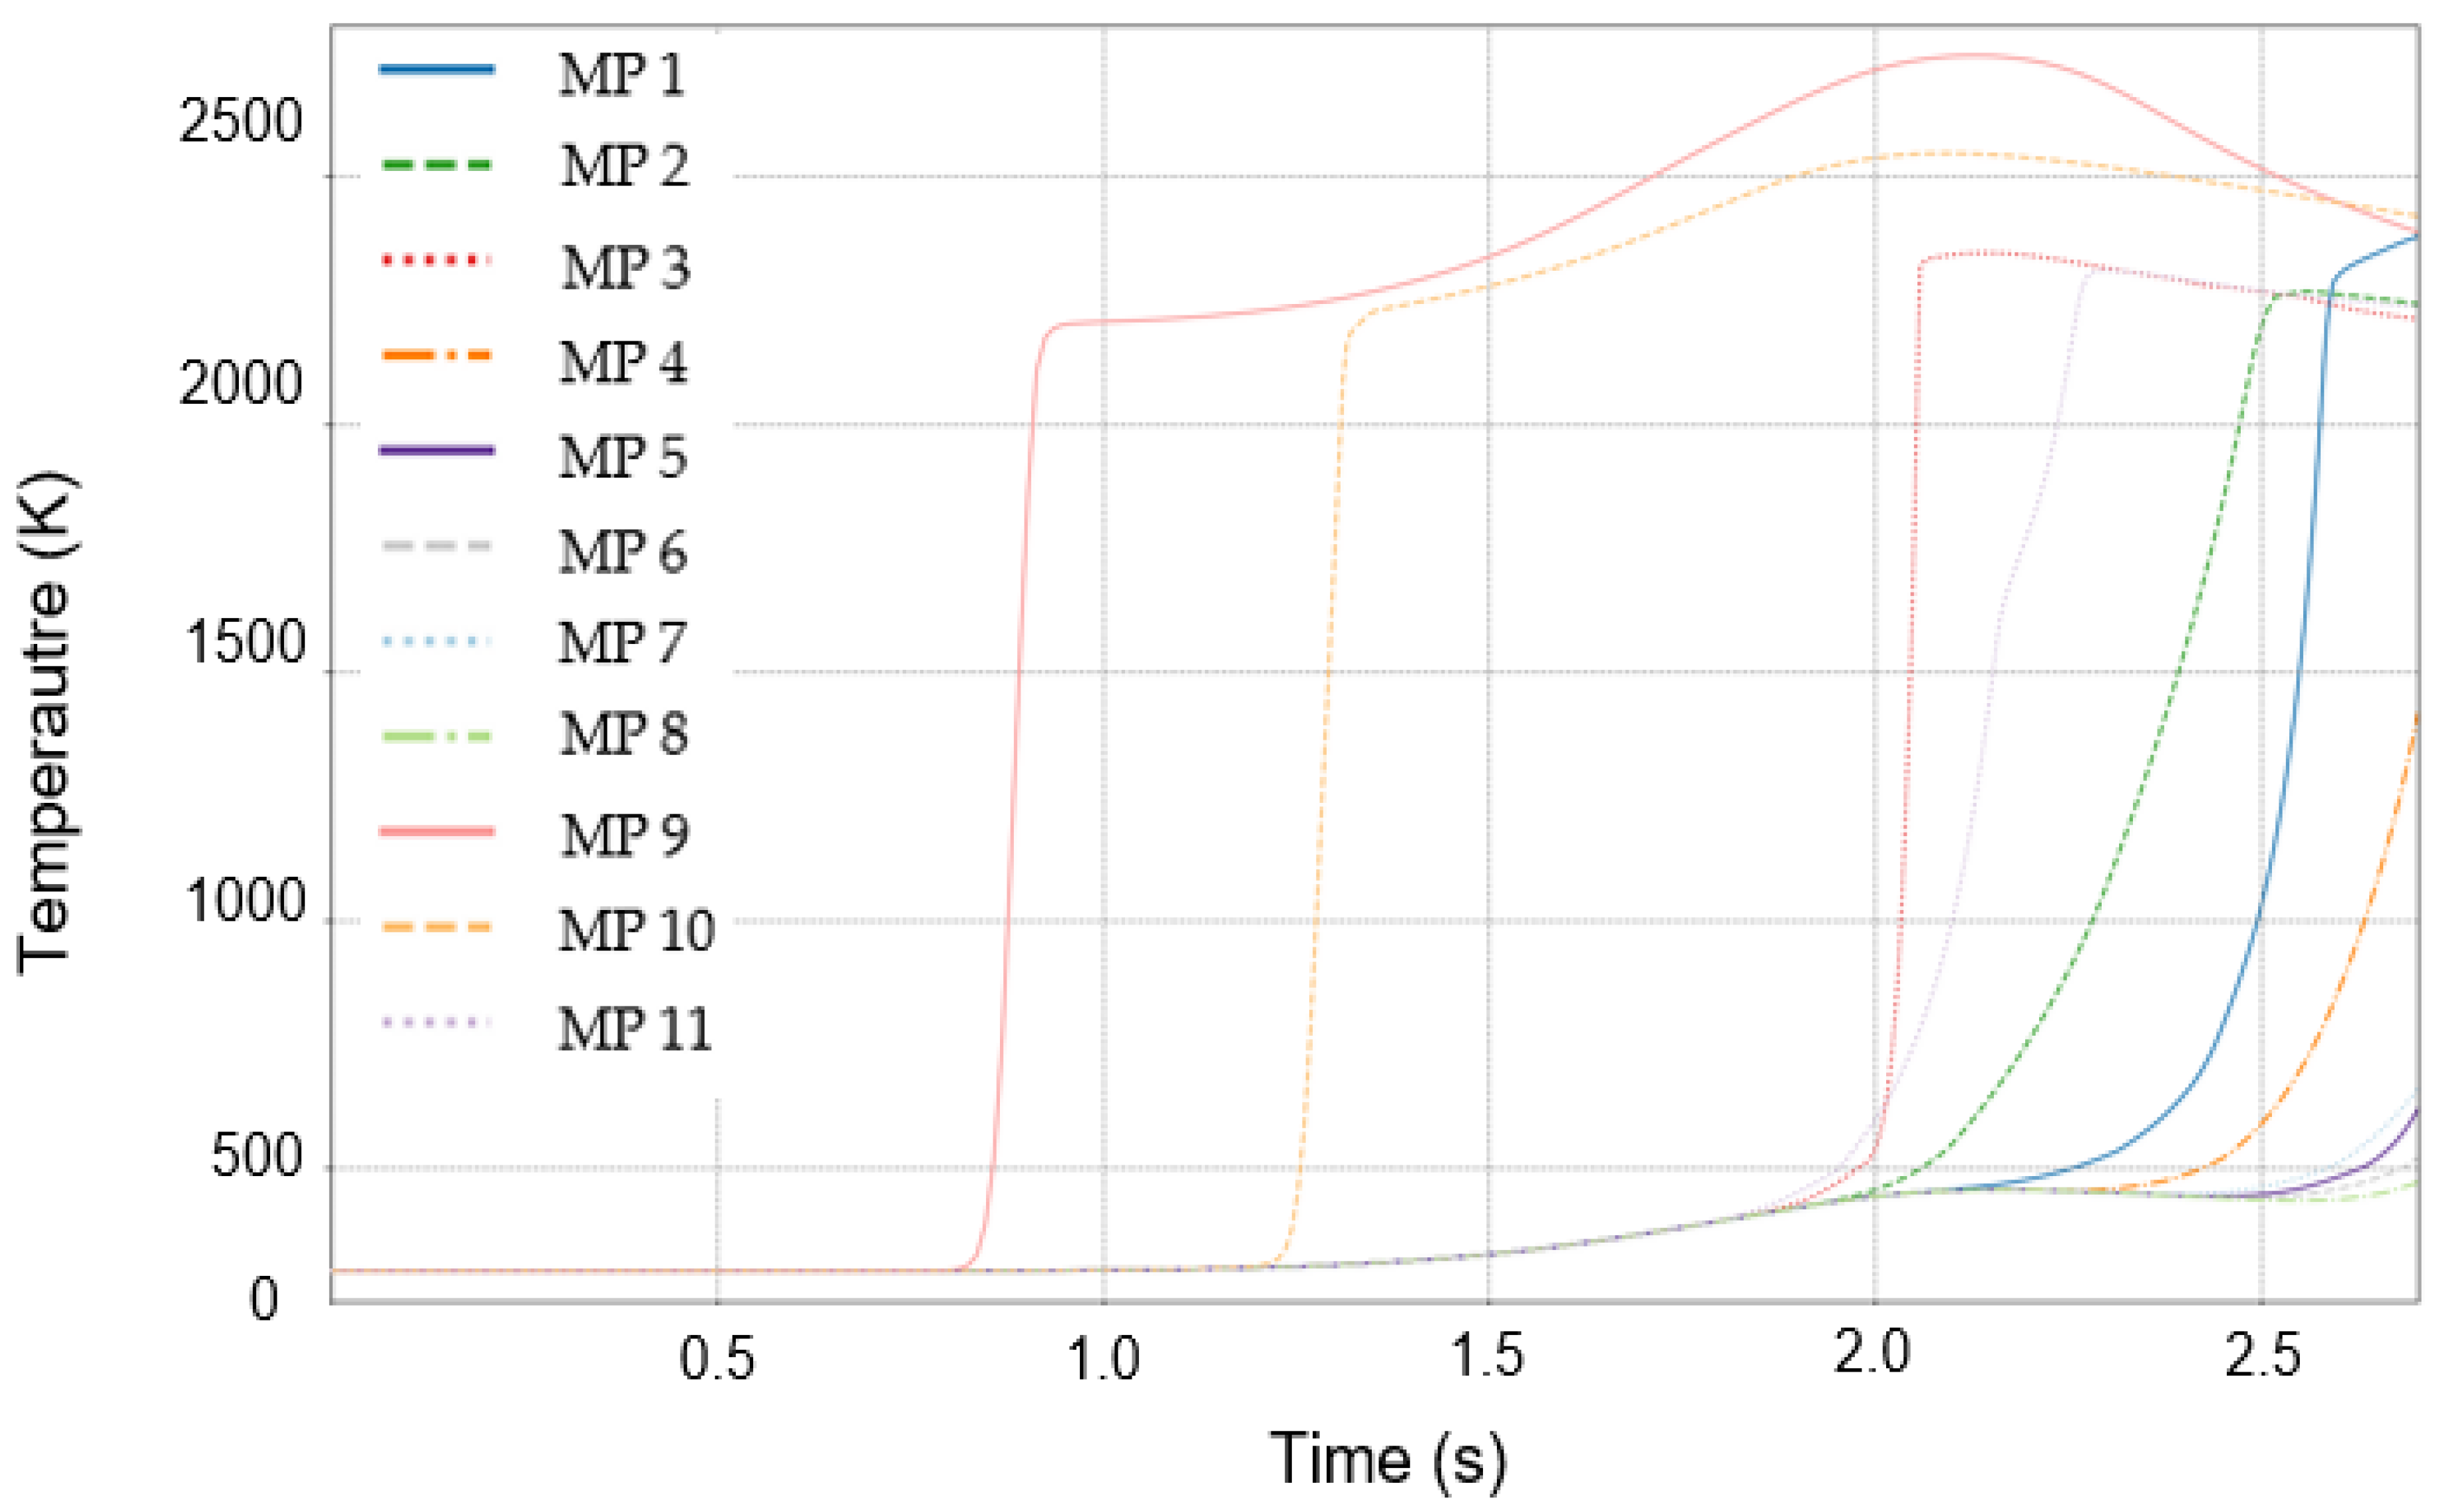
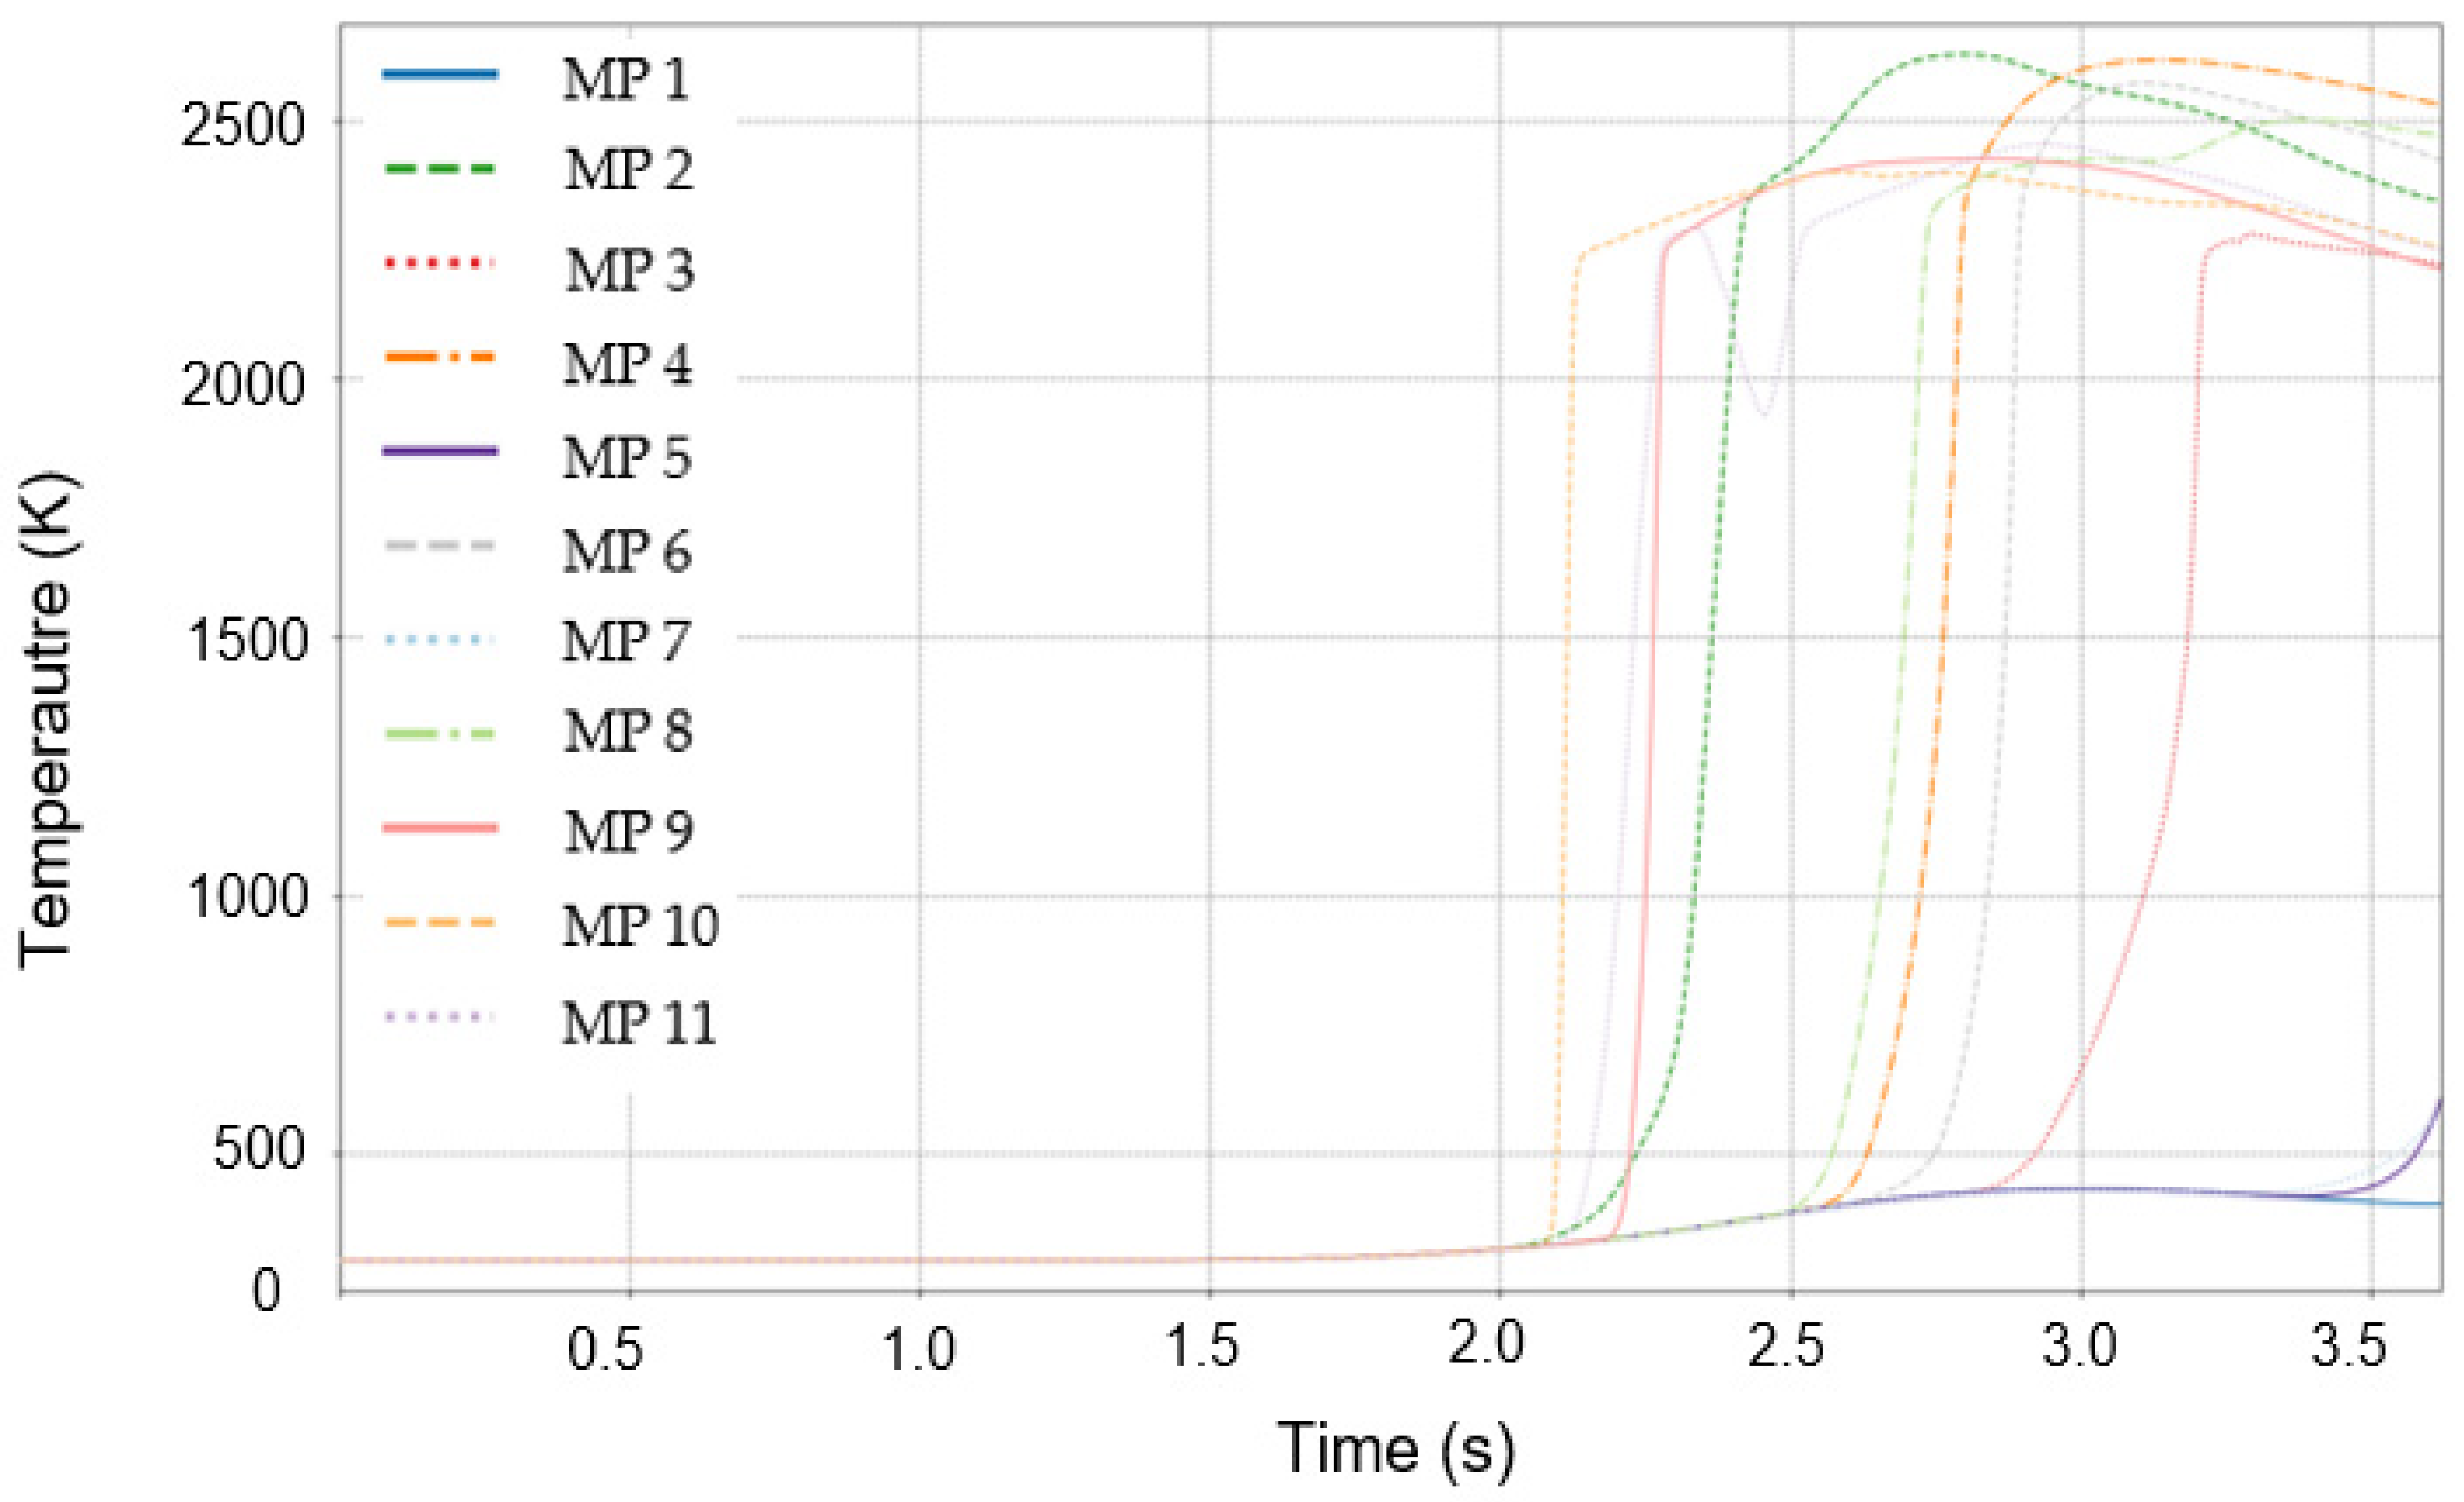
3.3. Initial Detection Characteristics of Temperature and Mass Fraction of Combustion Products

The mass fraction of the combustion products is defined as the mass of combustion products (kg) per unit mass (1 kg) of the mixture of fuel, air, and combustion products within a controlled volume [33]. In this study, the effects of the location of the ignition along the X-, Y-, and Z-axes on the initial detection timing of combustion products and the temperature were evaluated. The detection threshold was defined as the time at which the mass fraction reached 0.01 kg/kg and the temperature reached 351.15 K. This corresponded to the thermal detector activation criterion established by the FSS Code [43].
Figure 10 presents the visualization results of the initial detection times. Along the X-axis, the ignition at the centre position (6.1 m) resulted in the shortest detection time for combustion products (recorded as 1.11 s at monitoring point MP11). In contrast, ignition near the sidewalls (0.1 m and 9.9 m) resulted in significantly delayed detection times of 2.03 s and 1.94 s at MP9 and MP10, respectively. The temperature detection exhibited a similar pattern, with the shortest response time being observed at the central ignition point and increased delays being seen as the ignition approached the walls. The Y-axis results demonstrate a comparable trend. Ignition at the centre (7.5 m) produced the shortest detection times of 0.36 s and 0.41 s for the combustion product mass and temperature at MP11, respectively. The slowest detection occurred when ignition occurred near the forward wall (14.9 m), with both indicators being recorded at 2.09 s at MP10. This implies that the distance from the spatial centre significantly affects the time required for heat and product diffusion to reach the monitoring points. For the Z-axis, the ignition near the ceiling (4.9 m) resulted in the earliest detection, with both the mass fraction and temperature reaching the threshold at 0.91 s at MP9. Conversely, ignition at the intermediate height (3.1 m) resulted in the longest detection times of 1.16 s and 1.14 s, respectively, at MP10. These results imply that ignition in the upper regions promotes upward diffusion through buoyant flow, and thus enables early detection. In contrast, mid-level ignition causes an asymmetrical spread owing to interference from the surrounding structures. This, in turn, resulted in detection delays.
Overall, the ignition positions closer to the spatial centre in the X- and Y-directions and to the upper boundary in the Z-direction facilitated the earliest detection of combustion indicators. These results verify that the spatial relationship between the ignition source and monitoring locations closely governs the initial detection characteristics of the combustion products and temperature.

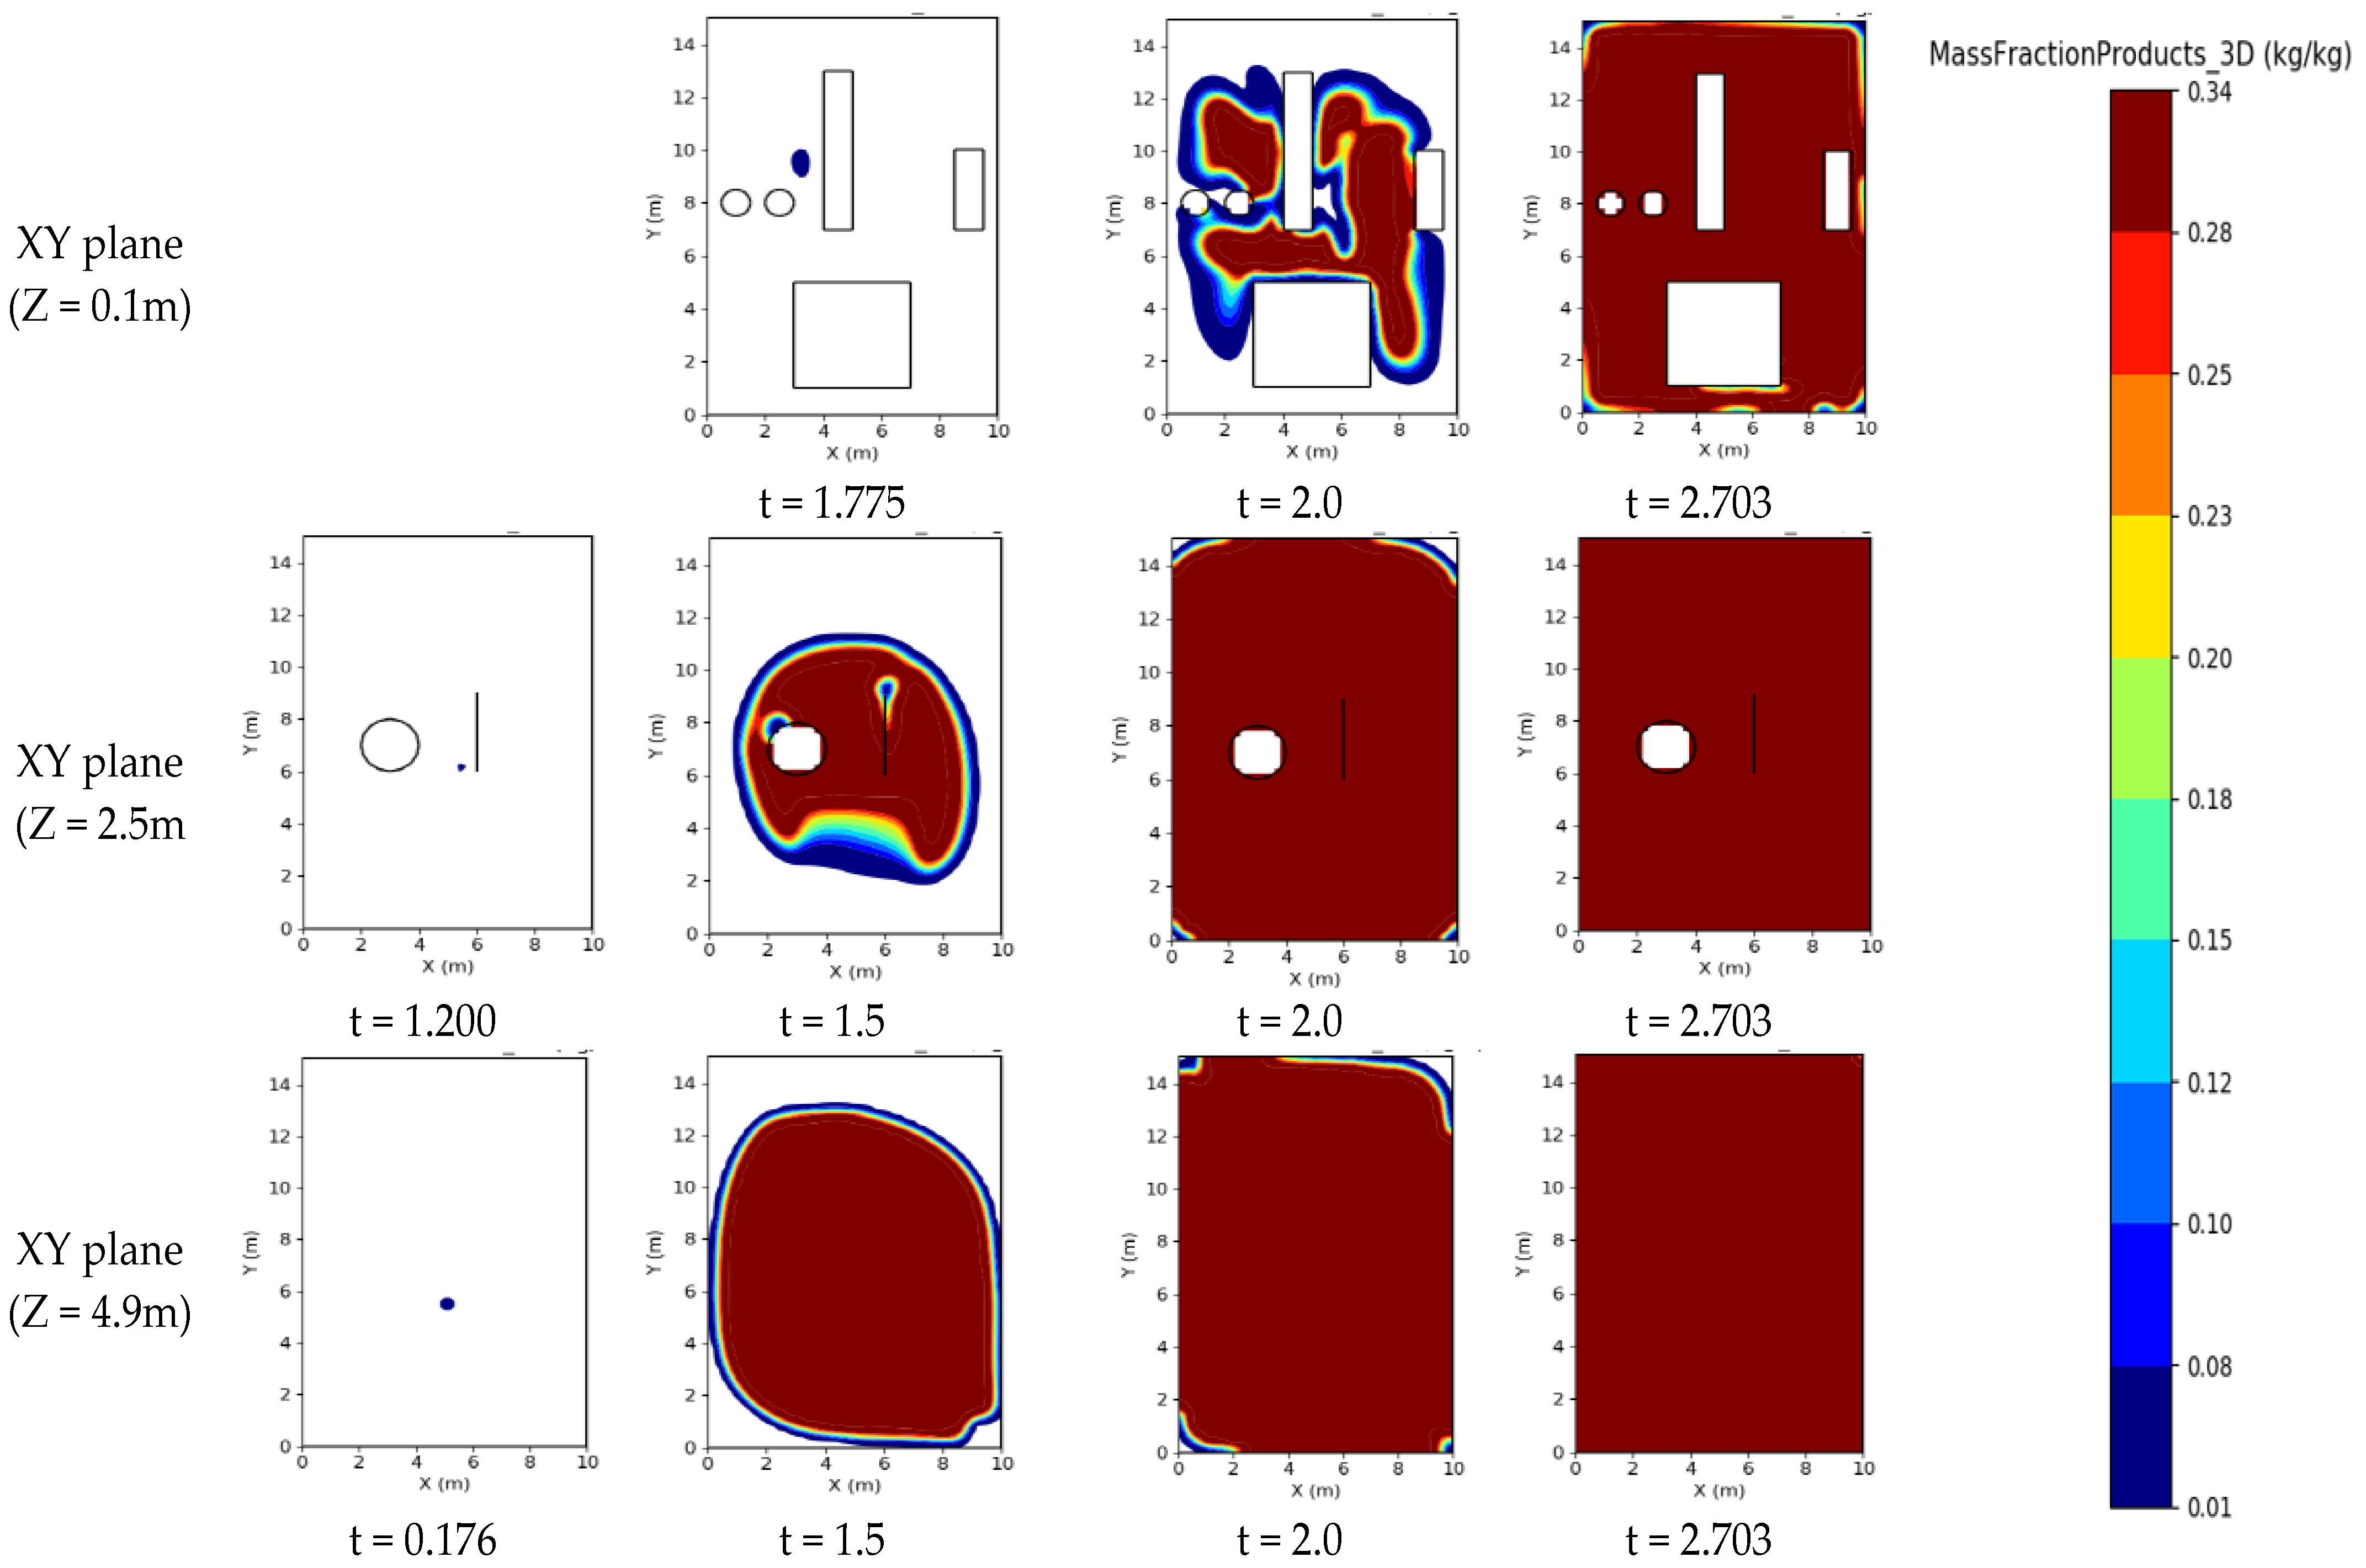
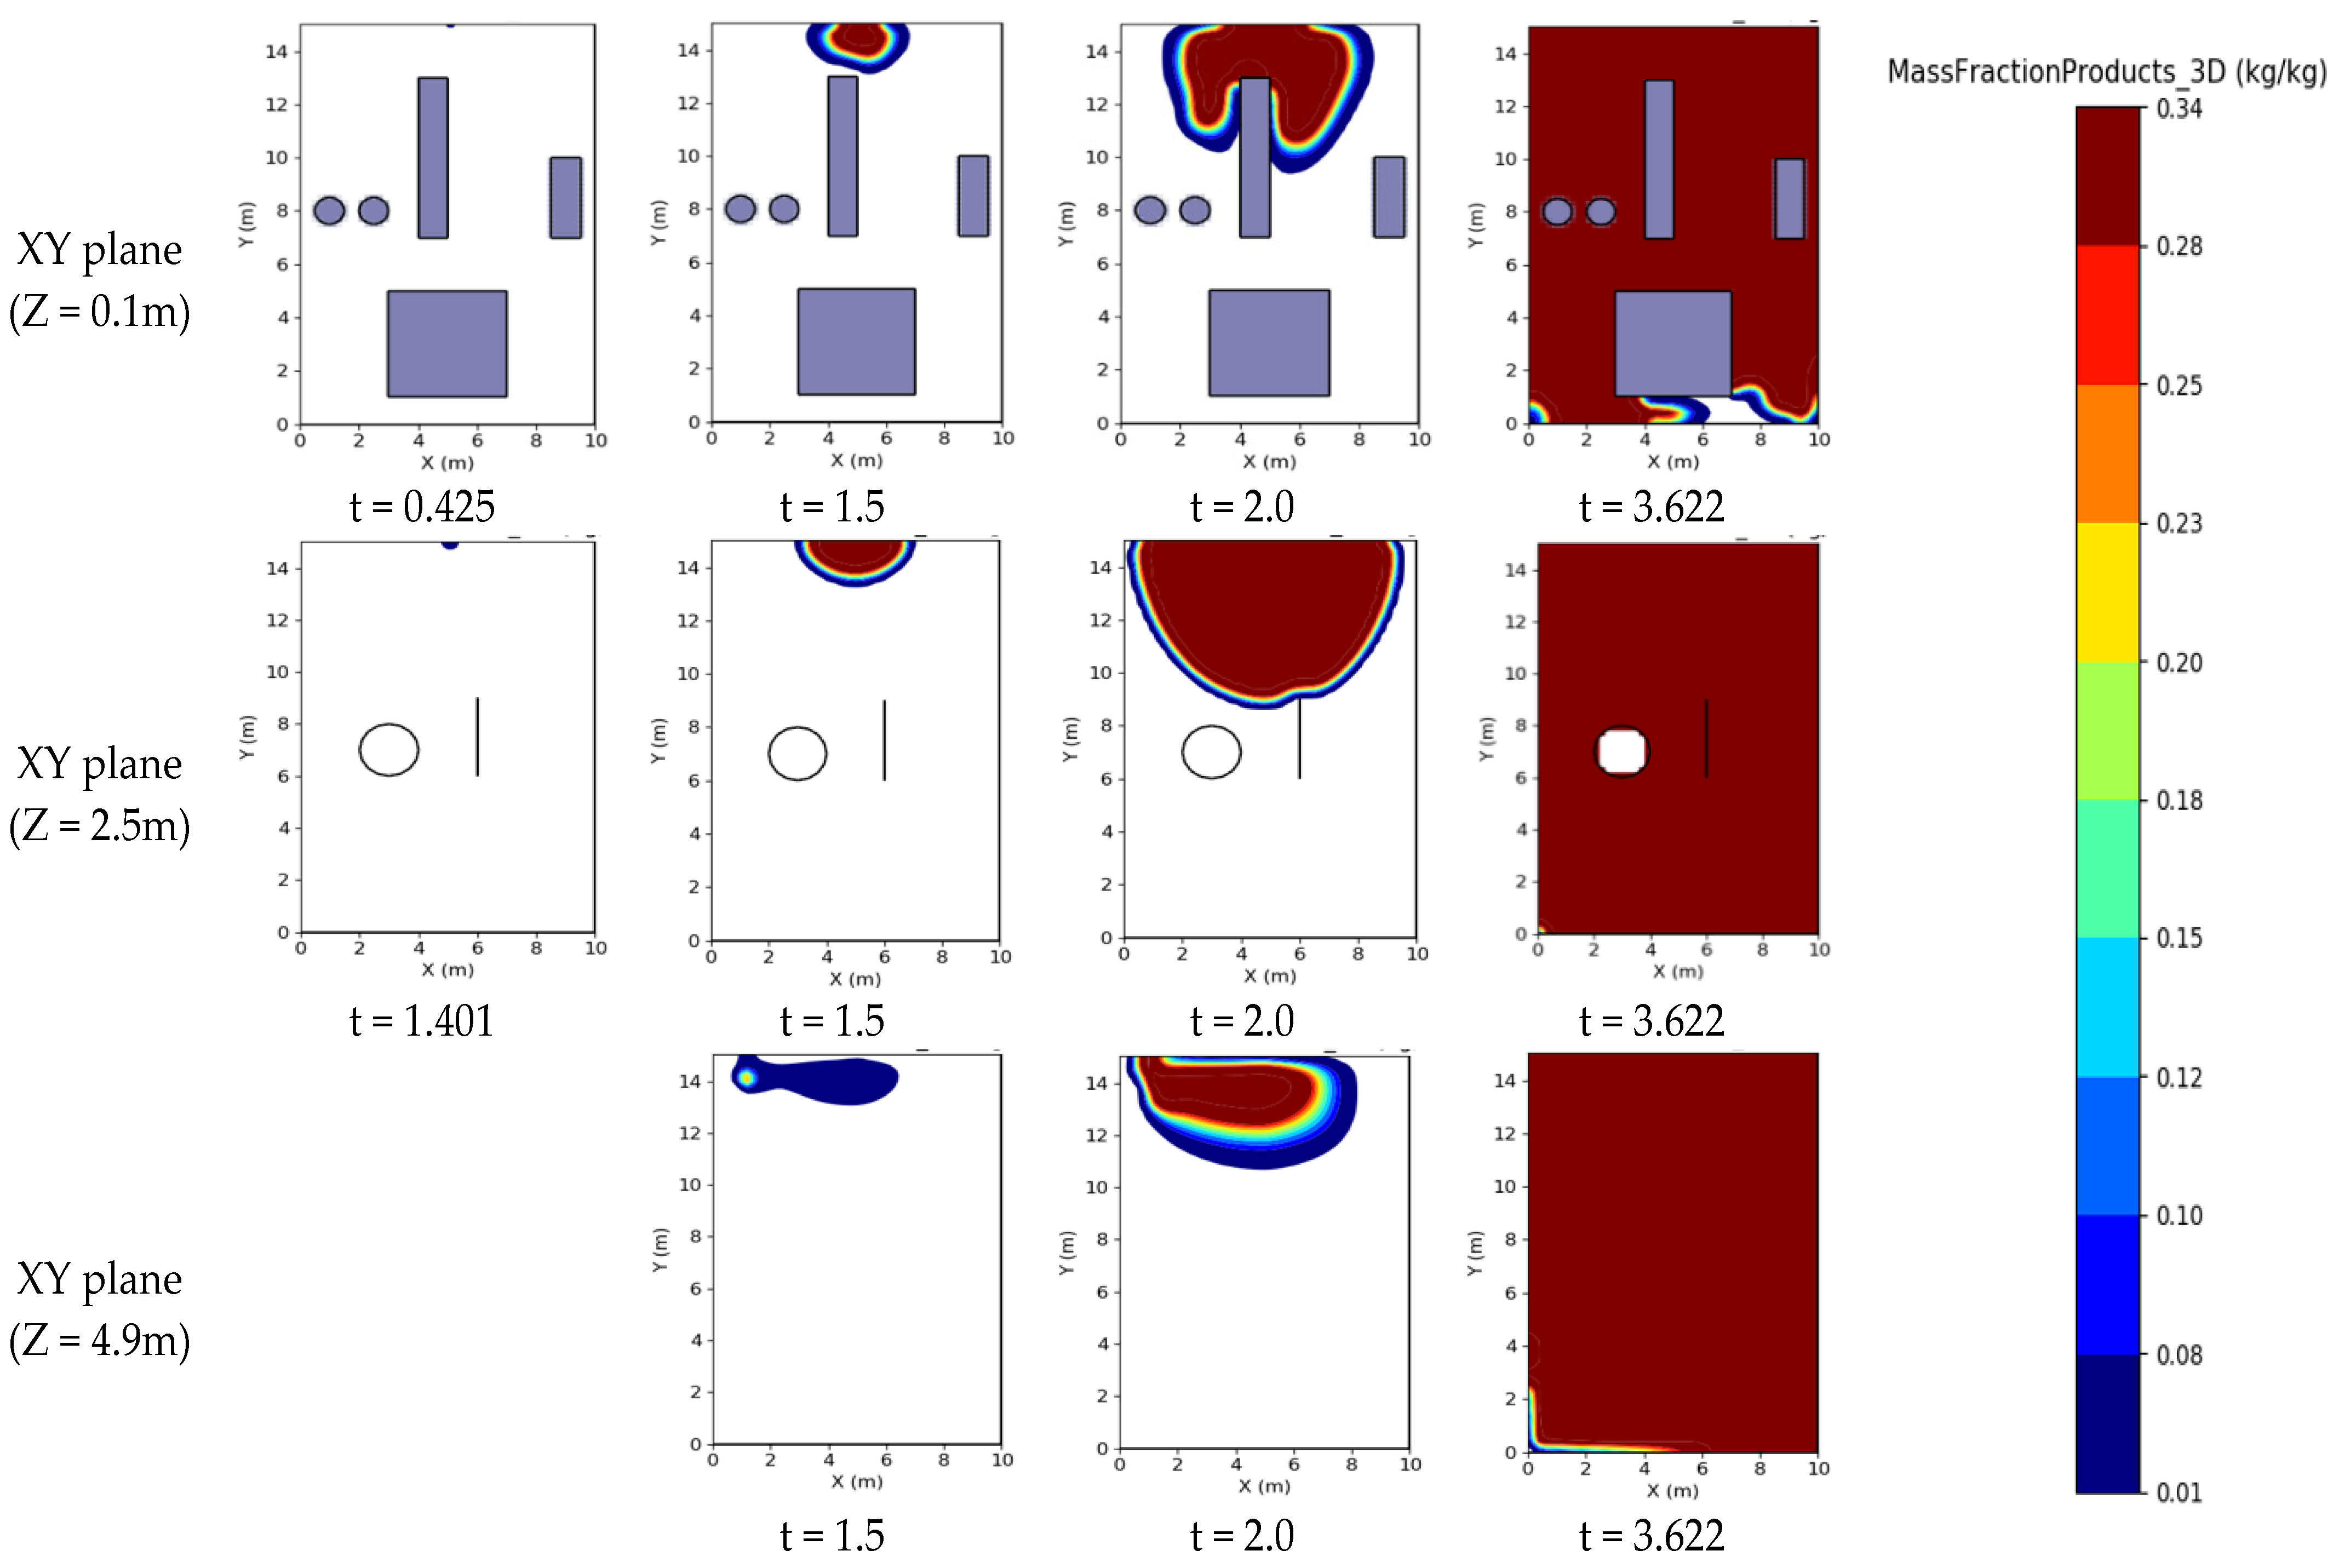
3.4. Distribution of Mass Fractions of Combustion Products

The spatial and temporal distribution of the mass fraction of the combustion products is an effective indicator for visualizing flame propagation characteristics and identifying regions where combustion is complete [33]. In this study, the distribution characteristics of the combustion products within an ammonia FPR were quantitatively analysed based on the ignition location. Two representative cases were selected for comparison: Case 19, in which ignition occurred near the ceiling (Z = 4.9 m) and yielded the highest peak explosion pressure, and Case 13, in which ignition occurred near the forward wall (Y = 14.9 m), resulting in the lowest peak pressure. Figure 11 and Figure 12 show the time-dependent distributions of the combustion product mass fractions at three vertical heights: 0.1 m, 2.5 m, and 4.9 m. In Case 19, ignition near the ceiling resulted in the rapid formation and downward diffusion of the combustion products. At 4.9 m, a mass fraction exceeding 0.01 kg/kg was detected at 0.176 s. At 2.5 m and 0.1 m, the initial detection occurred at 1.2 s and 1.755 s, respectively. By 2.0 s, the 2.5 m and 4.9 m levels were fully saturated with combustion products. Approximately 60–70% of the space at 0.1 m was also affected, which indicated a fast and uniform flame spread throughout the room. In contrast, Case 13 (in which ignition occurred near the lower forward wall) exhibited a lower rate of product propagation. The first detection at 0.1 m occurred at 0.425 s. However, the detections at 2.5 m and 4.9 m were delayed significantly until 1.401 s and 1.5 s, respectively. Even at 2.0 s, the combustion products remained localized within approximately 10–30% of the space near the forward wall. This indicates a constrained flame spread owing to geometric confinement. Figure 13 and Figure 14 show the time histories of the combustion product mass fractions at 11 monitoring points (MP1–MP11) for both cases. In Case 19, MP9 recorded a rapid increase to 0.34 kg/kg within 0.9 s. This indicates an efficient propagation. Conversely, in Case 13, MP10 required approximately 2.1 s to reach an equal concentration. This demonstrates a considerably slower spread of the combustion products. These results verify that both the sequence and velocity of product arrival are highly dependent on the ignition location. The observed differences were attributed to variations in the structural congestion around the ignition points. Obstructions such as walls and equipment can constrain or redirect flame pathways, and can thereby affect the distribution pattern of the combustion products. In gas explosions, interactions with structural elements significantly influence the product propagation. Moreover, localized fuel–structure contact can intensify flame acceleration and cause abrupt pressure increases [44,45].
Therefore, the ignition location plays a critical role in determining the diffusion characteristics of combustion products in enclosed spaces. These differences can directly impact the fire and explosion risks. These observations emphasize the necessity of considering both time-dependent propagation behaviours and structural interference factors when developing fire-response strategies and safety design criteria for ammonia FPRs.

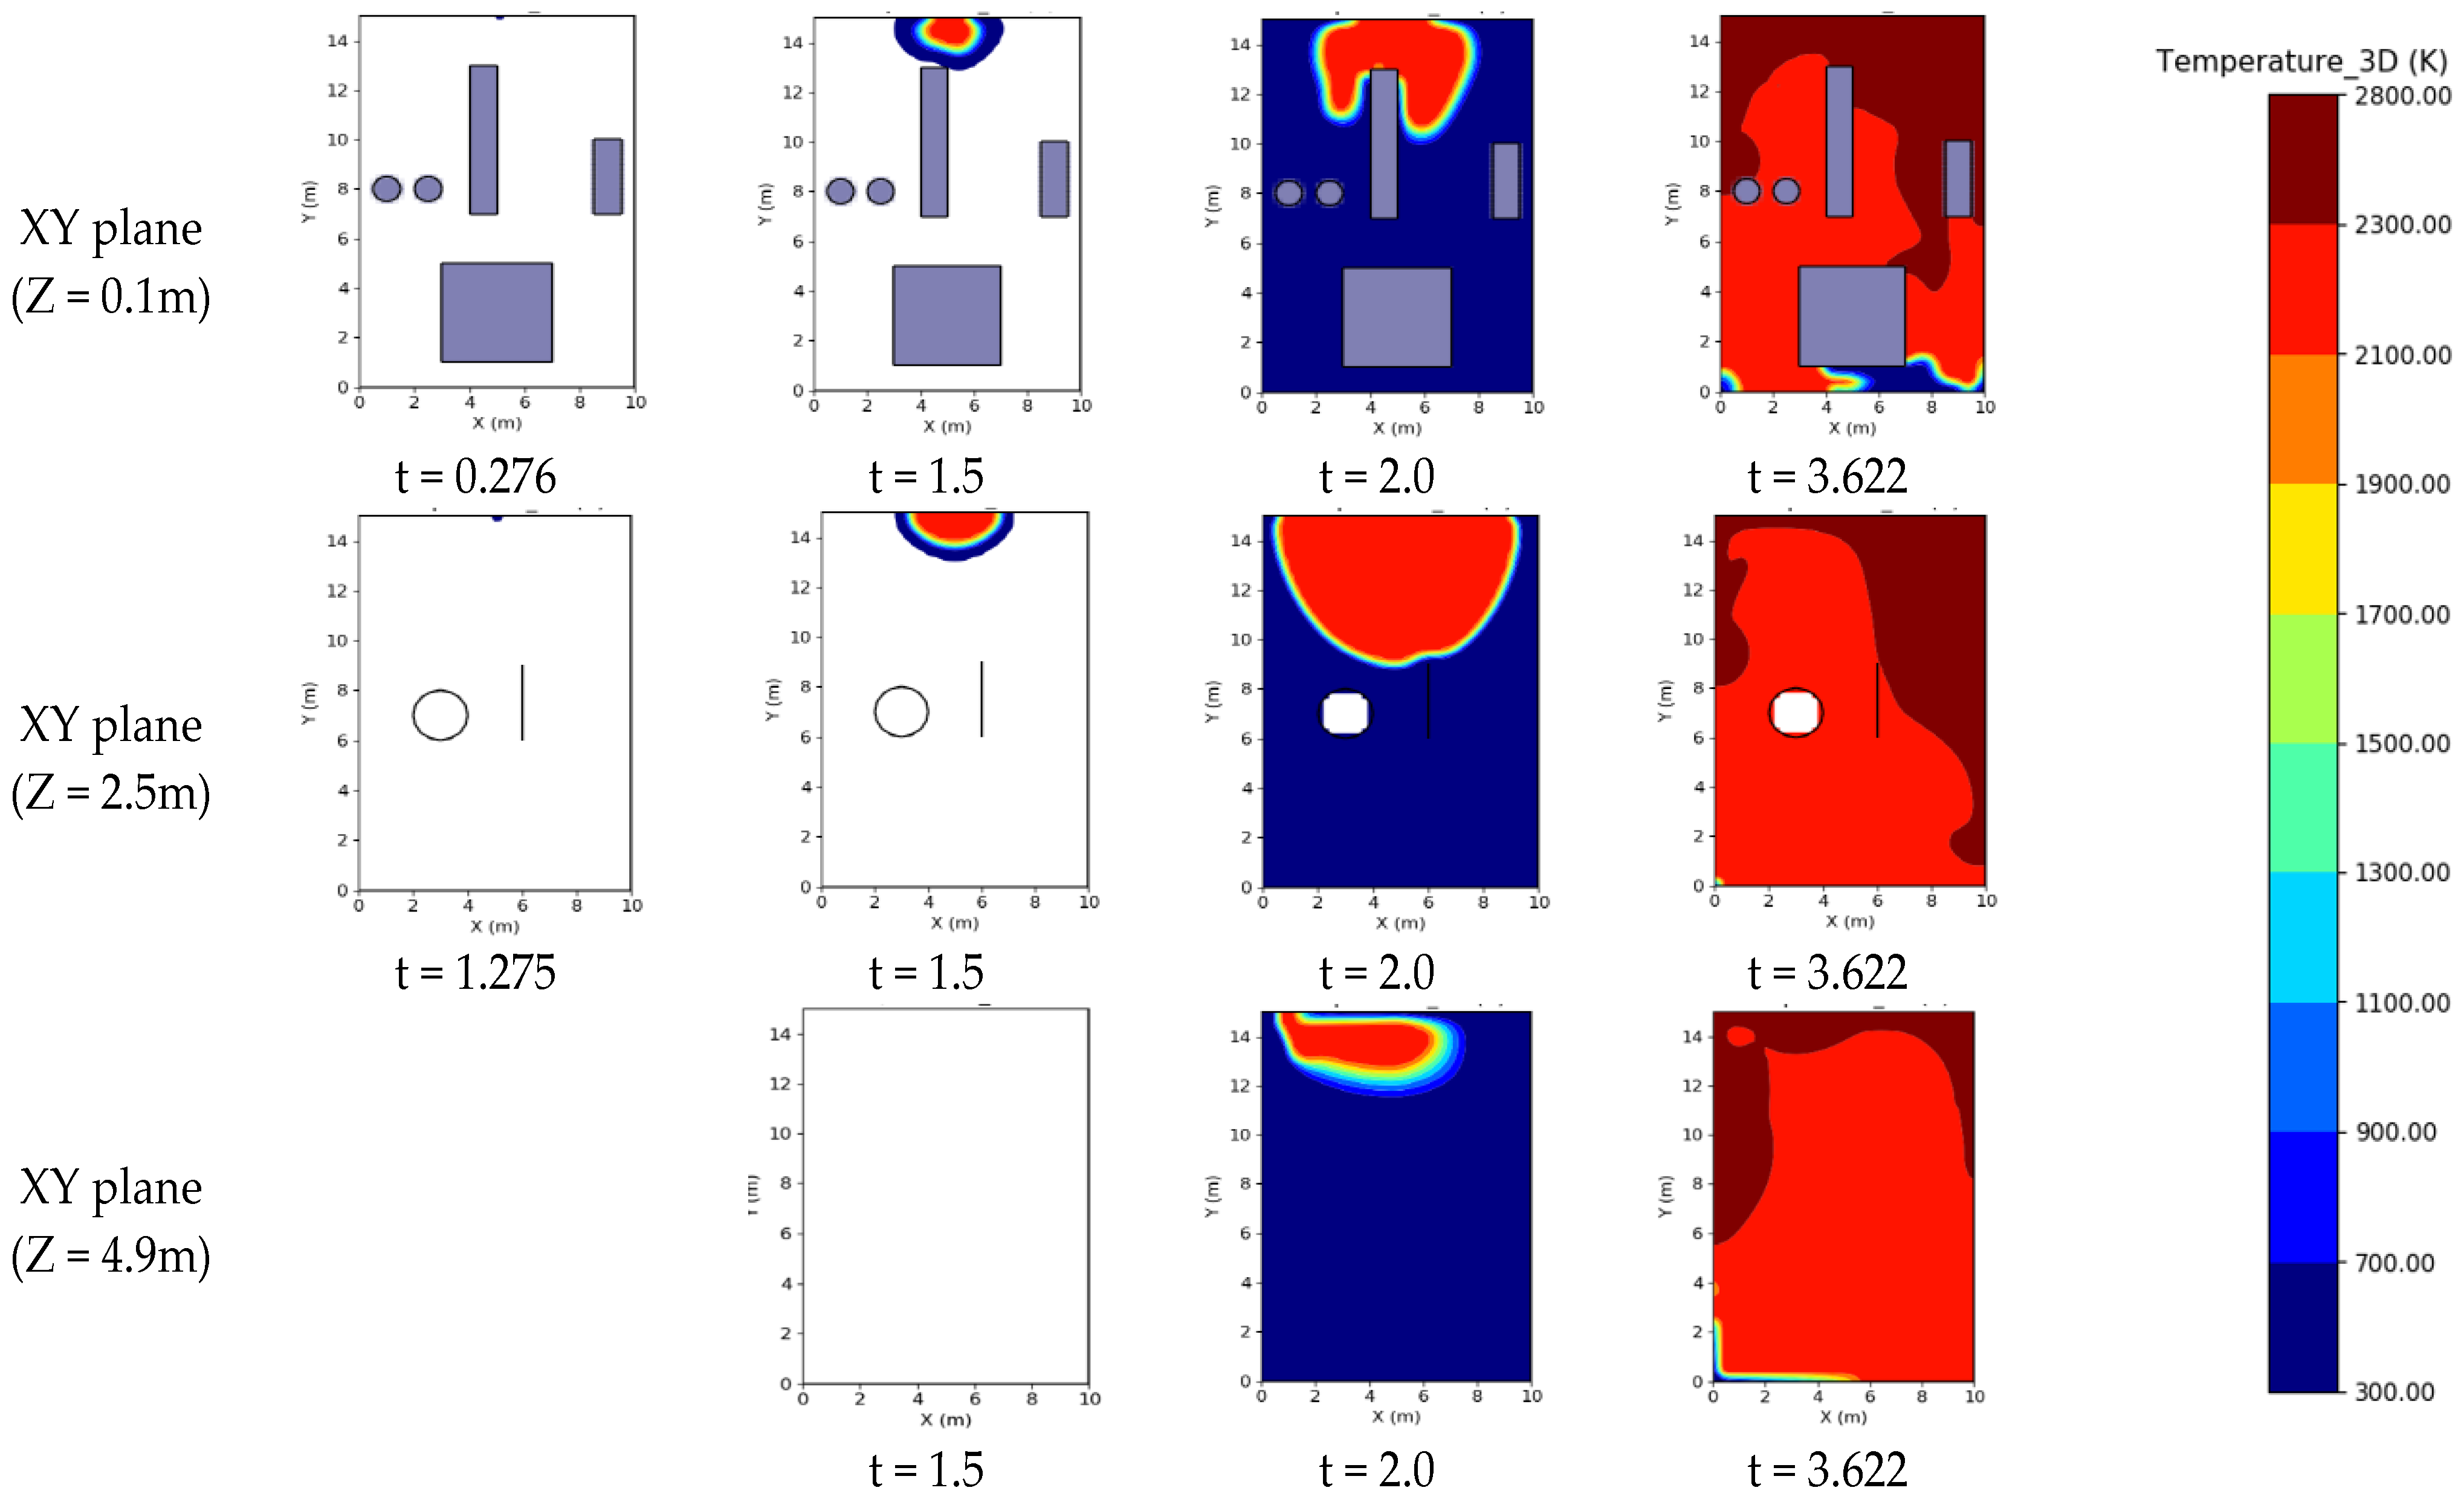
3.5. Distribution of Temperature

The spatial and temporal distributions of the temperature resulting from ignition were analysed in the ammonia FPR to assess the influence of the ignition location on thermal propagation. Two representative cases were selected for comparison: Case 19, which exhibited the highest explosion pressure (ignition at Z = 4.9 m near the ceiling) and Case 13, which resulted in the lowest pressure (ignition at Y = 14.9 m near the forward wall). Figure 15 and Figure 16 illustrate the temporal evolution of the temperature at three vertical heights (0.1 m, 2.5 m, and 4.9 m), starting from the instant when the temperature exceeded 300 K. In Case 19, the ceiling-level ignition resulted in rapid and extensive heat accumulation in the upper region during the early stages of combustion. A temperature increase beyond 300 K was detected at 0.152 s at heights of 4.9 m and 2.5 m. This indicates a near-simultaneous upward and mid-level propagation. By 2.0 s, temperatures exceeding 2300 K were observed throughout most of the room, excluding the corners. At the floor level (0.1 m), the temperature began to increase at 1.226 s. However, it diffused rapidly across the space, causing approximately 50% of the room volume to attain temperatures above 2300 K by 2.0 s. Uniform high-temperature zones in the range of 2100–2300 K were formed throughout the space by 2.703 s. The efficient and symmetrical thermal spread was attributed to the minimal structural interference and enhanced buoyancy-driven convection associated with ceiling ignition. Conversely, in Case 13, ignition occurred near the forward wall, resulting in a more confined and delayed heat propagation. At the lowest height (0.1 m), the temperature exceeded 300 K at 0.276 s. However, the flame and heat remained concentrated near the ignition point. Even at 2.0 s, the high-temperature zones continued to be constrained to the vicinity of the FWD wall, covering approximately 10–30% of the room. At 2.5 m, the initial temperature increase occurred at 1.275 s, with high temperatures being present in only 30% of the room by 2.0 s. The upper region (4.9 m) exhibited a further delay, with temperatures exceeding 300 K only at 2.0 s. This indicates sluggish vertical diffusion. This thermal delay is explained by the increased obstruction from the walls and structural elements near the ignition point, which interfered with flame and heat propagation. The time-resolved temperature profiles at all of the monitoring points (Figure 17 and Figure 18) further highlight the contrast between the two cases. In Case 19, the temperature at MP9 increased abruptly to approximately 2200 K within 0.8 s and peaked at 2742 K. This indicates a rapid and intense combustion. In Case 13, a comparable temperature level was attained only at 2.1 s at MP10. The peak value was lower at 2627 K and was recorded at MP2. The sequence of temperature increase varied across the monitoring points in each case. This indicates that the ignition location significantly influences the flame propagation paths and rates. These results verify that the ignition location has a substantial impact on the thermal distribution and peak temperatures during combustion. Ignition near the ceiling promotes a rapid and uniform thermal spread owing to buoyancy effects and minimal interference. This, in turn, resulted in higher peak temperatures and faster room-wide propagation. In contrast, ignition near structural boundaries slows heat diffusion and causes localized high-temperature accumulation.
Therefore, an accurate assessment of the thermal behaviour of explosions based on the ignition position is essential for evaluating fire and explosion hazards in ammonia FPRs. These observations emphasize the need for location-specific fire-protection designs and response strategies.

4. Conclusions

This study quantitatively analyses the influence of the ignition location on explosion characteristics within an ammonia FPR onboard ammonia-fuelled vessels using FLACS-based computational fluid dynamics (CFD) simulations. To reflect the three-dimensional spatial characteristics of the preparation room, 19 ignition scenarios were designed systematically based on the distribution of the ignition locations along the X-, Y-, and Z-axes. The analysis focused on key explosion metrics, including the peak explosion pressure, rate of pressure increase, flammable gas reduction rate, initial detection times of combustion indicators, and spatiotemporal distribution of temperature and combustion products. The main observations of this study are as follows.
The ignition location was identified as a critical factor that influences the explosion intensity and combustion spread behaviour. The lowest peak pressure (3.24 bar) occurred in Case 13 (Y = 14.9 m, forward wall), whereas the highest pressure (4.27 bar) was recorded in Case 19 (Z = 4.9 m, near the ceiling). The rate of pressure increase ranged from 1.11 bar/s to 2.20 bar/s, with symmetric and rapid flame propagation being observed in the central and upper ignition scenarios (e.g., Case 4, Case 8, Case 19). In contrast, ignition near the structural boundaries resulted in attenuated explosion reactivity owing to wave reflection and asymmetric combustion;
The flammable gas reduction rate also varied significantly with the ignition position. The fastest depletion occurred in Case 7 (centre-bottom ignition) at 456.64 m3/s, whereas the slowest was recorded in Case 13 at 313.89 m3/s. These results indicate a strong correlation between the gas depletion rate and the rate of pressure increase. Thus, these results reaffirm the importance of fuel consumption dynamics in determining the severity of explosions;
The initial detection times of combustion products and changes in temperature were shortest in the central and upper ignition scenarios (averaging between 0.36 s and 0.91 s). Conversely, the forward-wall ignition (Case 13) resulted in significantly delayed detection (exceeding 2.03 s). These results indicate that the ignition location directly affects the early detection performance and should be considered in the design of fire alarm and suppression systems;
Case 19 exhibited the most extreme explosion behaviour in terms of the pressure, temperature, and product spread. Combustion products were first detected at 0.176 s at a height of 4.9 m. By 2.0 s, the room was fully saturated, with temperatures exceeding 2742 K and mass fractions above 0.34 kg/kg. In contrast, Case 13 exhibited limited propagation, affecting less than 30% of the space and reaching a lower peak temperature of 2627 K.
These results verify that the ignition location is a dominant factor in explosion dynamics, influencing the peak pressures, reaction rates, detection times, and distribution profiles of heat and combustion products. This paper presents a customized explosion risk assessment framework for ammonia fuel preparation systems. It provides essential insights into ignition source control, optimal sensor placement, and spatially differentiated safety design strategies. In particular, ignition near the floor centre was identified as the most critical scenario owing to its steep pressure rise rate and rapid gas consumption. To minimize the risk under such worst-case conditions, it is recommended to restrict ignition sources in this zone and implement passive safety systems, such as flame arresters or explosion vent panels, to suppress early-stage pressure escalation. These preventive measures can enhance the structural resilience and safety of ammonia FPRs.
Future research should incorporate multivariable scenarios that involve actual ammonia leakage, gas dispersion behaviour, and ventilation conditions to enhance the predictive accuracy of the explosion risk model. Experimental validation and long-term data collection from real shipboard operations are necessary to establish highly reliable models that are suitable for practical applications. The observations of this study can potentially serve as a foundational reference for the development of safety design standards and explosion risk assessment guidelines by international regulatory bodies such as the International Maritime Organization (IMO). These insights are expected to inform future engineering standards and contribute to the development of safer designs for ammonia-fuelled vessel systems.

Author Contributions

Formal analysis, J.-W.B.; Investigation, J.-W.B. and B.-S.N.; Methodology, J.-W.B. and S.-J.C.; Supervision, K.-H.P. and J.-H.C.; Writing—Original Draft, J.-W.B.; Writing—Review and Editing, J.-W.B., B.-S.N., J.-W.L., S.-J.C., J.-D.K., K.-H.P. and J.-H.C. All authors have read and agreed to the published version of the manuscript.

Funding

This research was supported by the Korea Institute of Marine Science and Technology Promotion (KIMST), funded by the Ministry of Oceans and Fisheries (20220491).

Institutional Review Board Statement

Not applicable.

Informed Consent Statement

Not applicable.

Data Availability Statement

The raw data supporting the conclusions of this article will be made available by the authors on request.

Conflicts of Interest

The authors declare no conflicts of interest.

Abbreviations

BOGBoil-Off Gas
CFDComputational Fluid Dynamics
EREquivalence Ratio
FPRFuel Preparation Room
FSSFire Safety Systems
GHGGreenhouse Gas
IEAInternational Energy Agency
IMOInternational Maritime Organization
ITFInternational Transport Forum
LNGLiquefied Natural Gas
MPRRMaximum Pressure Rise Rate
MPMonitoring Point
NH3Ammonia
OSHAOccupational Safety and Health Administration
PWRPressurized Water Reactor

References

  1. Armijo, J.; Philibert, C. Flexible production of green hydrogen and ammonia from variable solar and wind energy: Case study of Chile and Argentina. Int. J. Hydrogen Energy 2020, 45, 1541–1558. [Google Scholar] [CrossRef]
  2. Castellanos, G.; Roesch, R.; Sloan, A.; Gielen, D. A Pathway to Decarbonise the Shipping Sector by 2050; International Renewable Energy Agency (IRENA): Abu Dhabi, United Arab Emirates, 2021.
  3. Fridell, E. Emissions and Fuel Use in the Shipping Sector. In Green Ports; Ng, A.K.Y., Becker, A., Cahoon, S., Chen, S.L., Earl, P., Eds.; Elsevier: Amsterdam, The Netherlands, 2019; pp. 19–33. [Google Scholar]
  4. International Maritime Organization. Initial IMO Strategy on Reduction of GHG Emission from Ships. Resolution MEPC.304(72) (Adopted on 13 April 2018); International Maritime Organization: London, UK, 2018. [Google Scholar]
  5. Wang, S.; Zhen, L.; Psaraftis, H.N.; Yan, R. Implications of the EU’s inclusion of maritime transport in the emissions trading system for shipping companies. Engineering 2021, 7, 554–557. [Google Scholar] [CrossRef]
  6. Al-Aboosi, F.Y.; El-Halwagi, M.M.; Moore, M.; Nielsen, R.B. Renewable ammonia as an alternative fuel for the shipping industry. Curr. Opin. Chem. Eng. 2021, 31, 100670. [Google Scholar] [CrossRef]
  7. Valera-Medina, A.; Amer-Hatem, F.; Azad, A.K.; Dedoussi, I.C.; De Joannon, M.; Fernandes, R.X.; Costa, M. Review on ammonia as a potential fuel: From synthesis to economics. Energy Fuels 2021, 35, 6964–7029. [Google Scholar] [CrossRef]
  8. Valera-Medina, A.; Xiao, H.; Owen-Jones, M.; David, W.I.F.; Bowen, P.J. Ammonia for power. Prog. Energy Combust. Sci. 2018, 69, 63–102. [Google Scholar] [CrossRef]
  9. Thomas, G. Potential Roles of Ammonia in a Hydrogen Economy; U.S. Department of Energy: Washington, DC, USA, 2006. Available online: https://www.energy.gov/eere/fuelcells/articles/potential-roles-ammonia-hydrogen-economy (accessed on 24 March 2025).
  10. Park, H.S.; Kim, B.R.; Park, S.W.; Jeong, I.H. A Study on Policy Directions for Responding to IMO’s Regulation on GHG Emission; Korea Maritime Institute (KMI): Busan, Republic of Korea, 2020; pp. 1–249.
  11. Seo, Y.; Han, S. Economic evaluation of an ammonia-fueled ammonia carrier depending on methods of ammonia fuel storage. Energies 2021, 14, 8326. [Google Scholar] [CrossRef]
  12. Souissi, N. Fueling the Future: A Techno-Economic Evaluation of E-Ammonia Production for Marine Applications; OIES Paper: ET40; Oxford Institute for Energy Studies: Oxford, UK, 2024. [Google Scholar]
  13. Shin, I.; Cheon, J.; Lee, J. A study on the hazard area of bunkering for ammonia fueled vessel. J. Korean Soc. Mar. Environ. Saf. 2023, 29, 964–970. [Google Scholar] [CrossRef]
  14. Klerke, A.; Christensen, C.H.; Nørskov, J.K.; Vegge, T. Ammonia for hydrogen storage: Challenges and opportunities. J. Mater. Chem. 2008, 18, 2304–2310. [Google Scholar] [CrossRef]
  15. United States Department of Labor. Occupational Safety and Health Administration (OSHA). Available online: https://www.osha.gov/ords/imis/accidentsearch.search?sic=&sicgroup=&naics=&acc_description=&acc_abstract=&acc_keyword=%22Ammonia%22&inspnr=&fatal=&officetype=&office=&startmonth=&startday=&startyear=&endmonth=&endday=&endyear=&keyword_list=on&p_start=260& (accessed on 20 January 2025).
  16. NRK. En Død Etter Ammoniakkeksplosjon. Available online: https://www.nrk.no/vestfold/en-dod-etter-ammoniakkeksplosjon-1.272219 (accessed on 20 January 2025).
  17. ABC NEWS. Ammonia Leak China Caused by Detached Pipe Cap. Available online: http://www.abc.net.au/news/2013-09-02/an-china-ammonia-deaths-caused-by-detatched-cap/4928574 (accessed on 26 March 2025).
  18. French Ministry of the Environment. Explosion of an Ammonia Tank. Mar. 24, 1992, Dakar. Available online: https://www.aria.developpement-durable.gouv.fr/wp-content/files_mf/A3485_ips03485_002.pdf (accessed on 20 January 2025).
  19. Dharmavaram, S.; Pattabathula, V. The Dakar Ammonia Accident: Analysis of the Worst Incident at an Anhydrous Ammonia User; Utah Valley University: Orem, UT, USA, 2022. [Google Scholar]
  20. Li, C.; Lei, B.; Pang, R.; Xiao, J.; Kuznetsov, M.; Jordan, T. Effects of ignition location on CH4/air explosion characteristic in a spherical bomb. Therm. Sci. Eng. Prog. 2024, 50, 102539. [Google Scholar] [CrossRef]
  21. Wang, Q.; Wan, H.; Bi, M.; Gao, W.; Peng, B.; Luo, Z.; Xue, Y. Effects of ignition position and hydrogen concentration on the flame propagation characteristics of hydrogen–air deflagration. Fuel 2024, 359, 130349. [Google Scholar] [CrossRef]
  22. Hou, Z.; Wang, D.; Zhang, W.; Luo, S.; Lu, Y.; Tian, S.; Xu, Z. Study on the influence of ignition position on the explosion characteristics of methane–air premix in a semi-closed pipeline. Process Saf. Environ. Prot. 2023, 172, 642–651. [Google Scholar] [CrossRef]
  23. Chen, C.F.; Shu, C.M.; Ho, S.P.; Chang, H.P.; Ho, H.H.; Xie, B. Utilizing FLACS to Assess quantitative Analysis on Explosion Caused by Propylene Gas Leaks Within Drainage Culverts or Soil. In Proceedings of the World Conference on OIL, Gas and Infrastructure (WCOGI), Beijing, China, 26–29 October 2016. [Google Scholar]
  24. Middha, P.; Hansen, O.R.; Storvik, I.E. Validation of CFD-model for hydrogen dispersion. J. Loss Prev. Process Ind. 2009, 22, 1034–1038. [Google Scholar] [CrossRef]
  25. Evans, J.A.; Johnson, D.M.; Lowesmith, B.J. Explosions in Full Offshore Module Geometries (Work Carried Out under Contract to the HSE, MaTSU/8847/3522); Report No. R2422; BG Technology: Cheshire, UK, 1999. [Google Scholar]
  26. Ai-Hassan, T.; Johnson, D.M. Gas Explosions in Large Scale Offshore Module Geometries: Overpressures, Mitigation and Repeatability. In Proceedings of the 17th International Conference on Offshore Mechanics and Arctic Engineering (OMAE), American Society of Mechanical Engineers (ASME), Lisbon, Portugal, 5–9 July 1998; p. 12. [Google Scholar]
  27. Foisselon, P.; Hansen, O.R.; van Wingerden, K. Detailed Analysis of FLACS Performance in Comparison to Full Scale Experiments; Report No. 97-9; Gas Safety Programme: Singapore, 1998. [Google Scholar]
  28. Vyazmina, E.; Jallais, S. Validation and recommendations for FLACS CFD and engineering approaches to model hydrogen vented explosions: Effects of concentration, obstruction, vent area and ignition position. Int. J. Hydrog. Energy 2016, 41, 15101–15109. [Google Scholar] [CrossRef]
  29. Lv, D.; Tan, W.; Liu, L.; Zhu, G.; Peng, L. Research on maximum explosion overpressure in LNG storage tank areas. J. Loss Prev. Process Ind. 2017, 49, 162–170. [Google Scholar] [CrossRef]
  30. Hansen, O.R.; Johnson, D.M. Improved far-field blast predictions from fast deflagrations, DDTs and detonations of vapour clouds using FLACS CFD. J. Loss Prev. Process Ind. 2015, 35, 293–306. [Google Scholar] [CrossRef]
  31. Hansen, O.R.; Hinze, P.; Engel, D.; Davis, S. Using computational fluid dynamics (CFD) for blast wave predictions. J. Loss Prev. Process Ind. 2010, 23, 885–906. [Google Scholar] [CrossRef]
  32. Bleyer, A.; Taveau, J.; Djebaïli-Chaumeix, N.; Paillard, C.E.; Bentaïb, A. Comparison between FLACS Explosion Simulations and Experiments Conducted in a PWR Steam Generator Casemate Scale Down with Hydrogen Gradients. Nucl. Eng. Des. 2012, 245, 189–196. [Google Scholar] [CrossRef]
  33. Gexcon. FLACS-CFD v22.2 User’s Manual; Gexcon: Bergen, Norway, 2023. [Google Scholar]
  34. Jang, H.; Mujeeb-Ahmed, M.P.; Wang, H.; Park, C.; Hwang, I.; Jeong, B.; Sykaras, K. Safety Evaluation on Ammonia-Fueled Ship: Gas Dispersion Analysis through Vent Mast. Int. J. Hydrog. Energy 2024, 83, 1060–1077. [Google Scholar] [CrossRef]
  35. Tam, V.H.; Tan, F.; Savvides, C. A Critical Review of the Equivalent Stoichiometric Cloud Model Q9 in Gas Explosion Modelling. Eng 2021, 2, 156–180. [Google Scholar] [CrossRef]
  36. Li, Z.; Wu, J.; Liu, M.; Li, Y.; Ma, Q. Numerical analysis of the characteristics of gas explosion process in natural gas compartment of utility tunnel using FLACS. Sustainability 2019, 12, 153. [Google Scholar] [CrossRef]
  37. Wang, K.; Liu, Y.; Wang, H.; Liu, X.; Jiao, Y.; Wu, Y. Dynamic process and damage evaluation subject to explosion consequences resulting from a LPG tank trailer accident. Processes 2023, 11, 1514. [Google Scholar] [CrossRef]
  38. Xu, H.; Deng, Q.; Huang, X.; Li, D.; Pan, F. Simulation and experimental verification of dispersion and explosion of hydrogen–methane mixture in a domestic kitchen. Energies 2024, 17, 2320. [Google Scholar] [CrossRef]
  39. Wu, F.; Zhou, X.; Hao, Y.; Zhuang, S. Study on explosion venting characteristics of L-type venting duct. Processes 2024, 12, 2726. [Google Scholar] [CrossRef]
  40. Arntzen, B.J. Modelling of Turbulence and Combustion for Simulation of Gas Explosions in Complex Geometries. Ph.D. Thesis, Norwegian University of Science and Technology, Trondheim, Norway, 1998. [Google Scholar]
  41. Zhang, H.; Jia, Z.; Ye, Q.; Cheng, Y.; Li, S. Numerical Simulation on Influence of Initial Pressures on Gas Explosion Propagation Characteristics in Roadway. Front. Energy Res. 2022, 10, 913045. [Google Scholar] [CrossRef]
  42. Razus, D.; Movileanu, C.; Oancea, D. The Rate of Pressure Rise of Gaseous Propylene–Air Explosions in Spherical and Cylindrical Enclosures. J. Hazard. Mater. 2007, 139, 1–8. [Google Scholar] [CrossRef]
  43. International Maritime Organization (IMO). International Code for Fire Safety Systems (FSS Code), Chapter 9, Section 2.4; Amendment 24 (Resolution MSC.108(73)); IMO: London, UK, 2001. [Google Scholar]
  44. March and McLennan. Large Property Losses in the Hydrocarbon-Chemical Industries: A Thirty-Year Review, 17th ed.; M&M Protection Consultants: New York, NY, USA, 1990. [Google Scholar]
  45. Carpenter, R.B. Lightning Protection for Flammables Storage Facilities; Lightning Eliminators Consultants: Boulder, CO, USA, 1996. [Google Scholar]
Figure 1. Explosion experiment and simulation results of BFETS phase 3A [25,26,27,33].
Applsci 15 06554 g001
Figure 2. Framework for safety design of ammonia explosion.
Applsci 15 06554 g002
Figure 3. Modelling of ammonia fuel preparation room.
Applsci 15 06554 g003
Figure 4. Generation of grids for explosion scenario.
Applsci 15 06554 g004
Figure 5. Maximum pressure according to the grid size.
Applsci 15 06554 g005
Figure 6. Arrangement of monitoring points in FPR.
Applsci 15 06554 g006
Figure 7. Variation in maximum pressure at different ignition positions. (a) Maximum explosion pressure along the X-axis. (b) Maximum explosion pressure along the Y-axis. (c) Maximum explosion pressure along the Z-axis.
Applsci 15 06554 g007
Figure 8. Peak pressure–time ratio at different ignition positions. (a) Maximum pressure rise rate along the X-axis. (b) Maximum pressure rise rate along the Y-axis. (c) Maximum pressure rise rate ratio along the Z-axis.
Applsci 15 06554 g008
Figure 9. Flammable gas reduction rate base on ignition position. (a) Flammable gas reduction rate along the X-axis. (b) Flammable gas reduction rate along the Y-axis. (c) Flammable gas reduction rate along the Z-axis.
Applsci 15 06554 g009aApplsci 15 06554 g009b
Figure 10. Variation in first detection time with ignition position. (a) Initial detection time at a mass fraction of products of 0.01 kg/kg and a temperature of 351.15 k along the X-Axis. (b) Initial detection time at a mass fraction of products of 0.01 kg/kg and a temperature of 351.15 K along the Y-Axis. (c) Initial detection time at a mass fraction of products of 0.01 kg/kg and a temperature of 351.15 k along the Z-Axis.
Applsci 15 06554 g010aApplsci 15 06554 g010b
Figure 11. Distribution of combustion products in Case 19.
Applsci 15 06554 g011
Figure 12. Distribution of combustion products in Case 13.
Applsci 15 06554 g012
Figure 13. Variation in mass fraction products at monitoring points in Case 19.
Applsci 15 06554 g013
Figure 14. Variation in mass fraction products at monitoring points in Case 13.
Applsci 15 06554 g014
Figure 15. Distribution of temperature in Case 19.
Applsci 15 06554 g015
Figure 16. Distribution of temperature in Case 13.
Applsci 15 06554 g016
Figure 17. Variation in temperature at monitoring points in Case 19.
Applsci 15 06554 g017
Figure 18. Variation in temperature at monitoring points in case 13.
Applsci 15 06554 g018
Table 1. Details of simplified ammonia fuel preparation room model.
ItemSpecification
Vessel typeBulk Carrier
Deadweight (ton)180,000 DWT
Tank typeIMO Type C
Volume15 m × 10 m × 5 m = 750 m3
(Width × Length × Height)
Diameter for ventilation inlet and outlet0.8 m
Equipment simplifiedFuel gas supply system including
vaporizer and glycol water expansion tank,
BOG compressor, degassing units,
solenoid valve cabinet
Table 2. Initial and boundary conditions.
Boundary Condition
XLOEuler
XLOEuler
YLOEuler
YHIEuler
ZLOEuler
ZHIEuler
Initial Condition
Ambient pressure [Pa]101325
Environment temperature [K]288.15
Gas composition ratio
Gas cloud volume
Shape of cloud volume
Ammonia 100%
Equivalent volume(ER = 1)
10 × 15 × 5 cube
Table 3. The coordination position of ignition points in FPR.
CaseIgnition Position
X Axis (m)
Ignition Position
Y Axis (m)
Ignition Position
Z Axis (m)
1.0.15.50.1
2.2.15.50.1
3.4.15.50.1
4.6.15.50.1
5.8.15.50.1
6.9.95.50.1
7.5.15.50.1
8.5.17.50.1
9.5.18.50.1
10.5.19.50.1
11.5.111.50.1
12.5.113.50.1
13.5.114.90.1
14.5.15.50.1
15.5.15.51.1
16.5.15.52.1
17.5.15.53.1
18.5.15.54.1
19.5.15.54.9
Table 4. Arrangement of monitoring points in FPR for 3D explosion simulation.
Monitoring PointPosition
X Axis (m)
Position
Y Axis (m)
Position
Z Axis (m)
1.0.10.14.9
2.0.114.94.9
3.9.90.14.9
4.9.914.94.9
5.0.10.10.1
6.0.114.90.1
7.9.90.10.1
8.9.914.90.1
9.5.07.54.9
10.5.07.52.5
11.5.27.50.1
Disclaimer/Publisher’s Note: The statements, opinions and data contained in all publications are solely those of the individual author(s) and contributor(s) and not of MDPI and/or the editor(s). MDPI and/or the editor(s) disclaim responsibility for any injury to people or property resulting from any ideas, methods, instructions or products referred to in the content.

