Next Article in Journal
Quantitative Analysis of Explosion Characteristics Based on Ignition Location in an Ammonia Fuel Preparation Room Using CFD Simulation
Previous Article in Journal
The Impact of Seasonality on Air Quality in Terms of Pollution with Substances Hazardous to the Environment
 
 
Due to scheduled maintenance work on our database systems, there may be short service disruptions on this website between 10:00 and 11:00 CEST on June 14th.
Article

Machine Learning-Driven Optimization of Machining Parameters Optimization for Cutting Forces and Surface Roughness in Micro-Milling of AlSi10Mg Produced by Powder Bed Fusion Additive Manufacturing

1
Department of Electronic and Automation, Besni Ali Erdemoglu Vocational School, Adıyaman University, Adıyaman 02302, Turkey
2
Department of Machine and Metal Technologies, Isparta OSB Vocational School, Isparta University of Applied Sciences, Isparta 32092, Turkey
3
Department of Naval Architecture and Marine Engineering, Maritime Faculty, Bandırma Onyedi Eylül University, Bandırma 10200, Turkey
4
Department of Industrial Engineering, Faculty of Engineering, Harran University, Şanlıurfa 63510, Turkey
*
Author to whom correspondence should be addressed.
Appl. Sci. 2025, 15(12), 6553; https://doi.org/10.3390/app15126553
Submission received: 18 April 2025 / Revised: 23 May 2025 / Accepted: 3 June 2025 / Published: 10 June 2025
(This article belongs to the Section Additive Manufacturing Technologies)

Abstract

:
This study focuses on optimizing machining parameters in the micro-milling of AlSi10Mg aluminum alloy produced via the powder bed fusion additive manufacturing process. Although additive manufacturing enables complex geometries and minimizes material waste, challenges remain in reducing surface roughness and cutting forces during post-processing. Micro-milling experiments were conducted using spindle speeds up to 60,000 rpm, with varied feed rates and cutting depths. Cutting forces (Fx, Fy, and Fz) were measured using a Kistler-9119AA1 mini dynamometer, while surface roughness (Ra) was evaluated with a Nanovea-ST400 3D optical profilometer. Five advanced machine learning models, random forest regressor (RFR), gradient boosting regressor (GBR), LightGBM, CatBoost, and k-nearest neighbors (KNN), were employed to predict cutting forces and surface roughness, with CatBoost achieving the highest predictive accuracy (R2 > 0.96). Among all models, CatBoost achieved the best predictive performance, with test R2 values exceeding 0.96 for both force and Ra estimations. Experimental and ML-based results demonstrated that higher feed rates and depths of cut increased cutting forces, particularly in the Fx direction, while elevated spindle speeds reduced forces due to thermal softening. Surface roughness was minimized at lower feed rates and higher spindle speeds. The optimal machining conditions for achieving Ra < 1 µm were identified as ap = 50 µm, n = 30,000 rpm, and fz = 0.25 µm/tooth. This integrated approach supports precision machining of AM aluminum alloys.

1. Introduction

Additive manufacturing (AM) manufactures objects by progressively layering material according to a digital design. In contrast to conventional subtractive manufacturing, which involves the removal of material from a solid workpiece, AM selectively adds material only where required [1,2]. Metal AM has increasingly been adopted across high-value industries, including the medical, automotive, nuclear energy, and aerospace sectors [3]. Metal AM processes can be classified based on various factors, including material feeding methods, energy sources, and part volume. However, a more structured classification is determined by the form of raw material used and its delivery mechanism within the system. From this point of view, metal AM processes are basically divided into two main groups, directed energy deposition (DED) and powder bed fusion (PBF) systems, which are powder-fed systems [4,5].
PBF systems include direct metal laser sintering (DMLS), selective laser sintering/melting (SLS/M), and electron beam melting (EBM). These processes use a powder bed as the build platform. SLS, DMLS, and SLM utilize a laser as the heat source, while EBM employs an electron beam. SLS and DMLS are sintering-based processes, whereas SLM and EBM involve complete melting of the powder [6]. DMLS is a laser-based additive manufacturing process that utilizes metal powder to fabricate parts directly during the building process. This technique provides the production of complex metal components with high precision and material efficiency [7].
In additive manufacturing (AM), metal powders are typically characterized by a spherical morphology and a controlled particle size distribution to enhance packing density, improve flowability, and ensure uniform layer deposition, all of which contribute to achieving high mechanical performance and near-full part density. Critical powder characteristics such as morphology, apparent and tap density, chemical composition, flowability, and thermal properties directly affect process stability, melt pool behavior, and ultimately, the structural integrity and quality of fabricated parts [8,9]. Metal powders used in AM have been extensively analyzed, with emphasis on the need for standardized characterization to ensure process reliability [8]. Moreover, it has been demonstrated that powder morphology significantly impacts the mechanical properties of metal matrix composites fabricated via laser powder bed fusion, where enhanced sphericity and uniformity lead to improved ductility and reduced microstructural defects [9]. Most LPBF research relies on commercially available pre-alloyed powders, with nickel alloy 625, 316L stainless steel, AlSi10Mg, and Ti6Al4V being the most used materials [10]. Aluminum alloys are well known for their outstanding strength-to-weight ratio, excellent formability, corrosion resistance, and recyclability. Compared to traditional steel, they enable lighter car parts without compromising strength. Ongoing research continues to enhance aluminum alloys, driving further innovations in sustainable lightweighting for the automotive industry [11,12,13]. Among aluminum alloys, AlSi10Mg is extensively used in additive manufacturing for its excellent weldability, high strength-to-weight ratio, superior formability, thermal stability, corrosion resistance, and diverse post-processing potential [14,15].
Tool-based micromachining techniques, including micro milling, micro turning, micro grinding, and micro drilling, function similarly to conventional machining, allowing for precise material removal at the microscale. Mechanical micromachining processes offer wide application flexibility and versatility by enabling the production of miniature components with complex shapes, independent of material properties [16,17]. Despite its potential applications and benefits, the influence of the micro-milling machinability of additively manufactured aluminum alloys remains largely unexplored, highlight a significant knowledge gap for optimizing the machining process [18].
In recent years, significant advancements in ML techniques have facilitated highly accurate prediction and optimization in machining processes, especially concerning surface roughness and cutting forces. Numerous studies have effectively integrated ML algorithms such as artificial neural networks (ANN), support vector regression (SVR), random forest (RF), and gradient boosting methods with multi-objective optimization tools like NSGA-II to enhance machining performance. For instance, robust hybrid frameworks combining ML models with NSGA-II have been developed to minimize surface roughness and tool wear in the turning and milling of alloy steels and aluminum alloys [19,20]. Similarly, ML-based models like ANN and SVR were employed with genetic algorithms for the optimization of surface roughness and cutting forces in the milling of aluminum alloys [21]. The predictive capacity and industrial applicability of such models have also been emphasized in studies highlighting the accuracy, cost-effectiveness, and stability of ML-based systems for forecasting machining parameters across various materials and processes, ranging from conventional metal cutting to specialized applications such as rotary ultrasonic bone drilling [22,23]. Additionally, ML-aided optimization frameworks have been validated in hard turning scenarios involving advanced coatings and high-strength alloys [24,25]. Furthermore, hybrid strategies combining ML and simulation techniques, such as finite element analysis and deep reinforcement learning, have been proposed to predict cutting forces and energy consumption accurately [26,27]. Complementing these, ML modeling under eco-efficient lubrication conditions was explored to predict surface roughness in MQL-assisted turning [28]. Collectively, these studies underscore the potential of ML-integrated optimization approaches as reliable, flexible, and efficient tools for enhancing productivity and sustainability in modern machining operations. However, most existing studies focus on conventional materials or macro-scale processes, with limited exploration of micro-milling performance on additively manufactured (AM) AlSi10Mg alloys. Additionally, few works compare multiple machine learning models under identical experimental conditions for predicting both cutting forces and surface roughness in micro-machining. This study addresses these gaps by systematically analyzing the machinability of DMLS-fabricated AlSi10Mg using a wide range of ML models, thereby contributing novel insights into process optimization for the precision manufacturing of AM components.
This study investigates the optimum cutting parameters for the micro milling of AlSi10Mg aluminum alloy produced using the powder bed fusion additive manufacturing process. The samples, AlSi10Mg aluminum alloy, were produced by the direct metal laser sintering (DMLS) process. To evaluate the impact of machining parameters, various cutting speeds, feed rates, and depths of cut were applied to assess their effects on the efficiency and surface roughness characteristics of the micro-milled components. In addition, machine learning models were applied to predict the cutting forces and surface roughness, providing a data-driven approach to optimize the machining process. This research introduces a novel approach by offering valuable insights into the micro-milling of additively manufactured aluminum alloys, focusing specifically on the DMLS-fabricated samples. It also explores the implications of the findings and identifies potential improvements for the micro-machining of aluminum alloys, particularly those produced via the DMLS process.

2. Materials and Methods

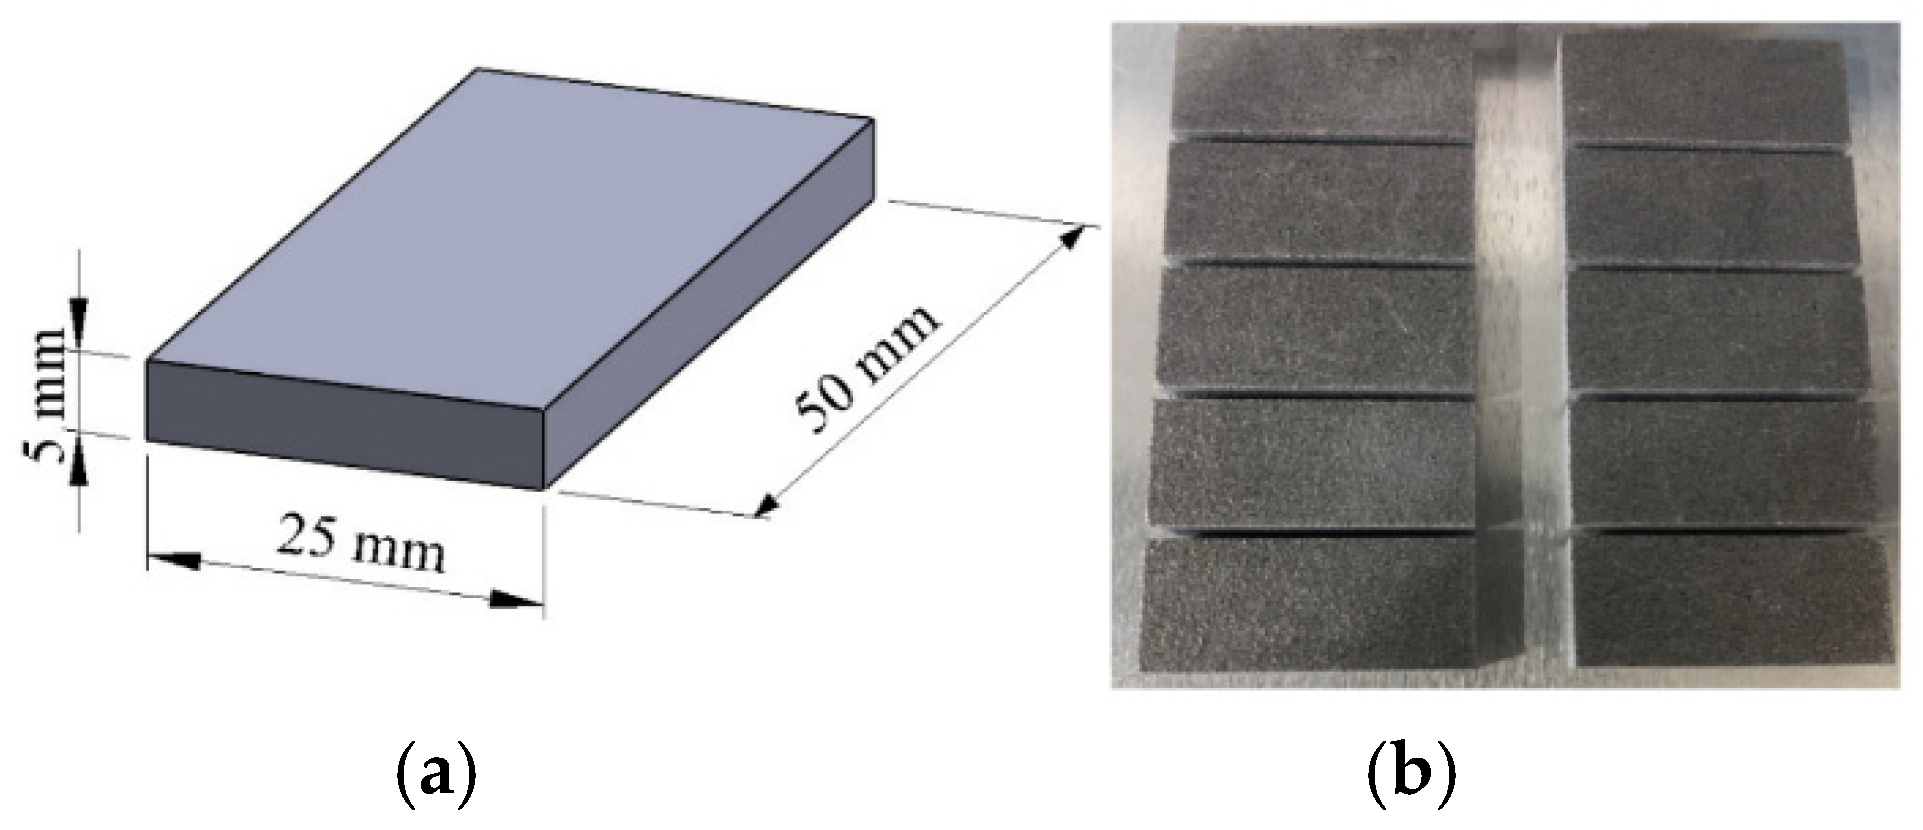
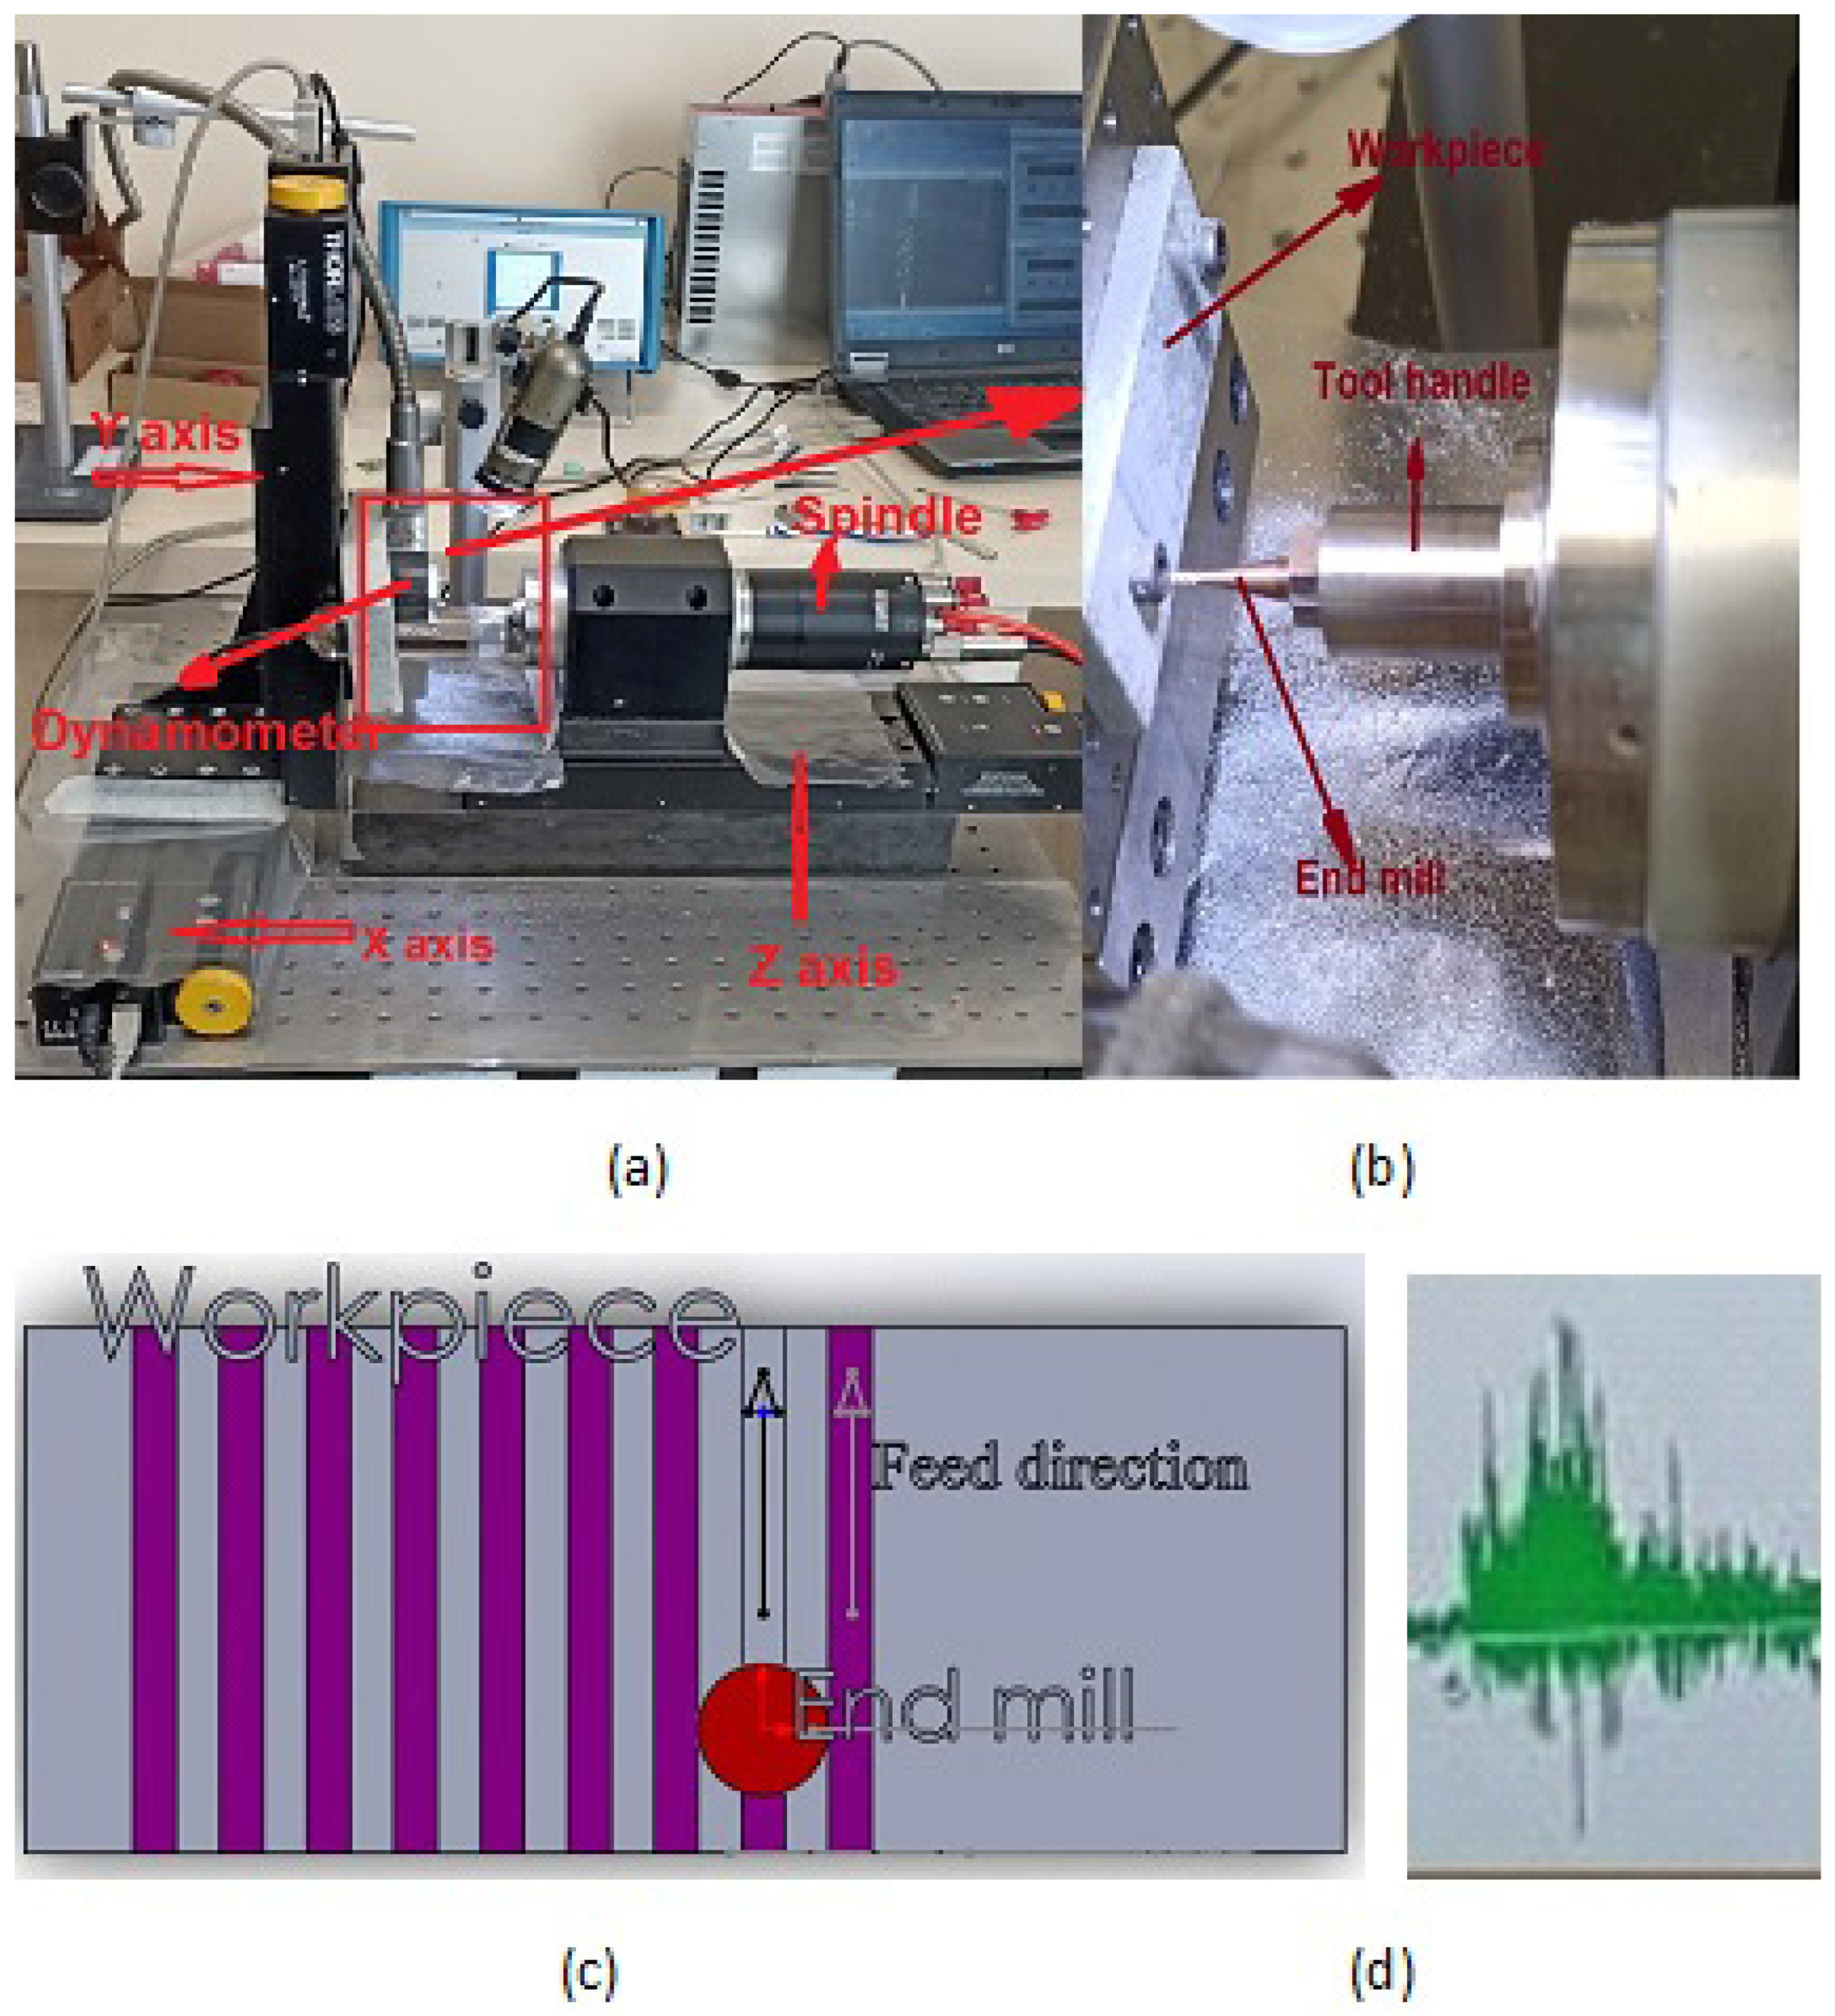
2.1. Material Specifications and Sample Preparation

AlSi10Mg material supplied by EOS company was used in the study. The samples were manufactured by the DMLS device. In this study, micro-milling experiments were conducted using Al10MgSi aluminum alloy fabricated by the DMLS method. Table 1 shows the chemical components of the materials used in the study. The aluminum AlSi10Mg manufactured by the EOS company is a widely used alloy known for its favorable mechanical properties and lightweight nature, as shown in Table 2.
The system operates with high precision, utilizing advanced, sharp micro cutting tools for 1090 µm applications. The workpiece material, an additively manufactured AlSi10Mg alloy, is well-suited for micro machining. It is prepared with dimensions of 50 × 20 × 5 mm. The parts were fabricated using AlSi10Mg alloy on a DMLS machine equipped with a Yb-fiber laser, which operates at a maximum power of 400 W and has a minimum laser spot diameter of 100 µm. The fabrication was carried out with a standard layer thickness of 0.03 mm. The process followed the manufacturer’s recommended parameters, specifically, a laser power of 370 W, a scanning speed of 1300 mm/s, and a hatch spacing of 0.19 mm, and the platform temperature here was taken as 165 °C, which is recommended by the company, in order to reduce distortion in the material and ensure a tighter bond. Upon completion of the fabrication process, the residual dust on the parts was first cleaned inside the fabrication chamber. Subsequently, the support structures were removed, and the specimens were separated from the manufacturing platform using a wire electrical discharge machining (EDM) system (Figure 1).
In Figure 2, the micro-milling experimental setup, capable of reaching high spindle speeds of up to 60,000 rpm and performing micro-level milling operations, is presented. The figure also includes a detailed view of the cutting region where the machining process takes place, along with a schematic representation of the machining area. This micro-milling machine is equipped with specialized software that allows it to achieve the desired spindle speed with high precision. Additionally, the cutting depth can be easily adjusted along the Z-axis to the required µm level. During the experiments, the material was secured to a Kistler-9119AA1 model mini dynamometer using screws, enabling the measurement of cutting forces (Fx, Fy, and Fz) during machining. These force values were then transmitted to a computer system for data analysis. The motion along the X, Y, and Z axes was worked with high precision using micro-step motors and guide rails, with the machining direction set along the X-axis. Unlike conventional industrial vertical machining centers, this micro-milling machine features a horizontal machining configuration, where the cutter is attached to the via a pneumatic system. For the cutting process, a Heikenei brand four-flute cutting tool with a diameter of 1000 µm was used, and its specifications are provided in Table 3.
In the micro-machining tests, the cutting parameters included feed per tooth (fz), spindle speed (n), and cutting depth. The machining experiments were conducted using four different feed rates, three spindle speed variations, and two different cutting depths (Table 4). Initially, the four different feed rate parameters were applied with three different spindle speeds and a depth of 50 µm. Subsequently, the same parameters were tested again with a second depth of 100 µm. The parameters used for this article are similar to those seen in a study conducted by Erçetin et al. [30], as shown in Table 4.
Cutting force signals were converted into force measurement values by amplifying them from the system. These measured values were recorded by transferring them to the Dynoware software (https://www.kistler.com/INT/en/cp/software-dynoware-2825a/P0000205, accessed on 2 June 2025) on the computer. Since the sampling rates for these cutting forces were 2000 Hz, the cutting force signals were also selected in the 300–2000 Hz. The cutting force values found were evaluated according to the valley-peak values for Fx, Fy, and Fz, which are widely used in micro milling, and were finalized (Figure 3). The values expressed by these values are the values between the minimum and maximum amplitudes. The distance used for the cutting force was used as 25 mm. For the surface roughness measurement values (Sa), a Nanovea-ST400 3D Optical profilometer was used to scan the surface part inside the channel. The surface roughness values of the area within this channel were measured.

2.2. Machine Learning Models

In this study, machine learning models were employed to predict cutting forces (Fx, Fy, and Fz) and surface roughness (Ra) during the micro-milling process of AlSi10Mg aluminum alloy. These models offer a data-driven approach to optimize the machining process, reducing reliance on trial-and-error experimentation and enhancing both process efficiency and accuracy.
The dataset used in this study comprises measurements from multiple micro-milling experiments, encompassing various cutting parameters such as feed rate, cutting depth, and spindle speed. The data underwent preprocessing through outlier detection, normalization, and feature selection techniques, ensuring their quality and relevance for model training. Recursive feature elimination (RFE) and mutual information scores were applied to identify the most relevant features for prediction.
A variety of machine learning models were utilized to model the relationships between cutting parameters and performance metrics (cutting forces and surface roughness). These models, including RFR, GBR, LightGBM, CatBoost, and KNN, were selected for their efficacy in regression tasks and their capacity to handle complex, nonlinear relationships within high-dimensional datasets.
These models were specifically chosen for several important reasons. First, efficiency is a key consideration, as deep learning models, despite their power, require substantial computational resources. In contrast, models like GBR and RFR provide high accuracy with relatively lower computational costs, making them more suitable for industrial applications. Second, interpretability is critical, as these models offer valuable insights into feature importance, enabling the identification of cutting parameters that most significantly impact cutting forces and surface roughness. Finally, performance was a determining factor, as ensemble models such as RFR and GBR have consistently demonstrated superior predictive accuracy in prior research, especially in structured datasets with multiple variables, such as those involved in micro-milling. Table 5 provides an overview of the machine learning models employed in this study, including their descriptions, theoretical foundations, and mathematical formulations.
The dataset was divided into training (80%) and testing (20%) subsets to evaluate model performance. Hyperparameter optimization was conducted using grid search and cross-validation techniques, focusing on critical parameters such as learning rate, tree depth, and the number of estimators. Python (https://www.python.org/, accessed on 2 June 2025) was employed for model development, leveraging libraries such as Scikit-Learn, XGBoost, and TensorFlow to ensure efficient implementation of the models. To assess model accuracy and robustness, several evaluation metrics were employed, including mean absolute error (MAE), root mean squared error (RMSE), and R-squared (R2) scores. By adopting a systematic approach encompassing dataset preparation, feature selection, hyperparameter tuning, and the use of reliable coding frameworks, this study ensures the reproducibility and transparency of the machine learning-based predictive models for cutting forces and surface roughness, thereby contributing to the optimization of the micro-milling process.

3. Results and Discussion

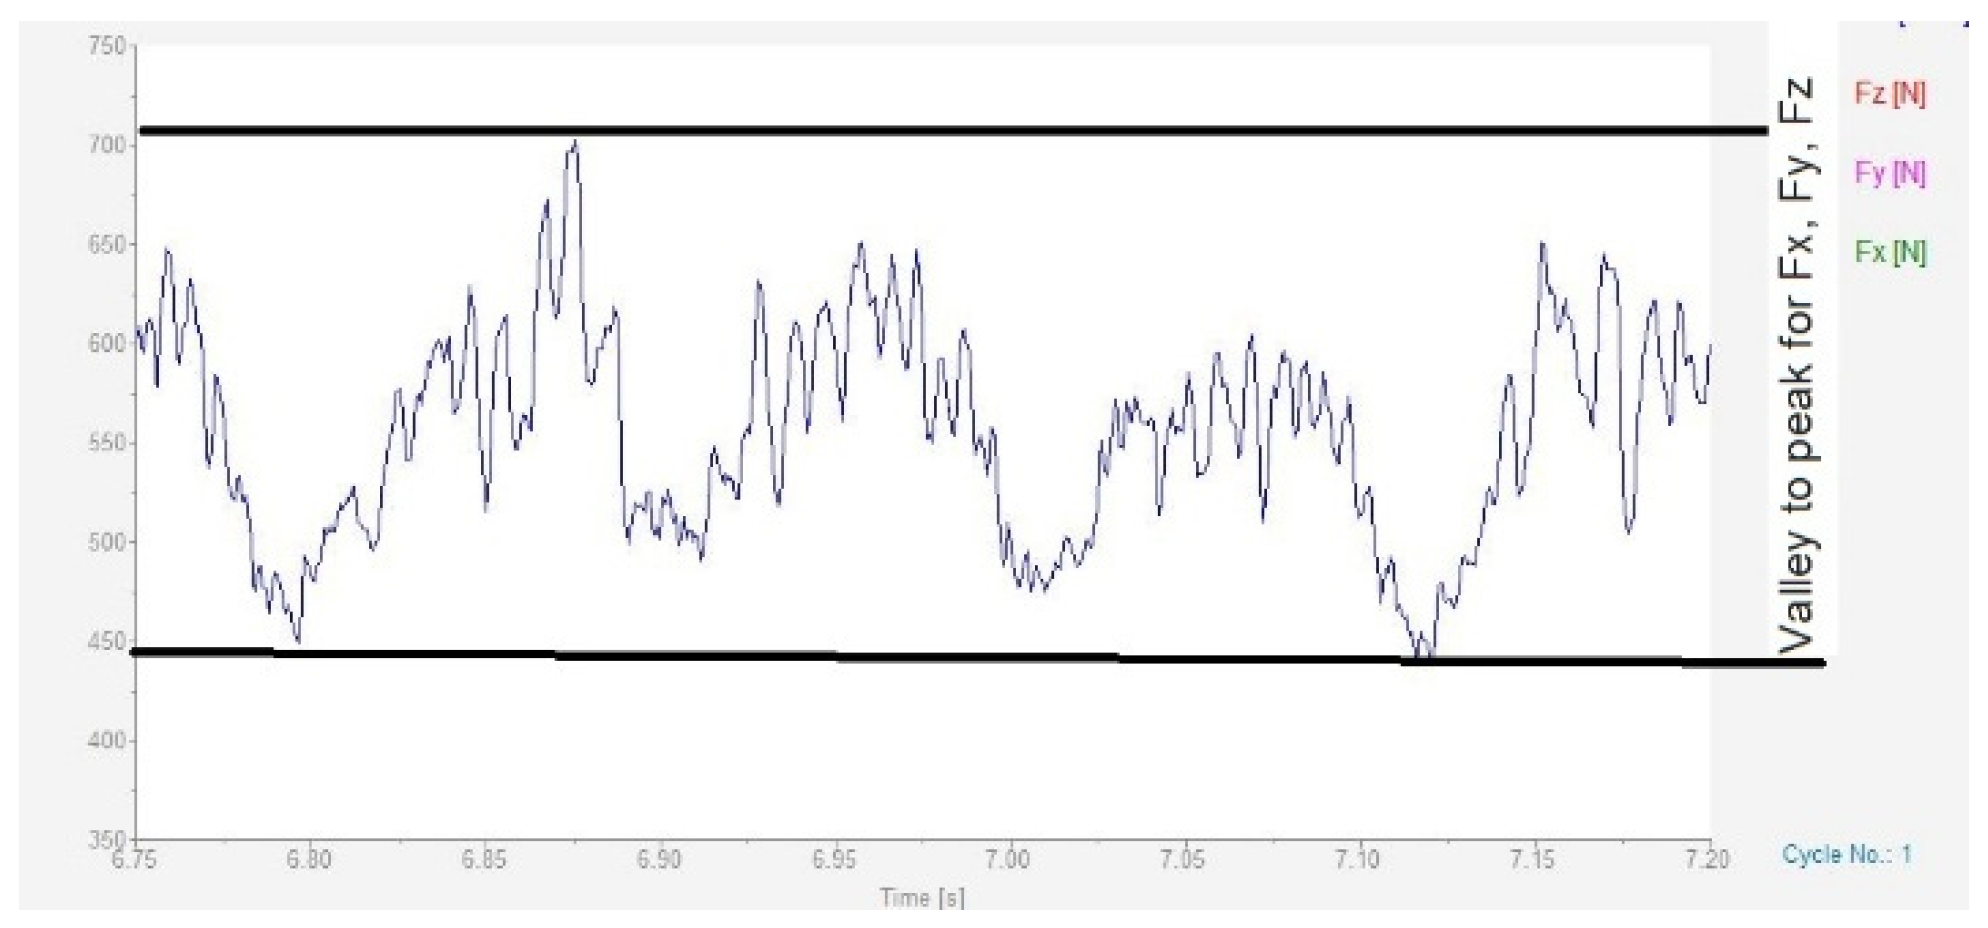
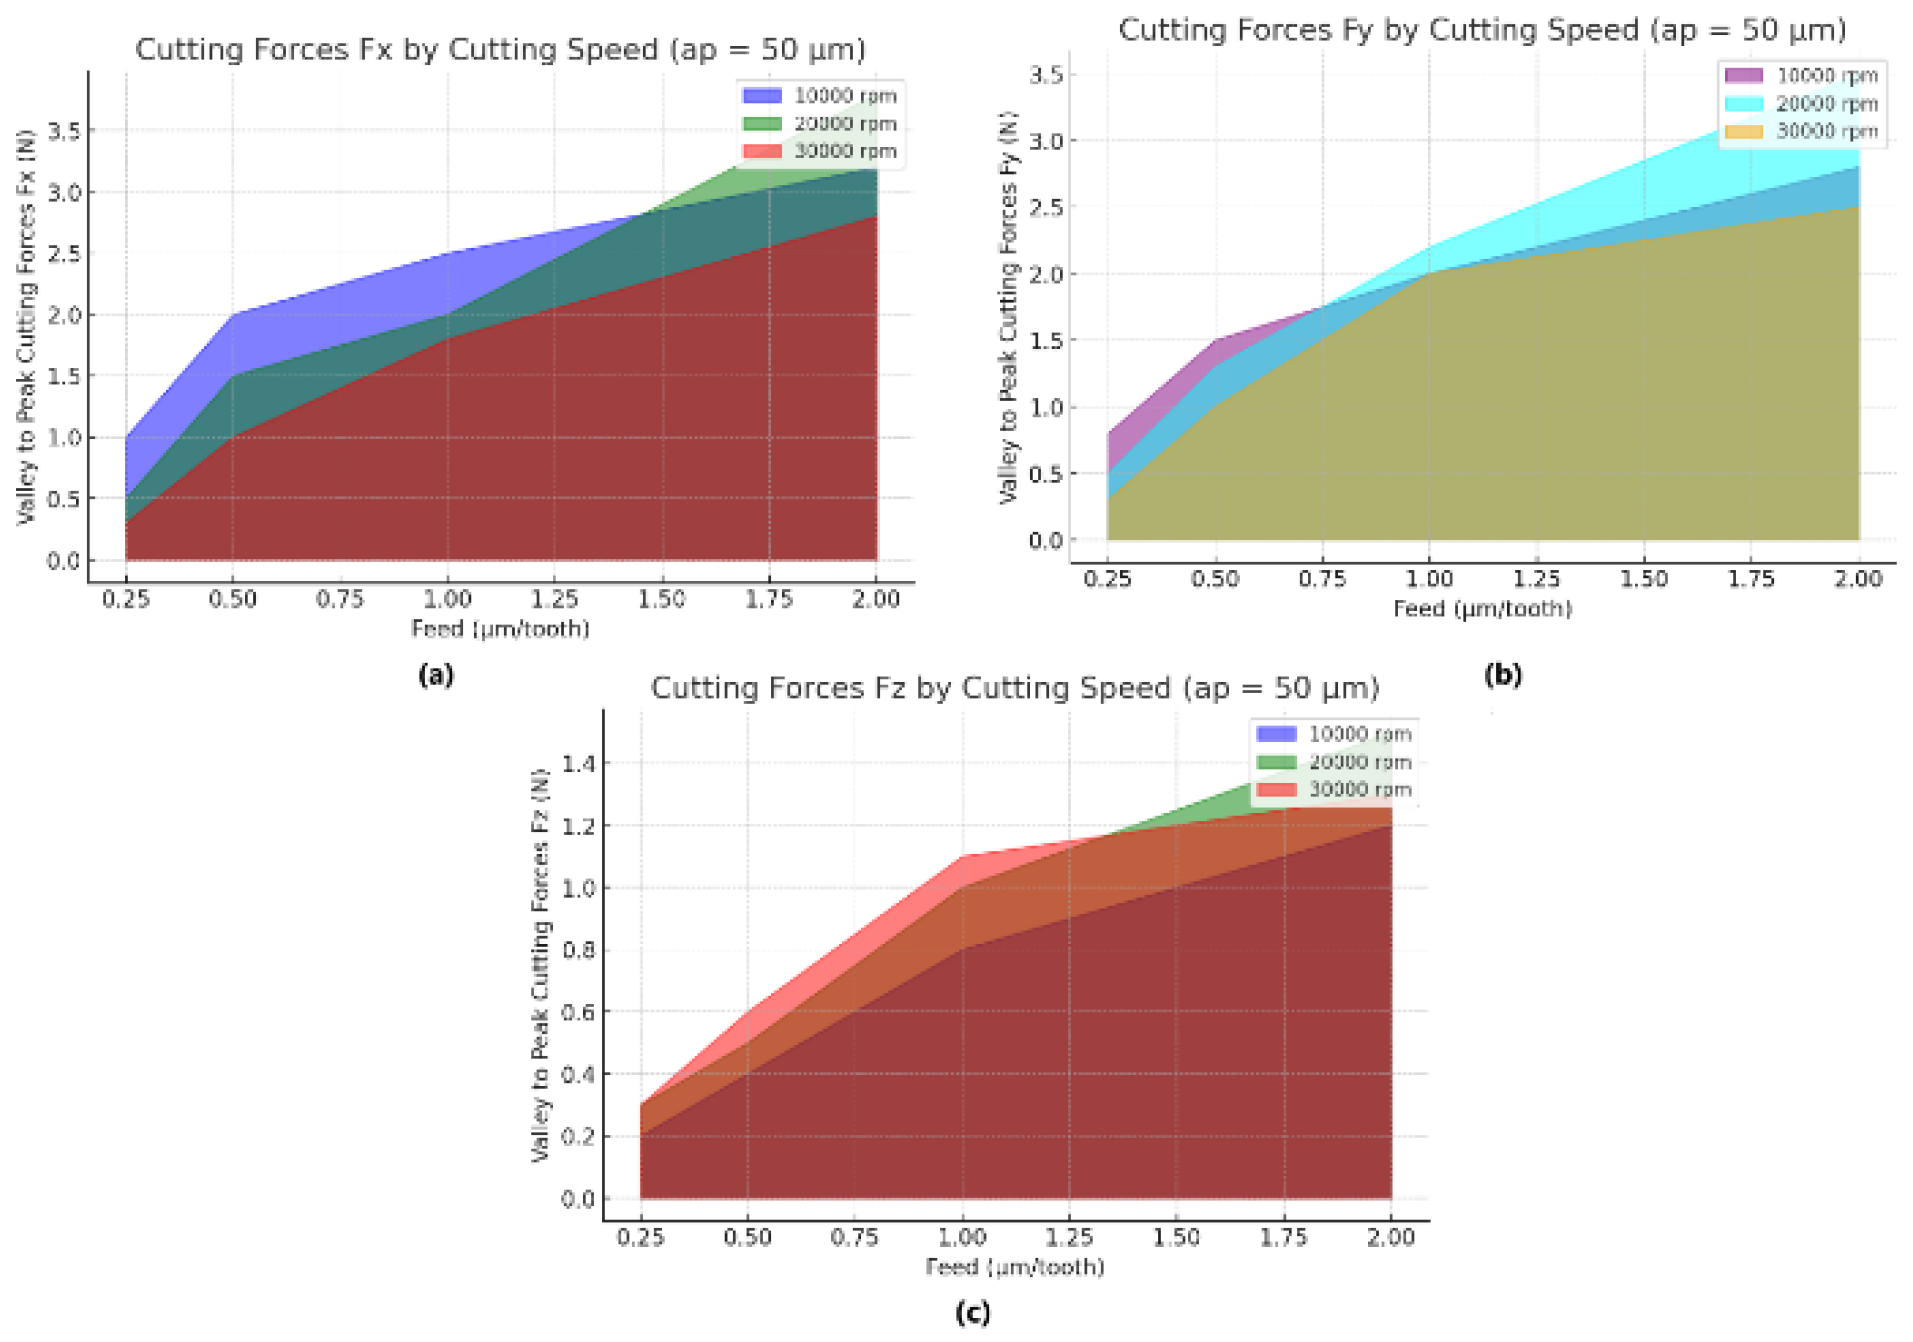
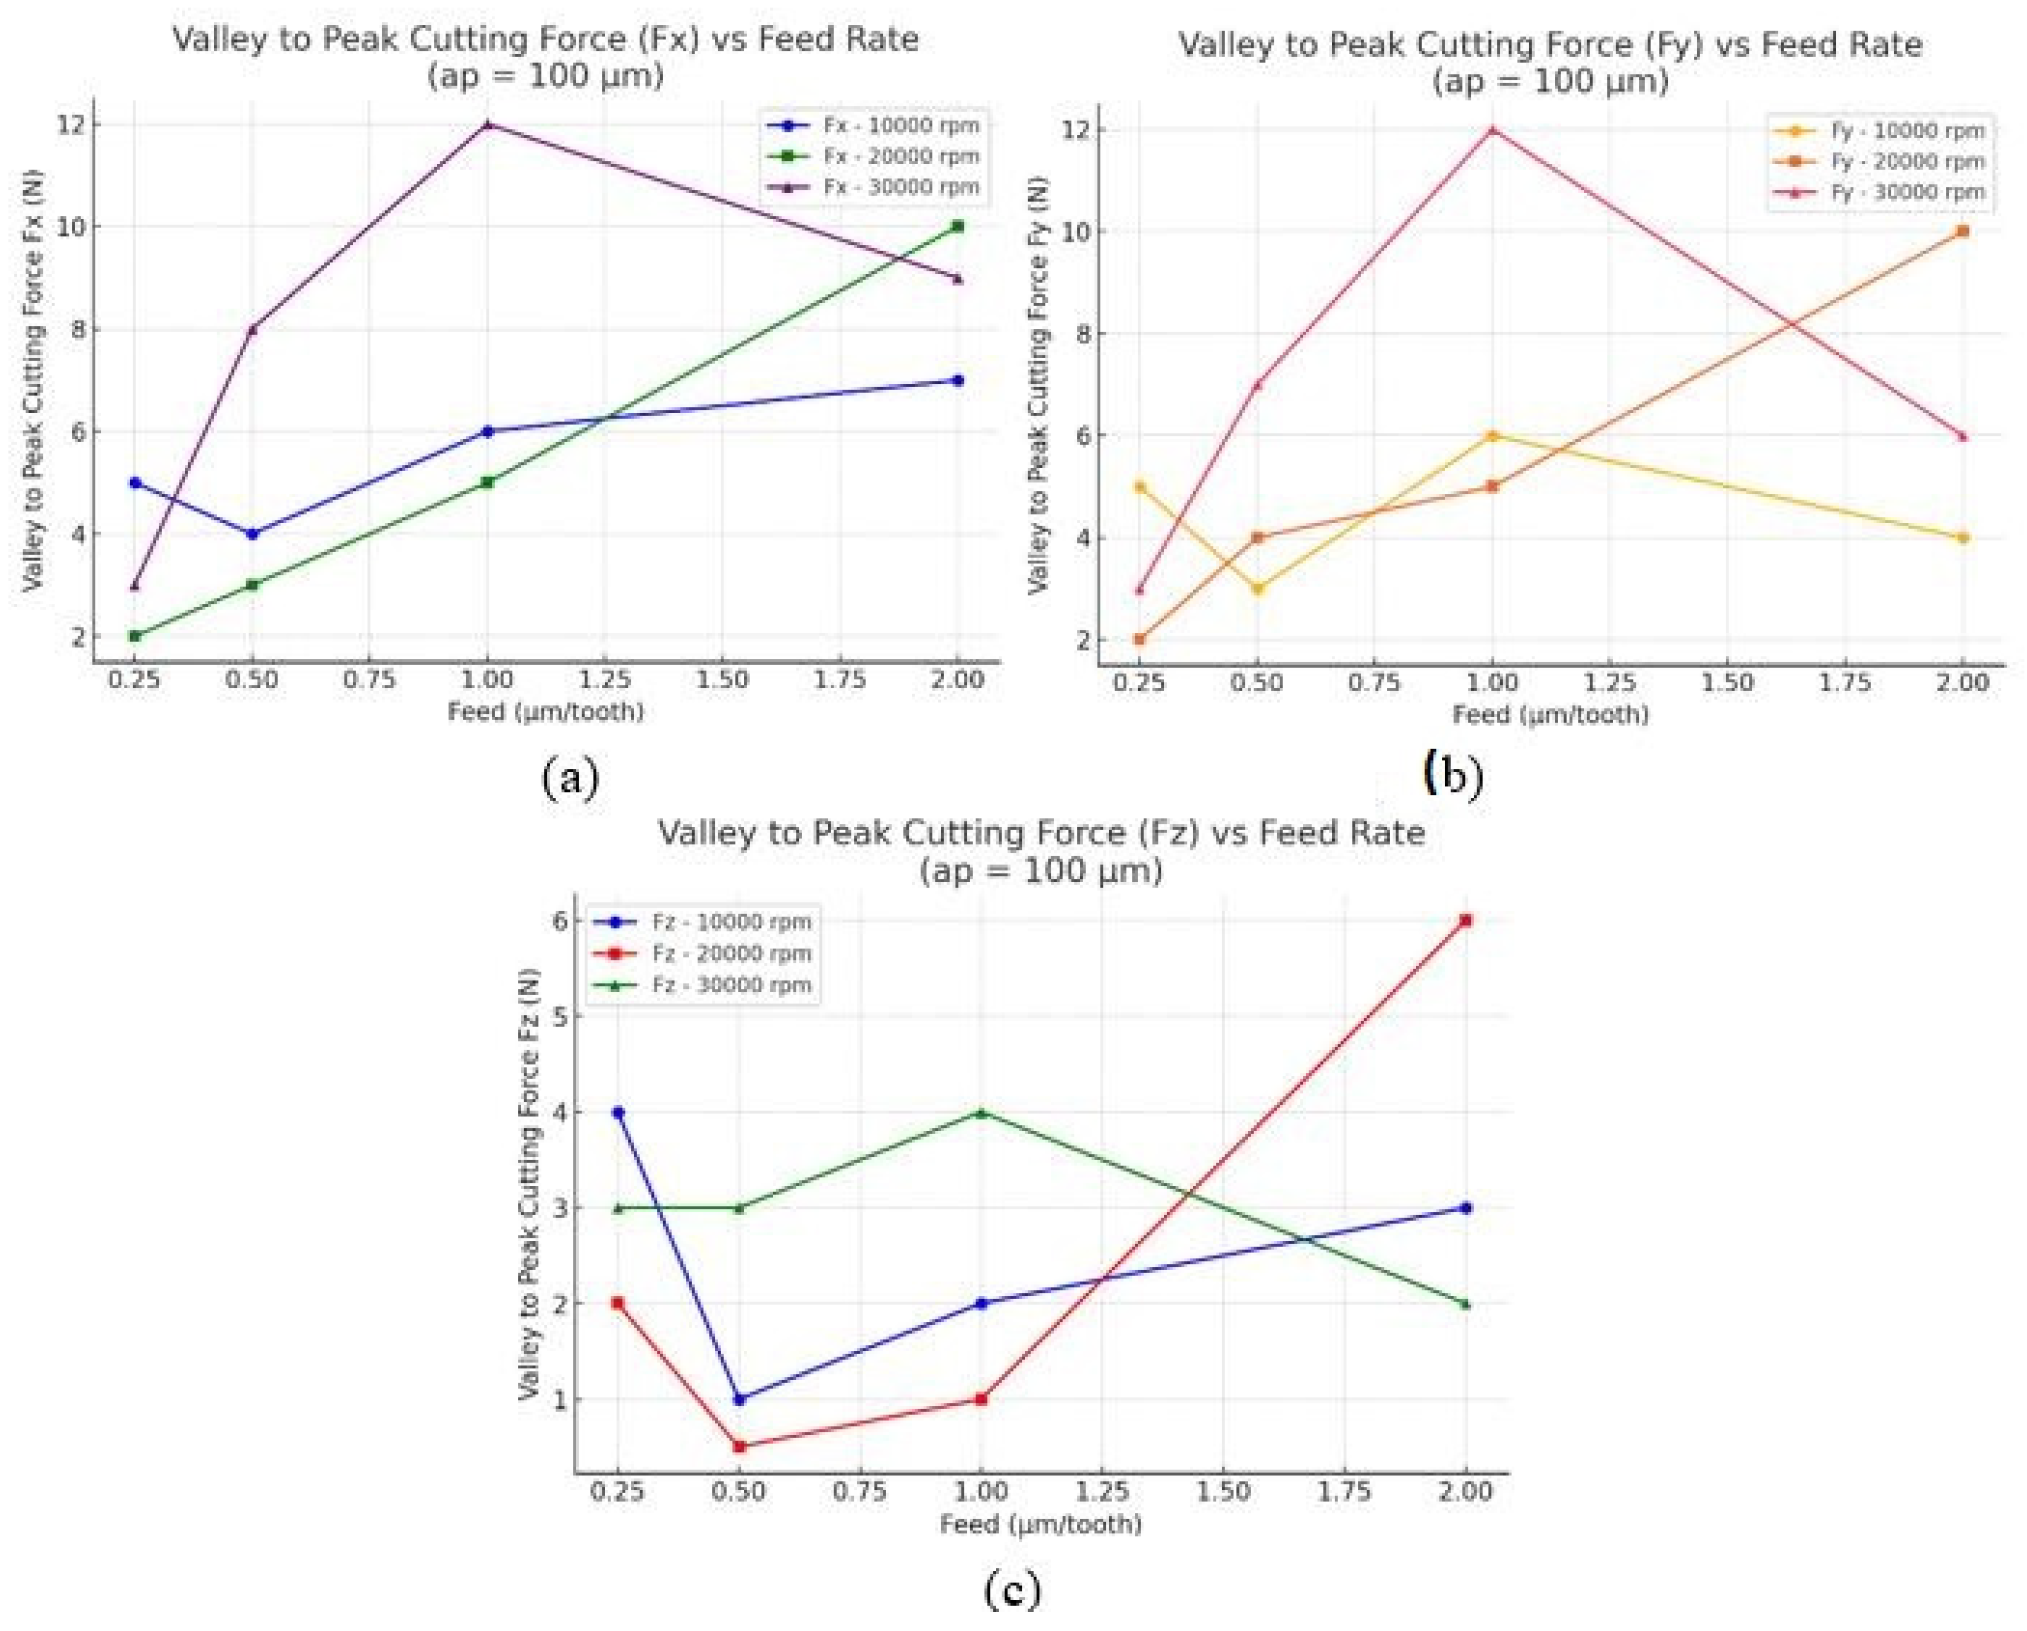
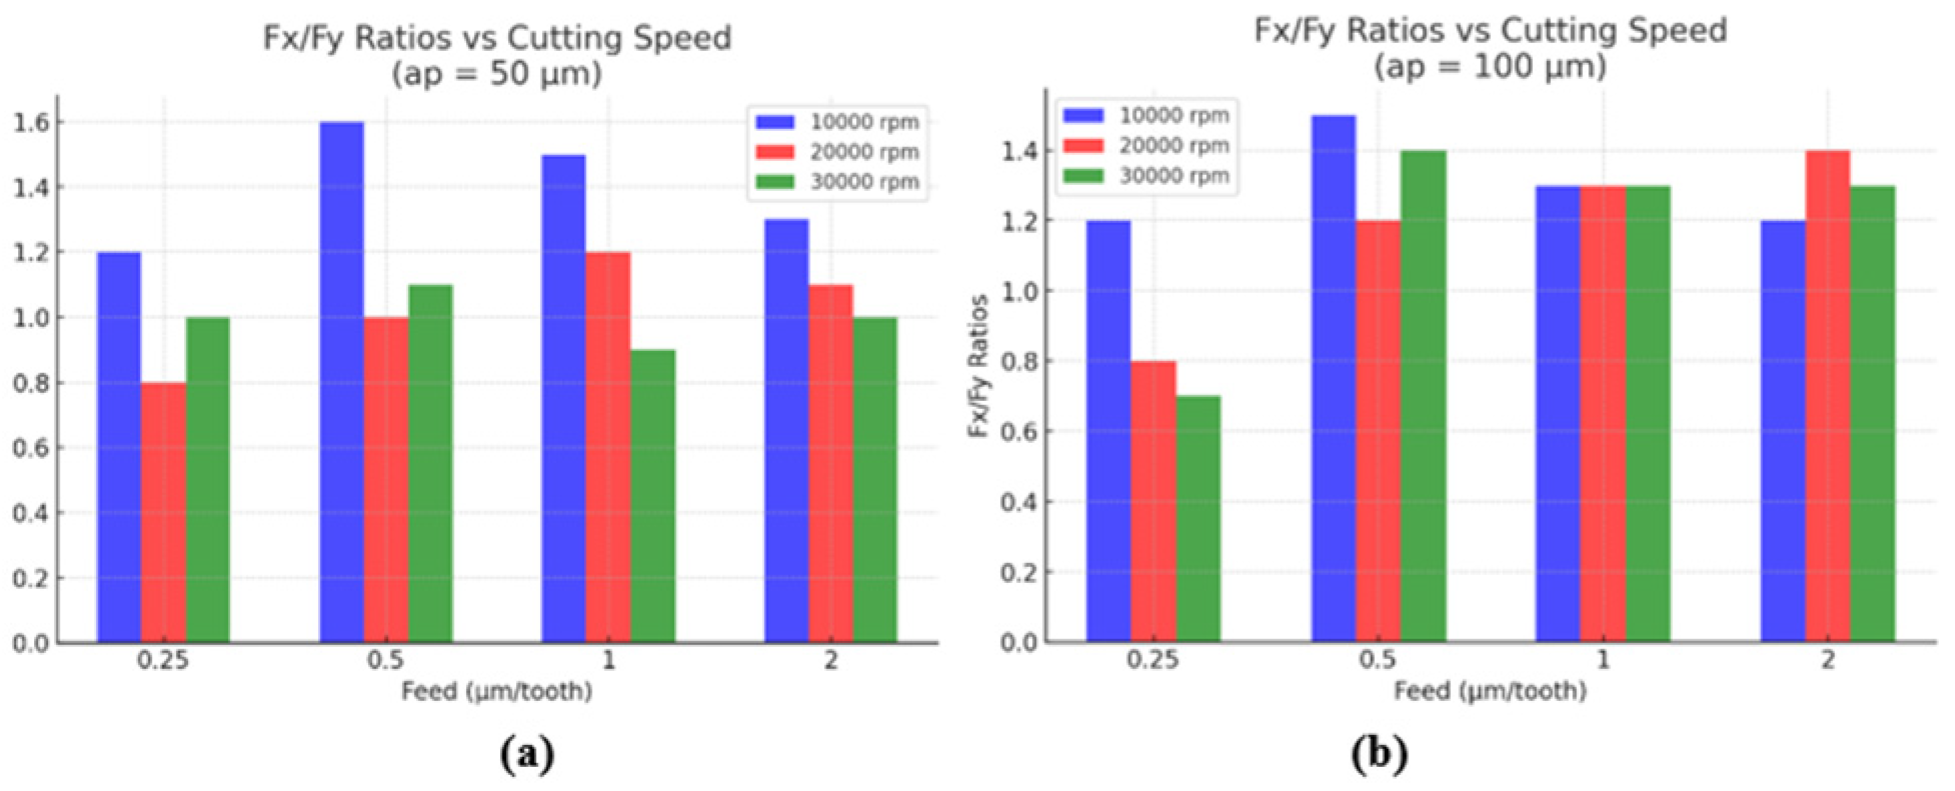
3.1. Effects of Cutting Parameters on Cutting Forces in Micro-Milling

Figure 4 and Figure 5 present the graphs of the cutting forces Fx, Fy, and Fz generated during micro milling at cutting depths of 50 µm and 100 µm. An analysis of these figures reveals that an increase in cutting depth and feed rate leads to a significant rise in the cutting forces Fx and Fy. The increase in these two parameters leads to greater friction in cutter and the specimens during each rotation and feed movement compared to previous conditions. This increased contact subsequently causes a rise in cutting forces. Essentially, with the grow in feed and depth, the cutter removes more chip within the same time period, thus showing an increase in the press on the cutter. However, an inverse relationship is observed in micro-milling experiments, where an increase in spindle speed leads to a noticeable decrease in cutting forces. Under the same cutting conditions, coated carbide tools consistently generate higher cutting forces compared to other cutting tools [42].
A higher spindle speed implies that the cutter side of the endmill contacts the specimens at a higher velocity. This higher speed results in a rise in temperature in the machining zone, leading to the thermal softening of the specimen [43]. Heat through machining plays an important role in reducing cutting forces. This widely observed effect is particularly significant in micro-milling because of the extremely small size of the produced chips [30]. There exists an inverse relation between spindle speed and cutting forces; every increase in spindle speed causes a decline in cutting forces. However, the contact between the cutter and the specimen simultaneously causes a significant temperature rise at the tool tip [44].
Another notable finding in this study is that the Fx cutting forces observed during micro-milling at cutting depths of 50 µm and 100 µm are significantly much higher than the Fy cutter forces. The higher magnitude of Fx can be attributed to its alignment with the primary material removal direction. The Fx component is required to exceed the shear strength of the specimen during machining, thereby resulting in a greater force. In contrast, the Fy component, unlike the material removal operation, is primarily related to the contact between the cutter and the specimen, which explains its lower magnitude [45].
In Figure 6, an increase in feed rate and spindle speed typically leads to a reduction in the Fx/Fy ratio. For the experiments conducted at a cutting depth of 50 µm, the maximum Fx/Fy ratio was 1.60, while the minimum ratio was 0.80 (Figure 6a). In contrast, for the tests performed at a cutting depth of 100 µm, the maximum Fx/Fy ratio was 1.43, whereas the minimum ratio was 0.43 (Figure 6b). As the feed increased, the chip thickness also increased, with a corresponding rise in Fx and Fy. However, the Fx cutting force exhibited a more rapid increase compared to Fy. This phenomenon can be assigned to the fact that at higher feed rates, a greater portion of the workpiece is engaged per spindle revolution, necessitating a higher feed force. The highest cutting force was recorded at a cutting depth of 100 µm, a feed rate of 1 µm/tooth, and a spindle speed of 30,000 rpm. In contrast, the lowest cutting force values were observed at a cutting depth of 50 µm, a feed rate of 0.25 µm/tooth, and a spindle speed of 10,000 rpm.
These insights offer practical guidance for selecting cutting parameters to minimize excessive forces, which can prolong tool life and improve product quality in industrial micro-milling setups. A different result was found in this paper. When examining the cutting forces at the feed rate parameter of Fz = 0.25 µm/tooth in Figure 14, it was observed that spindle speed does not play a significant role. At lower feed rates, since the cutting tool removes less material per spindle revolution, the chip load is relatively low. This can be expounded with the situation where although the cutting tool remains in contact with the machined material per unit time, the total of material removed in contact instance is smaller. Consequently, no notable grow in cutting forces can be seen. The mechanics of chip formation in conventional machining and micro-milling differ significantly [46]. These differences arise due to factors such as tool runout, dimensional variations, and the elastic recovery of the workpiece [47]. Such phenomena are more likely to take place when micro-milling mushy metallic or plastic specimens that need relatively low cutting forces [48].
As observed in Figure 5 and Figure 6, an increase in cutting depth from 50 µm to 100 µm naturally resulted in a rise in all cutting forces. This increase in cutting depth led to greater surface contact between the cutter and the specimen through each material removal, causing a higher mass of specimen to undergo deformation and chip removal. Consequently, this indicates a greater requirement for cutting forces [49]. It was observed that in tests where the feed rate was high and the spindle speed was low, the cutting forces increased by 2 to 3 times (Figure 4a–c). A spindle speed of 20,000 rpm was found to be more suitable for reducing cutting forces. However, when considering machining time, a cutting depth ap = 100 µm was more appropriate for minimizing the total machining duration. These findings highlight a trade-off between minimizing cutting forces and optimizing machining time, a balance that should be carefully managed in industrial production to enhance efficiency and tool performance.

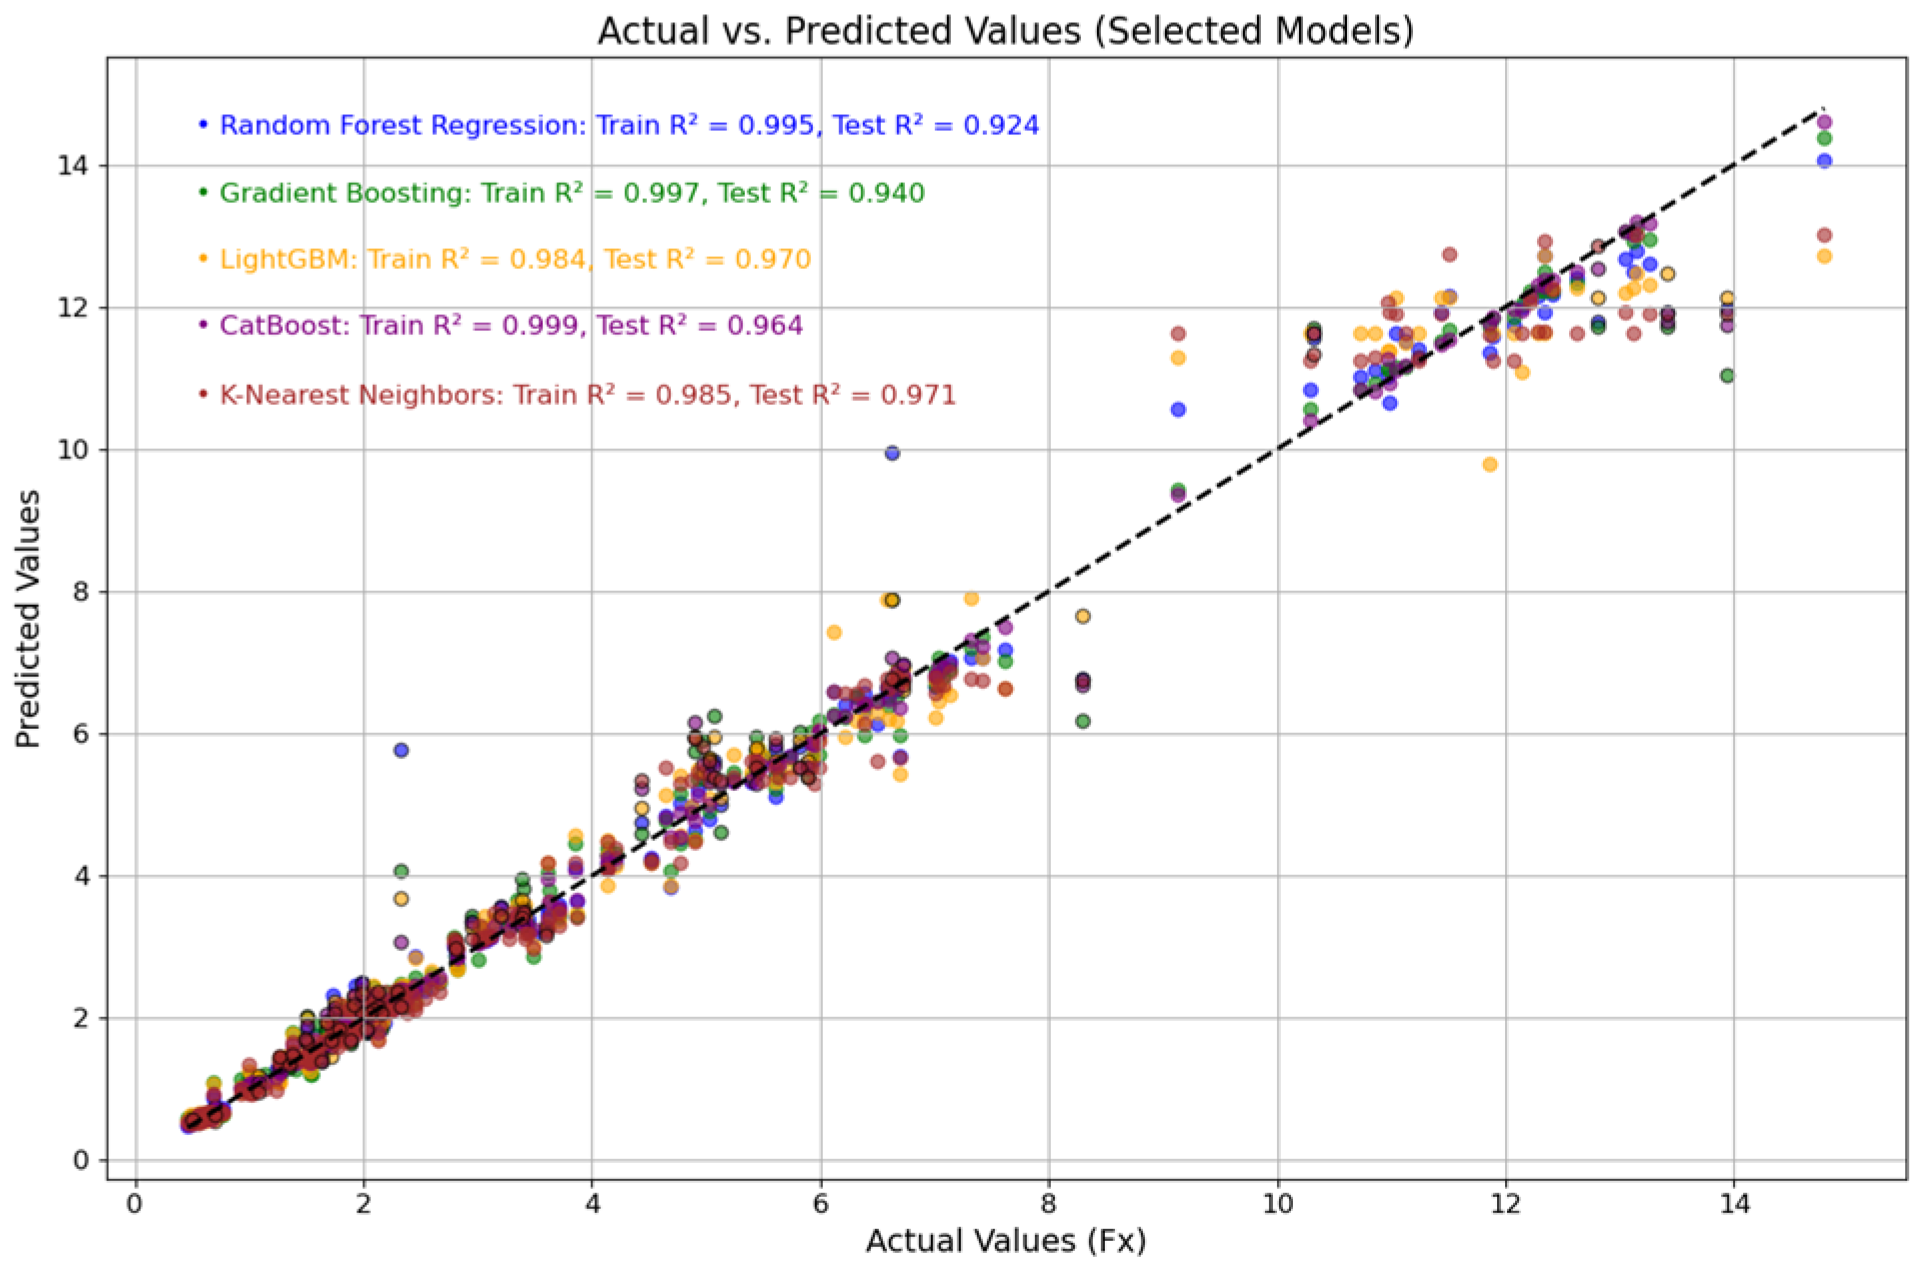
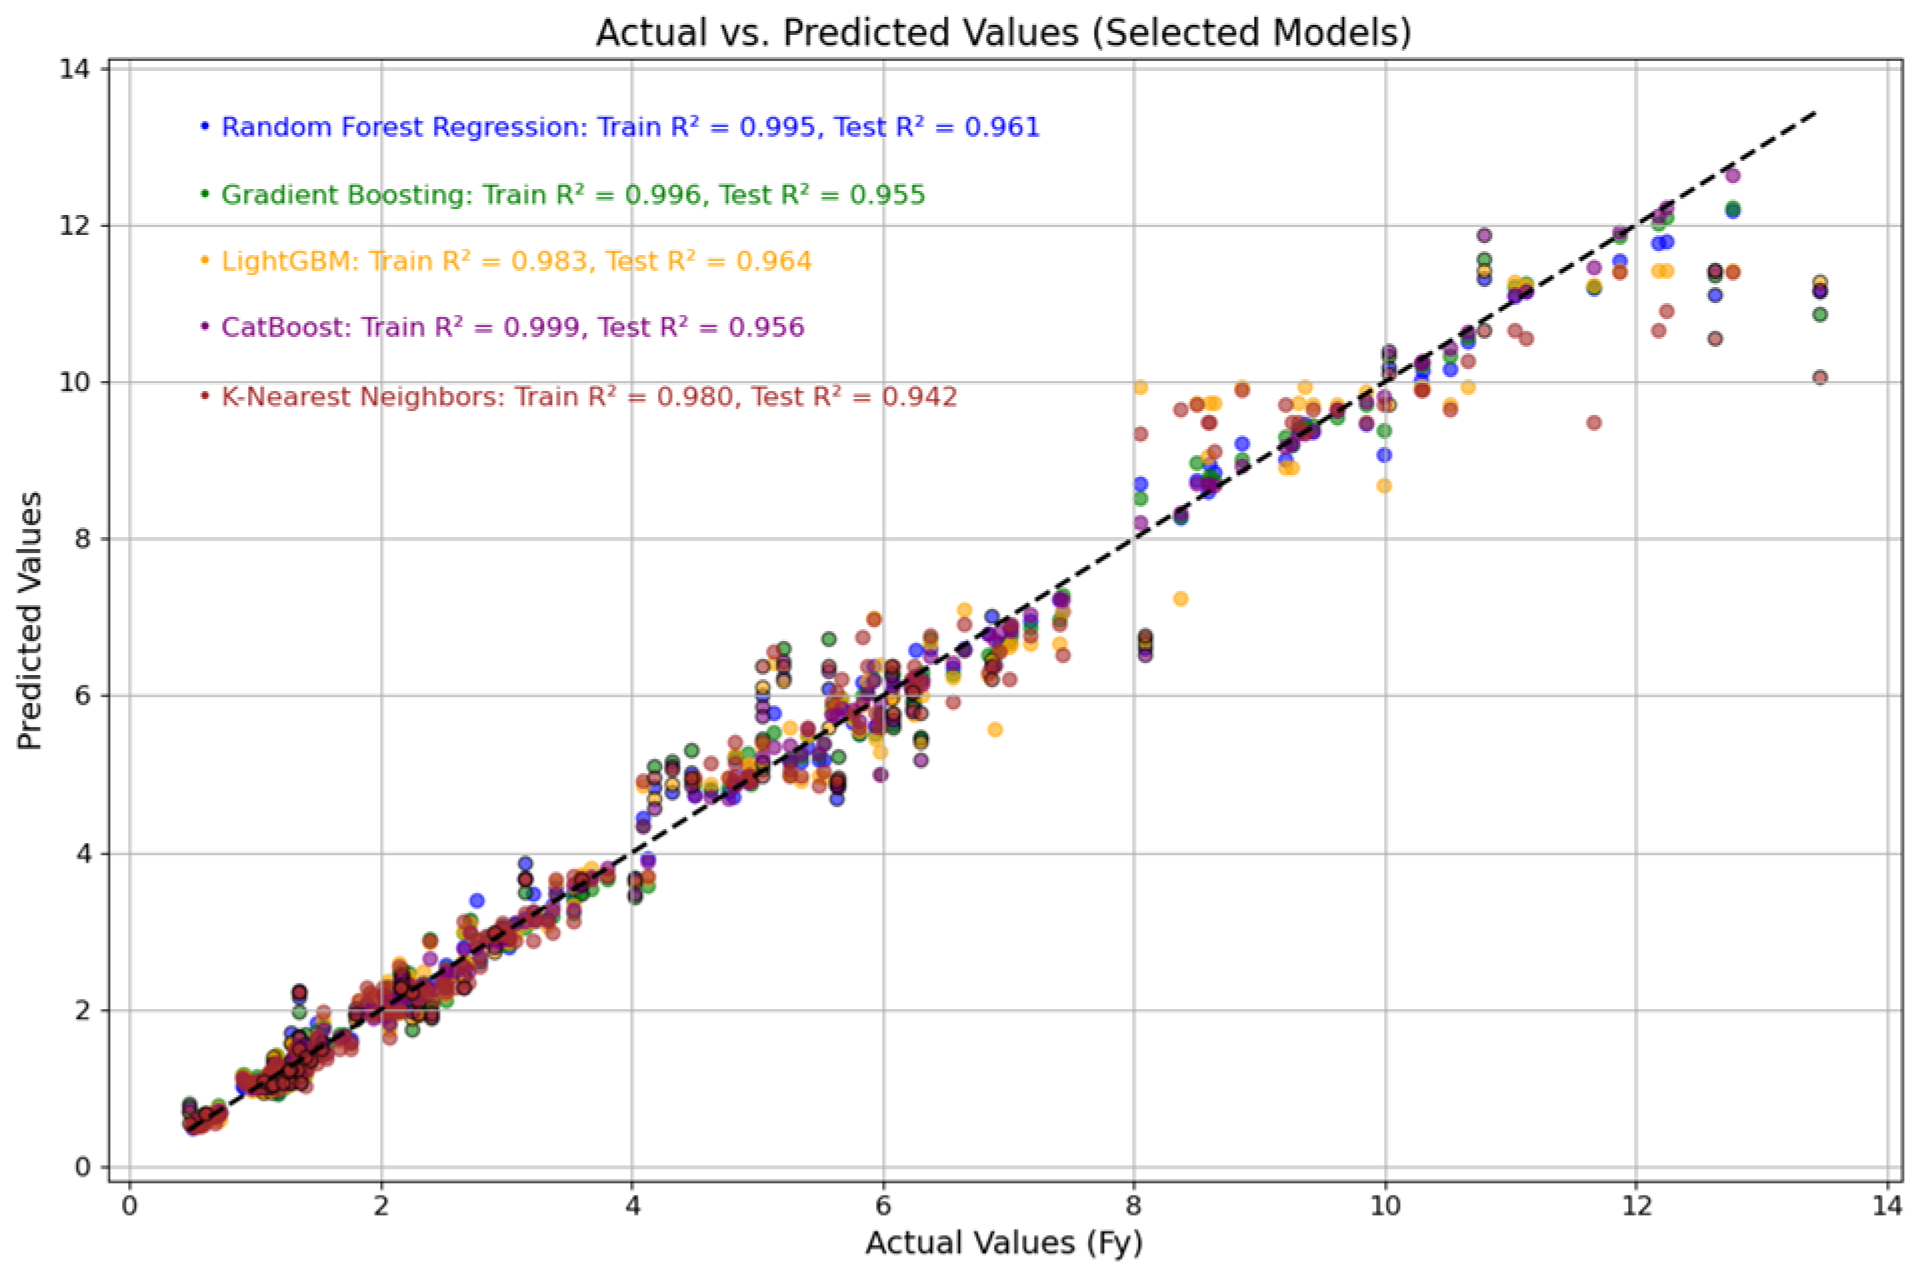
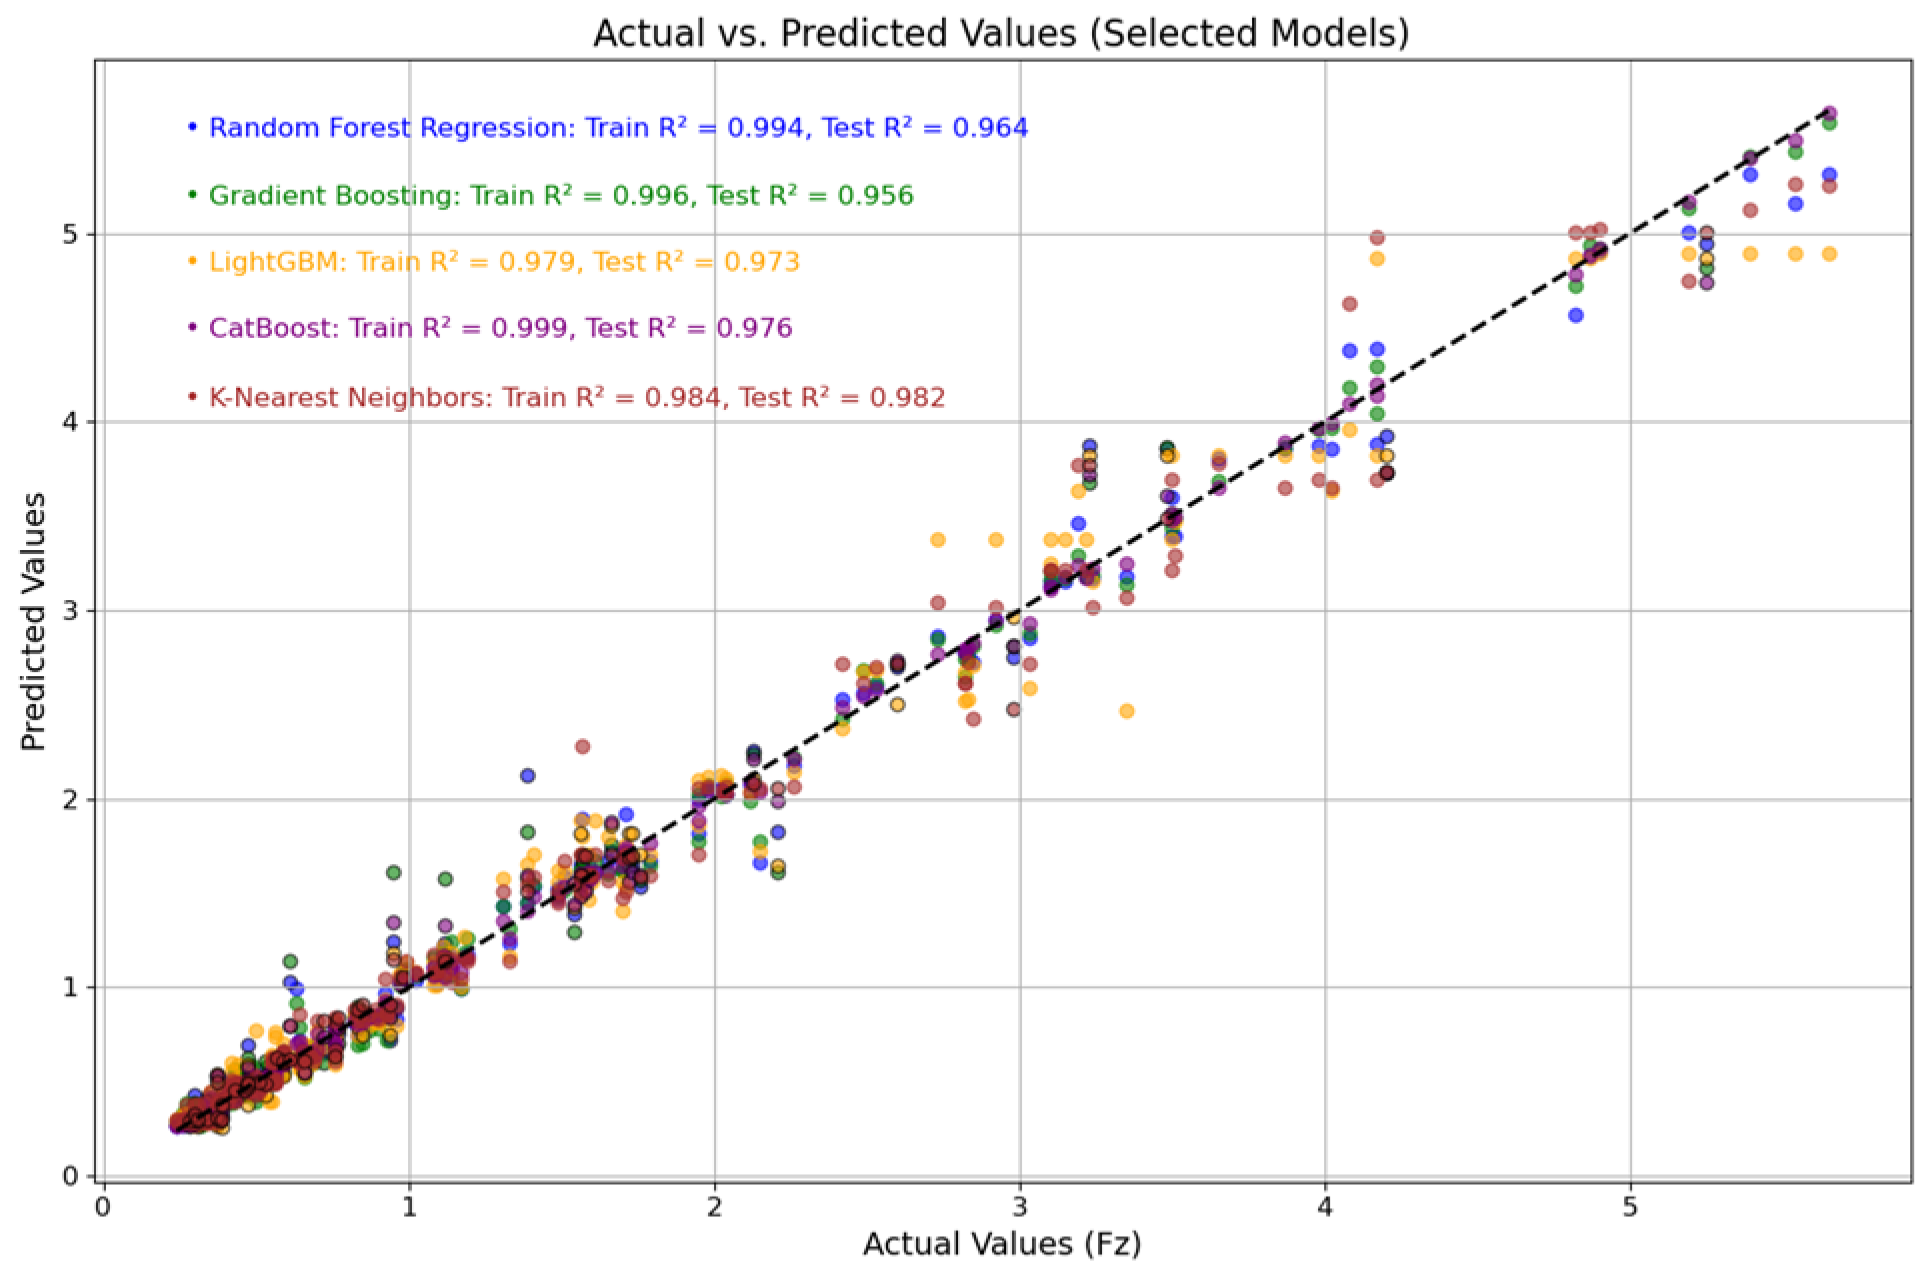
3.2. Predictive Modeling of Cutting Forces

ML algorithms have become pivotal tools for predicting machining responses, such as cutting forces, across various manufacturing processes. Several studies have demonstrated that models like SVR, ANN, RFR, and GBR can provide high accuracy in predicting complex, nonlinear interactions between process parameters and output responses [19,21,26]. The current study builds upon this foundation by evaluating the predictive performances of RFR, GBR, LightGBM, CatBoost, and KNN models in estimating the cutting force components Fx, Fy, and Fz in micro-milling processes.
Figure 7 illustrates the models’ performance in predicting the Fx force component. Among all, CatBoost achieved the highest predictive accuracy, yielding an R2 value of 0.9990 for training and 0.9642 for testing, coupled with the lowest mean absolute error (MAE) of 0.3889 and root mean square error (RMSE) of 0.6073 in testing. These results suggest strong generalization ability with minimal overfitting. Notably, LightGBM and KNN also performed well, with test R2 values of 0.9698 and 0.9707, respectively, although their higher MAE values suggest comparatively less robustness. This observation aligns with findings reported in previous research [19], which indicated that CatBoost and ANN outperformed other models in predicting cutting force in AISI 4340 alloy turning.
Such predictive precision is crucial for real-time process monitoring and adaptive control systems, where anticipating cutting forces can help avoid tool breakage, improve surface finish, and optimize machining efficiency.
In the prediction of the Fy component (Figure 8), CatBoost once again showed the best performance with R2 values of 0.9987 (training) and 0.9563 (testing). Its RMSE and MAE values (0.6481 and 0.4607, respectively) indicate a slightly increased error, potentially due to model sensitivity to minor outliers. RFR and LightGBM also yielded competitive results, both exceeding 0.96 in test R2, which is consistent with previous studies [26], where RFR and SVR effectively captured milling force variations across different cutting speeds and feed rates.
Despite slightly higher errors in Fy prediction, the models still demonstrate acceptable performance levels for integration into smart manufacturing platforms where force feedback is essential for closed-loop control.
Figure 9 shows that all models performed exceptionally in predicting the thrust force (Fz). CatBoost attained the best balance, with the highest test R2 (0.9763) and lowest MAE (0.1126) and RMSE (0.1688). While KNN slightly surpassed CatBoost in R2 (0.9818), its higher error values suggest that CatBoost achieved better overall accuracy. This aligns with the findings reported in [22], which highlighted that advanced ML models exhibit superior predictive stability and robustness for cutting force estimations in high-speed machining.
As detailed in Table 6, CatBoost consistently provided superior performance across all cutting force components, with training R2 values exceeding 0.998 and balanced test accuracy, underscoring its strong generalization ability. This finding supports earlier work [21], which demonstrated that ANN and SVR, when properly tuned, can yield high-fidelity cutting force predictions. Nevertheless, models like RFR and GBR also offered competitive results, though with relatively higher error metrics in Fx and Fy predictions.
It is noteworthy that the Fz component exhibited the highest prediction accuracy among all force directions across all models. This may be attributed to the lower variance and greater stability of the thrust force in micro-milling, which is less sensitive to tool–workpiece dynamics compared to tangential (Fx) and radial (Fy) forces. Similar conclusions were drawn in earlier research [25], which emphasized the comparatively stable nature of the thrust force under varying cutting conditions.
The superior predictive performance for Fz also opens opportunities for integrating ML-based force models into digital twin systems, enabling more precise simulation and real-time optimization of micro-milling tasks in Industry 4.0 and 5.0 environments.

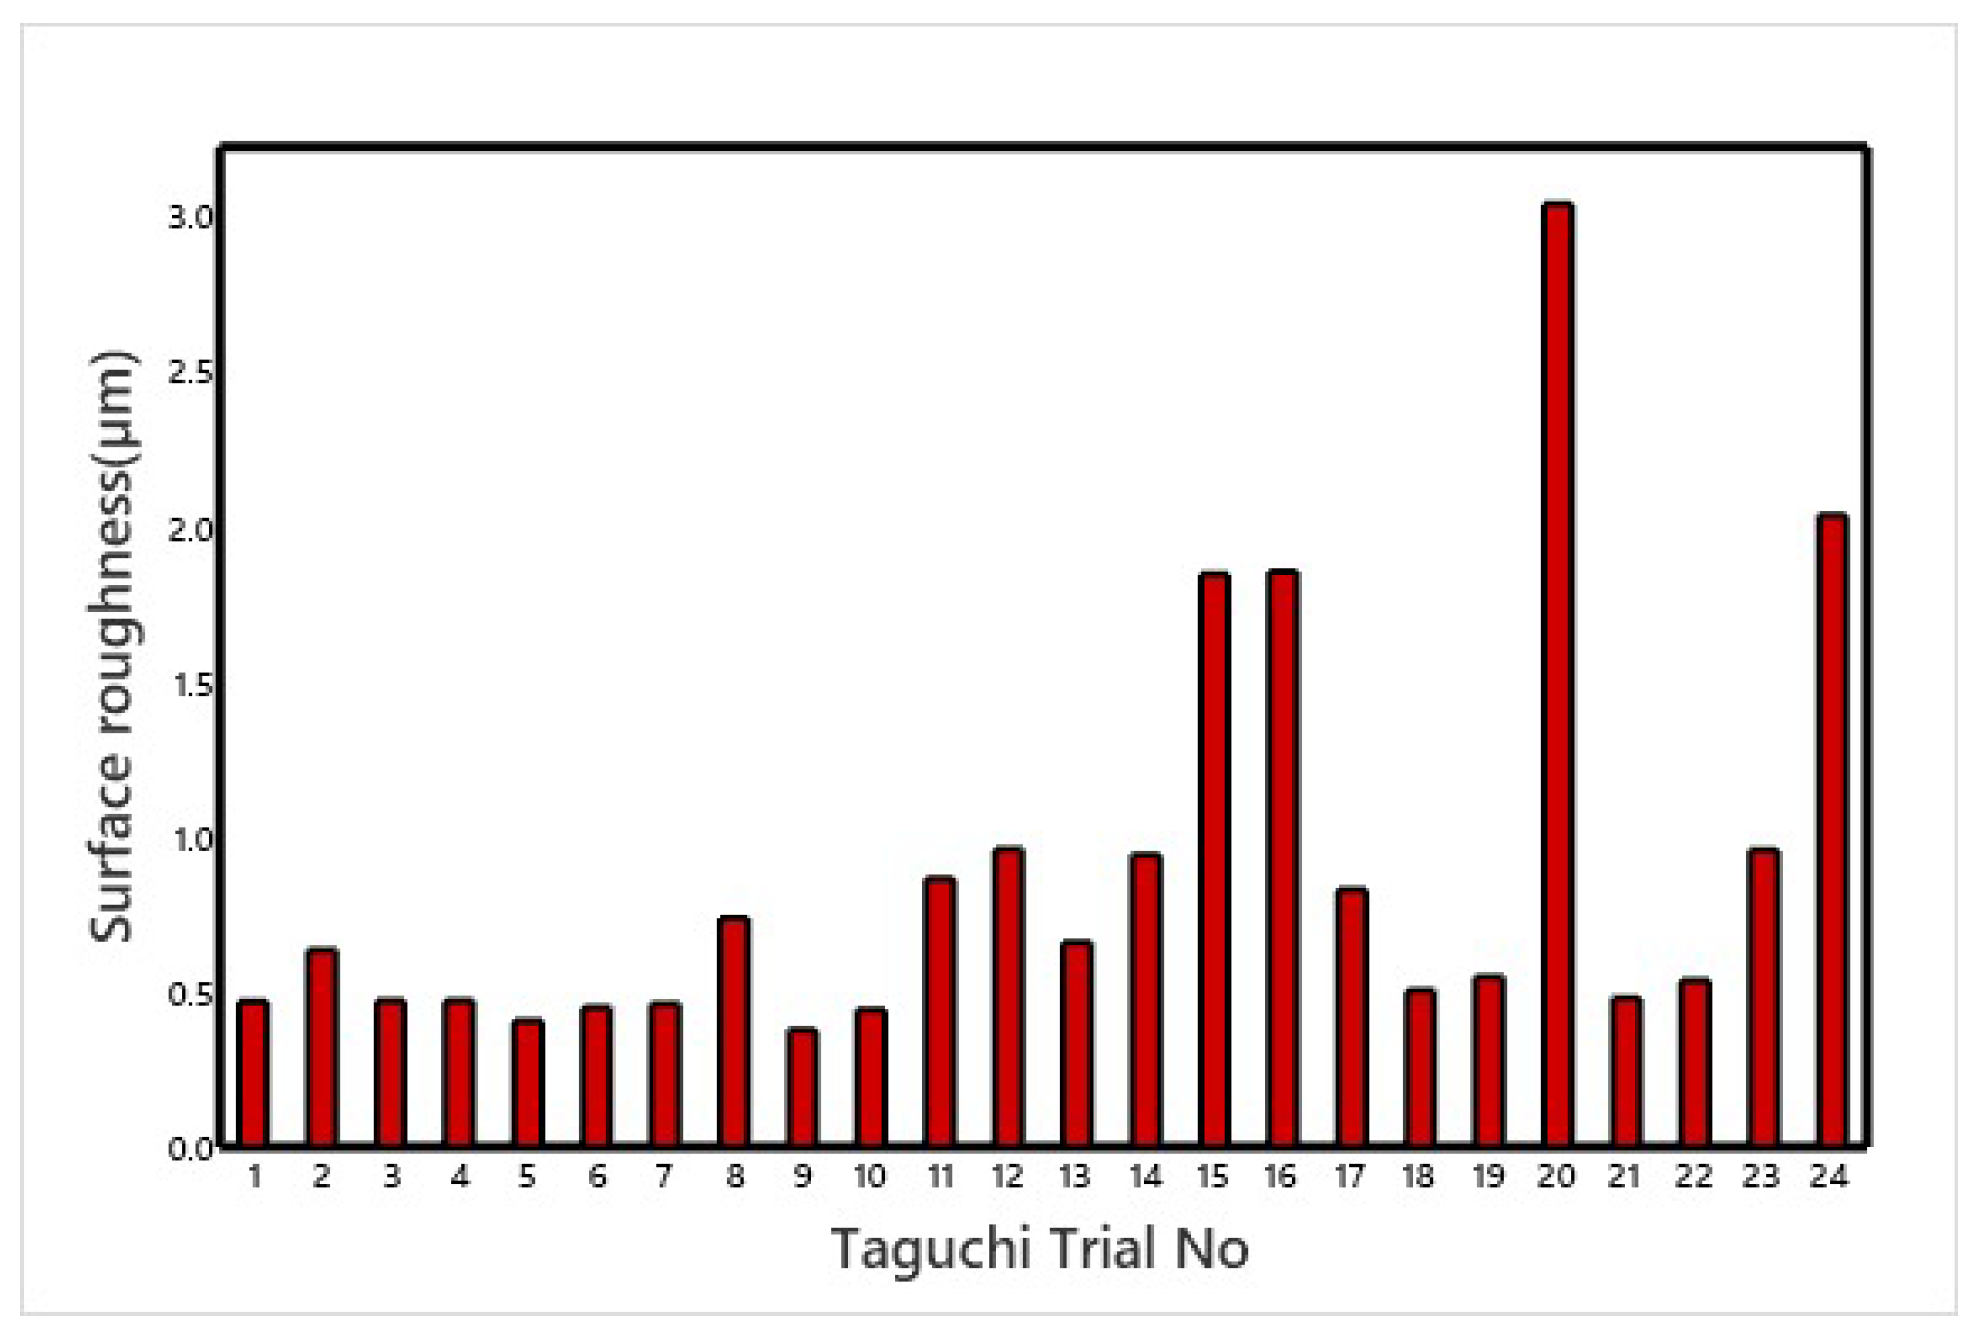
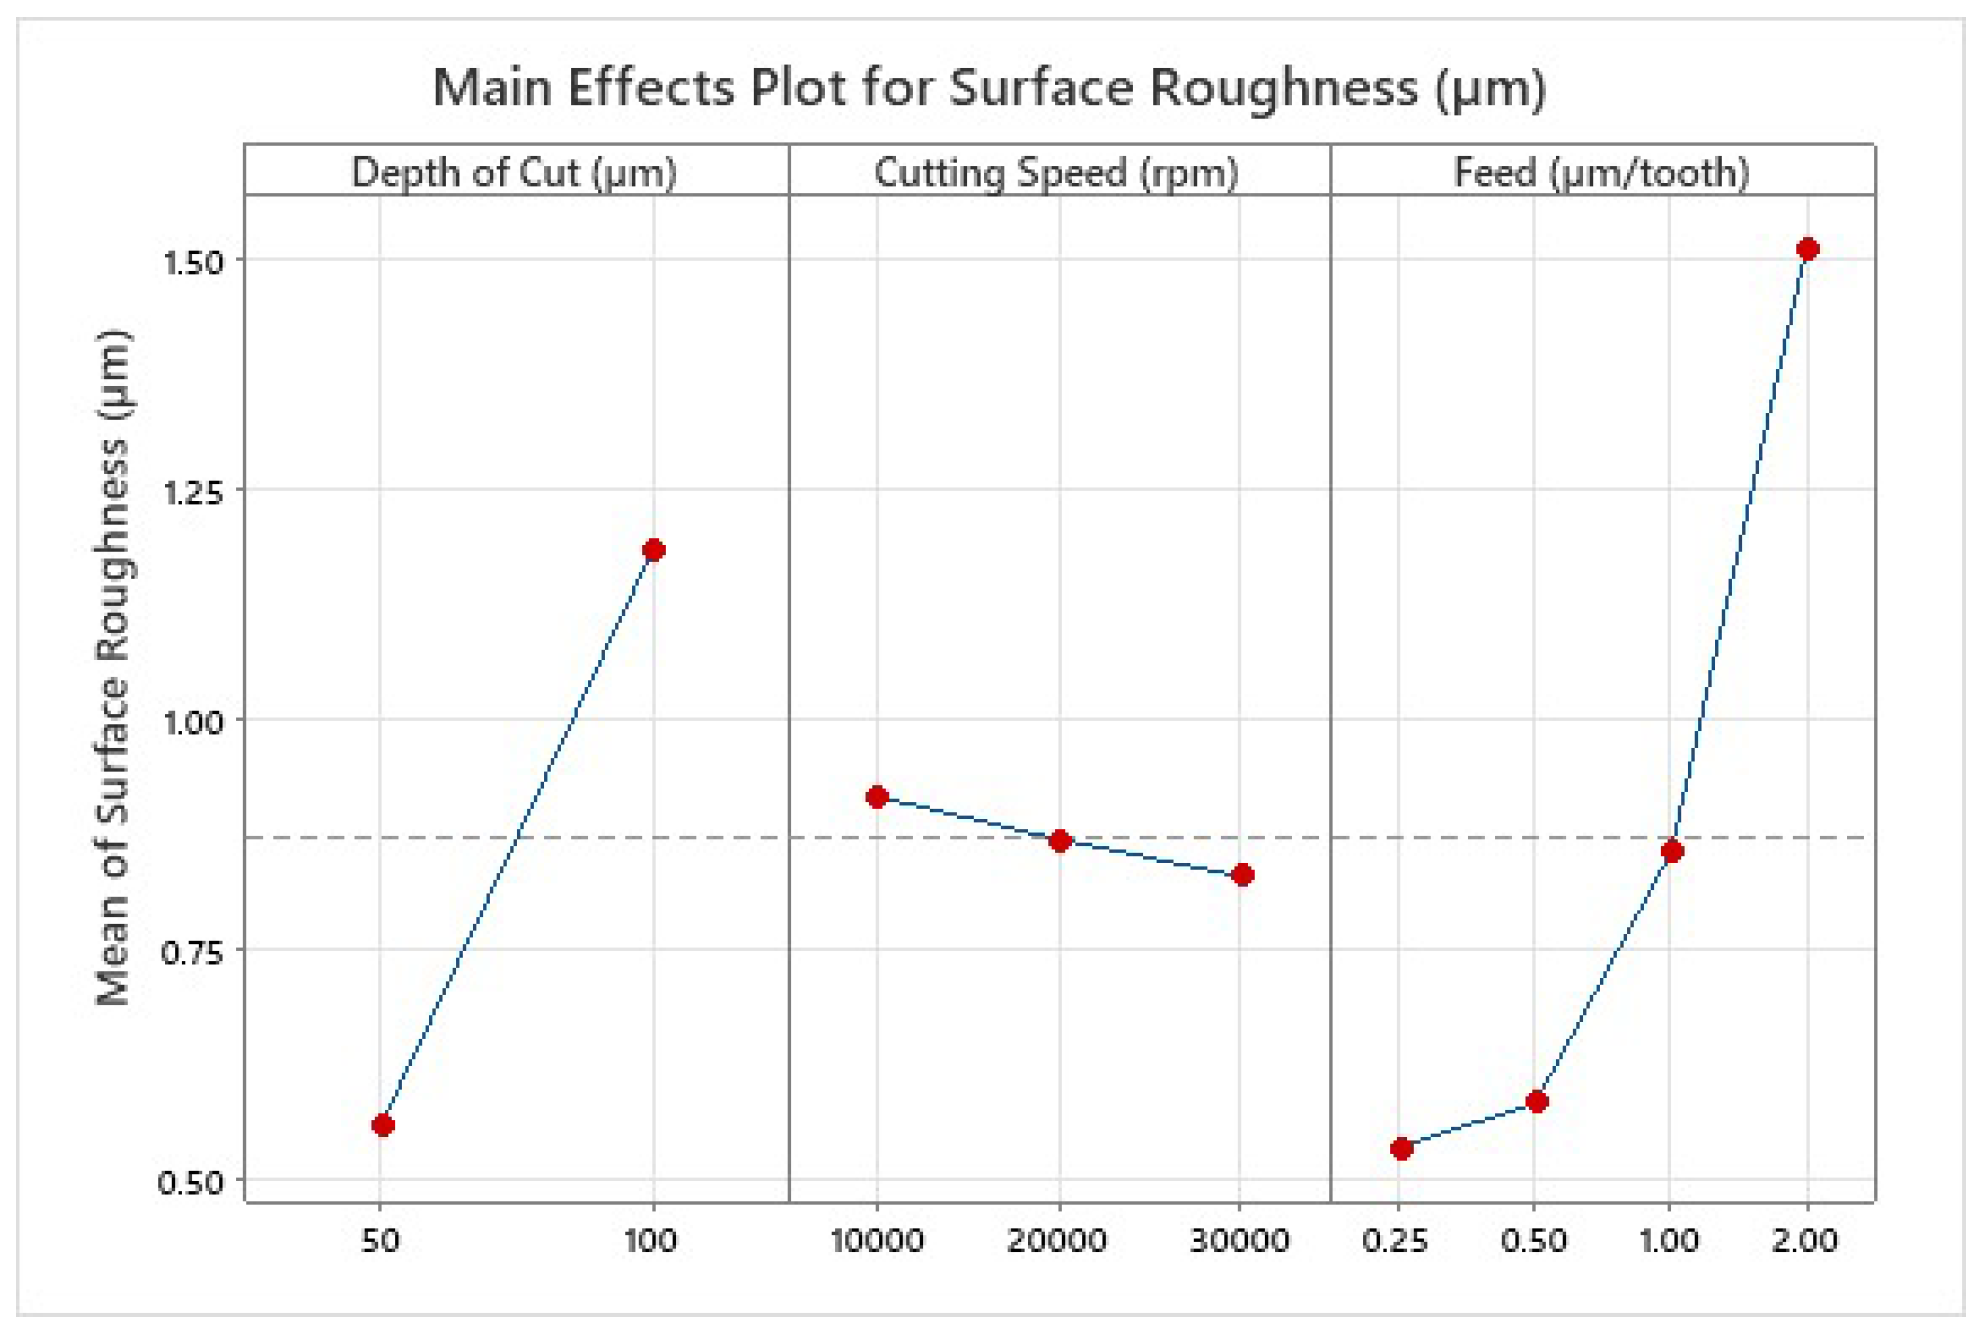
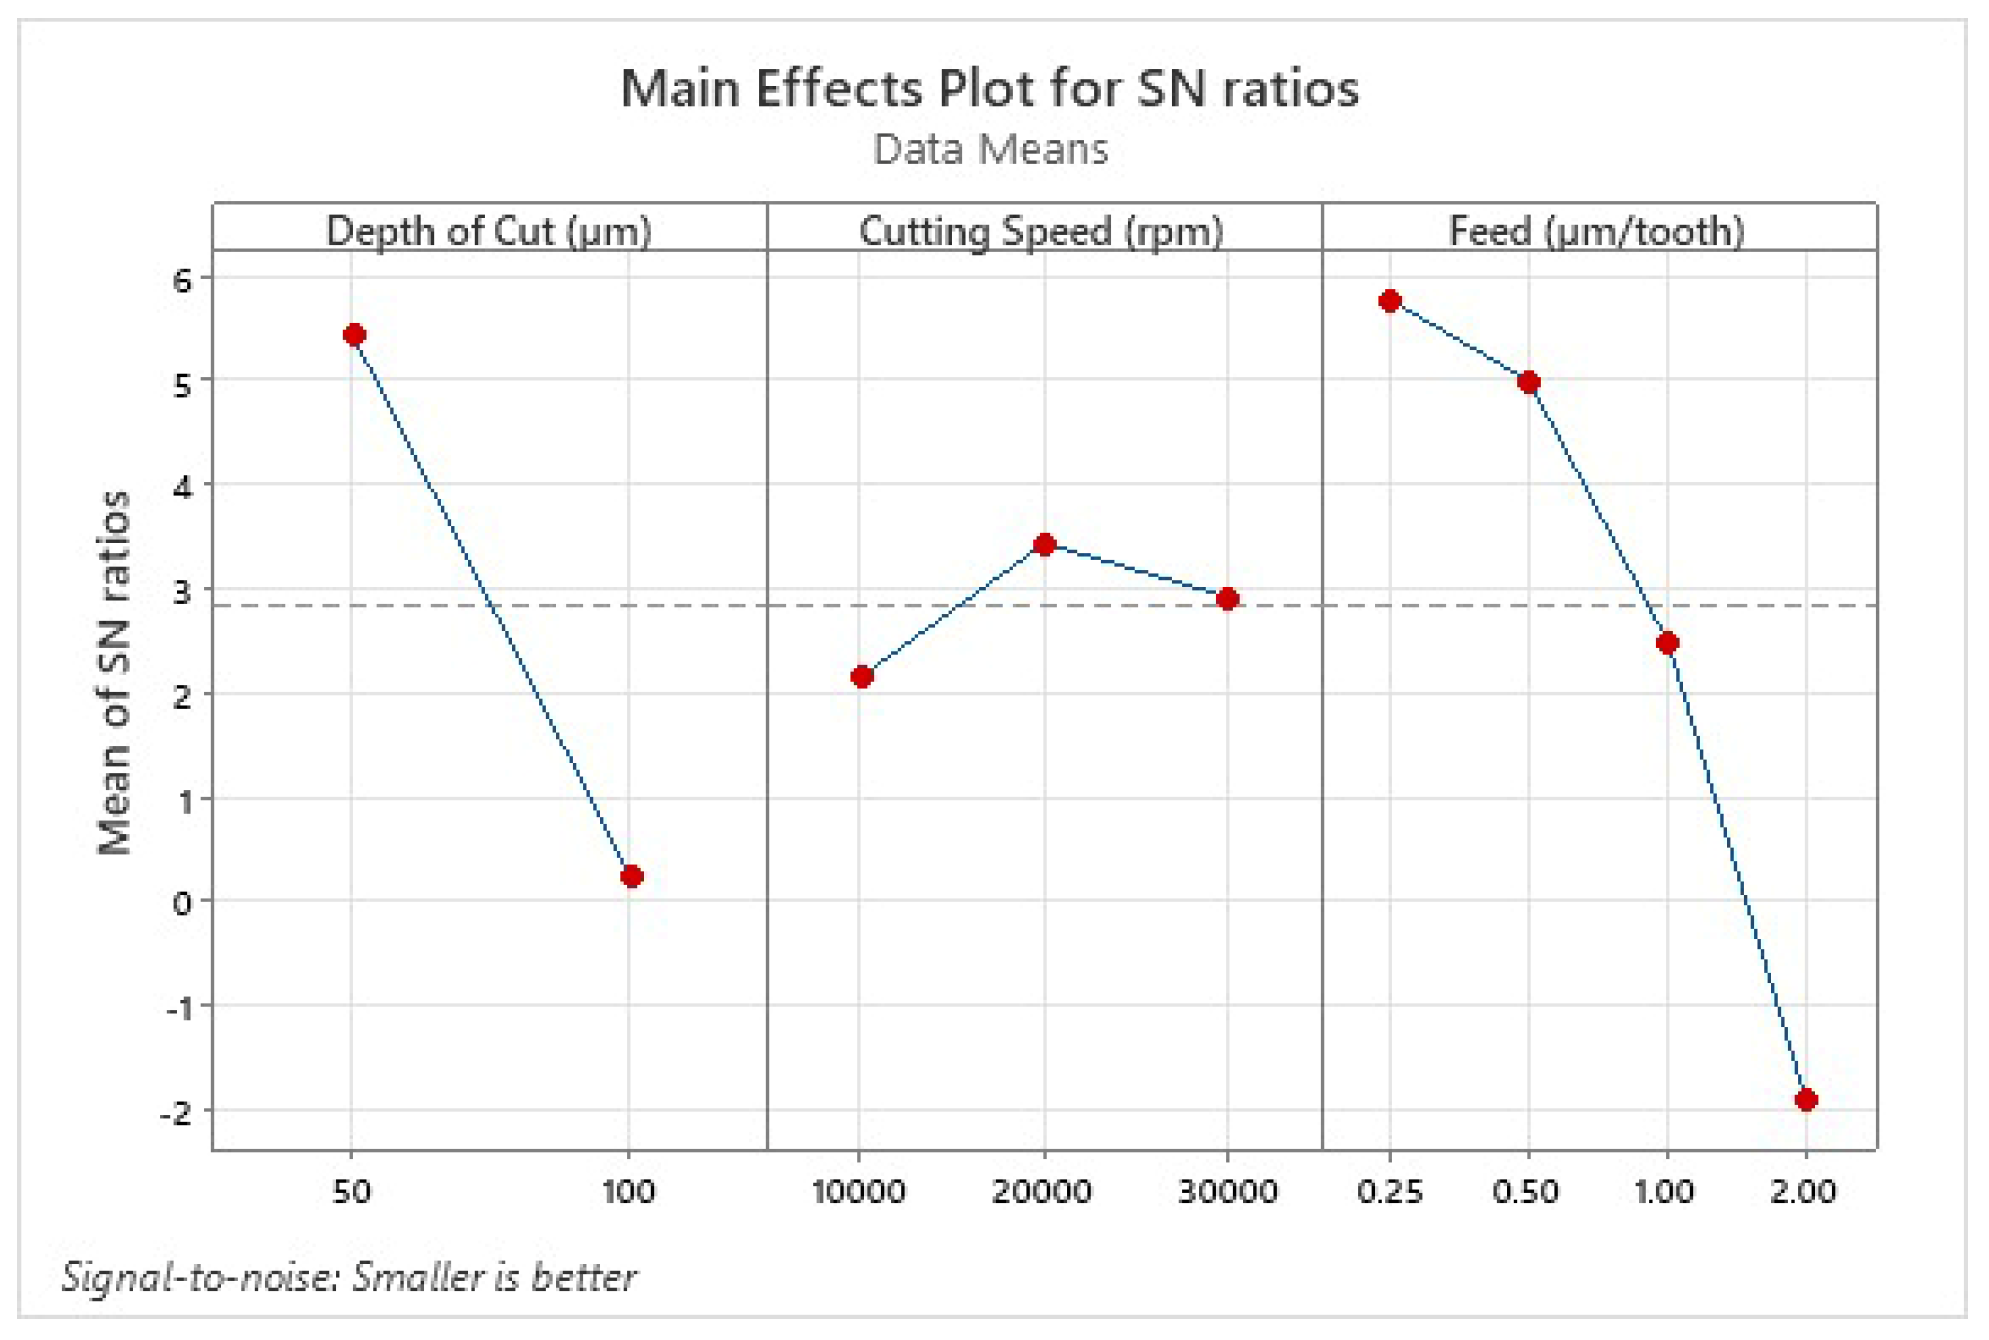
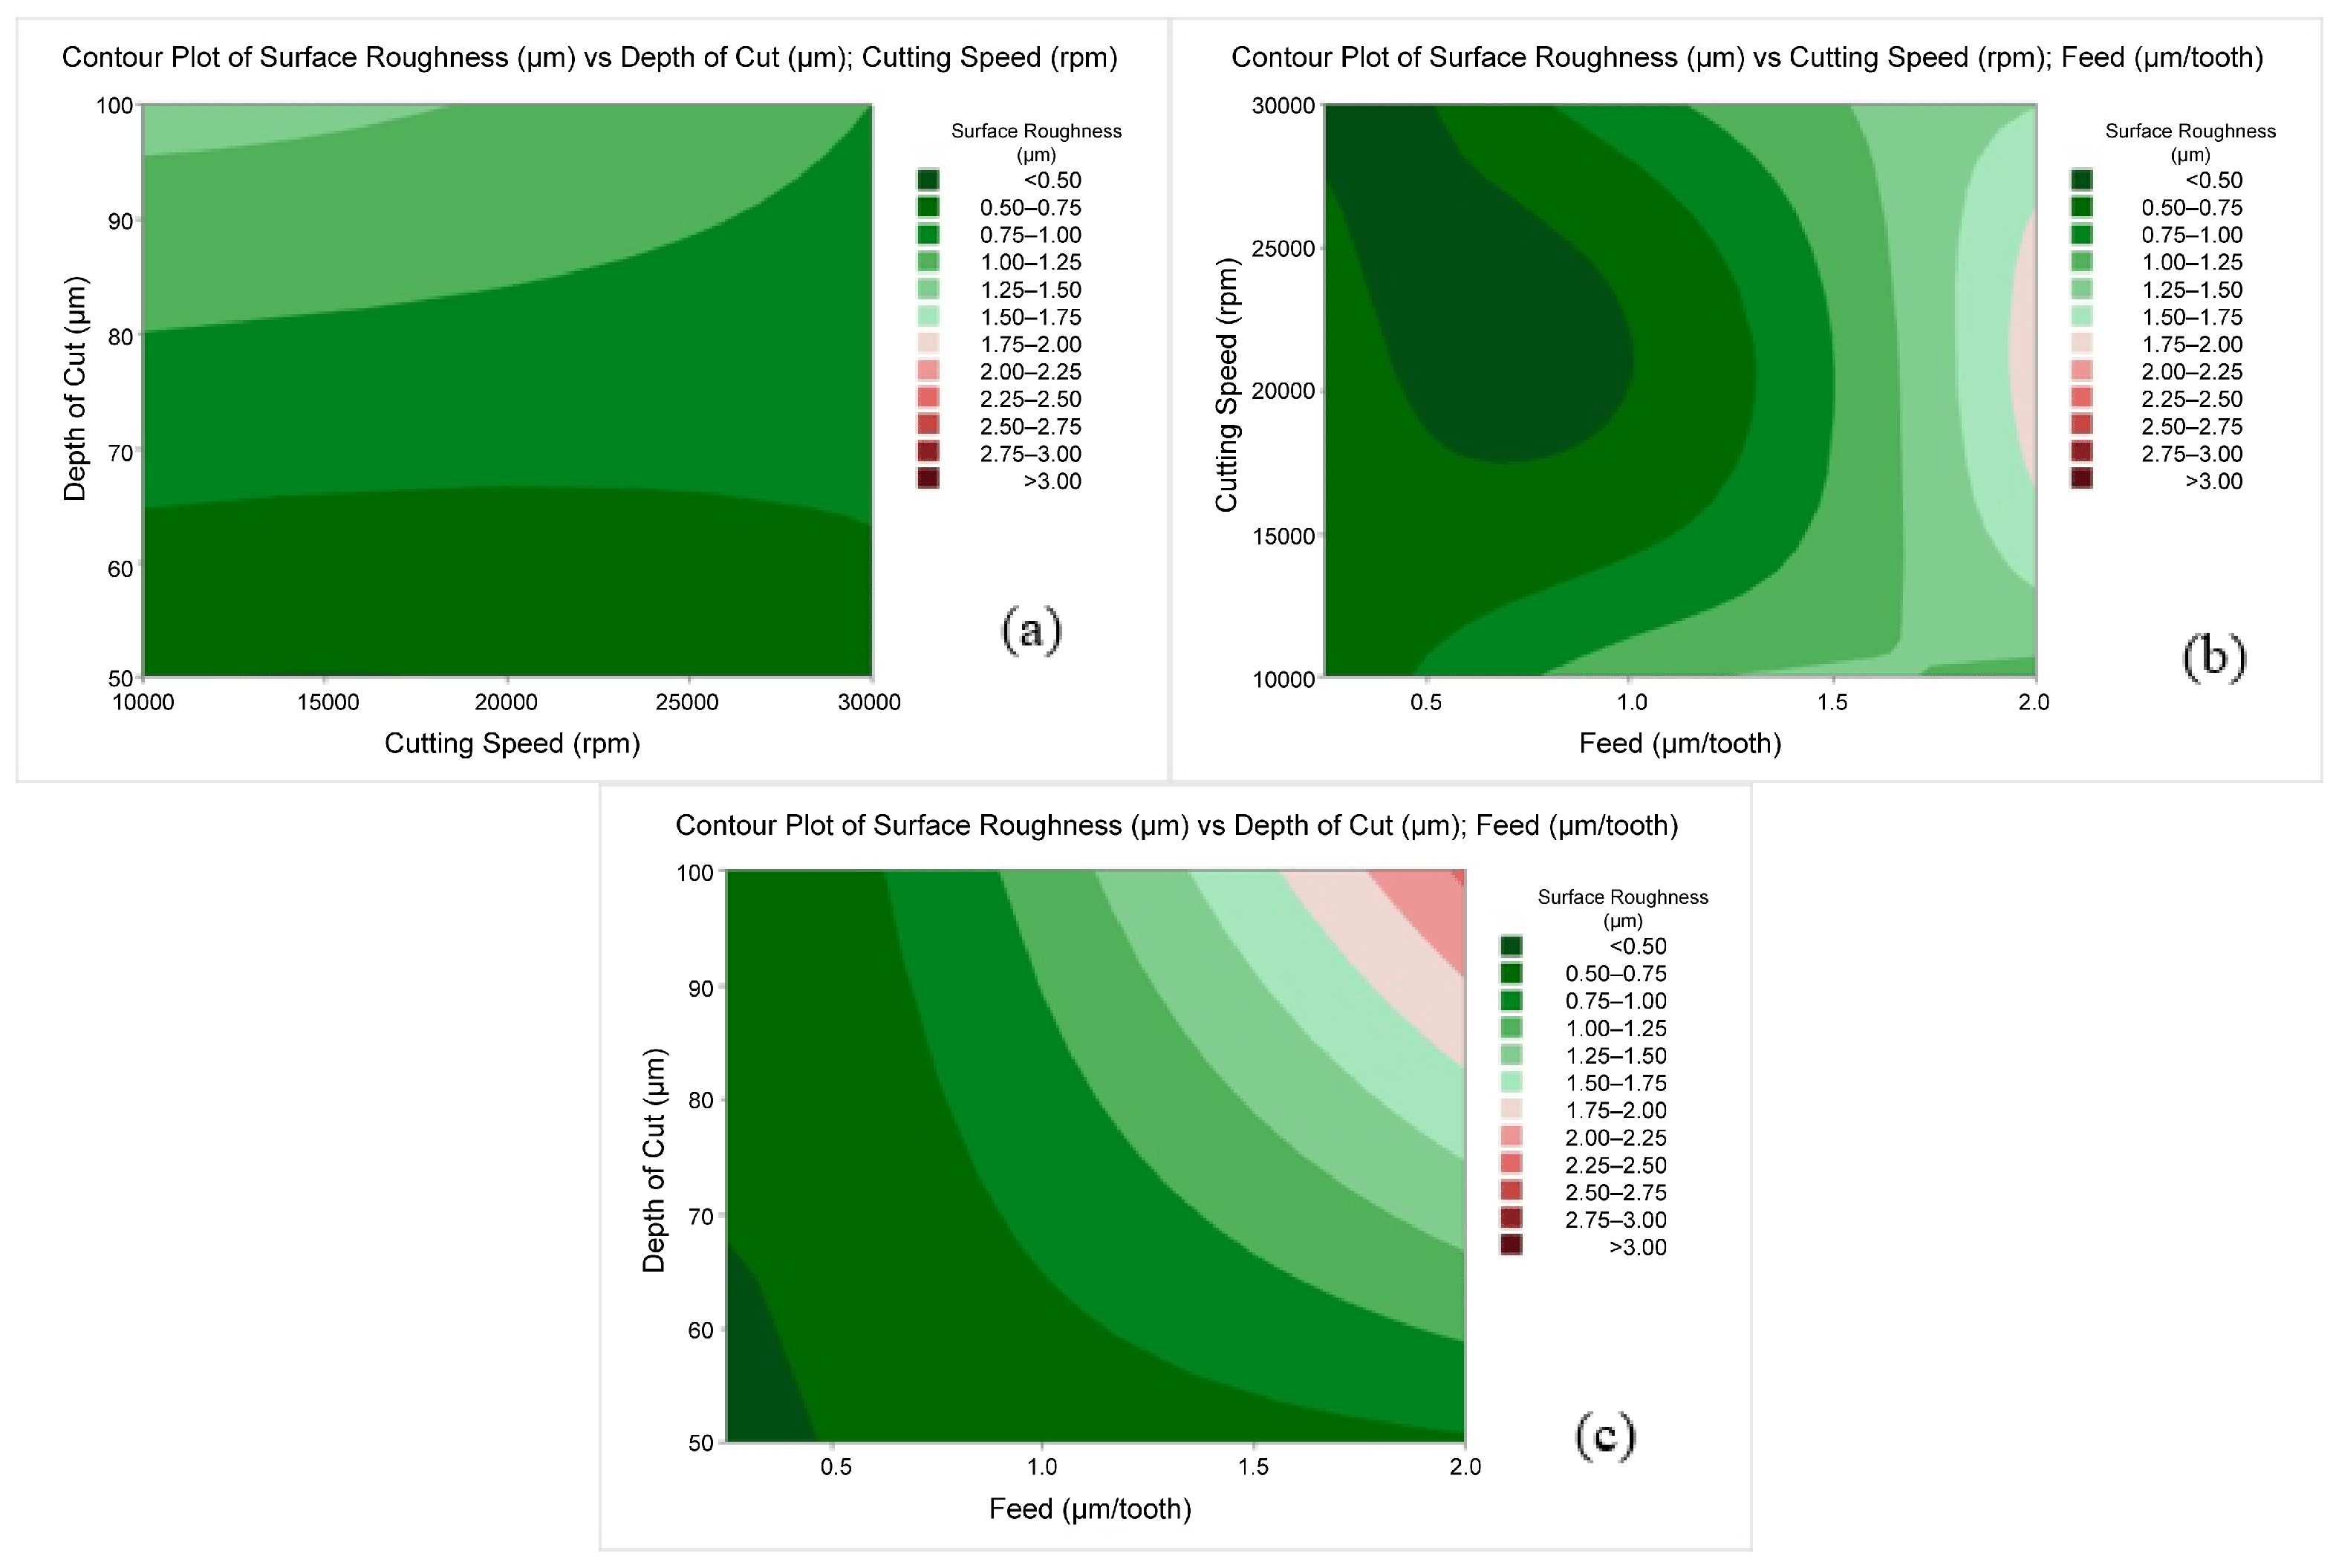
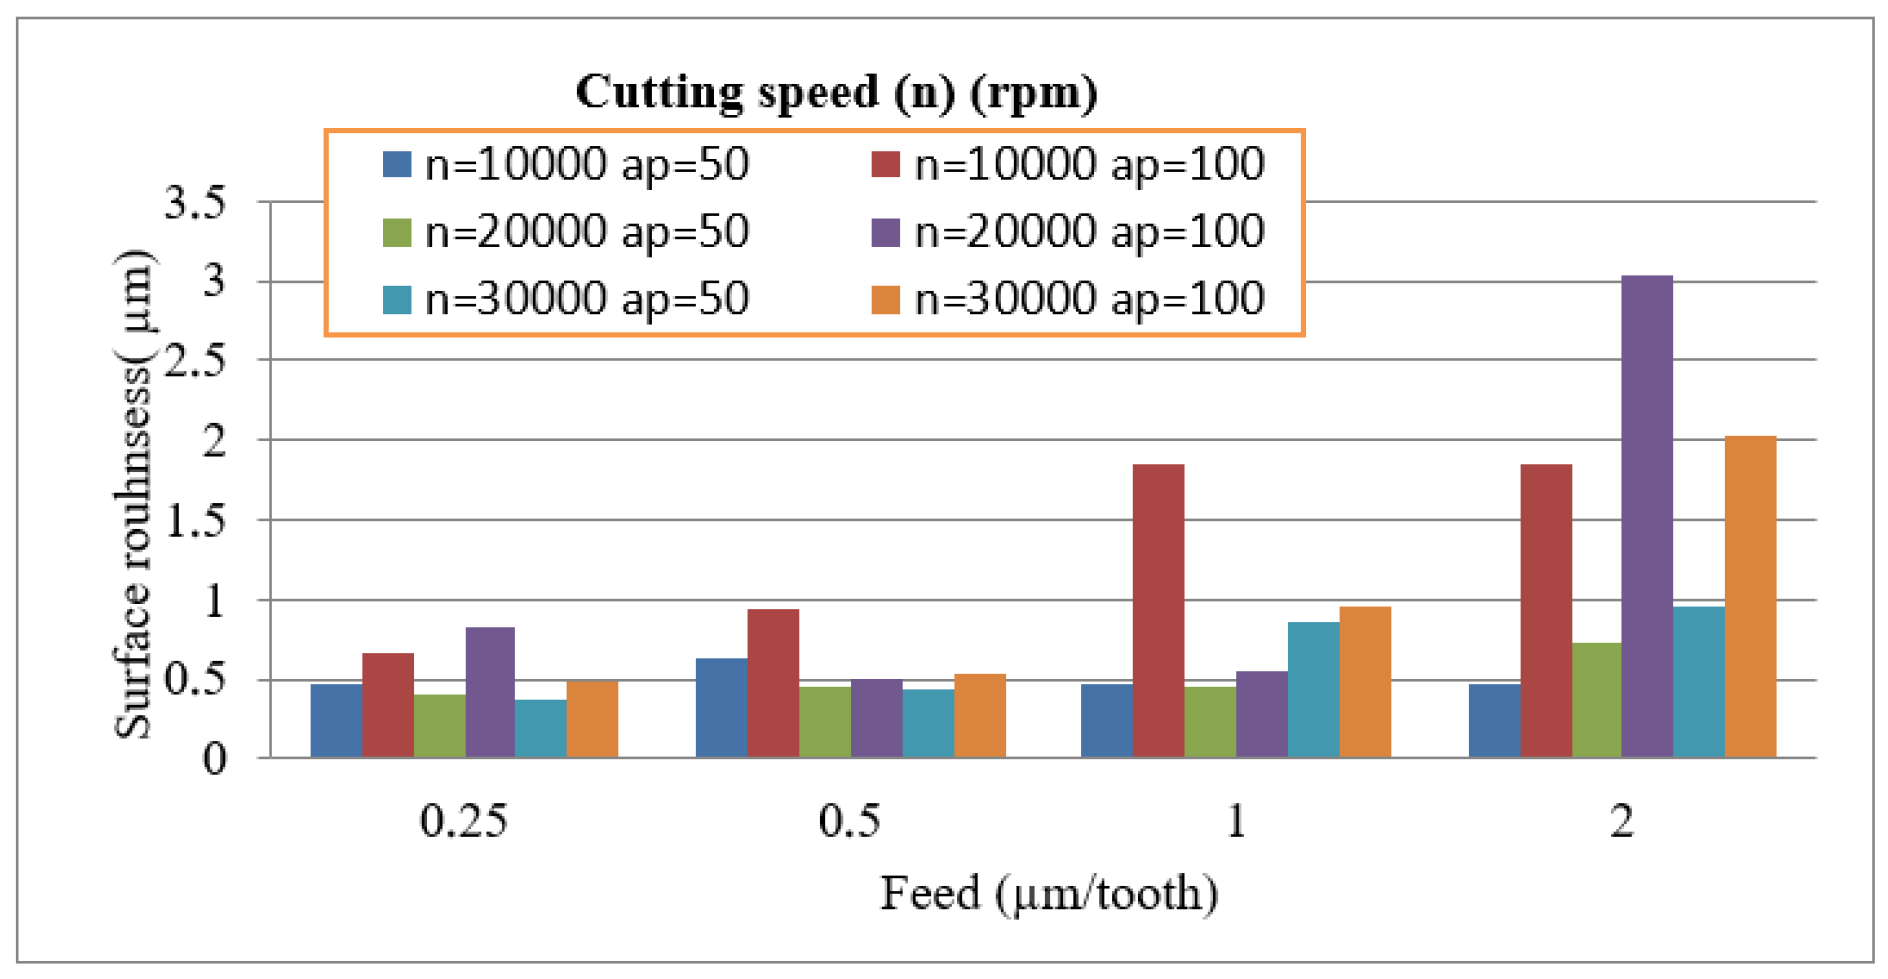
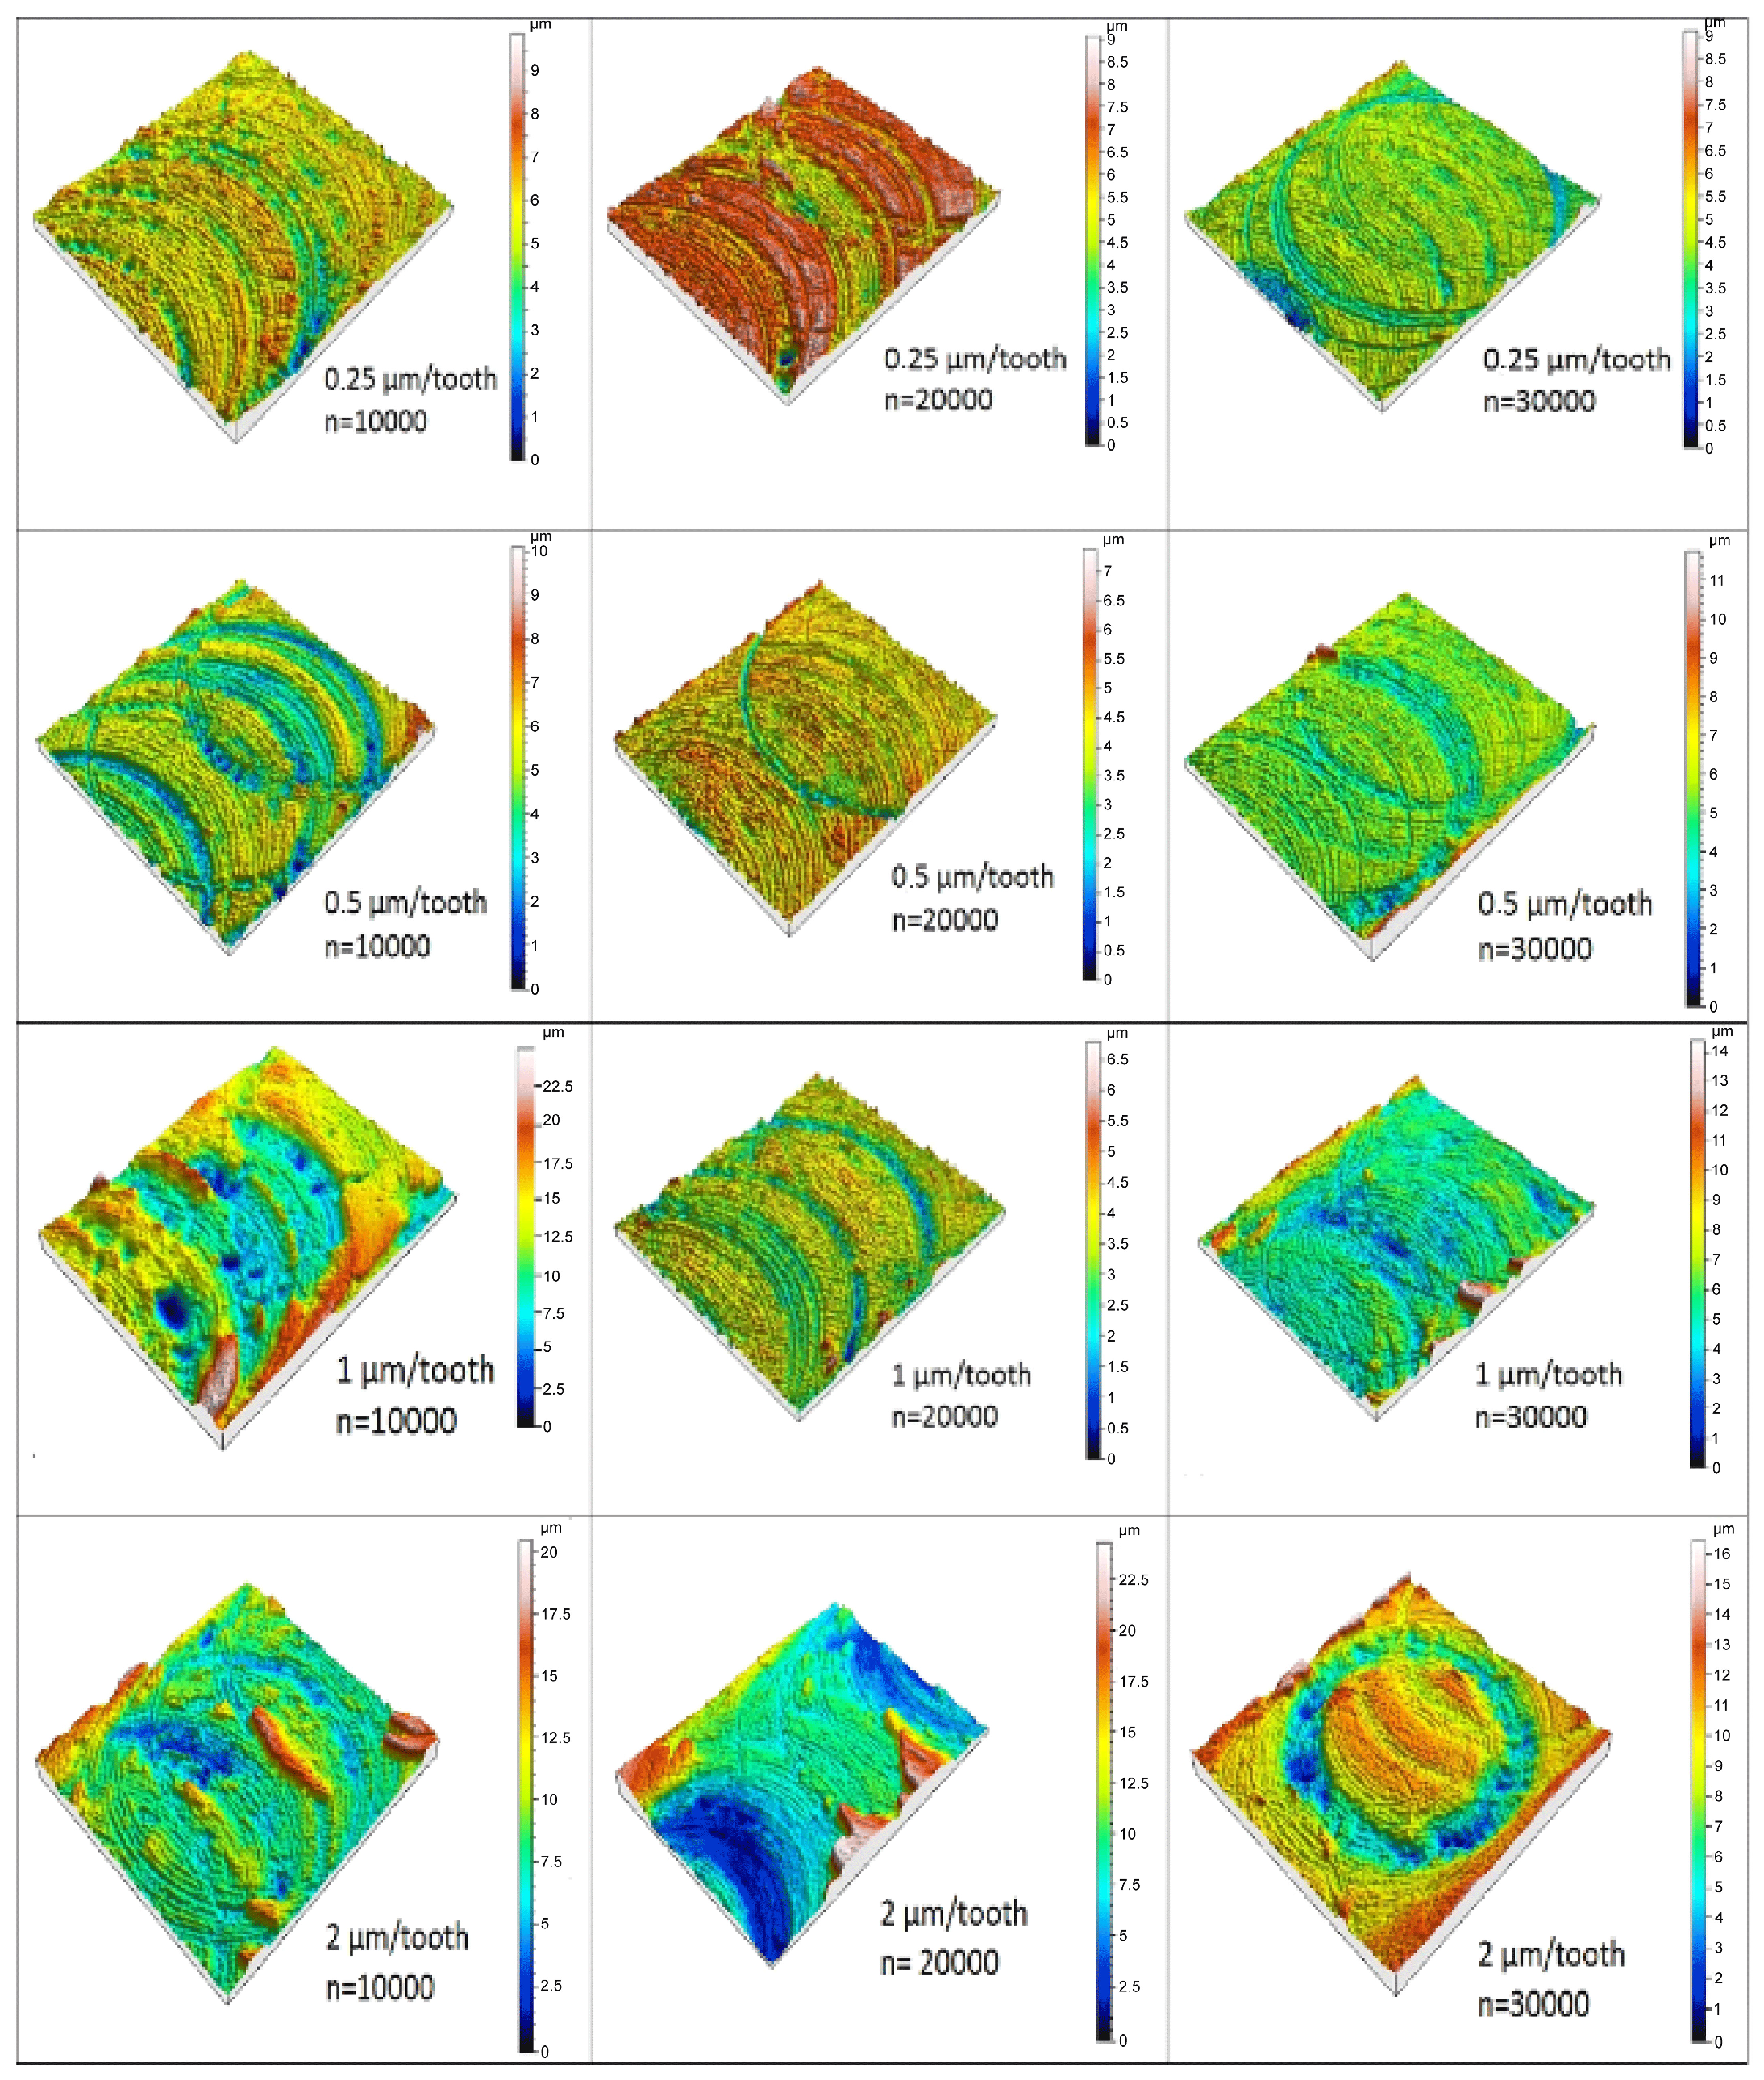
3.3. Effects of Cutting Parameters on Surface Roughness in Micro-Milling

The milling process is one of the most important performance indicators in terms of surface roughness and machining accuracy. The machining data obtained from this process is analyzed using variance analysis (ANOVA) and utilized to optimize machining parameters. With the increasing use of aluminum alloys, especially in sectors such as defense, automotive, and aviation, the milling process has become one of the most widely preferred methods for processing these materials. Figure 10 illustrates the surface roughness results of all Taguchi experimental designs.
These findings are not only statistically significant but also practically important, as they guide optimal parameter selection in precision-dependent industries such as aerospace and biomedical manufacturing.
Additionally, Figure 11 and Figure 12 illustrate the distribution of surface roughness (Ra) values based on the main effects and signal-to-noise (SN) ratio graphs within the framework of the Taguchi design method. The SN ratio is a statistical measure used to evaluate the robustness of different parameter combinations; a higher SN ratio indicates more consistent and lower-variance results. According to the analysis, surface roughness increases as both the depth of cut and feed rate rise. Moreover, when the cutting speed exceeds 15,000 rpm, surface quality deteriorates significantly due to accelerated tool wear from elevated temperatures and cutting forces. Increased material deformation and machining-induced vibrations also contribute to this decline in surface finish.
Such trends highlight the necessity for real-time process monitoring systems in high-speed micro-milling applications to proactively mitigate surface degradation.
In view of the experimental data obtained from the Taguchi trial sets, the Al10MgSi sample with a 100 µm depth of cut, a cutting speed of 20,000 rpm, and a feed rate of 2 µm/tooth exhibited the highest average Ra value of 3.03 µm. To facilitate a more detailed examination of bivariate relationships, contour diagrams are additionally provided, as shown in Figure 13.
In Figure 14, the surface roughness values (Ra) for cutting depths of 50 µm and 100 µm are compared on the same graph. This figure illustrates how surface roughness varies as a function of feed rate and spindle speed for different depths of cut. For the material machined at a 50 µm cutting depth, Ra values increased proportionally with the feed rate, and were particularly pronounced at a spindle speed of 30,000 rpm. Similarly, for a 100 µm cutting depth, the areal surface roughness (Sa) values showed a marked increase with increasing feed rate. This relationship is associated with the higher material removal rate: As feed rate increases, the volume of material removed per unit time also rises, which causes more pronounced fluctuations in the surface profile and leads to higher roughness values [50,51].
In contrast, higher spindle speeds tended to reduce surface roughness values. This effect is attributed to the formation of built-up edges along the tool’s cutting edges, which can smooth the machined surface [52].
These insights are particularly valuable for industrial applications, where they can be used to define adaptive control strategies within CNC systems to maintain optimal surface integrity under variable machining conditions.
Figure 15 and Figure 16 present 3D surface topography images obtained from a profilometer for cutting depths of 50 µm and 100 µm, respectively. These figures clearly illustrate the surface irregularities under the lowest parameter settings (fz = 0.25 µm/tooth and n = 10,000 rpm), where ploughing effects dominate. The visible irregular cutting marks result from the tool edge’s inability to fully remove material in a single pass, leading to residual deformation and overlapping tool paths in subsequent revolutions [53].
This visual evidence of tool–material interaction under suboptimal conditions underscores the importance of optimizing toolpath strategies and implementing predictive maintenance in high-precision micro-machining environments.

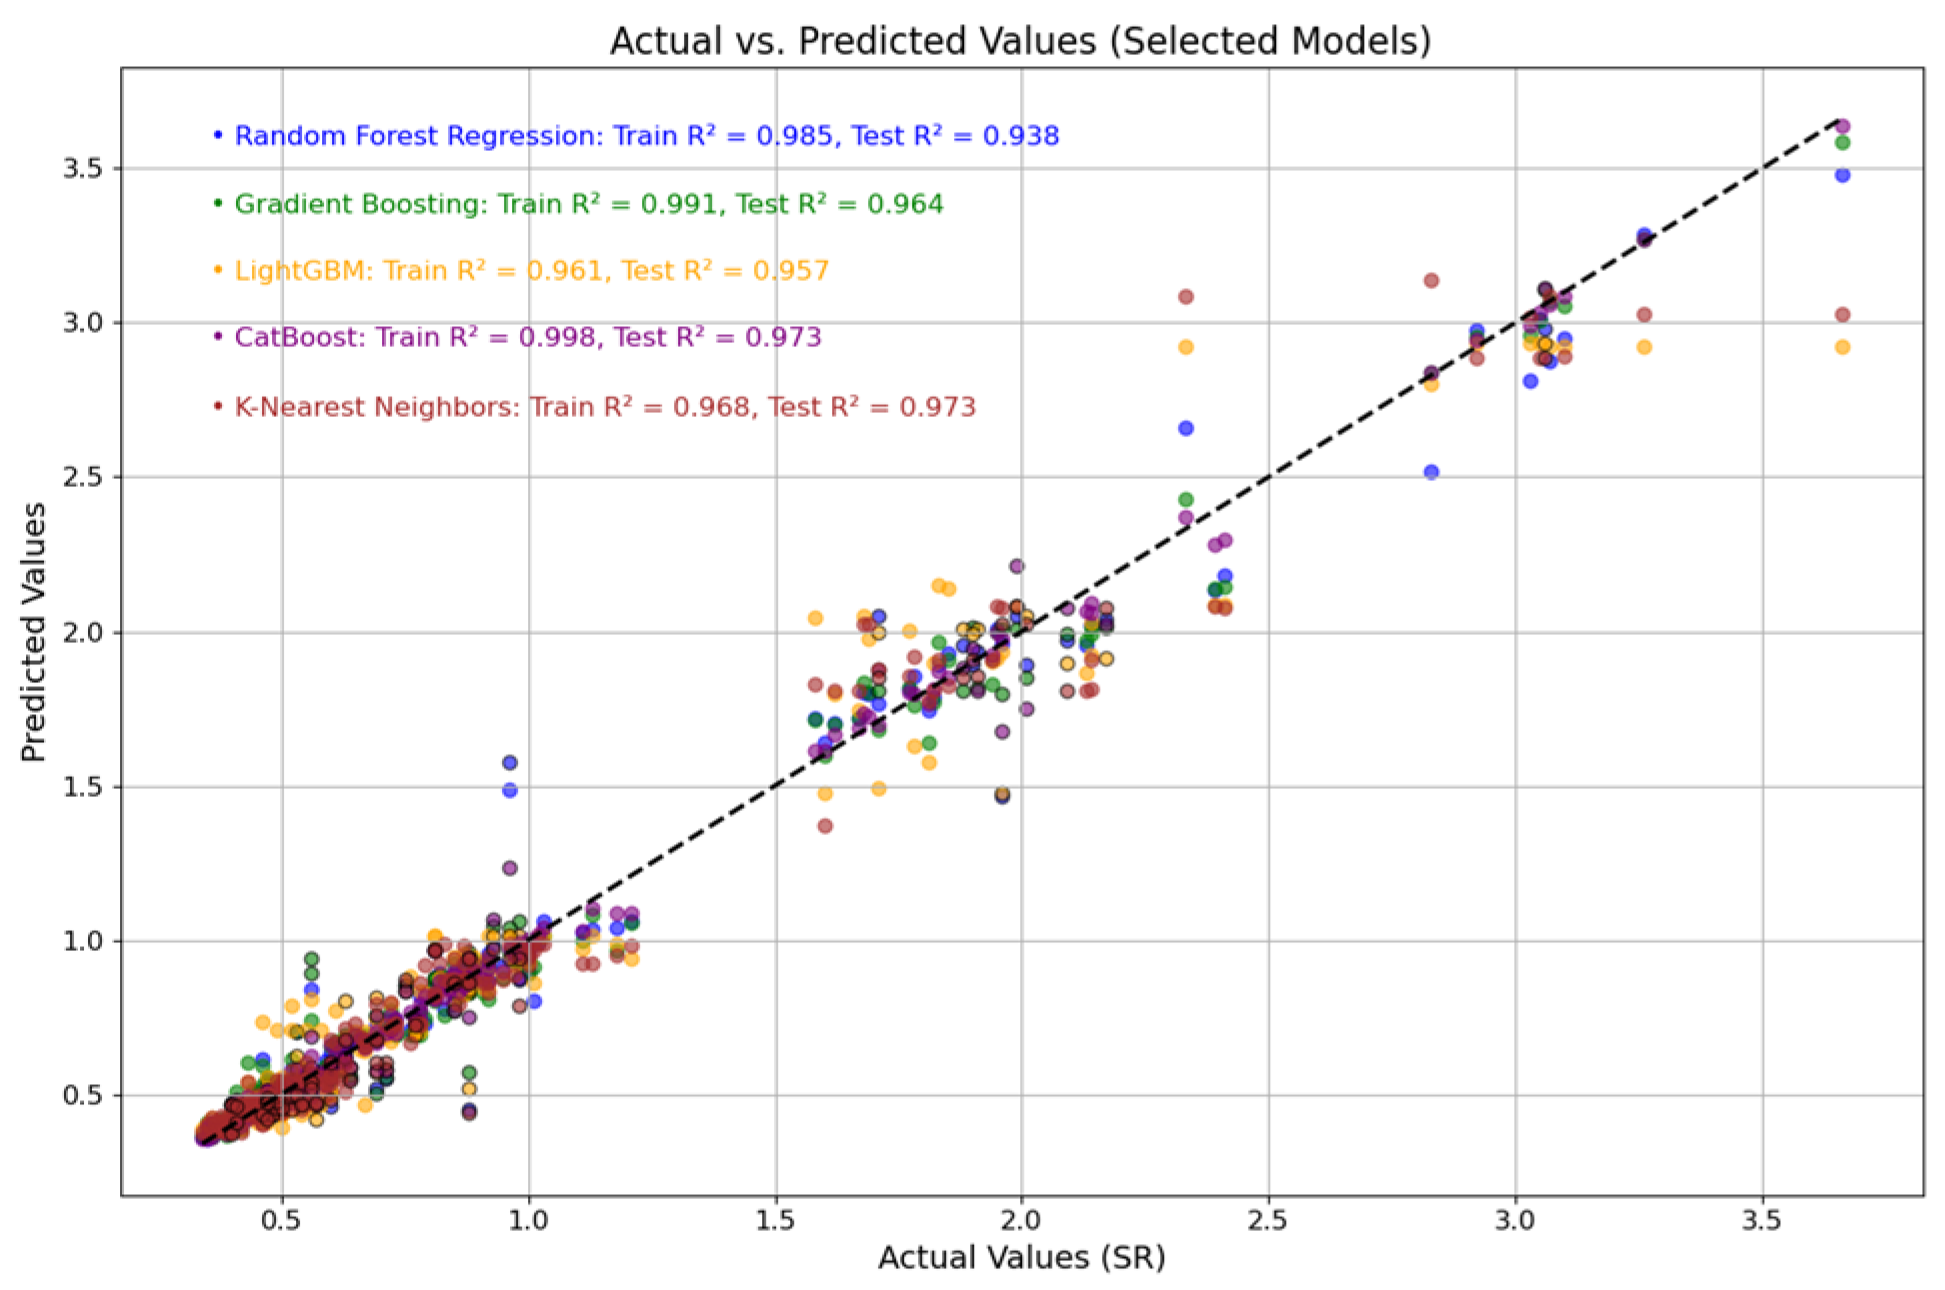
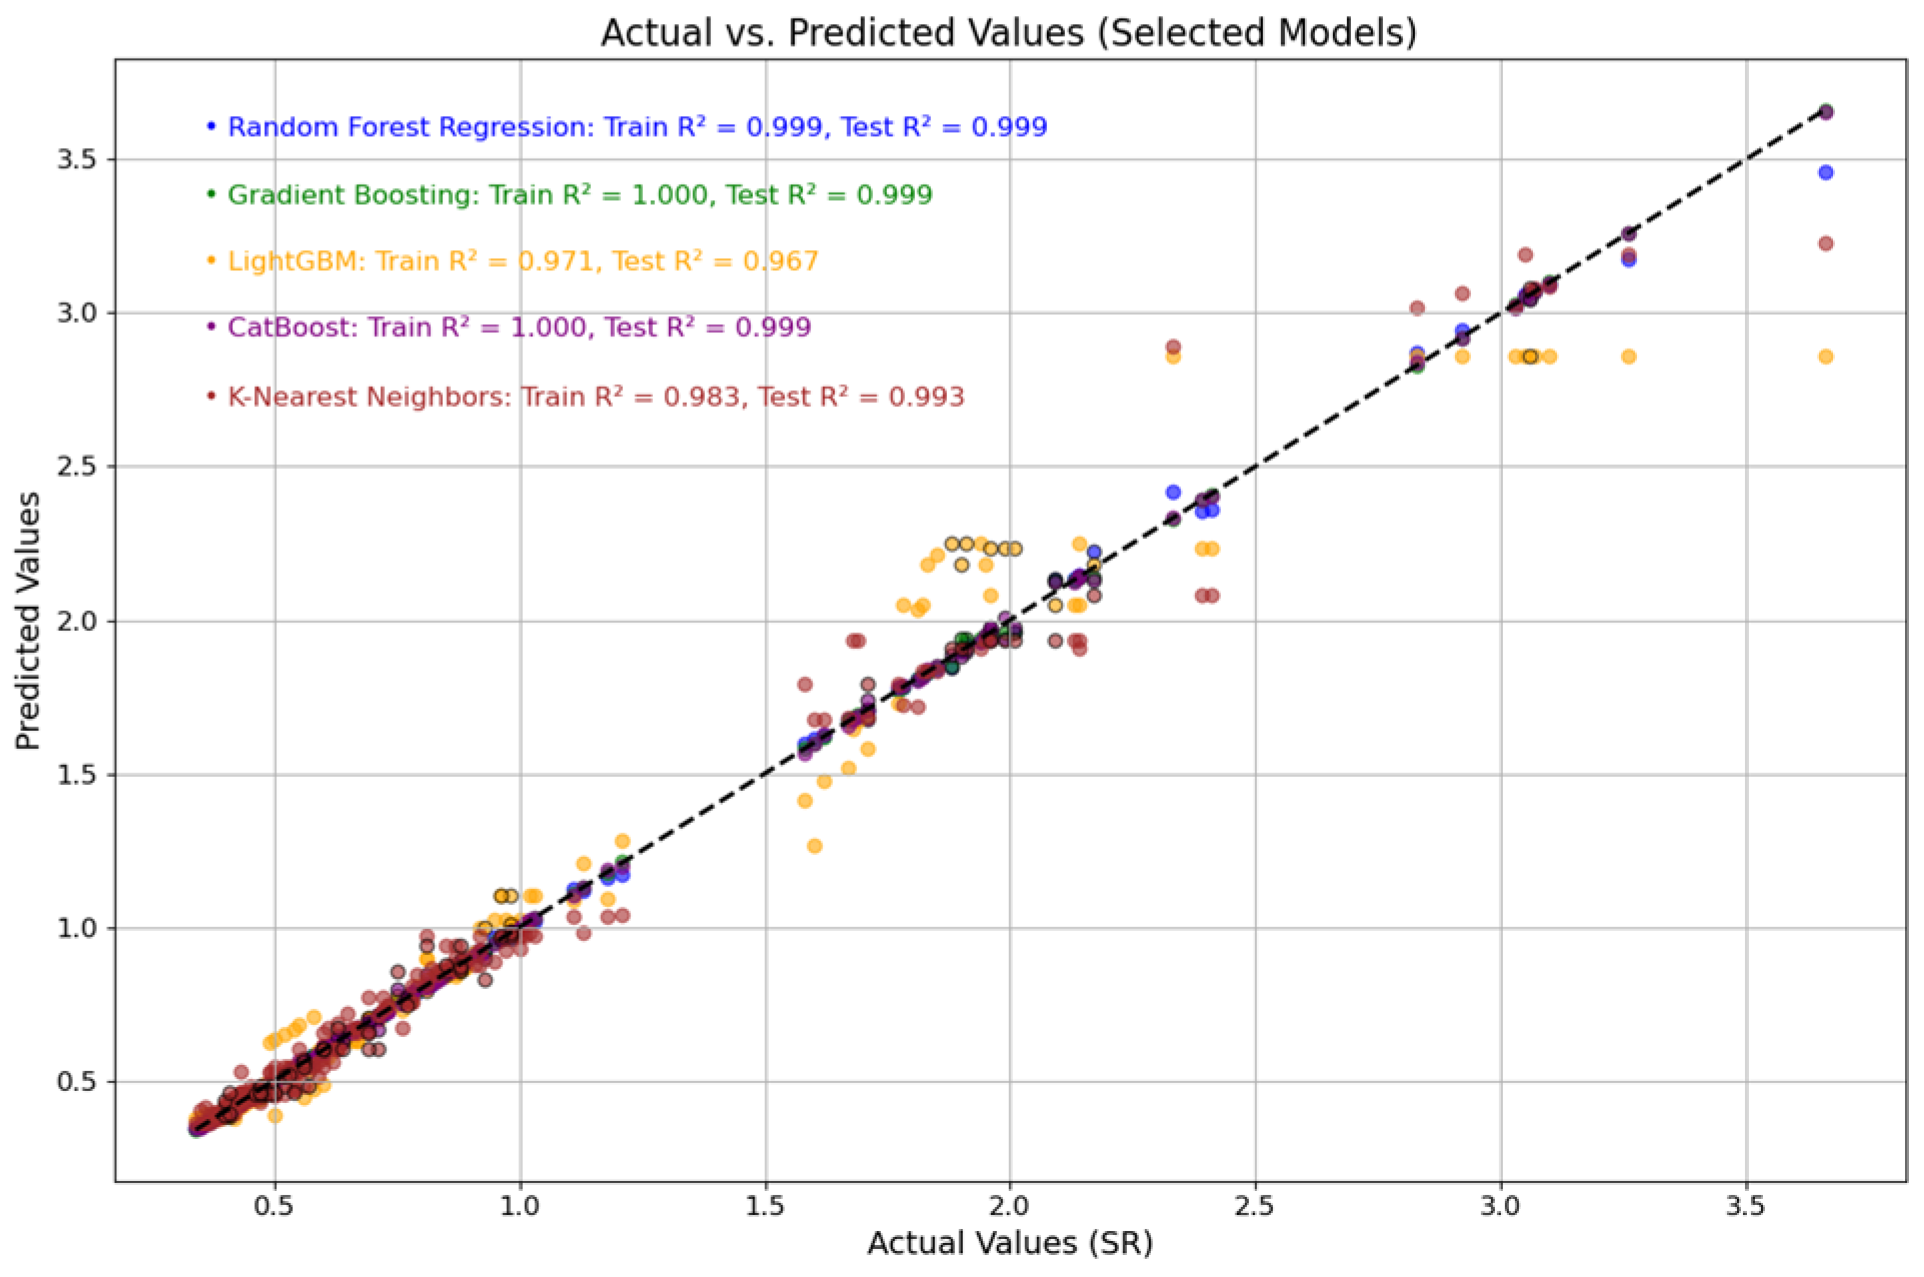
3.4. Predictive Modeling of Surface Roughness

ML has emerged as a powerful approach for predicting Ra, a key indicator of machining quality, across a wide range of manufacturing processes. Numerous studies [19,21,23,27] have demonstrated the superiority of ML-based models over traditional statistical methods, particularly in handling nonlinear and multi-dimensional relationships among machining parameters. Unlike conventional modeling approaches that often rely on linear regression or simplified empirical formulas, ML algorithms can effectively learn complex, nonlinear patterns and subtle interactions among input features such as spindle speed, feed rate, and depth of cut, leading to more accurate and generalizable predictions of surface quality.
In this study, five state-of-the-art ML algorithms, RFR, GBR, LightGBM, CatBoost, and KNN, were employed to predict surface roughness based on a dataset structured with Taguchi’s experimental design. These models were selected based on their demonstrated predictive performance in the recent literature for similar applications [19,22,24]. The inclusion of both ensemble-based learners (e.g., CatBoost, LightGBM) and distance-based methods (e.g., KNN) allows for a comprehensive evaluation of different learning paradigms in capturing micro-milling behavior. The comparative performances of these models are presented in Figure 17, and detailed evaluation metrics are summarized in Table 7.
Among the evaluated models, CatBoost achieved the highest accuracy, with R2 values of 0.9977 for training and 0.9729 for testing, and the lowest test error metrics (MAE = 0.0731 and RMSE = 0.1032). These results reflect CatBoost’s robust generalization capability and superior handling of nonlinear, high-dimensional relationships, aligning with findings from prior studies [19], which also reported a high performance from CatBoost in predicting Ra and cutting forces in AISI 4340 alloy steel turning. CatBoost’s built-in capability to handle categorical variables, automatic feature interaction handling, and regularization features make it particularly well suited for modeling complex manufacturing processes where traditional parametric models fall short. KNN followed closely with a test R2 of 0.9725. Despite its competitive performance, the model exhibited a slightly higher training error (MAE = 0.0674, RMSE = 0.1188), indicating potential limitations in modeling more complex nonlinear patterns. Similar observations have been made in previous research [26], where KNN performed well but was outperformed by ensemble methods. GBR showed a balanced performance with R2 values of 0.9906 (train) and 0.9639 (test) and moderate RMSE (0.1190). This reflects its capacity to generalize well across the dataset, although its sensitivity to hyperparameter settings has been noted in several works [21,23], making model tuning crucial for optimal performance. LightGBM exhibited relatively lower R2 values (0.9611 train and 0.9569 test) and higher training RMSE (0.1303), possibly due to its aggressive histogram-based decision tree learning, which, while computationally efficient, may underrepresent subtle local patterns in Ra evolution. RFR, although known for robustness and stability, yielded the lowest predictive performance in this study (test R2 = 0.9382 and RMSE = 0.1600), suggesting a more limited ability to model intricate micro-patterns associated with surface morphology in high-speed micro-milling. This aligns with findings from [23], which showed that tree-based bagging methods may underperform compared to boosting and neural network approaches in high-precision applications.
The added value of these ML models over traditional methods lies in their ability to model nonlinear dependencies without prespecified equations, adapt to multivariate interactions, and scale efficiently with increased data complexity. These characteristics are essential for advancing smart manufacturing systems and real-time quality monitoring frameworks.
Furthermore, the trained models—especially CatBoost and KNN—can be directly integrated into computer numerical control (CNC) systems for real-time surface roughness prediction, enabling dynamic parameter adjustments and minimizing post-processing requirements. This has significant implications for improving productivity, reducing scrap rates, and ensuring consistent product quality in precision manufacturing environments.
The predictive trends observed are well aligned with the experimental results described earlier. For example, Ra values increased with higher feed rates and deeper cuts, especially at lower spindle speeds—a pattern accurately captured by the CatBoost and KNN models. Moreover, the nonlinear effects of high spindle speeds (above 15,000 rpm) on surface roughness, likely due to tool wear and thermal softening, were effectively modeled by ensemble-based algorithms. These findings are consistent with earlier work [22,24], which emphasized the suitability of ML models in identifying complex interactions between machining parameters and output characteristics.
In conclusion, CatBoost emerged as the most effective model for predicting surface roughness under varying micro-milling parameters, outperforming other ensemble and non-parametric models. The model’s capacity for high-fidelity prediction, even with limited data and complex input–output dynamics, provides a novel contribution to the micro-milling literature. These results demonstrate the practical relevance of ML techniques not only for predictive accuracy but also for enhancing process understanding and control—elements critical to the evolution of intelligent machining systems. Future studies could explore the online implementation of these models in closed-loop machining environments, integrating sensor data for adaptive control and fault prediction. This approach aligns with Industry 5.0 objectives, promoting human–machine collaboration and higher customization in surface integrity management. These findings are consistent with those of numerous recent studies [19,23,27], which collectively underscore the growing role of advanced ML techniques in smart manufacturing and surface quality optimization.

3.5. Modeling Surface Roughness Based on Cutting Force Components

In machining operations, surface roughness is one of the most critical quality attributes, directly influenced by cutting forces. Variations in cutting forces during the process reflect the complex interaction between the cutting tool and the workpiece, encompassing factors such as tool vibration, material deformation, and process dynamics. Recent advancements in sensor technologies and machine learning algorithms have significantly enhanced the capacity to model these intricate interactions with high precision.
The existing literature has consistently demonstrated that cutting force signals, particularly when treated as time-series data, serve as powerful predictors of surface roughness. For instance, convolutional neural networks (CNNs) applied to frequency-transformed force data have achieved prediction errors below 10%, indicating strong predictive capabilities [54]. Furthermore, interpretable machine learning models such as random forests have achieved high levels of accuracy even when fewer sensors are used, thereby contributing to cost-effective smart manufacturing systems [55]. In grinding operations, LightGBM has been identified as the most effective model for predicting surface roughness from force-derived features, outperforming other algorithms in terms of error rates [56].
The experimental findings of the present study are in strong alignment with the prevailing literature. Multiple regression models—namely, random forest, gradient boosting, CatBoost, LightGBM, and k-nearest neighbors—were developed based on the primary cutting force components Fx, Fy, and Fz to estimate the arithmetic average surface roughness (Ra). Among these, the Fx and Fy components were found to have a direct correlation with tool deflection patterns and surface vibration effects, while Fz was associated with the depth of penetration and subsurface plastic deformation during cutting.
Figure 18 presents a comparative visualization of the predicted and actual Ra values for all regression models considered. The results show exceptionally high predictive accuracy, with R2 values exceeding 0.95 across all models on the test dataset. Notably, both RFR and CatBoost exhibited a nearly perfect prediction performance (R2 ≈ 1.000), underscoring their robust generalization capabilities.
These findings indicate that cutting force-based models are not only highly accurate but also practical for real-time implementation through sensor-integrated CNC systems. This makes them particularly suitable for industrial applications requiring adaptive control of surface finish. Furthermore, the ease of integrating force sensors into existing machining setups enhances the scalability of these models for smart factory environments.
In conclusion, the use of cutting force signals as input features provides a highly reliable alternative to conventional surface roughness prediction methods that rely solely on process parameters. The results underscore the potential of force-based models in the development of intelligent, predictive quality control systems for digital manufacturing environments. Future research could focus on fusing real-time sensor data with adaptive ML models to enable closed-loop surface quality regulation, which is critical for achieving high consistency in high-precision machining operations.

4. Conclusions

This study investigated the effects of cutting parameters on cutting forces and surface roughness in the micro-milling of Al10MgSi alloy, supported by ML predictive models to enhance process understanding and optimization.
Cutting forces analysis revealed that increasing the cutting depth and feed rate significantly raises the tangential (Fx) and radial (Fy) cutting forces due to enhanced friction and material removal rates. Conversely, increasing the spindle speed reduces cutting forces, mainly due to thermal softening effects at the tool–workpiece interface, which is consistent with the thermal dynamics typical in micro-milling processes. Notably, the Fx component dominated the cutting force profile, aligning with the primary direction of material removal and shear deformation. An optimal spindle speed of around 20,000 rpm was identified to balance cutting force reduction and machining efficiency, while a depth of cut of 100 µm optimized machining time, highlighting the necessary trade-off between tool load and production speed.
Machine learning-based predictive modeling demonstrated outstanding accuracy in forecasting cutting force components. Among the evaluated models, CatBoost consistently delivered the best performance, with R2 values exceeding 0.95 on test datasets for all force components, minimal error rates, and superior generalization capability. This validates CatBoost’s suitability for real-time force prediction and adaptive control in micro-milling, a crucial advancement for smart manufacturing environments and Industry 4.0/5.0 implementations.
Surface roughness outcomes showed a direct correlation with feed rate and cutting depth, both contributing to increased Ra values due to higher material removal rates and dynamic tool–workpiece interactions. Increased spindle speeds, however, tended to reduce surface roughness, attributed to the formation of built-up edges that smoothen the machined surface. The visual analysis of surface topography highlighted ploughing effects and irregular cutting marks at low parameter settings, underscoring the importance of optimal parameter selection and toolpath strategies to maintain surface integrity.
The ML models for surface roughness prediction mirrored those for cutting forces, with CatBoost outperforming others by accurately capturing the complex, nonlinear interactions between process variables and surface quality metrics. This predictive capability enables proactive control strategies for maintaining product quality under varying operational conditions.
The practical implications of this research suggest that a balanced selection of cutting depth, feed rate, and spindle speed, informed by robust ML predictions, can significantly improve tool life, machining efficiency, and product quality in micro-milling operations. The integration of ML-based predictive models into CNC control systems and digital twin frameworks represents a promising pathway for advancing precision manufacturing technologies.
Future work could expand this approach by incorporating tool wear monitoring, dynamic vibration analysis, and multi-material machining to further enhance the robustness and applicability of predictive models in increasingly complex micro-machining environments.

Author Contributions

Conceptualization, Z.A.C., K.O., A.E., and G.S.; methodology, G.S., Z.A.C., K.O., and A.E.; software, G.S. and A.E.; validation, G.S., Z.A.C., K.O., and A.E.; formal analysis, G.S., Z.A.C., K.O., and A.E.; investigation, G.S., Z.A.C., K.O., and A.E.; resources, G.S., Z.A.C., and K.O.; data curation, G.S., Z.A.C., K.O., and A.E.; writing—original draft preparation, G.S., Z.A.C., K.O., and A.E.; writing—review and editing, G.S., Z.A.C., K.O., and A.E.; visualization, G.S., Z.A.C., K.O., and A.E. All authors have read and agreed to the published version of the manuscript.

Funding

This research received no external funding.

Institutional Review Board Statement

Not applicable.

Informed Consent Statement

Not applicable.

Data Availability Statement

The original contributions presented in the study are included in the article, further inquiries can be directed to the corresponding author.

Conflicts of Interest

The authors declare no conflicts of interest.

References

  1. Ngo, T.D.; Kashani, A.; Imbalzano, G.; Nguyen, K.T.; Hui, D. Additive manufacturing (3D printing): A review of materials, methods, applications and challenges. Compos. Part B Eng. 2018, 143, 172–196. [Google Scholar] [CrossRef]
  2. Kushwaha, S.; Park, J.; Koric, S.; He, J.; Jasiuk, I.; Abueidda, D. Advanced deep operator networks to predict multiphysics solution fields in materials processing and additive manufacturing. Addit. Manuf. 2024, 88, 104266. [Google Scholar] [CrossRef]
  3. Brandão, A.D.; Gumpinger, J.; Gschweitl, M.; Seyfert, C.; Hofbauer, P.; Ghidini, T. Fatigue properties of additively manufactured AlSi10Mg-surface treatment effect. Procedia Struct. Integr. 2017, 7, 58–66. [Google Scholar] [CrossRef]
  4. Frazier, W.E. Metal additive manufacturing: A review. J. Mater. Eng. Perform. 2014, 23, 1917–1928. [Google Scholar] [CrossRef]
  5. Güler, S.; Serindağ, H.T.; Çam, G. Tel ark eklemeli imalat: Son gelişmeler ve değerlendirmeler. Mühendis Ve Makina 2022, 63, 82–116. [Google Scholar] [CrossRef]
  6. Singh, D.D.; Mahender, T.; Reddy, A.R. Powder bed fusion process: A brief review. Mater. Today Proc. 2021, 46, 350–355. [Google Scholar] [CrossRef]
  7. Khaing, M.W.; Fuh, J.Y.H.; Lu, L. Direct metal laser sintering for rapid tooling: Processing and characterization of EOS parts. J. Mater. Process. Technol. 2001, 113, 269–272. [Google Scholar] [CrossRef]
  8. Slotwinski, J.A.; Garboczi, E.J.; Stutzman, P.E.; Ferraris, C.F.; Watson, S.S.; Peltz, M.A. Characterization of metal powders used for additive manufacturing. J. Res. Natl. Inst. Stand. Technol. 2014, 119, 460. [Google Scholar] [CrossRef]
  9. Shu, C.; Chen, S.; Lei, P.; Shu, X.; Abdel-Wahab, A.; Essa, K. Effect and mechanism of powder morphology on mechanical properties of nickel-based metal matrix composites TiC-IN738LC in laser powder bed fusion. Prog. Addit. 2025, 1–19. [Google Scholar] [CrossRef]
  10. Li, H.; Brodie, E.G.; Hutchinson, C. Predicting the chemical homogeneity in laser powder bed fusion (LPBF) of mixed powders after remelting. Addit. Manuf. 2023, 65, 103447. [Google Scholar] [CrossRef]
  11. Akhai, S.; Rana, M. Taguchi-based grey relational analysis of abrasive water jet machining of Al-6061. Mater. Today Proc. 2022, 65, 3165–3169. [Google Scholar] [CrossRef]
  12. Thareja, P.; Akhai, S. Processing parameters of powder aluminium-fly ash P/M composites. J. Adv. Res. Manuf. Mater. Sci. Met. Eng. 2017, 4, 24–35. [Google Scholar]
  13. Akhai, S.; Srivastava, P.; Sharma, S. Developments in horizontal axis wind turbines-A brief review. J. Crit. Rev. 2020, 7, 255–260. [Google Scholar]
  14. Isaac, J.P.; Lee, S.; Thompson, S.; Saharan, A.; Shamsaei, N.; Tippur, H.V. Role of build orientation on quasi-static and dynamic fracture responses of additively manufactured AlF357 and AlSi10Mg alloys. Addit. Manuf. 2022, 59, 103080. [Google Scholar] [CrossRef]
  15. Narayanan, Y.S.; Nguyen, N.; Hosseini, A. Milling of additively manufactured AlSi10Mg with microstructural porosity defects, finite element modeling and experimental analysis. J. Manuf. Process. 2024, 118, 242–260. [Google Scholar] [CrossRef]
  16. Bolat, Ç.; Karakılınç, U.; Yalçın, B.; Öz, Y.; Yavaş, Ç.; Ergene, B.; Ercetin, A.; Akkoyun, F. Effect of drilling parameters and tool geometry on the thrust force and surface roughness of aerospace grade laminate composites. Micromachines 2023, 14, 1427. [Google Scholar] [CrossRef]
  17. Mallick, P.S.; Pratap, A.; Patra, K. Review on cryogenic assisted micro-machining of soft polymer: An emphasis on molecular physics, chamber design, performance analysis and sustainability. J. Manuf. Process. 2022, 80, 930–957. [Google Scholar] [CrossRef]
  18. Tan, R.; Zhao, X.; Liu, Q.; Guo, X.; Lin, F.; Yang, L.; Sun, T. Investigation of surface integrity of selective laser melting additively manufactured AlSi10Mg alloy under ultrasonic elliptical vibration-assisted ultra-precision cutting. Materials 2022, 15, 8910. [Google Scholar] [CrossRef]
  19. Nguyen, A.T.; Nguyen, V.H.; Le, T.T.; Nguyen, N.T. A hybridization of machine learning and NSGA-II for multi-objective optimization of surface roughness and cutting force in AISI 4340 alloy steel turning. J. Mach. Eng. 2023, 23, 133–153. [Google Scholar]
  20. Nguyen, A.T.; Nguyen, V.H.; Le, T.T.; Nguyen, N.T. Multiobjective Optimization of Surface Roughness and Tool Wear in High-Speed Milling of AA6061 by Machine Learning and NSGA-II. Adv. Mater. Sci. Eng. 2022, 2022, 5406570. [Google Scholar] [CrossRef]
  21. Yeganefar, A.; Niknam, S.A.; Asadi, R. The use of support vector machine, neural network, and regression analysis to predict and optimize surface roughness and cutting forces in milling. Int. J. Adv. Manuf. Technol. 2019, 105, 951–965. [Google Scholar] [CrossRef]
  22. Zhang, Y.; Xu, X. Machine learning cutting force, surface roughness, and tool life in high speed turning processes. Manuf. Lett. 2021, 29, 84–89. [Google Scholar] [CrossRef]
  23. Agarwal, R.; Gupta, V.; Singh, J.; Jain, V. Prediction of surface roughness and cutting force induced during rotary ultrasonic bone drilling via statistical and machine learning algorithms. Proc. Inst. Mech. Eng. Part C J. Mech. Eng. Sci. 2022, 236, 11123–11135. [Google Scholar] [CrossRef]
  24. Das, A.; Das, S.R.; Panda, J.P.; Dey, A.; Gajrani, K.K.; Somani, N.; Gupta, N.K. Machine learning-based modeling and optimization in hard turning of AISI D6 Steel with advanced altisin-coated carbide inserts to predict surface roughness and other machining characteristics. Surf. Rev. Lett. 2022, 29, 2250137. [Google Scholar] [CrossRef]
  25. Kumar, R.; Rafighi, M.; Özdemir, M.; Şahinoğlu, A.; Kulshreshta, A.; Singh, J.; Singh, S.; Prakash, C.; Bhowmik, A. Modeling and optimization of hard turning: Predictive analysis of surface roughness and cutting forces in AISI 52100 steel using machine learning. Int. J. Interact. Des. Manuf. (IJIDeM) 2024, 1–30. [Google Scholar] [CrossRef]
  26. Charalampous, P. Prediction of cutting forces in milling using machine learning algorithms and finite element analysis. J. Mater. Eng. Perform. 2021, 30, 2002–2013. [Google Scholar] [CrossRef]
  27. Lu, J.; Mu, H.; Ouyang, H.; Zhang, Z.; Ding, W. Modeling and effect analysis of machining parameters for surface roughness and specific energy consumption during TC18 machining using deep reinforcement learning and neural networks. Artif. Intell. Rev. 2025, 58, 193. [Google Scholar] [CrossRef]
  28. Dubey, V.; Sharma, A.K.; Pimenov, D.Y. Prediction of surface roughness using machine learning approach in MQL turning of AISI 304 steel by varying nanoparticle size in the cutting fluid. Lubricants 2022, 10, 81. [Google Scholar] [CrossRef]
  29. Metal Powder EOS. Aluminium AlSi10Mg Material Data Sheet, E.O.S. GmbH—Electro Optical Systems, Krailling/Munich, Germany. Available online: https://www.eos.info/var/assets/03_system-related-assets/material-related-contents/metal-materials-and-examples/metal-material-datasheet/aluminium/material_datasheet_eos_aluminium-alsi10mg_en_web.pdf (accessed on 2 June 2025).
  30. Ercetin, A.; Aslantaş, K.; Özgün, Ö.; Perçin, M.; Chandrashekarappa, M.P.G. Optimization of machining parameters to minimize cutting forces and surface roughness in micro-milling of Mg13Sn alloy. Micromachines 2023, 14, 1590. [Google Scholar] [CrossRef]
  31. Xu, P.; Ji, X.; Li, M.; Lu, W. Small data machine learning in materials science. npj Comput. Mater. 2023, 9, 42. [Google Scholar] [CrossRef]
  32. Friedman, J.H. Greedy function approximation: A gradient boosting machine. Ann. Stat. 2001, 29, 1189–1232. [Google Scholar] [CrossRef]
  33. Breiman, L. Random forests. Mach. Learn. 2001, 45, 5–32. [Google Scholar] [CrossRef]
  34. Breiman, L. Classification and Regression Trees; Routledge: London, UK, 2017. [Google Scholar]
  35. Sharma, S.; Gupta, V.; Mudgal, D. Response surface methodology and machine learning based tensile strength prediction in ultrasonic assisted coating of poly lactic acid bone plates manufactured using fused deposition modeling. Ultrasonics 2024, 137, 107204. [Google Scholar] [CrossRef]
  36. Ke, G.; Meng, Q.; Finley, T.; Wang, T.; Chen, W.; Ma, W.; Liu, T.Y. Lightgbm: A highly efficient gradient boosting decision tree. In Proceedings of the Advances in Neural Information Processing Systems 30 (NIPS 2017), Long Beach, CA, USA, 4–9 December 2017; Volume 30. [Google Scholar]
  37. Zhou, Y.; Wang, W.; Wang, K.; Song, J. Application of LightGBM Algorithm in the Initial Design of a Library in the Cold Area of China Based on Comprehensive Performance. Buildings 2022, 12, 1309. [Google Scholar] [CrossRef]
  38. Hussain, S.; Mustafa, M.W.; Jumani, T.A.; Baloch, S.K.; Alotaibi, H.; Khan, I.; Khan, A. A Novel Feature Engineered-CatBoost-Based Supervised Machine Learning Framework for Electricity Theft Detection. Energy Rep. 2021, 7, 4425–4436. [Google Scholar] [CrossRef]
  39. Ibrahim, A.A.; Ridwan, R.L.; Muhammed, M.M.; Abdulaziz, R.O.; Saheed, G.A. Comparison of the CatBoost Classifier With Other Machine Learning Methods. Int. J. Adv. Comput. Sci. Appl. 2020, 11, 738–748. [Google Scholar] [CrossRef]
  40. Kramer, O.; Kramer, O. K-nearest neighbors. In Dimensionality Reduction with Unsupervised Nearest Neighbors; Springer Nature: Dordrecht, The Netherlands, 2013; pp. 13–23. [Google Scholar]
  41. Pan, Z.; Wang, Y.; Pan, Y. A new locally adaptive k-nearest neighbor algorithm based on discrimination class. Knowl.-Based Syst. 2020, 204, 106185. [Google Scholar] [CrossRef]
  42. Sima, M.; Özel, T. Modified material constitutive models for serrated chip formation simulations and experimental validation in machining of titanium alloy Ti–6Al–4V. Int. J. Mach. Tools Manuf. 2010, 50, 943–960. [Google Scholar] [CrossRef]
  43. Kadirgama, K.; Abou-El-Hossein, K.A.; Noor, M.M.; Sharma, K.V.; Mohammad, B. Tool life and wear mechanism when machining Hastelloy C-22HS. Wear 2011, 270, 258–268. [Google Scholar] [CrossRef]
  44. Saglam, H.; Yaldiz, S.; Unsacar, F. The effect of tool geometry and cutting speed on main cutting force and tool tip temperature. Mater. Des. 2007, 28, 101–111. [Google Scholar] [CrossRef]
  45. Bhagat, K.C.; Kumar, A.; Thakur, A.; Gangopadhyay, S. Analysis of cutting forces and surface quality during micro milling of AZ31B magnesium alloy. Int. J. Adv. Manuf. Technol. 2024, 134, 3465–3480. [Google Scholar] [CrossRef]
  46. Bao, W.Y.; Tansel, I.N. Modeling micro-end-milling operations. Part I: Analytical cutting force model. Int. J. Mach. Tools Manuf. 2000, 40, 2155–2173. [Google Scholar] [CrossRef]
  47. Malekian, M.; Park, S.S.; Jun, M.B. Tool wear monitoring of micro-milling operations. J. Mater. Process. Technol. 2009, 209, 4903–4914. [Google Scholar] [CrossRef]
  48. Köpf, A.; Feistritzer, S.; Udier, K. Diamond coated cutting tools for machining of non-ferrous metals and fibre reinforced polymers. Int. J. Refract. Met. Hard Mater. 2006, 24, 354–359. [Google Scholar] [CrossRef]
  49. Chae, J.; Park, S.S.; Freiheit, T. Investigation of micro-cutting operations. Int. J. Mach. Tools Manuf. 2006, 46, 313–332. [Google Scholar] [CrossRef]
  50. Gupta, M.; Kumar, S. Investigation of surface roughness and MRR for turning of UD-GFRP using PCA and Taguchi method. Eng. Sci. Technol. Int. J. 2015, 18, 70–81. [Google Scholar] [CrossRef]
  51. Uhlmann, E.; Lypovka, P.; Hochschild, L.; Schröer, N. Influence of rail grinding process parameters on rail surface roughness and surface layer hardness. Wear 2016, 366, 287–293. [Google Scholar] [CrossRef]
  52. Erçetin, A.; Aslantas, K.; Özgün, Ö. Micro-end milling of biomedical TZ54 magnesium alloy produced through powder metallurgy. Mach. Sci. Technol. 2020, 24, 924–947. [Google Scholar] [CrossRef]
  53. Karakılınç, U.; Ergene, B.; Yalçın, B.; Aslantaş, K.; Erçetin, A. Comparative analysis of minimum chip thickness, surface quality and burr formation in micro-milling of wrought and selective laser melted Ti64. Micromachines 2023, 14, 1160. [Google Scholar] [CrossRef]
  54. Tsai, M.H.; Lee, J.N.; Tsai, H.D.; Shie, M.J.; Hsu, T.L.; Chen, H.S. Applying a neural network to predict surface roughness and machining accuracy in the milling of SUS304. Electronics 2023, 12, 981. [Google Scholar] [CrossRef]
  55. Gross, D.; Spieker, H.; Gotlieb, A.; Knoblauch, R.; Elmansori, M. Efficient Milling Quality Prediction with Explainable Machine Learning. IFAC-Pap. 2024, 58, 43–48. [Google Scholar] [CrossRef]
  56. Charde, M.M.; Najan, T.P.; Cepova, L.; Jadhav, A.D.; Rash-inkard, N.S.; Samal, S.P. Predictive Modelling of Surface Roughness in Grinding Operations Using Machine Learning Techniques. Manuf. Technol. 2025, 25, 14–23. [Google Scholar] [CrossRef]
Figure 1. Fabrication process of the samples: (a) dimensional representation (in mm) and (b) manufactured AlSi10Mg samples.
Applsci 15 06553 g001
Figure 2. (a) experimental setup, (b) schematic representation of the machining, (c) schematic view of the machining area, and (d) schematic representation of cutting forces.
Applsci 15 06553 g002
Figure 3. Display for measurement of shear forces from valley to peak for Fx, Fy, and Fz.
Applsci 15 06553 g003
Figure 4. Feed of 0.25–0.5–1–2 and depth of 50 µm in cutting forces: (a) Fx, (b) Fy, and (c) Fz.
Applsci 15 06553 g004
Figure 5. Feed of 0.25–0.5–1–2 and depth of 100 µm in cutting forces: (a) Fx, (b) Fy, and (c) Fz.
Applsci 15 06553 g005
Figure 6. Ratio of Fx to Fy for depth of cut (a) 50 µm and (b) 100 µm.
Applsci 15 06553 g006
Figure 7. Predictive performance of regression models for Fx based on actual and predicted values with corresponding R2 scores.
Applsci 15 06553 g007
Figure 8. Predictive performance of regression models for Fy based on actual and predicted values with corresponding R2 scores.
Applsci 15 06553 g008
Figure 9. Predictive performance of regression models for Fz based on actual and predicted values with corresponding R2 scores.
Applsci 15 06553 g009
Figure 10. Experimental results for surface roughness.
Applsci 15 06553 g010
Figure 11. Main effects plot for surface roughness.
Applsci 15 06553 g011
Figure 12. SN ratios corresponding to surface roughness values.
Applsci 15 06553 g012
Figure 13. Contour plots of surface roughness: depth of cut/cutting speed (a), cutting speed /feed (b), and depth of cut/feed (c).
Applsci 15 06553 g013
Figure 14. Variation in surface roughness (Ra and Sa) with feed rate and spindle speed for cutting depths of 50 µm and 100 µm. The figure highlights the influence of increased feed rate on roughness and the mitigating effect of high spindle speeds.
Applsci 15 06553 g014
Figure 15. Three-dimensional profilometer image showing surface topography at 50 µm depth of cut under low spindle speed and feed rate. The image reveals ploughing effects and irregular surface patterns due to incomplete material removal.
Applsci 15 06553 g015
Figure 16. Three-dimensional profilometer image for 100 µm depth of cut under the same low cutting parameters. Surface irregularities and overlapping tool marks are clearly visible, indicating inefficient chip formation and higher roughness.
Applsci 15 06553 g016
Figure 17. Predictive performance of regression models for surface roughness based on actual and predicted values with corresponding R2 scores.
Applsci 15 06553 g017
Figure 18. Comparison of actual and predicted surface roughness (Ra) values using Fx, Fy, and Fz cutting force components across various regression models. The figure has been refined to emphasize deviations and model performance clarity through enhanced color coding and error range bands.
Applsci 15 06553 g018
Table 1. Chemical composition of AlSi10Mg aluminum alloy [29].
MaterialElementFeSiTiMn
lSi10MgPercent0.55%9.0–11.0%0.15%0.45%
CuNiMgAl
0.05%0.05%0.25–0.45%Balance
Table 2. Mechanical and physical properties of AlSi10Mg [29].
MaterialTensile Strength (MPa)Elong. at Break (%)Surface Roughness
(Ra–Rz µm)
Den. (g/cm3)
AlSi10Mg4606.39–20 µm
70–120 µm
2.67
Table 3. The properties the of end mill.
Shaft Diameter
(mm)
Tool Diameter (mm)Length (mm)Flute NumberHelix Angle
(°)
Hardness
HRC
Coating Type
4150435°55TİSİN Coated
Table 4. Parameters applied in the machining testing.
Test NumberFeed Amount, fz
(µm/Tooth)
Milling Speed,
(rpm)
Depth of Cut, Doc
(µm)
1–2–3–4–5–6–7–8–9–10–11–120.25
0.5
1
2
10,000
20,000
30,000
50
1–2–3–4–5–6–7–8–9–10–11–120.25
0.5
1
2
10,000
20,000
30,000
100
Table 5. Machine learning models.
Model NameDescriptionTheoryMathematical FormulationSources
RFRAn ensemble model consisting of multiple decision trees, where predictions are determined through majority voting.Each tree is trained on a bootstrap sample, and the final prediction is obtained by averaging or majority voting. h x = 1 B b = 1 B h b x [31,32,33]
GBRA boosting technique that converts weak learners into strong learners by iteratively correcting errors.The model sequentially adds weak learners and optimizes by minimizing the loss function. S p l i t t i n g   C r i t e r i o n = n = 1 n g i [31,32,33,34,35]
LightGBMA histogram-based machine learning algorithm optimized for speed and memory usage, particularly fast on large datasets.Optimizes speed and memory usage using gradient-based one-side sampling (GOSS) and exclusive feature bundling (EFB). Ω x = γ T + 1 2 λ j = 1 T w j 2 [36,37]
CatBoostA machine learning algorithm designed for processing categorical data, producing low-variance and nonlinear model outputs.Effectively handles categorical data and produces low-variance model outcomes. L = i = 1 N y i f ( x i 2 + λ j = 1 M w j 2 [38,39]
KNNA simple yet effective algorithm used for classification and regression tasks by considering the k-nearest neighbors in the feature space.The model predicts a data point’s label by considering the majority class of its k-nearest neighbors. f x = 1 k i = 1 k y i [40,41]
Table 6. Model performance metrics for cutting forces (Fx, Fy, and Fz) prediction.
Dependent VariableModelR2 TrainR2 TestMAE TrainMAE TestRMSE TrainRMSE Test
FxRFR0.99590.92430.16270.49100.25620.8887
GBR0.99670.94090.15710.48320.20620.7800
LightGBM0.98370.96980.28240.38250.45760.5572
CatBoost0.99900.96420.08490.38890.11130.6073
KNN0.98490.97070.27810.33700.43970.5493
FyRFR0.99570.96130.13380.40720.20370.6102
GBR0.99580.95490.15170.45300.20000.6663
LightGBM0.98310.96450.25700.40790.40220.5848
CatBoost0.99870.95630.08910.46070.11350.6481
KNN0.98000.94200.27900.43700.43740.7467
FzRFR0.99420.96420.05430.13720.09530.2282
GBR0.99620.95620.05640.15380.07760.2371
LightGBM0.97940.97300.11050.12210.17980.1800
CatBoost0.99920.97630.02920.11260.03570.1688
KNN0.98430.98180.09630.08660.15670.1477
Table 7. Model performance metrics for surface roughness prediction.
Dependent VariableModelR2 TrainR2 TestMAE TrainMAE TestRMSE TrainRMSE Test
SRRFR0.98540.93820.04180.09690.07780.1600
GBR0.99060.96390.04490.08480.06400.1190
LightGBM0.96110.95690.07910.08950.13030.1301
CatBoost0.99770.97290.02380.07310.03150.1032
KNN0.96760.97250.06740.06870.11880.1038
Disclaimer/Publisher’s Note: The statements, opinions and data contained in all publications are solely those of the individual author(s) and contributor(s) and not of MDPI and/or the editor(s). MDPI and/or the editor(s) disclaim responsibility for any injury to people or property resulting from any ideas, methods, instructions or products referred to in the content.

