Article

GPR Sensing and Visual Mapping Through 4G-LTE, 5G, Wi-Fi HaLow, and Wi-Fi Hotspots with Edge Computing and AR Representation

by
Scott Tanch
1,
Alireza Fath
1,
Nicholas Hanna
2,
Tian Xia
3 and
Dryver Huston
1,*
1
Mechanical Engineering, University of Vermont, Burlington, VT 05405, USA
2
Computer Science, University of Vermont, Burlington, VT 05405, USA
3
Electrical and Biomedical Engineering, University of Vermont, Burlington, VT 05405, USA
*
Author to whom correspondence should be addressed.
Appl. Sci. 2025, 15(12), 6552; https://doi.org/10.3390/app15126552
Submission received: 28 April 2025 / Revised: 6 June 2025 / Accepted: 8 June 2025 / Published: 10 June 2025
(This article belongs to the Special Issue Robotics and Intelligent Systems: Technologies and Applications)

Abstract

:
In this study, we demonstrate an application for 5G networks in mobile and remote GPR scanning situations to detect buried objects by experts while the operator is performing the scans. Using a GSSI SIR-30 system in conjunction with the RealSense camera for visual mapping of the surveyed area, subsurface GPR scans were created and transmitted for remote processing. Using mobile networks, the raw B-scan files were transmitted at a sufficient rate, a maximum of 0.034 ms mean latency, to enable near real-time edge processing. The performance of 5G networks in handling the data transmission for the GPR scans and edge computing was compared to the performance of 4G networks. In addition, long-range low-power devices, namely Wi-Fi HaLow and Wi-Fi hotspots, were compared as local alternatives to cellular networks. Augmented reality headset representation of the F-scans is proposed as a method of assisting the operator in using the edge-processed scans. These promising results bode well for the potential of remote processing of GPR data in augmented reality applications.

1. Introduction

The process of scanning and monitoring underground infrastructure is often expensive and time-consuming. Ground penetrating radar (GPR) is one of the non-destructive methods to monitor underground facilities. The GPR works based on electromagnetic fields, in which the transmission antenna must generate the spatially and temporally distributed field distortions by excitation voltages, and the receiving antenna must read the recordable signal from the identified temporal variation [1]. In the typically processed scans of the received data, hyperbolic patterns represent the buried objects [2]. Annan [3] reviewed the history and future aspects of using GPR. As GPR proves to be a practical means of subterranean imaging, researchers use it in a variety of applications such as monitoring transport infrastructures [4], concrete pavements [5], and river embarkments [6]. Jiao et al. [7] used 900 MHz GPR to recognize and detect substantial defects in concrete images. Various techniques can be used for source localization, such as time-reversal [8]. This method can be incorporated using Multistatic data from radar imaging to locate the buried targets [9].
Additionally, GPR scanning methods have been improved by the addition of neural networks for non-traditional applications such as locating burial sites [10]. As the interpretation of GPR data is challenging, methods for creating 3D images of reinforced concrete have been proposed [11]. Moreover, GPR is used in tandem with emerging technologies such as augmented reality (AR) [12] to create 3D models of underground pipelines. In 2020, a new GPR-augmented reality method for monitoring underground structures was proposed, which reduces the time required to post-process the data [13]. The system was later implemented to observe signal strength in real time using AR [14]. GPR scanning can also be used in conjunction with other computationally expensive methods such as deep reinforcement learning, which was demonstrated by Omwenga et al. [15] in 2021. The autonomous cognitive GPR method outperforms other comparable methods in terms of identifying objects with high accuracy in a timely manner.
Apart from the use of GPR scanning methodology, another important feature is the mapping and localization of the area. The localization was previously performed manually, which was not only time-consuming but could also lead to potential human errors. For this reason, RealSense cameras are widely used. Tsykunov et al. [16] used depth and tracking RealSense cameras to create a 3D map and localization of an indoor area. Bayer et al. [17] utilized two RealSense cameras on their Hexapod walking robot to autonomously explore outdoor and indoor spaces. Furthermore, the RealSense camera can be used in conjunction with the NVIDIA Jetson Nano for Simultaneous Localization and Mapping (SLAM) using the Robot Operating System (ROS) on mobile platforms [18].
Wireless communication is defined as data transmission from one place to another. Some of the popular wireless networks are wireless personal area networks, wireless local area networks, wireless metropolitan area networks, wireless wide area networks, and cellular networks [19]. Frattasi et al. [20] used a user-centric approach to describe 4G network properties. Switching to 4G from previous generations has a number of advantages, including lower costs and the ability to access the network via a variety of platforms [21]. In 2014, Li et al. [22] estimated the maximum improvement that could be achieved with 5G as a 90–160 times increase in range. In 2017, Al-Falahy and Alani [23] investigated the necessities and requirements for achieving low latency and high data throughput. Hao [24] compared the performance of 4G and 5G networks, finding that the time delay improved by more than ten times and the peak data rate increased by more than twenty times.
In 2021, Lee et al. [25] evaluated the IEEE 802.11ah [26] (Wi-Fi HaLow) and demonstrated its capability as a low-power, high-throughput, and long-range protocol with field tests for indoor and outdoor environments. Verhoeven et al. [27] compared the performance of long-range IoT wireless technologies such as LoRa and Wi-Fi HaLow. Although e LoRa works in higher frequency ranges, Wi-Fi HaLow proved to have higher throughput. Furthermore, the Wi-Fi HaLow network is applicable to situations that current IT infrastructure is incapable of, such as multi-sided applications for medical emergencies [28]. Table 1 shows an overview of the literature review.
The challenges associated with performing GPR scanning include the following procedures: (1) the operator scanning the entire area, (2) manually mapping and marking the site, (3) presenting the saved data to an expert with spatial coordination, (4) the expert interpreting the data and locating the targets of interest, and (5) the operator returning to the site several times to create full scans of the target infrastructures. By moving the interpretation and processing of GPR data to an edge processing site, the time between collection and onsite interpretation can be greatly reduced. GPR surveys are conducted in diverse environments, ranging from densely populated regions to isolated tracts of land, each providing unique communication challenges. In 2022 [29], the POWDER (Platform for Open Wireless Data-driven Experimental Research) [30] network was evaluated as a potential solution for data transmission to edge processing sites. While the POWDER network showed promise, its implementation area is geographically restricted, leading to the need for more widely available data transmission solutions.
This paper proposes a method to overcome these time-consuming challenges by incorporating the Intel RealSense T265 tracking camera for localization, transitioning processing and marking operations to edge-computing sites using the best available network to obtain real-time feedback on processed scans. A method for generating AR representations of the collected F-scans is implemented at the edge, taking advantage of the increased computational power made available by fast network transmission. Using edge computing with a fast network can significantly improve the efficiency of the GPR system. This proposed workflow has the potential to move the processing of raw data out of the office and into the cloud, allowing for faster, onsite interpretation. To accomplish this, both Wireless Local Area Networks (WLAN) and Cellular Networks infrastructures were investigated.
A description of the proposed data generation system as well as the arrangement of the WLAN and Cellular transmission modes are provided in Section 2. Results of freeform F-Scan visualization in AR, wireless local transmission, and cellular network data transmission are given in Section 3. Finally, the comparison of the generated results and future directions are provided in Section 4.

2. Materials and Methods

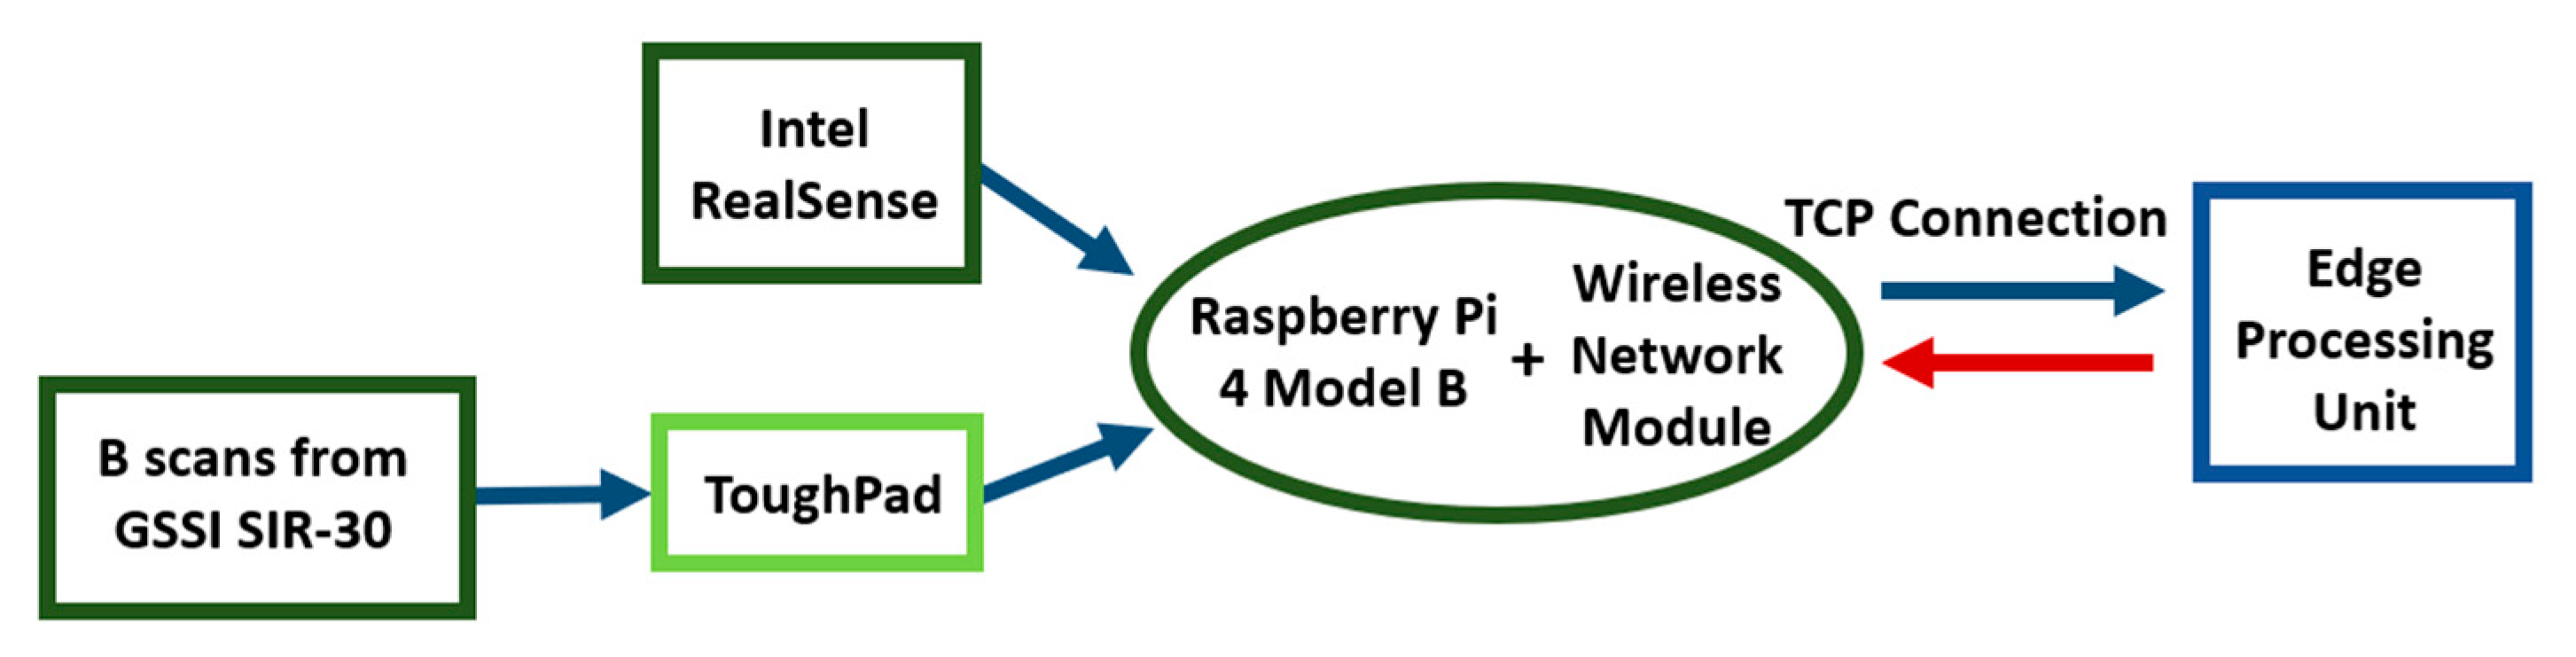
2.1. Data Generation with Ground Penetrating Radar

The proposed system consists of two data-generating devices: a Geophysical Survey Systems (GSSI) SIR-30 GPR system (Geophysical Survey Systems Inc., Nashua, NH, USA) and an Intel RealSense T265 tracking camera (Intel, Santa Clara, CA, USA). These two data streams are merged together to create both traditional B-Scans as well as F-Scans. In a traditional B-scan, individual traces are stacked along the x-axis creating a cross-sectional image with an x-axis corresponding to the scan’s length and y-axis corresponding to depth. Conversely, an F-scan depicts a subsurface cross-section that curves across the x-y plane with the z-axis representing depth. An F-scan is unique in that the original radar data are collected in conjunction with positional data, which is then used to project the initial flat scan into 3D space. GPR DZT data files are passed through a Panasonic Toughpad (Panasonic, Kadoma, Japan) to a Raspberry Pi 4 Model B and packaged together with pose data from RealSense. The total size of these packages is dependent on the survey they represent and is typically less than one megabyte in size. A TCP connection is then made to the edge processing unit through a 4G or 5G link to Verizon Wireless (Figure 1). After receiving the data, it is unpacked and processed using custom geometry creation algorithms to generate both an F and B scan image, which are returned along the same link.
Position data are collected from RealSense every 6 ms over the course of the scan and are used to associate each trace to an approximate X-Y coordinate. This creates a relatively dense dataset, which must be reduced to create parsable 3D geometry. The reduction is carried out by stepping through the series of points sequentially and merging vertices within the module’s stated accuracy, approximately 1%. This creates a relatively smooth path while maintaining the features of the survey line. Following the reduction, the points are loaded into Blender and extruded in the Z direction to create a surface. The generation of these models can be seen below in Figure 2. A B-Scan can then be applied to that surface as a texture map, allowing the B-Scan to conform to the surface geometry and create the desired F-Scan. These digital objects are finally transferred to a Unity application run on an AR headset (Microsoft HoloLens 2), allowing for an AR view of the subsurface features with the ability to interact with the 3D object for thorough inspection of the underground infrastructure in the environment.

2.2. Wireless Local Area Network Data Transmission

In this section, possible wireless communication networks are investigated to find the optimal solutions for edge processing. In this cyber-physical system (CPS) [31], the near real-time data transmission between the operator and the edge processing unit is of importance for the operator’s decision-making; thus, the latency metric is considered to compare different technologies for evaluating the CPS. In locations where connectivity to 5G and 4G networks is not possible, the edge processing for GPR scanning of underground structures requires alternative fast, high-throughput networks. Therefore, we evaluated the possible alternatives to perform similar tasks by using long-range, high-throughput, and low-power IEEE 802.11ah (Wi-Fi HaLow) [32] and compared its performance with 2.4 GHz and 5 GHz IEEE 802.11ac Wi-Fi hotspots [33].
For this purpose, a network is created consisting of three single-board computers (Raspberry Pi 4 Model B) augmented with Wi-Fi HaLow HATs from AFLA. In this network configuration displayed in Figure 3, the first station chunks the B-scans (or F-scans) collected from the GSSI SIR-30 into packets and sends them with a delay to another station connected via the access point while timing the process.
For comparison, a similar configuration displayed in Figure 4, is set up by substituting the single-board computer with a Wi-Fi hotspot (HTC 5G hub or Orbic Speed 5G UW) through 2.4 GHz and 5 GHz IEEE 802.11ac Wi-Fi. The process of chunking the data and sending it to the other station continues until the B-scan completely transfers and the timed values of latency are compared.

2.3. Cellular Network Data Transmission

A similar arrangement of components was used to compare the latency of 4G and 5G connections on the Verizon mobile network. Figure 5 illustrates the path taken by the transmitted data. Data were generated, as described in Section 2.1, and transmitted from a single-board computer to an Orbic Speed 5G UW via Wi-Fi. Two tests were then performed using Orbic’s 4G and 5G connectivity through the Verizon network, connecting to a workstation approximately 1 mile from the lab. The packets were processed on this remote workstation and B-scans were returned to the single-board computer along the same path. Though F-scans were generated at the remote station, for simplicity only B-scans were transmitted.

3. Results

3.1. Visualization of Generated F-Scans via Hololense

The data transmitted for this experiment is intended to be used in the Microsoft HoloLens 2 system to enable simple visualization of GPR scans. The AR representation allows the user to inspect the subsurface thoroughly in the corresponding physical environment. Figure 6 shows this application in action in varied environmental conditions. The scans shown are positioned in the physical space manually by the user by aligning a virtual origin point with its physical counterpart. After placement, the user may move around the virtual objects as needed to inspect the represented subsurface.

3.2. Wireless Local Area Network Latency Comparison

The potential wireless communication networks are put to the test to verify their effectiveness in the edge processing of the GPR B-scans. For the comparison, a B-scan file of 2.7 megabytes is transferred using each Wi-Fi technology. A packet size of 32 bytes with a 0.5-millisecond delay was found to be optimal for this transmission case [34]. In the two setups, the access point and Wi-Fi hotspot are located at a distance of approximately 6 m apart from each other stations in another room of the building, with multiple objects placed between them. For each of the five configurations, the latency for each packet is plotted over the time delay to that packet and is shown in Figure 7.
In Figure 7, the latency is shown to be the lowest in the HaLow Wi-Fi setup (0.0062 ms) and the highest in the 2.4 GHz Orbic Wi-Fi hotspot setup (3.5 ms). Additionally, the HaLow Wi-Fi setup shows the lowest number of outliers compared with the other setups, indicating higher stability.
For comparison, Figure 8 depicts the resulting latencies versus time in one graph. While the maximum latency times can be interpreted with this graph, further statistical analysis is required to analyze the latency data in terms of consistency and performance.
Probability density histograms for each case are depicted in Figure 9 with each setup nominally following a log-normal distribution. From this figure, it can be interpreted visually that higher probability density in low latencies indicates better performance. By this standard, Wi-Fi HaLow shows its superiority in consistency and low latency compared with the other four cases. While Figure 9a shows several outliers for the Wi-Fi HaLow setup, the low probability density of these outliers indicates the stability of the Wi-Fi HaLow.
The numerical statistical values, such as mean, median, standard deviation, and total latency, are compared in the five network setup cases in Table 2. In this table, the HaLow setup has the lowest values for the four parameters. The HaLow is followed in performance by the Orbic setup and then by the HTC setup.

3.3. Cellular Network Latency Comparison

Similarly, latency values are calculated again, as described in Section 3.2, using a file of 395 kilobytes with a packet size of 32 bytes, and the corresponding parameters are calculated for comparison. Though a smaller file was utilized, using the same 32-byte packet size described in Section 3.1, the mean, median, maximum, and standard deviation of the recorded latencies will remain comparable.
Latency data collected in the cellular network case, shown in Figure 10 and Figure 11, indicated a minor increase in per-packet performance of the 5G network over 4G. Over the course of an entire data file, these minor increases compound into a more significant reduction in total latency. Figure 10a shows the packet latency for 4G technology while Figure 10b shows the packet latency for 5G technology.
Figure 11 shows the latency for both tests plotted together to better compare the two. It can be seen that for a majority of packets, the latency for 5G remains below that of 4G. It is also shown that the 5G network exhibits fewer outliers and is of smaller magnitude than its 4G counterparts.
These outliers are better illustrated in Figure 12a,b, which show the probability density of latency for 4G and 5G technologies, respectively. The probability density of the outliers depicted in Figure 11 is so low that it is not visible on the same axes. The mean, median, and standard deviation for each histogram are shown in Table 3, as well as the total latency.
The mean latency for 4G was found to be 0.0009 ms greater than in the 5G case; however, the median value was 0.0002 ms less in the 4G case than in 5G. The standard deviation was 0.0042 ms smaller in the 5G test, demonstrating the greater stability of the 5G connection. The total latency was found to be 11.864 ms shorter for 5G.
The mean latency time for transmitting the B-scan in each setup case is depicted in Figure 13 for a visual comparison. It can be observed that transmission over the HaLow Wi-Fi network resulted in a mean latency time that was 42.7% faster than the mean value of the other WLAN cases and performed 12.2% faster than the 5G network.

4. Discussion

The current method of associating local coordinates to each A-Scan is imprecise as it assumes an even distribution of scans along the entire survey line. As the GPR cart is triggered spatially by a survey wheel and the RealSense module is triggered temporally by the system clock, the two streams are not perfectly in sync and the association may become less accurate. This can be improved by tying the RealSense trigger to the survey wheel. In this arrangement, each pulse from the survey wheel causes both an A-Scan and a coordinate to be created simultaneously.
The process by which 3D models are created and made available to the HoloLens has not yet been automated, and as such still requires human intervention. In the future, this process will become automated, along with the expansion of the processing techniques applied to the scan, such as background removal and back projection for 3-D image formation.
Comparing the alternatives in the WLAN transmission of B-scan shows the advantage of using the Wi-Fi HaLow HAT setup for its low latency in comparison to the HTC and Orbic hotspots in conjunction with the single-board computer’s onboard Wi-Fi module. However, it should be noted that the performance of the Wi-Fi hotspots is limited by the onboard Wi-Fi technology of the single-board computers, which is entirely replaced in the HaLow setup.
Considering this fact, it is demonstrated that switching from the HTC Wi-Fi hotspot to the Orbic Wi-Fi hotspot lowers the mean latency values in both 2.4 and 5 GHz network cases, even though they are both restricted by the single-board computer’s onboard wireless communication technology. The improvement of the Orbic hotspot over the HTC hotspot may be due to the increased load the HTC experiences while running Android OS.
While comparing the 5G network to its last generation counterpart, e.g., 4G LTE, the tests show slight performance improvements. It is worth noting that the carrier used in this experiment does not offer its highest performance service, 5G UWB, in this test area. Future experiments will include multiple test periods; additional Orbic stations, allowing for more data to be collected concurrently; optimization of processing times to better characterize round-trip times; and evaluation of the 5G coverage of the test area for comparison to previous literature.
The proposed wireless communications methods satisfy the low latency data transfer requirements for near real-time edge computing and AR representation of the F-scans. Using this fast network, the operator can receive nearly real-time feedback from the experts and AR representation of the scan to adjust the path of the GPR scanning based on the new information.
Furthermore, by edge computing of the F-scans, the operators do not need to scan the entire area, as they can identify the important targets through AR representation or expert feedback in the field. Therefore, they can focus their efforts on scanning the paths that give necessary information about the target rather than scanning the entire area.
Comparing the WLAN and cellular network solutions presented here indicates comparable latency values between 5G and HaLow, but lower variance for 5G. While the performance is similar, it should be noted that the two systems are not interchangeable. To achieve the range allowed by cellular networks, multiple HaLow stations would be needed with each station increasing the total latency. This limitation is countered by the decentralized nature of HaLow technology.
Further efforts to characterize and compare the performance of WLAN and cellular networks may be aimed at examining the effects of network congestion and saturation by measuring packet latency in diverse geographic locations and times. Additionally, the number of intermediaries between the sender and receiver in the cellular network should be characterized, allowing for more uniformly comparable results.

Author Contributions

Conceptualization, A.F., N.H. and S.T.; methodology, A.F. and S.T.; software, A.F. and S.T.; investigation, A.F. and S.T.; formal analysis, A.F. and S.T.; resources, D.H. and T.X.; data curation, A.F., N.H. and S.T.; writing—original draft preparation, A.F., N.H. and S.T.; writing—review and editing, A.F. and S.T.; visualization, A.F. and S.T.; supervision, D.H. and T.X.; project administration, D.H.; funding acquisition, D.H. and T.X. All authors have read and agreed to the published version of the manuscript.

Funding

This research was funded by the U.S National Science Foundation awards 2119485 and 2345851.

Institutional Review Board Statement

Not applicable.

Informed Consent Statement

Not applicable.

Data Availability Statement

The original data presented in the study are openly available in EdgeComputingWithWirelessNetworks at https://github.com/scotttanch/EdgeComputingWithWirelessNetworks (accessed on 18 March 2024).

Conflicts of Interest

The authors declare no conflicts of interest.

References

  1. Jol, H.M. Ground Penetrating Radar Theory and Applications; Elsevier: Amsterdam, The Netherlands, 2008. [Google Scholar]
  2. Dell’Acqua, A.; Sarti, A.; Tubaro, S.; Zanzi, L. Detection of linear objects in GPR data. Signal Process. 2004, 84, 785–799. [Google Scholar] [CrossRef]
  3. Annan, A. GPR—History, trends, and future developments. Subsurf. Sens. Technol. Appl. 2002, 3, 253–270. [Google Scholar] [CrossRef]
  4. Solla, M.; Pérez-Gracia, V.; Fontul, S. A review of GPR application on transport infrastructures: Troubleshooting and best practices. Remote Sens. 2021, 13, 672. [Google Scholar] [CrossRef]
  5. Joshaghani, A.; Shokrabadi, M. Ground penetrating radar (GPR) applications in concrete pavements. Int. J. Pavement Eng. 2021, 23, 4504–4531. [Google Scholar] [CrossRef]
  6. Di Prinzio, M.; Bittelli, M.; Castellarin, A.; Pisa, P.R. Application of GPR to the monitoring of river embankments. J. Appl. Geophys. 2010, 71, 53–61. [Google Scholar] [CrossRef]
  7. Jiao, L.; Ye, Q.; Cao, X.; Huston, D.; Xia, T. Identifying concrete structure defects in GPR image. Measurement 2020, 160, 107839. [Google Scholar] [CrossRef]
  8. Ciuonzo, D.; Romano, G.; Solimene, R. Performance analysis of time-reversal MUSIC. IEEE Trans. Signal Process. 2015, 63, 2650–2662. [Google Scholar] [CrossRef]
  9. Devaney, A.J. Time reversal imaging of obscured targets from multistatic data. IEEE Trans. Antennas Propag. 2005, 53, 1600–1610. [Google Scholar] [CrossRef]
  10. Mazurkiewicz, E.; Tadeusiewicz, R.; Tomecka-Suchoń, S. Application of neural network enhanced ground-penetrating radar to localization of burial sites. Appl. Artif. Intell. 2016, 30, 844–860. [Google Scholar] [CrossRef]
  11. Dinh, K.; Gucunski, N.; Tran, K.; Novo, A.; Nguyen, T. Full-resolution 3D imaging for concrete structures with dual-polarization GPR. Autom. Constr. 2021, 125, 103652. [Google Scholar] [CrossRef]
  12. Pereira, M.; Burns, D.; Orfeo, D.; Zhang, Y.; Jiao, L.; Huston, D.; Xia, T. 3-D Multistatic Ground Penetrating Radar Imaging for Augmented Reality Visualization. IEEE Trans. Geosci. Remote Sens. 2020, 58, 5666–5675. [Google Scholar] [CrossRef]
  13. Childs, J.; Orfeo, D.; Burns, D.; Huston, D.; Xia, T. Enhancing Ground Penetrating Radar with Augmented Reality Systems for Underground Utility Management; SPIE: Bellingham, WA, USA, 2020; Volume 11426. [Google Scholar]
  14. Girard, J.; Burns, D.; Huston, D.; Xia, T. Penetrating Radar Combined with 3-D Imaging for Real-Time Augmented Reality Sensing and Classification; SPIE: Bellingham, WA, USA, 2021; Volume 11759. [Google Scholar]
  15. Omwenga, M.M.; Wu, D.; Liang, Y.; Yang, L.; Huston, D.; Xia, T. Cognitive GPR for Subsurface Object Detection Based on Deep Reinforcement Learning. IEEE Internet Things J. 2021, 8, 11594–11606. [Google Scholar] [CrossRef]
  16. Tsykunov, E.; Ilin, V.; Perminov, S.; Fedoseev, A.; Zainulina, E. Coupling of localization and depth data for mapping using Intel RealSense T265 and D435i cameras. arXiv 2020, arXiv:2004.00269. [Google Scholar]
  17. Bayer, J.; Faigl, J. On Autonomous Spatial Exploration with Small Hexapod Walking Robot using Tracking Camera Intel RealSense T265. In Proceedings of the 2019 European Conference on Mobile Robots (ECMR), Prague, Czech Republic, 4–6 September 2019; pp. 1–6. [Google Scholar]
  18. Newman, A.; Yang, G.; Wang, B.; Arnold, D.; Saniie, J. Embedded Mobile ROS Platform for SLAM Application with RGB-D Cameras. In Proceedings of the 2020 IEEE International Conference on Electro Information Technology (EIT), Chicago, IL, USA, 31 July–1 August 2020; pp. 449–453. [Google Scholar]
  19. Islam, M.; Jin, S. An overview research on wireless communication network. Networks 2019, 5, 19–28. [Google Scholar] [CrossRef]
  20. Frattasi, S.; Fathi, H.; Fitzek, F.H.P.; Prasad, R.; Katz, M.D. Defining 4G technology from the users perspective. IEEE Netw. 2006, 20, 35–41. [Google Scholar] [CrossRef]
  21. Khan, A.H.; Qadeer, M.A.; Ansari, J.A.; Waheed, S. 4G as a Next Generation Wireless Network. In Proceedings of the 2009 International Conference on Future Computer and Communication, Kuala Lumpar, Malaysia, 3–5 April 2009; pp. 334–338. [Google Scholar]
  22. Li, Q.C.; Niu, H.; Papathanassiou, A.T.; Wu, G. 5G Network Capacity: Key Elements and Technologies. IEEE Veh. Technol. Mag. 2014, 9, 71–78. [Google Scholar] [CrossRef]
  23. Al-Falahy, N.; Alani, O.Y. Technologies for 5G Networks: Challenges and Opportunities. IT Prof. 2017, 19, 12–20. [Google Scholar] [CrossRef]
  24. Hao, Y. Investigation and Technological Comparison of 4G and 5G Networks. J. Comput. Commun. 2021, 9, 36–43. [Google Scholar] [CrossRef]
  25. Lee, I.G.; Kim, D.B.; Choi, J.; Park, H.; Lee, S.K.; Cho, J.; Yu, H. WiFi HaLow for Long-Range and Low-Power Internet of Things: System on Chip Development and Performance Evaluation. IEEE Commun. Mag. 2021, 59, 101–107. [Google Scholar] [CrossRef]
  26. Adame, T.; Bel, A.; Bellalta, B.; Barcelo, J.; Oliver, M. IEEE 802.11 AH: The WiFi approach for M2M communications. IEEE Wirel. Commun. 2014, 21, 144–152. [Google Scholar] [CrossRef]
  27. Verhoeven, R.; Kempinski, S.; Meratnia, N. Performance Evaluation of Wi-Fi HaLow, NB-IoT and LoRa for Smart City Applications. In Proceedings of the 19th ACM International Symposium on Performance Evaluation of Wireless Ad Hoc, Sensor, & Ubiquitous Networks, Montreal, QC, Canada, 24–28 October 2022; pp. 17–24. [Google Scholar]
  28. Purat, J.; Lehmann, N.J.; Karagülle, M.-U.; Voisard, A. HaLowNet-A WiFi HaLow network-based information system for the provision of multi-sided applications for medical emergency scenarios. In Proceedings of the 2022 IEEE 10th International Conference on Healthcare Informatics (ICHI), Rochester, MN, USA, 11–14 June 2022; pp. 519–521. [Google Scholar]
  29. Utah, U.O. Vermont Researchers Use POWDER for Unique Testing. Available online: https://www.price.utah.edu/2022/09/19/vermont-researchers-uses-powder-for-unique-testing (accessed on 10 February 2023).
  30. Breen, J.; Buffmire, A.; Duerig, J.; Dutt, K.; Eide, E.; Hibler, M.; Johnson, D.; Kasera, S.K.; Lewis, E.; Maas, D. POWDER: Platform for open wireless data-driven experimental research. In Proceedings of the 14th International Workshop on Wireless Network Testbeds, Experimental evaluation & Characterization, London, UK, 25 September 2020; pp. 17–24. [Google Scholar]
  31. Fath, A.; Sauter, C.; Liu, Y.; Gamble, B.; Burns, D.; Trombley, E.; Sathi, S.K.R.; Xia, T.; Huston, D. HeSARIC: A Heterogeneous Cyber–Physical Robotic Swarm Framework for Structural Health Monitoring with Augmented Reality Representation. Micromachines 2025, 16, 460. [Google Scholar] [CrossRef] [PubMed]
  32. IEEE 802.11ah; IEEE Standard for Information Technology—Telecommunications and Information Exchange Between Systems—Local and Metropolitan Area Networks—Specific Requirements—Part 11: Wireless LAN Medium Access Control (MAC) and Physical Layer (PHY) Specifications—Amendment. IEEE Standards Association: Piscataway, NJ, USA, 2016. Available online: https://standards.ieee.org/ieee/802.11ah/4960/ (accessed on 9 June 2025).
  33. IEEE 802.11ac; IEEE Standard for Information Technology—Telecommunications and Information Exchange Between Systems—Local and Metropolitan Area Networks—Specific Requirements—Part 11: Wireless LAN Medium Access Control (MAC) and Physical Layer (PHY) Specifications. IEEE Standards Association: Piscataway, NJ, USA, 2013. Available online: https://standards.ieee.org/ieee/802.11ac/4473/ (accessed on 9 June 2025).
  34. Taha, M. An efficient software defined network controller based routing adaptation for enhancing QoE of multimedia streaming service. Multimed. Tools Appl. 2023, 82, 33865–33888. [Google Scholar] [CrossRef]
Figure 1. Schematic of the process to create F-Scans and wireless edge processing.
Applsci 15 06552 g001
Figure 2. Generation of an F-Scan in Blender: (a) merging of vertices to create a smoother path; (b) 3D model in open space.
Applsci 15 06552 g002
Figure 3. Network setup for transmitting data over Wi-Fi HaLow.
Applsci 15 06552 g003
Figure 4. Network setup for transmitting data over Wi-Fi hotspots.
Applsci 15 06552 g004
Figure 5. Flow of data through the networks and components of the proposed system. Solid lines indicate single hops, while dashed lines represent paths with an undetermined number of hops.
Applsci 15 06552 g005
Figure 6. A digitally rendered representation of F-scans in AR displayed over (a) snow-covered ground and, (b) uncovered ground.
Applsci 15 06552 g006
Figure 7. Latency test of B-scans transmission over (a) Wi-Fi HaLow, (b) 2.4 GHz HTC Wi-Fi hotspot, (c) 5 GHz HTC Wi-Fi hotspot, (d) 2.4 GHz Orbic Wi-Fi hotspot, and (e) 5 GHz Orbic Wi-Fi hotspot.
Applsci 15 06552 g007
Figure 8. Comparison of latency while transmitting B-scans over Wi-Fi HaLow, 2.4 GHz HTC Wi-Fi hotspot, 5 GHz HTC Wi-Fi hotspot, 2.4 GHz Orbic Wi-Fi hotspot, and 5 GHz Orbic Wi-Fi hotspot.
Applsci 15 06552 g008
Figure 9. Comparison of probability density in terms of latency while transmitting B-scans over (a) Wi-Fi HaLow and, (b) 2.4 GHz HTC Wi-Fi hotspot, (c) 5 GHz HTC Wi-Fi hotspot, (d) 2.4 GHz Orbic Wi-Fi hotspot, and (e) 5 GHz Orbic Wi-Fi hotspot.
Applsci 15 06552 g009
Figure 10. Packet latency for (a) 4G cellular and (b) 5G cellular.
Applsci 15 06552 g010
Figure 11. Packet latency for 4G and 5G technologies for each packet.
Applsci 15 06552 g011
Figure 12. Comparison of latency histograms for (a) 4G technology and (b) 5G technology.
Applsci 15 06552 g012
Figure 13. Comparison of mean latency time in each setup case using WLAN and cellular network transmission.
Applsci 15 06552 g013
Table 1. Literature review summary table.
StudiesFocus
Jol [1] and Dell’Acqua et al. [2]GPR Theories
Solla et al. [4], Joshaghani and Shokrabadi [5], and Di Prinzio et al. [6]GPR Applications
Pereira et al. [12], Childs et al. [13], and Girard et al. [14]GPR-AR
Mazurkiewicz et al. [10]GPR Neural Network
Tsykunov et al. [16]RealSense Camera for Localization
Newman et al. [18]RealSense Camera for SLAM
Islam and Jin [19]Wireless Networks
Frattasi et al. [20] and Khan et al. [21]4G Network
Li et al. [22]5G Network
Hao [24]4G and 5G Network Comparison
Lee et al. [25], Adame et al. [26], and Purat et al. [28]HaLow Network and applications
Verhoeven et al. [27]HaLow and LoRa Comparison
Table 2. Comparison of the five network setup cases using mean, median, standard deviation, and total latency statistical data.
Wi-Fi NetworkHaLow2.4 GHz HTC5 GHz HTC2.4 GHz Orbic5 GHz Orbic
Mean (ms)0.018610.033620.033660.031330.03134
Median (ms)0.014310.026460.026940.025750.02575
STD (ms)0.020020.035290.038370.036420.03277
Maximum (ms)1.116281.672273.158573.5035611.76930
Total Latency (ms)1598.112887.422891.372691.272692.15
Table 3. Comparison of the mean, median, and standard deviation for calculated transmission metrics.
Technology4G5G
Mean (ms)0.02210.0212
Median (ms)0.01670.0169
STD (ms)0.02150.0173
Maximum (ms)0.75860.3061
Total Latency (ms)279.923268.059
Disclaimer/Publisher’s Note: The statements, opinions and data contained in all publications are solely those of the individual author(s) and contributor(s) and not of MDPI and/or the editor(s). MDPI and/or the editor(s) disclaim responsibility for any injury to people or property resulting from any ideas, methods, instructions or products referred to in the content.

