Article

Mesoscale Modelling of the Mechanical Behavior of Metaconcretes

by
Antonio Martínez Raya
1,*,
Gastón Sal-Anglada
2,
María Pilar Ariza
3 and
Matías Braun
4
1
Department of Organizational Engineering, Business Administration and Statistics, School of Aeronautical and Space Engineering, Technical University of Madrid—Universidad Politécnica de Madrid (UPM), 28040 Madrid, Spain
2
Barcelona Supercomputing Center, Centro Nacional de Supercomputación (CNS), 08034 Barcelona, Spain
3
School of Engineering, University of Seville—Universidad de Sevilla (US), 41092 Seville, Spain
4
Research Group GREEN, Nebrija University—Universidad Nebrija (UAN), 28015 Madrid, Spain
*
Author to whom correspondence should be addressed.
Appl. Sci. 2025, 15(12), 6543; https://doi.org/10.3390/app15126543
Submission received: 4 May 2025 / Revised: 3 June 2025 / Accepted: 7 June 2025 / Published: 10 June 2025

Abstract

Featured Application

Metaconcrete-based materials offer a novel approach to controlling wave propagation, making them ideal for mitigating noise and vibration. Their selective attenuation of specific frequency ranges makes them a promising material for protective barriers, high-performance flooring, and resilient infrastructure in transportation and industrial settings. Refining the design of these materials through numerical modeling optimizes their mechanical performance for structural applications, which require both durability and resistance to dynamic loads.

Abstract

Metaconcrete (MC) is a class of engineered cementitious composites that integrates locally resonant inclusions to filter stress waves. While the dynamic benefits are well established, the effect of resonator content and geometry on static compressive resistance remains unclear. This study develops the first two-dimensional mesoscale finite-element model that explicitly represents steel cores, rubber coatings, and interfacial transition zones to predict the quasi-static behavior of MC. The model is validated against benchmark experiments, reproducing the 56% loss of compressive strength recorded for a 10.6% resonator volume fraction with an error of less than 1%. A parametric analysis covering resonator ratios from 1.5% to 31.8%, diameters from 16.8 mm to 37.4 mm, and coating thicknesses from 1.0 mm to 4.2 mm shows that (i) strength decays exponentially with volumetric content, approaching an asymptote at ≈20% of plain concrete strength; (ii) larger cores with thinner coatings minimize stiffness loss (<10%) while limiting strength reduction to 15–20%; and (iii) material properties of the resonator have a secondary influence (<6%). Two closed-form expressions for estimating MC strength and Young’s modulus (R2 = 0.83 and 0.94, respectively) are proposed to assist with the preliminary design. The model and correlations lay the groundwork for optimizing MC that balances vibration mitigation with structural capacity.

1. Introduction

Artificially structured materials designed to exhibit properties not typically found in nature are metamaterials. Their conceptual foundation dates back to the late 1960s, when Veselago [1] proposed the idea of materials with negative refractive indices, sparking broader research into the manipulation of waves. Initially explored for electromagnetic applications, metamaterials later demonstrated remarkable capabilities in acoustic domains, where engineered microstructures can selectively filter or redirect sound waves [2,3]. These systems can show negative effective mass or stiffness by exploiting local resonance phenomena, resulting in band gaps over specific frequency ranges [4,5]. Since then, numerous metamaterials have been developed, incorporating diverse mechanisms such as locally resonant structures, phononic crystals (PCs), and geometric-based resonators, each tailored to manipulate wave propagation in distinct ways [6,7,8,9,10,11,12,13,14,15,16]. Capitalizing on these properties, civil engineering researchers have introduced metaconcrete, which integrates resonant inclusions into conventional matrices to mitigate dynamic loads such as impact, blast, and seismic excitations [17,18,19,20]. This innovative approach exploits the unique wave-filtering properties of metamaterials to enhance structural resilience under various transient or vibrational conditions.
Unlike standard concrete, MC incorporates inclusions similar to rubber-coated steel balls or metallic cores with compliant coatings that resonate locally under dynamic loads [21,22]. This resonance phenomenon effectively filters or attenuates stress waves that pass through the material, reducing transmitted wave amplitudes and associated damage [23,24,25,26]. Early studies showed that researchers could tailor the resonant behavior by adjusting the geometry, coating thickness, material properties, and volume fraction of the inclusions [19,27,28]. Recent work on complex lattice-like inclusions has demonstrated that 3D resonator arrays can enhance vibration damping over a broader frequency range [29,30,31]. There are various practical applications of metaconcretes in specific civil engineering problems, such as the dissipation of impulsive loads (e.g., explosions) [32], their use in the design of new seismic protection systems [33,34], and vibration attenuation [35].
Despite notable advances in dynamic performance, recent studies have highlighted potential compromises in mechanical response when incorporating resonators. In particular, soft coatings, which are vital for local resonance, weaken interfacial bonds and create stress concentrations that undermine the quasistatic load-bearing capacity [36,37,38,39,40,41]. Some investigations have reported compressive strength reductions of up to 50% when adding resonators at just 10% by volume in concrete samples, underscoring the need to consider these design trade-offs carefully [36]. Such findings highlight the importance of comprehensively evaluating both dynamic and static requirements to optimize the performance of metaconcretes [40,42,43].
The available experimental evidence suggests that adequately adjusting the resonator’s stiffness, the coating’s thickness, and the volume fraction can yield metaconcretes with compressive strengths comparable to those of conventional concretes [40]. Achieving this balance requires a deep understanding of the underlying failure mechanisms.
A growing body of research has employed mesoscale numerical models to elucidate the mechanical response of metaconcretes. For instance, Xu et al. [44] developed a finite-element model of metaconcrete bars subjected to impulsive loading and validated it experimentally. Mitchell et al. [17] introduced the concept of metaconcrete by substituting conventional aggregates with specifically designed resonant inclusions, demonstrating a significant attenuation of shock waves and vibrations through Finite Element Method (FEM) simulations. Zhang et al. [45] further explored this approach by numerically investigating dual-resonant aggregates in metaconcrete, revealing enhanced wave attenuation and tunable bandgap properties.
In parallel, studies employing the Discrete Element Method (DEM) have also contributed essential insights. Han and Lu [46] investigated the forced vibration-damping characteristics of metaconcrete at the unit-cell scale, optimizing aggregate selection to enhance vibrational mitigation. Additionally, Han and Lu [47] examined nonlinear vibration behaviors of single aggregate systems within metaconcretes, demonstrating how resonator design can significantly impact dynamic performance.
Notwithstanding these advances, existing numerical studies typically assume regularly arranged resonators, whereas practical castings are expected to exhibit a random spatial distribution of inclusions within the cementitious matrix. Furthermore, most investigations have primarily focused on predicting eigenfrequencies and associated band gaps as functions of resonator type and volume fraction, leaving the impact of resonator incorporation on the quasi-static compressive strength of metaconcretes largely unexplored. This study explicitly addresses this gap by investigating the mechanical response of metaconcrete under quasi-static loading conditions with randomly distributed resonators, thus establishing the novelty and relevance of the research approach.
To this end, the present study introduces a mesoscale numerical model (the first of its kind dedicated to capturing the mechanical behavior of metaconcretes) that explicitly accounts for heterogeneous material distributions and interfacial mechanics. Following validation of the model against experimental data sets from the literature [36], the research team investigated the effects of varying resonator size, content, and distribution on static compressive performance. The study offers critical insights into these factors, laying the groundwork for the rational design of multifunctional metaconcretes that can mitigate dynamic hazards while maintaining a reasonable load-bearing capacity.
This paper aims to shed light on the proper empirical studies conducted using a mesoscale numerical model to simulate the compressive response of MCs, organized into the following seven main sections. The first section provides a brief explanation of the reason behind the approach. In the second section, the authors describe the research design using a description of the method. The third section details the validation of the specific model. The fourth section presents the main findings of the empirical approach. The fifth section explains how to analyze the results to gain further information on the research issue. The sixth section summarizes the conclusions based on the results. Finally, the seventh section deals with research limitations and future directions.

2. Description of the Numerical Model

A custom Python script constructs the FEM using Abaqus (2017 version), automating the entire process from geometry creation to meshing, material assignment, assembly, and load application.
The two-dimensional specimen has a height of 200 mm and a width of 100 mm. Consequently, the study randomly embedded circular resonators within this rectangular concrete matrix until the desired area fraction was reached. Each resonator comprises three regions: an internal steel core that provides high stiffness, a compliant annular rubber coating designed to introduce flexibility, and an interfacial transition zone (ITZ), which is explicitly modeled as a thin layer (0.1 mm) surrounding each resonator [48]. The ITZ represents a weak bonding interface between the concrete and the resonator, which captures local effects such as stress concentrations and potential debonding phenomena. A random positioning algorithm prevents resonator overlaps, thus ensuring a minimum separation distance between each other and specimen boundaries. A recursive verification routine iteratively reassigns positions whenever an overlap occurs. Figure 1 shows a schematic illustration of the resonator configuration.
Each model component is assigned specific material properties to represent its mechanical response accurately. These models are based on the concrete damaged plasticity (CDP) model, which is used to capture material fracture. This constitutive model can simulate nonlinear behavior and damage evolution under compressive loading by accounting for both tensile cracking and compressive crushing. The CDP model provides a realistic representation of failure mechanisms in concrete-like materials. The CDP model represents concrete and ITZ, while the rubber coating and steel core are expressed as linear elastic materials.
Instantiating the concrete sample with each resonator component—including the ITZ, rubber coating, and steel core—creates the assembly. The interaction between the different phases has been modeled with perfect adhesion using a tie contact approach, which allows for an accurate representation of the system when phases are in mutual contact [49]. Adopting a tie contact enables the independent meshing of each phase, thereby avoiding the need for node matching at the interfaces and simplifying model generation, particularly when the inclusions are randomly distributed. Because the tie constraint interpolates displacements without permitting separation or sliding, the associated computational cost remains low for two-dimensional analyses.
For the loading scenario, a smooth displacement load is applied to the top edge of the concrete sample, while the bottom edge is fully fixed to simulate support. An explicit dynamics step, with automatically controlled time incrementation, is defined to capture the quasistatic compressive response, employing explicit integration throughout the simulation. According to the data summarized in Table 1, the complete model generation has been automated via Abaqus’ Python scripting interface. This script sets key simulation parameters (e.g., material properties, boundary conditions, and load amplitudes), generates specimen geometry with randomly distributed inclusions, and performs meshing operations for each part. Moreover, CDP parameters are calibrated by comparing numerical predictions with experimental data [36], ensuring that the simulated response accurately reflects the behavior of the observed material.

3. Validation of the Proposed Model

This section is devoted to validating the proposed model based on the experimental results reported in [36]. Simple compression tests were conducted on cylindrical high-strength concrete specimens, each measuring 20 cm in height and 5 cm in diameter. Two configurations were considered: the first consisted of a plain concrete specimen, whereas the second involved a concrete specimen containing 10.6% resonators. These resonators comprise a spherical steel core with a diameter of 15.4 mm, covered by a 2.3 mm-thick layer of rubber.
The mechanical properties of the concrete were obtained from the work published by Xu et al. [36]. According to that study, the concrete exhibits a Young’s modulus of 25.42 GPa, a Poisson’s ratio of 0.173, a density of 2183 kg/m3, a compressive strength of 67.49 MPa, and a failure strain of 0.38%.
Regarding the characterization of the ITZ’s mechanical behavior, the same values used for the concrete were adopted, except for the strength, which was set to 50% of that of the concrete (33.75 MPa) [48]. An ITZ thickness of 0.1 mm was also considered [40,50,51,52].
The properties of steel and rubber materials were assumed to behave linearly when modeling the resonators. A Young’s modulus of 210 GPa, a Poisson’s ratio of 0.3, and a 7800 kg/m3 density were adopted for steel. A Young’s modulus of 50 MPa, a Poisson’s ratio of 0.5, and a 1300 kg/m3 density were considered for the rubber. Four-node plane–stress elements with reduced integration (CPS4R) from the Abaqus/Explicit library were employed [49].
Figure 2 shows the stress–strain curves obtained from compression tests on concrete specimens, including the three specimens tested in earlier experiments [36], as well as the curve obtained from the implemented FEM. Consequently, the constitutive model parameters employed to delineate the concrete’s mechanical behavior exhibit high congruence with the experimental outcomes.
To quantitatively compare the numerical results with the experimental data, Table 2 provides a comparison of the mean values and standard deviations of Young’s modulus ( E ), and the compressive strength ( f c ). Young’s modulus was calculated from the stress–strain curves through the following expression [53]:
E = σ 2 σ 1 ε 2 0.00005 ,
where σ 1 corresponds to the stress at a strain of 0.005%, and σ 2 and ε 2 are the stress and strain at 40% of the failure stress. The results in Table 2 indicate that the CDP model, utilizing the established concrete parameters, exhibits a high degree of compatibility with the experimental data. Thus, the proposed model exhibits strong alignment with Young’s modulus and the strength parameters, with deviations of less than 4%.
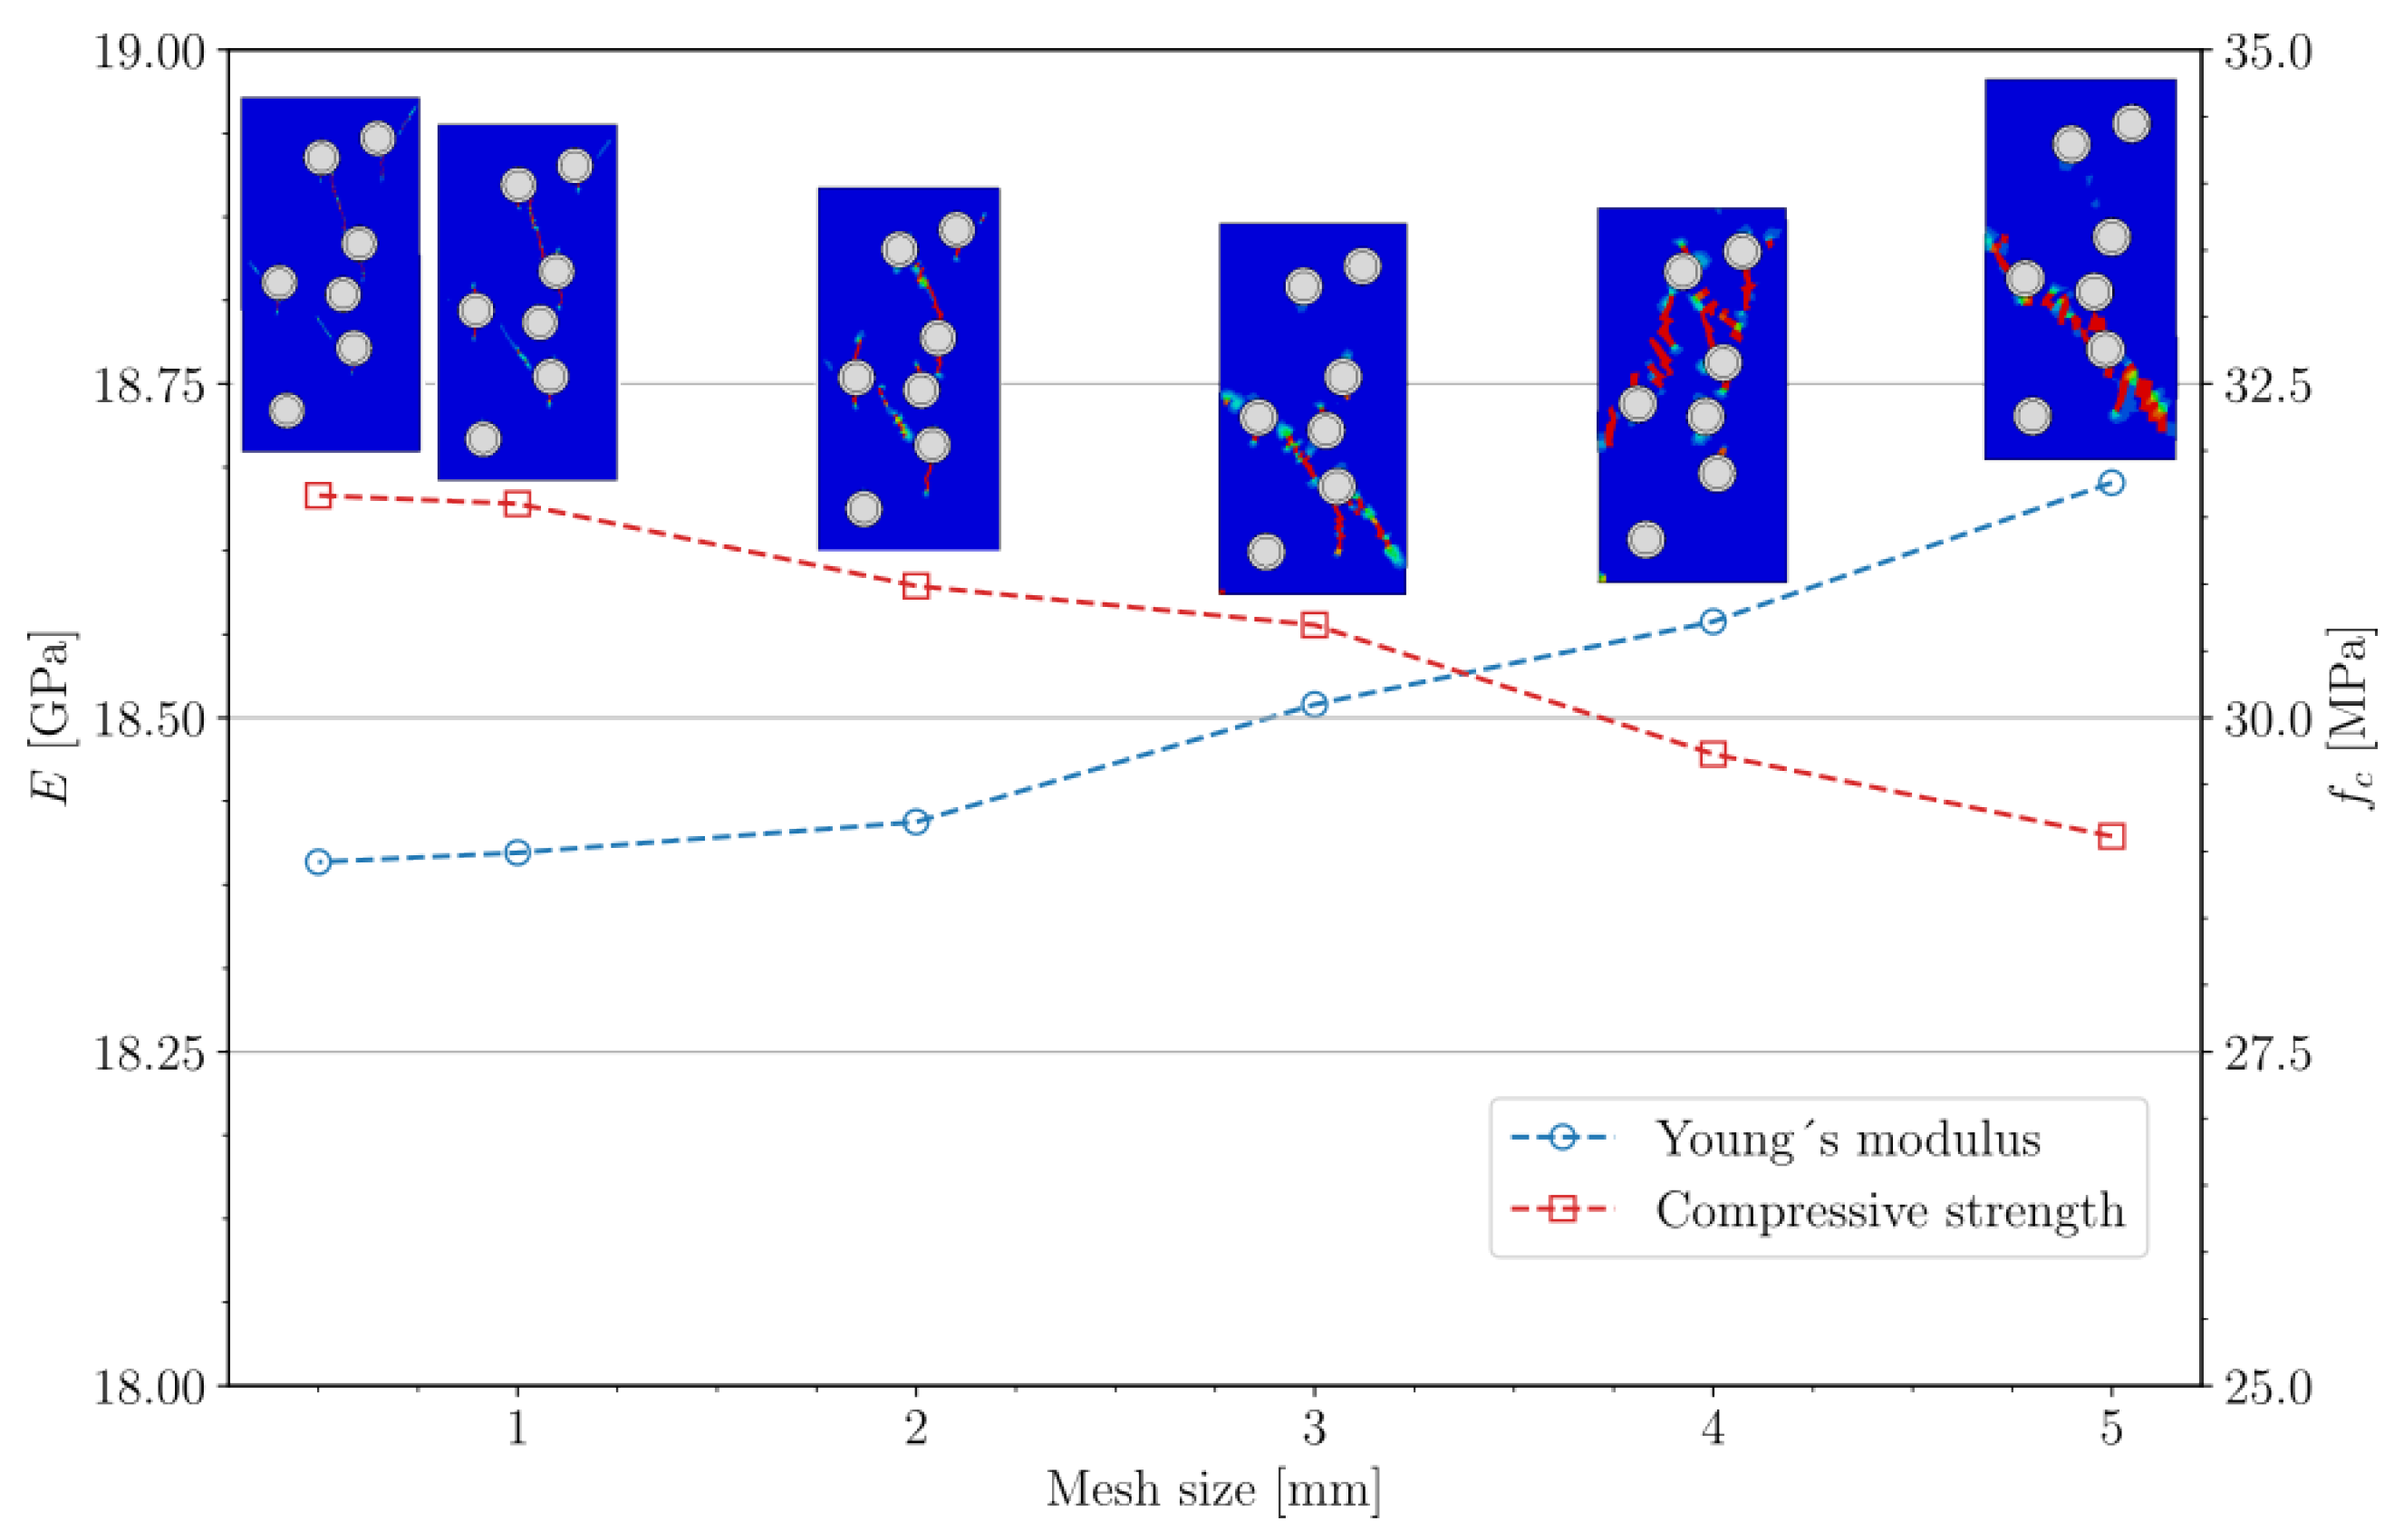
Three FEMs, each showing a distinct distribution of resonators within the concrete matrix, were created for the specimen with resonant inclusions. Following the execution of a mesh-size sensitivity study, an element size of 1.0 mm was selected. To perform a mesh size sensitivity analysis, element sizes of 0.5, 1.0, 2.0, 3.0, 4.0, and 5.0 mm were considered. As shown in Figure 3, the mesh-size sensitivity analysis was based on Young’s modulus, compressive strength, and the cracking pattern (inferred from the tensile damage variable). In the CDP model, the degradation of tensile strength is tracked through a scalar variable representing tensile damage. The value of the scalar tensile-damage variable is equal to 0 when the material is undamaged (see blue elements in the figure). Conversely, a value close to 1 indicates complete tensile failure (see red elements in the figure). Consequently, mapping the spatial distribution of the scalar tensile-damage variable offers an indirect representation of cracks. Refinement of the mesh reveals that the predominant crack trajectories align vertically, in agreement with the experimental results cited above [36]. All three parameters converge reasonably well from a mesh size of 1.0 mm onward.
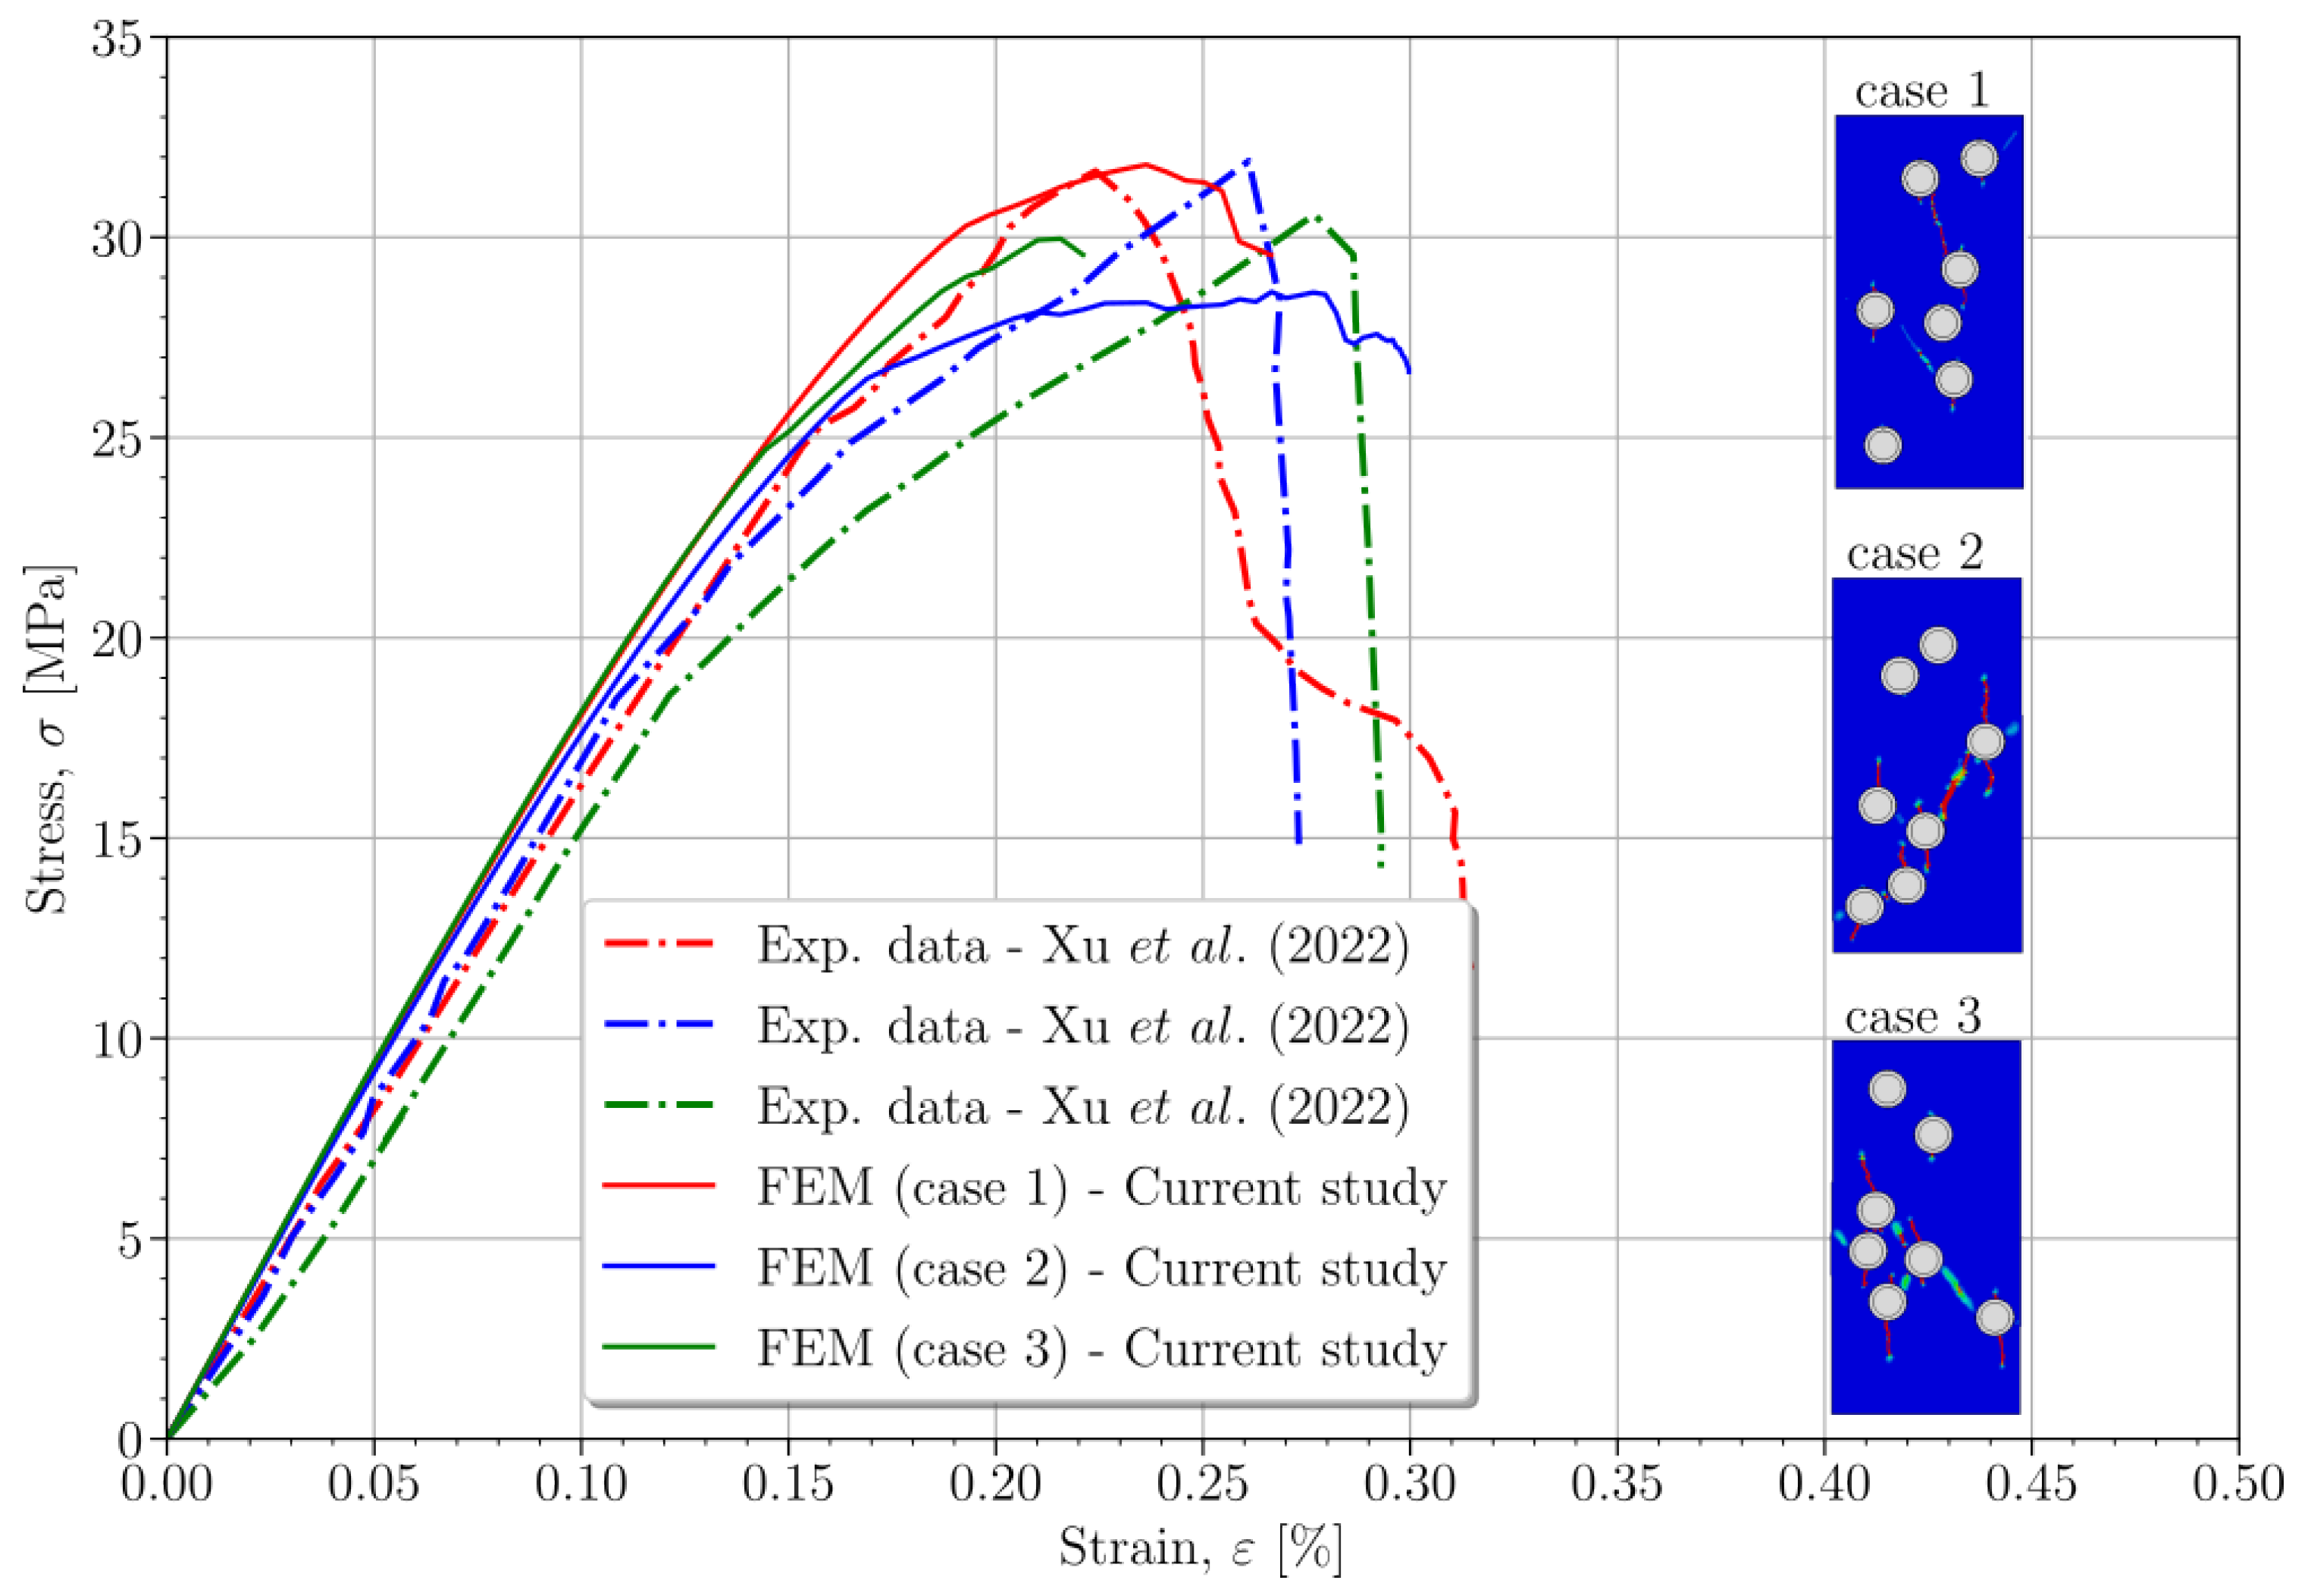
As shown in Figure 4, stress–strain curves have been obtained from these three configurations using the proposed model and compared to the three experimental curves reported in [36]. In addition, the figure presents the cracking patterns obtained for each analyzed case. The numerical results show good agreement with the experimental data.
Table 3 shows the mean values and standard deviations (SD) of Young’s modulus and compressive strength for concrete specimens containing 10.6% resonators. Based on a comparison between experimental data obtained from the study and those collected from FEM results, the investigation showed that the predicted Young’s modulus exhibits an error of about 20%. In contrast, the compressive strength error remains below 1%. Acknowledging the substantial discrepancy observed in the prediction of Young’s modulus is imperative. However, the lack of information on rubber characteristics in Xu et al.’s experiments explains this difference [36]. Consequently, generic values for the rubber’s Young’s modulus were used to estimate the material properties.
These findings suggest that the proposed model accurately captures the mechanical behavior of metaconcretes, particularly in predicting Young’s modulus and key strength parameters, including compressive strength and failure strain.

4. Results

This section presents a consistent interpretation of the experimental results, grounded in findings from the model developed in Section 3.

4.1. Effect of the Resonator Ratio

This subsection analyzes the effect of varying the resonator ratio, ρ , within the concrete matrix. This research study addressed different resonator contents ranging from 1.5% to 31.8%. For each case, five FEMs were created, each with a distinct spatial distribution of the resonators, and the corresponding stress–strain curves were obtained. From these curves, Young’s modulus and the compressive strength were determined.
Table 4 presents the mean values, SDs of Young’s modulus and compressive strength, and the number of resonators considered for each resonator ratio. As can be observed, there is little dispersion in the results due to the resonators’ spatial distribution, as evidenced by the low standard deviation (SD) values below 3% for both Young’s modulus and compressive strength.
Figure 5 shows the mean normalized values of Young’s modulus, compressive strength, and crack patterns as a function of the resonator content. The Young’s modulus and compressive strength of the concrete normalized these mean values without resonators ( E 0 = 25.42 GPa and f c 0 = 67.49 MPa, respectively). In this figure, it can be observed that, as expected, both the compressive strength and Young’s modulus decrease with an increasing resonator ratio. Increasing the resonator ratio leads to a marked reduction in Young’s modulus, which is consistent with the predictions of a mixing law [54,55]. Moreover, incorporating a single resonator leads to a reduction of more than 25% in compressive strength. Due to the addition of further resonators, the compressive strength approaches an asymptotic value, reaching approximately 20% of the compressive strength of concrete without resonators. This trend is also evident in rubberized concrete [56], where the inclusion of a small proportion of rubber results in a significant decrease in compressive strength; however, further increases in rubber content lead to an asymptotic increase in compressive strength. Observation of the cracking patterns reveals that cracks initiate at the resonators, preferentially at their lower and/or upper extremities. These cracks follow predominantly vertical trajectories, consistent with the experimental observations reported in [36]. The existence of connections among resonators suggests that the crack paths become more erratic as the resonator ratio increases.

4.2. Effect of Resonator Dimensions

4.2.1. Combined Effect of Resonator Diameter and Coating Thickness

Resonators are typically designed to yield a specific natural frequency through their dimensions. This target frequency can be estimated using the following equation [17,18]:
f ( Hz ) = 1 2 π 3 2 E r ρ c t R c ,
where ρ c is the density of the core material, R c is the radius of the core, t is the thickness of the coating, and E r is the Young’s modulus of the rubber. Equation (2) provides an estimated resonant frequency that serves as a reference for examining wave transmission behavior.
For the resonators considered in this study (see Section 3), the target resonant frequency is 3696 Hz. In this section, we investigate the effect of resonator size on the mechanical properties of the concrete. To this end, a series of resonator sizes were evaluated, all designed to achieve a resonant frequency of 3696 Hz (calculated from Equation (2)) while maintaining a constant resonator ratio of 10.6%. Table 5 summarizes the rubber coating thickness, steel core diameter, overall resonator diameter, and the number of resonators within the concrete matrix that were considered in this analysis.
Figure 6 displays the meaning of normalized values of Young’s modulus and compressive strength as functions of the resonator diameter ( D a ) and the coating thickness ( t ). As in previous cases, these values are normalized for specimens without resonators. The results indicate that the variation in Young’s modulus is below 10%, while the compressive strength varies by approximately 15–20%. The data suggest that employing larger resonators with thinner coatings is more advantageous. Additionally, the figure includes representative cracking patterns. The observed patterns indicate that cracks initiate at the interface between the concrete and the resonator and tend to propagate along pathways that connect adjacent resonators. As the number of resonators increases, these preferential paths multiply, reducing the effective load-bearing area and thereby explaining the observed decrease in compressive strength.
Table 6 presents the mean values and SDs of Young’s modulus and compressive strength for various resonator diameters. This means that both Young’s modulus and compressive strength decrease as the resonator diameter decreases. Moreover, compressive strength exhibits a higher standard deviation—approximately 10%—compared to about 2% for Young’s modulus. This suggests that the spatial distribution of resonators has a more significant influence on compressive strength than on Young’s modulus.
In essence, utilizing larger resonators while maintaining the same total inclusion volume through the employment of thinner rubber coatings and a reduced number of units can result in a delay in the degradation of compressive strength, despite a modest gain in overall stiffness.

4.2.2. Combined Effects of Core Size and Coating Thickness

This subsection examines the combined influence of the rubber coating thickness surrounding the steel resonators and the corresponding variation in core size on the compressive mechanical behavior of MCs. Whilst analyzing this effect, numerical simulations were indeed conducted by varying the rubber thickness ( t ) while keeping the total metamaterial diameter constant ( D a = 20 mm) and maintaining a fixed resonator volume fraction of ρ = 10.6%. This implies that the core diameter ( D c ), defined as D c = D a 2 t , decreases as the rubber thickness increases.
By modifying t , the steel resonator’s core size is also altered, which can significantly impact the composite material’s stiffness distribution and mechanical performance. Five random spatial configurations of resonators were generated for each rubber thickness to account for variability in spatial distribution.
The influence of these geometric variations was analyzed by measuring the compressive strength ( f c ) and Young’s modulus ( E ). Table 7 presents the mean values and SDs for different rubber thicknesses, highlighting the simultaneous changes in D c .
As the rubber coating thickness increases (resulting in a reduction of D c ), a decrease in compressive strength is observed, while variations in Young’s modulus remain relatively small. This suggests that the core size reduction, combined with the increase in rubber content, plays a critical role in the overall mechanical response. The SD values indicate the dispersion of measurements around the mean, providing insight into the consistency and reliability of the results.
Figure 7 presents the normalized values of Young’s modulus and compressive strength to facilitate the interpretation of trends. The normalization was performed relative to the reference properties of plain concrete without resonators ( E 0 = 25.42 GPa and f c 0 = 67.49 MPa, respectively). Normalized values enable a more straightforward comparison of relative changes across different rubber thicknesses while maintaining a dimensionless representation of mechanical performance. Figure 7 illustrates the relationship between rubber thickness, core size, and the normalized values of Young’s modulus and compressive strength. A clear trend emerges since t increases and D c decreases, while compressive strength progressively declines, and, in addition, Young’s modulus remains relatively stable over the studied range.
This behavior suggests that the decrease in compressive strength is closely linked to the reduction in core size rather than solely to the addition of rubber. As the steel resonator shrinks, its ability to contribute to mechanical resistance decreases, resulting in a more pronounced weakening effect in the composite structure.

4.3. Effect of Material Properties

This section examines the effect of varying the elastomer material coating and the core of the resonators. For this purpose, a case study was selected from the specimen modeled in Section 3 for mesh size analysis. In this specimen, 10.6% of the resonators are embedded in concrete. Each resonator has an overall diameter of 20 mm, a steel core diameter of 15.4 mm, and a rubber coating thickness of 2.3 mm.
Considering that Young’s modulus of an elastomer can range from 10−4 GPa to 10−1 GPa [19,57], the following values were examined: 100, 50, 25, 1, and 0.1 MPa. Two core materials were considered for each coating material: 210 GPa for steel and 16 GPa for lead. All other parameters were kept constant.
As illustrated in Figure 8, the values of Young’s modulus and compressive strength for the diverse materials under consideration for the resonators are presented. The data show that modifying the core and coating materials does not substantially influence the composite’s macroscopic mechanical properties. Our findings suggest that Young’s modulus is less sensitive to these alterations than the compressive strength. However, it is noteworthy that altering the Young’s modulus of the coating can result in an approximately 6% variation in compressive strength. Furthermore, the core material selection appears to exert minimal influence on the mechanical response, at least within the scope of the resonator dimensions considered in this study. Crack patterns were also not presented, as they remained unchanged when Young’s modulus of the resonator materials was modified. Furthermore, as previously shown in Figure 3, they are identical to those calculated with a mesh size of 1 mm. These trends indicate that, under quasi-static compression, each resonator functions mechanically as an almost stress-free cavity rather than as a load-bearing inclusion. The significant disparity in stiffness between the concrete matrix and the compliant coating effectively decouples the solid core from the external field, thereby negating the core’s inherent stiffness (steel versus lead) from significantly impacting the global response. Consequently, variations in the core or coating materials within the examined ranges do not alter the crack trajectory or the overall load-displacement curve. The resonators replace an equivalent volume of concrete with void-like regions, which govern the observed 6% fluctuation in compressive strength while leaving Young’s modulus virtually unchanged.

5. Discussion

The results presented in the previous section reveal several vital insights regarding the influence of resonator characteristics on the mechanical properties of MCs.
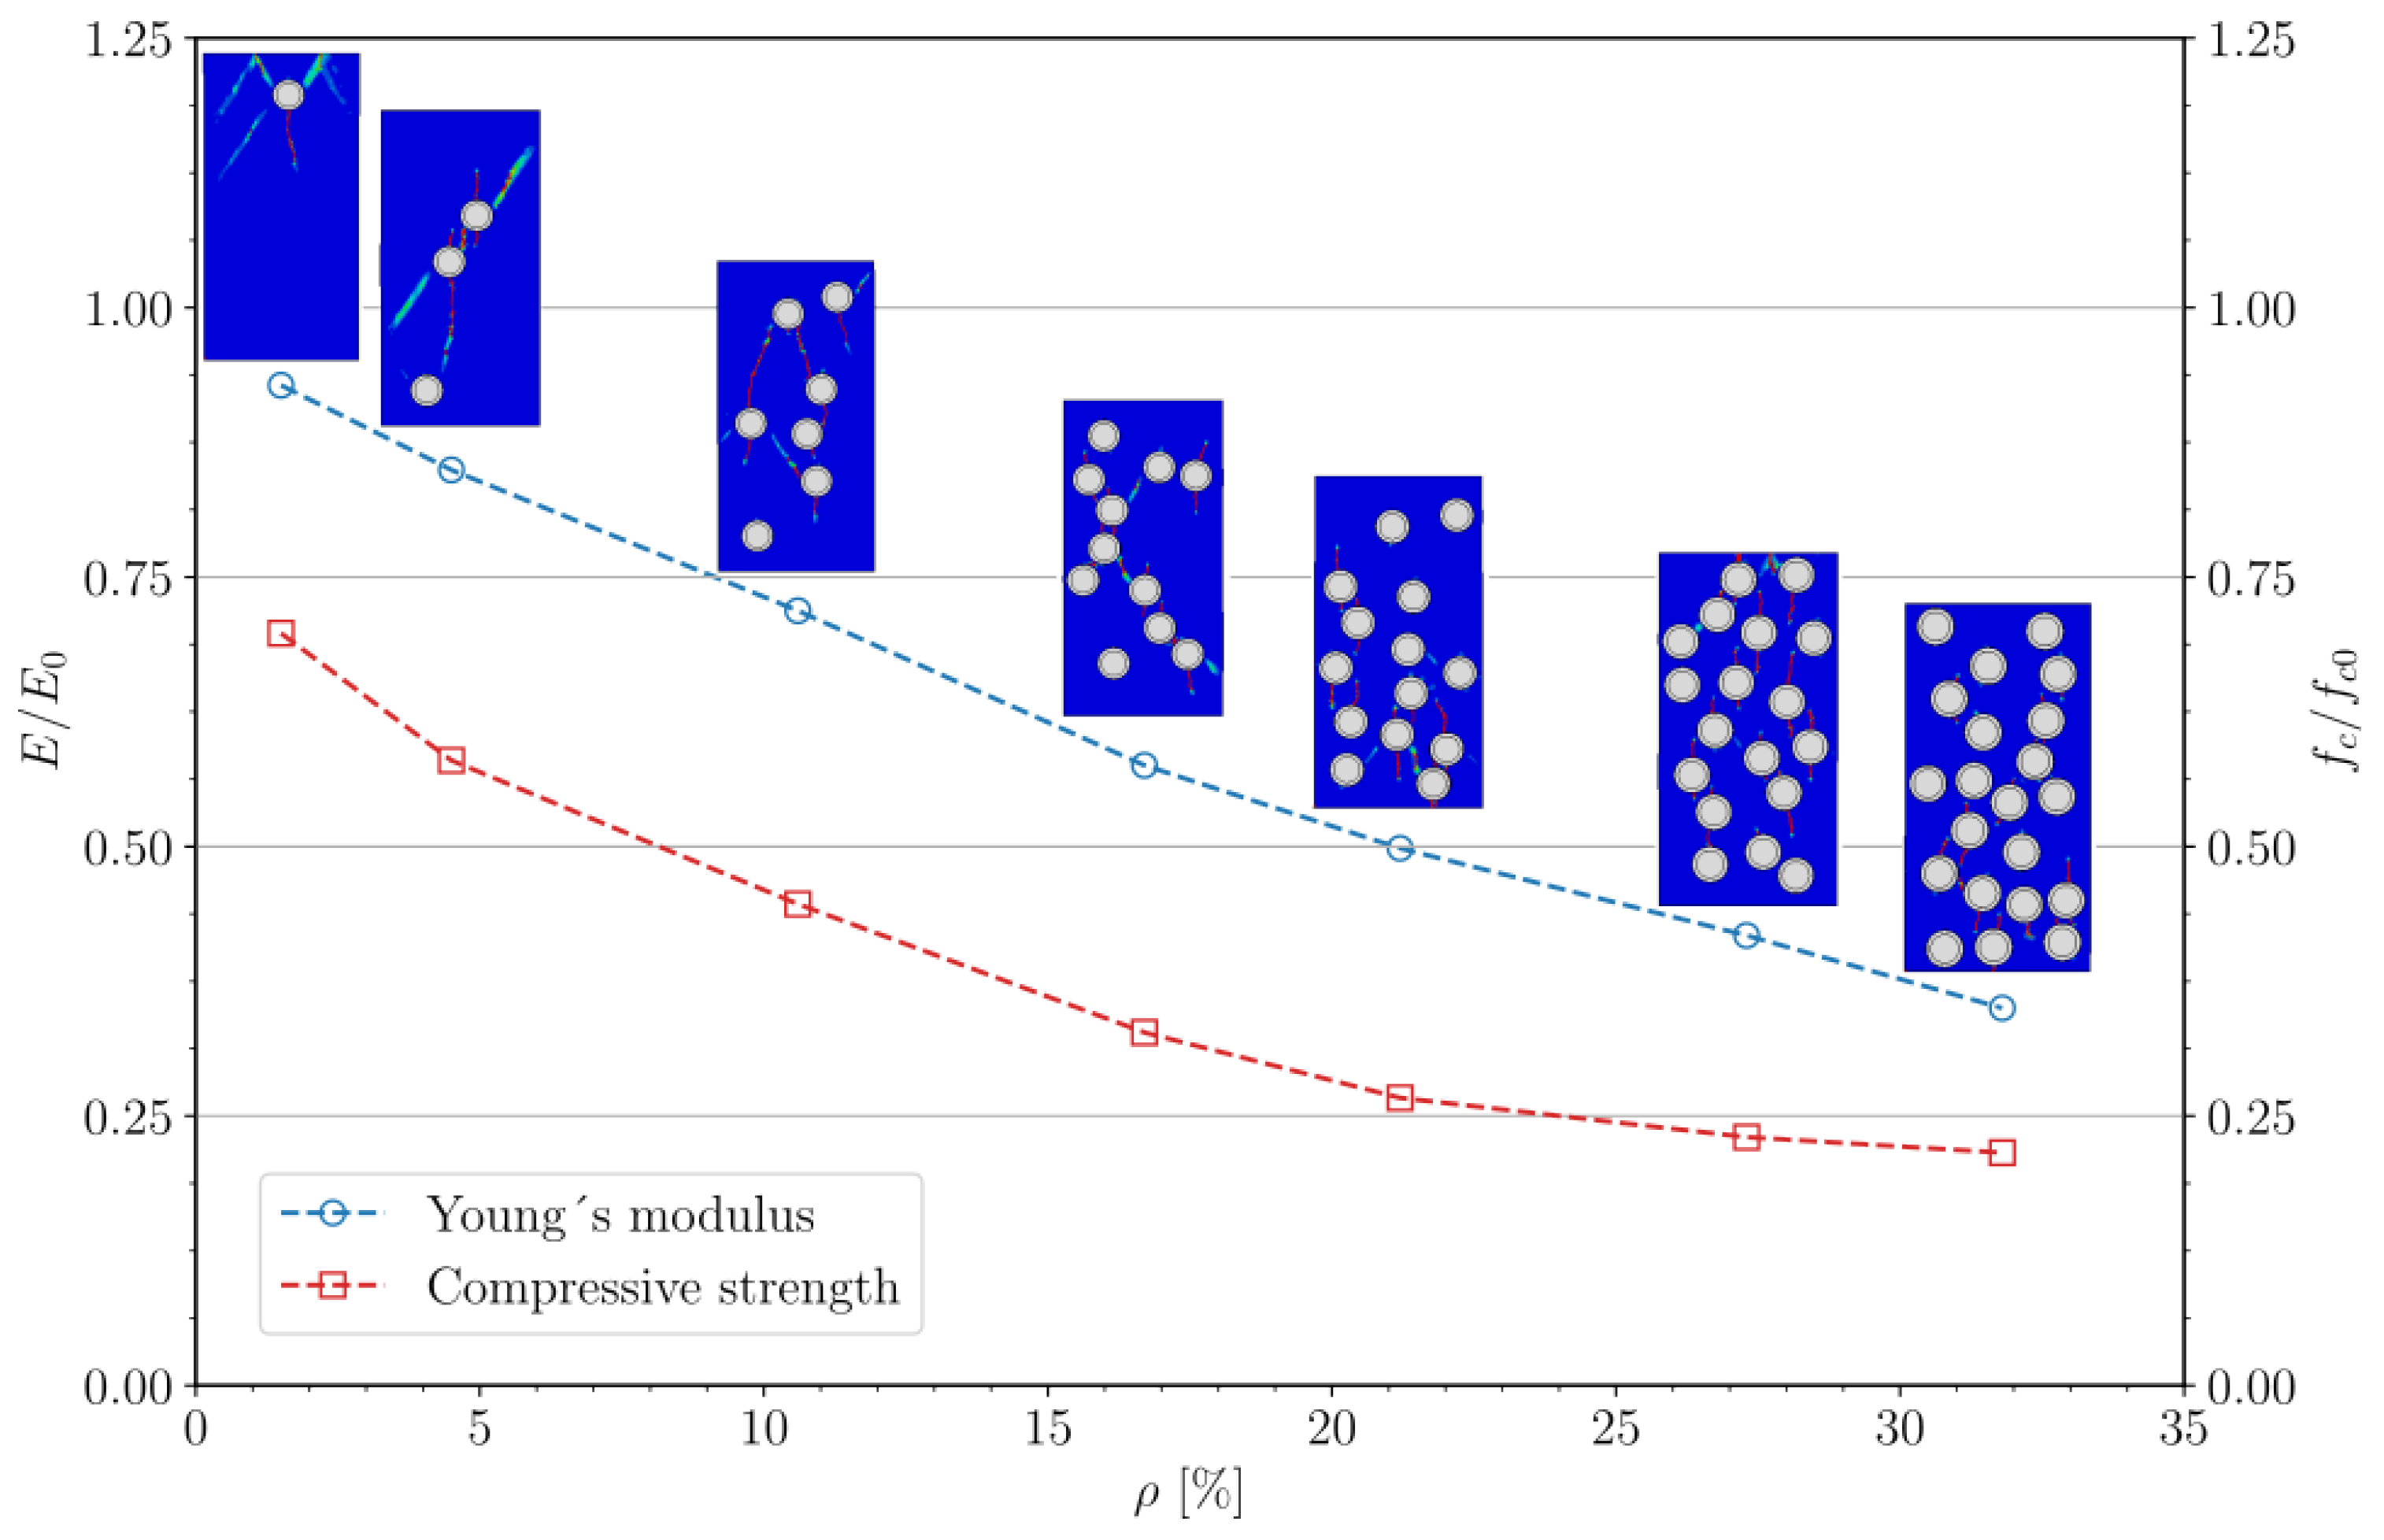
First, the analysis of the resonator ratio shows a clear trend: both Young’s modulus and compressive strength decrease with increasing resonator ratio. Notably, the compressive strength experiences a pronounced reduction, exceeding 25% with the inclusion of just one resonator, before approaching an asymptotic value that is approximately 20% lower than that of the plain concrete. The observed asymptotic behavior can be attributed to localized weakening around the inclusion. Once enough resonators are included, further increments in damage and crack initiation produce limited additional global weakening, as these phenomena dominate the overall response. This behavior is consistent with a mixing law [54,55], where the addition of a secondary phase (in this case, resonators) progressively diminishes the effective load-bearing area. The low dispersion in the measured values (SDs below 3%) confirms that the spatial distribution of resonators has a relatively minor effect on these macroscopic properties.
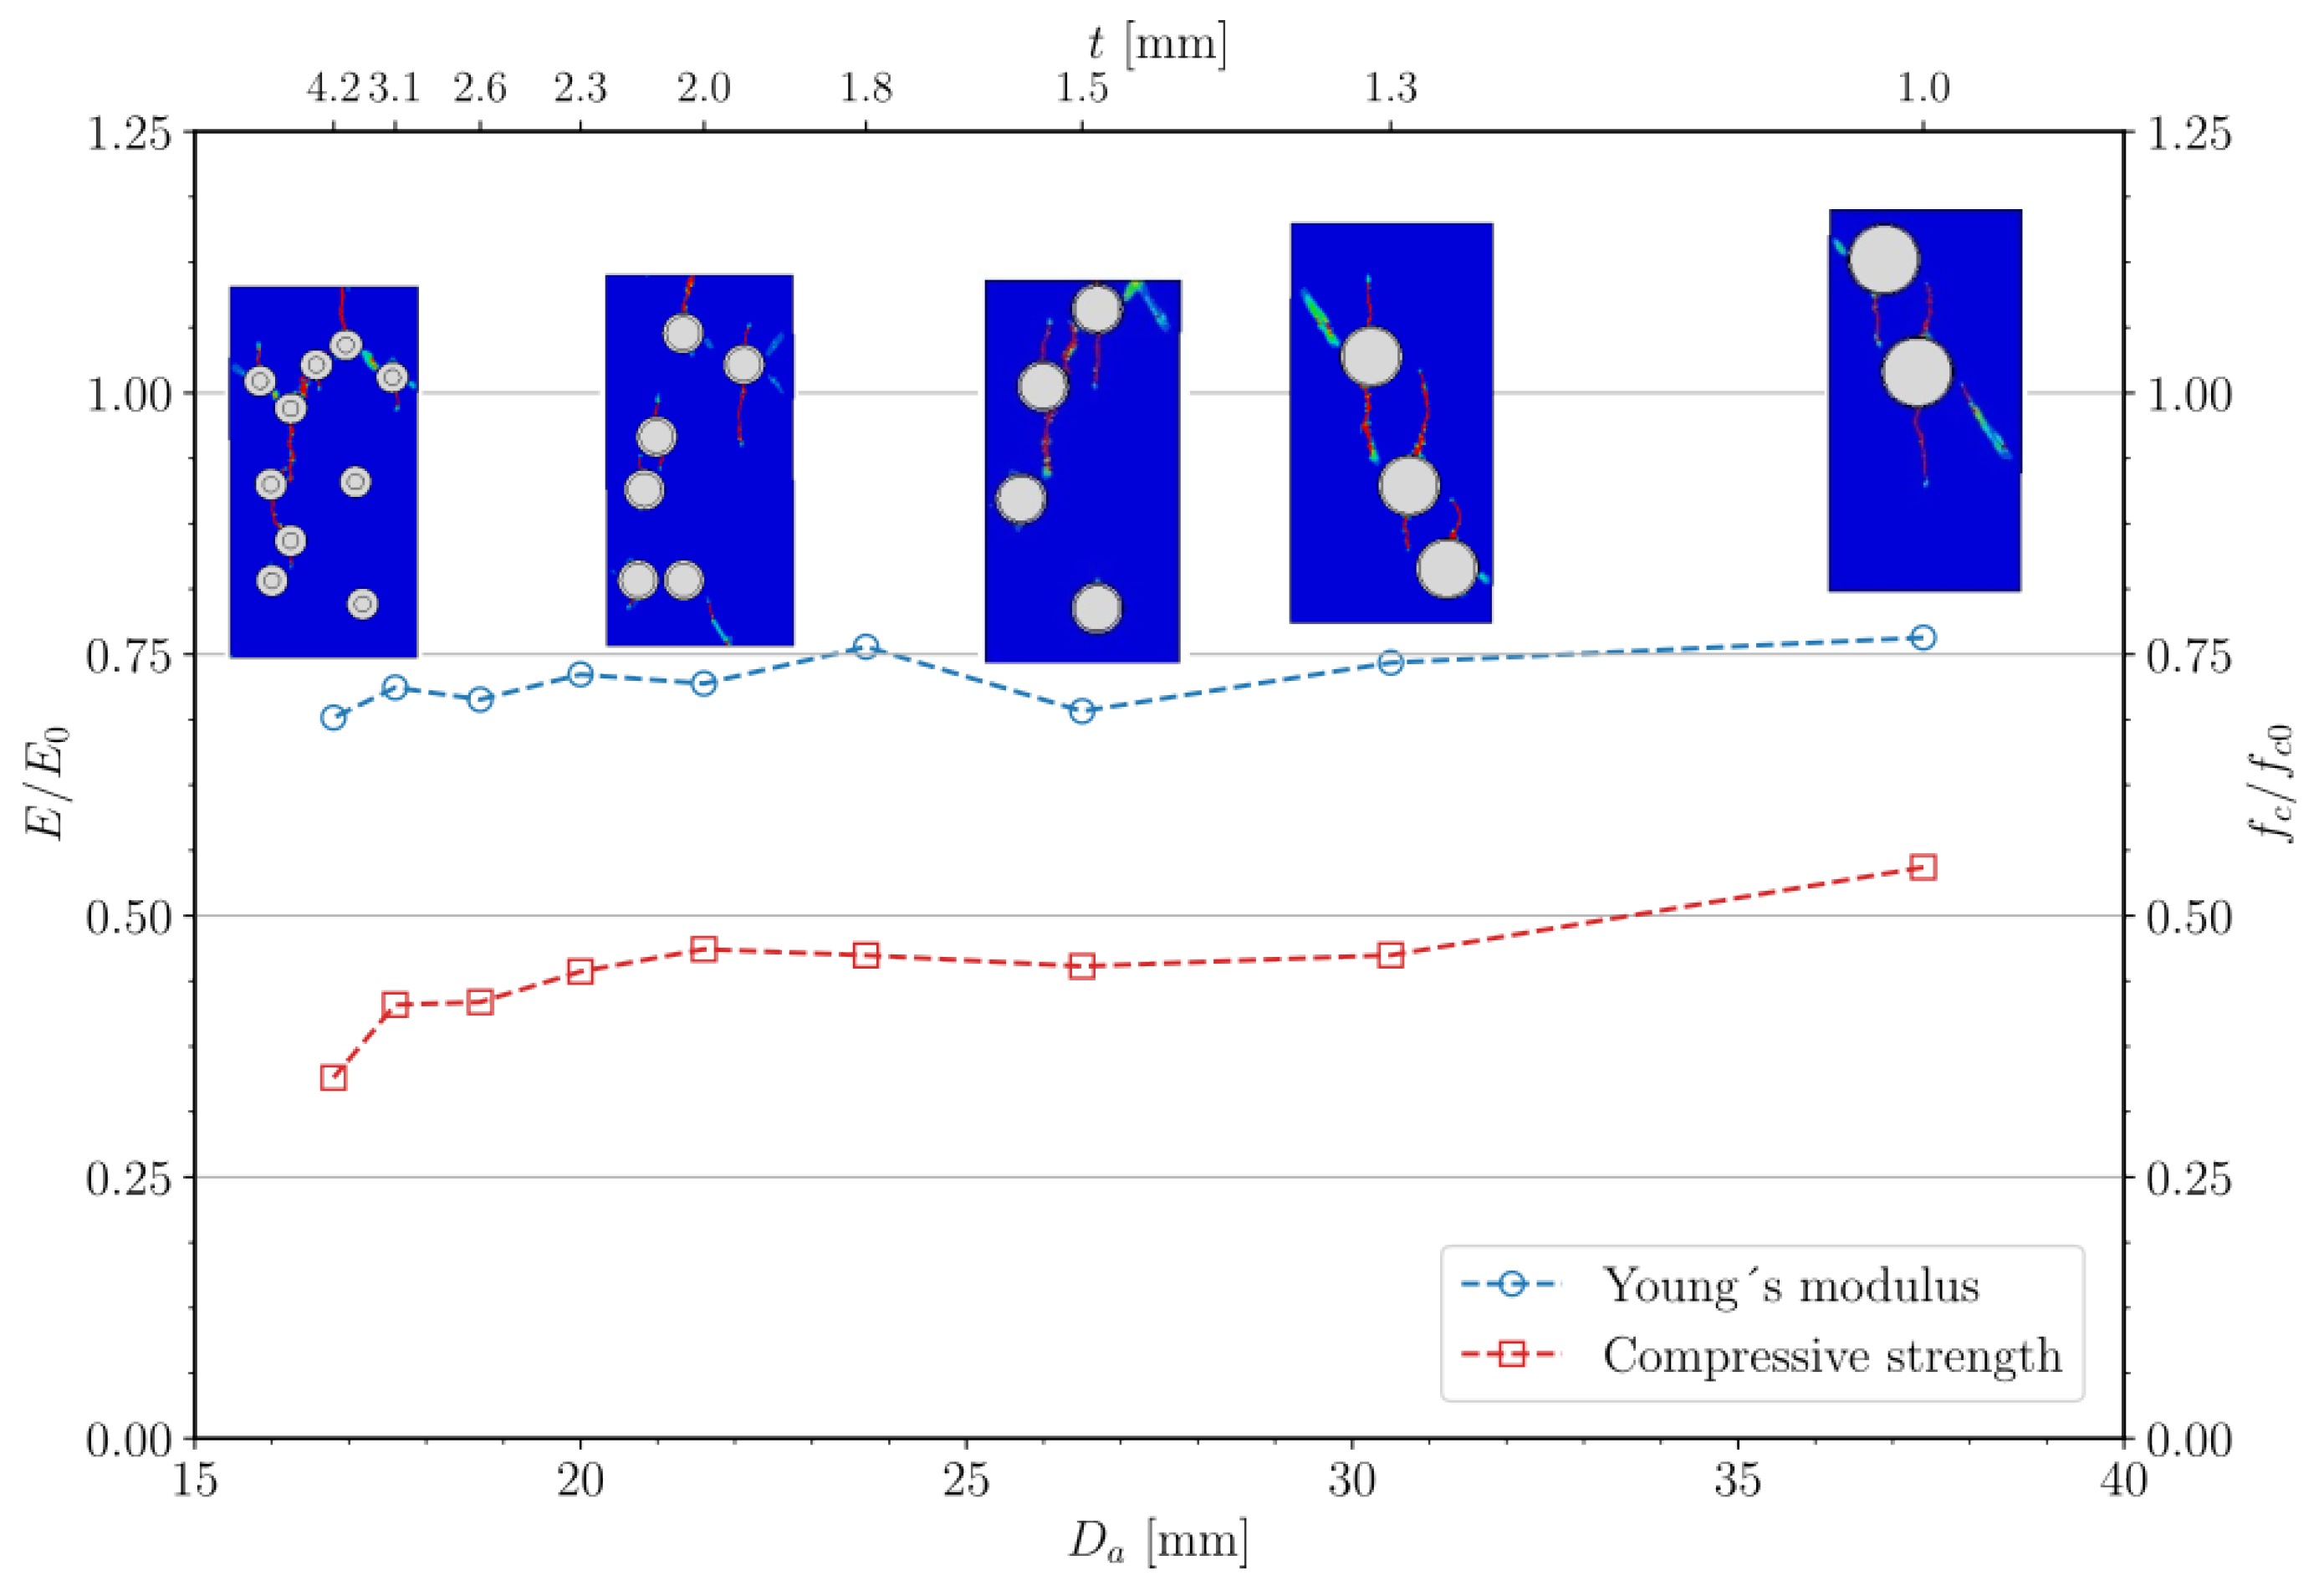
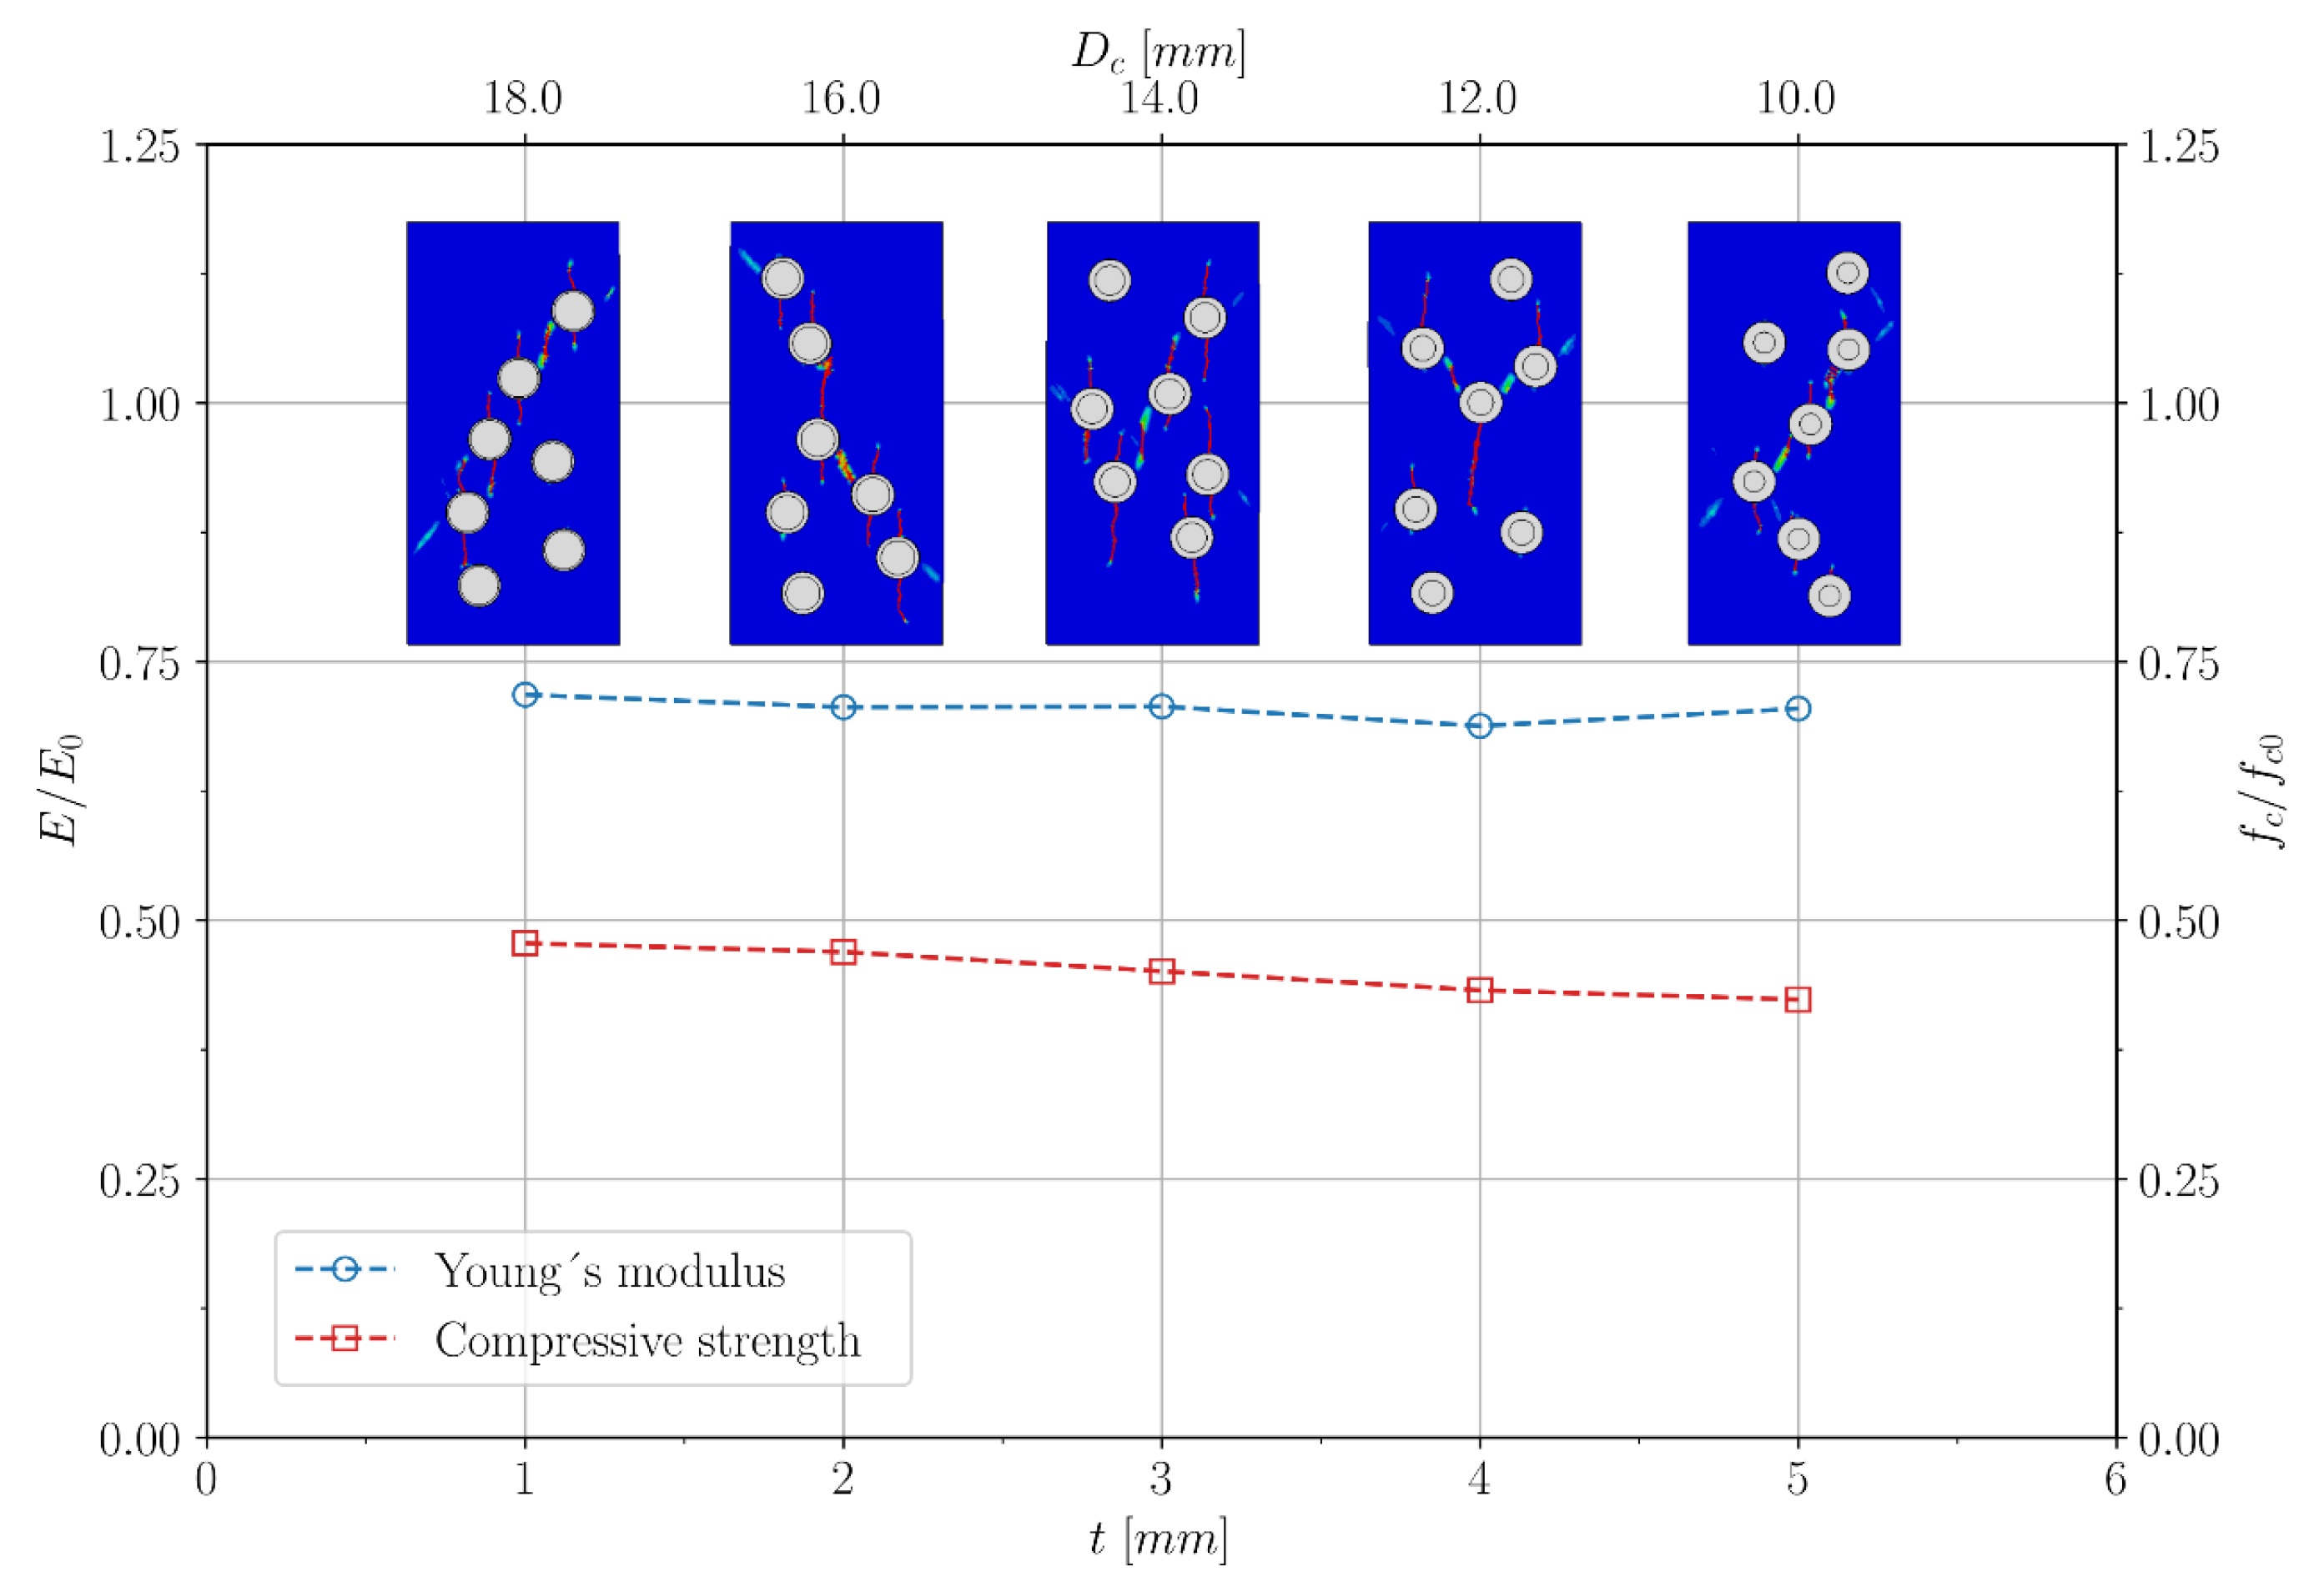
Second, it has investigated the effect of resonator dimensions, specifically the resonator diameter, as well as the relation between the core size and the coating thickness on the mechanical response of the MC. The data indicate that variations in Young’s modulus remain within 10%, while compressive strength varies by approximately 15–20% as the resonator size decreases. The corresponding cracking patterns corroborate these findings, showing that cracks initiate at the resonators and follow predominantly vertical paths. As the number of resonators increases, the connectivity of cracks increases, thereby reducing the overall compressive strength.
Finally, the study of material properties—examining both the elastomer coating and the core material—demonstrates that modifications in the coating’s Young’s modulus produce modest changes in the overall mechanical response. Although the compressive strength varies by about 6% across the range of elastomer moduli tested, Young’s modulus primarily remains insensitive to these changes. Furthermore, substituting the steel core with a lead core has a minimal impact on the mechanical properties of the resonator dimensions considered, suggesting that the macroscopic behavior of the composite is governed more by the resonator geometry and distribution than by the specific material properties of the core.
Additionally, the low dispersion in almost all the results is noteworthy, indicating that the spatial distribution of the resonators has a relatively minor, yet slightly more pronounced, influence on the compressive strength compared to Young’s modulus. This is relevant, as it suggests that slight variations in spatial distribution during fabrication are unlikely to result in substantial changes to mechanical properties.
Overall, these findings suggest that the optimal design of MCs involves using larger resonators with thinner rubber coatings and a lower resonator ratio, thereby ensuring a balance between enhanced dynamic behavior and acceptable mechanical strength. The consistency of these trends with experimental observations reported in the literature [36] further validates the proposed numerical model.
The following equation is proposed as a function of the compressive strength of the concrete without resonators and the volumetric content of the resonators based on the results of the simulations conducted in this work. This equation approximates the compressive strength of the MC:
f c = 1 1 + γ ρ f c 0 ,
where f c 0 is the compressive strength of the concrete without resonators, and γ is a constant obtained via a least-squares fit. In our analysis, γ was determined to be 0.114, with a coefficient of determination, R 2 = 0.826. Figure 9 presents the fitted function alongside the numerical results. While increasing the resonator content broadens the low-frequency band gap and enhances wave attenuation, it simultaneously diminishes the quasi-static load-bearing capacity. The present results indicate that limiting the resonator volume ratio to ρ   3–5% preserves at least 55% of the reference compressive strength—an acceptable threshold for lightly loaded vibration-control elements, such as isolation slabs or track beds. This strength window will serve as the basis for future work, wherein the current mesoscale framework will be coupled with transient wave-propagation simulations to quantify how the observed reduction in f c affects attenuation, bandwidth, and efficiency.
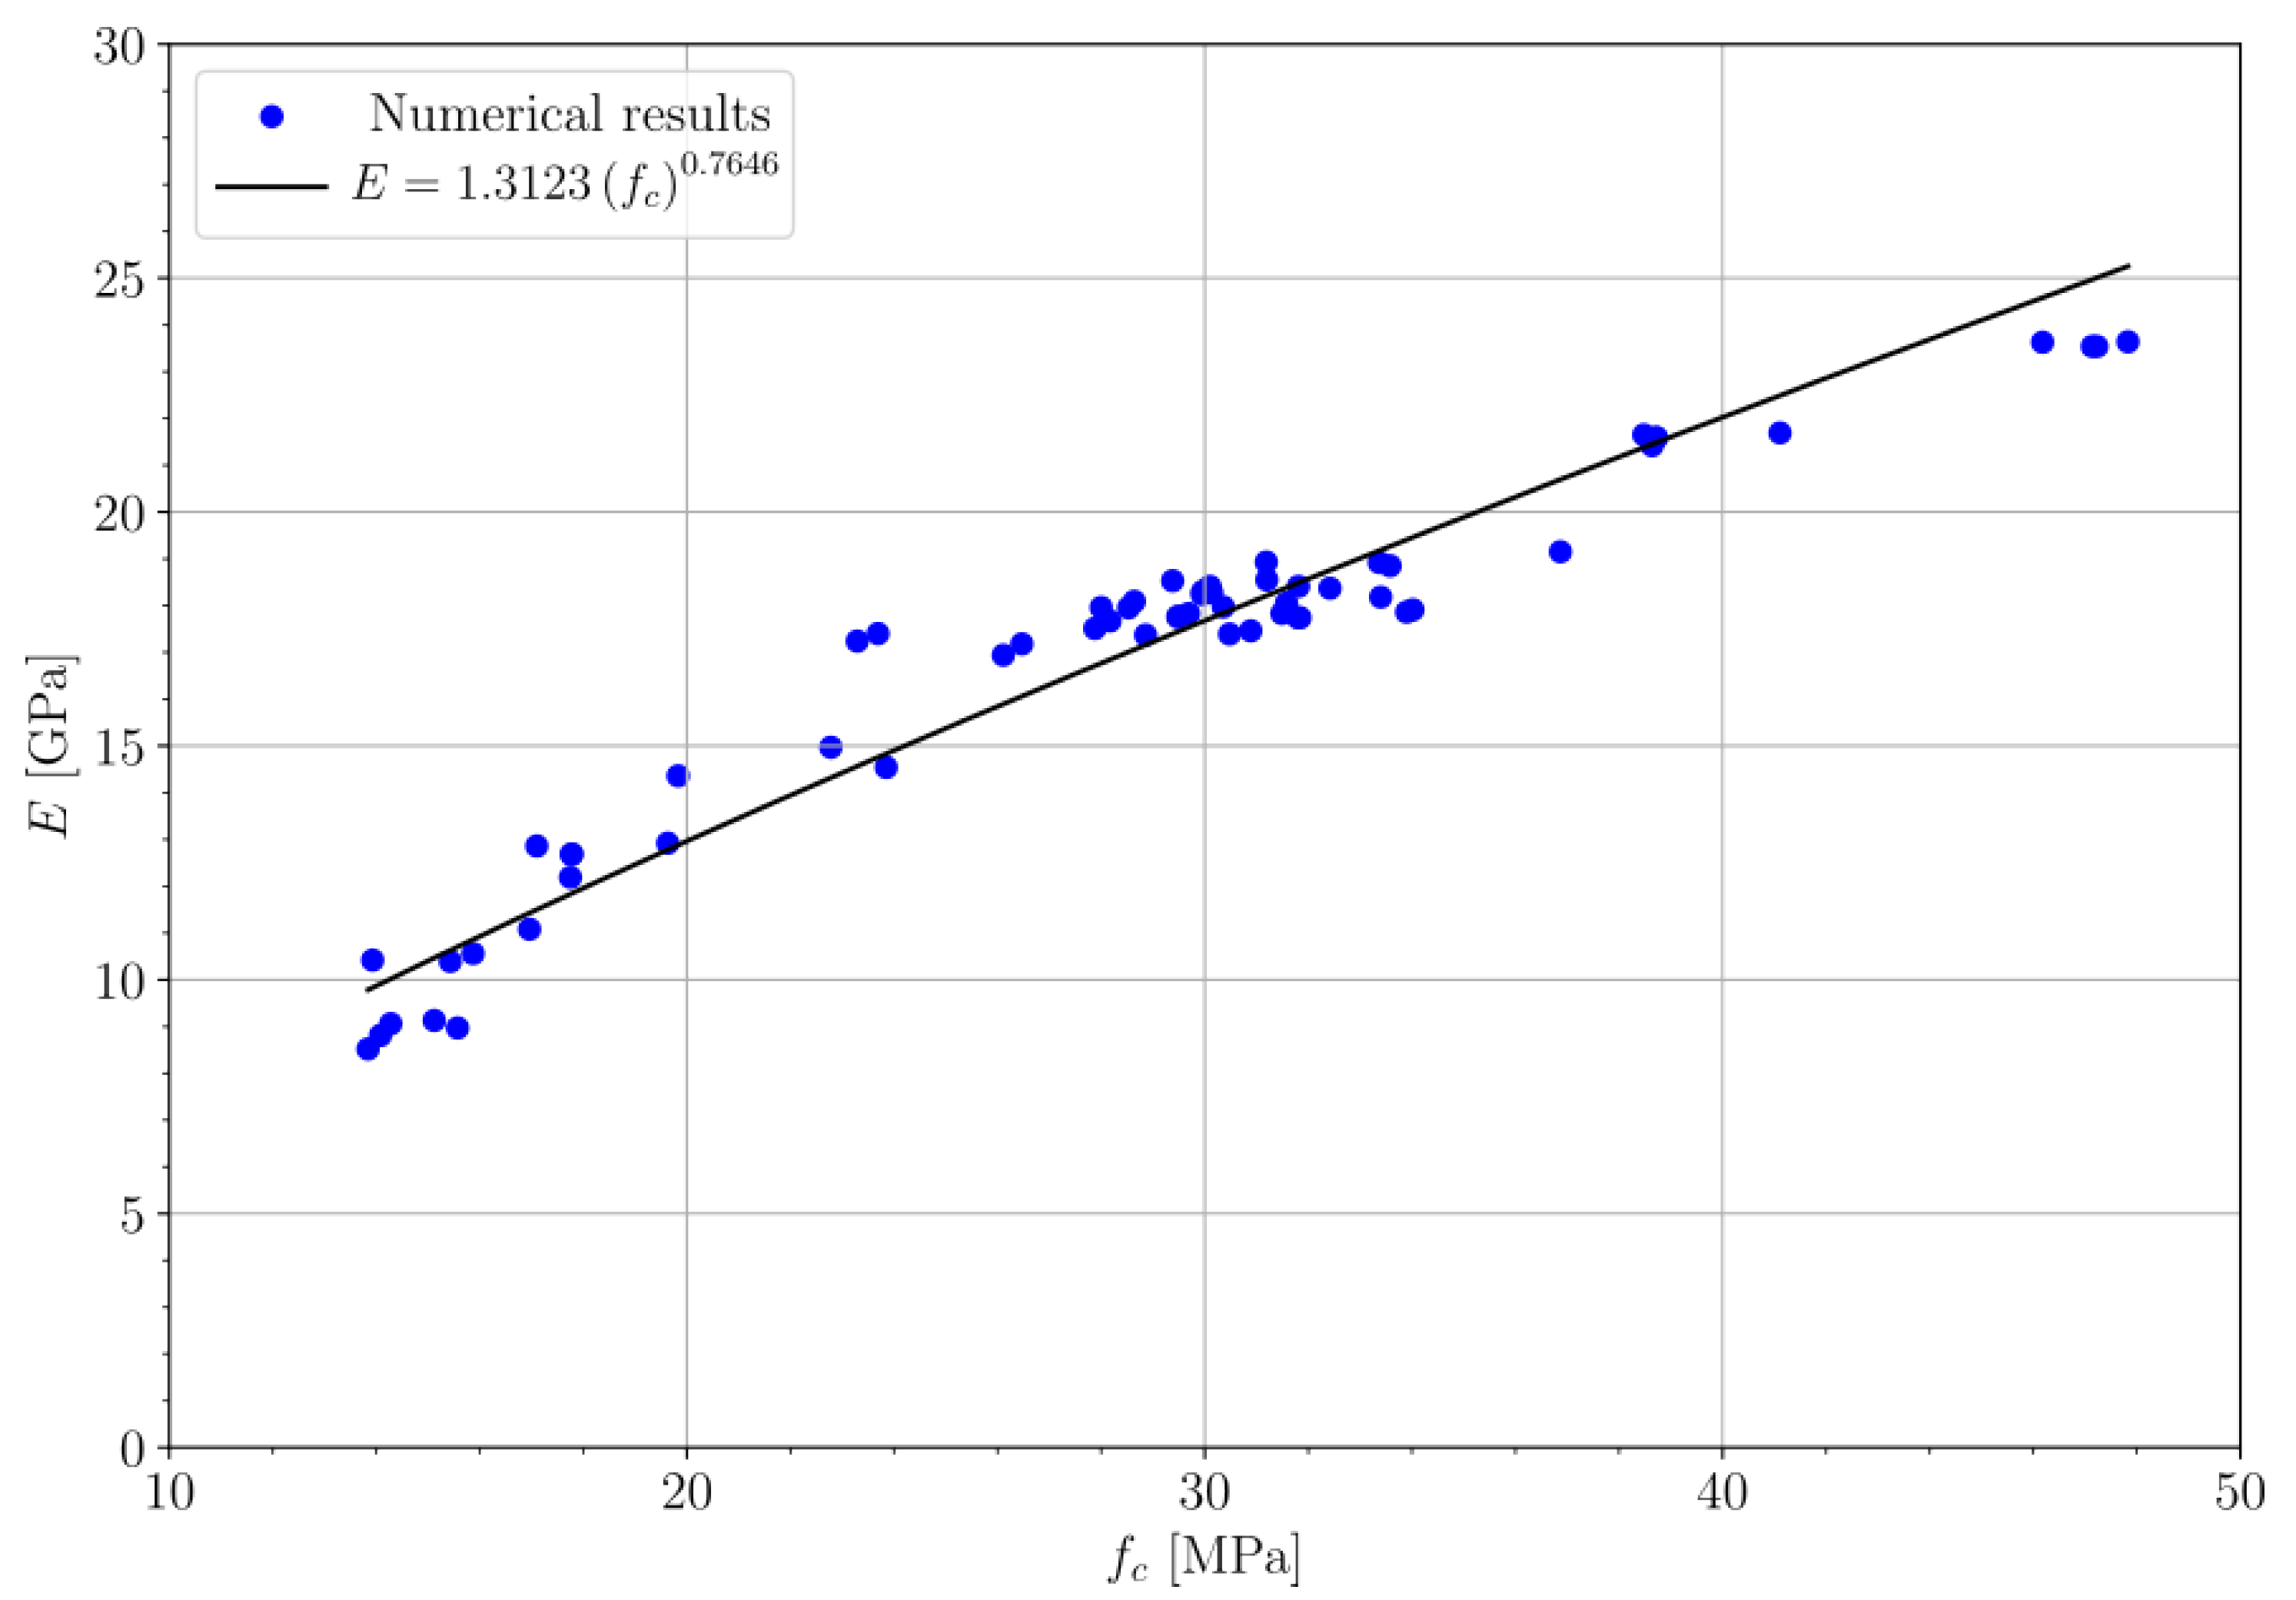
The simulation results suggest the potential for a novel function that estimates Young’s modulus from the compressive strength of MC. Given the dispersion of the data in both the lower and upper ranges of compressive strength, one flexible approach is to assume that E behaves as a power function of f c , following the format of Eurocode 2 [58]. In other words, the aim is to identify the constants α and β as follows:
E = α ( f c ) β
Through a least-squares fitting procedure, constants are appropriately determined to obtain α = 1.3123 and β = 0.7646. This fit yields a coefficient of determination R 2 = 0.9358. Consequently, Figure 10 displays the simulation results alongside Equation (4).
While these relationships offer a valuable preliminary framework for structural design, their validity is constrained to the parameter ranges that have been investigated. Further experimental validations would be instrumental in extending the scope and reliability of these relationships.

6. Conclusions and Future Directions

A two-dimensional mesoscale model has been developed to reproduce uniaxial-compression tests on metaconcretes, explicitly representing steel cores, rubber coatings, and the interfacial transition zone. Numerical predictions agree well with the experiments, capturing both stiffness and strength reductions. The parametric study quantifies these reductions: inserting a single resonator ( ρ ≈ 1.5%) already lowers the reference compressive strength by 30%, while the highest ratio examined ( ρ = 31.8%) produces an 80% loss, which defines the asymptotic plateau of the strength curve. Keeping the resonator content below ρ   5% preserves at least 55% of the baseline strength and more than 85% of the plain-concrete Young’s modulus. At an intermediate ratio (ρ = 10.6%), large-core inclusions ( D   ≥ 30 mm) with thin rubber coatings ( t ≤ 1.3 mm) restrict the stiffness penalty to <10% and the strength reduction to 15–20%. Overall, an optimal practical window of ρ 3–5%, combined with large-diameter, thin-coated resonators, achieves the desired locally resonant behavior while limiting the compressive-strength penalty to ≲45%.
Based on the findings of this study, future research should focus on the following points regarding such a new engineered material:
  • Extending to 3D simulations through three-dimensional modeling to capture out-of-plane effects, triaxial stress states, and more realistic resonator placements;
  • Refining coating material characterization so as to incorporate nonlinear or viscoelastic constitutive models for elastomers that could improve predictive accuracy, particularly under long-term or dynamic loading;
  • Examining alternative resonator designs to investigate lattice-like inclusions, composites, or other geometries that may help broaden the feasible design space;
  • Integrating dynamic and fatigue analyses of metaconcrete to attenuate vibrations and shocks and evaluate fatigue and impact responses would yield a complete performance assessment;
  • Validating at-large scales from testing on metaconcrete would confirm mesoscale findings and guide further design recommendations;
  • Extending the mesoscale framework to metaconcrete columns subjected to lateral confinement to quantify its influence on compressive strength and ductility, drawing on experimental insights;
  • Investigating the interaction of recycled crumb-rubber particles and chemically treated rubber coatings with OPC and alkali-activated slag binders, assessing their impact on compressive strength, durability, and interfacial chemistry, and developing mitigation strategies for the associated strength loss.
Addressing the research gaps above will improve confidence in specific metaconcrete technologies and facilitate their transition into broader engineering practice.

Author Contributions

Conceptualization, A.M.R., G.S.-A., M.P.A. and M.B.; methodology, A.M.R., G.S.-A., M.P.A. and M.B.; software, G.S.-A. and M.B.; validation, G.S.-A. and M.B.; formal analysis, G.S.-A. and M.B.; investigation, A.M.R., G.S.-A., M.P.A. and M.B.; resources, M.P.A.; data curation, A.M.R.; writing—original draft preparation, A.M.R., G.S.-A. and M.B.; writing—review and editing, A.M.R., G.S.-A. and M.B.; visualization, A.M.R., G.S.-A. and M.B.; supervision, A.M.R., G.S.-A., M.P.A. and M.B.; project administration, A.M.R.; funding acquisition, A.M.R. All authors have read and agreed to the published version of the manuscript.

Funding

This research received no external funding.

Institutional Review Board Statement

Not applicable.

Informed Consent Statement

Not applicable.

Data Availability Statement

The data presented in this study are available on request from the corresponding author. The data are not publicly available due to privacy.

Conflicts of Interest

The authors declare no conflicts of interest.

Abbreviations

The following abbreviations are used in this manuscript:
MCMetaconcrete
FEMFinite element model
CDPConcrete damage plasticity
ITZInterfacial transition zone
SDStandard deviation
f c Compressive strength
f c 0 Compressive strength of the concrete without resonators
E Young’s modulus
E 0 Young’s modulus of the concrete without resonators
E r Young’s modulus of the coating material
σ Stress
ε Strain
ρ Volumetric resonator ratio
ρ C Density of the resonator core material
D c Resonator core diameter
R c Resonator core radius
t Resonator coating thickness
D a Resonator diameter
f (Hz)Frequency in Hertz

References

  1. Veselago, V.G. The electrodynamics of substances with simultaneously negative values of ϵ and μ. Sov. Phys.-Uspekhi 1968, 10, 509. [Google Scholar] [CrossRef]
  2. Liu, Z.; Zhang, X.; Mao, Y.; Zhu, Y.Y.; Yang, Z.; Chan, C.T.; Sheng, P. Locally resonant sonic materials. Science 2000, 289, 1734–1736. [Google Scholar] [CrossRef] [PubMed]
  3. Pendry, J.B. Negative refraction makes a perfect lens. Phys. Rev. Lett. 2000, 85, 3966–3969. [Google Scholar] [CrossRef] [PubMed]
  4. Milton, G.W.; Willis, J.R. On modifications of Newton’s second law and linear continuum elastodynamics. Proc. R. Soc. A Math. Phys. Eng. Sci. 2007, 463, 855–880. [Google Scholar] [CrossRef]
  5. Brûlé, S.; Javelaud, E.H.; Enoch, S. Guenneau. Experiments on seismic metamaterials: Molding surface waves. Phys. Rev. Lett. 2014, 112, 133901. [Google Scholar] [CrossRef]
  6. Zhang, Y.; Li, B. Photonic crystal-based bending waveguides for optical interconnections. Opt. Express 2006, 14, 5723–5732. [Google Scholar] [CrossRef]
  7. Liu, B.; Liu, Y.-F.; Jia, C.; He, X.-D. All-optical diode structure based on asymmetrical coupling by a micro-cavity and FP cavity at two sides of photonic crystal waveguide. AIP Adv. 2016, 6, 065316. [Google Scholar] [CrossRef]
  8. Notomi, M. Negative refraction in photonic crystals. Opt. Quantum Electron. 2002, 34, 133–143. [Google Scholar] [CrossRef]
  9. Noori, M.; Soroosh, M.; Baghban, H. Self-collimation in photonic crystals: Applications and opportunities. Ann. Phys. 2018, 530, 1700049. [Google Scholar] [CrossRef]
  10. Tamura, S.; Hurley, D.C.; Wolfe, J.P. Acoustic-phonon propagation in superlattices. Phys. Rev. B 1998, 38, 1427–1449. [Google Scholar] [CrossRef]
  11. Kushwaha, M.S.; Halevi, P.; Dobrzynski, L.; Djafari-Rouhani, B. Acoustic band structure of periodic elastic composites. Phys. Rev. Lett. 1993, 71, 2022–2025. [Google Scholar] [CrossRef] [PubMed]
  12. Assouar, M.B.; Oudich, M. Enlargement of a locally resonant sonic band gap by using double-sides stubbed phononic plates. Appl. Phys. Lett. 2012, 100, 123506. [Google Scholar] [CrossRef]
  13. Bilal, O.R.; Hussein, M.I. Trampoline metamaterial: Local resonance enhancement by springboards. Appl. Phys. Lett. 2013, 103, 111901. [Google Scholar] [CrossRef]
  14. Sal-Anglada, G.; Yago, D.; Cante, J.; Oliver, J.; Roca, D. Optimal design of Multiresonant Layered Acoustic Metamaterials (MLAM) via a homogenization approach. Eng. Struct. 2023, 293, 116555. [Google Scholar] [CrossRef]
  15. Sal-Anglada, G.; Yago, D.; Cante, J.; Oliver, J.; Roca, D. Sound transmission loss enhancement through triple-peak coupled resonances acoustic metamaterials. Int. J. Mech. Sci. 2024, 266, 108951. [Google Scholar] [CrossRef]
  16. Yago, D.; Sal-Anglada, G.; Roca, D.; Cante, J.; Oliver, J. Machine learning in solid mechanics: Application to acoustic metamaterial design. Int. J. Numer. Methods Eng. 2024, 125, 1–29. [Google Scholar] [CrossRef]
  17. Mitchell, S.J.; Pandolfi, A.; Ortiz, M. Metaconcrete: Designed aggregates to enhance dynamic performance. J. Mech. Phys. Solids 2014, 65, 69–81. [Google Scholar] [CrossRef]
  18. Mitchell, S.J.; Pandolfi, A.; Ortiz, M. Investigation of elastic wave transmission in a metaconcrete slab. Mech. Mater. 2015, 91, 295–303. [Google Scholar] [CrossRef]
  19. Xu, C.; Chen, W.; Hao, H. The influence of design parameters of engineered aggregate in metaconcrete on bandgap region. J. Mech. Phys. Solids 2020, 139, 103929. [Google Scholar] [CrossRef]
  20. Kim, E.; Yang, J.; Hwang, H.; Shul, C.W. Impact and blast mitigation using locally resonant woodpile metamaterials. Int. J. Impact Eng. 2017, 101, 24–31. [Google Scholar] [CrossRef]
  21. Xu, X.; Barnhart, M.V.; Li, X.; Chen, Y.; Huang, G. Tailoring vibration suppression bands with hierarchical metamaterials containing local resonators. J. Sound Vib. 2019, 442, 237–248. [Google Scholar] [CrossRef]
  22. Chen, Y.; Hu, G.; Huang, G. A hybrid elastic metamaterial with negative mass density and tunable bending stiffness. J. Mech. Phys. Solids 2017, 105, 179–198. [Google Scholar] [CrossRef]
  23. Chen, Y.Y.; Barnhart, M.V.; Chen, J.K.; Hu, G.K.; Sun, C.T.; Huang, G.L. Dissipative elastic metamaterials for broadband wave mitigation at subwavelength scale. Compos. Struct. 2016, 136, 358–371. [Google Scholar] [CrossRef]
  24. Manimala, J.M.; Huang, H.H.; Sun, C.T.; Snyder, R.; Bland, S. Dynamic load mitigation using negative effective mass structures. Eng. Struct. 2014, 80, 458–468. [Google Scholar] [CrossRef]
  25. Briccola, D.; Ortiz, M.; Pandolfi, A. Experimental validation of metaconcrete blast mitigation properties. J. Appl. Mech. 2016, 84, 031001. [Google Scholar] [CrossRef]
  26. Barnhart, M.V.; Xu, X.; Chen, Y.; Zhang, S.; Song, J.; Huang, G. Experimental demonstration of a dissipative multi-resonator metamaterial for broadband elastic wave attenuation. J. Sound Vib. 2018, 433, 104–118. [Google Scholar] [CrossRef]
  27. Krushynska, A.O.; Miniaci, M.; Bosia, F.; Pugno, N.M. Coupling local resonance with bragg band gaps in single-phase mechanical metamaterials. Extrem. Mech. Lett. 2017, 12, 30–36. [Google Scholar] [CrossRef]
  28. Ren, T.; Li, F.; Chen, Y.; Liu, C.; Zhang, C. Improvement of the band-gap characteristics of active composite laminate metamaterial plates. Compos. Struct. 2020, 254, 112831. [Google Scholar] [CrossRef]
  29. Briccola, D.; Tomasin, M.; Netti, T.; Pandolfi, A. The influence of a lattice-like pattern of inclusions on the attenuation properties of metaconcrete. Front. Mater. 2019, 6, 35. [Google Scholar] [CrossRef]
  30. An, X.; Lai, C.; Fan, H.; Zhang, C. 3D acoustic metamaterial-based truss-lattice structures for low-frequency and broadband vibration attenuation. Int. J. Solids Struct. 2020, 191, 293–306. [Google Scholar] [CrossRef]
  31. Ma, G.; Fu, C.; Wang, G.; del Hougne, P.; Christensen, J.; Lai, Y.; Sheng, P. Polarization bandgaps and fluid-like elasticity in fully solid elastic metamaterials. Nat. Commun. 2016, 7, 13536. [Google Scholar] [CrossRef] [PubMed]
  32. Xu, C.; Chen, W.; Hao, H.; Jin, H. Effect of engineered aggregate configuration and design on stress-wave attenuation of metaconcrete rod structure. Int. J. Solids Struct. 2021, 232, 111182. [Google Scholar] [CrossRef]
  33. Chen, Z.; Wang, G.; Lim, C.W. Artificially engineered metaconcrete with wide bandgap for seismic surface-wave manipulation. Eng. Struct. 2023, 276, 115375. [Google Scholar] [CrossRef]
  34. Zeng, Y.; Xu, Y.; Yang, H.; Muzamil, M.; Xu, R.; Deng, K.; Peng, P.; Du, Q. A Matryoshka-like seismic metamaterial with wide band-gap characteristics. Int. J. Solids Struct. 2020, 185, 334–341. [Google Scholar] [CrossRef]
  35. Liu, Y.; An, X.; Chen, H.; Fan, H. Vibration attenuation of finite-size metaconcrete: Mechanism, prediction and verification. Compos. Part A Appl. Sci. Manuf. 2021, 143, 106294. [Google Scholar] [CrossRef]
  36. Xu, C.; Chen, W.; Hao, H.; Pham, T.M.; Bi, K. Static mechanical properties and stress wave attenuation of metaconcrete subjected to impulsive loading. Eng. Struct. 2022, 263, 114382. [Google Scholar] [CrossRef]
  37. Kettenbeil, C.; Ravichandran, G. Experimental investigation of the dynamic behavior of metaconcrete. Int. J. Impact Eng. 2018, 111, 199–207. [Google Scholar] [CrossRef]
  38. Sharma, B.; Sun, C.T. Impact load mitigation in sandwich beams using local resonators. J. Sandw. Struct. Mater. 2016, 18, 50–64. [Google Scholar] [CrossRef]
  39. Mitchell, S.J.; Pandolfi, A.; Ortiz, M. Effect of brittle fracture in a metaconcrete slab under shock loading. J. Eng. Mech. 2016, 142, 04016010. [Google Scholar] [CrossRef]
  40. Xu, C.; Chen, W.; Hao, H.; Pham, T.M.; Li, Z.; Jin, H. Dynamic compressive properties of metaconcrete material. Constr. Build. Mater. 2022, 351, 128974. [Google Scholar] [CrossRef]
  41. Shi, H.Y.Y.; Tay, T.E.; Lee, H.P. Numerical studies on composite meta-material structure for mid to low frequency elastic wave mitigation. Compos. Struct. 2018, 195, 136–146. [Google Scholar] [CrossRef]
  42. Chen, J.S.; Sharma, B.; Sun, C.T. Dynamic behaviour of sandwich structure containing spring-mass resonators. Compos. Struct. 2011, 93, 2120–2125. [Google Scholar] [CrossRef]
  43. Sharma, B.; Sun, C.T. Local resonance and Bragg bandgaps in sandwich beams containing periodically inserted resonators. J. Sound Vib. 2016, 364, 133–146. [Google Scholar] [CrossRef]
  44. Xu, C.; Chen, W.; Hao, H.; Bi, K.; Pham, T.M. Experimental and numerical assessment of stress-wave attenuation of metaconcrete rods subjected to impulsive loads. Int. J. Impact Eng. 2022, 159, 104052. [Google Scholar] [CrossRef]
  45. Zhang, E.; Jin, Y.; Wang, Y. Design and evaluation of dual-resonant aggregates metaconcrete. Lat. Am. J. Solids Struct. 2023, 20, e479. [Google Scholar] [CrossRef]
  46. Han, J.; Lu, G. Study on damping forced vibration characteristics of metamaconcrete unit cell and optimizing aggregate selection. Constr. Build. Mater. 2024, 369, 135598. [Google Scholar] [CrossRef]
  47. Han, J.; Lu, G. The investigation of nonlinear vibration on metaconcrete single aggregate system and aggregate optimal design. Sci. Rep. 2025, 15, 90829. [Google Scholar] [CrossRef]
  48. Jurado, J.; Zubiarrain, N.M.; Villa, E.I.; Rocco, C.G.; Braun, M. Mesoscale modelling of the mechanical behaviour of concrete with rubber as coarse aggregate. Eng. Fract. Mech. 2023, 291, 109533. [Google Scholar] [CrossRef]
  49. Hibbitt, Karlsson, Sorensen. ABAQUS/Standard: User’s Manual, version 5.7; Hibbitt, Karlsson & Sorensen Inc.: Pawtucket, RI, USA, 1997; pp. 1–98. [Google Scholar]
  50. Hu, X.; Xu, H.; Xi, X.; Zhang, P.; Yang, S. Meso-scale phase field modelling of reinforced concrete structures subjected to corrosion of multiple reinforcements. Constr. Build. Mater. 2022, 321, 126376. [Google Scholar] [CrossRef]
  51. Ma, D.; Liang, Z.; Liu, Y.; Jiang, Z.; Liu, Z.; Zhou, L.; Tang, L. Mesoscale modeling of epoxy polymer concrete under tension or bending. Compos. Struct. 2021, 256, 113079. [Google Scholar] [CrossRef]
  52. Huang, Y.; Yang, Z.; Ren, W.; Liu, G.; Zhang, C. 3D meso-scale fracture modelling and validation of concrete based on in-situ X-ray Computed Tomography images using damage plasticity model. Int. J. Solids Struct. 2015, 67, 340–352. [Google Scholar] [CrossRef]
  53. ASTM C469/C469M-14; C469/c469m-14 Standard Test Method for Static Modulus of Elasticity and Poisson Ratio of Concrete in Compression. ASTM International: West Conshohocken, PA, USA, 2014; pp. 1–5.
  54. Hirsch, T.J. Modulus of elasticity of concrete affected by aggregate shape. PCA Res. Dev. Lab. J. 1962, 4, 22–28. [Google Scholar] [CrossRef]
  55. Hashin, Z.; Shtrikman, S. A variational approach to the elastic behaviour of multiphase materials. J. Mech. Phys. Solids 1963, 11, 127–140. [Google Scholar] [CrossRef]
  56. Bompa, D.V.; Elghazouli, A.Y.; Xu, B.; Stafford, P.J.; Ruiz-Teran, A.M. Experimental assessment and constitutive modelling of rubberised concrete materials. Constr. Build. Mater. 2017, 137, 246–260. [Google Scholar] [CrossRef]
  57. Ashby, M.; Shercliff, H.; Cebon, D. Materials: Engineering, Science, Processing and Design, 4th ed.; Butterworth-Heinemann: Oxford, UK, 2019; pp. 1–806. [Google Scholar]
  58. EN 1992-1-1 (2004) (English); Eurocode 2: Design of Concrete Structures—Part 1-1: General Rules and Rules for Buildings [Authority: The European Union Per Regulation 305/2011, Directive 98/34/EC, Directive 2004/18/EC] (Incorporating Corrigenda December 2008 and April 2009). European Standard: Brussels, Belgium, 2004; pp. 1–227.
Figure 1. Schematic representation of the resonant inclusion modeled in the study plotted to: (a) Perspective view; (b) Plain view. Explanatory notes: The inclusion consists of a steel core (grey) of diameter D c , surrounded by a compliant rubber coating (orange) with the thickness t embedded within a concrete matrix; the ITZ, depicted in blue, explicitly models the weakened bonding interface; the outer diameter of the resonator, excluding the ITZ, is denoted by D a . Source: the authors’ own elaboration based on research design.
Applsci 15 06543 g001
Figure 2. Comparison of stress–strain curves for concrete specimens, including experimental data [36] and the proposed FEM. Source: own elaboration.
Applsci 15 06543 g002
Figure 3. Mesh size sensitivity analysis of Young’s modulus ( E ), compressive strength ( f c ), and corresponding cracking patterns derived from the tensile damage variable. Source: own elaboration from numerical calculations.
Applsci 15 06543 g003
Figure 4. Comparison of stress–strain curves for concrete specimens with a 10.6% resonator ratio, including experimental data [36] and the proposed FEM. Source: own elaboration.
Applsci 15 06543 g004
Figure 5. Mean normalized values of Young’s modulus ( E / E 0 ) and compressive strength ( f c / f c 0 ), along with the corresponding cracking patterns, as a function of the resonator ratio ( ρ ). Source: own elaboration from numerical calculations.
Applsci 15 06543 g005
Figure 6. Mean normalized values of Young’s modulus ( E / E 0 ) and compressive strength ( f c / f c 0 ), along with the corresponding cracking patterns, as a function of the resonator ratio ( ρ ). Source: own elaboration.
Applsci 15 06543 g006
Figure 7. Effect of rubber coating thickness ( t ) and core size ( D c ) on the normalized Young’s modulus ( E / E 0 ) and compressive strength ( f c / f c 0 ) for metaconcrete specimens with a constant resonator volume fraction of 10.6%. Source: own elaboration.
Applsci 15 06543 g007
Figure 8. Normalized compressive strength f c / f c 0 and normalized Young’s modulus E / E 0 as a function of coating stiffness E r , for metaconcretes with either steel or lead cores. Solid lines represent compressive strength (right axis), and dashed lines represent Young’s modulus (left axis). The results indicate that both E and f c , when normalized for plain mortar values, remain largely unaffected by the core material or coating stiffness. Source: own elaboration.
Applsci 15 06543 g008
Figure 9. Relationship between the compressive strength ( f c ) and volumetric resonator ratio ( ρ ). Source: own elaboration.
Applsci 15 06543 g009
Figure 10. Relationship between the compressive strength ( f c ) and the modulus of elasticity ( E ). Source: own elaboration.
Applsci 15 06543 g010
Table 1. Geometrical parameters and mechanical properties of the materials 1.
Geometrical Parameters and Mesh Configuration
FeatureValue/Description
Specimen size200 mm (height) × 100 mm (width)
Inclusion geometryCircular resonators, randomly distributed
Element size1 mm
Mechanical properties of the materials
Material E   [ GPa ] f c   [ MPa ] ρ   [ kg / m 3   ] ν   [ ]
Concrete25.4267.4921830.173
ITZ25.4233.7521830.173
Steel core210-78000.3
Rubber coating0.05-13000.5
1 Source: own elaboration based on data from [36].
Table 2. Chart comparing Young’s modulus ( E 0 ), and the compressive strength ( f c 0 ) 1.
ParameterExperimental Data 2Numerical Results
E 0 [GPa]25.42 ± 1.0124.42
f c 0 [MPa]67.49 ± 0.9967.17
1 It assumes a concrete specimen, contrasting the data obtained from the proposed FEM numerical model. 2 According to the data from [36]. Source: own calculation.
Table 3. Comparison of Young’s modulus ( E ), and the compressive strength ( f c ) 1.
ParameterExperimental Data [36]Numerical Results
E 0 [GPa]15.34 ± 1.9118.27 ± 0.16
f c 0 [MPa]29.98 ± 1.8130.14 ± 1.59
1 Assuming concrete specimens with a 10.6% resonator ratio, contrasting the experimental data with the proposed numerical model. Source: own elaboration.
Table 4. Effect of resonator ratios ( ρ ) on mechanical properties 1.
# Resonators ρ (%) E (GPa) f c (MPa)
00.00 25.4267.49
11.5123.58 ± 0.0547.10 ± 0.68
34.5421.59 ± 0.1039.13 ± 1.11
710.6018.27 ± 0.1630.14 ± 1.59
1116.6614.62 ± 0.3122.10 ± 2.03
1421.2012.66 ± 0.2818.01 ± 0.95
1827.2610.61 ± 0.3115.55 ± 1.26
2131.808.89 ± 0.2414.58 ± 0.74
1 Concerning the mean and standard deviation of Young’s modulus ( E ) and compressive strength ( f c ). Source: own elaboration.
Table 5. Resonator Dimensions and Quantities for a Fixed Resonant Frequency (3696 Hz) 1.
# Resonators D c (mm) t (mm) D a (mm)
235.41.037.4
328.01.330.5
423.41.526.5
520.21.823.7
617.62.021.6
715.42.320.0
813.42.618.7
108.44.216.8
1 The table lists the steel core diameter ( D c ), the coating thickness ( t ), the overall resonator diameter ( D a ), and the number of resonators incorporated in the concrete matrix. Source: own calculation.
Table 6. Effect of resonator diameter ( D a ) on mechanical properties 1.
D a (mm) E (GPa) f c (MPa)
37.419.15 ± 0.2636.87 ± 2.78
30.518.55 ± 0.4031.20 ± 3.18
26.517.39 ± 0.3030.48 ± 0.54
23.718.93 ± 0.2531.19 ± 1.75
21.618.04 ± 0.5131.58 ± 2.23
20.018.27 ± 0.1630.14 ± 1.59
18.717.66 ± 0.3228.16 ± 0.13
17.617.95 ± 0.5028.00 ± 2.22
16.817.23 ± 0.2123.28 ± 1.40
1 By the values of the mean and standard deviation of Young’s modulus ( E ) and compressive strength ( f c ). Source: own calculation.
Table 7. Effect of core size ( D c ) and coating thickness ( t ) on mechanical properties 1.
t (mm) D c (mm) E (GPa) f c (MPa)
1.018.018.25 ± 0.4432.25 ± 1.60
2.016.017.91 ± 0.4831.63 ± 2.00
3.014.017.94 ± 0.5530.36 ± 1.88
4.012.017.49 ± 0.4029.18 ± 2.78
5.010.017.91 ± 0.4728.58 ± 3.47
1 By the values of the mean and standard deviation of Young’s modulus ( E ) and compressive strength ( f c ). Source: own calculation.
Disclaimer/Publisher’s Note: The statements, opinions and data contained in all publications are solely those of the individual author(s) and contributor(s) and not of MDPI and/or the editor(s). MDPI and/or the editor(s) disclaim responsibility for any injury to people or property resulting from any ideas, methods, instructions or products referred to in the content.

