Abstract
Based on Brillouin optical time-domain reflectometry (BOTDR) technology, this study integrates laboratory tensile tests and similarity simulation experiments to systematically investigate the relationship between overlying strata collapse and fiber strain during coal seam mining. An analytical expression was established to describe the correlation between overlying strata displacement and fiber strain. The horizontal fiber monitoring results indicate that fiber strain accurately captures the evolution of overlying strata collapse and exhibits strong agreement with actual displacement height. When the working face advanced to 115 m and 155 m, the rock strata primarily underwent stress adjustment with minimal failure. At 195 m, the collapse zone expanded significantly, resulting in a notable increase in fiber strain. By 240 m, severe roof failure occurred, forming a complete caving zone in the goaf. The fiber strain curve exhibited a characteristic “double convex peak” pattern, with peak positions closely corresponding to rock fracture locations, further validating the feasibility of fiber monitoring in coal seam mining. Vertical fiber monitoring clearly delineated the evolution of the “three-zone” structure (caving zone, fracture zone, and bending subsidence zone) in the overlying strata. The fiber strain underwent a staged transformation from compressive strain to tensile strain, followed by stable compaction. The “stepped” characteristics of the strain curve effectively represented the heights of the three zones, highlighting the progressive and synchronized nature of rock failure. These findings demonstrate that fiber strain effectively characterizes the collapse height and evolution of overlying strata, enabling precise identification of rock fracture locations. This research provides scientific insights and technical support for roof stability assessment and mine safety management in coal seam mining.
1. Introduction
During coal mining, the deformation, failure, and collapse of overlying strata are inevitable, leading to a redistribution of stress and strain. Therefore, rock movement and mining-induced stress–strain evolution are closely interconnected. Investigating the stress–strain evolution of overlying strata during coal mining is fundamental to optimizing coal mining technologies [1,2].
To enhance the accuracy and efficiency of monitoring roof collapse during coal mining, researchers have introduced distributed optical fiber sensing technology into traditional monitoring methods. Compared to mechanical or electronic sensors, distributed optical fiber sensors offer advantages such as fully distributed measurement, long-distance transmission, and high sensitivity [3,4,5]. As a result, this technology has become a research hotspot in coal mining monitoring. In terms of its application in overlying strata deformation monitoring, Ma Jiaxiao and Zhang Guihua [6,7] analyzed the coupling characteristics between optical fibers and rock–soil interfaces through pullout tests. Liu [8] used fiber optic grating to study the coupling of loess deformation and developed a loess deformation prediction model. Zhang Pingsong [9] utilized distributed optical fiber sensors to investigate coal seam deformation and failure mechanisms. Moirangthem [10] developed a strain-sensitive optical fiber sensor based on optical fiber sensing technology to monitor the strain evolution of surrounding rock in tunnels. Chai Jing [4,11,12,13,14,15] combined theoretical analysis with field optical fiber measurements to analyze the three-zone deformation characteristics of stope surrounding rock, identify the failure location of the key aquifuge layer, and determine the damage depth and stress-relief range of the coal seam floor after mining. Li Zixiang [16] studied cantilever thin plates, establishing a correlation between optical fiber strain and deformation while proposing an error correction strategy, thus laying the foundation for optical fiber sensors in structural deformation monitoring. These studies demonstrate the significant potential of distributed optical fiber sensing technology in ensuring coal mine safety [17,18].
Due to its cost-effectiveness, controllability, and visualization capabilities, laboratory-based physical similarity simulation has become an essential method for investigating overburden movement in coal mining [7,19,20]. Consequently, researchers have incorporated distributed optical fiber sensing technology into similarity simulation experiments to improve monitoring accuracy and applicability. For instance, Chai Jing [21] employed fiber Bragg gratings in an experimental model to detect rock deformation. Ouyang Yibo [22] conducted similarity simulation experiments and compared optical fiber strain monitoring systems with digital image correlation (DIC) techniques to validate the coupling characteristics between rock and optical fibers. Zhu and Hou [23,24] investigated the strain curve variation patterns of horizontally and vertically deployed optical fibers and explored their relationship with the deformation, failure, and movement processes of overlying strata in the stope. Hou and Du [25,26] developed a model correlating roadway roof strata subsidence with optical fiber strain, confirming the feasibility and reliability of optical fiber-based monitoring in coal roadway roofs.
In summary, distributed optical fiber sensing technology has been widely applied in coal mining monitoring, and significant progress has been made in investigating overburden movement and optical fiber strain monitoring. However, the intrinsic relationship between optical fiber monitoring of surrounding rock strain and stope overburden collapse remains insufficiently explored. Therefore, this study employs laboratory and similarity simulation experiments using distributed optical fiber sensing technology to investigate the strain evolution of surrounding rock and the overburden collapse mechanism. Furthermore, this research systematically validates the feasibility and effectiveness of distributed optical fiber sensing technology in monitoring overburden collapse, providing theoretical and engineering insights into stope overburden collapse and distributed optical fiber monitoring applications.
2. The Principle of Distributed Optical Fiber Monitoring
Brillouin optical time-domain reflectometry (BOTDR) is a single-ended optical fiber sensing technology that does not require the formation of a closed-loop circuit for measurement. As illustrated in Figure 1, The frequency shift has a linear relationship with temperature or axial strain changes in the optical fiber. The frequency shift is obtained, and the change of temperature and strain along the whole distributed sensing is measured from the spontaneous Brillouin scattering light [27]. Thus, in this experiment, variations in the Brillouin frequency shift of the optical fiber sensor were monitored to assess changes in strain and temperature within the rock strata.
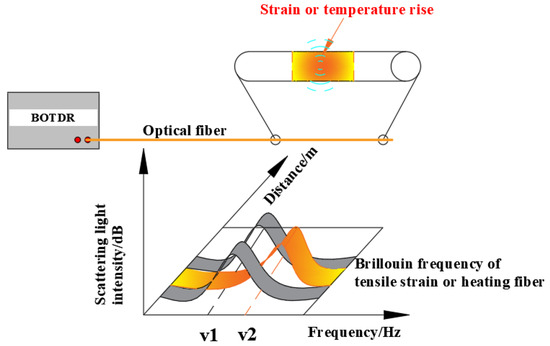
Figure 1.
BOTDR test principle.
The relationship between the Brillouin frequency shift, strain, and temperature can be expressed as follows:
where υΒ(ε,T) represents the Brillouin frequency shift after changes in strain and temperature, υΒ(0) is the initial Brillouin frequency shift of the optical fiber, ε is the axial strain of the sensing fiber, and T0 and T denote the initial and changed temperatures, respectively. Given that the experiment was conducted under controlled indoor conditions, the temperature effect on the test can be considered negligible.
In this study, an AV6419 optical time-domain strain measurement instrument was used. The device operates at a wavelength of 1550 ± 5 nm, with a maximum sampling interval of 0.05 m and a spatial resolution of 1 m. The strain measurement resolution of this device is 1 με, enabling highly sensitive detection of subtle deformations. The strain measurement accuracy is (±0.2 + 2^sampling interval + 2^10−5^distance). It supports self-initiated, single-ended measurements and offers several advantages, including a long measurement range (up to 80 km), strong environmental adaptability, wide sensing coverage, and a high dynamic range.
A high-transmission tight-sheath strain sensing cable (NZS-DSS-C07) was employed in the experiment. This cable incorporates an elastomeric sheath that enhances its coupling with the rock strata without compromising optical fiber sensitivity, thereby improving data reliability.
3. Similar Simulation Experiment
3.1. Engineering Overview
The 7242 working face is the first mining face of the 72-coal seam in the 82 mining area of the Suntuan Coal Mine, Huainan Mining Group. The roadway elevation of the 7242 working face ranges from −424.3 m to −546.9 m. The panel has a strike length of approximately 458–460 m and an inclined width of 248–250 m, with the 8242 working face located beneath it. According to geological data, the thickness of the 72-coal seam varies between 1.04 m and 2.36 m, with an average thickness of 1.7 m. The coal seam is black, ranging from powdery to flaky in texture, with well-developed endogenous fractures. It is classified as semi-bright coal, with localized interlayers of mudstone up to 0.1 m in thickness. The No. 82 coal seam has a thickness between 1.78 m and 2.07 m, averaging 2 m. It is predominantly black and powdery, mainly composed of dark coal, with a semi-dark and semi-bright texture. Figure 2 presents the comprehensive stratigraphic column and parameters of the working face.
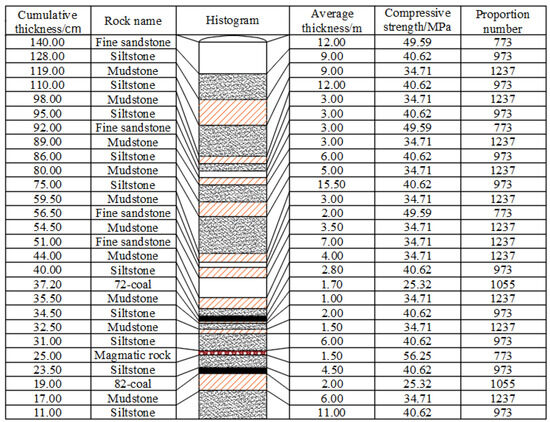
Figure 2.
Comprehensive histogram and parameters of working face.
3.2. Experimental Design
This experiment is conducted using the 7242 working face of Suntuan Coal Mine as the research background, aiming to investigate the collapse of overlying strata and the evolution of strain during the mining of the 72-coal seam. The dimensions of the similar simulation test platform are 300 cm × 30 cm × 140 cm. The geometric similarity ratio of the model is αL = 100:1 (i.e., 1 m in the actual mine corresponds to 1 cm in the model), and the model bulk density ratio is αr = 1.6:1. To accurately replicate the on-site conditions, core samples were collected from the field to analyze the mechanical properties of different rock layers. Based on the strength characteristics of the in situ rock, the similar materials for each layer were scientifically proportioned to ensure that the physical and mechanical properties of the model closely match those of the actual mining site.
The model materials primarily consist of fine sand, lime, and gypsum, where fine sand serves as the main component, while lime and gypsum act as cementing agents. During the layer placement process, mica sheets are laid between the strata to ensure uniformity and stability.
The total model length is 300 cm, with 30 cm of coal pillars reserved on both sides, corresponding to an actual working face advancement distance of 240 m. The 72-coal seam is excavated in increments of 5 m per step. The total model height is 140 cm, representing a simulated overlying rock thickness of 140 m. The strata above the model are simulated by applying a distributed load using weighted plates on the model’s top surface.
3.3. Monitoring System Layout
As illustrated in Figure 3, prior to the placement of similar materials, a certain pre-tension is applied to both ends of the optical fibers to ensure they remain taut throughout the experiment. A total of five optical fibers are embedded in the model. Two horizontal optical fibers, designated as H1 and H2, are positioned at 10 m and 30 m above the 72-coal seam to monitor roof displacement and collapse behavior. Three vertical optical fibers, labeled S1, S2, and S3, are placed at 60 m, 120 m, and 180 m from the cut-through to measure the height of overburden failure.
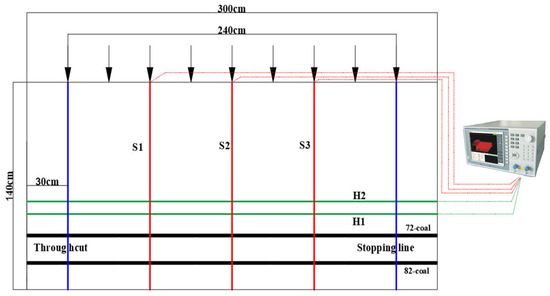
Figure 3.
Test model test layout.
Additionally, an image-based displacement measurement system is employed, comprising a high-resolution digital camera, measurement points, and GetData2.22 software. The digital camera captures sequential images to track rock strata collapse and displacement. Given the rough surface texture of the model, direct photographic observation is challenging. To enhance measurement accuracy, the model surface is coated with white paint, and a displacement measurement grid is established. Horizontal measurement lines are laid along the coal seam direction at 10 m intervals, while vertical lines are spaced every 10 m, forming a 10 × 10 m square grid. The intersections of these grid lines serve as displacement measurement points, and displacement data are extracted and analyzed using GetData software.
4. Analysis of Horizontal Optical Fiber Strain Monitoring in Stope
4.1. Analysis of Overburden Collapse and Fiber Optic Mechanism
As the working face advances, the overlying strata undergo progressive collapse. When fiber optics are effectively embedded within the rock mass, they experience axial tensile strain as the strata collapse, thereby reflecting the internal strain variations within the overburden. By analyzing the spatiotemporal evolution of overburden strain in response to mining operations, the movement and failure mechanisms of the disturbed overburden can be revealed, providing insights into the failure modes under different excavation conditions.
Since fiber optics directly capture strain evolution but do not explicitly measure displacement variations caused by rock collapse, a mechanical model is established based on the principles of material mechanics. In the model, the red line represents the initial placement of the fiber optic cable, while the green line represents its deformed shape after overburden collapse. For analytical convenience, it is assumed that the overburden load is uniformly distributed, the fiber optic material is isotropic, and the fiber remains intact and continuously deployed within the rock mass.
When the overlying strata collapse is shown in Figure 4, the following model is established. Assuming that the length between AB is l1, the length between AB’ is l’1, BB’ is the displacement h1, and the strain of fiber AB’ is ε1, it can be obtained from the definition of strain ε1:
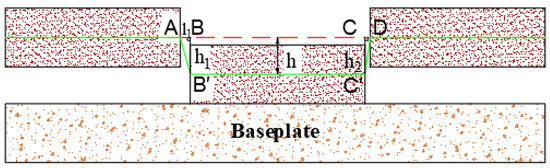
Figure 4.
Single caving of overburden rock.
Then, the length l′1 between the collapse backward AB′ is:
According to the Pythagorean theorem, the displacement h1 is:
The displacement h1 is:
As shown in Figure 5, the slope of ΔABB’ is k < 0 (the collapse slope of the rock stratum is k < 0), and the collapse displacement of the rock stratum increases, so the positive sign is taken; otherwise, the negative sign is taken. From this, it can be seen that the displacement h1 is:
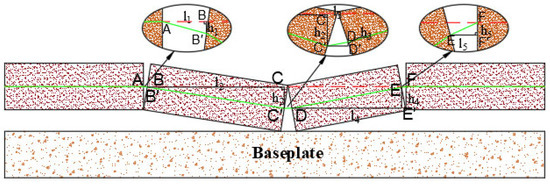
Figure 5.
Overburden hinged caving.
As shown in Figure 5, a single rock layer collapses, and the optical fiber in the rock does not undergo tensile changes, so h2 = h1.
When the overlying strata fall, as shown in Figure 5, the two ends are hinged with each other, and the following model is established. The length between AB is l1, BB′ is the displacement h1, and the strain of optical fiber AB′ is ε1. The backward displacement h1 can be obtained from the above formula:
Similarly, the length of BC is l2, CC′ is the displacement h2, and the strain of B′C′ is ε2. At this time, the total displacement of the fiber is hC = h1 + h2, and the displacement variation h2 can be obtained from the above formula:
The displacement of model D is hD = h1 + h2 + h3. The length between the CD is l3, DD′ is the displacement h3, and the strain of the optical fiber C′D is ε3. It can be seen from the diagram that the slope of the C′D of the overburden collapse is k > 0, the displacement is reduced, and h3 is negative. Therefore, the displacement variation h3 after the collapse is:
The displacement of model E is hE = h1 + h2 + h3 + h4. The length of DE is l4, EE′ is the displacement h3, and the strain at the EF point of the optical fiber is ε3. It can be seen from the diagram that the slope of the overburden caving EF is k > 0, and h4 is negative. Therefore, the displacement variation h4 after the collapse is:
The displacement of the F point of the model: hF = h1 + h2 + h3 + h4 + h5 = 0.
As shown in Figure 6, the composite collapse of overlying strata can be obtained from the above analysis. When the overlying strata are broken and collapsed, a hinge is formed between the rock mass and the rock mass, and the differential approximation is regarded as a triangle. Therefore, the displacement hn of point n can be accumulated by the displacement before point n. The positive and negative slope ki of each point represents the increase or decrease of the collapse displacement of the surrounding rock. Then, the displacement hn of point n is expressed as follows:
when the M point is the maximum displacement of the collapse, as shown in Figure 7, then hmax is:
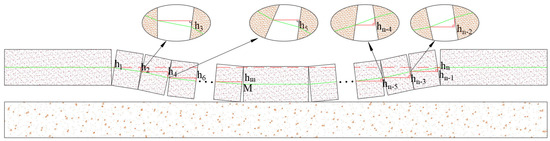
Figure 6.
Composite caving of overburden rock.
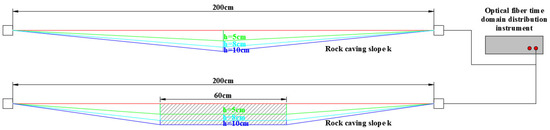
Figure 7.
Fiber tensile test layout.
Assuming that before point M, the strain at each point n satisfies the overlying rock collapse slope k < 0, and after point M, the strain at each point n satisfies the overlying rock collapse slope k > 0, then the displacement at each point satisfies:
In the formula, ∑hi is the total displacement of surrounding rock collapse; li is the initial length of the measured fiber; εi is the strain in the measured optical fiber; i is the rock block where the rock layer is broken and collapsed.
4.2. Indoor Fiber Tensile Test
To investigate the strain and displacement characteristics of fiber deformation under axial tension during the collapse of overlying rock layers, two indoor fiber tensile tests were designed and conducted to simulate the impact of different collapse modes on fiber strain.
Scheme 1: The fiber was fixed at both ends, and a vertical point load was applied at the midpoint of its effective arrangement area to simulate fiber deformation under a hinged collapse of the overlying strata. This test aimed to reveal the strain distribution and tensile characteristics of the fiber when the overlying strata underwent a hinged deformation.
Scheme 2: Similarly, the fiber was fixed at both ends, but a “rock block” with a length of 60 cm was placed at the midpoint of the effective fiber layout area to simulate fiber deformation under a single collapse of the overlying strata. This test helped to explore the stress and strain distribution characteristics of the fiber under localized rock collapse conditions.
During the experiment, the AV6419 optical time-domain strain measurement system was used for real-time monitoring of fiber strain. The measured strain values were then substituted into the strain–displacement relationship model to calculate fiber displacement. Finally, the computed tensile displacement values were compared with theoretical calculations to verify the accuracy and applicability of the model. The test setup is shown in Figure 7.
The fiber was stretched by 50 mm, 80 mm, and 100 mm at the midpoint position according to Schemes 1 and 2, and the corresponding strain curves were obtained, as shown in Figure 8. The overall fiber strain curve exhibits a slightly higher strain at both ends and a lower strain in the middle.
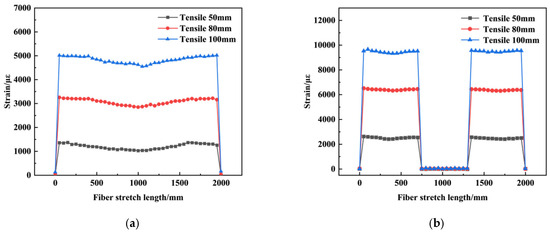
Figure 8.
Fiber tensile strain curve: (a) strain curve of fiber under point stretching, (b) strain curve of fiber under single-block collapse.
Figure 8 illustrates the strain distribution of the fiber under different tensile conditions. Generally, the strain curves exhibit a pattern where strain is slightly higher at both ends and lower in the middle, indicating that the central part of the fiber undergoes uniform deformation after loading.
From Figure 8a, it can be observed that when the fiber is stretched at the midpoint, the strain gradually attenuates toward both ends, forming a “U”-shaped curve. The tensile slope remains relatively constant, and the strain values show minimal variation, indicating uniform force distribution along the fiber.
From Figure 8b, in the case of localized rock block collapse, a significant strain concentration occurs in the affected region, whereas the strain is much lower in areas away from the collapse zone, forming two distinct “step-like” features. This suggests that when localized rock collapse occurs, the fiber effectively captures the strain concentration in the collapse-affected region. Furthermore, in the section from 700 mm to 1300 mm, where the simulated rock block applies compression, the fiber undergoes minimal deformation, resulting in negligible strain variation.
Overall, the fiber effectively reflects the strain distribution characteristics under different collapse modes, providing valuable data support for monitoring overlying rock movement using optical fiber technology.
Substituting the optical fiber strain curves into Equation (13), the displacement of the optical fiber at different tensile distances is calculated based on strain variations. The computed fiber displacement is then compared with the theoretical tensile length, as shown in Figure 9.
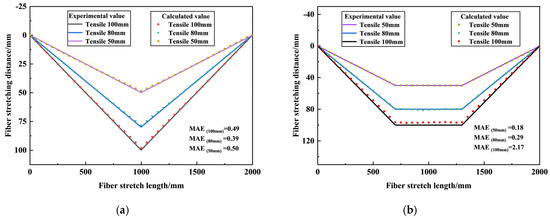
Figure 9.
Theoretical tensile distance and strain calculated displacement curve: (a) fixed-point optical fiber tensile displacement curve, (b) single collapse optical fiber tensile displacement curve.
The calculated optical fiber displacement, derived from Equation (13) based on strain variations, closely aligns with the theoretical tensile distance. This confirms that fiber strain monitoring can accurately compute actual collapse displacement, validating the scientific reliability of using optical fiber strain to represent overlying rock displacement.
However, as shown in Figure 9, the computed displacement values at certain points are slightly lower than the theoretical curve. This discrepancy may result from slippage at the fixed ends of the fiber, leading to reduced strain measurements and, consequently, slightly lower calculated displacements.
Experimental results from indoor fiber tensile tests indicate that fiber strain magnitude is positively correlated with the collapse slope. When the collapse displacement changes abruptly compared to the previous stage, a sudden increase in fiber strain occurs. Conversely, when the collapse displacement progresses gradually, the fiber strain variation remains relatively smooth.
4.3. Evolution Law of Horizontal Optical Fiber Strain in Rock Strata
As shown in the figure below, an excavation was performed on a similar simulation model, and the strain curves of horizontal optical fibers were monitored at different advancing distances. To facilitate observation, measurements were taken at working face advancements of 115 m, 155 m, 195 m, and 240 m. Optical fibers H1 and H2 were installed 10 m and 30 m above the roof of the 72-coal seam, respectively.
As shown in Figure 10a, the boundary coal pillars on both sides measure 30 m each. Before excavation, the overlying rock strain remains stable, with an average optical fiber strain value of 12 με, indicating that the rock mass is in a relatively intact and uniform stress environment, unaffected by significant disturbances. The failure of the rock mass is primarily caused by tensile stress. When the internal tensile stress reaches the ultimate tensile strength of the rock mass, fractures begin to form. At the fracture location, the optical fiber experiences a sudden tensile stress surge, leading to a sharp increase in strain. As the overlying rock collapses and gradually compacts, the optical fiber primarily endures the gravitational load of rock fragments and relatively stable tensile stress, causing the strain value to level off. This phenomenon indicates that the optical fiber undergoes tensile deformation due to rock layer collapse and experiences varying degrees of tension within fractured rock zones.
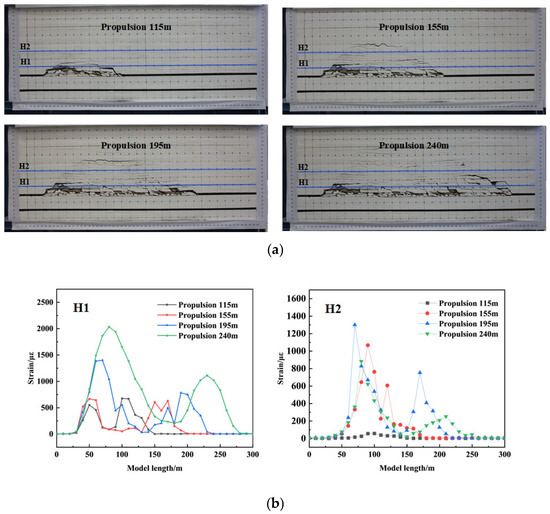
Figure 10.
Optical fiber strain curves at different advancing distances: (a) Collapse schematic. Horizontal optical fibers H1 (10 m above the 72-coal seam), horizontal optical fibers H2 (30 m above the 72-coal seam). (b) H1, H2 horizontal fiber strain curves.
As shown in Figure 10b, at 115 m and 155 m of working face advancement, the strain in optical fibers H1 and H2 remains relatively low, indicating that the roof has not yet experienced large-scale failure. The strain curves exhibit a relatively smooth double-peak pattern, with slightly higher strain values at both ends and lower values in the middle, forming a ‘saddle-shaped’ distribution. Experimental images confirm that, at this stage, the rock mass mainly develops localized fractures and small-scale collapses without significant structural instability. The left peak is primarily concentrated within the 0–50 m range from the boundary coal pillar, indicating that this area is significantly affected by stress concentration, leading to active rock failure. Meanwhile, the right peak shifts forward as the working face advances, suggesting that the rock failure zone continues to expand.
As the working face advances to 195 m and 240 m, the peak strain values increase significantly, as shown in Figure 10b. Particularly at 240 m, the peak optical fiber strain exceeds 2000 με, indicating that the roof has entered a stage of intense failure. At this stage, rock fractures on both sides of the working face become evident, with sudden strain fluctuations, while the strain within the goaf remains relatively stable due to compaction by overlying rock. The double-peak phenomenon persists, with the left peak position remaining unchanged and the right peak continuing to shift forward, confirming the progressive expansion of the failure zone.
At 195 m advancement, strain peaks increase significantly, particularly in the left-side strain region of H1 and H2, where local strain values approach 1000 με. Experimental images demonstrate that the collapse zone expands, fractures penetrate deeper, rock block sizes increase, and the severity of failure intensifies. The right peak in the strain curve moves forward, indicating that as the working face advances, the range of roof failure expands accordingly. Meanwhile, the middle section of the curve stabilizes, suggesting that the goaf rock mass enters a compaction stage, where fallen rock fragments compress and fill voids under gravity, forming a more stable stress state.
At 240 m advancement, both optical fibers H1 and H2 exhibit strain peaks exceeding 2000 με, confirming that the roof has entered a critical failure stage. Experimental images clearly show large-scale rock collapse, roof instability, and a fully developed goaf collapse zone. The strain curve continues to exhibit a double-peak pattern, but the strain in the H1 peak zone (50–120 m) and H2 peak zone (180–250 m) increases significantly, indicating that these areas correspond to major stress concentration zones or key collapse zones. At this stage, severe strain fluctuations reflect the instability and sudden failure of the rock mass, suggesting that stress accumulation in the surrounding rock leads to sudden failure events, posing serious safety risks for mining operations.
The strain curves of optical fibers H1 and H2 exhibit a consistent pattern, effectively capturing the evolution of rock mass failure. Overall, at 115 m and 155 m advancement, the roof remains largely intact, characterized by localized fractures and stress adjustments. At 195 m advancement, the collapse zone expands, roof failure intensifies, and stress concentrations become more pronounced ahead of the working face. By 240 m, large-scale rock collapse occurs, roof structures become unstable, and surrounding rock stress fluctuates violently, marking the most critical failure stage. Therefore, in coal seam mining operations, special attention should be given to the stress evolution of surrounding rock beyond 200 m of advancement, with proactive support and monitoring measures implemented to mitigate sudden failures and enhance mining safety.
4.4. Analysis of Overlying Rock Collapse Displacement
To better determine the overlying rock collapse displacement, the optical fiber strain values obtained in the previous section were substituted into the established relationship between collapse displacement and fiber strain. Additionally, Get-Data software was used for point extraction analysis to obtain the vertical displacement of the overlying rock layer during working face excavation.
As shown in Figure 11, the computed collapse displacement was compared with the fiber strain-derived displacement (hereafter referred to as ‘fiber displacement’) for further analysis.
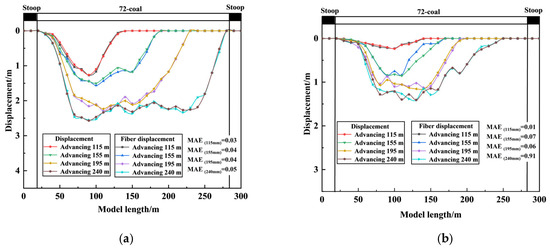
Figure 11.
Fiber displacement and displacement curve: (a) H1 fiber, (b) H2 fiber.
As shown in Figure 11, the vertical displacement curves of the overlying rock at 10 m (H1) and 30 m (H2) above the coal seam exhibit a strong correlation with the displacement curves derived from optical fiber strain conversion. This consistency demonstrates that the optical fiber strain monitoring method effectively captures the actual displacement of collapsing rock layers.
With the advancement of the working face, the collapse displacement of the overlying rock gradually increases. In the early stage, rock deformation is relatively small, but as the goaf expands, the roof stress intensifies, leading to a significant increase in collapse displacement. During the excavation process, the rock displacement pattern transitions from a ‘V-shape’ to a ‘U-shape’, indicating that initial collapse is localized, whereas, in later stages, collapse extends across the entire roof, eventually forming a large-scale subsidence zone.
Between 30 m and 75 m of the model length, the collapse displacement increases sharply, which coincides with the sudden changes in the H1 and H2 optical fiber strain curves. This indicates that the rock mass in this region has undergone significant fracturing and collapse. As excavation continues, at approximately 50 m from the advancing face, a sharp drop in collapse displacement is observed, corresponding to another sudden change in optical fiber strain. This further confirms that the peak fiber strain values are closely related to the fracture positions in the rock mass.
Overall, the collapse displacement values calculated from fiber strain closely match the actual measured data, validating the feasibility and accuracy of this monitoring method. The use of optical fiber strain data to compute displacement enables a more detailed understanding of overlying rock collapse mechanisms, providing reliable data support for roof stability assessments in coal seam mining. Furthermore, this study reinforces the scientific validity and engineering applicability of optical fiber strain theory in mining monitoring, aiding in the prediction of goaf collapse evolution trends and enhancing mine safety management.
5. Vertical Optical Fiber Strain Monitoring Analysis
5.1. Overlying Rock Collapse Height and Optical Fiber Strain Analysis
During coal seam mining, the advancement of the working face leads to overlying rock collapse, fracture expansion, and bending deformation, forming a typical “three-zone” structure. Optical fiber sensing technology enables real-time monitoring of rock strain dynamics, allowing for the characterization of overlying rock failure extent and evolution. As shown in Figure 12, the strain evolution patterns of vertical optical fibers S1, S2, and S3 at different advancing distances provide insight into the relationship between overlying rock collapse height and vertical fiber strain.
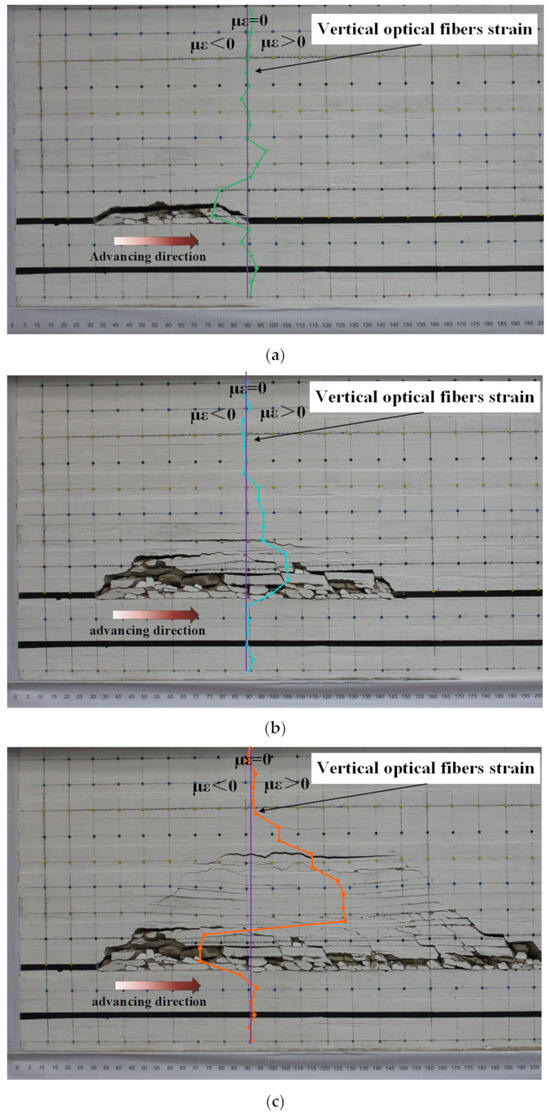
Figure 12.
Characterization of optical fiber strain in 3 stages of working face advancing: (a) fiber optic strain near the working face, (b) fiber optic strain within the working face, (c) fiber optic strain farther from the working face.
As shown in Figure 13, at different advancing distances, the strain data of S1 exhibit distinct stage-based variations. As the working face advances, significant changes occur in the strain behavior of vertical optical fibers S1, S2, and S3. Taking S1 as an example, the following patterns are observed:
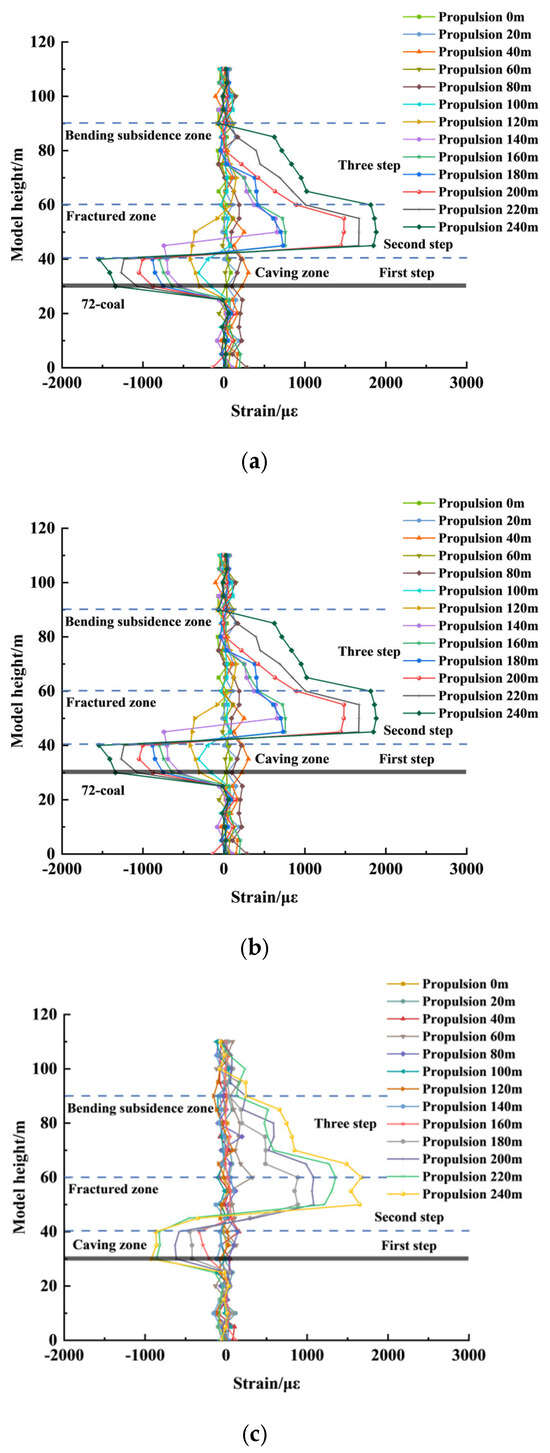
Figure 13.
Optical fiber strain curve at different distances of working face advancing: (a) optical fiber S1, (b) optical fiber S2, (c) optical fiber S3.
At 0–40 m Advancement: The working face has not yet reached the position of S1, and the rock mass remains in its initial stress state, resulting in no significant strain variations.
At 40–60 m Advancement: Due to front abutment pressure, S1 exhibits compressive strain, which increases as the working face advances. This suggests that the rock mass undergoes intensified compressive deformation in this zone.
At 60–140 m Advancement: The compressive strain transitions into tensile strain, and the strain curve exhibits a distinct “stepped” pattern. First step (0–10 m): Corresponding to the caving zone, where the step height aligns with the caving height, and strain values increase with advancing distance. Second step (10–40 m): Corresponding to the fracture zone, where strain increases with the expansion of fractures, and the step height grows as the fracture zone extends.
At 140–240 m Advancement: The strain curve further refines into three stepped regions, corresponding to the caving zone, fracture zone, and bending subsidence zone. First step (0–10 m): The strain stabilizes at 870 με, indicating a fully developed caving zone where compressive strain dominates. Third step (40–60 m): Corresponding to the bending subsidence zone, where strain values gradually decrease, indicating that the rock maintains continuity and integrity under bending deformation.
These findings suggest that optical fiber strain monitoring effectively captures the progressive failure process of the overlying rock, providing crucial insights into overlying rock collapse mechanisms in coal seam mining.
Based on the strain monitoring results of optical fiber S1, the overlying rock in the stope can be divided into three distinct zones, each exhibiting significantly different deformation and strain characteristics.
Caving Zone: This is the area most directly affected by mining. Optical fiber strain data show intense fluctuations with alternating positive and negative changes, indicating that the rock mass undergoes severe collapse effects, including rotation, compression, and impact of falling rock fragments. The high rate of strain variation suggests that rapid and large-scale rock movement occurs within a short period.
Fracture Zone: Located above the caving zone, this area exhibits more stable strain values, predominantly characterized by increasing tensile strain. This indicates that the fractured rock mass retains structural integrity, controlled by tensile stress, leading to gradual fracture expansion without immediate collapse. Unlike the caving zone, the strain curve in this region shows a gradual upward trend, reflecting a progressive failure mechanism in the rock mass.
Bending Subsidence Zone: Situated above the fracture zone, this area is primarily influenced by bending deformation rather than fracturing. The optical fiber strain values here are relatively low and stable, suggesting no large-scale fracturing or collapse. Although strain values change slightly with continued face advancement, their overall variation remains minimal, indicating that the rock mass retains significant integrity in this zone. The optical fiber strain curve clearly delineates the three-zone structure of overlying rock failure: Caving Zone: Characterized by violent strain fluctuations due to collapse. Fracture Zone: Marked by increasing tensile strain as fractures develop. Bending Subsidence Zone: Strain remains relatively stable, indicating overall rock integrity.
These findings demonstrate that optical fiber strain monitoring provides a reliable method for characterizing overlying rock failure in coal seam mining, offering valuable insights for collapse prediction and stope stability assessment.
5.2. Optical Fiber Strain Characterization at Different Stages
As the working face advances, the strain recorded by vertical optical fibers varies accordingly at different excavation distances. To facilitate observation, strain measurements were compared at three fiber locations.
The evolution of optical fiber strain clearly reflects the impact of working face advancement on both the surrounding and overlying strata. This evolution can be divided into three distinct stages:
Stage 1 (Before reaching the fiber position): Before the working face reaches the fiber, the surrounding rock mass remains intact, with no visible fractures. However, due to stress redistribution caused by coal seam extraction, the optical fiber records compressive strain, which stabilizes once the pressure reaches a threshold (as shown in Figure 12a). This indicates that in this initial stage, the overlying rock can still withstand mining-induced stress, and the structure remains undamaged.
Stage 2 (fiber within the working face): When the working face reaches the fiber, fractures begin to develop inside the surrounding rock, particularly horizontal tensile fractures. The subsequent overlying rock collapse further intensifies stress changes. During this stage, the optical fiber strain transitions from compressive to tensile strain, with the height of tensile strain influence increasing as the collapse extends upward (as shown in Figure 12b). This suggests that as the working face advances past the fiber location, the rock mass shifts from a compressed state to tensile failure.
Stage 3 (fiber positioned after the working face has passed): As the working face moves away, the characteristics of the overlying rock collapse change. The goaf rock mass enters the stages of fracturing, collapse, and compaction. In the vertical direction, the rock mass within 0–100 m of the goaf has fully collapsed and entered a stable compaction state, whereas rock beyond 100 m is still in the early stages of fracturing and collapse. Consequently, the optical fiber strain curve exhibits alternating positive and negative variations (as shown in Figure 12c). This indicates that optical fiber monitoring not only captures the failure process of the rock mass but also reveals the stress evolution characteristics at different excavation stages.
Throughout the working face advancement, optical fiber strain monitoring effectively captures the entire rock deformation process—from stability and compression to fracturing and tension, followed by collapse and compaction. This provides reliable data for studying overlying rock collapse mechanisms and further validates the scientific feasibility of using optical fiber monitoring for evaluating mining-induced rock deformation.
6. Conclusions
- (1)
- To monitor the collapse of overlying strata, a collapse model was established, and three distinct collapse modes—single collapse, articulated collapse, and composite collapse—were systematically analyzed. Based on this model, an analytical expression was derived to describe the relationship between overlying strata displacement and horizontal fiber strain. Laboratory fiber tensile tests demonstrated a significant positive correlation between fiber strain and the collapse slope of the overlying strata, providing a theoretical basis for quantitative monitoring of the collapse process.
- (2)
- Horizontal fiber monitoring results indicate that fiber strain can accurately capture the evolution of overlying strata collapse, with strong agreement between the measured strain and actual displacement height. At 115 m and 155 m of advancement, the rock strata primarily experienced stress adjustments with minimal failure. At 195 m, the collapse zone expanded, leading to a substantial increase in strain. By 240 m, the roof experienced severe failure, forming a complete caving zone in the goaf. Fiber strain effectively detects rock deformation and identifies fracture locations, verifying its feasibility in coal seam mining monitoring and providing reliable technical support for roof stability assessment and mine safety management.
- (3)
- Vertical fiber monitoring clearly delineated the dynamic evolution of the “three-zone” structure in the overlying strata. Throughout the working face advancement, strain exhibited a staged variation characterized by three phases: compressive strain, tensile strain, and stabilized compaction. In the caving zone, fiber strain fluctuated intensely due to the rotation and extrusion of collapsed rock blocks before eventually stabilizing. In the fracture zone, fiber strain exhibited continuous tensile characteristics, indicating gradual fracture expansion while maintaining structural integrity, revealing the progressive nature of failure. In the bending subsidence zone, fiber strain remained relatively small and stable, suggesting that the rock mass retained overall continuity and was primarily influenced by bending deformation.
- (4)
- The study results demonstrate that during coal seam mining, the collapse height and evolution of the overlying strata exhibit distinct staged characteristics, which can be classified into three zones: caving zone, fracture zone, and bending subsidence zone. Fiber strain monitoring provides an effective method for detecting rock deformation and accurately identifying fracture locations. This approach offers scientific insights into overlying strata collapse mechanisms and serves as a critical technical tool for mine safety monitoring, roof stability evaluation, and hazard early warning in coal mining operations.
Author Contributions
C.H.: methodology, investigation, writing—original draft. C.M.: conceptualization, formal analysis, writing—review and editing. H.Z.: conceptualization, supervision, visualization, investigation, funding acquisition. Q.X.: conceptualization, resources, supervision, writing—review and editing. All authors have read and agreed to the published version of the manuscript.
Funding
This work was funded by the State Key Laboratory of Precision Blasting and Hubei Key Laboratory of Blasting Engineering, grant number (No. PBSKL2022B01).
Institutional Review Board Statement
Not applicable.
Informed Consent Statement
Not applicable.
Data Availability Statement
The data that support the findings of this study are available from the corresponding author upon reasonable request.
Conflicts of Interest
The authors declare no conflicts of interest.
References
- Cheng, G.; Ma, T.; Tang, C.; Liu, H.; Wang, S. A zoning model for coal mining-induced strata movement based on microseismic monitoring. Int. J. Rock Mech. Min. Sci. 2017, 94, 123–138. [Google Scholar] [CrossRef]
- Hu, S.; Yu, T. Study on overlying rock movement and mine pressure behavior in shallow-buried close coal multi-seam mining. Alex. Eng. J. 2024, 105, 578–587. [Google Scholar] [CrossRef]
- Ren, Y.; Yuan, Q.; Chen, J.; Wang, Z.; Zhang, D.; Li, S. Evolution characteristics of mining-induced fractures in overburden strata under close-multi coal seams mining based on optical fiber monitoring. Eng. Geol. 2024, 343, 107802. [Google Scholar] [CrossRef]
- Du, W.; Chai, J.; Zhang, D.; Lei, W. The study of water-resistant key strata stability detected by optic fiber sensing in shallow-buried coal seam. Int. J. Rock Mech. Min. Sci. 2021, 141, 104604. [Google Scholar] [CrossRef]
- Li, T.; Wu, D.; Khyam, M.O.; Guo, J.; Tan, Y.; Zhou, Z. Recent Advances and Tendencies Regarding Fiber Optic Sensors for Deformation Measurement: A Review. IEEE Sens. J. 2022, 22, 2962–2973. [Google Scholar] [CrossRef]
- Zhang, G.; Chai, J.; Li, Y.; Mi, X. On stress distribution of bolt in pullout test based on FBG. J. Min. Saf. Eng. 2014, 31, 635–638. [Google Scholar]
- Ma, J.; Pei, H.; Zhu, H.; Shi, B.; Yin, J. A review of previous studies on the applications of fiber optic sensing technologies in geotechnical monitoring. Rock Mech. Bull. 2023, 2, 100021. [Google Scholar] [CrossRef]
- Liu, J.; Shi, B.; Cui, Y.-J.; Sun, M.-Y.; Gu, K.; Yao, J.-C.; Tang, C.-S. Predicting the deformation of compacted loess used for land creation based on the field monitoring with fiber-optic technology. Eng. Geol. 2024, 336, 107542. [Google Scholar] [CrossRef]
- Liu, C.; Zhang, P.; Shang, J.; Yao, D.; Wu, R.; Ou, Y.; Tian, Y. Comprehensive research on the failure evolution of the floor in upper mining of deep and thick coal seam. J. Appl. Geophys. 2022, 206, 104774. [Google Scholar] [CrossRef]
- Johnson Singh, M.; Choudhary, S.; Chen, W.-B.; Wu, P.-C.; Kumar Goyal, M.; Rajput, A.; Borana, L. Applications of fibre Bragg grating sensors for monitoring geotechnical structures: A comprehensive review. Measurement 2023, 218, 113171. [Google Scholar] [CrossRef]
- Hao, H.; Chai, J.; Ouyang, Y.; Zhang, D.; Gao, J.; Wang, J.; Huang, Z. Accurate monitoring of coal pillar deformation based on distributed optical fiber. Opt. Fiber Technol. 2024, 84, 103748. [Google Scholar] [CrossRef]
- Chai, J.; Ouyang, Y.; Liu, J.; Zhang, D.; Du, W. Experimental evaluation of precise monitoring of multi-scale deformation failure of rock mass based on distributed optical fiber. Measurement 2022, 199, 111381. [Google Scholar] [CrossRef]
- Du, W.; Chai, J.; Zhang, D.; Lei, W. Application of optical fiber sensing technology in similar model test of Shallow-buried and thick coal seam mining. Measurement 2021, 181, 109559. [Google Scholar] [CrossRef]
- Chai, J.; Yan, Z.; Ouyang, Y.; Zhang, D.; Yang, J.; Yang, G.; Ma, C. Dynamic Monitoring of Goaf Stress Field and Rock Deformation Driven by Optical Diber Sensing Technology. Appl. Sci. 2025, 15, 4393. [Google Scholar] [CrossRef]
- Chai, J.; Ma, Z.; Zhang, D.; Yuan, Q.; Lei, W. Experimental study on PPP-BOTDA distributed measurement and analysis of mining overburden key movement characteristics. Opt. Fiber Technol. 2020, 56, 102175. [Google Scholar] [CrossRef]
- Li, Z.-X.; Hou, G.-Y.; Wang, K.-D.; Hu, J.-X. Deformation monitoring of cracked concrete structures based on distributed optical fiber sensing technology. Opt. Fiber Technol. 2021, 61, 102446. [Google Scholar] [CrossRef]
- Acharya, A.; Kogure, T. Advances in fibre-optic-based slope reinforcement monitoring: A review. J. Rock Mech. Geotech. Eng. 2025, 17, 1263–1284. [Google Scholar] [CrossRef]
- Feng, X.-T.; Yang, C.-X.; He, B.-G.; Yao, Z.-B.; Hu, L.; Zhang, W.; Kong, R.; Zhao, J.; Liu, Z.-B.; Bi, X. Artificial intelligence technology in rock mechanics and rock engineering. Deep Resour. Eng. 2024, 1, 100008. [Google Scholar] [CrossRef]
- Lou, J.; Gao, F.; Li, J.; Yang, J.; Wang, X.; Lei, S. Research and application of stress (pressure) measurement system for physical modeling. J. China Coal Soc. 2019, 44, 31–40. [Google Scholar]
- Zheng, Y.; Zhu, Z.-W.; Xiao, W.; Deng, Q.-X. Review of fiber optic sensors in geotechnical health monitoring. Opt. Fiber Technol. 2020, 54, 102127. [Google Scholar] [CrossRef]
- Chai, J.; Qiu, B.; Li, Y.; Zhu, L. Simulation Experiment of Embedded Fiber Bragg Grating Monitoring in Rock Deformation Through Borehole. J. Min. Saf. Eng. 2012, 29, 44–47. [Google Scholar]
- Chai, J.; Ouyang, Y.; Zhang, D.; Lei, W. Theoretical analysis of the mechanical coupling between rock and optical fiber for distributed sensing of overlying strata deformation. J. Min. Strat. Control. Eng. 2020, 2, 73–82. [Google Scholar]
- Zhu, L.; Gu, W.; Chai, J. Distributed optical fiber monitoring of the whole field deformation evolution process of mining overburden. J. Min. Strat. Control Eng. 2022, 4, 43–50. [Google Scholar]
- Hou, G.; Hu, T.; Li, Z. Study on deformation characterization of ‘ two zones ‘ in overburden mining based on BOFDA. J. Min. Saf. Eng. 2020, 37, 224–237. [Google Scholar]
- Hou, G.; Xie, B.; Jiang, Y. Model construction and experimental study on the relationship between optical fiber strain and roof settlement deformation based on BOTDR. Geotech. Mech. 2017, 38, 1298–1304. [Google Scholar]
- Du, C.; Hu, T.; Li, Y. Feasibility study on distributed optical fiber monitoring of coal roadway roof. Min. Saf. Environ. Prot. 2022, 49, 81–88. [Google Scholar]
- Liu, Y.; Li, W.; He, J.I.; Liu, S.; Cai, L.; Cheng, G. Application of Brillouin optical time domain reflectometry to dynamic monitoring of overburden deformation and failure caused by underground mining. Int. J. Rock Mech. Min. Sci. 2018, 106, 133–143. [Google Scholar] [CrossRef]
Disclaimer/Publisher’s Note: The statements, opinions and data contained in all publications are solely those of the individual author(s) and contributor(s) and not of MDPI and/or the editor(s). MDPI and/or the editor(s) disclaim responsibility for any injury to people or property resulting from any ideas, methods, instructions or products referred to in the content. |
© 2025 by the authors. Licensee MDPI, Basel, Switzerland. This article is an open access article distributed under the terms and conditions of the Creative Commons Attribution (CC BY) license (https://creativecommons.org/licenses/by/4.0/).