Article

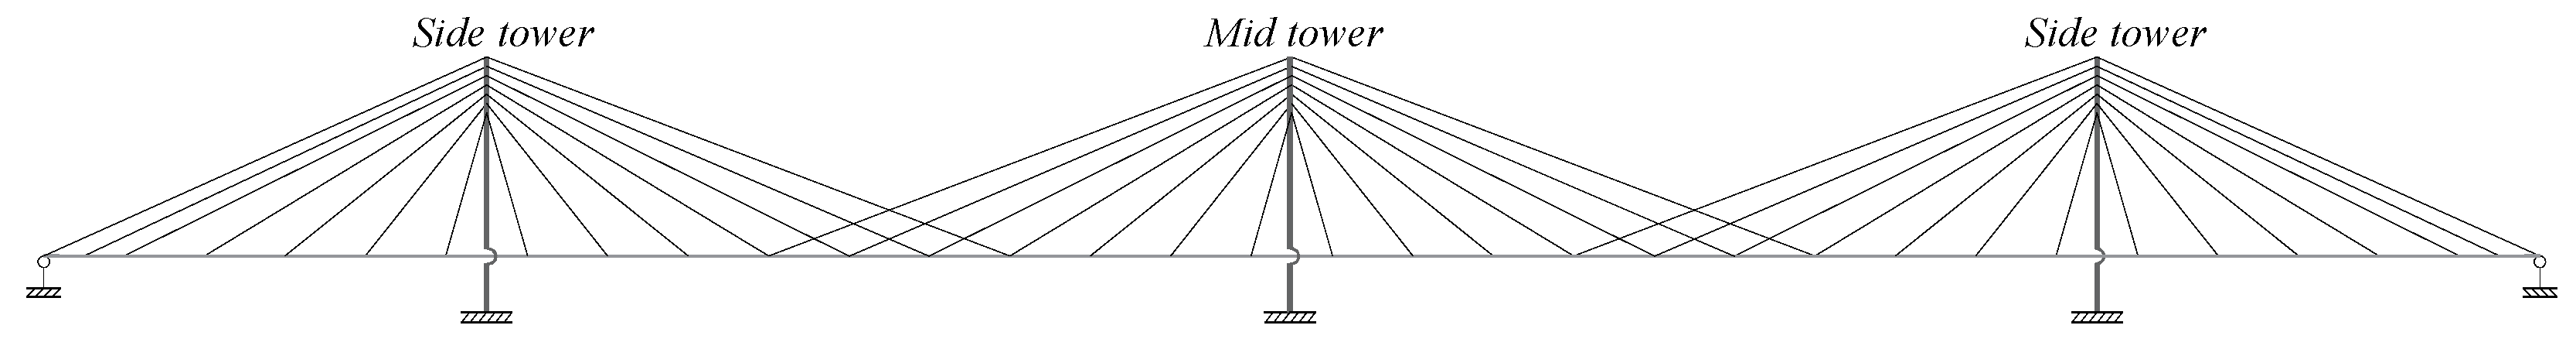
Influence of Crossing Cable Arrangement on the Static Performance of Long-Span Three-Tower Cable-Stayed Bridges

School of Architecture and Civil Engineering, Xi’an University of Science and Technology, No. 58 Yanta Rd., Xi’an 710054, China
*
Author to whom correspondence should be addressed.
Appl. Sci. 2025, 15(11), 6355; https://doi.org/10.3390/app15116355
Submission received: 14 April 2025 / Revised: 24 May 2025 / Accepted: 3 June 2025 / Published: 5 June 2025

Abstract

Insufficient structural stiffness is a key technical challenge that restricts the increase in span of multi-tower cable-stayed bridges. In order to clarify the application effect of crossing cables in long-span, multi-tower cable-stayed bridges, theoretical analysis and the finite element method were used to study the influence of the cable sag effect on the longitudinal constraint stiffness of crossing cables. The longitudinal constraint stiffness formula of the crossing cable was modified by introducing the equivalent elastic modulus to consider the cable sag effect. Based on the stiffness formula, the influence of the main span, initial stress of the crossing cable, and the ratio of the crossing cable area on its restraining effect was analyzed. The finite element model of a three-tower cable-stayed bridge with main span length of 1000 m and 1500 m is established to verify the accuracy of the formula, and the influence of the number of crossing cables and the tower height on the restraining effect of crossing cables is explored. The research results indicate that as the main span length increases, the location of maximum restraining stiffness of crossing cables moves closer to the mid span; increasing the area of crossing cables connected to the mid tower can effectively suppress the deviation of the tower. In addition, increasing the main span length will reduce the restraining effect of the crossing cables, while changes in the height of the towers do not affect the enhancement effect of the crossing cables on structural rigidity.

1. Introduction

The cable-stayed bridge is one of the commonly used bridge types among long-span bridges. Since the birth of the first modern cable-stayed bridge, the Stromsund Bridge, it has undergone a transformation from a sparse cable system to a dense cable system [1]. With the application of high-strength materials, the spanning capacity of cable-stayed bridges has been continuously improved, evolving from an initial main span of 182.6 m to the current 1208 m. Some representative long-span cable-stayed bridges include the following: The Sutong Yangtze River Highway Bridge (2008) [2] is the world’s first cable-stayed bridge with a span exceeding 1000 m, featuring a main span of 1088 m and a cable strength of 1770 MPa. The Russky Island Bridge (2012) [3] holds the record for the world’s largest span of a highway cable-stayed bridge, with a main span of 1104 m. The Changtai Yangtze River Bridge (expected to be completed by 2025) [4] boasts the world’s largest span for a dual-purpose highway and railway cable-stayed bridge, spanning 1208 m and featuring a strengthened cable of 2100 MPa. Another notable railway cable-stayed bridge is the Ma’anshan Yangtze River Bridge (expected to be completed by 2026) [5], a three-tower structure with a main span of 2 × 1120 m. Compared to double-tower cable-stayed bridges, multi-tower cable-stayed bridges have greater spanning capacity, but they suffer from issues such as low structural rigidity [6]. The development trend of cable-stayed bridges is towards larger spans, and taking effective measures to enhance structural stiffness is a key technical issue in designing large-span multi-tower cable-stayed bridges.
The mid tower of multi-tower cable-stayed bridges lacks the longitudinal constraint of backstays, resulting in insufficient overall structural resistance to deformation. Under live load, the deformations of the deck and towers are relatively large [7]. Measures to enhance the structural rigidity of multi-tower cable-stayed bridges primarily fall into two categories [8,9]: one is to increase the bending stiffness of the bridge towers; the other is to add stiffening cables to the main span. The Rion–Antirion Bridge [10] (with a main span of 3 × 560 m), the Millau Bridge [11] (with a main span of 6 × 342 m), and the Ma’anshan Yangtze River Bridge have adopted the first measure, which involves increasing the bending stiffness of the bridge towers to reduce the displacement of the towers and deck. The second measure mainly involves two schemes: setting stabilizing cables at the mid tower and setting crossing cables at the main span. The Ting Kau Bridge [12] (with two main spans of 448 + 475 m) has stabilizing cables set up along the bridge direction on both sides of the mid tower to increase the rigidity of the mid tower. The stabilizing cables at the mid tower need to span the entire main span. When the main span is long, its sag effect becomes more pronounced, greatly reducing its restraining effect. The Queensferry Bridge [13] (with two main spans of 2 × 650 m) and the Huangmaohai Bridge [14] (with two main spans of 2 × 720 m) have crossing cables installed at main spans to enhance the overall rigidity of the structure, which proves that this method can effectively improve the structural stiffness. However, as the length of the main span increases, the sag effect of the cables will reduce the axial stiffness of the crossing cables. For three-tower cable-stayed bridges with main spans up to the kilometer scale, there is still a lack of relevant research on the influence of the crossing cable on the structural performance and its optimal setting method.
Gimsing [9] proposed a scheme to enhance the structural rigidity of multi-tower cable-stayed bridges by installing crossing cables on the main span. This scheme redistributed the dead load of the deck among the crossing cables, thereby providing effective longitudinal restraint to the mid tower. To clarify the performance of the crossing cable, Chai [15] derived the formula for the longitudinal constraint stiffness of the crossing cable to the mid tower, and proposed a simplified calculation method for the longitudinal displacement of the mid tower and the vertical displacement of the loading span deck under uniformly distributed load for three-tower cable-stayed bridges [16]. Subsequently, based on the longitudinal constraint stiffness formula of the crossing cable, the influence of crossing cable area and anchorage position on its constraint performance was analyzed [17]. Theoretical research indicates that when the height-to-span ratio of the tower to the span length ranges from 0.2 to 0.3, the maximum constraint stiffness is attained when the crossing cable anchor is located at a distance of 0.69–0.73 times the span length from the mid tower. Based on the Queensferry Bridge, Yao et al. [18] compared the economic efficiency of two crossing cable schemes, namely increasing the stay cable in the mid span and changing the cable spacing, and believed that the second scheme is more economical. Shao et al. [19] removed the mid tower crossing cables on the basis of setting crossing cables at the mid span, thereby increasing the range of the side tower cable supporting the deck, forming an “ unequal-size fan” form. This cable arrangement utilizes the strong constraint of the back cables to improve the structural stiffness. Baldomir et al. [20] optimized the steel volume of the Queensferry Bridge by setting the area and pre-tension force of each cable as variables. The optimization results revealed that increasing the length of the crossing zone could reduce the steel volume in the cables. Subsequently, Arellano et al. [21] optimized the crossover cable zone length by employing the non-dominated sorting genetic algorithm, with the objectives of minimizing steel consumption in crossing cables and displacement at the tower top. A solution from the Pareto front revealed that the optimal anchorage length of crossing cables was 0.28 times the main span length. All aforementioned optimizations adopted the mid-span arrangement of crossover cables. Subsequently, Cid et al. [22], based on the Queensferry Bridge case study, optimized the entire cable system. Under constraints of stiffness and mechanical performance, the optimal cable arrangement with minimal steel consumption positioned crossing cables away from the mid span. As the crossing cable zone expanded, their anchorage locations progressively moved closer to the side towers. This demonstrates that anchoring crossing cables near side towers provides greater constraint stiffness. Huang et al. [23] proposed an optimization strategy that combines analytical and optimization algorithms to optimize the arrangement of crossing cables with the goal of minimizing steel consumption for cables. The optimization results confirm that asymmetric arrangement has a better effect on improving structural stiffness than symmetric arrangement.
The above research analyzes the influence of the crossing cables on the mechanical properties of the structure and the optimal setting of the crossing cables, with a research background focusing on cable-stayed bridges with a main span ranging from 600 to 700 m. However, in long-span cable-stayed bridges, the sag effect of cables is significant, and the influence of crossing cables on the mechanical properties of the structure is still unclear.
In Section 2 of this paper, the equivalent elastic modulus is incorporated into the constraint stiffness formula of crossing cables to account for the sag effect. Based on the modified formula, the influence of crossing cable parameters on their mechanical performance is analyzed. Section 3 introduces the finite element models of two three-tower cable-stayed bridges with different spans. In Section 4, the finite element models are utilized to validate the accuracy of the proposed formula, and the effects of anchorage locations and the cross-sectional area ratio of crossing cables between the mid tower and side towers on their restraining effectiveness are investigated.

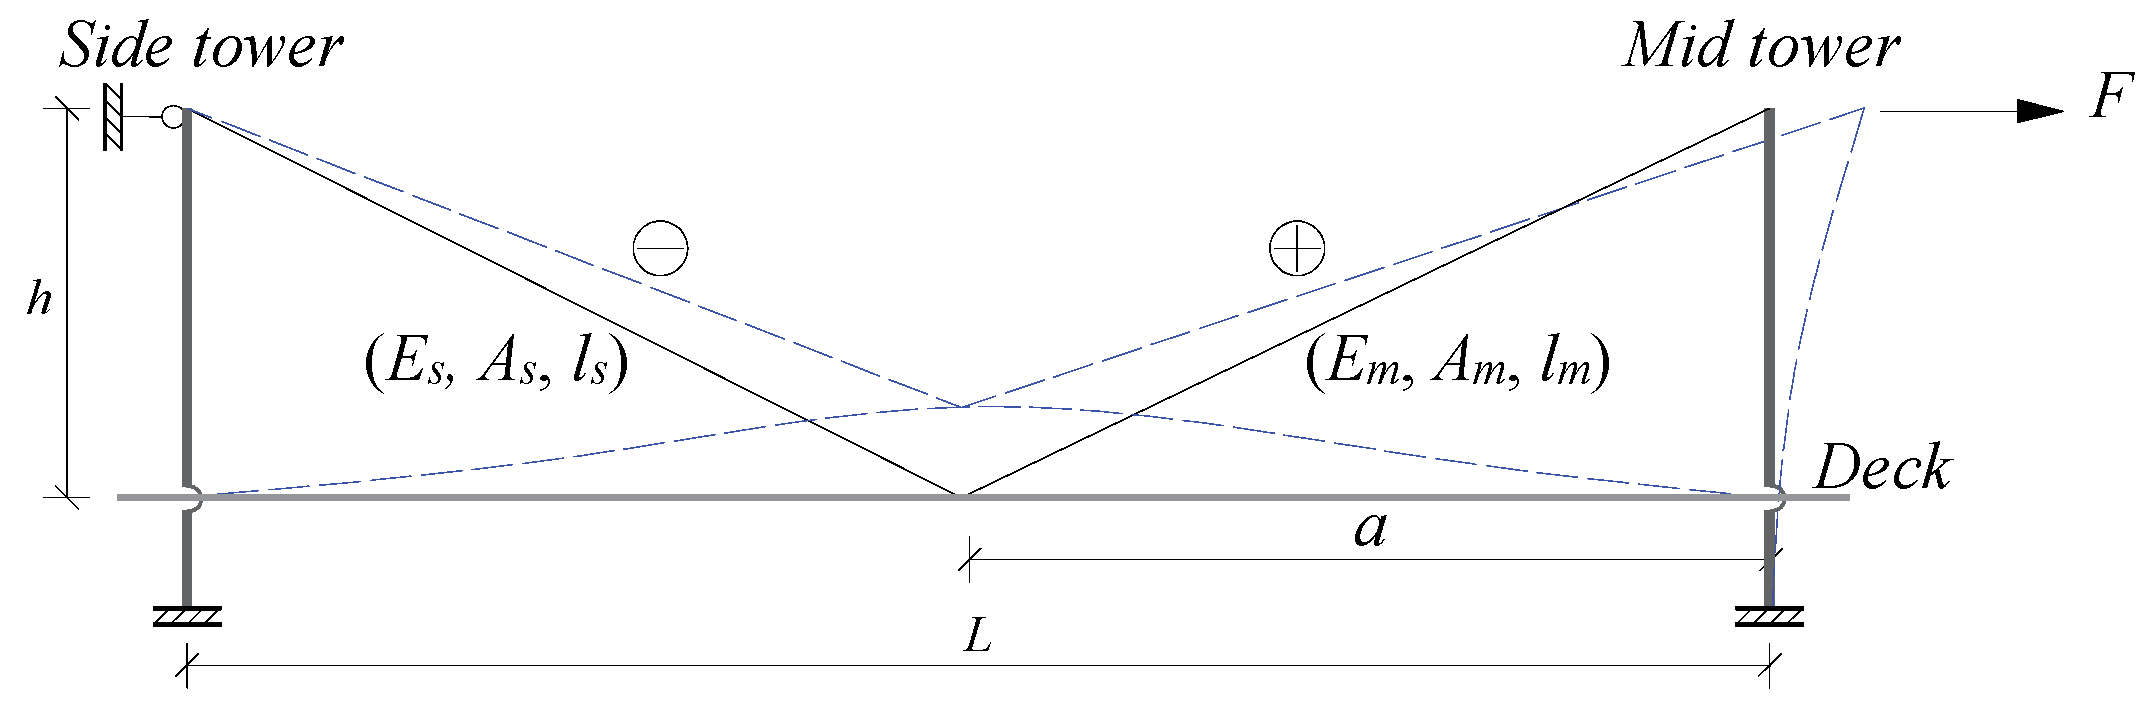
2. Analysis of Sag Effect Influence

The structural form of setting crossing cables in the mid span of the three-tower cable-stayed bridge is shown in Figure 1. Chai et al. [15,16] analyzed the mechanical mechanism by which the crossing cables provide restraint to the bridge towers. When an unbalanced horizontal force is applied to the top of the mid tower, the change in the cable forces of a pair of crossing cables is shown in Figure 2. In the figure, the crossing cables are anchored at a distance a from the mid tower, with the main span length denoted as L and the tower height above the deck as h. When the mid tower deflects, the crossing cables of the mid tower are tensioned, resulting in increased cable forces that restrain the tower’s deflection. Meanwhile, the cable forces in the crossing cables of the side towers decrease. A portion of the dead load on the main girder originally borne by the side towers’ crossing cables is transferred to the mid tower’s crossing cables. This load redistribution maintains the force equilibrium of the main girder and enhances the structural stiffness.
Chai et al. [15,16,17] derived the analytical formula of the longitudinal constraint stiffness of the crossing cable to the mid tower based on the action mechanism of the crossing cable:
k = a 2 l s 3 E s A s + l m 3 E m A m
where a represents the distance from the anchorage position of the crossing cable to the mid tower and l and A are the length and cross-sectional area of the cable, respectively. E′ is the elastic modulus of the cable. The subscripts s and m, respectively, represent the side tower and the mid tower. When the sag effect is not considered, the anchorage position with the maximum constraint stiffness of the crossing cable is located near 0.7 times the span length from the mid tower [17].
Under actual loading conditions, stay cables develop sag along the span due to their self-weight [24]. The presence of sag causes the stay cables to deviate from a straight-line configuration, leading to a reduction in their axial stiffness. As the cable length increases, the sag effect exerts a more pronounced influence on the axial stiffness of stay cables [25,26]. The Ernst formula [27] accounts for the sag effect by modifying the elastic modulus of the cable. The equivalent elastic modulus is calculated as shown in Equation (2), and this formula has been widely adopted [28,29,30].
E = E 1 + γ 2 d 2 E 12 σ 3
where γ represents the weight of the cable, d denotes the horizontal projected length of the cable, E is the elastic modulus of the cable, and σ is the initial stress of the cable.
Under dead load, the stress level of the crossing cable is σ. Substituting Equation (2) into Equation (1), the longitudinal constraint stiffness k of the crossing cable considering the sag effect can be obtained, which is expressed as follows:
k = 12 E a 2 σ 3 h 2   +   L a 2 3 2 12 σ 3   +   γ 2 E L a 2 A s + h 2   +   a 2 3 2 12 σ 3   +   γ 2 E a 2 A m
Let the ratio of the cross-sectional areas of the mid-tower crossing cable and the side tower crossing cable be Am/As = t, where As = A. Equation (3) can be expressed as follows:
k = 12 E A a 2 σ 3 h 2 + L a 2 3 2 12 σ 3 + E γ 2 L a 2 + h 2 + a 2 3 2 12 σ 3 + E γ 2 a 2 t
The ratio of tower height to main span length, denoted as h/L = α, is referred to as the height-to-span ratio. The ratio of the length a from the crossing cables to the mid tower relative to the span length L is defined as the anchor span ratio β (a/L = β), and substituted into Equation (4):
k = 12 E A β 2 σ 3 L α 2 + 1 β 2 3 2 12 σ 3 + γ 2 E L 2 1 β 2 + α 2 + β 2 3 2 12 σ 3 + γ 2 E β 2 L 2 t
From Equation (5), it can be seen that when the height-to-span ratio and the material properties of the crossing cable are constant, the constraint stiffness k is related to the main span length L, the height-to-span ratio α, the ratio t of the crossing cable areas of the mid and side tower, the anchor span ratio β, and the initial stress σ. Based on Equation (5), the relationship between main span length L, anchor span ratio β, initial stress σ and crossing cable constraint stiffness k is analyzed. The ratio of the crossing cable area of the side tower to the mid tower is t = 1, and the relationship between the constraint stiffness of the crossing cable and the anchorage position (anchor span ratio), span length and initial stress of the crossing cable is studied, respectively.
The ratio of height to span is 0.25, the area of the cable is 0.008 m2, and the initial stress is 600 MPa. The cable is a high-strength steel wire, with an elastic modulus of 205 GPa and a specific weight of 78.5 kN/m3. The relationship between the crossing cable constraint stiffness k and the anchor span ratio β under different main span lengths is shown in Figure 3.
As can be seen from Figure 3, the constraint stiffness of the crossing cable is related to its anchorage position. When the main span lengths are 700 m, 1000 m, and 1500 m, the anchor span ratios corresponding to the maximum constraint stiffness of the crossing cable are 0.694, 0.673, and 0.633, respectively. As the length of the main span increases, the anchorage position with the maximum constraint stiffness tends to move towards the mid span.
When the height-to-span ratio is 0.25 and the anchor span ratios are 0.5, 0.6, and 0.7, respectively, the relationship between the constraint stiffness k of the crossing cable and the main span length L is shown in Figure 4.
As can be seen from Figure 4, as the main span length increases, the constraint stiffness of the crossing cables continuously decreases. When the anchor span ratio β is 0.5, 0.6, and 0.7, the constraint stiffness of the crossing cables decreases by 73.04%, 74.09%, and 76.30%, respectively, as the main span length increases from 500 m to 1500 m. The main span length has a significant impact on the constraint stiffness of the crossing cables. This is mainly because as the span increases, the cable length increases and the sag effect increases, both of which reduce the axial stiffness of the cable.
When the main span length is 1000 m and the height-to-span ratio is 0.25, the relationship between constraint stiffness k and anchor span ratio β under different initial stresses of cables is shown in Figure 5.
As can be seen from Figure 5, after increasing the initial stress of the cable, due to the reduced sag effect of the cable, the anchorage position with the maximum constraint stiffness of the crossing cable tends towards the side tower, and its constraint stiffness gradually increases. Compared to the initial stress of 500 MPa, the constraint stiffness increases by 11.46% and 18.68% when the initial stress is 600 MPa and 700 MPa, respectively.
The influence of the area ratio of the crossing cable between the mid tower and the side tower on its constraint stiffness is analyzed below. The steel volume of a pair of crossing cables is defined as C, which has the following relationship:
A m / A s = t A m ( h 2 + a 2 ) 1 2 + A s h 2 + L a 2 1 2 = C
By substituting Equation (6) into Equation (5), the following can be obtained:
k = 12 E C β 2 σ 3 L 2 t α 2 + β 2 1 2 + α 2 + 1 β 2 1 2 α 2 + 1 β 2 3 2 12 σ 3 + γ 2 E L 2 1 β 2 + α 2 + β 2 3 2 12 σ 3 + γ 2 E β 2 L 2 t
Based on Equation (7), the relationship between the ratio t of crossing cable area and its constraint stiffness k is discussed. Let the steel volume of a pair of crossing cables C = 8.90 m3. Figure 6 and Figure 7 show the relationship between the ratio t of crossing cable area and k, for main span lengths of 1000 m and 1500 m, respectively.
It can be seen from Figure 6 and Figure 7 that when the steel volume of the crossing cable is constant, there is an optimal ratio of crossing cable area in theory, which maximizes its constraint stiffness. When the anchor span ratio β is 0.5, 0.6, and 0.7, the crossing cable area ratios at the maximum constraint stiffness under the main span of 1000 m are 1.02, 1.43, and 2.04, respectively. At the main span of 1500 m, the ratios are 1.02, 1.53, and 2.25. When the crossing cable is anchored at the mid span, the constraint stiffness is the largest when the crossing cable of the side tower and the middle tower adopts the same cross-sectional area. When the anchorage position of the crossing cable is biased towards the side tower, increasing the ratio of the crossing cable area between the mid tower and the side tower can increase its constraint stiffness.

3. Finite Element Analysis

To verify the accuracy of Equation (5) and analyze the constraint performance of the crossing cables, two models of three-tower cable-stayed bridges with main span lengths of 1000 m and 1500 m were designed, featuring a height-to-span ratio of 0.25.

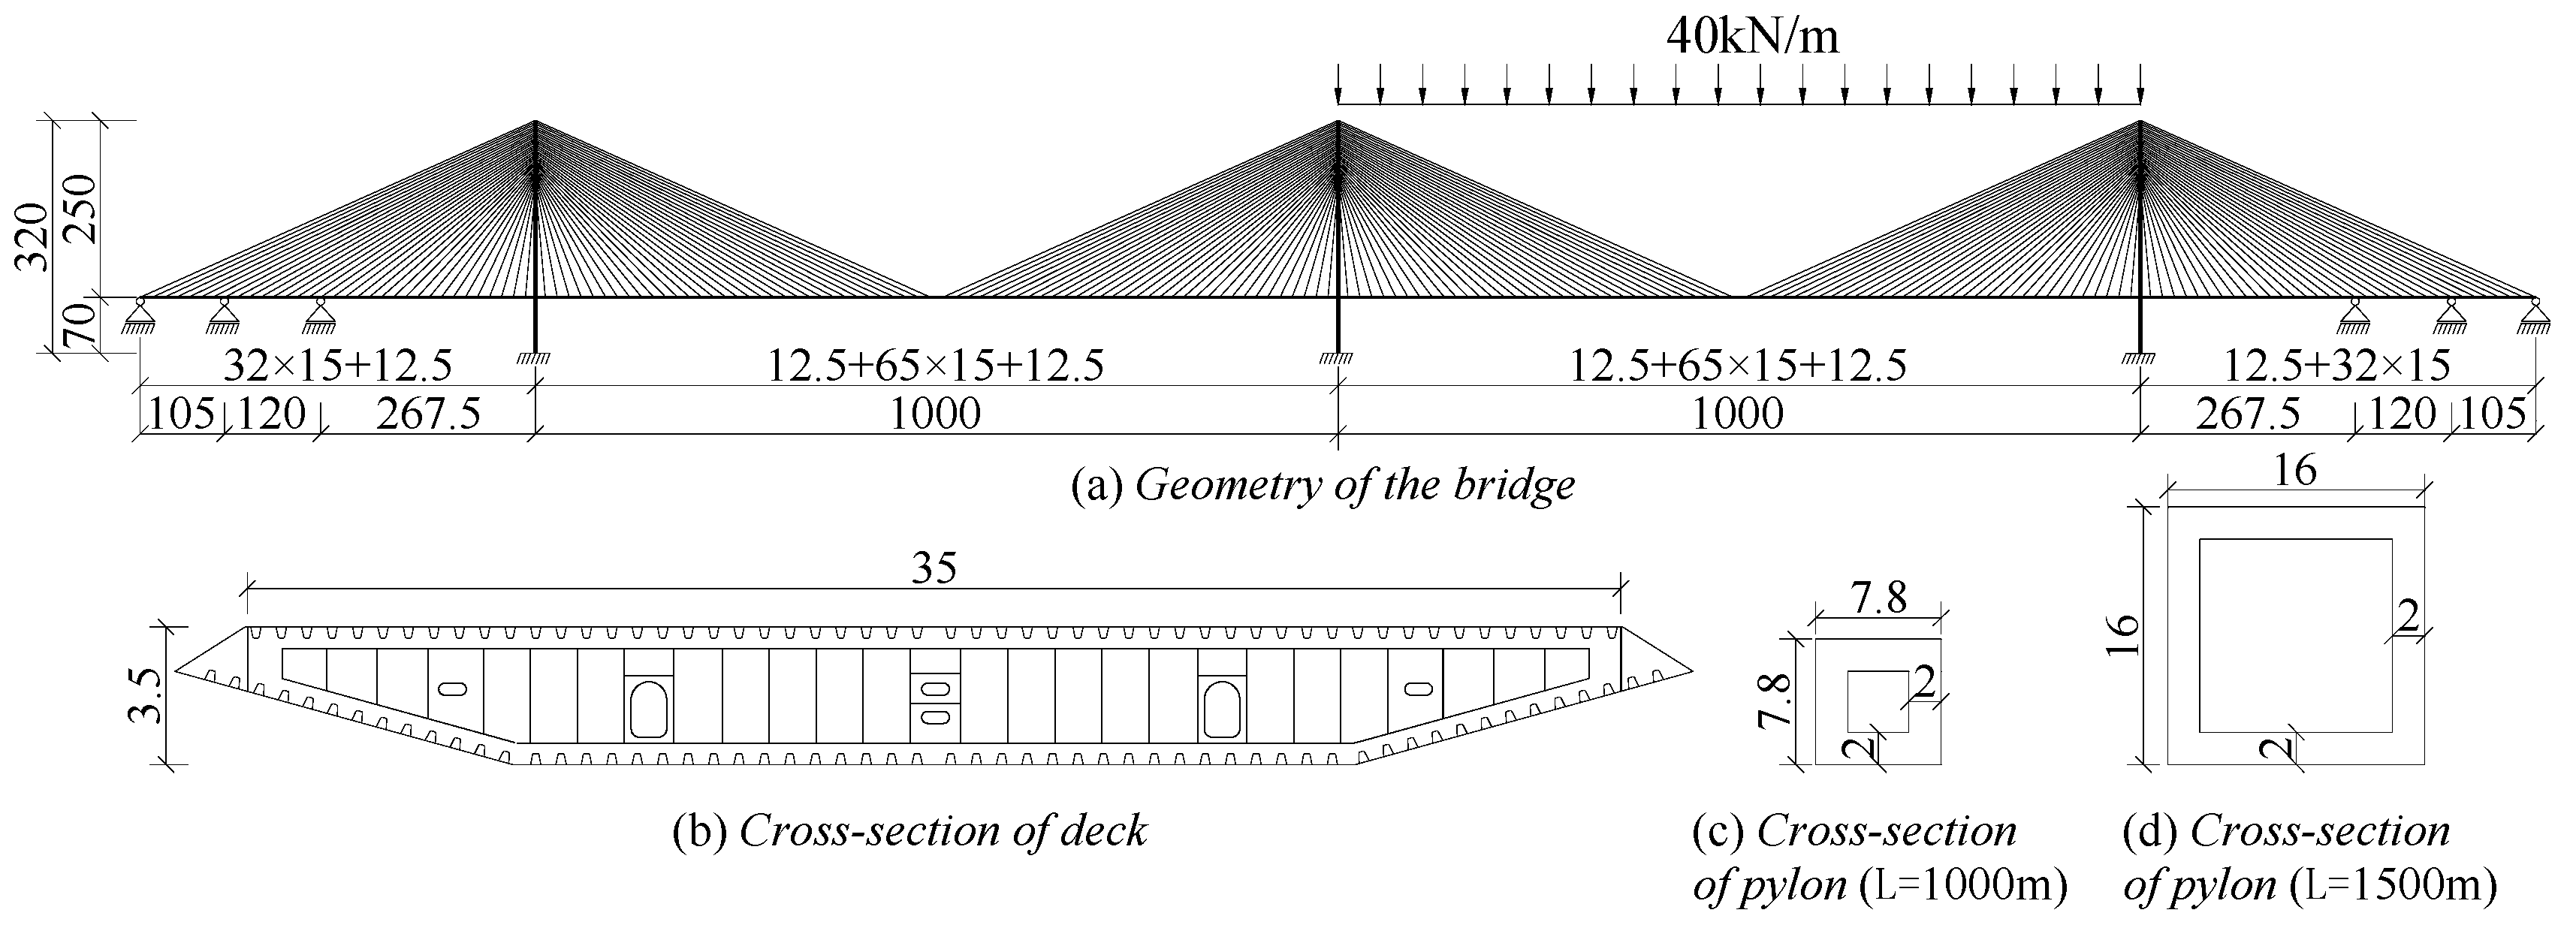
3.1. Structural Parameters of the Three-Tower Cable-Stayed Bridge

In the two three-tower cable-stayed bridges with main spans of 1000 m and 1500 m, the height of the tower above the deck is 250 m and 375 m, respectively, and the height below the deck is 70 m. Figure 8a shows the elevation layout of a three-tower cable-stayed bridge with a main span of 1000 m. The cable-stayed bridge adopts a floating + mid-tower longitudinal restraint cable system, with longitudinal restraint cables set between the mid tower and the deck to limit the longitudinal displacement of the main beam under live load. The piers only provide vertical support, and the cables are arranged in a semi-fan shape. The anchorage spacing of the cables on the deck is 15 m, while that on the tower is 2.5 m. In two three-tower cable-stayed bridges, there are 33 pairs and 50 pairs of cables on one side of the tower, respectively. It is divided into three groups of cables from the tower to the mid span, with cross-sectional areas of 0.005 m2, 0.007 m2, and 0.008 m2, respectively. The value of the cable area is based on the stress level of the cable under dead load, ensuring that the safety factor of the cable under dead and live loads is not less than 2.5. The deck is made of a steel box girder, as shown in Figure 8b. The width of the deck is 35 m and the height is 3.5 m. The tower has a single-column shape. The section of the tower is adjusted to control the maximum vertical displacement of the deck at L/300 when a uniform load of 40 kN/m is applied on one main span. The tower section forms of cable-stayed bridges with main spans of 1000 m and 1500 m are shown in Figure 8c,d. The cross-sectional characteristics of towers, deck, and cables are shown in Table 1.

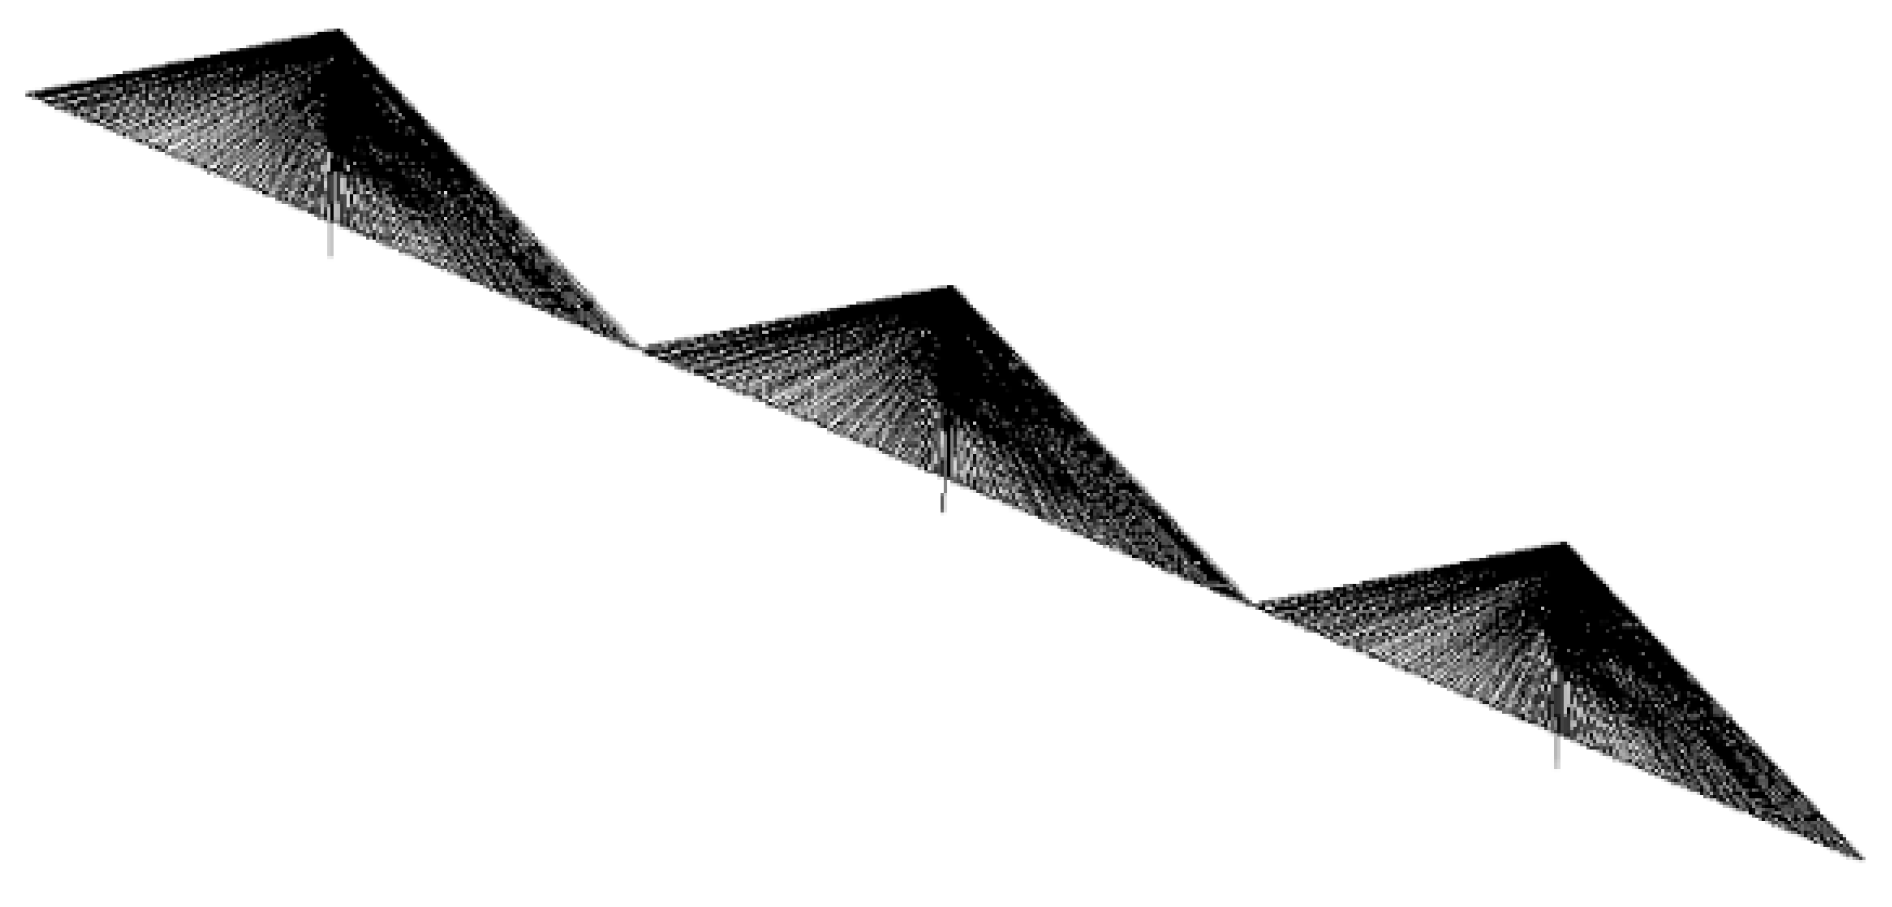
3.2. Finite Element Model

A finite element model was established using ANSYS (2021R1) software [31]. This study mainly explores the overall mechanical properties of the structure, without considering the local effects of the structure. Therefore, the use of bar-element simulation can meet the calculation accuracy requirements, and related studies have also adopted this simulation method [32,33]. The deck was modeled using Beam4 element, the bridge tower was modeled using Beam188 element, and the stay cables and longitudinal restraint cables were simulated using Link10 element. The finite element model is shown in Figure 9. The cable is connected to the deck and tower through a rigid arm. Vertical constraints are applied at the beam ends and auxiliary piers. The displacement and rotation of the bottom of the tower are constrained, and the mid tower and deck are connected by longitudinal restraint cables. The equivalent elastic modulus is used to consider the sag effect of the cable. The Newton–Raphson method [34] is used to consider the large deflection effect for geometric nonlinear analysis. The cable forces under dead load are determined using the zero reaction force method. First, vertical supports are installed at the anchorage points of the main girder. The initial cable forces are calculated based on the support reactions, and then iteratively adjusted until the support reactions approach zero.
The crossing cable is set in an asymmetric arrangement, as shown in Figure 10. The crossing cable extends from the mid tower and intersects with the cable of the side tower as shown by the red line in the figure. The area of the crossing cable for both the side tower and the mid tower is 0.008 m2, and the stress of the crossing cable under the dead load is 600 MPa.

3.3. Structural Response of Three-Tower Cable-Stayed Bridge Under Live Load

When one of the main spans is loaded and the adjacent main spans are not loaded, the vertical displacement of the deck is the largest, and the force on the mid tower is the most unfavorable. The loading method shown in Figure 8a is used to study the restraining effect of the crossing cable. Table 2 lists the structural responses of two three-tower cable-stayed bridges under a uniform load of 40 kN/m.

4. Analysis of Influencing Factors of Crossing Cable

According to the finite element model calculation, the following four aspects are studied. The loading method is to apply a 40 kN/m uniform load on one of the main spans.
(1)
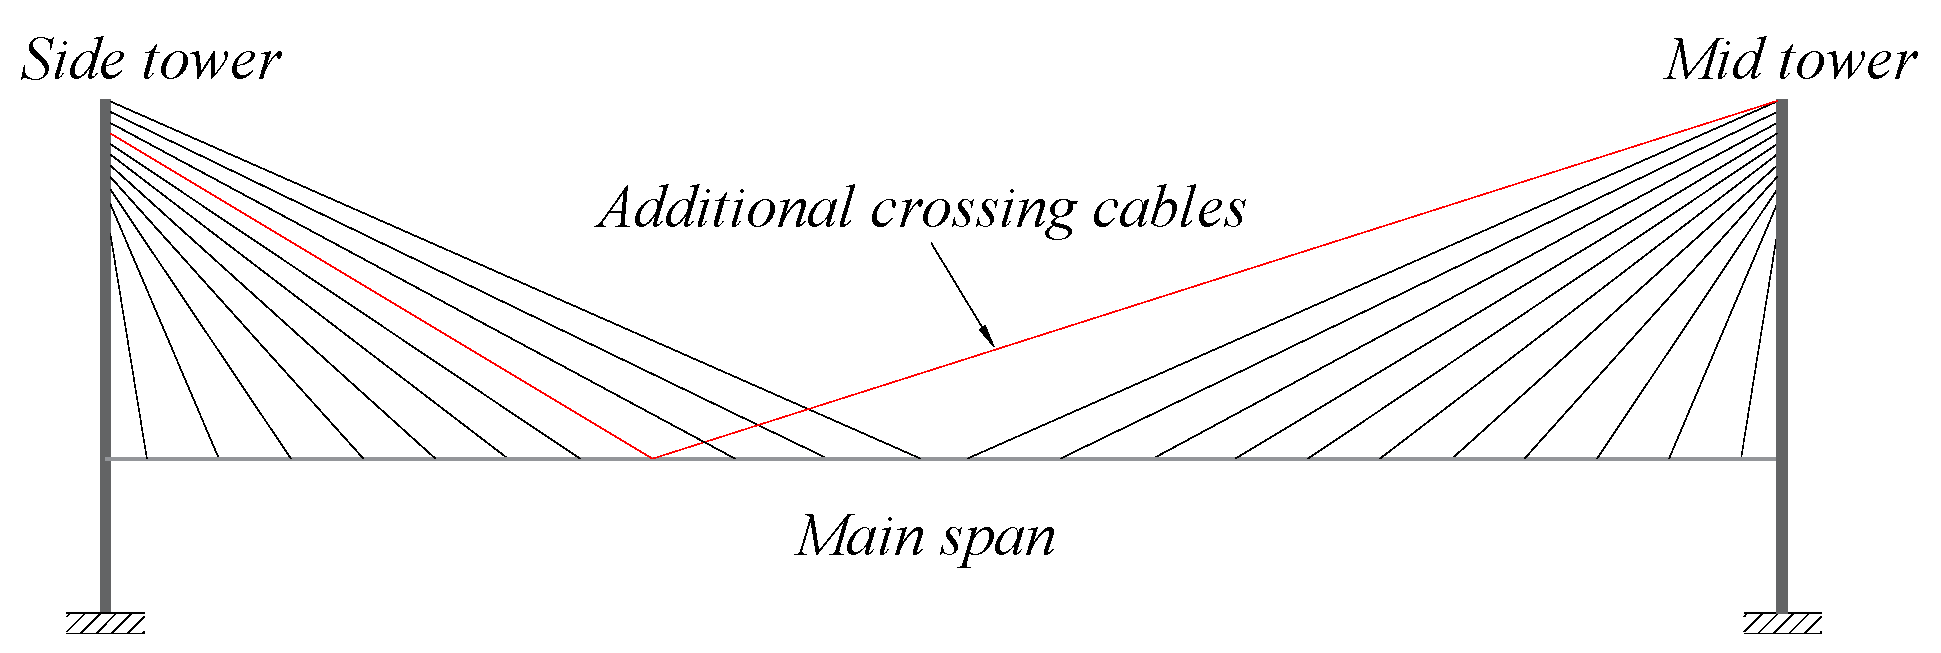
A pair of crossing cables are added to the three-tower cable-stayed bridge, and then the anchorage position of the crossing cable on the main beam is changed to verify the optimal anchorage position.
(2)
By changing the ratio of the crossing cable area between the mid tower and the side tower, the influence of the crossing cable area ratio on the constraint stiffness is analyzed.
(3)
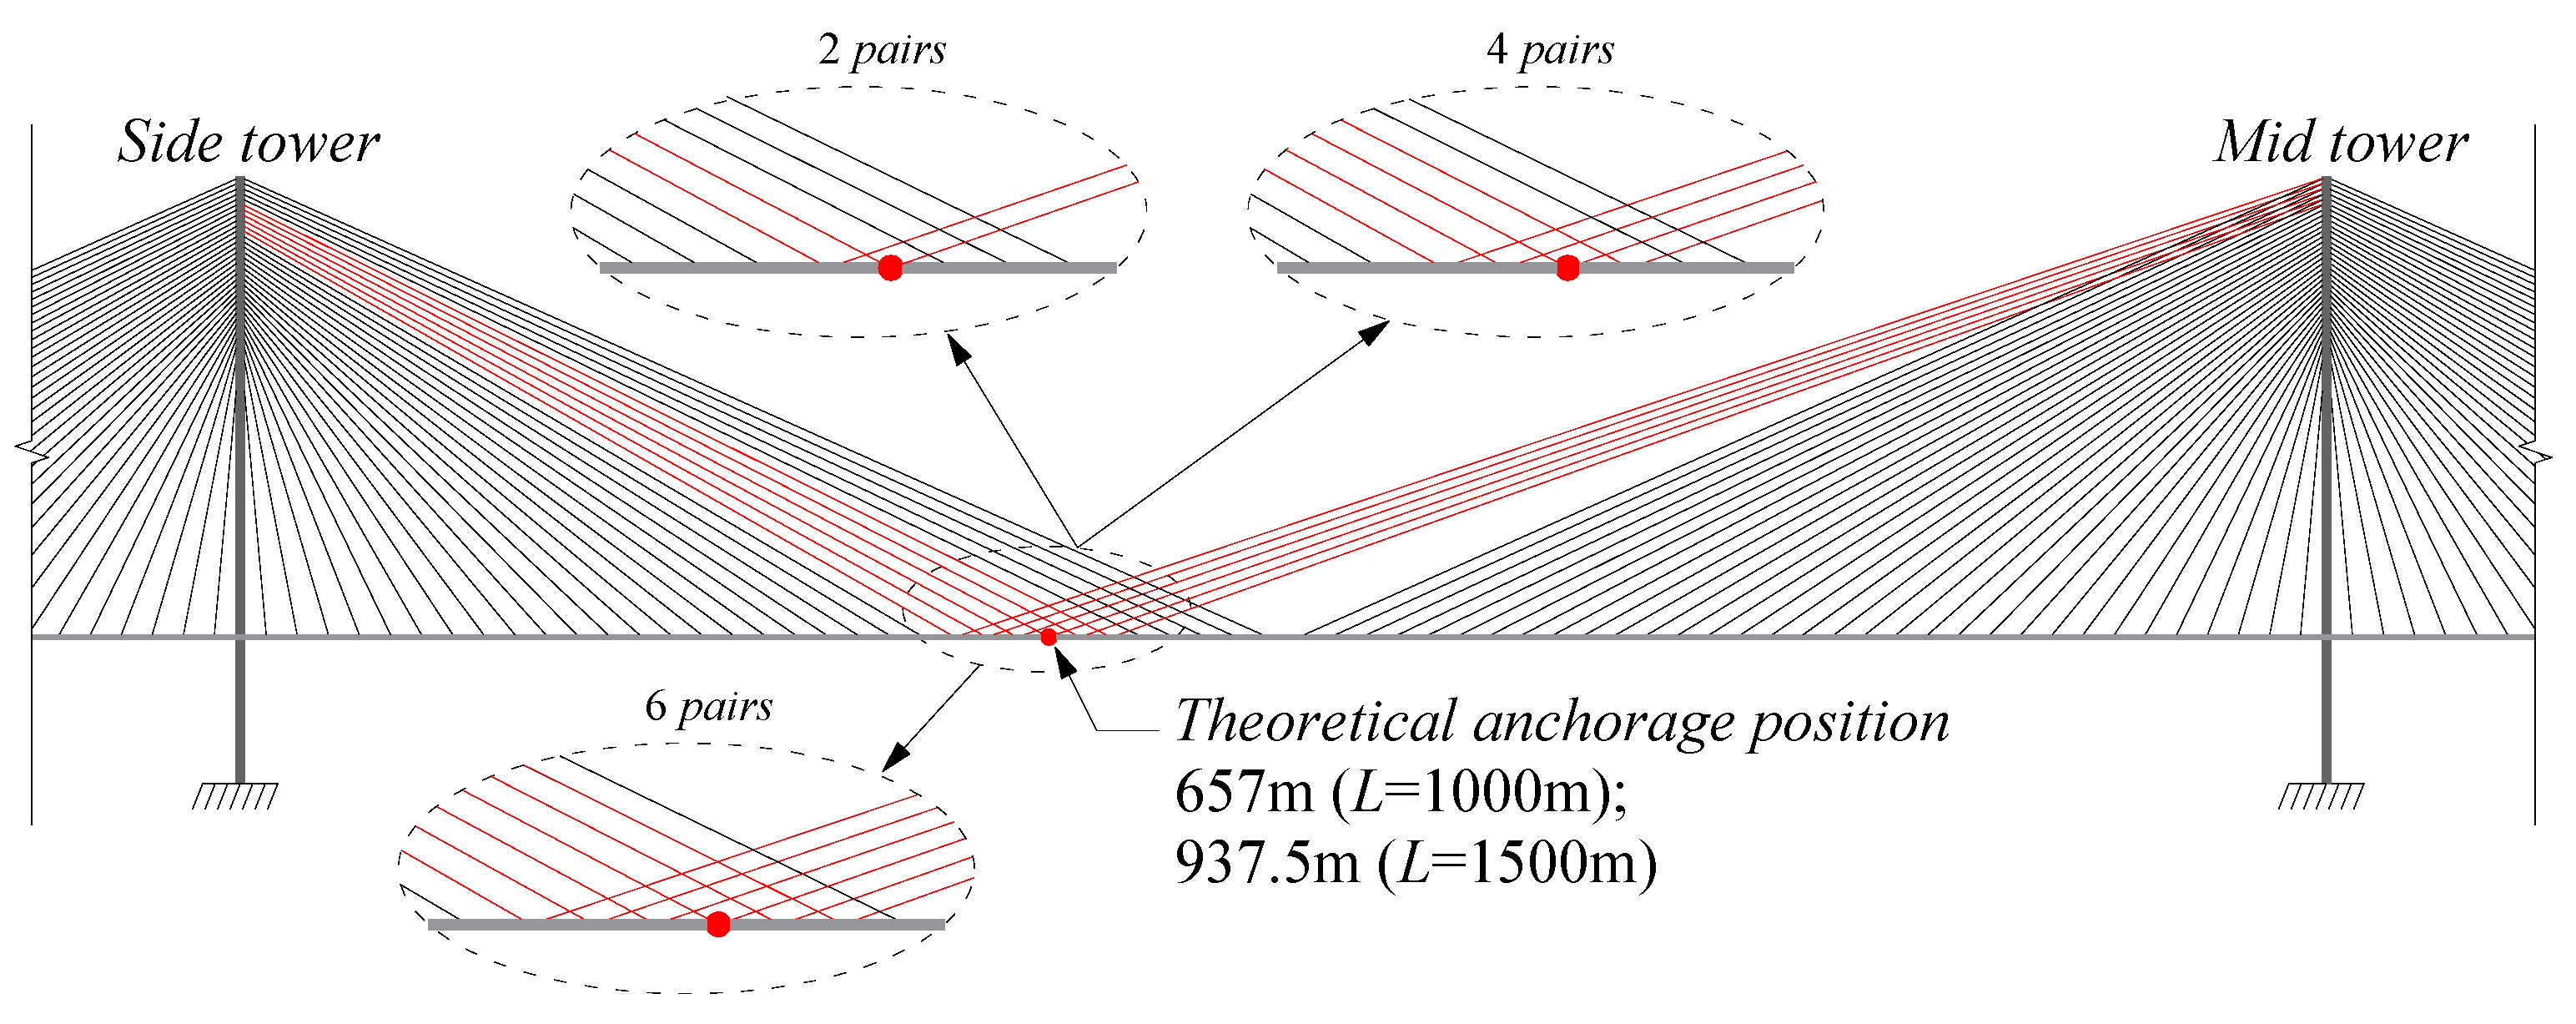
By changing the number of crossing cables, the improvement effect of setting crossing cables on the structural performance of long-span three-tower cable-stayed bridge is analyzed.
(4)
The height of the tower below the deck is changed, and the effect of setting crossing cables for cable-stayed bridges with different tower heights is analyzed.

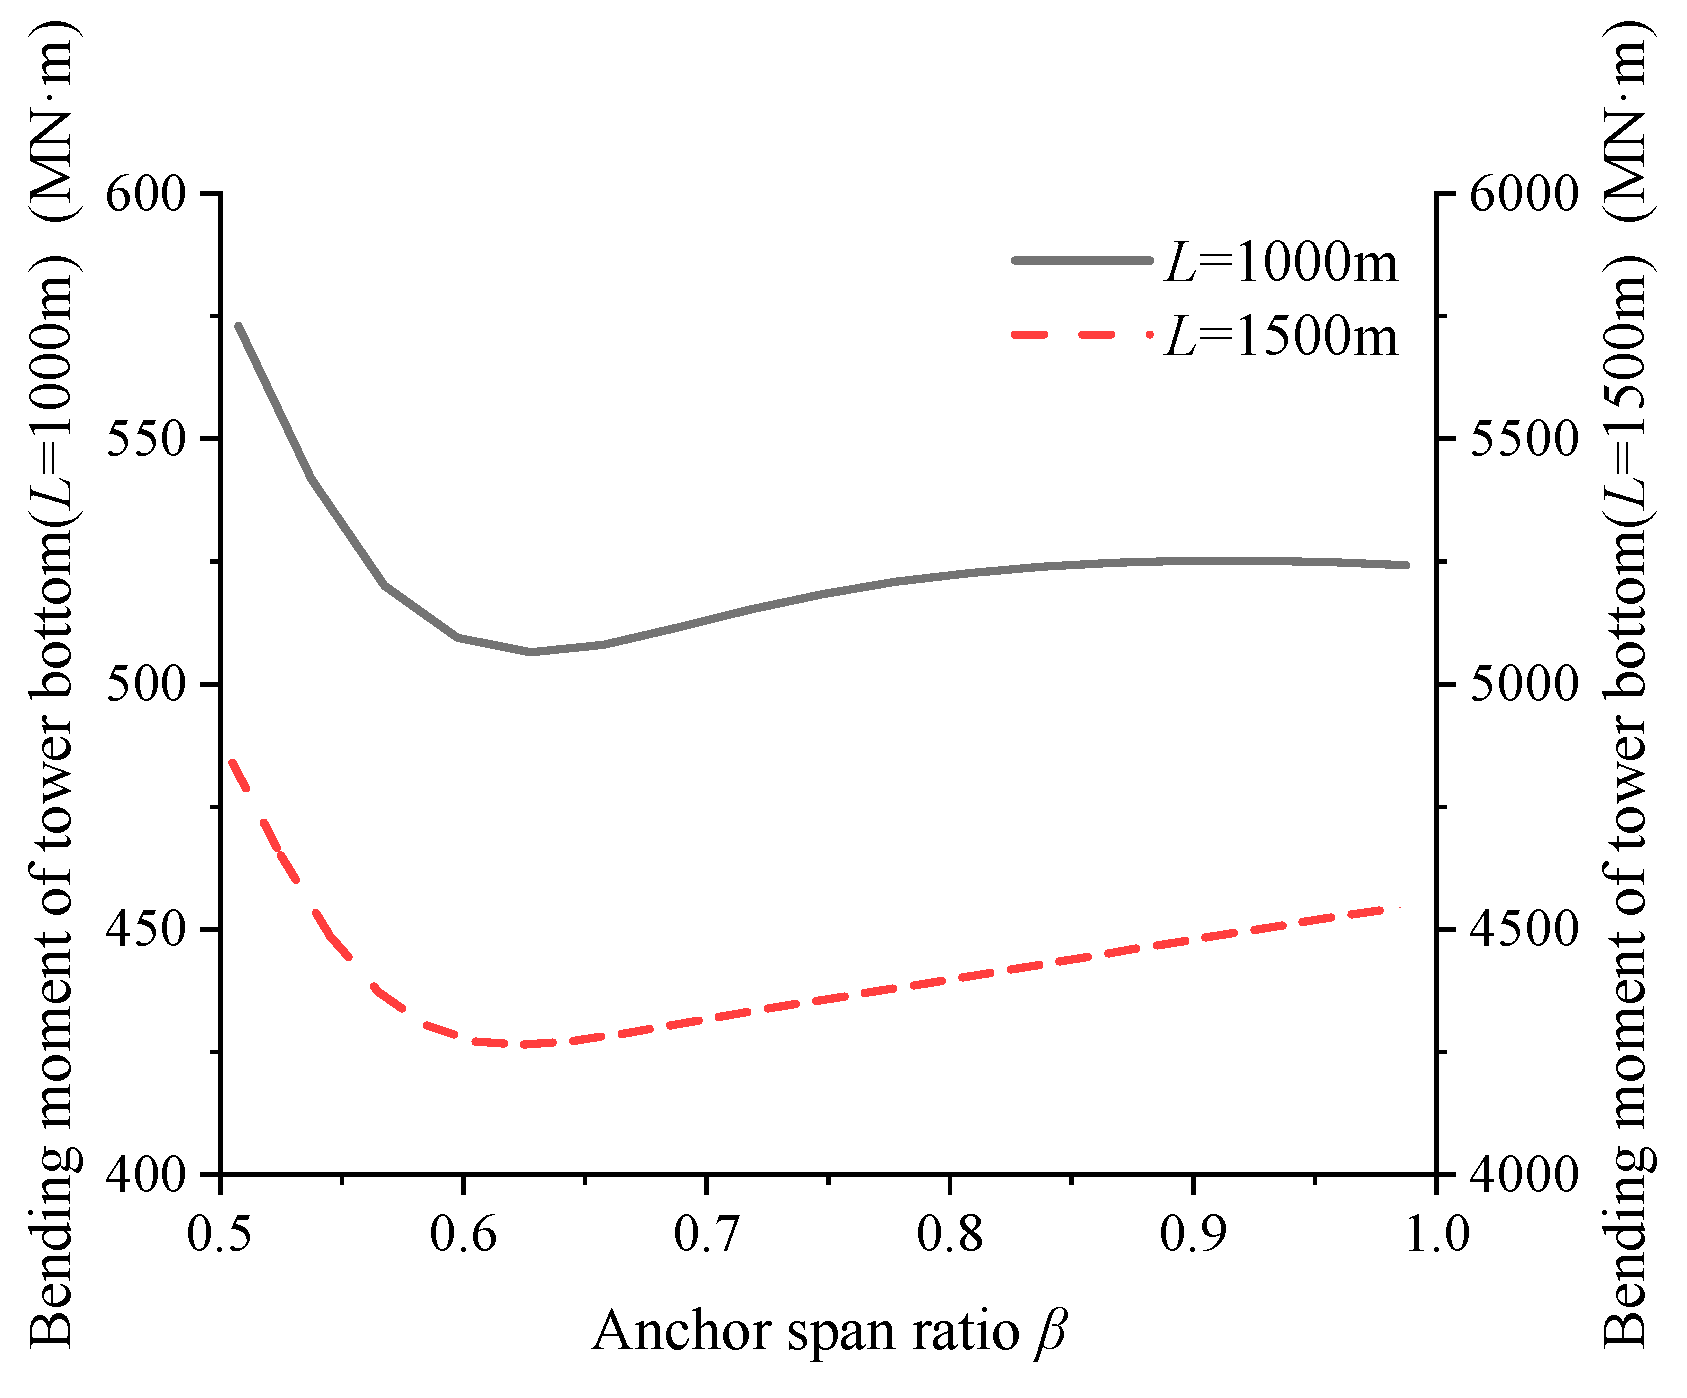
4.1. Anchor Span Ratio of Crossing Cable

A pair of crossing cables are added to the main span and set at different positions to calculate the displacement of the deck under the uniform load of 40 kN/m. The loading method of uniform load is shown in Figure 8. Figure 11 shows the maximum vertical deflection of the deck when the crossing cables are set at different positions.
It can be seen from Figure 11 that when the main span length is 1000 m and 1500 m, the vertical deflection of the deck is the smallest when the anchor span ratio is 0.657 and 0.625. The maximum anchor span ratios of the crossing cable constraint stiffness given by the formula are 0.673 and 0.633, respectively. The relative errors between the theoretical value and the model value are 2.44% and 1.28%, respectively. One of the reasons for the error is that the influence of the bending stiffness of the deck is ignored in the formula, and assuming that the displacement of the side tower top is 0 also leads to some errors. The formula has high accuracy and can be used to determine the optimal anchorage position of the crossing cable in the long-span cable-stayed bridge.
Figure 12 shows the bending moment of the mid-tower bottom under single-span loading when the crossing cable is anchored at different positions. It is noted that after adding a pair of crossing cables to the three-tower cable-stayed bridge with a main span of 1000 m, the anchor span ratio with the lowest bending moment at the tower bottom is 0.627. For the three-tower cable-stayed bridge with a main span of 1500 m, the vertical deflection of the deck and the bending moment at the tower bottom reach the minimum when the anchor span ratio is 0.625.

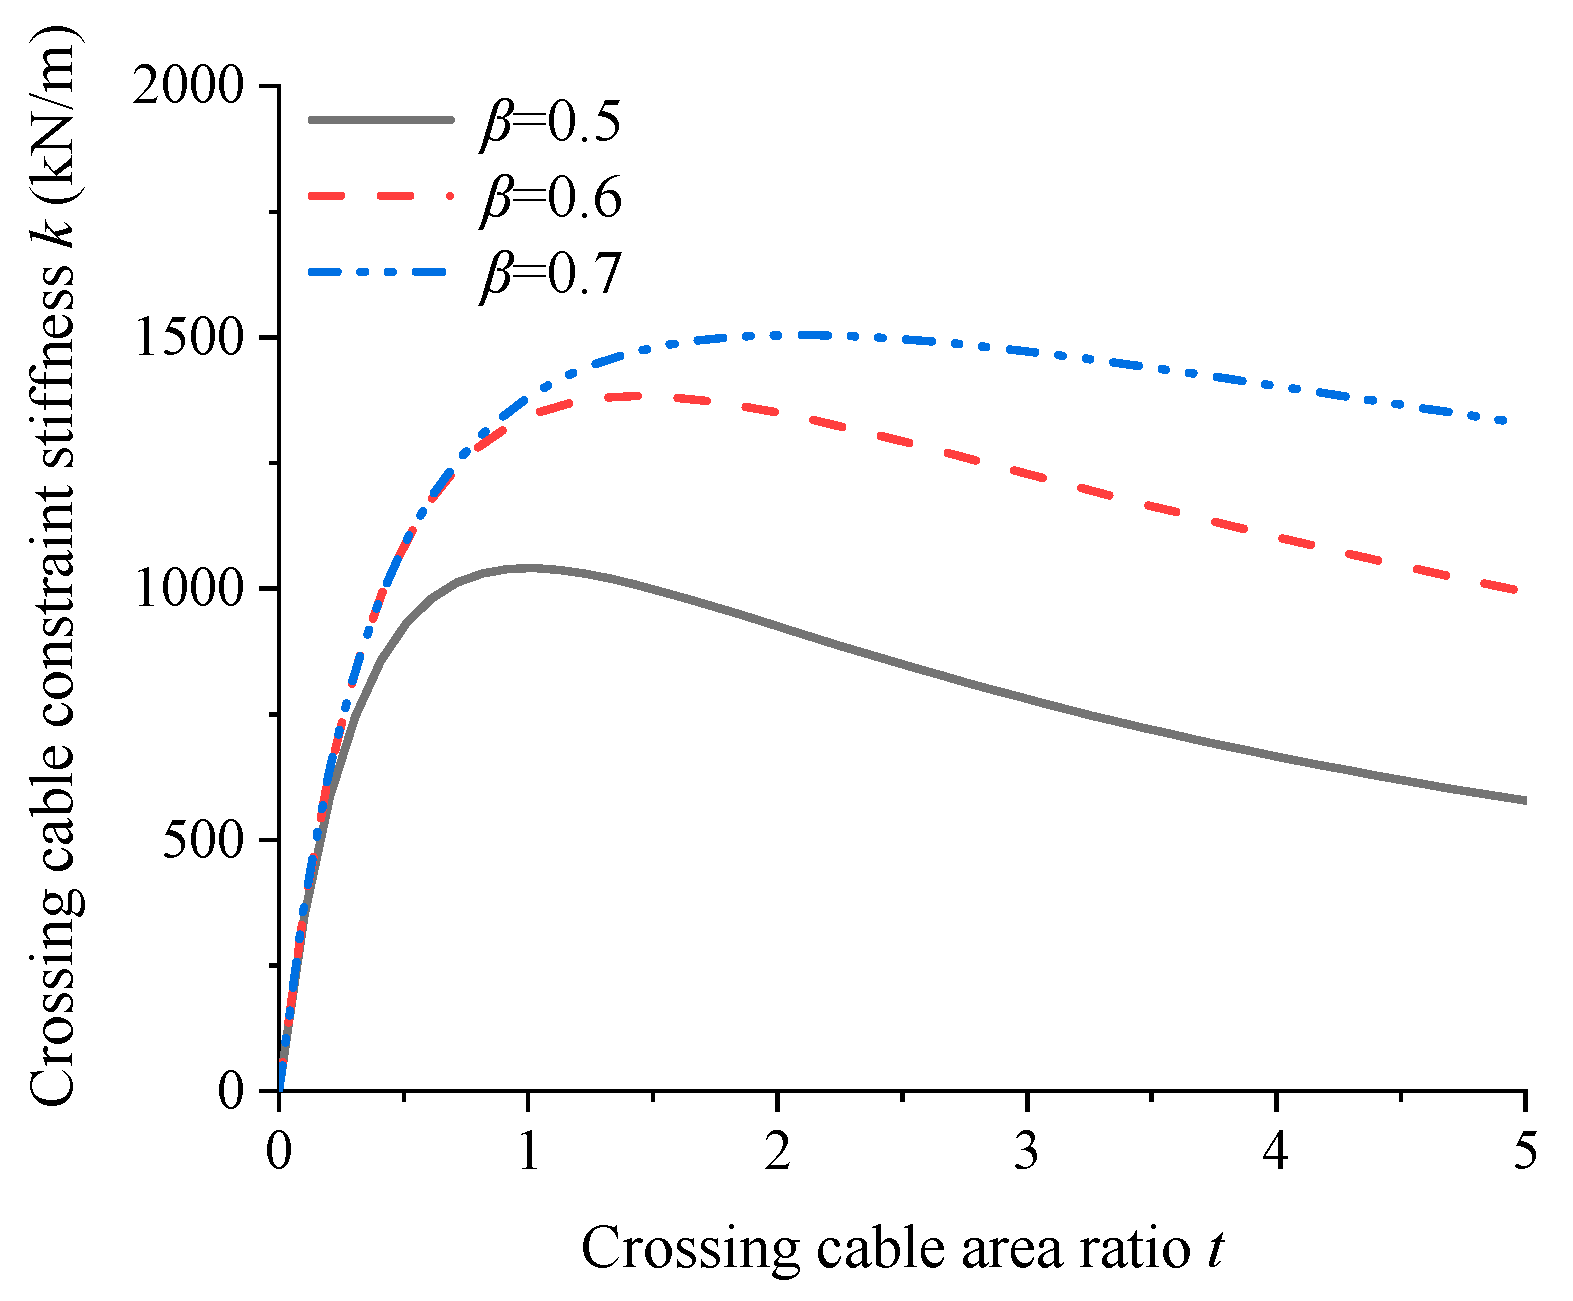
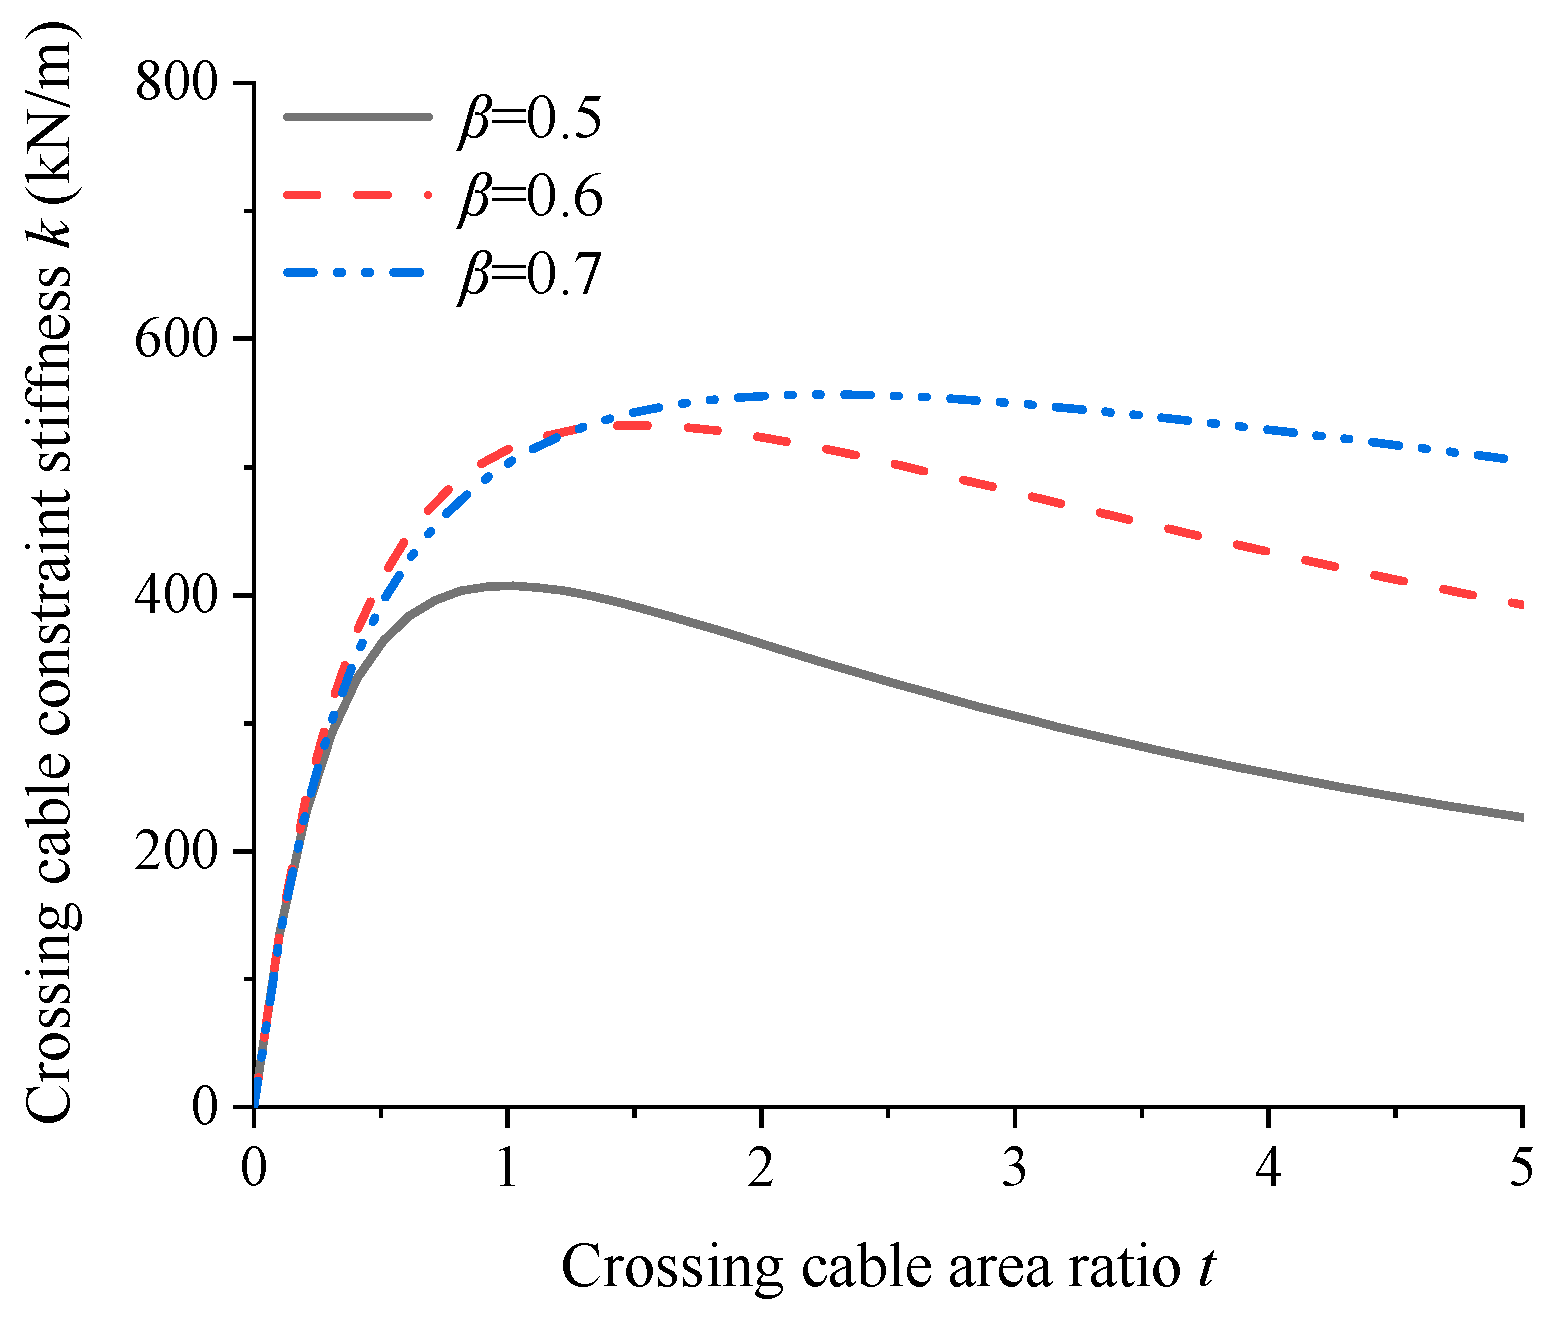
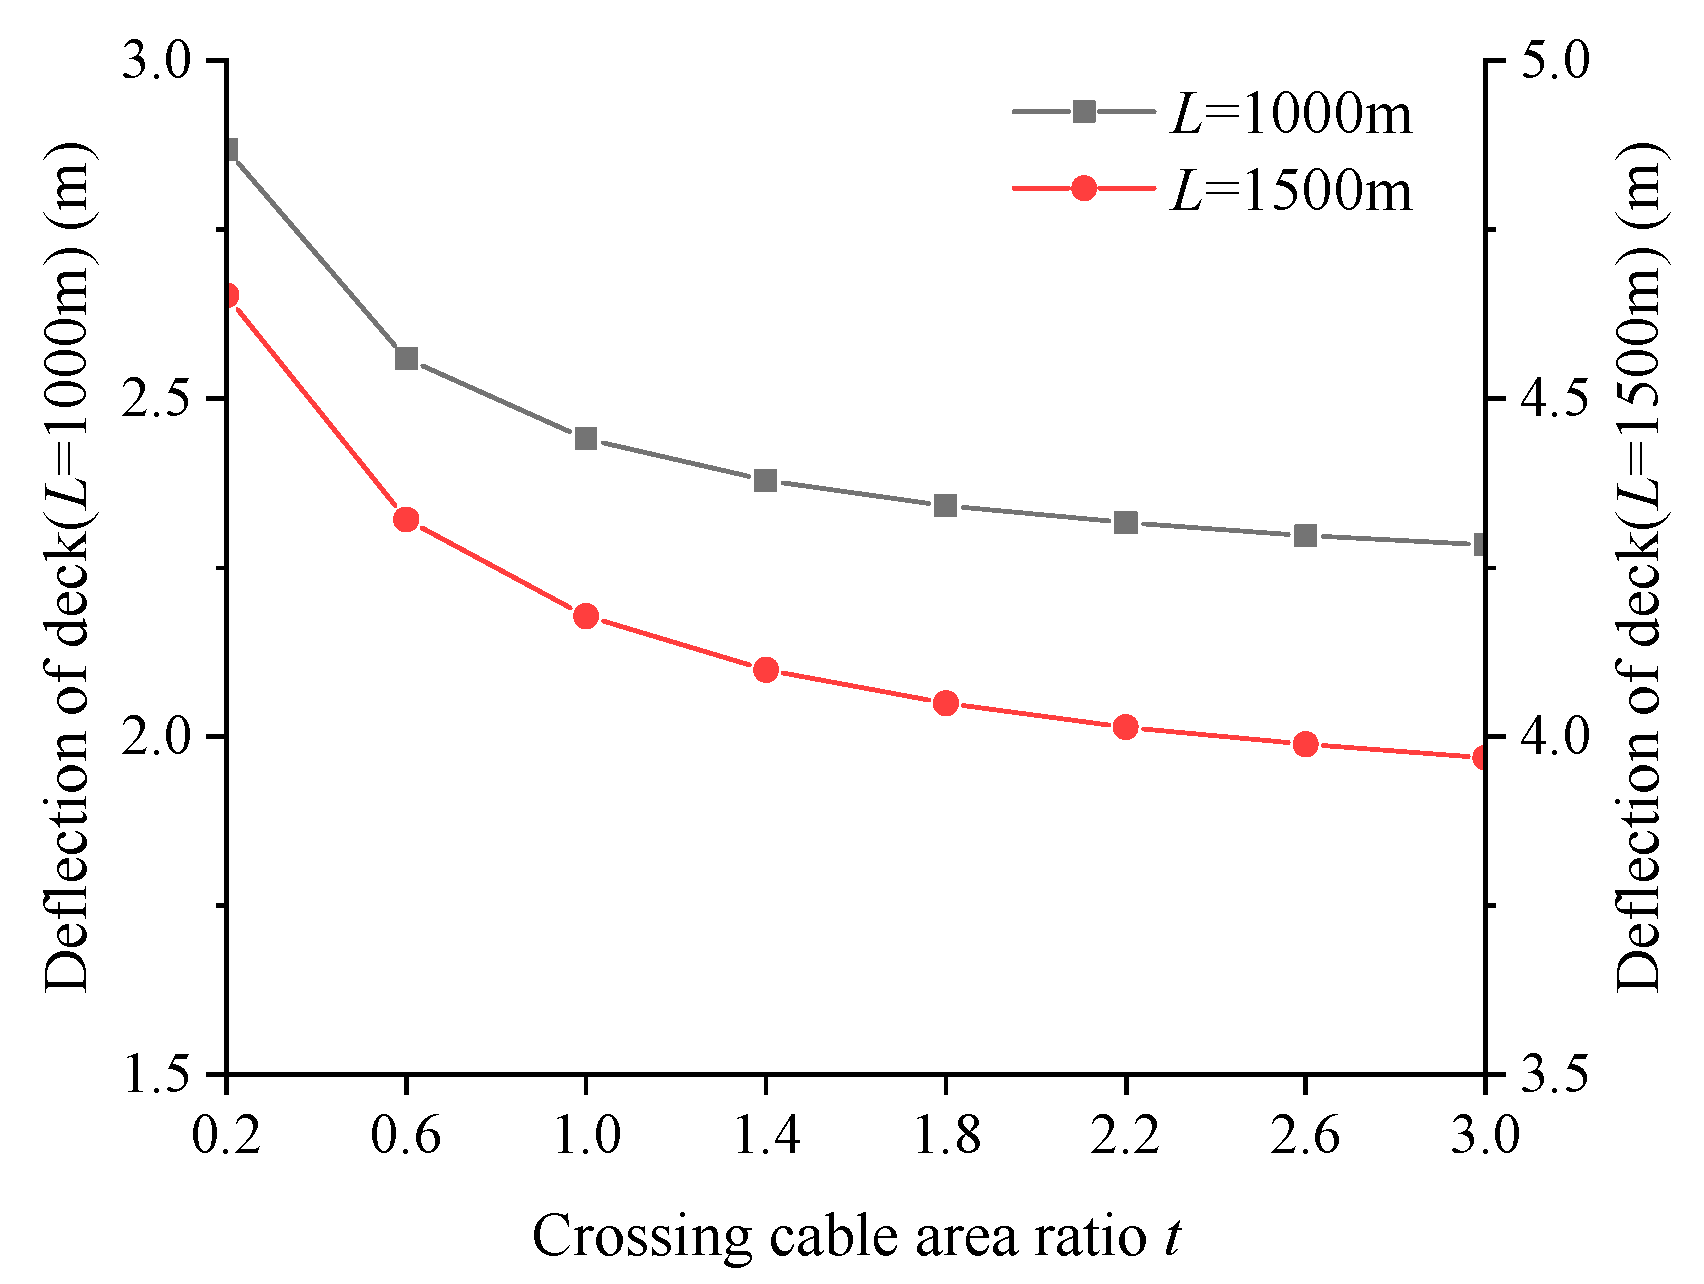
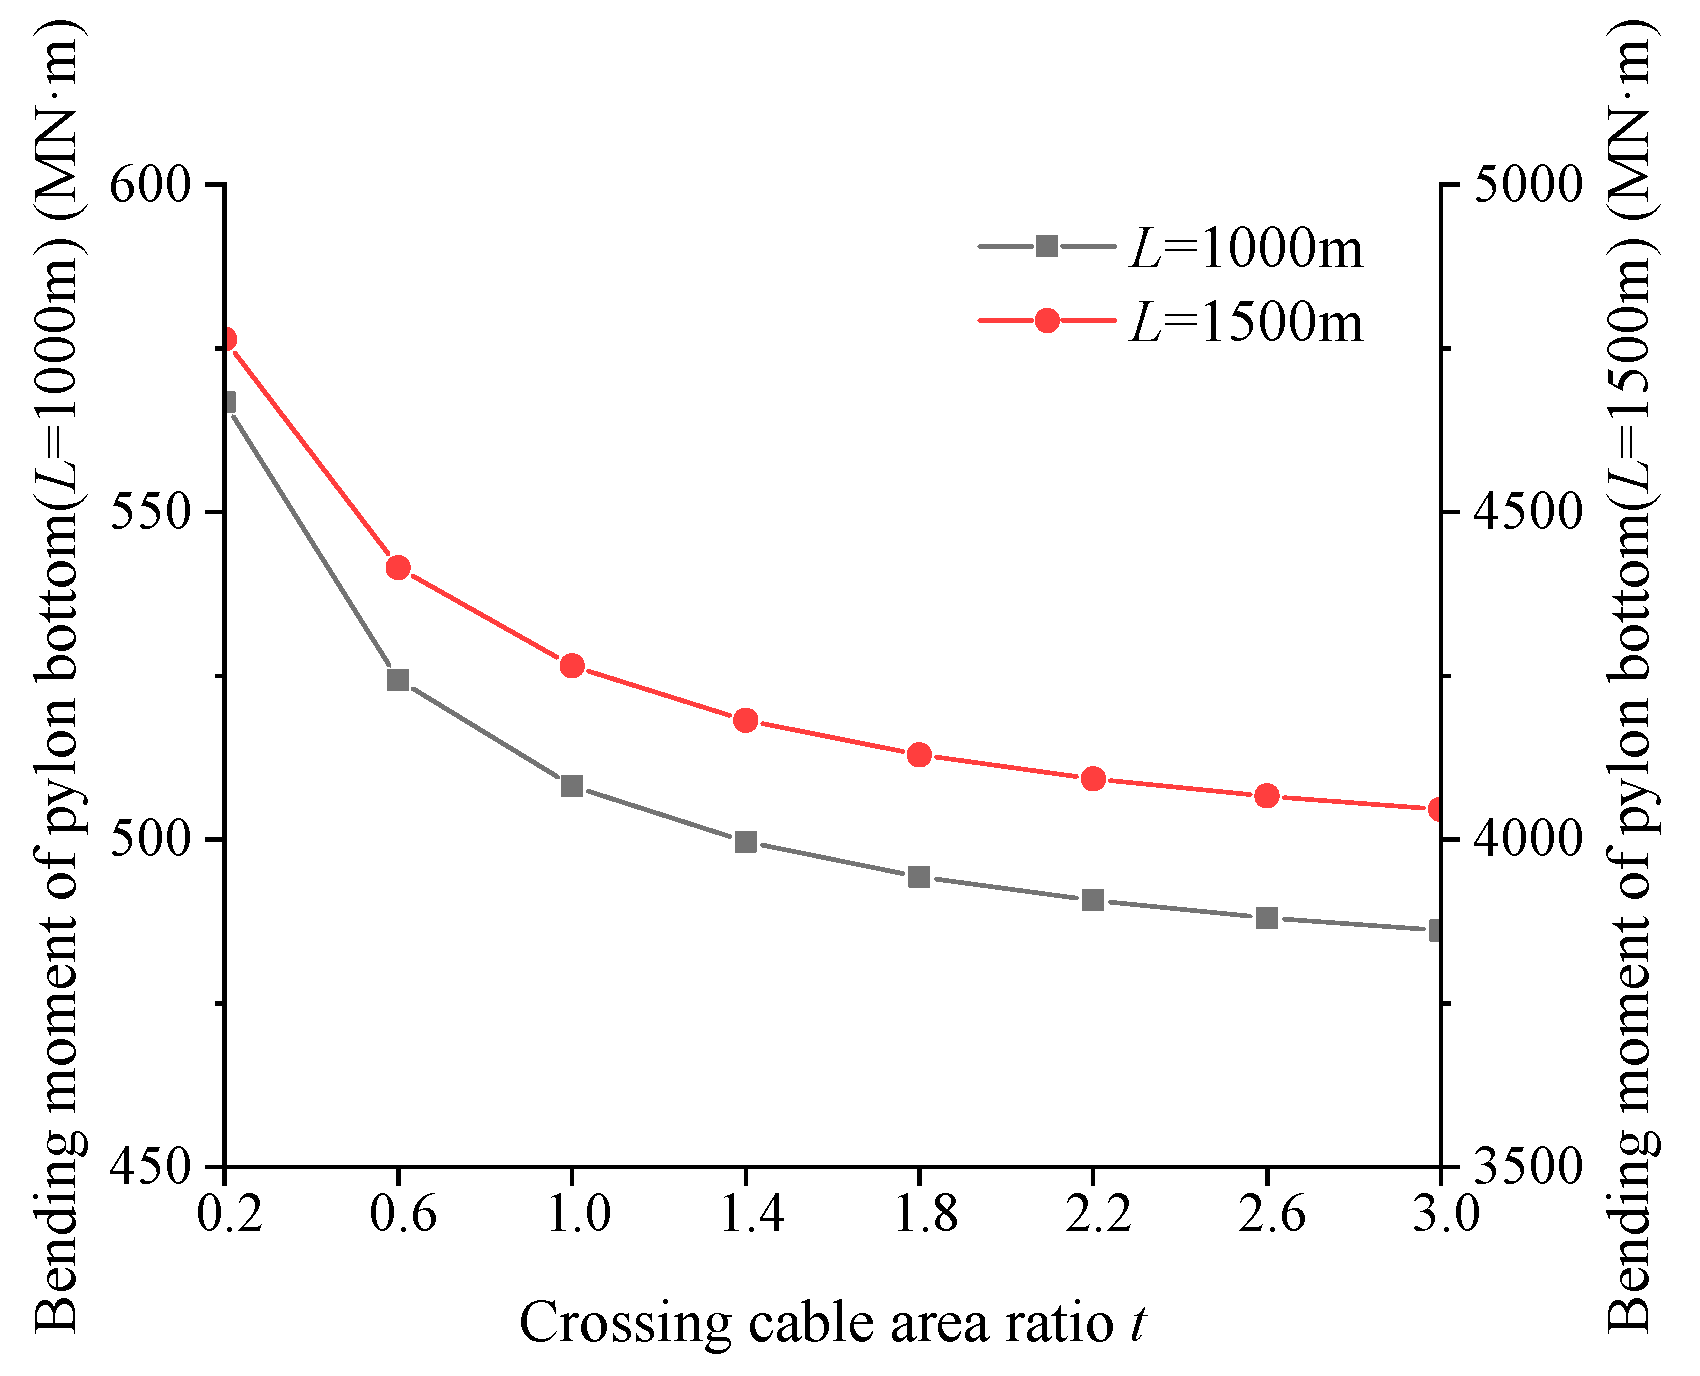
4.2. Ratio of Crossing Cable Area Between Mid Tower and Side Tower

In Section 4.1, the anchor span ratio was obtained for the minimum vertical deflection of the deck when the area of crossing cables is equal. On this basis, the steel volume used for a pair of crossing cables is kept unchanged, and then the ratio of the crossing cable area between the mid tower and the side tower is adjusted, and the relationship between the ratio of the crossing cable area and its restraining effect is analyzed. The steel volume of a pair of crossing cables in cable-stayed bridges with main spans of 1000 m and 1500 m is 8.90 m3 and 13.56 m3, respectively. When the crossing cable area ratio of the mid tower and the side tower changes from 0.2 to 3, the crossing cable area of the mid tower changes from 0.0032 m2 and 0.0031 m2 to 0.0106 m2 and 0.0109 m2, respectively, and the crossing cable area of the side tower changes from 0.0162 m2 and 0.0155 m2 to 0.0035 m2 and 0.0036 m2, respectively.
Figure 13 shows the maximum vertical deflection of the deck corresponding to different crossing cable area ratios under a 40 kN/m uniform load. It is noted that the maximum vertical deflection of the deck gradually decreases with the increase in the crossing cable area ratio. The finite element results are different from the change trend obtained in Figure 6 and Figure 7. This is because after increasing the crossing cable area ratio between the mid tower and the side tower, the axial stiffness of the crossing cable of the mid tower increases, and the axial stiffness of the side tower crossing cable decreases. However, the ordinary cable adjacent to the side tower crossing cable can make up for the reduction in the stiffness of the side tower crossing cable. Therefore, when the steel volume of the crossing cable is constant, the crossing cable of the mid tower adopts a larger cross-sectional area to help improve the restraining effect of the crossing cable.
When different crossing cable area ratios are used, the bending moment at the mid-tower bottom is shown in Figure 14. It is noted that the bending moment of the mid-tower bottom decreases with the increase in the crossing cable area ratio. It can be seen that increasing the cross-sectional area of the crossing cable of the mid tower can improve the structural stiffness and reduce the bending moment of the mid-tower bottom.

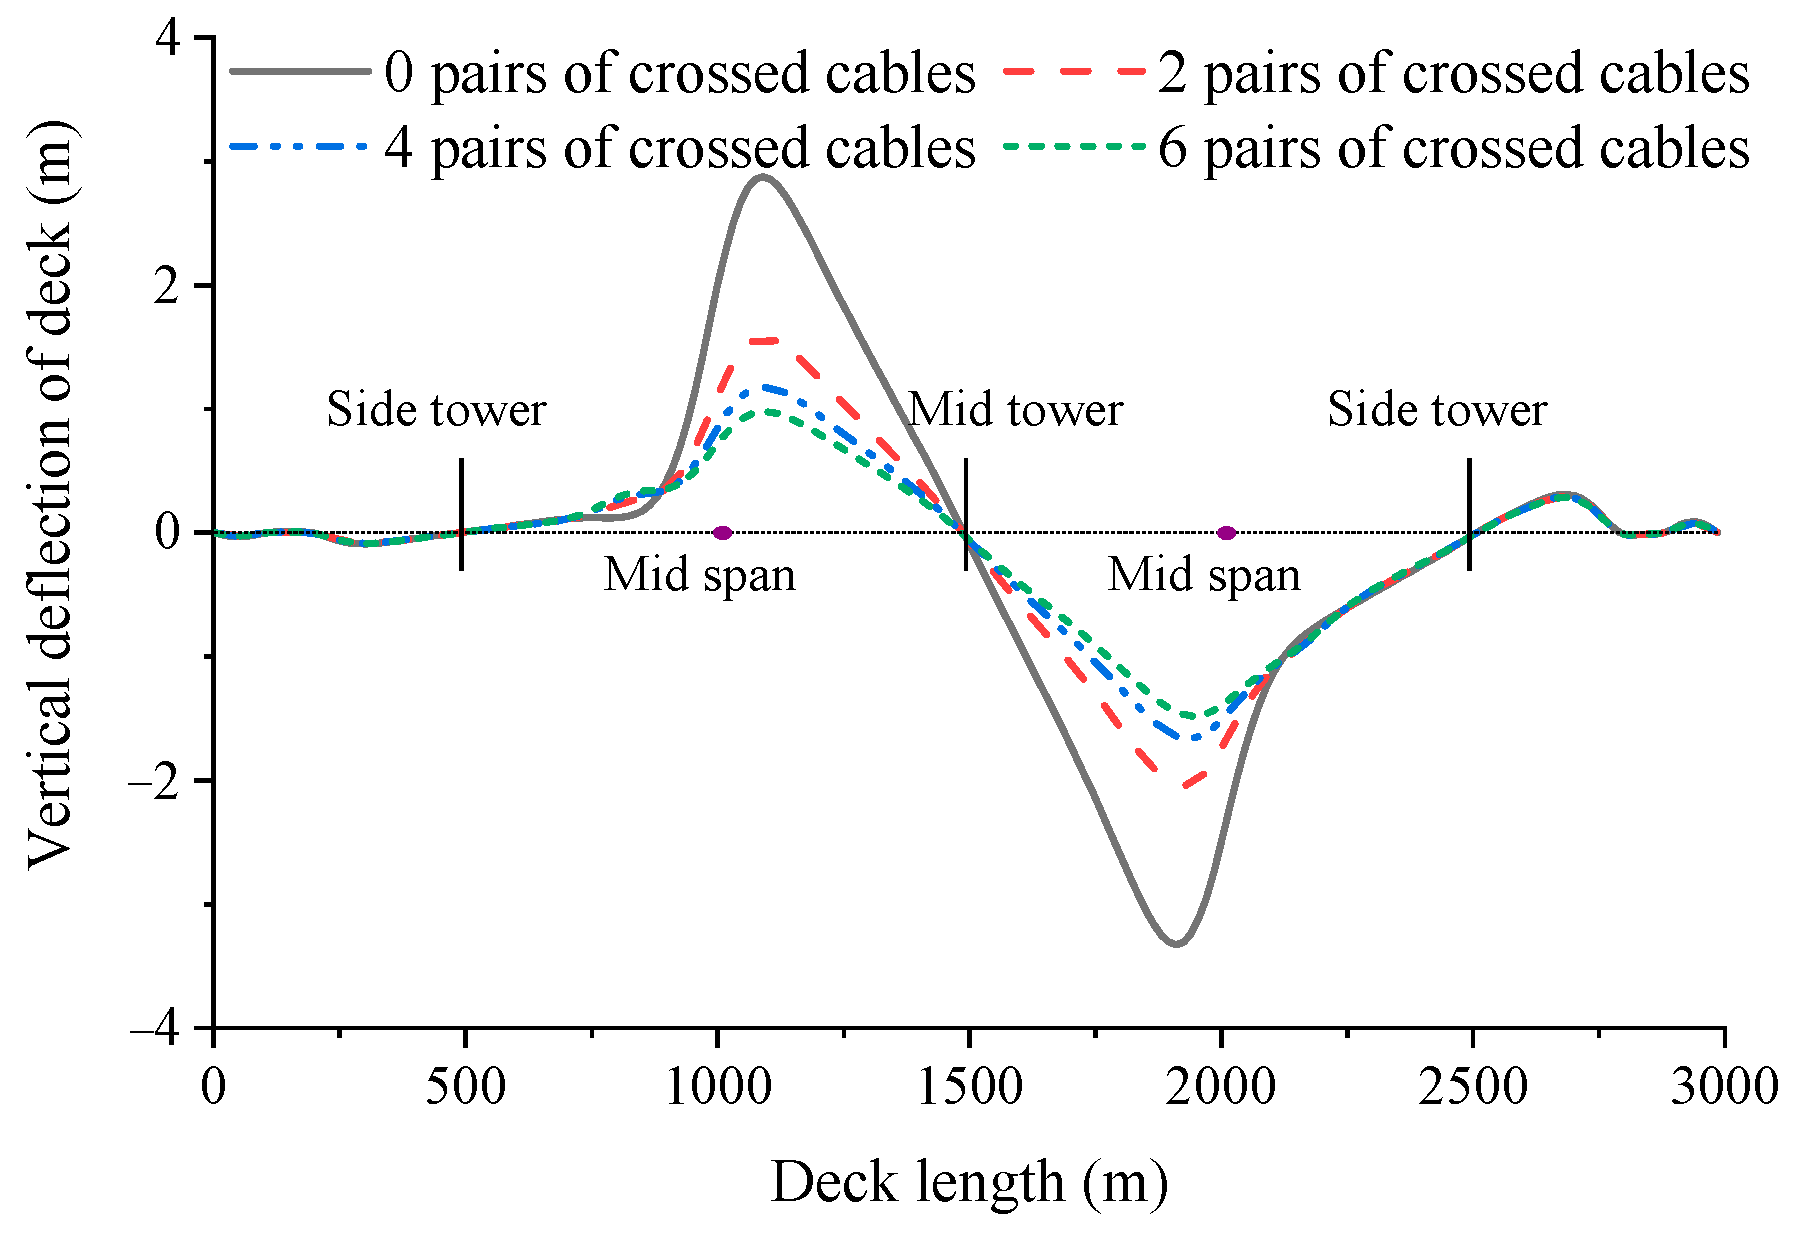
4.3. Number of Crossing Cables

On the basis of two three-tower cable-stayed bridges, two pairs, four pairs, and six pairs of crossing cables are added, respectively, and the crossing cables are set near the position with the largest constraint stiffness. The anchorage positions of different numbers of crossing cables are set as shown in Figure 15. The red dots in the figure are the theoretical anchorage positions with the largest constraint stiffness of the crossing cables.
For three-tower cable-stayed bridges with main spans of 1000 m and 1500 m under a uniformly distributed load, the vertical deflection of the deck is shown in Figure 16 and Figure 17. When no crossing cables are installed in the main span, the maximum downward deflection of the deck for the two bridges is 3.33 m and 5.05 m, respectively. After adding two, four, and six pairs of crossing cables, the maximum downward deflection of the deck for the 1000 m main span bridge reduces to 2.04 m, 1.66 m, and 1.48 m, respectively, while that for the 1500 m main span bridge decreases to 3.67 m, 3.13 m, and 2.83 m, respectively. Compared to the case without crossing cables, the vertical deflection of the deck is reduced by 55.55% and 43.96% after installing six pairs of crossing cables. In kilometer-scale three-tower cable-stayed bridges, the installation of crossing cables significantly reduces deck deflection. However, as the main span length increases, the effectiveness of crossing cables in enhancing the vertical stiffness of the deck slightly diminishes.
Figure 18 and Figure 19 give the bending moment distribution in the mid tower of two three-tower cable-stayed bridges after adding two, four, and six pairs of crossing cables. It is observed that significant bending moments occur in the anchorage zone of the mid tower for the bridge with a 1000 m main span. This is because the crossing cables are densely concentrated near the tower top, imposing strong longitudinal constraints that result in an “S”-shaped deformation of the tower. The bending moments at the tower base for the two bridges are 629.46 MN·m and 5190.73 MN·m, respectively. After installing two, four, and six pairs of crossing cables, the bending moment at the mid-tower bottom of the 1000 m main span bridge decreases by 28.41%, 38.28%, and 44.16%, respectively, while that of the 1500 m main span bridge decreases by 28.16%, 39.85%, and 46.47%, respectively. The addition of crossing cables in the main span significantly reduces the bending moment at the mid-tower bottom. For both span lengths, the reduction magnitudes of the tower base bending moment induced by crossing cables are comparable.

4.4. Tower Height

In order to study the influence of the tower height on the restraining effect of the crossing cables, the tower height below the deck is adjusted on the basis of the three-tower cable-stayed bridge, and six pairs of crossing cables are set up in the main span. The maximum vertical deflection of the deck and the bending moment of the mid tower bottom under a uniform load with and without crossing cables are calculated, respectively. In the original model, the height of the tower below the deck is 70 m, and the height of the tower below the deck is adjusted to 120 m and 170 m. Table 3 shows the maximum vertical deflection of the deck under different tower heights. It is noted that increasing the tower height can still effectively improve the vertical stiffness of the deck by setting crossing cables. Therefore, in a multi-tower cable-stayed bridge across deep valleys, crossing cables are still an effective measure to improve the structural stiffness.
Table 4 shows the bending moment of the mid-tower bottom under different tower heights. When the span of the main span is 1000 m, the reduction degree of the bending moment at the mid-tower bottom gradually decreases with the increase in the tower height. This is because when the tower height is increased without crossing cables, the ability of the tower to resist bending decreases, and the restraint effect of longitudinal restraint cables on the tower increases, which significantly reduces the bending moment of the tower below the deck. When the main span is 1500 m, increasing the tower height will not reduce the improvement effect of the crossing cable on the stress at the mid-tower bottom.
In this paper, the anchorage position with the largest constraint stiffness of the crossing cable is given, and the influence of the crossing cable on the static performance of the long-span three-tower cable-stayed bridge is analyzed. However, in the theoretical derivation stage, the bending stiffness of the deck is not considered, and the applicability of the crossing cable stiffness formula in cable-stayed bridges with a high-stiffness deck such as steel truss girders needs to be further improved.

5. Conclusions

This study verifies the application effect of crossing cables in super-kilometer multi-tower cable-stayed bridges, and provides a reasonable structural scheme for long-span cable-stayed bridges. The main conclusions are as follows:
(1)
The analytical formula of the longitudinal constraint stiffness of crossing cables based on the equivalent elastic modulus has high accuracy and can be used to determine the anchorage position with the maximum constraint stiffness of the crossing cables in long-span three-tower cable-stayed bridges.
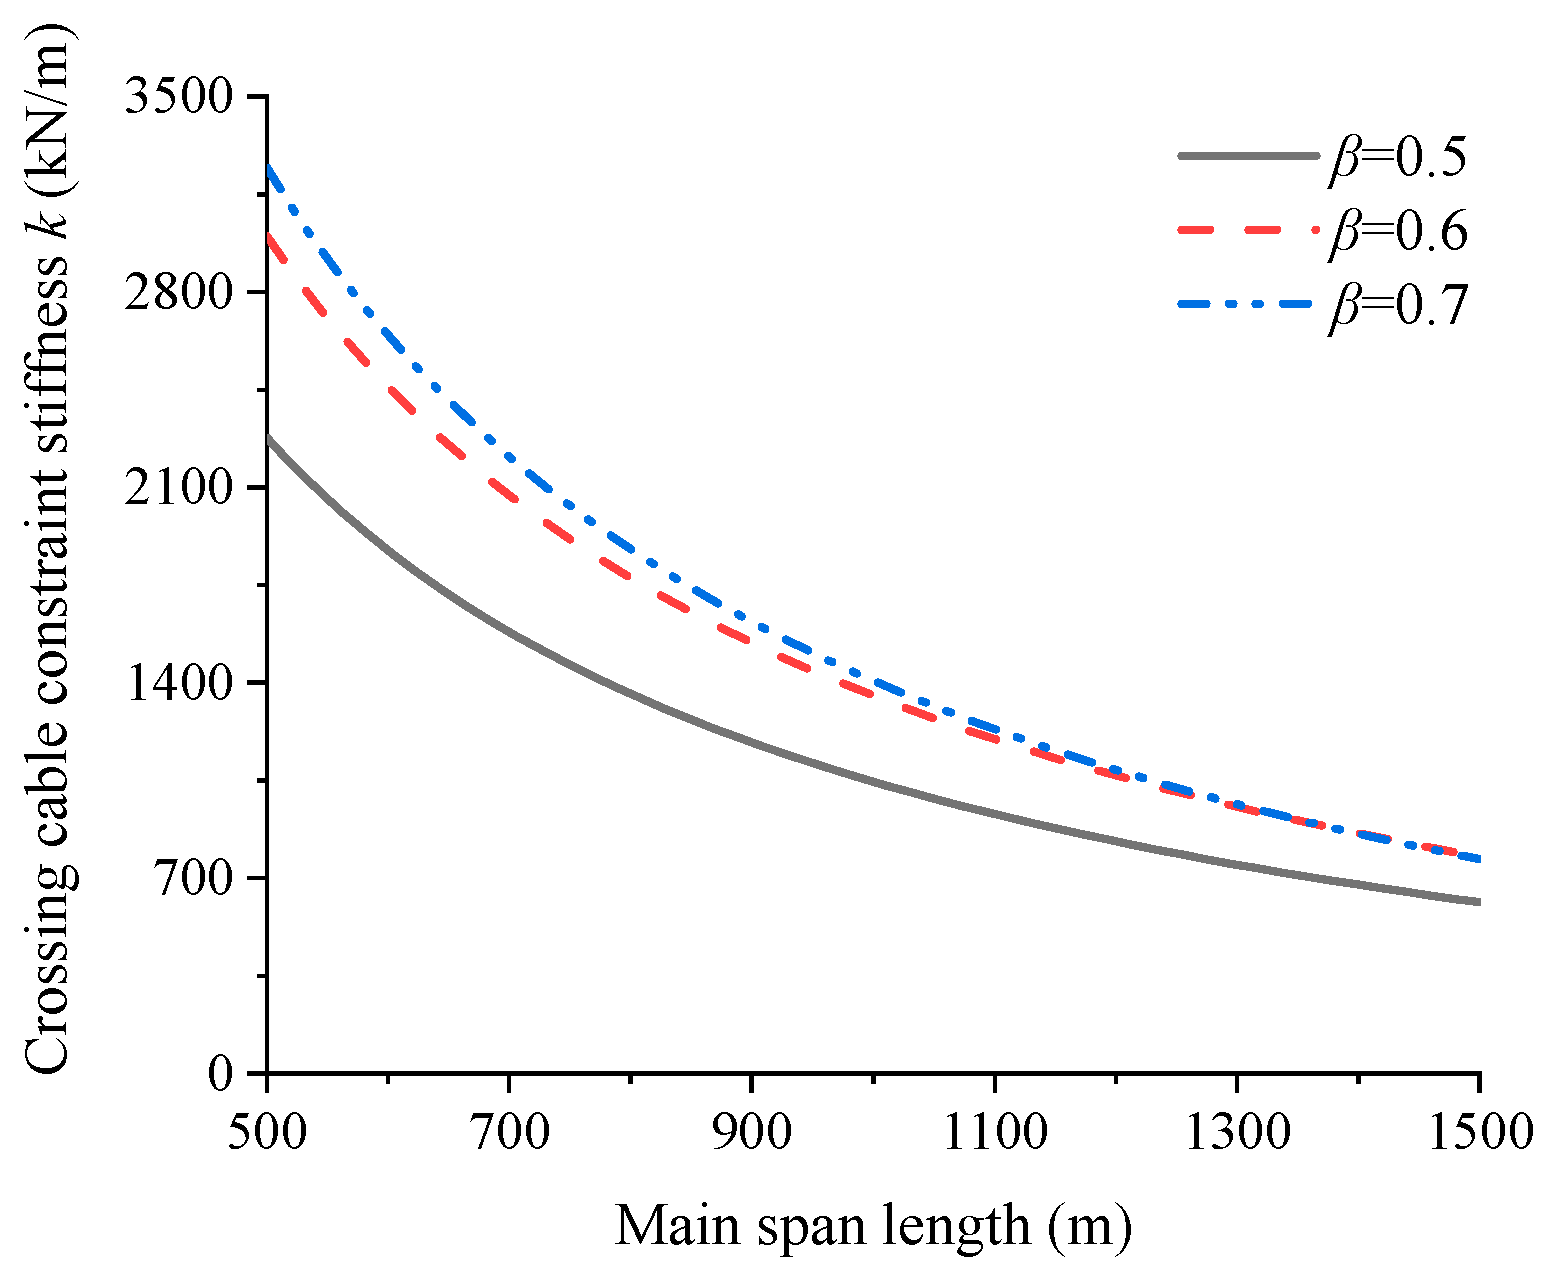
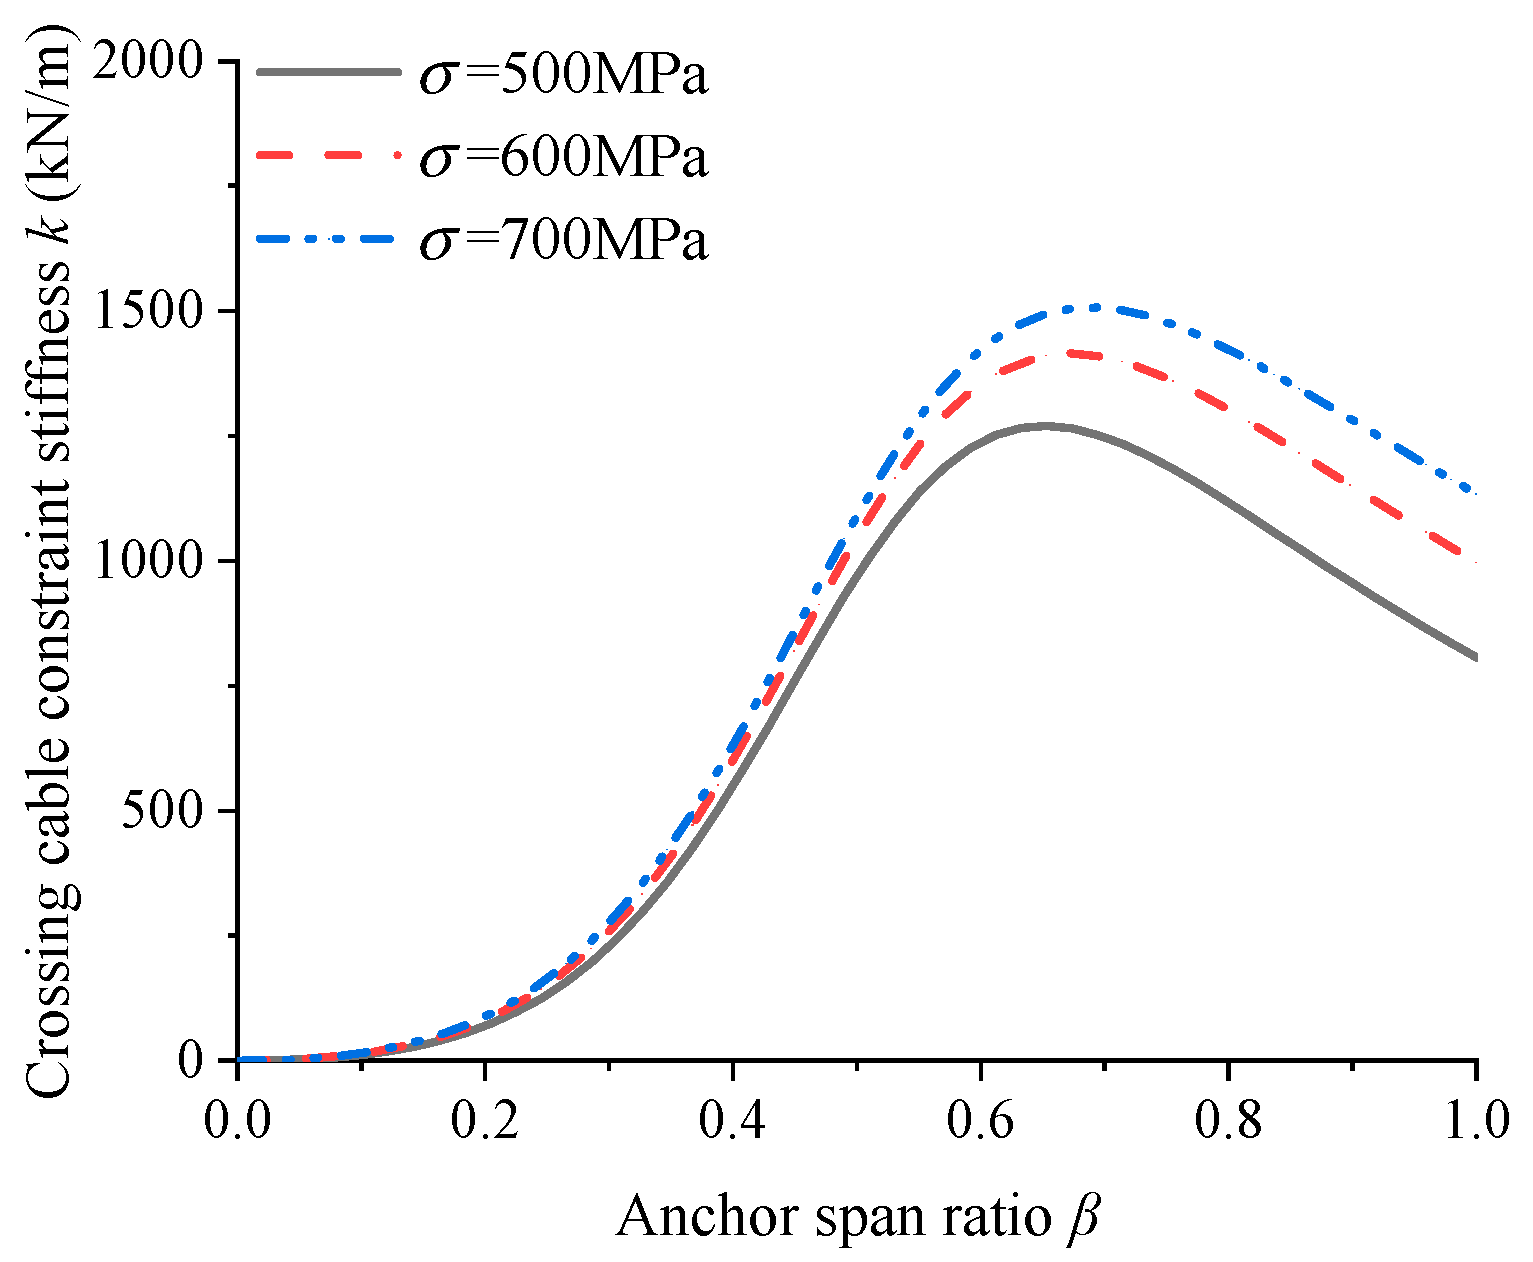
(2)
As the main span length increases, the sag effect becomes significant, causing the anchorage position with the maximum constraint stiffness of the crossing cables to shift toward the mid span. Taking a three-tower cable-stayed bridge with a height-to-span ratio of 0.25 as an example, when the cable stress level reaches 600 MPa, expanding the span from 700 m to 1500 m reduces the anchorage span ratio of the crossing cables from 0.69 to 0.63. Increasing the initial stress of the crossing cables helps improve their constraint stiffness, while the anchorage position with maximum constraint stiffness moves closer to the side towers.
(3)
When the steel volume of the crossing cable is constant, increasing the ratio of the crossing cable area between the mid tower and the side tower can make full use of the restraining effect of the ordinary cables near the crossing cable of the side tower on the deck, so as to improve the restraining effect of the crossing cable on the mid tower.
(4)
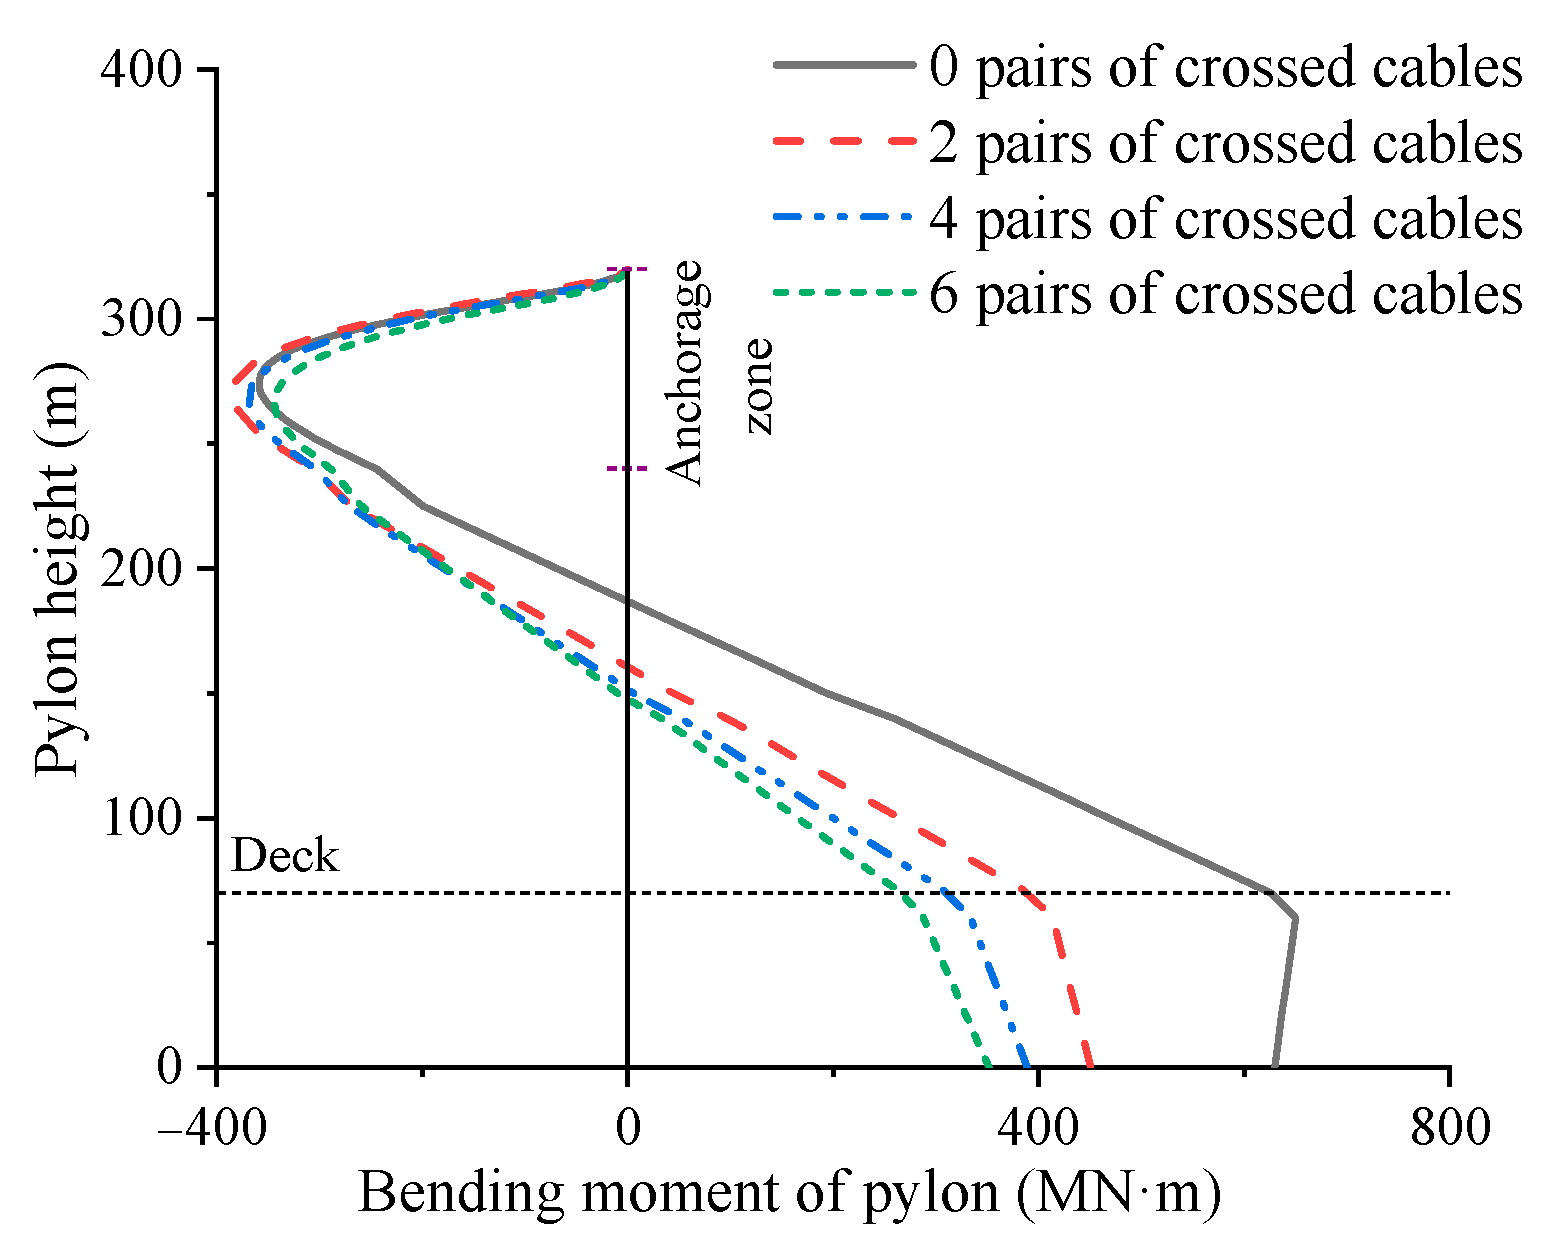
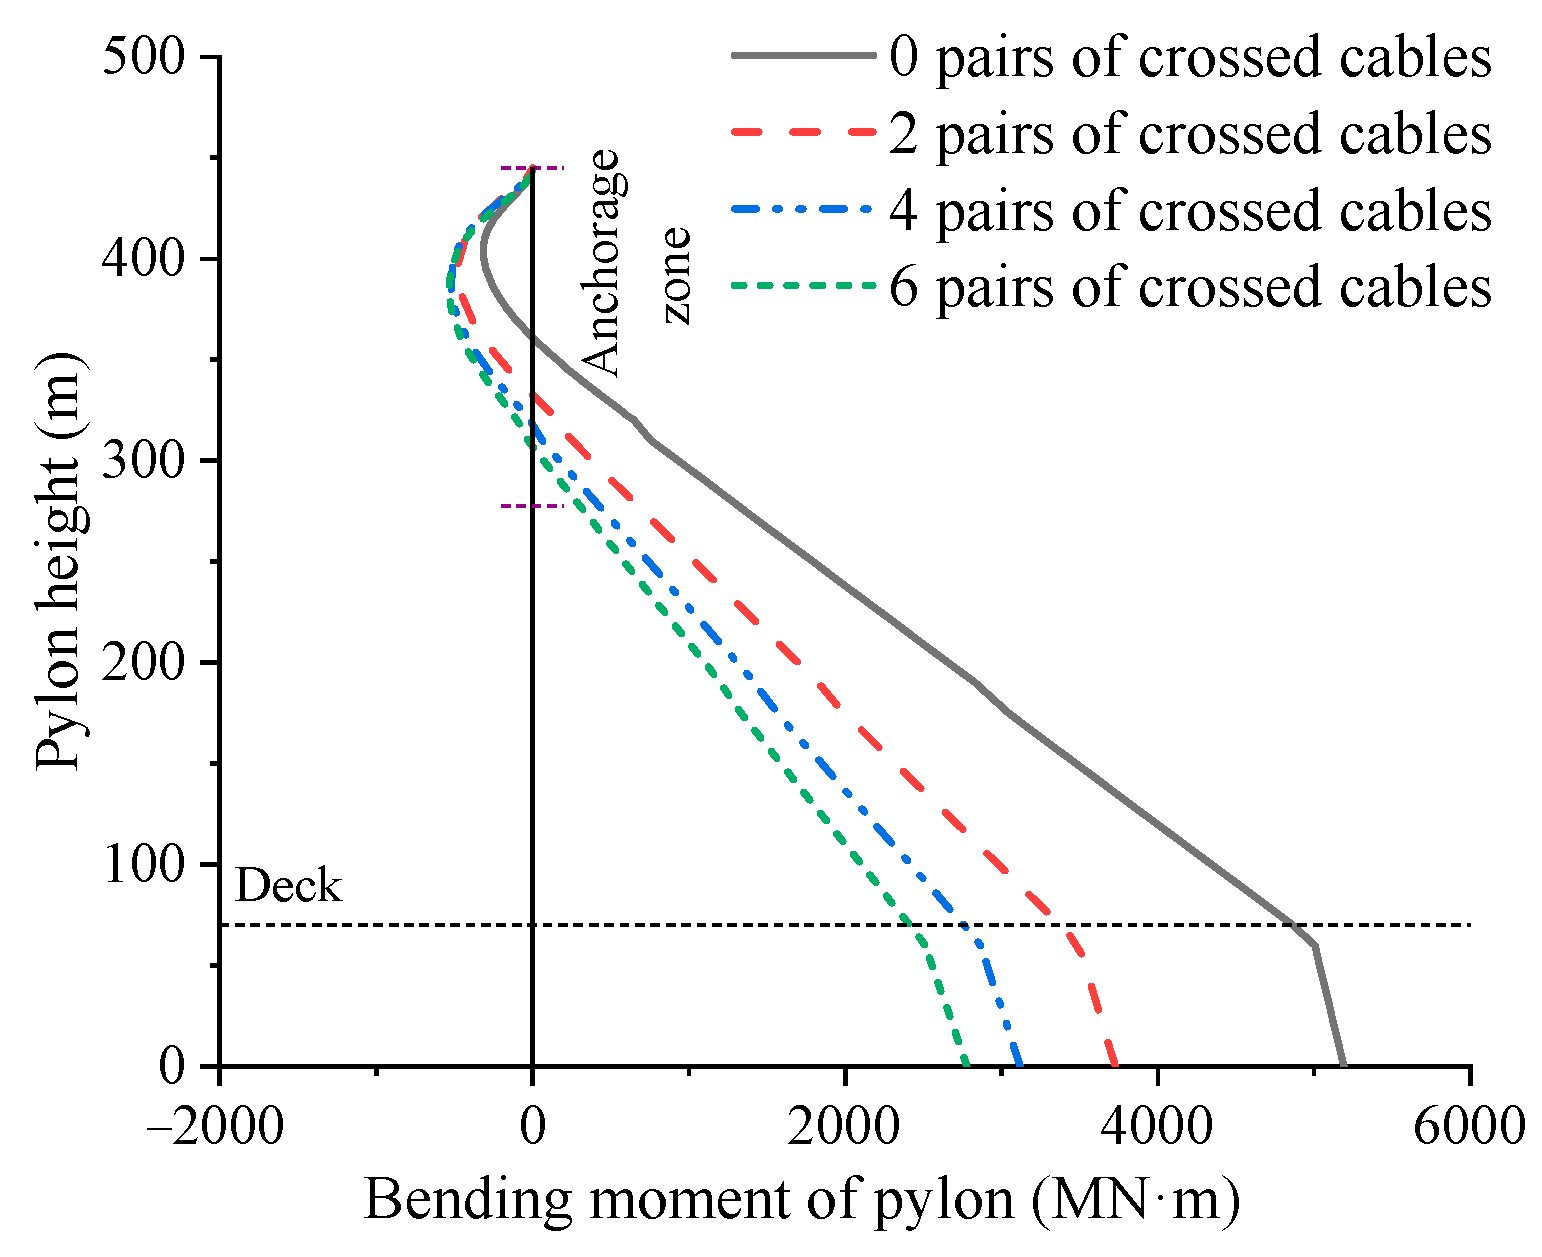
For multi-tower cable-stayed bridges with main spans exceeding 1000 m, the installation of crossing cables can still effectively enhance structural stiffness and reduce bending moments of the tower bottom. In the case study of this paper, after adding six pairs of crossing cables to three-tower cable-stayed bridges with main spans of 1000 m and 1500 m, the vertical displacement of the deck decreased by 55% and 40%, respectively, while the bending moment at the base of the mid tower was reduced by 44% and 46%.
(5)
When the tower height below the deck is increased, the crossing cables can still effectively improve the deformation of the deck and the bending moment of the mid tower. Therefore, for a three-tower cable-stayed bridge built in the deep-water area, the setting of crossing cables in the main span is still an effective measure to improve the structural stiffness.
Future work will explore the local stress situation of crossing cable three-tower cable-stayed bridges, with a focus on key positions such as crossing cable anchorage zones and bridge decks, and optimize local structural design by establishing refined solid models.

Author Contributions

Conceptualization, S.C.; Methodology, S.C. and K.H.; Software, K.H.; Validation, S.C.; Formal analysis, K.H.; Investigation, X.W.; Writing—original draft, K.H.; Writing—review & editing, S.C. and X.W.; Supervision, X.W.; Funding acquisition, S.C. All authors have read and agreed to the published version of the manuscript.

Funding

This work was supported by the National Natural Science Foundation of China (Grant No. 52178166). The authors express their gratitude for the financial assistance.

Institutional Review Board Statement

Not applicable.

Informed Consent Statement

Not applicable.

Data Availability Statement

The original contributions presented in this study are included in the article. Further inquiries can be directed to the corresponding author.

Conflicts of Interest

The authors declare no conflict of interest.

References

  1. Gimsing, N.J.; Georgakis, C.T. Cable Supported Bridges Concept and Design, 3rd ed.; Wiley: New York, NY, USA, 2011. [Google Scholar]
  2. Janjic, D. Structural Analysis of the Sutong Bridge; Bentley Systems Incorporated: Ningbo, China, 2007. [Google Scholar]
  3. Pipinato, A. Case study: The Russky bridge. In Innovative Bridge Design Handbook; Butterworth-Heinemann: Oxford, UK, 2016; pp. 671–680. [Google Scholar]
  4. Qin, S.Q.; Xu, W.; Lu, Q.F.; Zheng, Q.G.; Fu, Z.G.; Wan, R.A.A.; Sun, J.L. Overall Design and Concept Development for Main Navigational Channel Bridge of Changtai Changjiang River Bridge. Bridge Constr. 2020, 50, 1–10. (In Chinese) [Google Scholar]
  5. Liu, Q.Y.; He, M.; Li, X.L.; Zhang, Q. Research on Design and Construction of Main pylon of Maanshan Changjiang River Highway Bridge. Appl. Mech. Mater. 2014, 587, 1604–1607. [Google Scholar] [CrossRef]
  6. Arnaud, S.; Matsunaga, N.; Nagano, S.; Ragaru, J. Behavior of a multiple spans cable-stayed bridge. In Tailor Made Concrete Structures: New Solutions for our Society; Taylor & Francis Group: Abingdon, UK, 2008; pp. 807–813. [Google Scholar]
  7. Arellano, H.; Gomez, R.; Tolentino, D. Parametric analysis of multi-span cable-stayed bridges under alternate loads. Balt. J. Road Bridge Eng. 2019, 14, 543–567. [Google Scholar] [CrossRef]
  8. Virlogeux, M. Bridges with multiple cable-stayed spans. Struct. Eng. Int. 2001, 11, 61–82. [Google Scholar] [CrossRef]
  9. Gimsing, N.J. Multispan stayed girder bridges. J. Struct. Div. 1976, 102, 1989–2003. [Google Scholar] [CrossRef]
  10. Combault, J.; Teyssandier, J.P. Rion-Antirion bridge, greece-concept, design and construction. Struct. Eng. Int. 2005, 15, 22–26. [Google Scholar] [CrossRef]
  11. Buonomo, M.; Servant, C.; Virlogeux, M.; Cremer, J.M.; de Ville De Goyet, V.; Forno, J.D. The design and the construction of the Millau Viaduct. Steelbridge 2004, 2004, 165–182. [Google Scholar]
  12. Bergermann, R.; Schlaich, M. Ting Kau Bridge, Hong Kong. Struct. Eng. Int. 1996, 6, 152–154. [Google Scholar] [CrossRef]
  13. Hussain, N.; Hornby, R.; Minto, B.; Carter, M.; Kite, S. Queensferry Crossing, UK: Scheme, specimen and definition design. Proc. Inst. Civ. Eng.-Bridge Eng. 2019, 172, 92–112. [Google Scholar] [CrossRef]
  14. Pan, F. Overall Design and Innovation of Huangmaohai Link Project. Bridge Constr. 2021, 51, 10–16. (In Chinese) [Google Scholar]
  15. Chai, S.B.; Xiao, R.C.; Wang, X.L. Longitudinal restraint stiffness of crossed cables in multi-tower cable-stayed bridge. J. Harbin Inst. Technol. 2016, 9, 119–124. (In Chinese) [Google Scholar]
  16. Chai, S.B.; Wang, X.L. Simplified calculation method for deformation of multi-tower cable-stayed bridges with crossed cables. Eng. Struct. 2019, 181, 354–361. [Google Scholar] [CrossRef]
  17. Chai, S.B.; Zhang, R.L.; Wang, X.L.; Huang, K.J. Asymmetric arrangement of crossed cables in multitower cable-stayed bridges based on structural stiffness. J. Bridge Eng. 2023, 28, 04022142. [Google Scholar] [CrossRef]
  18. Yao, S.S.; Peng, B.; Wang, L.Y.; Chen, H.D. Analytical Solution for Longitudinal Anti-Push Stiffness of the Middle Tower of Cross-Cable Multi-Tower Cable-Stayed Bridge. Buildings 2023, 13, 2158. [Google Scholar] [CrossRef]
  19. Shao, X.D.; Deng, F.H.; Deng, L. Conceptual design of a new three-tower cable-stayed bridge system with unequal-size fans. J. Bridge Eng. 2018, 23, 06018002. [Google Scholar] [CrossRef]
  20. Baldomir, A.; Tembrás, E.; Hernández, S. Optimization of cable weight in multi-span cable-stayed bridges. Application to the Forth Replacement Crossing. In Multi-Span Large Bridges; CRC Press: Porto, Portugal, 2015; p. 620. [Google Scholar]
  21. Arellano, H.; Tolentino, D.; Gómez, R. Optimum criss crossing cables in multi-span cable-stayed bridges using genetic algorithms. KSCE J. Civ. Eng. 2019, 23, 719–728. [Google Scholar] [CrossRef]
  22. Cid, C.; Baldomir, A.; Hernández, S. Optimum crossing cable system in multi-span cable-stayed bridges. Eng. Struct. 2018, 160, 342–355. [Google Scholar] [CrossRef]
  23. Huang, K.J.; Chai, S.B.; Wang, X.L. Crossing cable design optimization of multi-tower cable-stayed bridge based on joint analytical method and genetic algorithm. Structures 2024, 69, 107335. [Google Scholar] [CrossRef]
  24. Asgari, B.; Osman, S.A.; Adnan, A. Three-dimensional finite element modelling of longspan cable-stayed bridges. IES J. Part A Civ. Struct. Eng. 2013, 6, 258–269. [Google Scholar] [CrossRef]
  25. Nazmy, A.S.; Abdel-Ghaffar, A.M. Three-dimensional nonlinear static analysis of cable-stayed bridges. Ind. Constr. 1990, 34, 257–271. [Google Scholar] [CrossRef]
  26. Ren, W.X. Ultimate behavior of long-span cable-stayed bridges. J. Bridge Eng. 1999, 4, 30–37. [Google Scholar] [CrossRef]
  27. Der, E.J. E-Modul von Seilen unter berucksichtigung des Durchhanges. Bauingenieur 1965, 40, 52–55. (In German) [Google Scholar]
  28. Wang, P.H.; Yang, C.G. Parametric studies on cable-stayed bridges. Comput Struct. 1996, 60, 243–260. [Google Scholar] [CrossRef]
  29. Xi, Y.; Kuang, J.S. Ultimate load capacity of cable-stayed bridges. J. Bridge Eng. 1999, 4, 14–22. [Google Scholar] [CrossRef]
  30. Song, C.L.; Xiao, R.C.; Sun, B. Optimization of cable pre-tension forces in long-span cable-stayed bridges considering the counterweight. Eng. Struct. 2018, 172, 919–928. [Google Scholar] [CrossRef]
  31. ANSYS User Documentation; ANSYS Inc.: Pittsburgh, PA, USA, 2021.
  32. Lai, Y.; Wu, Y.; Wang, G. Novel long-span cable-stayed deck arch bridge: Concept and structural characteristics. Eng. Struct. 2024, 308, 118026. [Google Scholar] [CrossRef]
  33. Zhang, W.M.; Zou, H.X.; Chen, J.; Chang, J.Q. An analytical method for adjusting dead load allocation between side and central cables in a cable-stayed bridge with three cable planes. Structures 2023, 48, 1761–1771. [Google Scholar] [CrossRef]
  34. Daniell, W.E.; Macdonald, J.H. Improved finite element modelling of a cable-stayed bridge through systematic manual tuning. Eng. Struct. 2007, 29, 358–371. [Google Scholar] [CrossRef]
Figure 1. Crossing cables are set in the mid span of three-tower cable-stayed bridge.
Applsci 15 06355 g001
Figure 2. Diagram of crossing cable force change.
Applsci 15 06355 g002
Figure 3. The relationship between k and anchor span ratio β under different spans.
Applsci 15 06355 g003
Figure 4. The relationship between k and the main span length L under different anchor span ratios.
Applsci 15 06355 g004
Figure 5. The relationship between k and the anchor span ratio β under different initial stresses.
Applsci 15 06355 g005
Figure 6. The relationship between the ratio t of crossing cable area of the mid tower and the side tower and k (L = 1000 m).
Applsci 15 06355 g006
Figure 7. The relationship between the ratio t of crossing cable area of the mid tower and the side tower and k (L = 1500 m).
Applsci 15 06355 g007
Figure 8. Cable-stayed bridge layout and cross-section (unit: m).
Applsci 15 06355 g008
Figure 9. Finite element model.
Applsci 15 06355 g009
Figure 10. Asymmetric arrangement of crossing cables.
Applsci 15 06355 g010
Figure 11. The maximum vertical deflection of the deck when the crossing cables are set at different positions.
Applsci 15 06355 g011
Figure 12. Bending moment of mid-tower bottom under uniform load.
Applsci 15 06355 g012
Figure 13. The displacement of the deck with different crossing cable area ratios.
Applsci 15 06355 g013
Figure 14. Tower bottom bending moment under different crossing cable area ratios.
Applsci 15 06355 g014
Figure 15. Anchorage position of crossing cable.
Applsci 15 06355 g015
Figure 16. Vertical deflection of the deck (L = 1000 m).
Applsci 15 06355 g016
Figure 17. Vertical deflection of the deck (L = 1500 m).
Applsci 15 06355 g017
Figure 18. Bending moment of the mid tower (L = 1000 m).
Applsci 15 06355 g018
Figure 19. Bending moment of the mid tower (L = 1500 m).
Applsci 15 06355 g019
Table 1. Cross-sectional characteristics of components.
ComponentMaterialArea (m2)Inertia Moment (m4)Elastic Modulus (GPa)
DeckQ3452.163205
TowerConcrete C6046.4/112291/373335
CableParallel steel wire0.005/0.007/0.008/205
Table 2. Structural response under dead and live load.
Structural ResponseL = 1000 mL = 1500 m
Maximum deflection of deck (m)3.335.05
Maximum stress of the deck (MPa)94.50147.81
Bending moment of mid-tower bottom (MN·m)640.315190.05
Stress of mid-tower bottom (MPa)22.6125.94
Maximum stress of cable (MPa)806794
Table 3. The maximum vertical deflection of the deck under different tower heights.
Main SpanTower Height Below Deck0 Pairs of Crossing Cables6 Pairs of Crossing CablesDeflection Reduction
L = 1000 m703.331.4855.55%
1203.401.5056.11%
1703.441.5056.37%
L = 1500 m705.052.8343.96%
1205.472.9346.52%
1705.772.9948.17%
Table 4. Bending moment of tower bottom under different tower heights (MN.m).
Main SpanTower Height Below Deck0 Pairs of Crossing Cables6 Pairs of Crossing CablesBending Ree
L = 1000 m70629.46351.4944.16%
120436.87275.8336.86%
170304.71220.7527.55%
L = 1500 m705190.732778.7146.47%
1204443.352347.4747.17%
1703816.811992.3847.80%
Disclaimer/Publisher’s Note: The statements, opinions and data contained in all publications are solely those of the individual author(s) and contributor(s) and not of MDPI and/or the editor(s). MDPI and/or the editor(s) disclaim responsibility for any injury to people or property resulting from any ideas, methods, instructions or products referred to in the content.

