Abstract
In this study, cavitation erosion tests were conducted to investigate the effects of the presence of coolant additives and chlorides on the corrosion and cavitation erosion of cylinder liners in marine diesel engines. Electrochemical experiments were conducted to evaluate the corrosion characteristics of ductile cast iron (DCI), and the corrosion potential and corrosion current density were measured. In addition, weight loss, surface roughness, and maximum surface damage depth were quantified as a function of cavitation exposure time. Furthermore, to investigate the erosion and erosion–corrosion characteristics induced by cavitation attack, the damaged surface morphology was closely examined using a scanning electron microscope (SEM) after the cavitation erosion tests. The results revealed that the coolant additive effectively protected the DCI from corrosion caused by aggressive chlorides. In particular, when an appropriate amount of additive was added to a coolant containing 100 ppm of chloride, the corrosion current density of DCI was reduced by approximately 31.7 times, significantly improving corrosion resistance. Therefore, different surface damage mechanisms corresponding to cavitation erosion and cavitation erosion–corrosion were identified depending on the presence or absence of the coolant additive during the cavitation erosion tests.
1. Introduction
Internal combustion engines convert the energy generated from the combustion of fuel and air within the cylinder liner into mechanical output. Cylinder liners are subjected to rapid fluctuations in load, temperature, and speed, and thus must be fabricated from materials capable of withstanding such harsh conditions [1]. Cast iron is commonly used for marine diesel engine cylinder liners due to its low cost and excellent machinability [2]. During solidification, carbon in cast iron forms graphite structures, either flake or spheroidal, which enhance wear resistance [3].
Effective coolant management is critical for maintaining optimal engine performance [4]. To prevent engine damage from excessive thermal loads during combustion, coolant must be adequately supplied to the outer surfaces of cylinder liners [5]. As the coolant directly contacts the liner surface, its condition is closely linked to corrosion and cavitation erosion [6]. Therefore, distilled water free of impurities should be used. However, distilled water produced by onboard freshwater generators is often highly corrosive, necessitating the addition of corrosion inhibitors to maintain coolant performance. Additionally, seawater, due to its high salinity, has the potential to induce corrosion damage in the cooling water system, necessitating careful consideration [7]. Seawater primarily enters the system due to damage to the seals of seawater-based cooling systems, which are used to cool high-temperature coolant, during the heat exchange process [8].
Cast iron has poor corrosion resistance even under atmospheric conditions, and it is known to be easily corroded by small amounts of corrosive substances such as chlorides, nitrates, sulfates, and carbonates [9]. To mitigate this, engine coolants typically incorporate corrosion inhibitors that enhance both corrosion resistance and thermal conductivity [10,11]. Cooling water can contain a variety of additives. Coolants based on ethylene glycol, carboxylates, and traditional nitrites have been extensively used over a long period to mitigate corrosion of cylinder liners [12,13]. In particular, nitrite has attracted considerable attention from researchers due to its low cost and relatively excellent corrosion inhibition performance [14,15]. In the context of iron corrosion, nitrite has been studied under various corrosive conditions such as solution temperature [14,16,17], nitrite concentration [17,18], the concentration of aggressive ions [19], and the pH of the solution [20,21]. In this context, primary attention has been focused on investigating the optimal characteristics of corrosion inhibitors and appropriately controlling the concentration of nitrite to reduce the risk of corrosion [22]. Nevertheless, if the nitrite concentration falls below the level required for effective corrosion prevention, pitting corrosion may occur. [23,24]. Nitrite-based coolants require periodic replenishment due to the continuous depletion of nitrite ions. If proper coolant management is not carried out, corrosion may occur, causing leakage in various sealing areas, which may reduce the life and safety of engine parts.
Cavitation erosion is another major cause of cylinder liner damage during engine operation [25,26,27]. Vibrations generated during the operation of internal combustion engines induce the formation and collapse of cavitation bubbles, causing erosion on the outer surface of the cylinder liner. This phenomenon is caused by the piston slap motion in which the piston moves up and down within the cylinder liner, impacting the inner wall of the cylinder liner [28]. The excessive vibrations generated on the outer surface of the cylinder liner induce rapid formation and collapse of micro vapor bubbles within the coolant, resulting in cavitation erosion damage to the cylinder liner surface. The most significant adverse effect of such cavitation erosion damage is the formation of holes in the cylinder liner surface, leading to the mixing of engine coolant with the lubrication oil system.
Recently, studies on cavitation phenomena in fluids using computational fluid dynamics (CFD) have been actively conducted across various fields, significantly enhancing the understanding of the mechanisms and characteristics of cavitation. As a result, the applicability of cavitation research has increased not only for theoretical analysis but also for practical engineering applications. Through theoretical and experimental analyses of the combined suppressive effects of fluid temperature, pressure difference, and turbulence intensity on hydrodynamic cavitation flow in Venturi-type reactors, variations in cavitation length and shape with respect to temperature have also been identified [29]. In addition, some studies have investigated the effects of cavitation dynamics and erosion patterns under submerged conditions on both flat and curved surfaces, thereby expanding the potential application of cavitation water jet technology to sustainable energy and cleaning processes [30]. Furthermore, the effect of nozzle rotation speed on the flow characteristics of water jets has been numerically analyzed, providing a theoretical basis for practical applications such as scale removal in industrial piping and wellbore cleaning in oilfields [31]. In addition, simulations of dual-nozzle cavitating water jets have been conducted to provide design guidelines for nozzles suitable for surface treatment of large structures [32], and the capability to simulate typical sheet-to-cloud cavitation flows around hydrofoils has also been evaluated, successfully reproducing the cavitation formation process [33].
In parallel, active research is also being conducted on cavitation phenomena occurring in the coolant flow around cylinder liners of internal combustion engines, reflecting the growing interest in understanding their impact on engine reliability and durability, as well as in identifying mechanisms to mitigate these effects. The correlation between pressure fluctuations and acceleration caused by the vibration of diesel engine cylinder liners and the concentration and intensity of cavitation has been investigated [34], the relationship between cylinder liner vibration and coolant pressure has also been analyzed to determine the cavitation risk associated with cylinder liner acceleration in medium-large-sized diesel engines [28]. It has also been demonstrated that vibration amplification of cylinder liners in internal combustion engines induces cavitation and erosion damage in the coolant, thereby providing a theoretical basis for mitigating damage caused by cavitation [35]. Meanwhile, according to the experimental study on cavitation erosion of cylinder liners by Chen and Leng, the weight loss during cavitation erosion tests was found to be minimal in all coolant samples containing three different additives, confirming the effectiveness of these additives in preventing cavitation erosion [36].
Thus, coolant additives play a vital role in mitigating both corrosion and cavitation erosion of cylinder liners. Most previous studies on nitrite, a corrosion inhibitor, have been conducted separately, focusing either on corrosion or cavitation erosion. However, in field conditions, environments, where both corrosion and cavitation erosion occur simultaneously, can be present, potentially leading to severe cavitation erosion–corrosion problems.
The objective of this study is to elucidate the effects of nitrite-based coolant additives on the corrosion and cavitation erosion behavior of cylinder liners in marine diesel engines. Electrochemical experiments and cavitation erosion tests were performed according to the presence or absence of additives and chlorides. Surface analyses after cavitation erosion tests were performed to investigate the mechanisms of corrosion and cavitation damage.
2. Experimental Method
2.1. Preparation
The test specimen was selected as ductile cast iron (GCD-500), which is commonly used for the cylinder liners and cylinder blocks that constitute the cooling water jacket system of diesel engines. Its chemical composition and mechanical properties are provided in Table 1 and Table 2. Specimens were precisely machined to dimensions of 20 mm × 20 mm × 10 mm (width × length × height). The surfaces were polished sequentially with sandpapers (#100 → #200 → #400 → #600), ultrasonically cleaned in distilled water for 1 min, dried with hot air, and stored in a desiccator.

Table 1.
Chemical composition of ductile cast iron.
Table 2.
Mechanical properties of ductile cast iron.
The experimental solutions were prepared in three types, as shown in Table 3, to evaluate the effects of the presence or absence of coolant additives and chlorides on the corrosion and cavitation erosion of the test specimens. The type of additive selected was a nitrite-based additive widely used as a coolant treatment agent in the shipping industry. The additive used in this study was a nitrite-based corrosion inhibitor from Drew Marine, a company specializing in coolant treatment agents for ships. The physical properties of the inhibitor are listed in Table 4. Based on the manufacturer’s recommendations, the additive concentration was set to the recommended level of 13,000 ppm, and the chloride concentration was selected to be the maximum upper limit of 100 ppm for the experimental conditions.
Table 3.
Types and conditions of experimental solutions.
Table 4.
Physical properties of coolant additive.
2.2. Electrochemical Experiment
A potentiodynamic polarization test was performed on GCD-500 specimens, which were used as working electrodes in the aqueous solution at 25 °C. The working electrode with a surface area of 1 cm2 was placed in a three-electrode corrosion cell connected to a potentiostat (VSP, Bio-Logic). The silver/silver chloride electrode (Ag/AgCl sat. KCl) and a graphite rod were used as reference and counter electrodes, respectively. All specimens were polarized using a scan rate of 0.5 mV/s within a range of −250 to +250 mV versus the open circuit potential (OCP). Tafel’s extrapolation was used to calculate the corrosion potential and corrosion current density from the polarization curves.
2.3. Cavitation Erosion Test
Cavitation erosion tests were performed using equipment designed to meet ASTM G32 [37] specifications. The experimental equipment utilized a vibration generation device based on the piezoelectric effect. The device, powered by 60 Hz, 220 V electricity through an electronic circuit, generates a rated vibration output of 20 kHz, which is supplied to the vibrator. The amplitude was automatically controlled and maintained at a constant value of 50 µm. Vibration generation by the piezoelectric element is achieved by applying an alternating electrical current to a conical horn, which induces axial vibrations and creates a cavity.
During cavitation erosion tests, the temperature of the solution was maintained at 25 ± 1 °C using a chiller to minimize temperature-induced variations in cavitation behavior. A chiller system consisting of a circulating constant-temperature water bath equipped with both a heater and a cooling unit was used to maintain the set temperature (CORETECH, HQ-DRCW21 (CORETECH, Anyang, Republic of Korea)). The operating temperature range of the unit was –10 °C to 95 °C and the built-in digital PID controller automatically maintained the target temperature with a precision of 0.1 °C. The horn immersion depth was consistently maintained at 12 mm. The test specimen was fixed to a fixture in such a way that it faced the vibrator’s horn, allowing the cavity generated by the horn to affect the specimen. This setup is referred to as the “stationary specimen method”. The distance between the vibrator and the specimen was kept constant at 0.5 mm. After cavitation erosion tests, weight loss measurements were conducted. Specimens were ultrasonically cleaned in distilled water, dried in an oven at 60 °C for 24 h, cooled in a desiccator for 30 min, and weighed at room temperature with a precision of 10−4 g. The cavitation erosion experiment was repeated three times for each experimental condition to ensure reproducibility, and then the average weight loss was calculated. Surface morphology before and after cavitation erosion tests was examined using a scanning electron microscope (SEM, SNE-4500M Plus (SEC, Daejeon, Republic of Korea)). In addition, a confocal 3D laser microscope (Olympus, OLS5000-SAF (Jiangsu Caidao Precision Instruments Co., Ltd., Suzhou, China)) was used to measure surface roughness and maximum surface damage depth, providing a detailed analysis of cavitation-induced damage.
3. Results and Discussion
3.1. Microstructure of Ductile Cast Iron
Figure 1 shows an SEM image of ductile cast iron (DCI) etched with a 4% nital solution. A matrix consisting of ferrite and pearlite, which is typical of DCI, as well as spheroidal graphite, was observed. The graphite particles were found to be nearly spherical and uniformly distributed across the specimen surface.
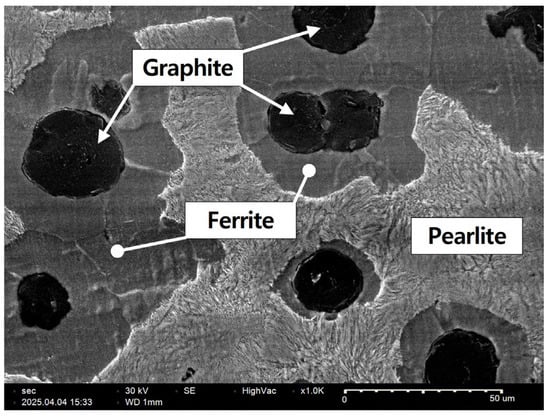
Figure 1.
Microstructure of ductile cast iron (GCD-500).
3.2. Corrosion Behavior
Figure 2 presents the curve of the OCP of DCI measured in the experimental solution with immersion time. For DW + C without additives, the potential started at approximately −0.49 V and gradually decreased over immersion time, reaching about −0.56 V at the end of the experiment. Frequent potential fluctuations were observed throughout the experiment. It is believed that the oxide film formed on the DCI surface in the atmosphere was destroyed by the highly corrosive Cl− ions present in the experimental solution, leading to a decrease in potential and fluctuations in potential associated with surface corrosion reactions. In particular, it is known that exposure of DCI to a corrosive electrolyte solution containing Cl− ions, as in the present study, leads to graphite corrosion [38]. Graphite corrosion can be explained by a galvanic corrosion mechanism. As shown in the microstructure in Figure 1, graphite, which possesses a noble electrochemical potential, promotes anodic dissolution through galvanic contact with the adjacent matrix, which has an active potential. As a result, the matrix surrounding the graphite corrodes preferentially, leaving only the graphite structure remaining. Meanwhile, the OCP of DW + A and DW + A + C, both containing additives, started at a higher potential of approximately −0.34 V compared to DW + C, and gradually increased, reaching approximately −0.25 V and −0.27 V, respectively, at the end of the experiment. The relatively higher OCP of DW + A and DW + A + C compared to DW + C is attributed to the effective passive behavior exhibited by the nitrite-based additive on the DCI surface [39,40]. This is consistent with previously reported similar corrosion behavior of carbon steel in neutral solutions in the presence of nitrite ions [41,42]. To interpret this behavior, it is useful to explain the inhibition mechanism of nitrite ions. This process occurs through the adsorption of nitrite ions onto the metal surface [43], followed by a reduction reaction that produces oxygen ions, as shown in the following reaction described by Equation (1) [18,42].
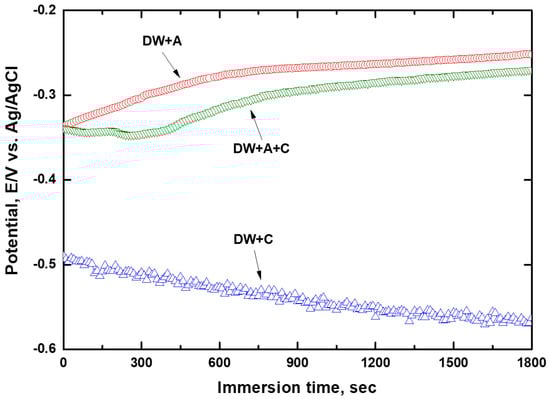
Figure 2.
Open circuit potential with immersion time.
In fact, the reduction in nitrite ions generates oxygen in the form of ions, which promotes the oxidation of ferrous ions to ferric ions [44]. In alkaline solutions, a stable passive film of maghemite forms on the metal surface, which can be summarized by the following reaction described by Equation (2) [42,45,46].
According to this reaction equation, it can be seen that not only nitrite ions but also hydroxide ions play a crucial role in the passivation of iron [22]. In contrast to DW + C, the OCP of DW + A and DW + A + C exhibited little voltage fluctuation, indicating that the passive behavior induced by the additive was established quite stably. The relatively lower OCP of DW + A + C compared to DW + A is believed to result from the partial negative influence of the Cl− ions present in DW + A + C on passive behavior. This OCP behavior trend is consistent with the findings of other researchers, who reported that the OCP behavior changes with varying nitrite concentrations [39]. To quantitatively assess the corrosion rate of DCI depending on the experimental solution, the potentiodyamic polarization experiments were performed, followed by Tafel’s analysis, as shown in Figure 3. The resulting corrosion potential and corrosion current density are presented in Table 5. The corrosion potential of DW + C was −0.24 V lower than that of DW + A + C, and the corrosion current density was about 31.7 times higher, confirming its relatively poor corrosion resistance. This indicates that the Cl− ions in the experimental solution contribute to the aggressive corrosion of DCI, while also demonstrating that the nitrite-based additive exhibits effective passive behavior. In particular, the corrosion potential and corrosion current density of DW + A and DW + A + C were nearly identical, indicating that the nitrite-based additive in the experimental solution has a strong resistance to Cl− ions. As a result, the appropriate concentration of nitrite-based additive in the coolant effectively forms passive behavior on the DCI surface, leading to relatively superior corrosion resistance. However, since the corrosion current density in this study was measured at a temperature lower than the actual coolant temperature during diesel engine operation, the influence of coolant temperature must be considered in future analyses for more accurate evaluation. According to the findings of Khani and Arefinia, as the temperature of the solution containing nitrite additives increased, the corrosion current density also increased, and the corrosion potential shifted to more negative values [41]. This is generally because an increase in solution temperature promotes the dissolution of metal ions through further activation of the metal surface [14,17], while also reducing the resistance of the oxide film on the metal surface [46].
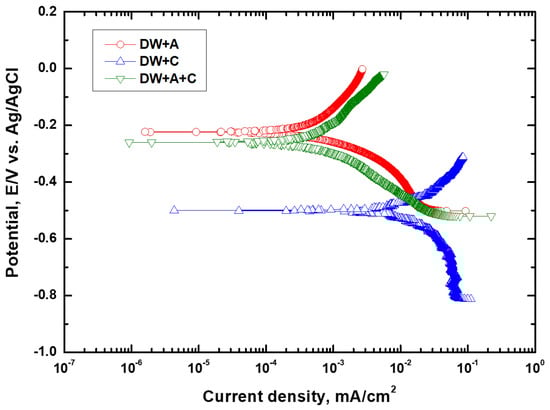
Figure 3.
Tafel’s curves after electrochemical experiments.
Table 5.
Corrosion potential and corrosion current density by Tafel’s analysis.
3.3. Cavitation Erosion Behavior
Figure 4 shows the weight loss and cavitation erosion rate curves over the duration of the cavitation erosion test and the scanned images of the surface specimen after the test. In the case of the weight loss curve in Figure 4a, it can be seen that all experimental solutions show a gradually increasing trend as the experimental time elapses, indicating that cumulative damage from continuous cavitation erosion has occurred. In particular, the DW+C specimen exhibited a steeper slope compared to the DW + A and DW + A + C specimens, indicating that its cavitation erosion resistance was relatively low. In the case of the cavitation erosion rate in Figure 4b, an unstable curve trend was observed in all conditions until about 10 min of the experimental time, but a stable curve trend was observed thereafter. The average rate in the stabilized cavitation erosion rate section was similar at 4.2 mg/h and 4.4 mg/h for DW + A and DW + A + C, respectively, whereas DW + C was confirmed to be more than twice as large at 9.3 mg/hour. The reason for the relatively high cavitation erosion in the DW + C specimen is that when the cavitation phenomenon occurs in a corrosive solution, such as Cl− ions, both physical cavitation erosion and chemical corrosion occur simultaneously, leading to a synergistic effect due to their interaction [47,48,49,50]. This synergistic effect is a common issue observed in engineering alloys used in marine environments, such as ship propellers, pump impellers, and valves [51,52]. Meanwhile, the DW + A and DW + A + C specimens showed almost identical trends in cavitation erosion rate, indicating that cavitation resistance is not significantly affected by the presence of Cl− ions. Accordingly, upon observing the surface images of DCI after the cavitation erosion tests, only circular surface damage caused by cavitation erosion was predominantly observed on the DW + A (Figure 4d) and DW + A + C (Figure 4e) specimens. In contrast, the DW + C specimen (Figure 4c) exhibited not only circular cavitation erosion damage but also a red coloration across the surface due to corrosion products from the corrosion damage. To observe the surface damage in more detail over the duration of the cavitation erosion test, SEM images of the central part of the circular surface damage on the DW + A and DW + C specimens are presented in Figure 5, Figure 6, Figure 7 and Figure 8. First, Figure 5 shows the surface morphology after 1 min of cavitation erosion test. In Figure 5a,c, the DW + A and DW + C specimens exhibit a relatively uniform distribution of spherical graphite across the surface. In the high magnification images (Figure 5b,d), the DW + A specimen mostly maintained its original surface morphology, while the DW + C specimen showed partial erosion damage to the spherical graphite in some areas. After 3 min of cavitation erosion test, as shown in Figure 6, the 200× magnification images (Figure 6a,c) revealed that spherical graphite was removed from the entire surface of both the DW + A and DW + C specimens, and small crater-like depressions with hemispherical shapes were observed due to cavitation erosion attack. In this way, during the early stages of the cavitation erosion test, when subjected to short periods of cavitation erosion attack, the exposed spherical graphite on the DCI surface is primarily damaged and removed. This is believed to occur because spherical graphite has relatively softer and more brittle structural characteristics compared to the ferrite-pearlite matrix [53]. In the high magnification images (Figure 6b,d), it was observed that cavitation erosion damage tended to propagate radially from the center of the damaged area of the hemispherical crater surface, with fatigue cracks and micro pits. This is because the crater surface damage forms a notch-like structure with high-stress concentration, creating a favorable environment for cavitation erosion to occur [54]. Additionally, pearlite, which has a higher strength than ferrite, acts as a protective framework against surface damage. The relatively softer ferrite acts as a starting point for fatigue crack initiation before the pearlite structure is affected by strain hardening and fatigue. This is related to the collapse characteristics of cavitation bubbles. The shock waves and micro-jets generated during the collapse of cavitation bubbles create significant localized heating and high-pressure regions. Cavitation erosion is considered a material fatigue phenomenon because surface damage, such as elastic or plastic deformation and cracks, occurs after repeated impacts from these bubble collapse shock forces [55,56]. For this reason, pits or expanded craters with significant stress concentration areas appear in the regions where the graphite has been removed, and radial micro-crack formation is further promoted. This implies that the collapse characteristics of cavitation bubbles and the microstructural characteristics of DCI have a combined effect on cavitation erosion damage.
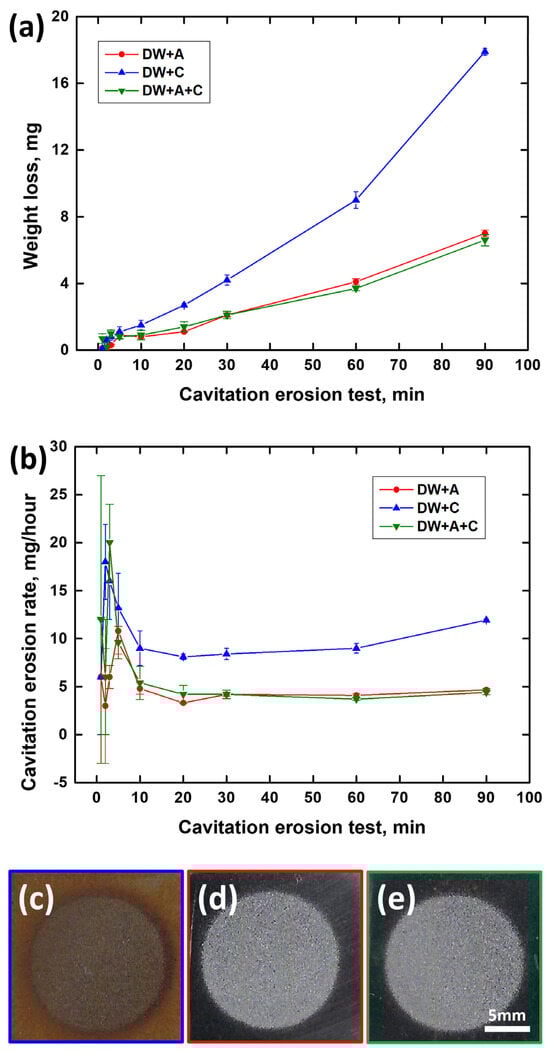
Figure 4.
Weight change curves and damaged surface images after cavitation erosion test; (a) weight loss, (b) cavitation erosion rate, (c) DW + C, (d) DW + A, and (e) DW + A + C.
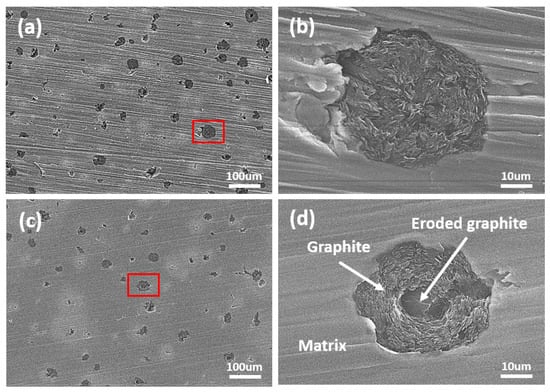
Figure 5.
SEM images after cavitation erosion test during 1 min; (a) DW + A image (×200), (b) high-magnification image of the marked area in (a), (c) DW + C image (×200), and (d) high-magnification image of the marked area in (c).
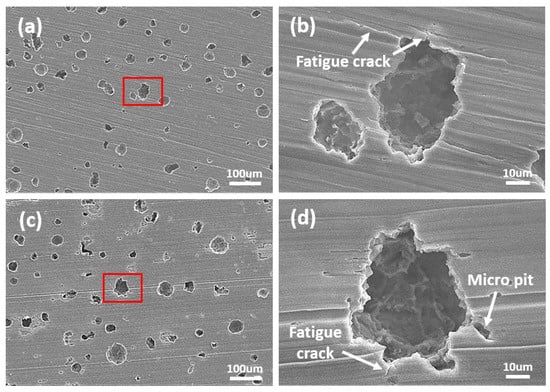
Figure 6.
SEM images after cavitation erosion test during 3 min; (a) DW + A image (×200), (b) high-magnification image of the marked area in (a), (c) DW + C image (×200), and (d) high-magnification image of the marked area in (c).
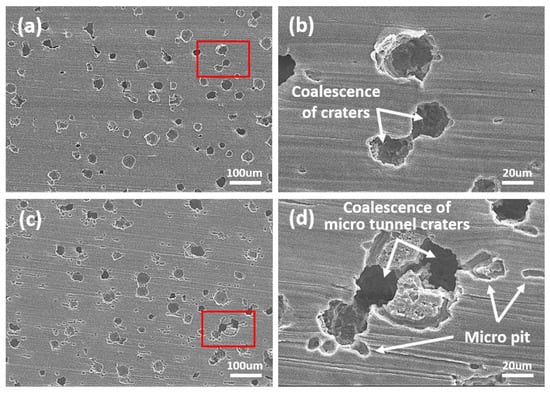
Figure 7.
SEM images after cavitation erosion test during 10 min; (a) DW + A image (×200), (b) high-magnification image of the marked area in (a), (c) DW + C image (×200), and (d) high-magnification image of the marked area in (c).
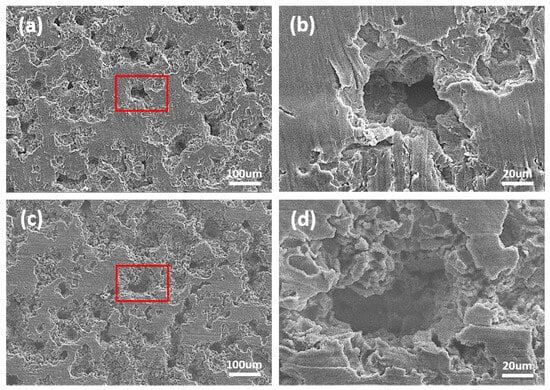
Figure 8.
SEM images after cavitation erosion test during 90 min; (a) DW + A image (×200), (b) high-magnification image of the marked area in (a), (c) DW + C image (×200), and (d) high-magnification image of the marked area in (c).
As shown in Figure 7, after 10 min of cavitation erosion tests, both the DW + A and DW + C specimens showed growth of crater damage, with the coalescence of adjacent craters leading to a further increase in surface damage (Figure 7b,d). Additionally, in the early stages of the cavitation erosion test, crater damage progressed more significantly in the depth direction rather than in the width direction. This surface damage trend was more pronounced in the DW + C specimen than in the DW + A specimen, with the observation of micro tunnels. This is believed to be related to the localized material destruction process caused by micro-jets generated during cavitation bubble collapse [56,57]. Meanwhile, several micro pits were also observed around the craters in the DW + C specimen surface. The reason for the concentrated formation of micro pits around the craters, unlike in the DW + A specimen, is that the DW + C specimen is exposed to the attack of Cl− ions without the passivation protection of the nitrite-based additive. At the same time, it is believed that the cavitation bubble collapse phenomenon concentrates at the crater damage site, leading to the formation of a high-temperature and high-pressure environment that promotes corrosion reactions. This phenomenon is believed to be the result of such interactions. As shown in Figure 5, Figure 6 and Figure 7, the microstructure of DCI was the main factor in determining the cavitation erosion damage tendency during the 10 min cavitation erosion test. In particular, it can be understood that the preferential cavitation erosion attack of the spheroidal graphite exposed on the surface of DCI induced the unstable cavitation erosion rate at the beginning of the test, as shown in Figure 4b. Subsequently, as shown in Figure 8, by the end of the cavitation erosion test, the size of the crater damage increased and the coalescence process intensified, resulting in the formation of deeper and larger craters. The DW + A specimen mainly shows crater damage progressing in the depth direction, while the DW + C specimen shows development in both depth and width directions due to the interaction with the corrosion reaction. As a result, in the 200× magnification images (Figure 8a,c), the area of the undamaged flat surface is observed to be smaller in the DW + C specimen than in the DW + A specimen. The primary destruction mechanism observed at this stage is related to fatigue, with the particles removed by cavitation erosion being attributed to the coalescence and growth of micro cracks. Thus, in the high magnification images (Figure 8b,d), the crater interior and surrounding areas in the DW + C specimen are judged to have a relatively more complex surface damage pattern.
Figure 9 shows the graph of surface roughness and maximum surface damage depth over time during the cavitation erosion test, obtained using a confocal 3D laser microscope. Both surface roughness (Figure 9a) and maximum surface damage depth (Figure 9b) exhibited a general increasing trend over time during the cavitation erosion test. This trend is consistent with the weight loss curve in Figure 4a, indicating that as the cavitation erosion test progresses, surface damage also increases due to material detachment damage caused by cavitation erosion attacks. In the initial stage of the cavitation erosion test, up to approximately 5 min, both surface roughness and maximum surface damage depth showed a sharp increase. This is because, as shown in Figure 6, the graphite exposed on the DCI surface was preferentially removed. In the case of the DW + C specimen, there was a sharp increase in surface damage depth at 30 min of test time, which is attributed to the growth of depth-oriented damage, such as micro tunnels, typical of cavitation erosion characteristics. Throughout the remainder of the test, the surface roughness of all specimens continued to increase, while the surface damage depth exhibited a more gradual slope. This is due to the coalescence of adjacent craters, as observed in the DW + C specimen in Figure 8, leading to a tendency for damage to progress in the width direction. Furthermore, as shown in Figure 4a, the sharp increase in weight loss of the DW + C specimen towards the end of the cavitation erosion test is attributed to significant material detachment damage in the form of large bulks during the coalescence of the craters. In contrast, for the DW + A specimen, surface roughness continued to increase steadily until the end of the cavitation erosion test, but the surface damage depth showed a relatively mild slope. This is because, as seen in Figure 8a, the number of micro tunnel damages in the depth direction continued to increase over test time, while damage in the width direction occurred relatively less. On the other hand, the DW + A + C specimen exhibited relatively higher surface roughness and surface damage depth compared to the DW + A specimen, though the difference was not significant, and the weight loss in Figure 4a was also almost identical. This surface damage trend can also be confirmed through the 3D profile data obtained by analyzing the surface damage after the cavitation erosion test, as shown in Figure 10. In the DW + A and DW + A + C specimens, multiple micro tunnel damages were observed, indicated by the black arrows. In contrast, the DW+C specimen exhibited wide surface damage formed during the coalescence of craters. In addition, when looking at the 2D image analysis results (Figure 11 and Table 6) based on the 3D analysis data after the cavitation erosion test, the values of damaged area ratio, number of craters, and total volume of craters were all in the order of DW + C, DW + A + C, and DW + A. This was also confirmed to be the same trend as the analysis data related to the previous cavitation erosion test. As a result, it was confirmed that the passivation behavior of the nitrite-based additive formed on the DCI surface effectively protects the material from the interaction of cavitation erosion and corrosion.
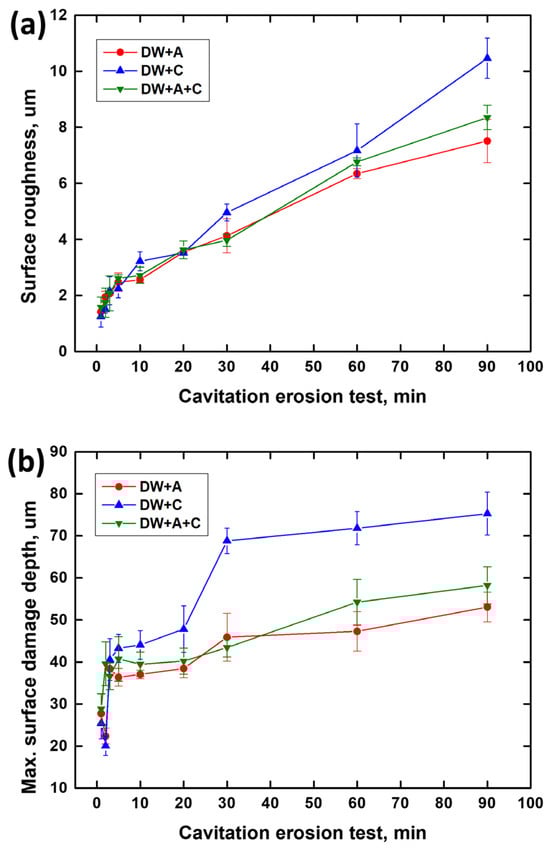
Figure 9.
Three-dimensional surface analysis after cavitation erosion test. (a) Surface roughness and (b) max. surface damage depth.
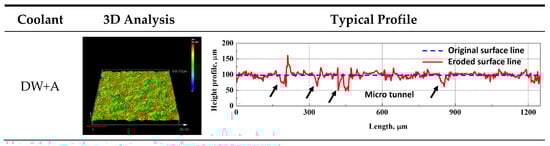
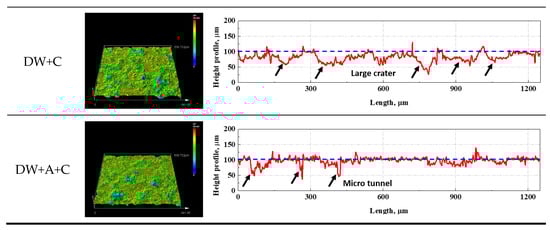
Figure 10.
Three-dimensional image and profile after cavitation erosion test during 90 min.
Figure 11.
Two-dimensional images after cavitation erosion test during 90 min; (a) DW+A, (b) DW+C, and (c) DW + A + C.
Table 6.
Results of 2D image analysis after cavitation erosion test during 90 min.
3.4. Cavitation Erosion–Corrosion Mechanism
Over the course of the cavitation erosion test, DCI exhibited a tendency for continuous increases in weight loss (Figure 4a), surface roughness, and maximum surface damage depth (Figure 9) due to surface damage caused by micro jets and shock wave attacks resulting from cavitation bubble collapse. In the initial stage, within approximately 5 min of the cavitation erosion test, a similar trend of cavitation erosion damage was observed across all experimental conditions, regardless of the presence of the nitrite-based additive. The graphite exposed on the DCI surface was initially eroded and removed by cavitation erosion (Figure 6). The small craters formed at this stage serve as areas of concentrated cavitation erosion attacks, causing depth-oriented surface damage accompanied by fatigue cracks. As the cavitation erosion test continued, surface damage trends varied depending on the presence of the nitrite-based additive. In the presence of a nitrite-based additive, cavitation erosion damage occurred predominantly, whereas in the absence of nitrite-based additive, cavitation erosion–corrosion damage occurred. In the case where the nitrite-based additive was present, passivation behavior appeared on the surface, effectively protecting it from corrosion damage, and physical cavitation erosion damage predominated (Figure 2 and Figure 3). Cavitation erosion preferentially occurred inside the craters, where repeated stress concentration led to fatigue failure accompanied by cracks. These small craters exhibited a damage mechanism in which adjacent craters coalesced and grew into larger craters (Figure 7). As the test time progresses, cavitation erosion damage increases, leading to the formation of numerous craters with micro tunnels observed in the depth direction on the surface (Figure 8 and Figure 10). On the other hand, in the absence of nitrite-based additives, the material is not protected by passivation behavior, making it susceptible to chemical corrosion attacks. As a result, cavitation erosion is accompanied by corrosion, leading to the occurrence of cavitation erosion–corrosion (Figure 2 and Figure 3). Due to the synergistic effect of the interaction between cavitation erosion and corrosion, the surface damage rate of DCI progressed rapidly, causing a relatively large increase in weight loss over test time (Figure 4a). The accompanying corrosion damage primarily appeared as micro pits near the craters, which facilitated the growth of the craters (Figure 7). Due to this corrosion effect, the craters tend to grow not only in the depth direction but also in the lateral direction. As a result, while surface roughness and weight loss continued to increase over test time, the maximum surface damage depth did not increase significantly after 30 min of test time (Figure 4 and Figure 10).
4. Conclusions
This study was conducted to analyze the effect of nitrite-based additives on the cavitation erosion and corrosion damage of DCI through electrochemical experiments and cavitation erosion tests. The following conclusions were as follows:
- The corrosion current density measurements showed that the nitrite-based additive effectively served as a corrosion inhibitor against chloride ions;
- In the presence of the nitrite-based additive, during cavitation erosion attack, the soft spherical graphite was preferentially removed, and small craters formed, acting as stress concentration regions. Subsequently, fatigue cracks initiated and grew from the surrounding areas of the small craters, leading to the coalescence of adjacent craters, which developed into larger craters;
- In the absence of the nitrite-based additive, DCI exposed to chloride ions exhibited a significant acceleration in crater damage due to the interaction between cavitation erosion and corrosion;
- The ultrasonic vibration cavitation erosion test used in this study can create an environment similar to the cavitation bubbles that occur in diesel engines. However, it has limitations in accurately replicating the actual operating conditions of the engine. In particular, it is challenging to fully replicate, under laboratory conditions, the vibration characteristics of the cylinder liner and the coolant flow conditions that vary with engine load and rotational speed. To overcome these limitations, validation experiments using actual engines are necessary, and this represents a critical task to be addressed in future research.
Author Contributions
Conceptualization, I.-C.P.; methodology, W.-S.J. and I.-C.P.; software, W.-S.J. and I.-C.P.; validation, W.-S.J. and I.-C.P.; formal analysis, W.-S.J. and I.-C.P.; investigation, W.-S.J. and I.-C.P.; resources, W.-S.J. and I.-C.P.; data curation, W.-S.J. and I.-C.P.; writing—original draft preparation, W.-S.J. and I.-C.P.; writing—review and editing, I.-C.P.; visualization, W.-S.J. and I.-C.P.; supervision, I.-C.P.; project administration, W.-S.J. and I.-C.P.; funding acquisition, I.-C.P. All authors have read and agreed to the published version of the manuscript.
Funding
This research received no external funding.
Institutional Review Board Statement
Not applicable.
Informed Consent Statement
Not applicable.
Data Availability Statement
The raw data supporting the conclusions of this article will be made available by the authors upon request.
Conflicts of Interest
The authors declare no conflicts of interest.
Abbreviations
The following abbreviations are used in this manuscript:
| DCI | Ductile Cast Iron |
| OCP | Open Circuit Potential |
| SEM | Scanning Electron Microscope |
| DW+A | Distilled Water + Additive |
| DW+C | Distilled Water + Chloride |
| DW+A+C | Distilled Water + Additive + Chloride |
References
- Oh, S.J.; Chung, K.H. Study of the Friction and Wear Characteristics of Piston Ring/Cylinder Liner Systems in Marine Engines. Tribol. Lubr. 2024, 40, 259–264. [Google Scholar]
- Pierce, D.; Haynes, A.; Hughes, J.; Graves, R.; Maziasz, P.; Muralidharan, G.; Shyam, A.; Wang, B.; England, R.; Daniel, C. High temperature materials for heavy duty diesel engines: Historical and future trends. Prog. Mater. Sci. 2019, 103, 109–179. [Google Scholar] [CrossRef]
- Kim, B.-H.; Kim, B.-H.; Koo, Y.-H.; Seo, J.-H. A Study on the Cavitation Corrosion of Gray Cast Iron Liner by Antifreeze. J. Korean Soc. Manuf. Process Eng. 2017, 16, 76–82. [Google Scholar] [CrossRef]
- MAN Diesel & Turbo. Cooling Water Treatment and Periodical Test of the Cooling Water. Service Letter, SL2016-623/JFH. 2016. Available online: https://www.man-es.com/docs/default-source/service-letters/sl2016-623.pdf?sfvrsn=7e43c4b3_4 (accessed on 14 April 2025).
- Stanivuk, T.; Lalić, B.; Žanić, J.; Šundov, M. Simulation Modelling of Marine Diesel Engine Cooling System. Trans. Marit. Sci. 2021, 10, 112–125. [Google Scholar] [CrossRef]
- Richardson, D.E. Review of power cylinder friction for diesel engines. J. Eng. Gas Turbines Power 2000, 122, 506–519. [Google Scholar] [CrossRef]
- Winterthur Gas & Diesel Ltd. Cooling Water and Additives All Engines. 2021, Issue 004 2021-05. Available online: https://wingd.com/media/w1ho1wo2/cooling-water-and-additives-for-wingd-engines_v4.pdf (accessed on 14 April 2025).
- Tae-Woo, L.I.M.; Chun-Ki, L.E.E. Thermodynamic Analysis of ORC to Recover waste Heat of Jacket Cooling Water in Diesel Engine. J. Korean Soc. Fish. Mar. Sci. Educ. 2018, 30, 1032–1039. [Google Scholar]
- Reynaud, A. Corrosion of cast irons. In Shreir’s Corrosion; Elsevier: Amsterdam, The Netherlands, 2010; Volume 3, pp. 1737–1788. [Google Scholar]
- Hudgens, R.B. Comparison of conventional and organic acid technology (OAT) coolants in heavy duty diesel engine service. J. Engines 1999, 108, 82–91. [Google Scholar]
- Weir, T.W.; Van de Ven, P. Review of organic acids as inhibitors in engine coolants. SAE Tech. Pap. 1996, 37, 37–47. [Google Scholar]
- Argade, G.; Chilukuri, A.; Perry, J.; Viers, M.; Steenhoek, J.; Debusk, J.; Wang, C.; Trobaugh, C. Corrosion Behavior of Alloyed Cast Iron in Ethylene Glycol-Based Engine Coolants at Elevated Temperature. Coatings 2021, 11, 357. [Google Scholar] [CrossRef]
- Regis, J.P.; Leonard, S.B.; Douglas, P. Hunsicker. The Role of Carboxylate-Based Coolants in Cast Iron Corrosion Protection. J. Passeng. Car Mech. Syst. J. 2021, 110, 1342–1348. [Google Scholar]
- Amin, M.A.; Hassan, H.H.; Abd EI Rehim, S.S. On the role of NO2− ions in passivity breakdown of Zn in deaerated neutral sodium nitrite solutions and the effect of some inorganic inhibitors: Potentiodynamic polarization, cyclic voltammetry, SEM and EDX studies. Electrochim. Acta 2008, 53, 2600–2609. [Google Scholar] [CrossRef]
- Nóvoa, X.R. Electrochemical aspects of the steel-concrete system. A review. J. Solid State Electrochem. 2016, 20, 2113–2125. [Google Scholar] [CrossRef]
- Mohana, K.N.; Badiea, A.M. Effect of sodium nitrite-borax blend on the corrosion rate of low carbon steel in industrial water medium. Corros. Sci. 2008, 50, 2939–2947. [Google Scholar] [CrossRef]
- Danaee, I.; Khomami, M.N.; Attar, A.A. Corrosion of AISI 4130 Steel Alloy under Hydrodynamic Condition in Ethylene Glycol + Water + NO2− Solution. J. Mater. Sci. Technol. 2013, 29, 89–96. [Google Scholar] [CrossRef]
- Hayyan, M.; Sameh, S.A.; Hayyan, A.; Alnashef, I.M. Utilizing of sodium nitrite as inhibitor for protection of carbon steel in salt solution. Int. J. Electrochem. Sci. 2012, 7, 6941–6950. [Google Scholar] [CrossRef]
- Joseph, G.; Perret, R. Inhibitor action on the corrosion of ion in salt-water solution. Corros. Sci. 1967, 7, 553–562. [Google Scholar] [CrossRef]
- Garces, P.; Saura, P.; Mendez, A.; Zornoza, E.; Andrade, C. Effect of nitrite in corrosion of reinforcing steel in neutral and acid solutions simulating the electrolytic environments of micropores of concrete in the propagation period. Corros. Sci. 2008, 50, 498–509. [Google Scholar] [CrossRef]
- Garces, P.; Saura, P.; Mendez, A.; Zornoza, E.; Andrade, C. Influence of pH on the nitrite corrosion inhibition of reinforcing steel in simulated concrete pore solution. Corros. Sci. 2011, 53, 3991–4000. [Google Scholar] [CrossRef]
- Valcarce, M.B.; Vázquez, M. Carbon steel passivity examined in alkaline solutions: The effect of chloride and nitrite ions. Electrochim. Acta 2008, 53, 5007–5015. [Google Scholar] [CrossRef]
- Saremi, M.; Mahallati, E. A study on chloride-induced dapassivation of mild steel in simulated concrete pore solution. Cem. Concr. Res. 2002, 32, 1915–1921. [Google Scholar] [CrossRef]
- Zhou, Y.; Zuo, Y. The inhibitive mechanisms of nitrite and molybdate anions on initiation and propagation of pitting corrosion for mild steel in chloride solution. Appl. Surf. Sci. 2015, 353, 924–932. [Google Scholar] [CrossRef]
- Kelley, F.A.; Mcwilliams, E.J. A bench test procedure for evaluating the cylinder liner pitting protection performance of engine coolant additives for heavy duty diesel engine applications. SAE Tech. Pap. Ser. 1996, 960879, 101–108. [Google Scholar]
- Steck, B.; Sommerfeld, G.; Schneider, V. Cavitation on Wet Cylinder Liners of Heavy Duty Diesel Engines. In Proceedings of the Commercial Vehicle Engineering Congress and Exhibition 2006, Chicago, IL, USA, 31 October–2 November 2006. [Google Scholar]
- Steck, B. Avoiding Cavitation on Wet Cylinder Liners of Heavy Duty Diesel Engines by Parameter Changes. In Proceedings of the Conference: SAE Brazil Congress and Exhibit 2008, Sao Paulo, Brazil, 7–9 October 2008. [Google Scholar]
- Liu, D.; Sun, N.; Zhu, G.; Cao, H.; Wang, T.; Li, G.; Gu, F. Modelling and evaluating piston slap-induced cavitation of cylinder liners in heavy-duty diesel engines. Eksploat. I Niezawodn. 2023, 25, 169644. [Google Scholar] [CrossRef]
- Ge, M.; Sun, C.; Zhang, G.; Coutire-Delgosha, O.; Fan, D. Combined suppression effects on hydrodynamic cavitation performance in Venturi-type reactor for process intensification. Ultrason. Sonochem. 2022, 86, 106035. [Google Scholar] [CrossRef]
- Wang, J.; Wang, Z.; Xu, Y.; Liu, H.; Yan, Y.; Zhang, J.; Li, S.; Ge, M. Analysis of the flow field characterization on the cavitation water jet applied to planar and curved surfaces. Phys. Fluids 2024, 36, 105172. [Google Scholar] [CrossRef]
- Wu, W.; Xu, Y.; Yan, Y.; Li, S.; Zhang, J.; Wang, Z. Investigation on The Flow Characteristics of Rotating Nozzle Cavitation Water Jet Flow Field. J. Appl. Fluid Mech. 2024, 17, 2637–2651. [Google Scholar]
- Luo, Y.; Zang, J.; Zheng, H. Flow Field and Gas Field Distribution of Non-Submerged Cavitation Water Jet Based on Dual-Nozzle with Concentric Configuration. Water 2023, 15, 2904. [Google Scholar] [CrossRef]
- Yin, T.; Pavesi, G. Several compressible computational fluid dynamics methods applied to transient sheet/cloud cavitation. Phys. Fluids 2025, 27, 023322. [Google Scholar] [CrossRef]
- Xia, D.; Zhang, H. 3D Numerical Simulation of the Cavitation Characteristics of Cooling-Water Flow of Cylinder Liners for Diesel Engines. J. Comput. Theor. Nanosci. 2011, 4, 2132–2136. [Google Scholar] [CrossRef]
- Liu, D.; Li, G.; Sun, N.; Zhu, G.; Cao, H.; Wasg, T.; Gu, F. Vibration-induced cavitation in cylinder liners caused by piston slaps. Int. J. Mech. Sci. 2024, 267, 109025. [Google Scholar] [CrossRef]
- Abreu, M.; Jonsson, S.; Elfsberg, J. Differences in ultrasonic cavitation damage between new and used engine coolants with varying time in operation. Wear 2024, 542, 205238. [Google Scholar] [CrossRef]
- ASTM G32-16; Standard Test Method for Cavitation Erosion Using Vibratory Apparatus. American Society for Testing and Materials International: West Conshohocken, PA, USA, 2021.
- Jur, T.A.; Middleton, J.I., Jr.; Yurko, A.A., III; Windham, R.L.; Grey, J.R., Jr. Case studies in graphitic corrosion of cast iron pipe. J. Fail. Anal. Prev. 2021, 21, 376–386. [Google Scholar] [CrossRef]
- Kim, K.T.; Kim, H.W.; Chang, H.Y.; Lim, B.T.; Park, H.B.; Kim, Y.S. Corrosion inhibiting mechanism of nitrite ion on the passivation of carbon steel and ductile cast iron for nuclear power plants. Adv. Mater. Sci. Eng. 2015, 1, 408138. [Google Scholar] [CrossRef]
- Kim, K.T.; Chang, H.Y.; Lim, B.T.; Park, H.B.; Kim, Y.S. New Mechanism on synergistic effect of nitrite and triethanolamine addition on the corrosion of ductile cast iron. Adv. Mater. Sci. Eng. 2016, 1, 4935602. [Google Scholar] [CrossRef]
- Khani, H.; Arefinia, R. Inhibition mechanism of nitrite on the corrosion of carbon steel in simulated cooling water systems. Mater. Corros. 2018, 69, 337–347. [Google Scholar] [CrossRef]
- Lee, D.Y.; Kim, W.C.; Kim, J.G. Effect of nitrite concentration on the corrosion behavior of carbon steel pipelines in synthetic tap water. Corros. Sci. 2012, 64, 105–114. [Google Scholar] [CrossRef]
- Pyke, R.; Cohen, M. Rate of Breakdown and Mechanism of Nitrite Inhibition of Steel Corrosion. J. Electrochem. Soc. 1948, 93, 63–78. [Google Scholar] [CrossRef]
- Al-Refaie, A.A.; Walton, J.; Cottis, R.A.; Lindsay, R. Photoelectron spectroscopy study of the inhibition of mild steel corrosion by molybdate and nitrite anions. Corros. Sci. 2010, 52, 422–428. [Google Scholar] [CrossRef]
- Reffass, M.; Sabot, R.; Jeannin, M.; Berziou, C.; Refait, P. Effects of NO2− Ions on localized corrosion of steel in NaHCO3 + NaCl electrolytes. Electrochim. Acta 2007, 52, 7599–7606. [Google Scholar] [CrossRef]
- Sideris, K.K.; Savva, A.E. Durability of mixtures containing calcium nitrite based corrosion inhibitor. Cem. Concr. Compos. 2005, 27, 277–287. [Google Scholar] [CrossRef]
- Galic, K.; Pavic, M.; Cikovic, N. The effect of inhibitors on the corrosion of tin in sodium chloride solution. Corros. Sci. 1994, 36, 785–795. [Google Scholar] [CrossRef]
- Kwok, C.T.; Cheng, F.T.; Man, H.C. Synergistic effect of cavitation erosion and corrosion of various engineering alloys in 3.5% NaCl solution. Mater. Sci. Eng. A 2000, 290, 145–154. [Google Scholar] [CrossRef]
- Tomlinson, W.J.; Talks, M.G. Erosion and corrosion of cast iron under cavitation conditions. Tribol. Int. 1991, 24, 67–75. [Google Scholar] [CrossRef]
- Gouda, V.K.; Ai-Hashem, A.H.; Abdullah, A.M.; Riad, W.T. Effect of ultrasonically induced cavitation on behaviour of nodular cast iron in sea water. Br. Corros. J. 1991, 26, 109–116. [Google Scholar] [CrossRef]
- Basumatary, J.; Nie, M.; Wood, R.J.K. The synergistic effects of cavitation erosion–corrosion in ship propeller materials. J. Bio-Tribo-Corros. 2015, 1, 12. [Google Scholar] [CrossRef]
- Basumatary, J.; Wood, R.J.K. Synergistic effects of cavitation erosion and corrosion for nickel aluminium bronze with oxide film in 3.5% NaCl solution. Wear 2017, 376, 1286–1297. [Google Scholar] [CrossRef]
- Al-Hashem, A.; Abdullah, A.; Riad, W. Cavitation corrosion of nodular cast iron (NCI) in seawater: Microstructural effects. Mater. Charact. 2001, 47, 383–388. [Google Scholar] [CrossRef]
- Hattori, S.; Kitagawa, T. Analysis of cavitation erosion resistance of cast iron and nonferrous metals based on database and comparison with carbon steel data. Wear 2010, 269, 443–448. [Google Scholar] [CrossRef]
- Hammitt, F.G. Cavitation and Multiphase Flow Phenomena; McGraw-Hill: New York, NY, USA, 1980. [Google Scholar]
- Mitelea, I.; Bordeaşu, I.; Pelle, M.; Crăciunescu, C. Ultrasonic cavitation erosion of nodular cast iron with ferrite–pearlite microstructure. Ultrason. Sonochem. 2015, 23, 385–390. [Google Scholar] [CrossRef]
- Park, I.C.; Kim, S.J. Cavitation erosion characteristics of hard chromium plated diesel engine cylinder liner. Trans. IMF 2022, 100, 189–192. [Google Scholar] [CrossRef]
Disclaimer/Publisher’s Note: The statements, opinions and data contained in all publications are solely those of the individual author(s) and contributor(s) and not of MDPI and/or the editor(s). MDPI and/or the editor(s) disclaim responsibility for any injury to people or property resulting from any ideas, methods, instructions or products referred to in the content. |
© 2025 by the authors. Licensee MDPI, Basel, Switzerland. This article is an open access article distributed under the terms and conditions of the Creative Commons Attribution (CC BY) license (https://creativecommons.org/licenses/by/4.0/).