Article

Telemedicine Queuing System Study: Integrating Queuing Theory, Artificial Neural Networks (ANNs) and Particle Swarm Optimization (PSO)

Department of Mechanical and Industrial Engineering Technology, University of Johannesburg, Johannesburg 2028, South Africa
*
Author to whom correspondence should be addressed.
Appl. Sci. 2025, 15(11), 6349; https://doi.org/10.3390/app15116349
Submission received: 27 April 2025 / Revised: 27 May 2025 / Accepted: 2 June 2025 / Published: 5 June 2025

Abstract

Telemedicine has emerged as a vital tool for expanding healthcare access, particularly in underserved areas, yet its effectiveness is often hindered by inefficient queuing systems, fluctuating patient demand, and limited resources. This study addresses these challenges by developing a hybrid Artificial Neural Network–Particle Swarm Optimization (ANN-PSO) model aimed at improving the performance of telemedicine queuing systems. A simulation-based dataset was generated to represent patient arrivals, service rates, and queuing behaviors. An ANN was trained to predict key performance metrics, including queue intensity, system utilization, and delays. To further enhance the model’s predictive capabilities, PSO was applied to optimize critical ANN parameters, such as neuron count, swarm size, and acceleration factors. The optimized ANN-PSO model achieved high predictive accuracy, with correlation coefficients (R2) consistently exceeding 0.90 and low mean squared errors across most outputs. The findings show that optimal parameter configurations vary depending on the specific performance metric, reinforcing the value of adaptive optimization. The results confirm the ANN-PSO model’s ability to accurately predict queuing behavior and optimize system performance, providing a practical decision-support tool for telemedicine administrators to dynamically manage patient flow, reduce waiting times, and enhance resource utilization under variable demand conditions.

1. Introduction

The global telemedicine market is expanding rapidly due to the increasing demand for accessible and efficient healthcare services [1]. Telemedicine has played a crucial role in overcoming geographic and physical barriers to healthcare, particularly benefiting patients in rural and underserved areas. By facilitating remote consultations, it reduces the need for long-distance travel and minimizes in-person waiting times, while also improving healthcare access for vulnerable populations such as the elderly and people with disabilities. Additionally, telemedicine increases operational efficiency by allowing healthcare providers to serve more patients without the need for physical travel.
Despite these advantages, the growing reliance on telemedicine platforms has introduced new operational challenges. Patient inflow is often highly variable, and traditional queuing models struggle to adapt to such fluctuations, leading to increased delays, system congestion, and inefficient resource utilization [2,3]. This has created a pressing need for intelligent, data-driven systems capable of supporting real-time queue management and resource allocation.
In response to this challenge, this study proposes a hybrid ANN-PSO model designed to improve telemedicine queuing system performance. ANN models offer robust predictive capabilities, while PSO enhances these models by optimizing their parameter configurations, resulting in better generalization and more accurate queue predictions. The ANN-PSO model dynamically adapts to variations in patient demand, helping administrators anticipate service bottlenecks and optimize resource utilization.
The recent literature has demonstrated the effectiveness of ANN-PSO models in healthcare applications, outperforming traditional ANN models and classical queuing theory approaches in terms of prediction accuracy, adaptability, and computational efficiency [4,5,6]. By continuously updating its predictions using real-time data, the ANN-PSO model offers a scalable and flexible solution applicable to both small-scale and large-scale telemedicine systems.
The novelty of this study lies not in the introduction of the ANN-PSO algorithm itself, but in its targeted application to the M/M/s/N queuing system for telemedicine environments. Specifically, the research contributes by (1) identifying optimal ANN-PSO configurations for multiple output performance metrics, (2) employing a queuing simulation-based data generation approach using Revoledu, and (3) applying the model to a complex telemedicine queuing framework that is underexplored in prior work.
This research aims to enhance the performance of telemedicine queuing systems by reducing patient waiting times, optimizing server utilization, and improving the overall quality of virtual healthcare services. The proposed model serves as a valuable decision-support tool, empowering telemedicine administrators to manage patient flow effectively, adapt to fluctuating demand, and ensure timely and efficient service delivery.
The objectives of the study are as follows:
  • To simulate telemedicine queuing scenarios and generate data for modeling system behavior.
  • To train an ANN model using simulated data to predict key performance indicators such as queue intensity, utilization, and delays.
  • To optimize the ANN model using PSO in order to identify the best parameter configurations for improving queuing system performance.
In telemedicine, queue management presents a significant challenge as it directly influences service efficiency, resource utilization and patient satisfaction. The increasing reliance on telemedicine platforms has created a demand for efficient queuing mechanisms that can dynamically adapt to variations in patient inflow and service rates. Traditional queuing models, such as Markovian processes and queueing theory-based approaches, often operate on fixed assumptions regarding arrival rates and service times, which makes them ineffective in real-time applications. ANNs, when optimized using PSO, provide a more robust and adaptive solution by enabling real-time predictions of queue congestion, patient waiting times and system load distribution [5]. A significant drawback of conventional ANN training techniques, like backpropagation (BP), is their dependence on gradient-based optimization. This method frequently leads to gradual convergence and vulnerability to the local minimum, which impairs the ANN’s capacity to generalize efficiently. By contrast, PSO leverages a population-based search strategy that enables ANN models to continuously refine their weight parameters and improve predictive accuracy over multiple iterations. This hybrid ANN-PSO approach enhances queue estimation while facilitating dynamic decision-making in resource allocation, ensuring that telemedicine services can adapt to fluctuating patient demand [4].
This approach allows ANN-PSO models to optimize their weights iteratively, enabling them to make accurate queue predictions while dynamically adapting to changes in patient arrival patterns. Studies have demonstrated that ANN-PSO models outperform conventional ANN models trained using backpropagation in terms of both accuracy and computational efficiency. For example, Yadav [4] applied ANN-PSO in medical queue prediction, reporting a 24% reduction in prediction errors compared to traditional queuing models. Beyond improving queue prediction, the ANN-PSO framework also enhances decision-making in telemedicine by optimizing server allocation. Traditional queuing models often operate under fixed assumptions about the number of servers required for optimal performance, whereas ANN-PSO can dynamically allocate resources based on real-time demand. In this regard, by continuously monitoring patient influx and adjusting the number of active servers, ANN-PSO minimizes patient waiting times and ensures efficient resource utilization [5].
In support of this, Adhicandra et al. [7] proposed the integration of reinforcement learning with priority queuing algorithms for emergency healthcare services. Their model, tested in real hospital environments, demonstrated a 50% reduction in emergency waiting times and improved patient satisfaction, highlighting the viability of intelligent queue optimization in healthcare.
Additionally, Yousif et al. [8] employed deep reinforcement learning with the RED algorithm for active queue management in networks, showing that dynamic adaptations could effectively stabilize queues and minimize delay—concepts applicable to telemedicine systems.
Moreover, Ngorsed and Suesaowaluk [9] introduced a web-based queue system for non-tertiary hospitals in Nigeria, successfully reducing crowding and improving service delivery during the COVID-19 pandemic. Their model, based on Poisson distribution and Little’s Law, validates the practical use of queuing theory in healthcare management.
Perdana et al. [10] implemented a QR-code-based hospital check-in system to streamline queue verification and administration, which significantly improved operational efficiency. These examples reinforce the growing role of digital technologies in modern queue management systems.
The combination of Markov Chains and ANNs has also been explored in traffic prediction models by Olayode et al. [11], who concluded that ANN outperformed Markov Chain models for predicting dynamic traffic flows—an analogy applicable to patient inflow in healthcare. In a follow-up study, Olayode et al. [12] applied ANN-PSO to traffic flow modeling, achieving over 98% accuracy. Their findings underscore the model’s strength in dynamic, real-world environments and affirm its relevance for telemedicine queuing systems. Tarekegn Nigatu et al. [13] further contributed by mathematically analyzing PSO convergence behaviors and demonstrating how constriction factors improve global search efficiency, supporting the theoretical soundness of PSO-enhanced ANN training.
Furthermore, one of the most significant advantages of the ANN-PSO approach is its ability to adapt to real-time data streams, a crucial feature in telemedicine environments where patient arrival patterns and service durations can fluctuate unpredictably. Unlike traditional queuing models that rely on historical data, ANN-PSO continuously updates its predictive model using the latest available information, which makes it particularly effective for large-scale telehealth operations [14].
The scalability of ANN-PSO further enhances its applicability in telemedicine. Whether deployed in small clinics or large-scale hospital networks, ANN-PSO can optimize telemedicine service delivery by fine-tuning queue management parameters to meet specific operational needs [15]. Moreover, through leveraging PSO’s ability to explore and exploit different weight configurations, ANN-PSO ensures that telemedicine platforms operate with maximum efficiency [16]. Additionally, PSO’s stochastic search mechanism allows ANN-PSO models to avoid the common pitfalls of traditional optimization algorithms, such as premature convergence to suboptimal solutions. This ensures that ANN-PSO maintains a high level of predictive accuracy even in complex, multi-modal optimization landscapes. Studies have shown that PSO-driven ANN models exhibit faster convergence rates compared to traditional backpropagation-based models, which make them ideal for real-time decision-making in healthcare applications [5]. In view of this, the hybrid ANN-PSO method signifies notable progress in telemedicine queue optimization. Integrating the forecasting abilities of ANNs with the global search effectiveness of PSO, this system allows for the precise, adaptive and efficient management of telemedicine queues. The capacity of ANN-PSO to perpetually enhance its predictions using real-time data guarantees optimal resource distribution, shorter patient waiting times and better service delivery in various healthcare environments. With the ongoing growth of telemedicine, the incorporation of ANN-PSO models into queue management systems is likely to significantly improve healthcare accessibility and efficiency [17].
ANNs enhanced through PSO have shown substantial advancements in healthcare processes, especially in managing queues and optimizing patient services. Several studies have offered empirical proof of the effectiveness of ANN-PSO models in improving queue prediction precision, resource distribution and system efficiency in healthcare environments. Alam et al. [5] reported that ANN-PSO models significantly outperformed conventional queue prediction techniques in terms of both accuracy and computational efficiency. This has enabled healthcare administrators to better anticipate patient flow and optimize resource distribution [16]. In emergency care settings, where patient arrival rates and service times are highly unpredictable, ANN-PSO has been particularly effective. Yadav [4] implemented ANN-PSO models in emergency room queue management and observed a 24% reduction in queue prediction errors compared to traditional machine learning approaches. The ability of ANN-PSO to rapidly adapt to dynamic queue conditions makes it an essential tool for improving emergency response times and minimizing patient wait times [16].
The application of ANN-PSO is not limited to emergency departments but extends to telemedicine platforms, where it has proven instrumental in optimizing virtual healthcare services. Zychlinski [6] proposed an ANN-PSO-based multi-server queue management system for telemedicine which demonstrated improved system utilization and reduced patient backlog. The study showed that ANN-PSO’s adaptive learning capability enables continuous adjustments in queue predictions based on real-time patient arrival patterns. This helps to ensure optimal resource allocation and enhanced service efficiency [16]. One of the primary reasons for the superior performance of ANN-PSO in healthcare settings is its ability to mitigate the limitations of traditional queuing models. Conventional queuing models, including Markovian processes and Poisson distributions, typically depend on rigid assumptions regarding arrival and service rates, which fail to reflect the fluctuations of patient influx in actual situations. ANN-PSO, conversely, adjusts its parameters in real time according to live data, which enables healthcare systems to stay flexible and adaptable to evolving circumstances [16].
Beyond queue management, ANN-PSO has also been utilized in diagnostic and monitoring applications. In telemedicine, ANN-PSO models have been integrated with IoT-based cloud networks to enhance the efficiency of remote patient monitoring. For example, a study by Goyal et al. [16] introduced an improved PSO approach for physiological sensor data fusion in IoT healthcare frameworks. This model improved EEG-based epilepsy diagnosis by optimizing the propagation of neural networks, which achieved a 4.6% improvement in execution time compared to Genetic Algorithm-based models [16]. Recent studies further underscore ANN-PSO’s suitability for telemedicine applications.
Mondal, Nandi & Jana [18] demonstrated that ANN-PSO accelerates neural network training, enabling telemedicine systems to make rapid adjustments for service optimization and thereby greatly enhancing system scalability and adaptability in large-scale deployments. Goyal et al. [16] confirmed that, compared to traditional backpropagation methods, ANN-PSO achieves faster convergence rates while maintaining high prediction accuracy, a critical advantage for real-time telemedicine platforms.
Moreover, ANN-PSO’s integration with IoT devices supports continuous remote patient tracking and predictive health analytics, facilitating early identification of potential health issues in chronic disease management [19]. For instance, in remote cardiovascular risk assessment and diabetes-monitoring systems, ANN-PSO-enhanced models delivered more reliable prognosis due to their ability to process and learn from high-frequency data streams [16].
ANN-PSO also excels in multi-modal optimization tasks—leveraging a population-based search to navigate complex, non-differentiable solution spaces—making it ideal for balancing competing telemedicine objectives (e.g., minimizing patient wait times, optimizing resource use, and maximizing service quality) without the need for gradient information. Finally, by reducing computational overhead and enabling lightweight model updates, ANN-PSO allows cloud-based telemedicine platforms to sustain uninterrupted service during peaks in demand, delivering cost-effective, scalable solutions without performance degradation [16].

2. Materials and Methods

This study employs the M/M/s/N queuing model, widely used to analyze and optimize systems characterized by random customer arrivals and service requirements, such as telecommunications networks, computer systems, and customer service centers [20]. The M/M/s/N queuing model is an extension of the classical M/M/s model, incorporating a finite system capacity (N). It is particularly useful for analyzing service systems where waiting space is limited, and customers may be denied entry if the system reaches its maximum capacity.
The applicability of the M/M/s/N model to telemedicine is grounded in its alignment with core operational characteristics: in telemedicine platforms, patient consultation requests occur randomly, akin to a Poisson arrival process, and consultation durations vary, modeled effectively by exponential service times [21]. The parameters represent the number of available doctors conducting remote consultations in parallel, while N reflects real-world capacity constraints such as platform session limits, clinician availability, and bandwidth restrictions. These dynamics mirror the M/M/s/N model’s treatment of arrivals blocked when capacity is reached.
The assumptions used in the M/M/s/N queuing model were adopted based on its suitability for modeling stochastic systems like telemedicine, where arrival and service rates are random. These assumptions (Poisson arrivals, exponential service times, finite capacity, multiple servers) reflect the unpredictable and time-sensitive nature of patient requests in telemedicine, aligning well with real-world dynamics.
This model consists of four key elements:
  • Arrival rate (number of customers/unit time), λ.
The arrival process follows a Poisson distribution with an average arrival rate; this means arrivals are random and independent of each other, making the interarrival times exponentially distributed.
In the context of telemedicine, this reflects real-world patient demand, where consultations are requested unpredictably.
  • Service rate (number of customers/unit time), μ.
The service process follows an exponential distribution with an average service rate, μ; this assumes that shorter service times occur more frequently than longer ones, which aligns with real-life consultations, where some cases require minimal interaction while others need extended discussions.
  • Number of servers (s).
The model includes parallel servers, representing the number of healthcare providers available for telemedicine consultations.
Each patient, upon arrival, will be immediately assigned to an available provider if one is free. If all providers are busy, the patient will either wait in a queue or be rejected, depending on system capacity.
  • Capacity of the system (N).
Unlike the standard M/M/s model (which assumes an infinite queue), M/M/s/N introduces a finite limit (N) on the number of patients that can be in the system (including those waiting and being served).
If a new patient arrives when the system is already at full capacity (N patients present), they are blocked and denied service.
This is critical in telemedicine, where platform limitations, provider availability, or technological constraints may cap the number of simultaneous consultations.
Additionally, the maximum queue size = N − s [20].
To understand system efficiency, the M/M/s/N model allows for the evaluation of several key performance indicators [20]:
1.
Utilization factor (U).
The utilization factor represents the percentage of time that all servers are busy, given by the following:
U = L L q s
where
  • U is the utilization factor;
  • L is the average number of customers in the system (both waiting and being served);
  • L q is the average number of customers waiting in line for service;
  • s is the number of service providers (servers).
2.
Probability of an empty system (P0).
The probability that there are no customers in the system is given by the following:
P 0 = ( 1 + i = 1 s ρ i i !   ρ s s !   j = s + 1 N ( ρ s ) j s ) 1
where
  • P0 is the probability that there are no customers in the system;
  • ρ is the traffic intensity, defined as ρ = λ μ ;
  • λ is the arrival rate of customers;
  • µ is the service rate per server;
  • s is the number of servers;
  • N is the maximum system capacity (including waiting and service).
3.
Probability of n customers in the system (Pn).
The probability of having exactly n customers in the system is given by the following:
Pn = ρ n n !   P 0 i f   1 n s     ρ n s ! s n s   P 0 i f   s + 1 n N 0 i f   n > N  
where
  • Pn is the probability of having exactly n customers in the system.
4.
Average waiting time in the queue (Wq).
The average time a customer spends in the waiting line waiting for a service is given by the following:
Wq = L q λ ( 1 P n )
where
  • Wq is the average waiting time in the queue;
  • L q is the average number of customers in the waiting line;
  • λ is the arrival rate of customers;
  • Pn is the probability that the system is full.
5.
Average time spent in the system (W).
The average time a customer spends in the system (including waiting and service time) is given by the following:
W = Wq + 1 μ
where
  • W is the average time a customer spends in the system;
  • Wq is the average time spent waiting in the queue;
  • µ is the average service rate per server.
6.
Average number of customers waiting in line for a service (Lq).
The average number of customers waiting for a service is given by the following:
Lq = n N ( n s ) P n
where
  • Lq is the average number of customers in the waiting line;
  • P n is the probability of having exactly n customers in the system.
7.
Average number of customers in the system (L).
The total number of customers present in the system, including those waiting and being served, is given by the following:
L = n = 0 N n P n
where
  • L is the average number of customers in the system (waiting and being served);
  • P n is the probability of having exactly n customers in the system.
The data generated was organized in Microsoft Excel, detailing both input parameters and output performance metrics, including queue intensity, system utilization, queue length, delays, and the probability of an idled server. This data was then imported into MATLAB 2018 for ANN model development.
In an ANN-PSO model, the PSO algorithm optimizes ANN weights and biases by iteratively refining the network parameters based on minimizing the prediction error. Mathematically, the velocity and position of each particle are updated using the following equations [22]:
V p , q k + 1 = ω . V p , k + c 1 r 1 P b e s t p , q k X p , q k + c 2 r 2 G b e s t p k X p , q k
X p , q k + 1 = X p , q k + V p , q k + 1
where
  • V p , q k + 1 represents the velocity update of a particle in the search space;
  • X p , q k + 1 represents the updated position (ANN weight/bias);
  • ω is the inertia factor controlling exploration vs. exploitation;
  • c 1 , c 2 are acceleration coefficients influencing cognitive (Pbest) and social (Gbest) learning;
  • r 1 , r 2 are the random values between 0 and 1 ensuring stochastic behavior.
As such, by iteratively updating ANN weights and biases using PSO, the model converges to an optimal configuration that minimizes queue-related prediction errors in telemedicine systems [4,23,
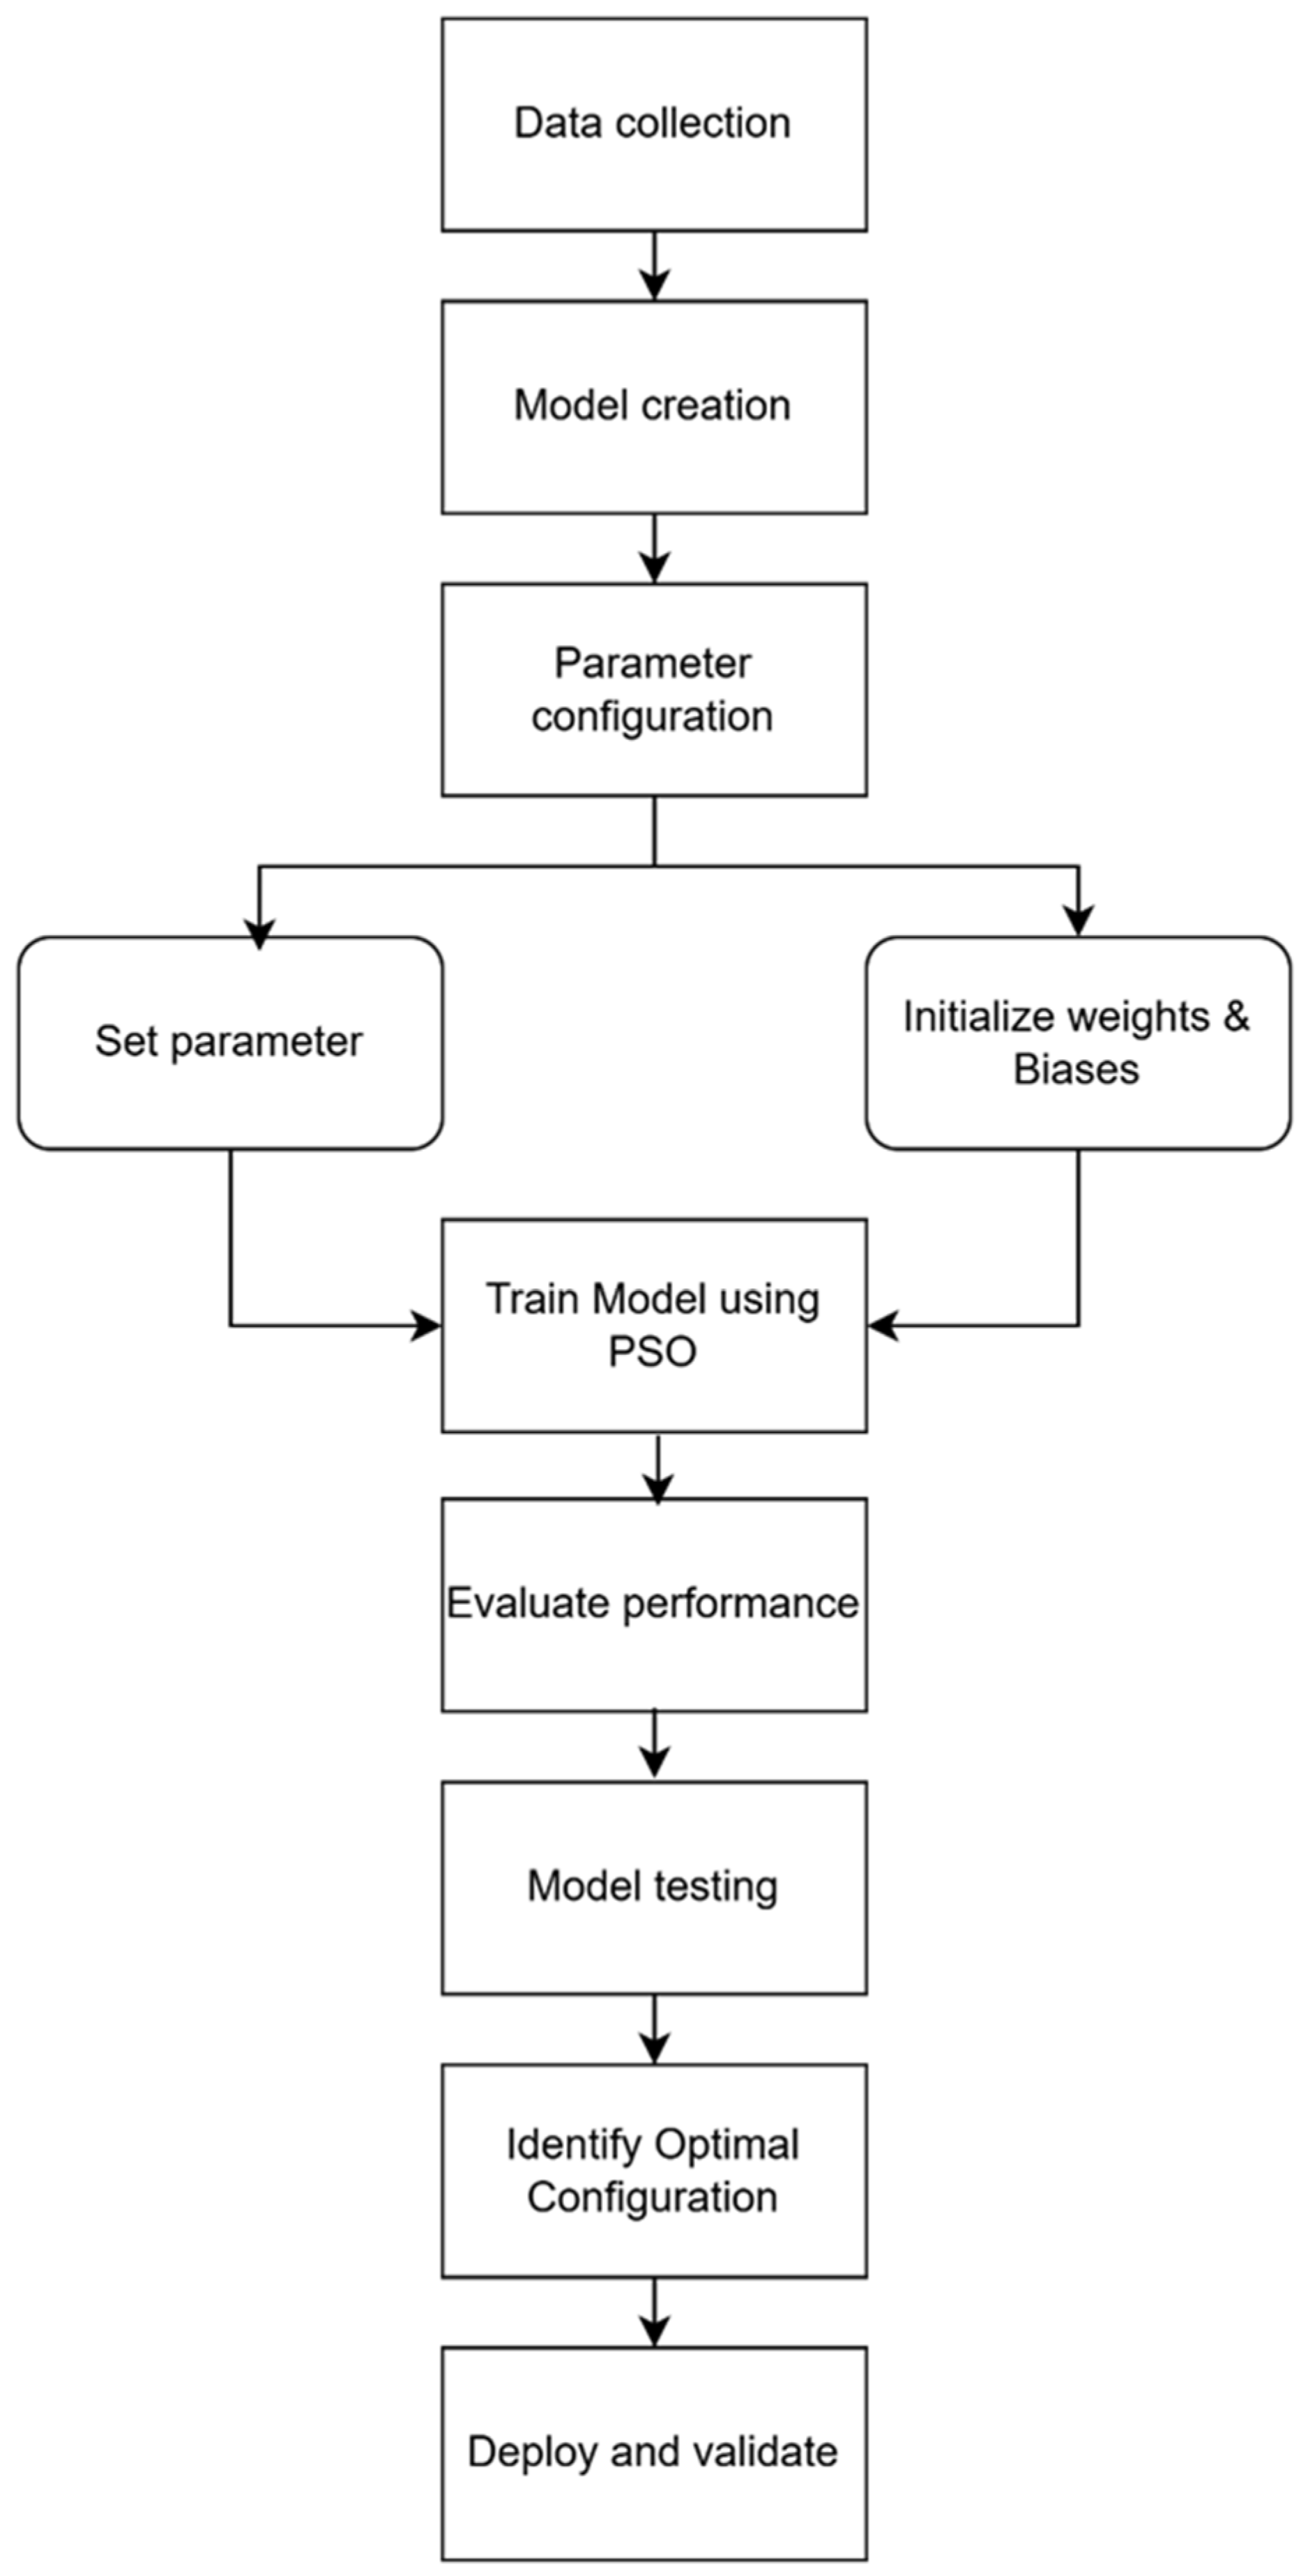
24]. The process involves the following steps:
  • Data Collection: The dataset is collected and pre-processed to ensure it is properly structured for effective model training. Input and output parameters are carefully prepared, ensuring that relevant data is available for accurate predictions.
    Data for this study was generated using the Revoledu online queuing calculator, a web-based tool designed to simulate and evaluate queuing system performance [20]. This tool enables users to input key parameters—including arrival rate (λ), service rate (μ), system capacity (N), and number of servers (s)—to compute queuing metrics such as queue length, utilization, and delays for different queuing models. For this study, the M/M/s/N model was selected to simulate a telemedicine queuing system using a scenario-based approach.
    To ensure variability and robustness in training the predictive models, input values were randomly generated within the following predefined ranges supported by the Revoledu simulator:
    • Arrival rate (λ): 600 to 1000;
    • Service rate (μ): 100 to 200;
    • System capacity (N): 35 to 75;
    • Number of servers (s): 11 to 19.
    A total of 100 unique simulation scenarios were produced using a uniform random sampling strategy across these ranges (as detailed in Appendix A). To ensure reproducibility, a fixed random seed (rng default) was applied during data processing in MATLAB. These datasets were subsequently used for training and optimizing the ANN-PSO models.
The data generated was organized in Microsoft Excel, detailing both input parameters and output performance metrics, including queue intensity, system utilization, queue length, delays, and the probability of an idled server. This data was then imported into MATLAB for models’ development.
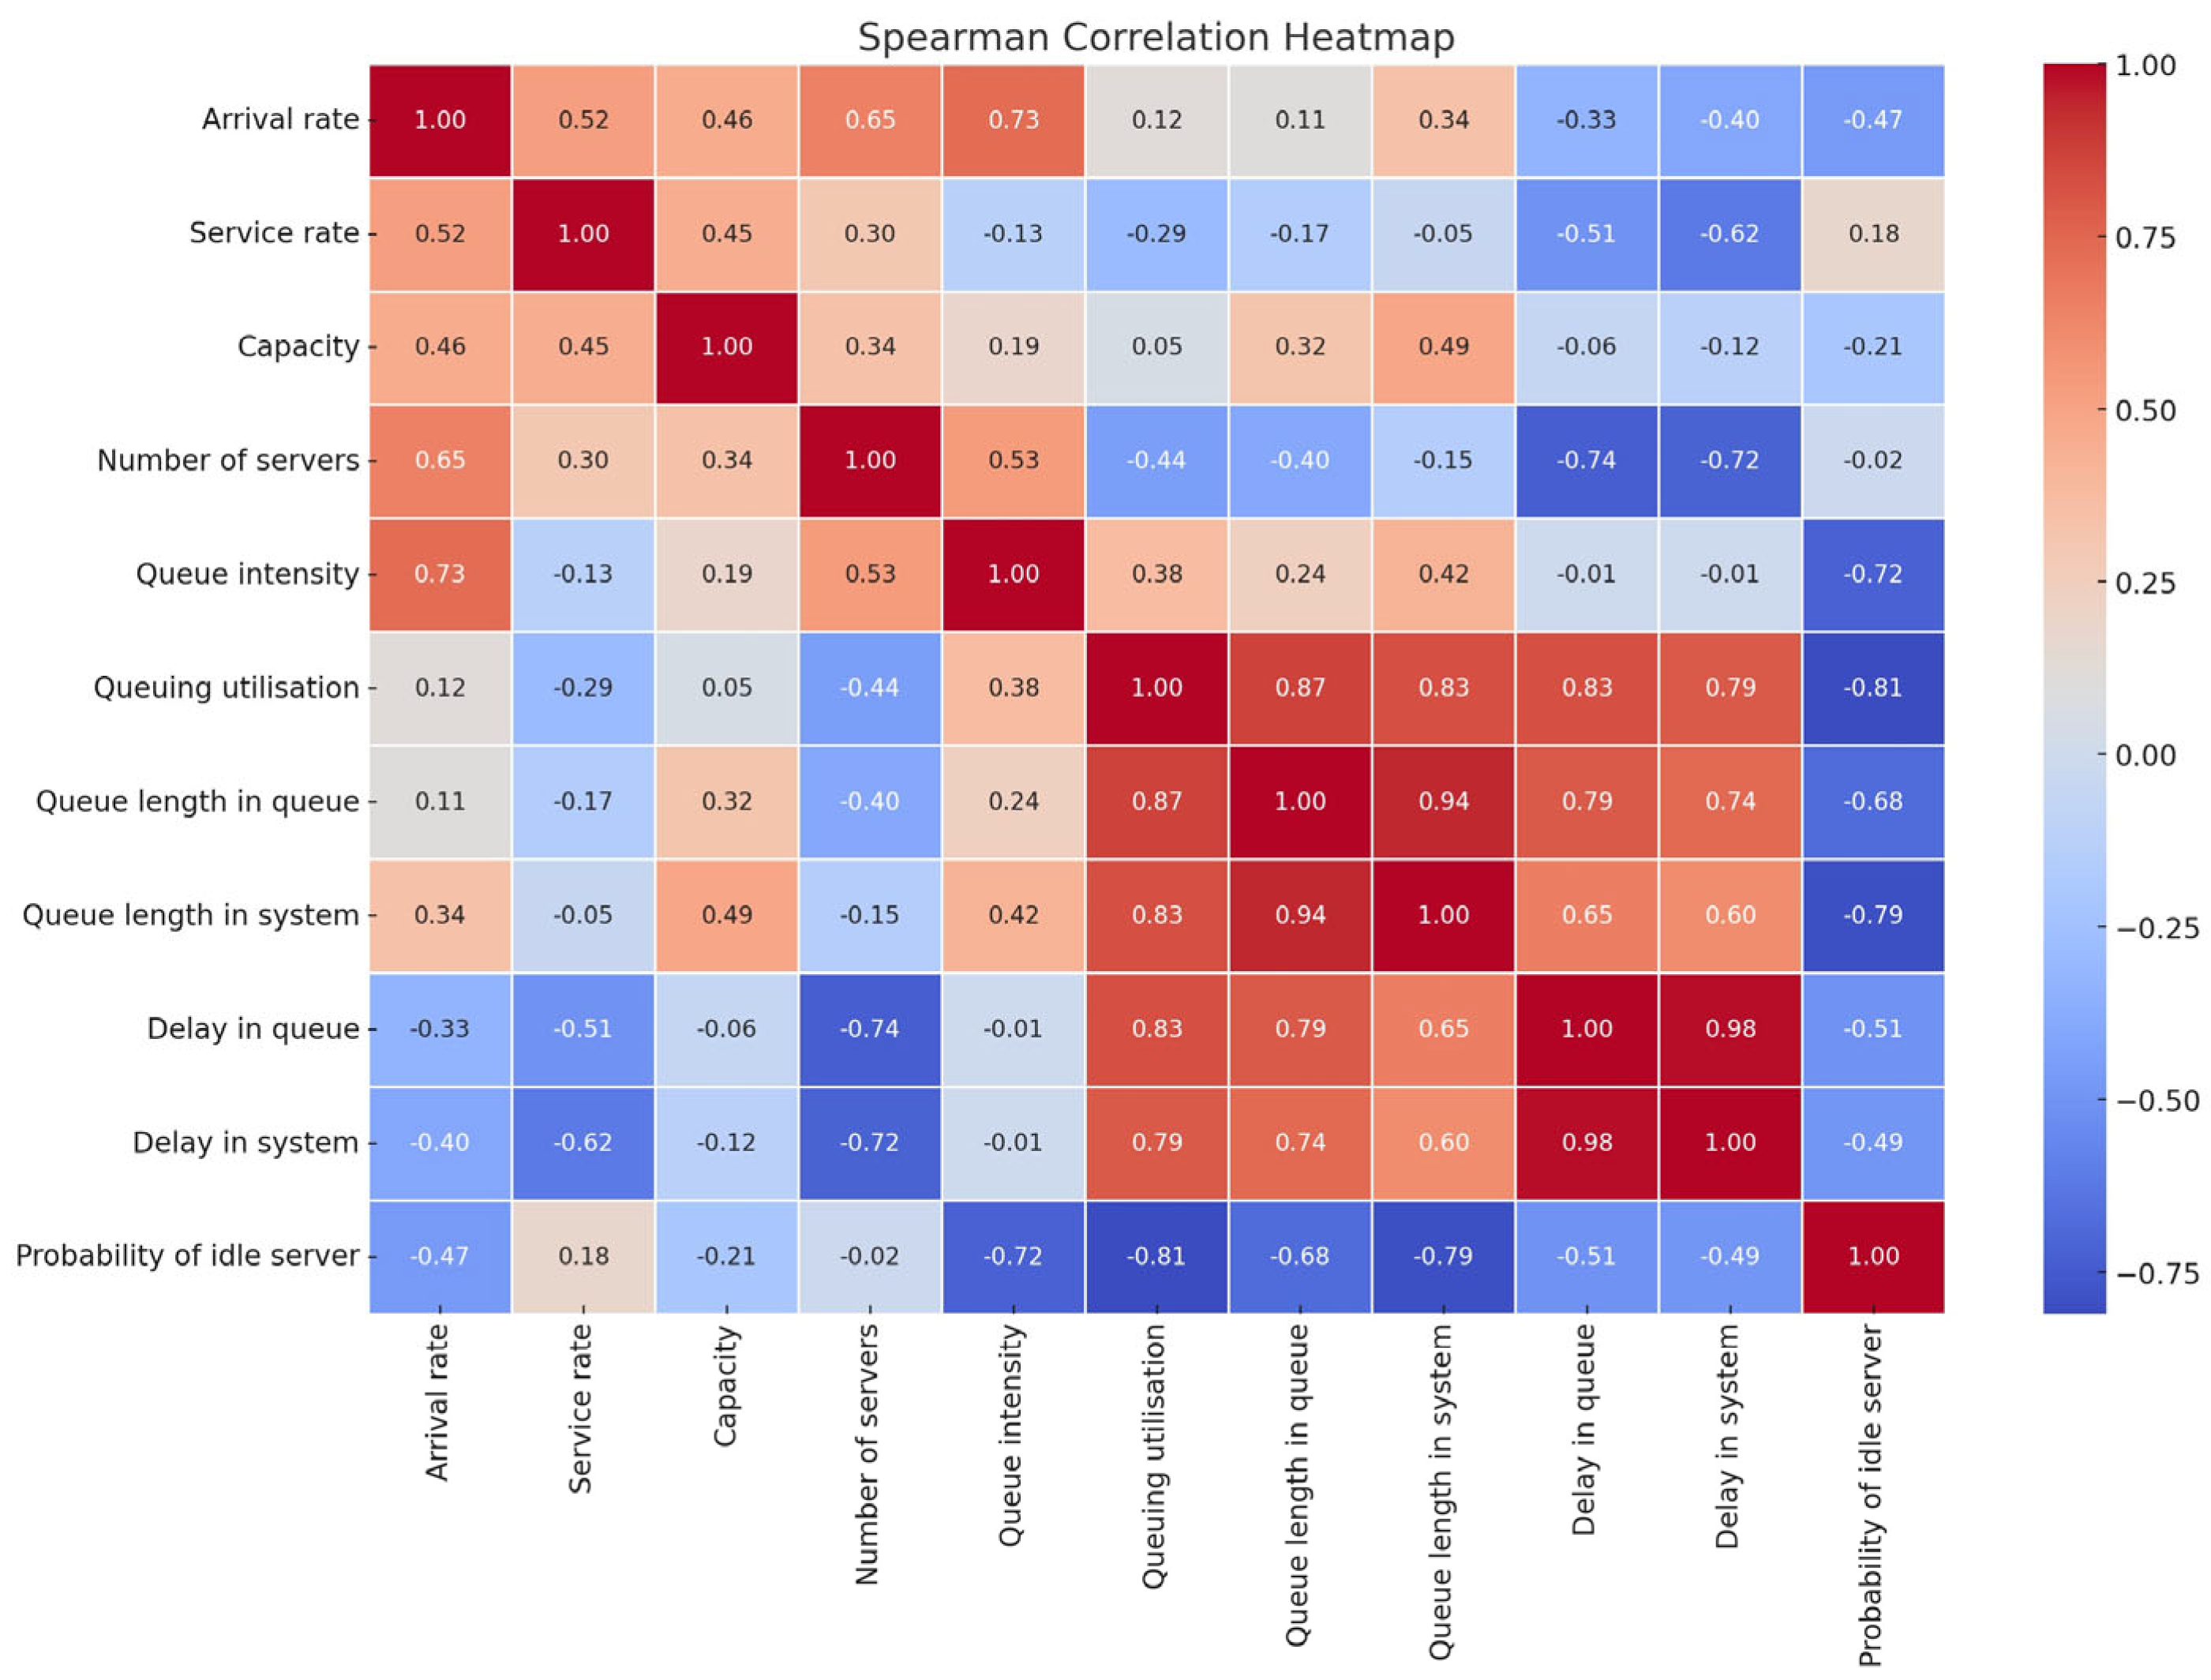
To assess the relationships between input and output variables in the 100 generated telemedicine queuing scenarios, a Spearman correlation analysis was performed. The Spearman correlation between inputs and outputs are summarized in Table 1.
This non-parametric test reveals monotonic relationships. The arrival rate is positively correlated with queue intensity (0.55) and queue length in the system (0.22). However, it is negatively correlated with delay in the queue/system and idle probability, suggesting that the presence of more arrivals reduces the idle time and increases congestion. The service rate has a strong negative correlation with delay in the system (−0.47) and delay in the queue (−0.37), indicating that faster service reduces the wait time. But it has a slight positive effect on the idle probability (0.13). The capacity positively affects the queue length and system size, possibly due to the accommodation of more patients. It has a minimal correlation with other outputs. The number of servers is negatively correlated with delay in the queue/system (−0.57/−0.55), confirming that more servers reduce wait time. It is negatively correlated with queuing utilization (−0.32), reflecting distributed load.
The heatmap in Figure 1 reveals strong positive correlations between arrival rate and most performance indicators such as queue intensity (ρ = 0.93), queue length in the system (ρ = 0.91), and delay in the queue (ρ = 0.84), indicating that higher arrival rates significantly intensify system congestion. Conversely, the probability of idle servers shows a moderate to strong negative correlation with input variables, particularly with arrival rate (ρ = −0.73) and queue intensity (ρ = −0.70), suggesting reduced idleness as the system load increases. These non-linear, monotonic relationships confirm that the results are not trivially explained by linear regression alone and validate the complexity and variability inherent in the system dynamics. The presented analysis supports the robustness of the scenario design and highlights the need for advanced modeling approaches beyond simple regression.
2.
Model Creation: The ANN model was defined in MATLAB, specifying the input and output layers. This step established the fundamental structure of the network, ensuring compatibility with the optimization process. The dataset was split into training (70%), validation (15%), and testing (15%) subsets. For ANN-PSO optimization, a 90% training and 10% testing split was adopted to allow the swarm to better explore the search space during fitness evaluation.
3.
Parameter Configuration:
  • We then set the parameters for the network as follows:
    The number of neurons in the hidden layer was set within the range of 5 to 10 to determine the optimal network complexity. This range was selected based on previous empirical studies and is consistent with the recommendations of Momeni et al. [25], which suggest limiting the neuron count to avoid overfitting while maintaining sufficient model capacity.
    The swarm population size was defined based on exploratory testing, ranging between 10 and 400, to enhance optimization effectiveness. Smaller swarm sizes (e.g., 10–50) facilitate faster convergence and lower computation time, while larger swarms (e.g., 200–400) enable broader exploration of the solution space for more complex outputs.
    Acceleration factors (C1 and C2) were adjusted to balance global and local search capabilities, improving convergence. These factors were tested within the range of 1.0 to 3.0 (C1 1–2,5 and C2 2–3), aligning with best practices to maintain a balance between cognitive (individual learning) and social (group learning) influences in PSO search dynamics, as suggested by Talukder [26].
    The maximum number of iterations is set to 1000, determined through convergence analysis and stabilization of results. This upper limit was chosen to allow a sufficient search depth without incurring excessive computational overhead.
Hyperparameter tuning was conducted using a sensitivity analysis approach, as recommended by Momeni et al. [25], who emphasize the importance of optimizing PSO parameters such as the number of neurons (n), swarm size (N), and acceleration coefficients (C1 and C2). Multiple runs and parameter combinations were tested to identify the most effective settings for the ANN-PSO model and ensure a well-optimized network. The table used with their proposed parameter values is in the next section of this work (Table 2).
This structured experimentation involved 36 trial configurations, each assessed using key performance indicators—Mean Square Error (MSE) and R-squared (R2)—across different queuing outputs (e.g., delay, queue length, utilization). Optimal settings varied per metric, affirming the need for metric-specific tuning.
  • Initialize Weights and Biases: This study started with random initial values, allowing the optimization process to efficiently explore the parameter space and identify the best configuration. To ensure reproducibility, MATLAB’s ‘rng default’ function was applied prior to data splitting and model training.
4.
Train Network Using PSO: The model was trained in MATLAB using Particle Swarm Optimization (PSO), where parameters are iteratively adjusted to minimize the error function. Random initial values were assigned to facilitate optimal exploration and convergence during training.
5.
Evaluate Performance: 
  • The trained model was assessed using regression (R2) and error metrics (MSE) to evaluate its predictive accuracy.
  • Performance metrics for different configurations were recorded and analyzed to determine the effectiveness of the model.
6.
Model Testing: The trained network was tested using unseen test data within the defined parameter range to verify its generalization ability and evaluate how well it performs in real-world scenarios.
7.
Identify Optimal Configuration: The model configuration that achieves the highest R2 and lowest MSE was selected as the best-performing setup. This ensured that the network provided the most reliable predictions.
Figure 2 shows the methodology employed to integrate ANN with PSO to optimize the queuing system model.
8.
Deploy and Validate: The optimal model was deployed for prediction tasks, and its outputs were validated against expected values. This final step ensured the model’s robustness and its effectiveness in predicting telemedicine system performance.
Although real patient data was not used, the simulation was carefully designed using queuing theory parameters validated in the literature. The use of Revoledu allowed for the generation of 100 unique and diverse queuing scenarios with uniform coverage of the parameter space. This approach ensured a broad representation of real-world dynamics, including congestion, under-utilization, and blocking behaviors.
Unlike unconstrained models such as M/M/1 or M/M/∞, the M/M/s/N structure is more representative of actual telemedicine operations, where maximum concurrent sessions and server availability are bounded. Prior studies such as those by Ngorsed & Suesaowaluk [9] and Perdana et al. [10] have employed Poisson-based models with finite capacity to simulate patient loads in virtual hospitals, validating the appropriateness of the M/M/s/N framework for such settings.

3. Results

3.1. Parametric Analysis of Hybrid ANN-PSO on Telemedicine Queuing System

This sub-section focuses on the parametric analysis of the hybrid ANN-PSO model, designed for optimization purposes. The input parameters for the ANN-PSO hybrid model are the same 100 scenarios used in the ANN analysis. Each ANN-PSO model developed within this framework generates a single output variable.
The dataset was divided into two sets, with 90% allocated for training the configured network and the remaining 10% used for testing. MATLAB was employed to conduct parametric analysis of the hybrid ANN-PSO model.
Optimization Trials and Performance Evaluation
Table 2 presents the selected values for acceleration factors (C1 and C2), swarm population size, and the number of neurons, which were systematically varied to generate distinct ANN-PSO model configurations, as determined by the researcher Talukder [16].
For each test, the three parameters were adjusted while the ANN-PSO algorithm was loaded into MATLAB. To determine the optimal combination of PSO and ANN parameters, a total of 36 trials were conducted, with each test running for a maximum of 1000 iterations.
The training and prediction performance of each configured network was assessed using the MSE and the R2 to validate the effectiveness of each ANN-PSO model configuration.

3.2. Discussion of Results

The parametric analysis of the ANN-PSO hybrid model was conducted to identify the optimal configurations for predicting key performance metrics in the telemedicine queuing system. The analysis evaluated different configurations by varying the number of neurons in the hidden layer, the swarm population size, and the acceleration factors (C1 and C2). The MSE and R2 values were used to assess the model’s accuracy during both training and testing phases. An ideal ANN-PSO model will have a regression scores close to 1 and MSE values near 0 [22].
The results indicate that parameter selection plays a critical role in the model’s ability to generalize well to unseen data.

3.2.1. Parametric Study of the ANN-PSO Hybrid Model for Queue Intensity

The best-performing configuration for queue intensity prediction was obtained when the number of neurons was 7, swarm population size was 50, and acceleration factors were C1 = 1 and C2 = 2.5. Under these conditions, the model achieved a training R2 of 0.9403 with an MSE of 3.8582, indicating strong learning capability. The testing R2 value of 0.9164 suggests that the model effectively generalizes to unseen data, confirming its reliability in predicting queue intensity (Results highlighted in bold and italic in Table 3).
A key observation from the results is that smaller swarm sizes yielded better performance in queue intensity prediction, while larger swarm populations introduced excessive exploration, leading to slightly higher errors. This finding highlights the importance of balancing exploration (global search) and exploitation (local search) in PSO-based optimization to maintain stable and accurate predictions. This aligns with the work of Binkley & Hagiwara [27], who emphasize that the balance between exploration and exploitation in PSO is achieved through the careful selection of parameters and methodology. They further note that conventional PSO parameters are often chosen to ensure convergence, reinforcing the necessity of parameter tuning in achieving optimal results.

3.2.2. Parametric Study of the ANN-PSO Hybrid Model for System Utilization

For system utilization, the optimal configuration was achieved with nine neurons, a swarm population size of 20, and acceleration factors of C1 = 1 and C2 = 3.0. The model attained a training R2 value of 0.9450, coupled with an extremely low MSE of 0.0047, indicating an excellent fit to the training data. Additionally, the testing R2 value of 0.9406 confirms that the model maintains high predictive accuracy across different datasets (Results highlighted in bold and italic in Table 4).
Compared to queue intensity, system utilization exhibited lower MSE values, suggesting that the model was able to capture utilization trends with minimal error. This is particularly relevant in telemedicine, where accurate predictions of server workload can help optimize resource allocation and prevent system overloading. The results also demonstrate that simpler metrics like system utilization perform optimally with smaller swarm sizes (e.g., 20), ensuring computational efficiency without sacrificing accuracy.

3.2.3. Parametric Study of the ANN-PSO Hybrid Model for Queue Length in the Queue and in the System

For queue length in the queue, the best results were obtained when the model had six neurons, a swarm population size of 200, and acceleration factors of C1 = 1 and C2 = 2.75. This configuration yielded a training R2 of 0.91187 and MSE of 39.1201, with a testing R2 of 0.7692. These results indicate that while the model learns queue length dynamics effectively, its generalization performance requires further optimization, as the testing R2 is relatively lower compared to other outputs (Results highlighted in bold and italic in Table 5).
Similarly, for queue length in the system, the optimal configuration involved five neurons, a swarm size of 200, and acceleration factors of C1 = 1.5 and C2 = 2.0. The model achieved a training R2 of 0.90548, with an MSE of 42.4288, and a testing R2 of 0.8091. The slightly higher MSE values suggest that queue length predictions are more sensitive to parameter tuning, and future improvements may require further refinement of training techniques or increased dataset diversity (Results highlighted in bold and italic in Table 6).
A notable trend observed in both queue length metrics is that larger swarm sizes (e.g., 200) resulted in improved prediction accuracy. This suggests that complex outputs require a higher number of particles in the swarm to explore the search space more effectively and capture intricate patterns in the data.

3.2.4. Parametric Study of the ANN-PSO Hybrid Model for Delay in the Queue and Delay in the System

The ANN-PSO model was also evaluated for its ability to predict delay in the queue, where the best results were obtained with six neurons, a swarm population size of 200, and acceleration factors C1 = 1 and C2 = 2.75. This setup produced a training R2 of 0.89247 and an MSE of 0.0031, with a testing R2 of 0.8654. These results suggest that the model performs well in estimating delays, although slight variations in swarm population sizes resulted in different levels of accuracy (Results highlighted in bold and italic in Table 7).
For delay in the system, the optimal configuration was found with six neurons, a swarm population size of 400, and acceleration factors of C1 = 1 and C2 = 2.25. The model achieved a training R2 of 0.9114, an MSE of 0.0028, and a testing R2 of 0.9024. Compared to queue length predictions, the delay-based outputs exhibited lower error rates, highlighting the model’s ability to track variations in waiting times efficiently (Results highlighted in bold and italic in Table 8).

3.2.5. Parametric Study of the ANN-PSO Hybrid Model for Probability of Idle Servers

For the probability of idle servers, the best configuration included seven neurons, a swarm population size of 100, and acceleration factors C1 = 1 and C2 = 2.5. This resulted in a training R2 of 0.77514, with a very low MSE of 0.0009785, and a testing R2 of 0.7092. Unlike other outputs, the probability of idle servers had a slightly lower R2 value, suggesting that the model struggled slightly with generalization. This is likely due to the complexity of predicting idle server behavior, which depends on multiple interacting factors (Results highlighted in bold and italic in Table 9).
A critical takeaway from this analysis is that optimal configurations varied across different outputs, emphasizing the need to tailor the ANN-PSO model to specific performance metrics. This ensures both accuracy and efficiency in addressing telemedicine demands. The results confirm the robustness of the model, though no single configuration fits all outputs, making adaptive optimization strategies essential.
The influence of the ANN-PSO parameters (C1, C2, and swarm size) on model performance was significant, highlighting the necessity of fine-tuning these values during the optimization process. For instance, complex outputs like queue length required larger swarm sizes (e.g., 200) to improve prediction accuracy, whereas simpler metrics such as system utilization performed optimally with smaller swarm sizes (e.g., 20), ensuring computational efficiency.
A key and somewhat counterintuitive finding of our parametric analysis was that smaller swarm populations (e.g., 10–50 particles) often yielded superior performance in predicting queue intensity compared to larger swarms. This can be explained by the nature of our optimization problem: the search space defined by tuning a single hidden layer. An ANN with 5–10 neurons and a handful of acceleration coefficients is relatively low-dimensional. In such contexts, smaller swarms concentrate on the search around promising regions, accelerating convergence and avoiding the excessive exploration that larger populations can introduce. By contrast, very large swarms may continually scatter particles into less relevant areas of the solution space, destabilizing convergence without yielding proportional gains in model accuracy. These dynamics align with established PSO tuning principles, which recommend reducing the swarm size when the problem dimensionality is modest to favor exploitation over exploration [28,29].
The ANN-PSO model effectively predicts multiple performance metrics, allowing telemedicine systems to adapt to fluctuating demand and improve overall operational efficiency. Each optimized configuration represents a balance between high accuracy and computational efficiency. Its adaptability to different outputs makes it a reliable tool for real-time decision-making, enhancing efficiency and responsiveness in telemedicine operations.
Overfitting was monitored through the evaluation of the model’s test set performance across 36 configurations. The best-performing models exhibited close R2 values between training and testing sets, e.g., 0.9403 (train) and 0.9164 (test) for queue intensity, and 0.9450 (train) and 0.9406 (test) for system utilization (see Table 3 and Table 4). Such consistent results indicate effective generalization and confirm the absence of overfitting.
These findings reinforce the importance of parameter optimization in achieving robust and generalizable predictions.
Future research should investigate the scalability of the ANN-PSO model for large-scale telemedicine networks with multiple service centers and servers, considering the interaction between various subsystems.
One key limitation of this study is the use of simulated data generated via the Revoledu online queuing tool. Although input parameters were randomly sampled within defined ranges to ensure uniform coverage of the queuing system’s parameter space, the artificial nature of the simulation may introduce underlying distributional biases that do not fully capture the complexity of real-world telemedicine systems. To mitigate this, the study generated 100 diverse scenarios and validated model performance on unseen test data to assess generalization. Nevertheless, future research should incorporate real patient data from operational telemedicine systems. This would enable additional validation of model predictions under real-world conditions and help compare model generalization across simulated vs. empirical environments. Collaborations with healthcare providers are planned to secure such datasets in the next phase of this research.

4. Conclusions

This study set out to optimize telemedicine queuing systems by developing a hybrid Artificial Neural Network–Particle Swarm Optimization (ANN-PSO) model aimed at improving system performance and patient experience.
The first objective—simulating queuing scenarios to generate relevant data—was achieved using queuing theory-based simulations that captured key variables such as arrival rates, service rates, and system capacity. These simulations provided a realistic foundation for training predictive models.
The second objective—training an ANN to forecast critical performance metrics—demonstrated that ANNs can effectively predict outputs such as queue intensity, system utilization, and delays with high accuracy. This predictive capability enables telemedicine administrators to anticipate demand and make proactive decisions.
The third and central objective—optimizing the ANN model using PSO—was fulfilled by fine-tuning network parameters to enhance model generalization and minimize prediction error. Rather than replacing traditional analytical approaches, the ANN-PSO model serves as a complementary tool that offers flexible, data-driven predictions under dynamic conditions. By enabling real-time adaptation to varying patient loads, this hybrid model supports more responsive telemedicine queue management and contributes to efficient, patient-centered service delivery.
The novelty of this study lies in its integrated use of ANN-PSO for simulating and optimizing M/M/s/N telemedicine queueing systems, with a unique focus on generating and evaluating optimal configurations for multiple performance metrics across a two-phase simulation. Unlike previous works, this study offers a practical framework tailored to address queue-related inefficiencies in dynamic telemedicine environments.
The ANN-PSO framework complements closed-form analysis by functioning as a real-time predictive engine. While analytical formulas compute point estimates under strict assumptions, the ANN-PSO dynamically updates predictions based on streaming data and system fluctuations. This capability is critical in telemedicine platforms that operate in stochastic, multi-parameter environments where closed-form assumptions (e.g., constant μ, infinite queues) often fail to capture temporal variability. As demonstrated in Section 3.1 and Section 3.2, ANN-PSO offers reliable forecasting across multiple metrics (utilization, queue delay, idle probability), making it suitable for decision support in adaptive scheduling and load balancing.

Author Contributions

Conceptualization, D.T. and L.T.; methodology, D.T.; software, D.T.; Validation, D.T. and L.T.; formal analysis, D.T.; investigation, D.T.; resources, L.T.; data curation, D.T.; writing—original draft preparation, D.T.; writing—review and editing, L.T.; visualization, D.T.; supervision, L.T.; project administration, L.T. All authors have read and agreed to the published version of the manuscript.

Funding

This research received no external funding.

Institutional Review Board Statement

Not applicable.

Informed Consent Statement

Not applicable.

Data Availability Statement

Data available in Appendix A.

Acknowledgments

The authors gratefully acknowledge the use of the Revoledu online tool for performing the queuing simulations required in this study. The optimization of the ANN-PSO model was conducted using existing MATLAB code available from academic resources. During the preparation of this manuscript, the author used ChatGPT (OpenAI, version March 2025) for the purposes of text restructuring, language improvement, and grammatical correction. The authors have carefully reviewed and edited the generated content and take full responsibility for the final version of this publication.

Conflicts of Interest

The authors declare no conflict of interest.

Abbreviations

The following abbreviations are used in this manuscript:
ANNArtificial Neural Networks
PSOParticle Swarm Optimization
C1 and C2Acceleration factors
MSEMean Square Error
R2Coefficient

Appendix A

Table A1. 100 Generated Configurations.
INPUTOUTPUT
Arrival RateService RateCapacityNumber of ServersQueue IntensityQueuing UtilizationQueue Length in QueueQueue Length in SystemDelay in QueueDelay in SystemProbability of Idle Server
1100752591.3314.82%0.0001.3330.0000.01326.36%
2103752591.3715.26%0.0001.3730.0000.01325.33%
3500703237.14100.00%28.27631.2760.1350.1490.00%
4500703277.1497.44%12.56219.3830.0260.0410.01%
5200503054.0079.97%2.1706.1680.0110.0311.30%
64502512218.00100.00%9.87511.8750.1980.2380.00%
7150234046.52100.00%34.41438.4140.3740.4180.00%
8750853258.82100.00%25.69230.6920.0600.0720.00%
98095420814.98100.00%10.85518.8550.0250.0440.00%
10410753555.4799.50%21.08826.0630.0570.0700.02%
11300502556.0099.72%15.34620.3310.0620.0820.01%
1230028751110.7196.90%20.46231.1210.0960.1040.00%
136001003036.00100.00%26.00029.0000.0870.0970.00%
143801004523.80100.00%41.88943.8890.2090.2190.00%
15370952563.9064.91%0.4794.3740.0010.0121.88%
16190852182.2427.94%0.0012.2360.0000.01210.70%
1760452511.3399.98%21.01522.0150.4670.4890.02%
18120352533.4399.46%15.94818.9320.1530.1810.10%
19250452535.56100.00%20.82623.8260.1540.1760.00%
2085252043.4084.32%3.0536.4260.0360.0761.94%
21100602531.6755.56%0.3752.0410.0040.02017.27%
22180503023.60100.00%26.75028.7500.2680.2880.00%
239006540613.85100.00%33.23539.2350.0850.1010.00%
248204525418.22100.00%20.71924.7190.1150.1370.00%
257504020918.75100.00%10.07719.0770.0280.0530.00%
265501002635.50100.00%21.80024.8000.0730.0830.00%
27480804526.0097.66%18.23524.0950.0390.0510.04%
28250453535.56100.00%30.82633.8260.2280.2510.00%
2990075251312.0089.76%2.97114.6400.0030.0170.00%
3090075301512.0079.82%1.10713.0800.0010.0150.00%
31350555036.36100.00%46.10849.1080.2790.2980.00%
32420604547.00100.00%39.66743.6670.1650.1820.00%
33280582524.83100.00%2.29324.2930.1920.2090.00%
348704520819.33100.00%11.29419.2940.0310.0540.00%
359503925924.36100.00%15.41424.4140.0440.0700.00%
36100085351111.7798.82%14.59725.4670.0160.0280.00%
376509525136.8452.63%0.0296.8710.0000.0110.11%
387807545810.40100.00%33.66841.6680.0560.0690.00%
396505524511.82100.00%18.26723.2670.0660.0850.00%
40620652169.5499.99%13.30919.3080.0340.0500.00%
4178030171526.0097.86%1.12215.8010.0030.0360.00%
4244025241817.6090.65%1.59017.9070.0040.0440.00%
4395010036189.5052.78%0.0119.5110.0000.0100.01%
443602524914.4099.99%13.33722.3360.0590.0990.00%
4570035501520.00100.00%32.00047.0000.0610.0900.00%
464504580310.00100.00%76.57179.5710.5670.5890.00%
473202526212.80100.00%23.81525.8150.4760.5160.00%
48125451522.7899.76%10.53012.5250.1170.1400.10%
49550653548.46100.00%30.10334.1030.1160.1310.00%
506904525615.33100.00%18.35724.3570.0680.0900.00%
5112007525916.00100.00%14.71523.7150.0220.0350.00%
52150010045815.00100.00%35.85743.8570.0450.0550.00%
531300125751510.4069.33%0.30010.7000.0000.0080.00%
548001502585.3366.66%0.4395.7720.0010.0070.45%
559509035710.56100.00%26.03133.0310.0410.0520.00%
5690020025104.5045.00%0.0154.5150.0000.0051.11%
5755035751915.7182.71%1.59117.3060.0030.0310.00%
5875045851316.67100.00%68.45581.4550.1170.1390.00%
59200555023.69100.00%46.77848.7780.4250.4430.00%
6060252532.4079.92%2.4954.8930.0420.0825.64%
6170452521.5677.74%2.3413.8960.0330.05612.52%
62100502052.0040.00%0.0402.0400.0000.02013.43%
631751003031.7558.33%0.4672.2170.0030.01315.56%
643501003033.5099.83%21.30724.3020.0710.0810.03%
65450752046.0099.98%14.00918.0080.0470.0600.00%
665501002525.50100.00%22.42924.4290.1120.1220.00%
677501253586.0075.00%1.0687.0670.0010.0090.21%
689809535710.32100.00%25.88932.8890.0390.0490.00%
6910005050510.00100.00%44.00049.0000.1760.1960.00%
703502520814.0099.99%10.67018.6690.0530.0930.00%
71250501245.0097.72%5.0979.0060.0260.0460.14%
72350501557.0099.54%7.67312.6500.0310.0510.01%
7375252523.00100.00%21.00123.0010.4200.4600.00%
74130080501816.2590.08%4.64120.8550.0040.0160.00%
7517001001001917.0089.47%4.59621.5960.0030.0130.00%
76100202065.0082.67%2.2617.2220.0230.0730.47%
77220402585.5068.74%0.5476.0460.0020.0270.38%
784002520416.00100.00%15.66719.6670.1570.1970.00%
7979065351212.1597.01%10.62822.2700.0140.0290.00%
805204525911.5699.82%12.62521.6080.0310.0530.00%
8185075351011.3399.66%18.28528.2510.0240.0380.00%
82700802588.7598.34%10.19018.0570.0160.0290.00%
83150402033.7599.70%13.24916.2400.1110.1360.05%
84110050451622.00100.00%26.33442.3340.0330.0530.00%
856509035127.2260.19%0.1157.3370.0000.0110.07%
8650012050134.1732.05%0.0004.1670.0000.0081.55%
873007545104.0040.00%0.0064.0060.0000.0131.83%
88450653556.92100.00%27.40132.4010.0840.1000.00%
891201015312.00100.00%11.66714.6670.3890.4890.00%
90180752032.4079.76%2.3604.7530.0130.0265.68%
9150251212.0099.99%10.00211.0020.4000.4400.01%
9275151025.0099.99%7.3349.3340.2450.3110.00%
93135201536.75100.00%11.20014.2000.1870.2370.00%
94800953058.42100.00%23.53828.5380.0500.0600.00%
95220502054.4086.77%3.4187.7560.0160.0360.69%
96250302028.33100.00%16.43819.4380.1830.2160.00%
977106530410.92100.00%25.42229.4220.0980.1130.00%
9895080451511.8879.16%1.13513.0090.0010.0140.00%
99100085351811.7765.36%0.12111.8860.0000.0120.00%
100150018075198.3343.86%0.0018.3340.0000.0060.02%

Appendix B. ANN-PSO Pseudocode

BEGIN
1. Initialize problem parameters:
  - Define the ANN architecture (e.g., number of input, hidden, output neurons)
  - Set the range of weights and biases
2. Initialize PSO parameters:
  - Number of particles (nParticles)
  - Maximum number of iterations (maxIter)
  - Inertia weight (w), cognitive coefficient (c1), social coefficient (c2)
  - Initialize velocity and position vectors for each particle
  - Set the search space: weights and biases of ANN
3. For each particle:
  a. Randomly initialize ANN weights and biases as a position vector
  b. Evaluate fitness using a performance metric (e.g., MSE on training data)
  c. Set initial personal best (pBest) = current position
  d. If fitness < global best (gBest), update gBest
4. For iteration = 1 to maxIter:
  FOR each particle:
    a. Update velocity:
      velocity = w * velocity
           + c1 * rand() * (pBest − current position)
           + c2 * rand() * (gBest − current position)
    b. Update position:
      position = position + velocity
    c. Decode position vector into ANN weights/biases
    d. Evaluate ANN fitness (e.g., MSE on training data)
    e. Update personal best if current fitness is better
    f. Update global best if any particle achieves better fitness
  END FOR
  Optionally update inertia weight w (e.g., w = w_start − iter * decay)
END FOR
5. Finalize:
  - Return ANN model with weights and biases from gBest
  - Test the trained ANN model on validation/test data
END

References

  1. Darrah, K. Europe’s Doctor Apps, Compared. Sifted, October 2019. Available online: https://sifted.eu/author/kim (accessed on 10 December 2024).
  2. Haleem, A.; Javaid, M.; Singh, R.P.; Suman, R. Telemedicine for healthcare: Capabilities, features, barriers, and applications. Sens. Int. 2021, 2, 100117. [Google Scholar] [CrossRef] [PubMed]
  3. Obermeier, G.; Zimmermann, R.; Auinger, A. The effect of queuing technology on customer experience in physical retail environments. In HCI in Business, Government and Organizations; Nah, F.F.-H., Tan, C.-H., Eds.; Lecture Notes in Computer Science; Springer: Cham, Switzerland, 2020; Volume 12204, pp. 141–157. [Google Scholar]
  4. Yadav, R.K. GA and PSO hybrid algorithm for ANN training with application in medical diagnosis. In Proceedings of the Third International Conference on Intelligent Computing in Data Sciences (ICDS), Marrakech, Morocco, 28–30 October 2019; IEEE: Piscataway, NJ, USA, 2019; pp. 1–5. [Google Scholar]
  5. Alam, M.N.; Sallem, A.; Pereira, P.; Bachir, B.; Masmoudi, N. Optimal artificial neural network using particle swarm optimization. E3S Web Conf. 2023, 469, 00019. [Google Scholar] [CrossRef]
  6. Zychlinski, N. Managing queues with reentrant customers in support of hybrid healthcare. Stoch. Syst. 2024, 14, 167–190. [Google Scholar] [CrossRef]
  7. Adhicandra, I.; Nurhidayati, S.; Fauzan, T.R. Optimization of Hospital Queue Management Using Priority Queue Algorithm and Reinforcement Learning for Emergency Service Prioritization. Int. J. Softw. Eng. Comput. Sci. (IJSECS) 2024, 4, 512–522. [Google Scholar] [CrossRef]
  8. Yousif, A.B.; Hassan, H.J.; Muttasher, G. Applying reinforcement learning for random early detection algorithm in adaptive queue management systems. Indones. J. Electr. Eng. Comput. Sci. 2022, 26, 1684–1691. [Google Scholar] [CrossRef]
  9. Ngorsed, M.; Suesaowaluk, P. A Web-Based Queue Management System for Non-Tertiary Hospitals to Reduce Crowding and Waiting Time. Int. J. Appl. Inf. Syst. (IJAIS) 2020, 12, 43–55. [Google Scholar] [CrossRef]
  10. Perdana, R.H.Y.; Hudiono; Taufik, M.; Rakhmania, A.E.; Rohman, M.A.; Arifin, Z. Hospital Queue Control System Using Quick Response Code (QR Code) as Verification of Patient’s Arrival. Int. J. Adv. Comput. Sci. Appl. 2019, 10, 357–364. Available online: https://www.ijacsa.thesai.org (accessed on 27 April 2024). [CrossRef]
  11. Olayode, I.O.; Tartibu, L.K.; Okwu, M.O. Traffic Flow Prediction at Signalized Road Intersections: A Case of Markov Chain and Artificial Neural Network Model. EasyChair Preprint 2021. Available online: https://www.researchgate.net/publication/353919217 (accessed on 27 April 2024).
  12. Olayode, I.O.; Tartibu, L.K.; Okwu, M.O.; Ukaegbu, U.F. Development of a Hybrid Artificial Neural Network–Particle Swarm Optimization Model for the Modelling of Traffic Flow of Vehicles at Signalized Road Intersections. Appl. Sci. 2021, 11, 8387. [Google Scholar] [CrossRef]
  13. Nigatu, D.T.; Dinka, T.G.; Tilahun, S.L. Convergence Analysis of Particle Swarm Optimization Algorithms for Different Constriction Factors. Front. Appl. Math. Stat. 2024, 10, 1304268. [Google Scholar] [CrossRef]
  14. Umar, M.; Amin, F.; Salahshour, S.; Botmart, T.; Weera, W.; Junswang, P.; Sabir, Z. Swarming computational approach for the heartbeat Van Der Pol nonlinear system. Comput. Mater. Contin. 2022, 72, 6185–6202. [Google Scholar] [CrossRef]
  15. Wang, D.; Hu, B.; Hu, C.; Zhu, F.; Liu, X.; Zhang, J.; Wang, B.; Xiang, H.; Cheng, Z.; Xiong, Y.; et al. Clinical characteristics of 138 hospitalized patients with 2019 novel coronavirus–infected pneumonia in Wuhan, China. JAMA 2020, 323, 1061–1069. [Google Scholar] [CrossRef] [PubMed]
  16. Goyal, A.; Kaushik, S.; Khan, R. IoT based cloud network for smart health care using optimization algorithm. Inform. Med. Unlock. 2021, 27, 100792. [Google Scholar] [CrossRef]
  17. Ang, K.M.; Chow, C.E.; El-Kenawy, E.-S.M.; Abdelhamid, A.A.; Ibrahim, A.; Karim, F.K.; Khafaga, D.S.; Tiang, S.S.; Lim, W.H. A modified particle swarm optimization algorithm for optimizing artificial neural network in classification tasks. Processes 2022, 10, 2579. [Google Scholar] [CrossRef]
  18. Mondal, P.; Nandi, A.; Jana, N.D. An Improved Particle Swarm Optimization based Neural Network Training for Classification. In Proceedings of the 2019 IEEE Region 10 Symposium (TENSYMP), Kolkata, India, 7–9 June 2019; IEEE: Piscataway, NJ, USA, 2019; pp. 681–686. Available online: https://ieeexplore.ieee.org/document/8768338 (accessed on 20 May 2025).
  19. Salman, O.H.; Aal-Nouman, M.I.; Taha, Z.K. Reducing waiting time for remote patients in telemedicine with considering treated patients in emergency department based on body sensors technologies and hybrid computational algorithms: Toward scalable and efficient real time healthcare monitoring system. J. Biomed. Inform. 2020, 112, 103592. [Google Scholar] [CrossRef] [PubMed]
  20. Kardi, T. Queuing Theory Tutorial. Available online: http://people.revoledu.com/kardi/tutorial/Queuing/ (accessed on 17 January 2025).
  21. Gross, D.; Shortle, J.F.; Thompson, J.M.; Harris, C.M. Fundamentals of Queueing Theory, 5th ed.; John Wiley & Sons: Hoboken, NJ, USA, 2018. [Google Scholar]
  22. Yadav, A.; Roy, S.M. An artificial neural network–particle swarm optimization (ANN–PSO) approach to predict the aeration efficiency of venturi aeration system. Smart Agric. Technol. 2023, 4, 100230. [Google Scholar] [CrossRef]
  23. Eberhart, R.; Kennedy, J. A new optimizer using particle swarm theory. In Proceedings of the Sixth International Symposium on Micro Machine and Human Science (MHS’95), Nagoya, Japan, 4–6 October 1995; pp. 39–43. [Google Scholar]
  24. Mazaheri, P.; Rahnamayan, S.; Bidgoli, A.A. Designing artificial neural network using particle swarm optimization: A survey. In Swarm Intelligence-Recent Advances and Current Applications; Aceves-Fernández, M.A., Ed.; IntechOpen: London, UK, 2022. [Google Scholar]
  25. Momeni, E.; Armaghani, D.J.; Hajihassani, M.; Amin, M.F.M. Prediction of uniaxial compressive strength of rock samples using hybrid particle swarm optimization-based artificial neural networks. Measurement 2015, 60, 50–63. [Google Scholar] [CrossRef]
  26. Talukder, S. Mathematical Modelling and Applications of Particle Swarm Optimization. Master’s Thesis, Blekinge Institute of Technology, School of Engineering, Karlskrona, Sweden, 2011. [Google Scholar]
  27. Binkley, K.J.; Hagiwara, M. Balancing exploitation and exploration in particle swarm optimization: Velocity-based reinitialization. Inf. Media Technol. 2008, 3, 103–111. [Google Scholar] [CrossRef]
  28. Zirpe, R. Understanding Particle Swarm Optimization (PSO): From Basics to Brilliance. Medium, 20 March 2024. Available online: https://thisisrishi.medium.com/understanding-particle-swarm-optimization-pso-from-basics-to-brilliance-d0373ad059b6 (accessed on 20 May 2025).
  29. Jordehi, A.R. Particle Swarm Optimisation for Dynamic Optimisation Problems: A Review. Neural Comput. Appl. 2014, 25, 1507–1516. Available online: https://link.springer.com/article/10.1007/s00521-014-1661-6 (accessed on 20 May 2025). [CrossRef]
Figure 1. Spearman correlation heatmap.
Applsci 15 06349 g001
Figure 2. ANN-PSO process flowchart.
Applsci 15 06349 g002
Table 1. Spearman correlation between inputs and outputs.
Queue IntensityQueuing UtilizationQueue Length in QueueQueue Length in SystemDelay in QueueDelay in SystemProbability of Idle Server
Arrival rate0.72740.121660.1056130.335902−0.33008−0.40173−0.46655
Service rate−0.12751−0.29166−0.16621−0.05127−0.50685−0.617250.175876
Capacity0.1859520.0480120.3190140.489123−0.05817−0.12233−0.20985
Number of servers0.534355−0.44428−0.39531−0.14969−0.7351−0.71579−0.02401
Table 2. Values of the hybrid ANN-PSO parameter.
Number of NeuronsSwarm Population SizeAcceleration Factor
C1C2
5102.252.00
6202.252.00
7501.502.25
81001.002.75
92001.502.00
104001.002.25
Table 3. Parametric study of the ANN-PSO hybrid model for queue intensity.
Number of NeuronsSwarm Population SizeAcceleration FactorTraining R2MSETesting R2
c1c2
5102.252.000.96932.01260.54
5202.252.000.96062.57070.6008
5501.52.250.98191.19520.8368
510012.750.95373.01480.2578
52001.52.000.97431.68960.7291
54001.52.000.95702.80570.6401
61013.000.95942.73490.8212
62022.250.96872.05660.7787
65012.500.95752.77830.6099
610012.500.96312.41540.592
620012.750.96372.37930.7701
640012.250.96362.37750.7021
7101.52.500.90576.00200.6835
72012.750.92734.79580.7283
75012.500.94033.85820.9164
710012.500.96822.08510.8335
72001.52.250.96002.61270.7553
740022.000.98810.78680.7147
81012.750.89496.66840.6232
82012.500.9351422360.8603
8501.52.250.96492.29550.2508
810012.500.89246.78100.6156
820012.750.97591.60200.4705
840012.250.96762.12500.7143
91012.750.88597.19710.805
92013.000.96852.06450.6350
9501.52.250.93364.28250.2965
910022.000.98640.90000.1684
92001.52.250.96272.44800.7199
940012.500.95942.65210.3784
101012.750.97455.75360.8202
10201.52.500.90346.23320.5109
10501.52.500.96002.61560.1959
1010012.750.96552.26190.8328
1020012.750.97341.75230.5596
104001.52.500.97611.58990.8673
Table 4. Parametric study of the ANN-PSO hybrid model for system utilization.
Number of NeuronsSwarm Population SizeAcceleration FactorTraining R2MSETesting R2
c1c2
5102.252.000.93080.00590.9076
5202.252.000.93010.00600.8845
5501.52.250.93250.00590.9403
510012.750.93230.00580.9470
52001.52.000.94390.00480.8855
54001.52.000.95530.00390.9375
61013.000.89080.00910.6464
62022.250.94950.00450.9551
65012.500.89860.00850.8733
610012.500.91340.00730.948
620012.750.93080.00590.9001
640012.250.94420.00480.7810
7101.52.500.76530.01830.5032
72012.750.86840.01090.8192
75012.500.89860.00850.8847
710012.500.91640.00710.1655
72001.52.250.93550.00550.8961
740022.000.94960.00430.9123
81012.750.87030.01090.8513
82012.500.79510.01650.9506
8501.52.250.92820.00610.9639
810012.500.92950.00600.9249
820012.750.92760.00620.8770
840012.250.95300.00400.8484
91012.750.79380.01640.917
92013.000.94500.00470.9406
9501.52.250.91040.00760.8682
910022.000.91060.00760.8998
92001.52.250.94980.00430.7931
940012.500.95070.00430.7884
101012.750.79860.01700.7852
10201.52.500.77580.01780.5935
10501.52.500.89710.00860.8315
1010012.750.92800.00610.8719
1020012.750.93610.00550.1840
104001.52.500.94750.00450.8898
Table 5. ANN-PSO sensitive analysis for queue length in the queue.
Number of NeuronsSwarm Population SizeAcceleration FactorTraining R2MSETesting R2
c1c2
5102.252.000.896745.36840.51
5202.252.000.898744.50520.6584
5501.52.250.892947.04900.6925
510012.750.866357.78350.5129
52001.52.000.897245.13530.5078
54001.52.000.921734.82740.4507
61013.000.881951.43250.6158
62022.250.912038.92710.3477
65012.500.865860.06200.5224
610012.500.912538.86010.423
620012.750.911939.12010.7692
640012.250.916337.16050.3315
7101.52.500.793087.18620.2752
72012.750.796184.83880.6333
75012.500.869456.62730.5125
710012.500.912238.88900.4302
72001.52.250.932230.30510.6161
740022.000.934829.21620.4704
81012.750.806481.19390.7028
82012.500.845067.11050.7143
8501.52.250.893947.28770.5293
810012.500.884650.32640.8094
820012.750.922734.39630.3139
840012.250.920735.27330.5319
91012.750.856461.76560.604
92013.000.935229.05770.5182
9501.52.250.870256.22910.6333
910022.000.927932.20530.1150
92001.52.250.922134.69190.5307
940012.500.898944.44850.6000
101012.750.7755100.79060.5777
10201.52.500.794487.78190.3527
10501.52.500.874954.60400.9175
1010012.750.906941.10360.5078
1020012.750.936228.66710.4767
104001.52.500.921434.96610.3721
Table 6. ANN-PSO sensitive analysis for queue length in the system.
Number of NeuronsSwarm Population SizeAcceleration FactorTraining R2MSETesting R2
c1c2
5102.252.000.899544.96840.56
5202.252.000.914438.58470.7043
5501.52.250.886950.29560.6328
510012.750.892148.06870.6037
52001.52.000.905542.42880.8091
54001.52.000.909940.54770.4417
61013.000.895846.55440.5966
62022.250.909040.98830.3690
65012.500.882352.61600.6782
610012.500.912839.33510.372
620012.750.915638.11200.7023
640012.250.923234.80980.4199
7101.52.500.800787.75650.6266
72012.750.799886.38160.8223
75012.500.899145.38280.6112
710012.500.935629.44460.4335
72001.52.250.930831.86820.3630
740022.000.951122.55160.6184
81012.750.829973.86930.6419
82012.500.7983107.33880.2117
8501.52.250.894147.47610.7765
810012.500.892747.90880.6287
820012.750.909740.73820.5268
840012.250.928132.64340.4674
91012.750.853963.95470.391
92013.000.935729.51230.5934
9501.52.250.884851.14290.6248
910022.000.929832.00310.4377
92001.52.250.892447.99060.4536
940012.500.908741.04790.6865
101012.750.821081.31860.6978
10201.52.500.7698100.89010.2325
10501.52.500.898645.36100.3447
1010012.750.919736.35460.5877
1020012.750.938328.16310.7121
104001.52.500.926033.65740.7940
Table 7. ANN-PSO sensitive analysis for delay in queue.
Number of NeuronsSwarm Population SizeAcceleration FactorTraining R2MSETesting R2
c1c2
5102.252.000.87210.00370.78
5202.252.000.88610.00320.7847
5501.52.250.78690.00580.3988
510012.750.84900.00420.7261
52001.52.000.88350.00330.8386
54001.52.000.88370.00330.8139
61013.000.81180.00520.4746
62022.250.85420.00410.7810
65012.500.85940.00400.8166
610012.500.89330.00310.752
620012.750.89250.00310.8654
640012.250.88120.00340.7616
7101.52.500.76210.00640.6567
72012.750.72520.00730.3842
75012.500.79720.00550.4525
710012.500.85050.00420.8171
72001.52.250.87930.00340.8459
740022.000.88020.00340.7326
81012.750.75250.00650.3789
82012.500.84970.00420.8099
8501.52.250.84990.00420.6842
810012.500.88490.00330.7523
820012.750.89170.00310.7939
840012.250.88980.00310.8614
91012.750.75970.00640.380
92013.000.89890.00290.8599
9501.52.250.85350.00410.7429
910022.000.89780.00290.8590
92001.52.250.85680.00400.7765
940012.500.89130.00310.8519
101012.750.82360.00490.7572
10201.52.500.78780.00570.7274
10501.52.500.78680.00580.5103
1010012.750.86020.00390.7999
1020012.750.87990.00340.7445
104001.52.500.90330.00280.7067
Table 8. ANN-PSO sensitive analysis for delay in system.
Number of NeuronsSwarm Population SizeAcceleration FactorTraining R2MSETesting R2
c1c2
5102.252.000.88030.00370.90
5202.252.000.87680.00380.8645
5501.52.250.83710.00500.6653
510012.750.85630.00440.8224
52001.52.000.88980.00350.8358
54001.52.000.88680.00360.8749
61013.000.83990.00490.6093
62022.250.84870.00460.7042
65012.500.87080.00400.8292
610012.500.85740.00440.738
620012.750.87970.00380.8493
640012.250.91140.00280.9024
7101.52.500.78250.00640.6899
72012.750.71230.00820.5649
75012.500.82270.00540.7154
710012.500.82890.00520.7747
72001.52.250.86630.00410.8336
740022.000.88210.00370.7921
81012.750.73950.00750.4025
82012.500.86960.00410.7798
8501.52.250.87620.00390.7917
810012.500.87870.00380.8727
820012.750.87880.00380.8112
840012.250.88900.00350.8812
91012.750.75300.00740.867
92013.000.88470.00360.8565
9501.52.250.83900.00490.7126
910022.000.90880.00290.8017
92001.52.250.89150.00340.8151
940012.500.84780.00470.7581
101012.750.77980.00660.4751
10201.52.500.82020.00550.8073
10501.52.500.76920.00680.7719
1010012.750.85020.00460.7792
1020012.750.87390.00390.8079
104001.52.500.89540.00330.6539
Table 9. ANN-PSO sensitive analysis for probability of idle server.
Number of NeuronsSwarm Population SizeAcceleration FactorTraining R2MSETesting R2
c1c2
5102.252.000.83400.00080.41
5202.252.000.80760.00090.1355
5501.52.250.65920.00140.3775
510012.750.78380.00100.0770
52001.52.000.79290.00090.2754
54001.52.000.82510.00080.3251
61013.000.73520.00110.1491
62022.250.81120.00080.1720
65012.500.76070.00100.3204
610012.500.80410.00090.258
620012.750.81440.00080.1369
640012.250.80970.00080.3478
7101.52.500.53230.00180.1217
72012.750.52570.00180.1724
75012.500.76790.00110.4261
710012.500.77510.00100.7092
72001.52.250.81870.00080.2987
740022.000.83490.00070.2349
81012.750.62350.00150.1044
82012.500.62210.00150.6914
8501.52.250.69250.00130.0768
810012.500.66460.00140.4736
820012.750.81660.00080.2355
840012.250.72280.00120.1248
91012.750.20380.00260.002
92013.000.79560.00090.1056
9501.52.250.70430.00130.2432
910022.000.85700.00070.1324
92001.52.250.81800.00080.2312
940012.500.78460.00090.1594
101012.750.60280.00170.2416
10201.52.500.71680.00120.0896
10501.52.500.71280.00120.2103
1010012.750.72190.00120.0914
1020012.750.85410.00070.5585
104001.52.500.81650.00080.4013
Disclaimer/Publisher’s Note: The statements, opinions and data contained in all publications are solely those of the individual author(s) and contributor(s) and not of MDPI and/or the editor(s). MDPI and/or the editor(s) disclaim responsibility for any injury to people or property resulting from any ideas, methods, instructions or products referred to in the content.

