4.3.1. Performance of Different Classification Algorithms
(1) Comparison of the accuracy of VGG16, SE-VGG16, ResNet18, ResNet34, ResNet50, MobileNetV3, and EfficientNetB0 for different gestures.
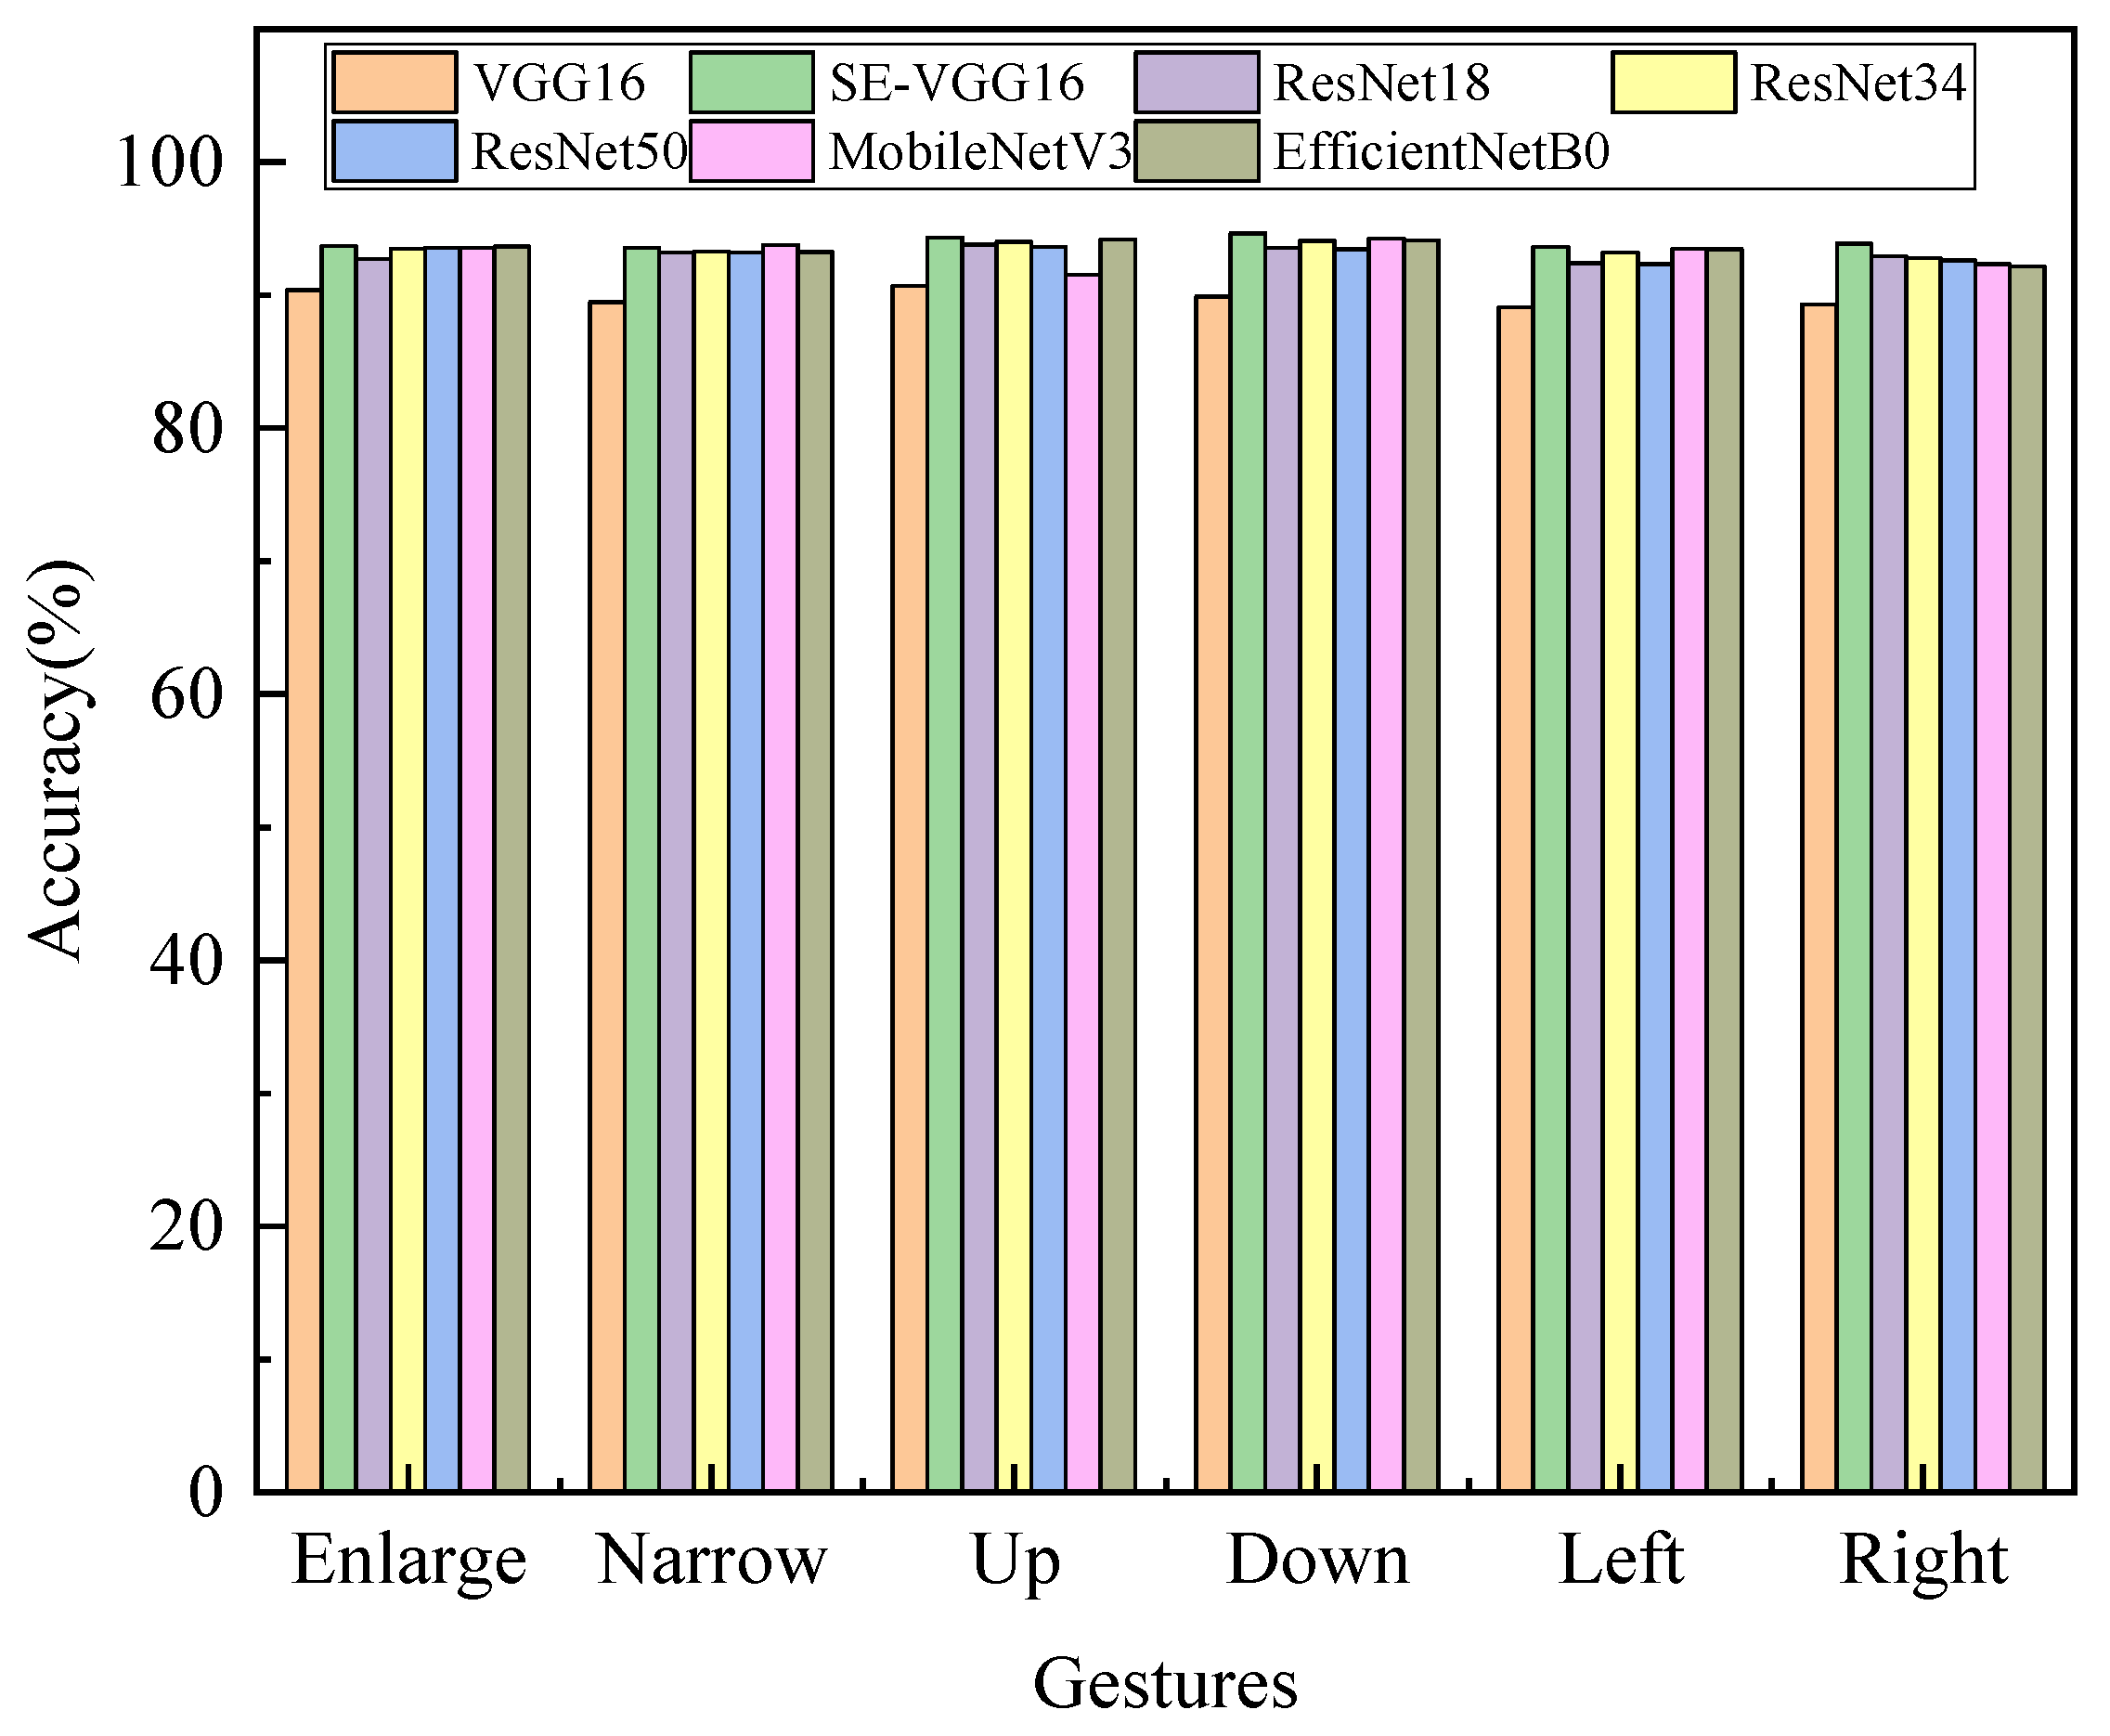
In order to evaluate the performance of the SE-VGG16 WiFi gesture recognition method, the recognition accuracy of seven models, including VGG16, SE-VGG16, ResNet18, ResNet34, ResNet50, MobileNetV3, and EfficientNetB0, is compared and analyzed in this study. The results are shown in
Figure 8.
Figure 8 compares the gesture recognition accuracy of seven deep-learning models. Among these models, SE-VGG16 has the highest overall accuracy, with ResNet variants ranking closely behind. SE-VGG16’s superiority stems from its squeeze–excitation (SE) mechanism, which recalibrates channel-wise features, improving accuracy by 4.13% over VGG16. ResNet models use residual connections for better performance, but trail SE-VGG16 in some challenging scenarios. Lightweight models MobileNetV3 and EfficientNetB0 trade accuracy for computational efficiency; their depthwise separable convolutions and reduced capacity limit performance on intricate gestures. Further analysis of per-gesture accuracy reveals that SE-VGG16’s advantage is most pronounced for Enlarge/Narrow gestures, where its attention mechanism effectively isolates subtle finger movements from noise. The results collectively affirm SE-VGG16 as a state-of-the-art solution, particularly for environments requiring high precision across diverse gesture types.
(2) Confusion Matrix of Different Gestures in SE-VGG16 Model
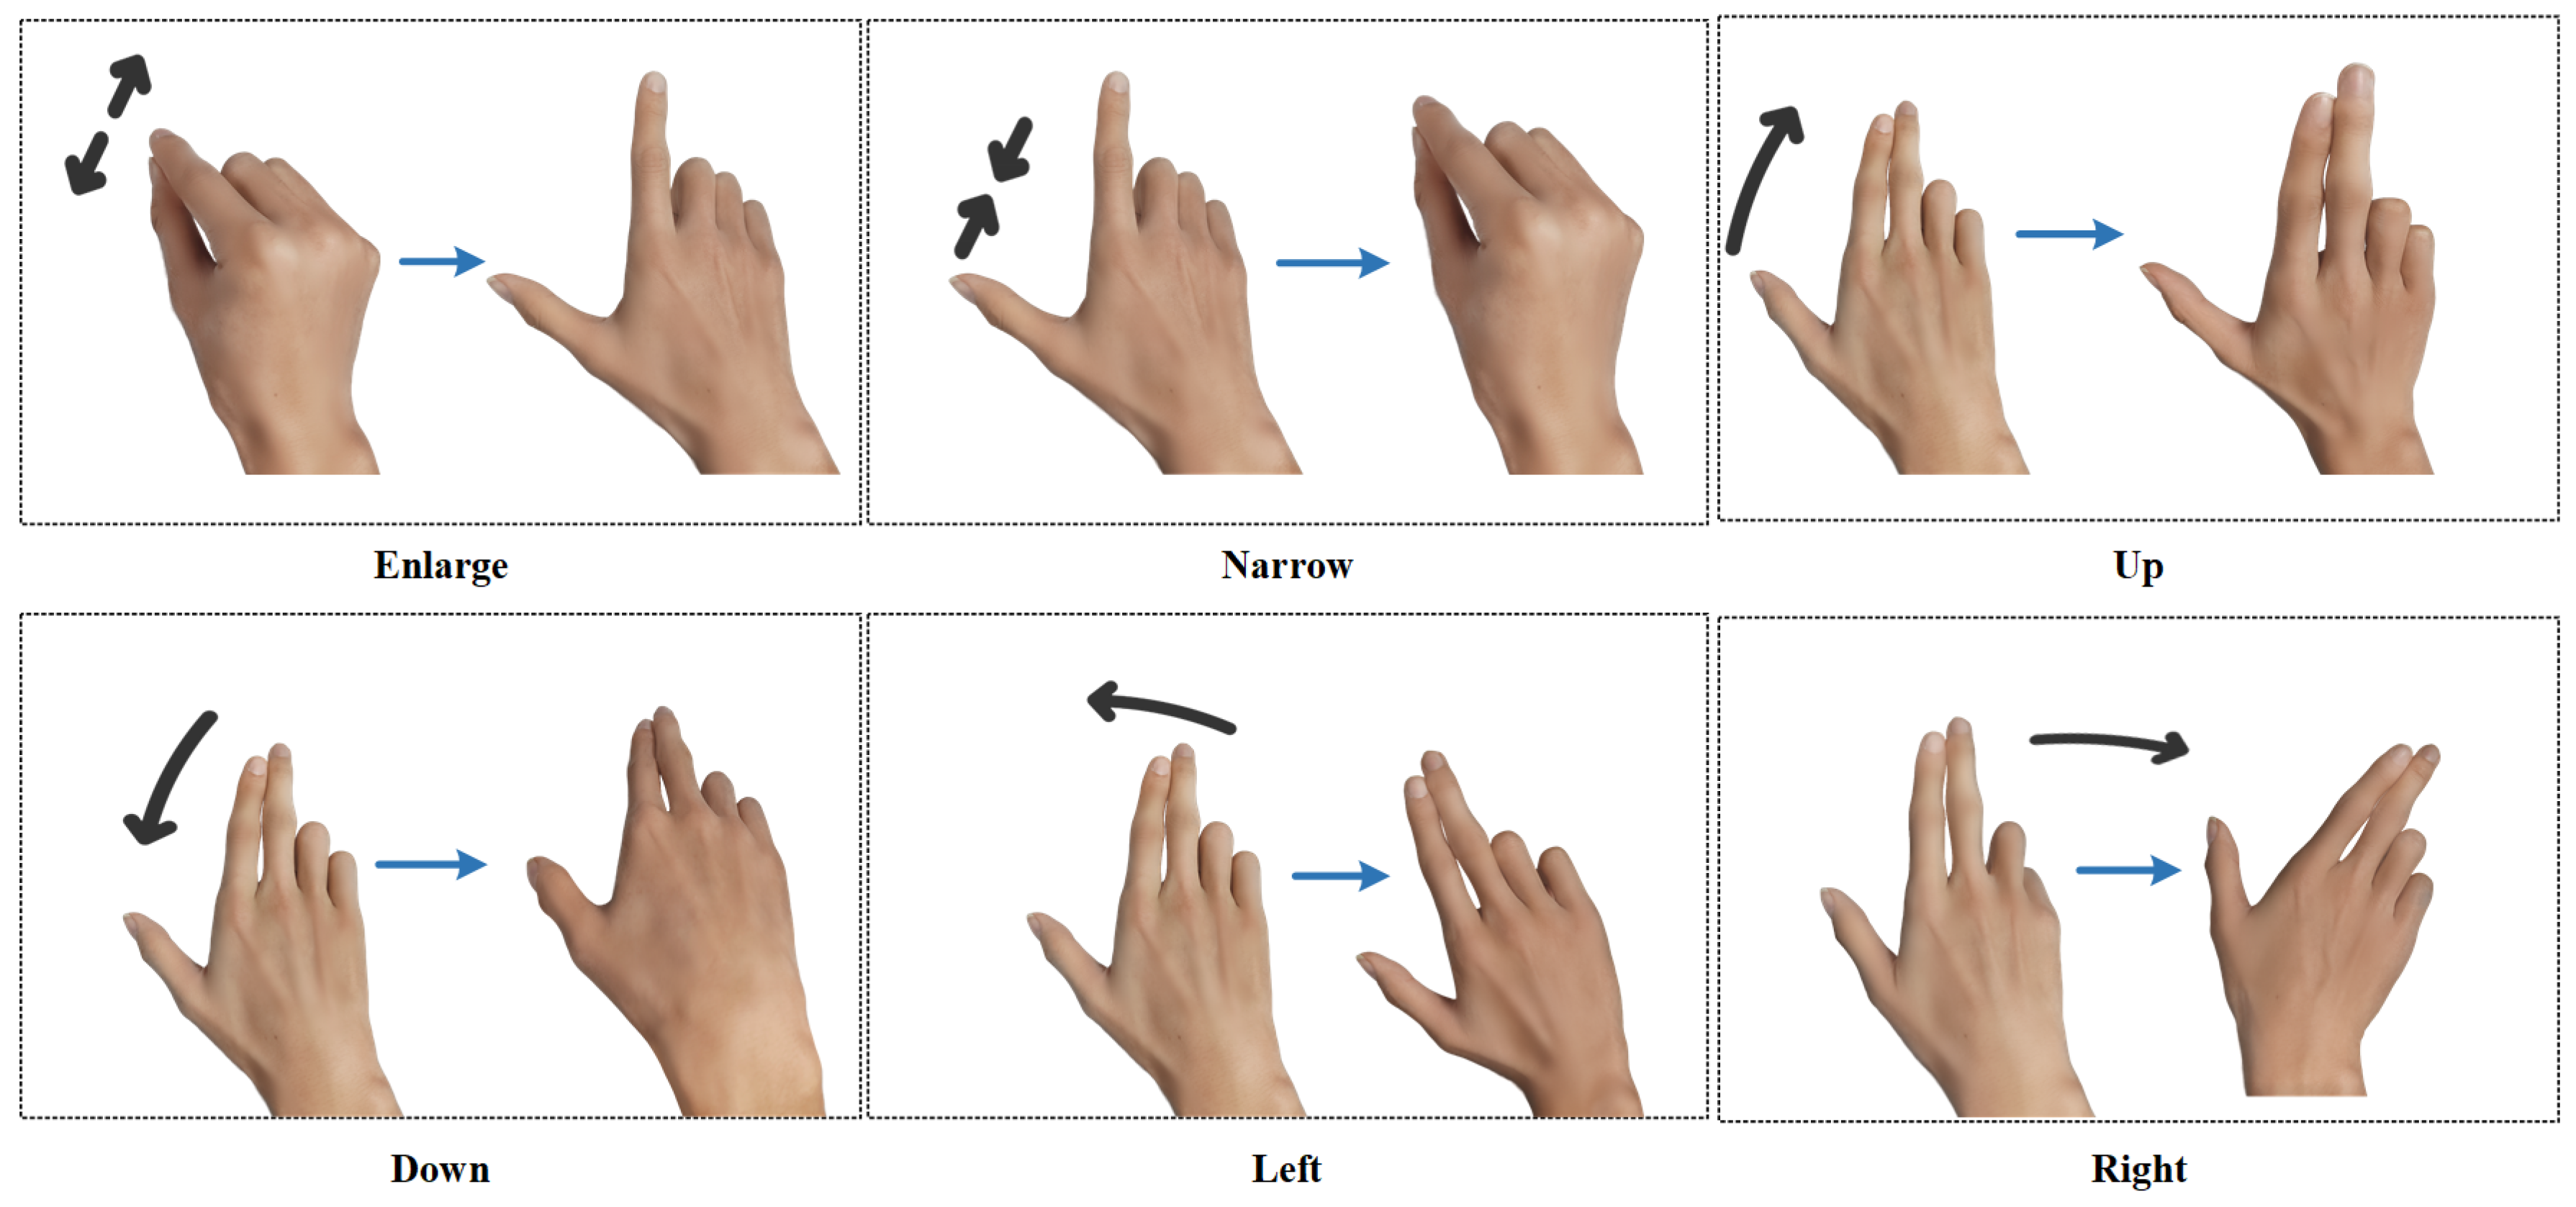
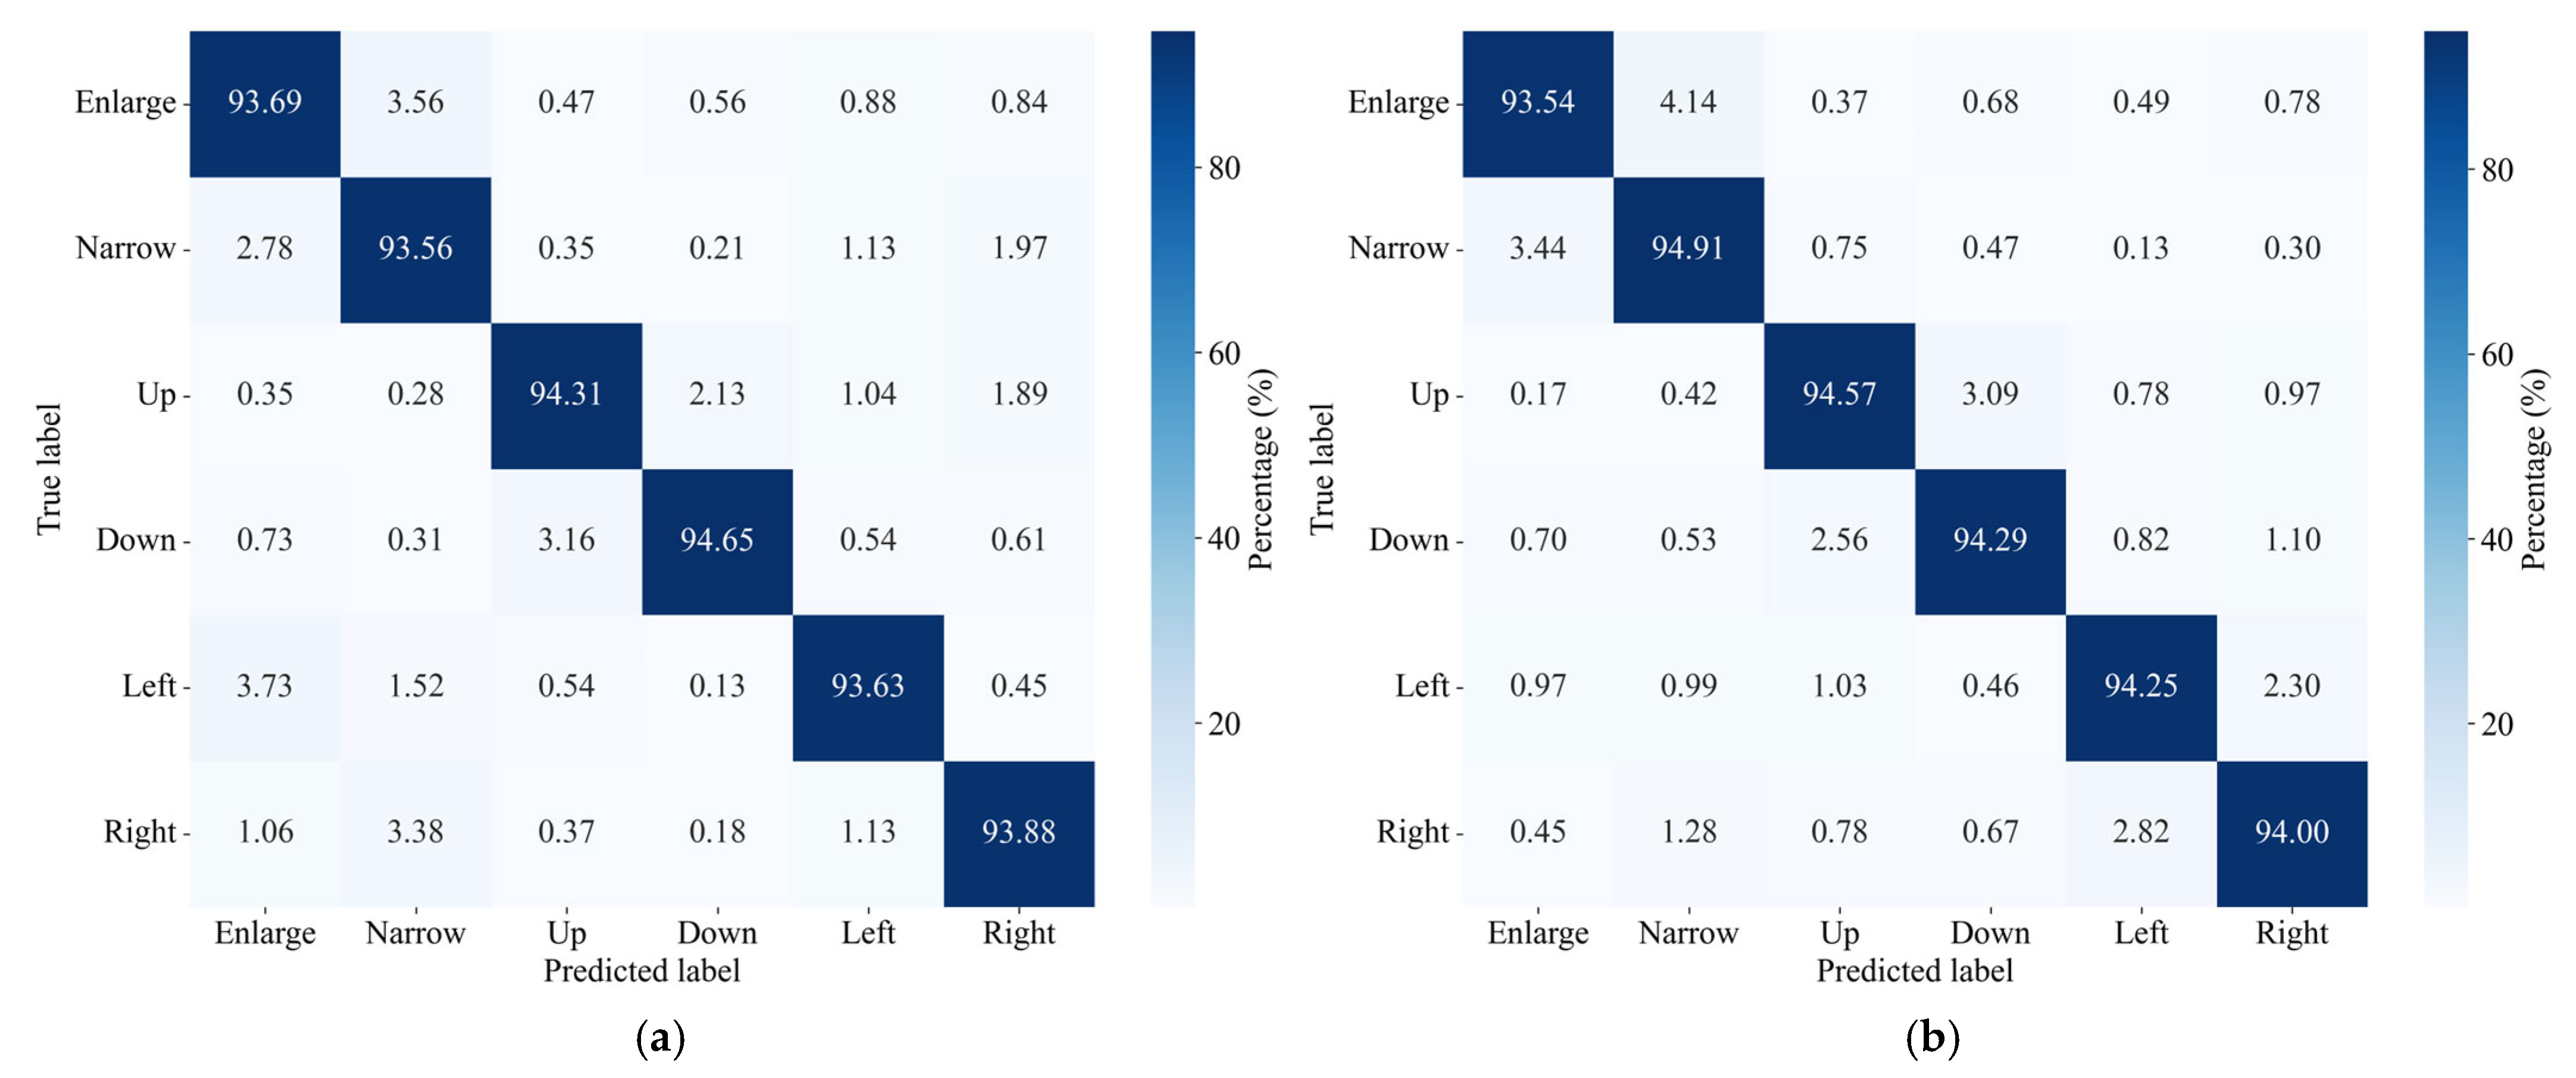
To further assess the SE-VGG16 model’s gesture-recognition performance, confusion matrices for office and conference room environments are analyzed. These matrices detail misclassifications among Enlarge, Narrow, Up, Down, Left, and Right gestures.
In the office environment (
Figure 9a), the SE-VGG16 model shows excellent recognition performance. The confusion matrix shows that the recognition rate of the “up” gesture is as high as 94.31%, while the “zoom in” and “zoom out” gestures with complex motion patterns also maintain a high accuracy of 93.69% and 93.56%, respectively. Despite a small number of misclassifications, the overall misclassification rate is very low, which indicates that the model can effectively distinguish the unique signal characteristics of each type of gesture and maintains stable performance even in the presence of environmental interference. In addition, in the validation of the conference room scenario (
Figure 9b), the model also performs well, with a recognition rate of 94.29% for the “down” gesture, and other gesture types also maintain a high recognition accuracy. The overall low misclassification rate fully demonstrates the robustness of the model.
The results of the confusion matrix clearly demonstrate the effectiveness of the SE-VGG16 model. It is worth noting that the signal uniformity due to the open space of the conference room and the signal variability due to the complex layout of the office have some comparative value, while the model maintains an overall high accuracy rate in different environments. This performance fully demonstrates the model’s excellent environmental adaptability and robustness characteristics.
(3) Comparison of VGG16 and SE-VGG16 performance
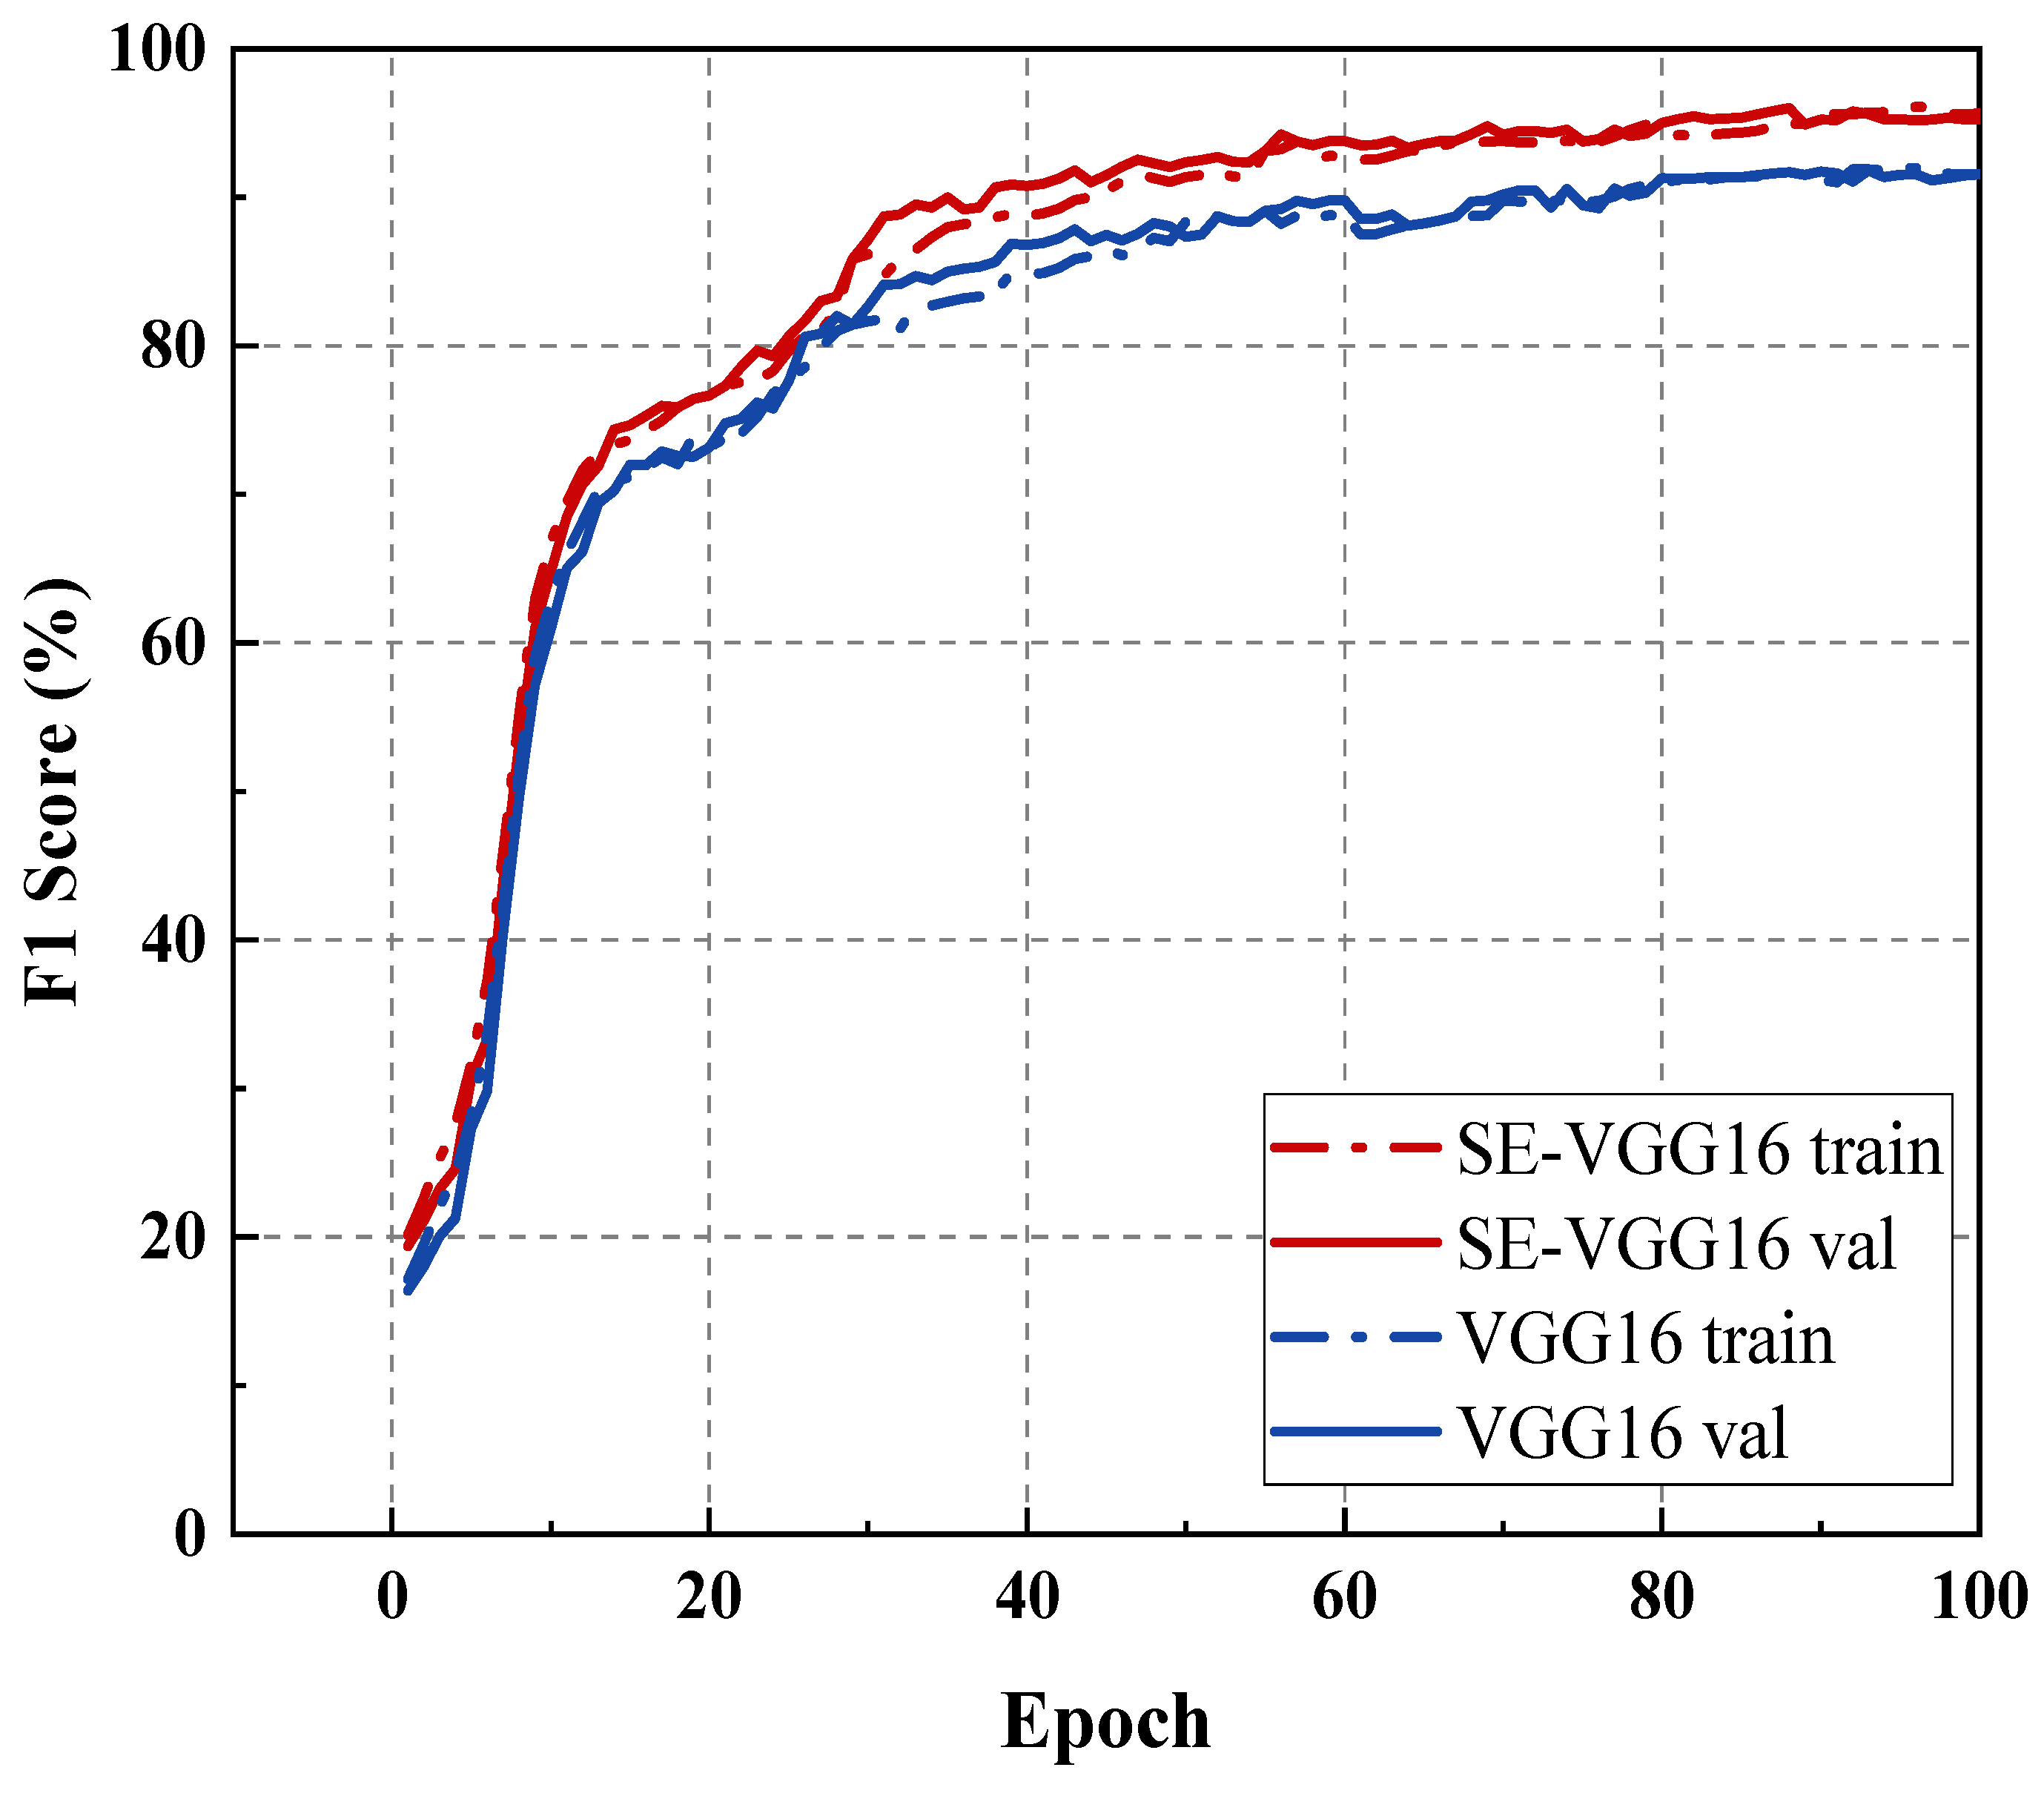
To evaluate the performance enhancement achieved by incorporating the squeeze–excitation mechanism into VGG16, we compared the training and validation accuracy trajectories of both VGG16 and SE-VGG16 across successive epochs. The results are presented in
Figure 10.
Figure 10 demonstrates that both models exhibit progressively improving accuracy with increasing epoch count until reaching stabilization. Notably, the validation accuracy marginally exceeds the training accuracy in both architectures.
(4) Comparison of SE-WiGR with other gesture recognition systems
To comprehensively verify the actual performance of the proposed method, we selected two typical indoor scenarios (conference room and office environment) and conducted systematic comparisons with mainstream gesture recognition algorithms under identical experimental conditions, the experimental results are shown in
Table 5. In gesture recognition tasks, class imbalance (e.g., limited samples for fine-grained gestures like “Enlarge/Narrow”) and inter-class feature similarity (e.g., directional gestures “Left/Right” and “Up/Down”) pose challenges for traditional metrics like Accuracy. As a harmonic mean of Precision (TP/(TP + FP)) and Recall (TP/(TP + FN)), the F1 score mitigates bias from dominant gesture categories and provides a balanced assessment of minority classes, while also sensitively capturing misclassifications between similar gestures with subtle feature differences—avoiding the oversimplification of single Accuracy metrics. Additionally, in practical applications like smart homes, the F1 score’s penalty of both false positives and negatives aligns with real-world reliability requirements.
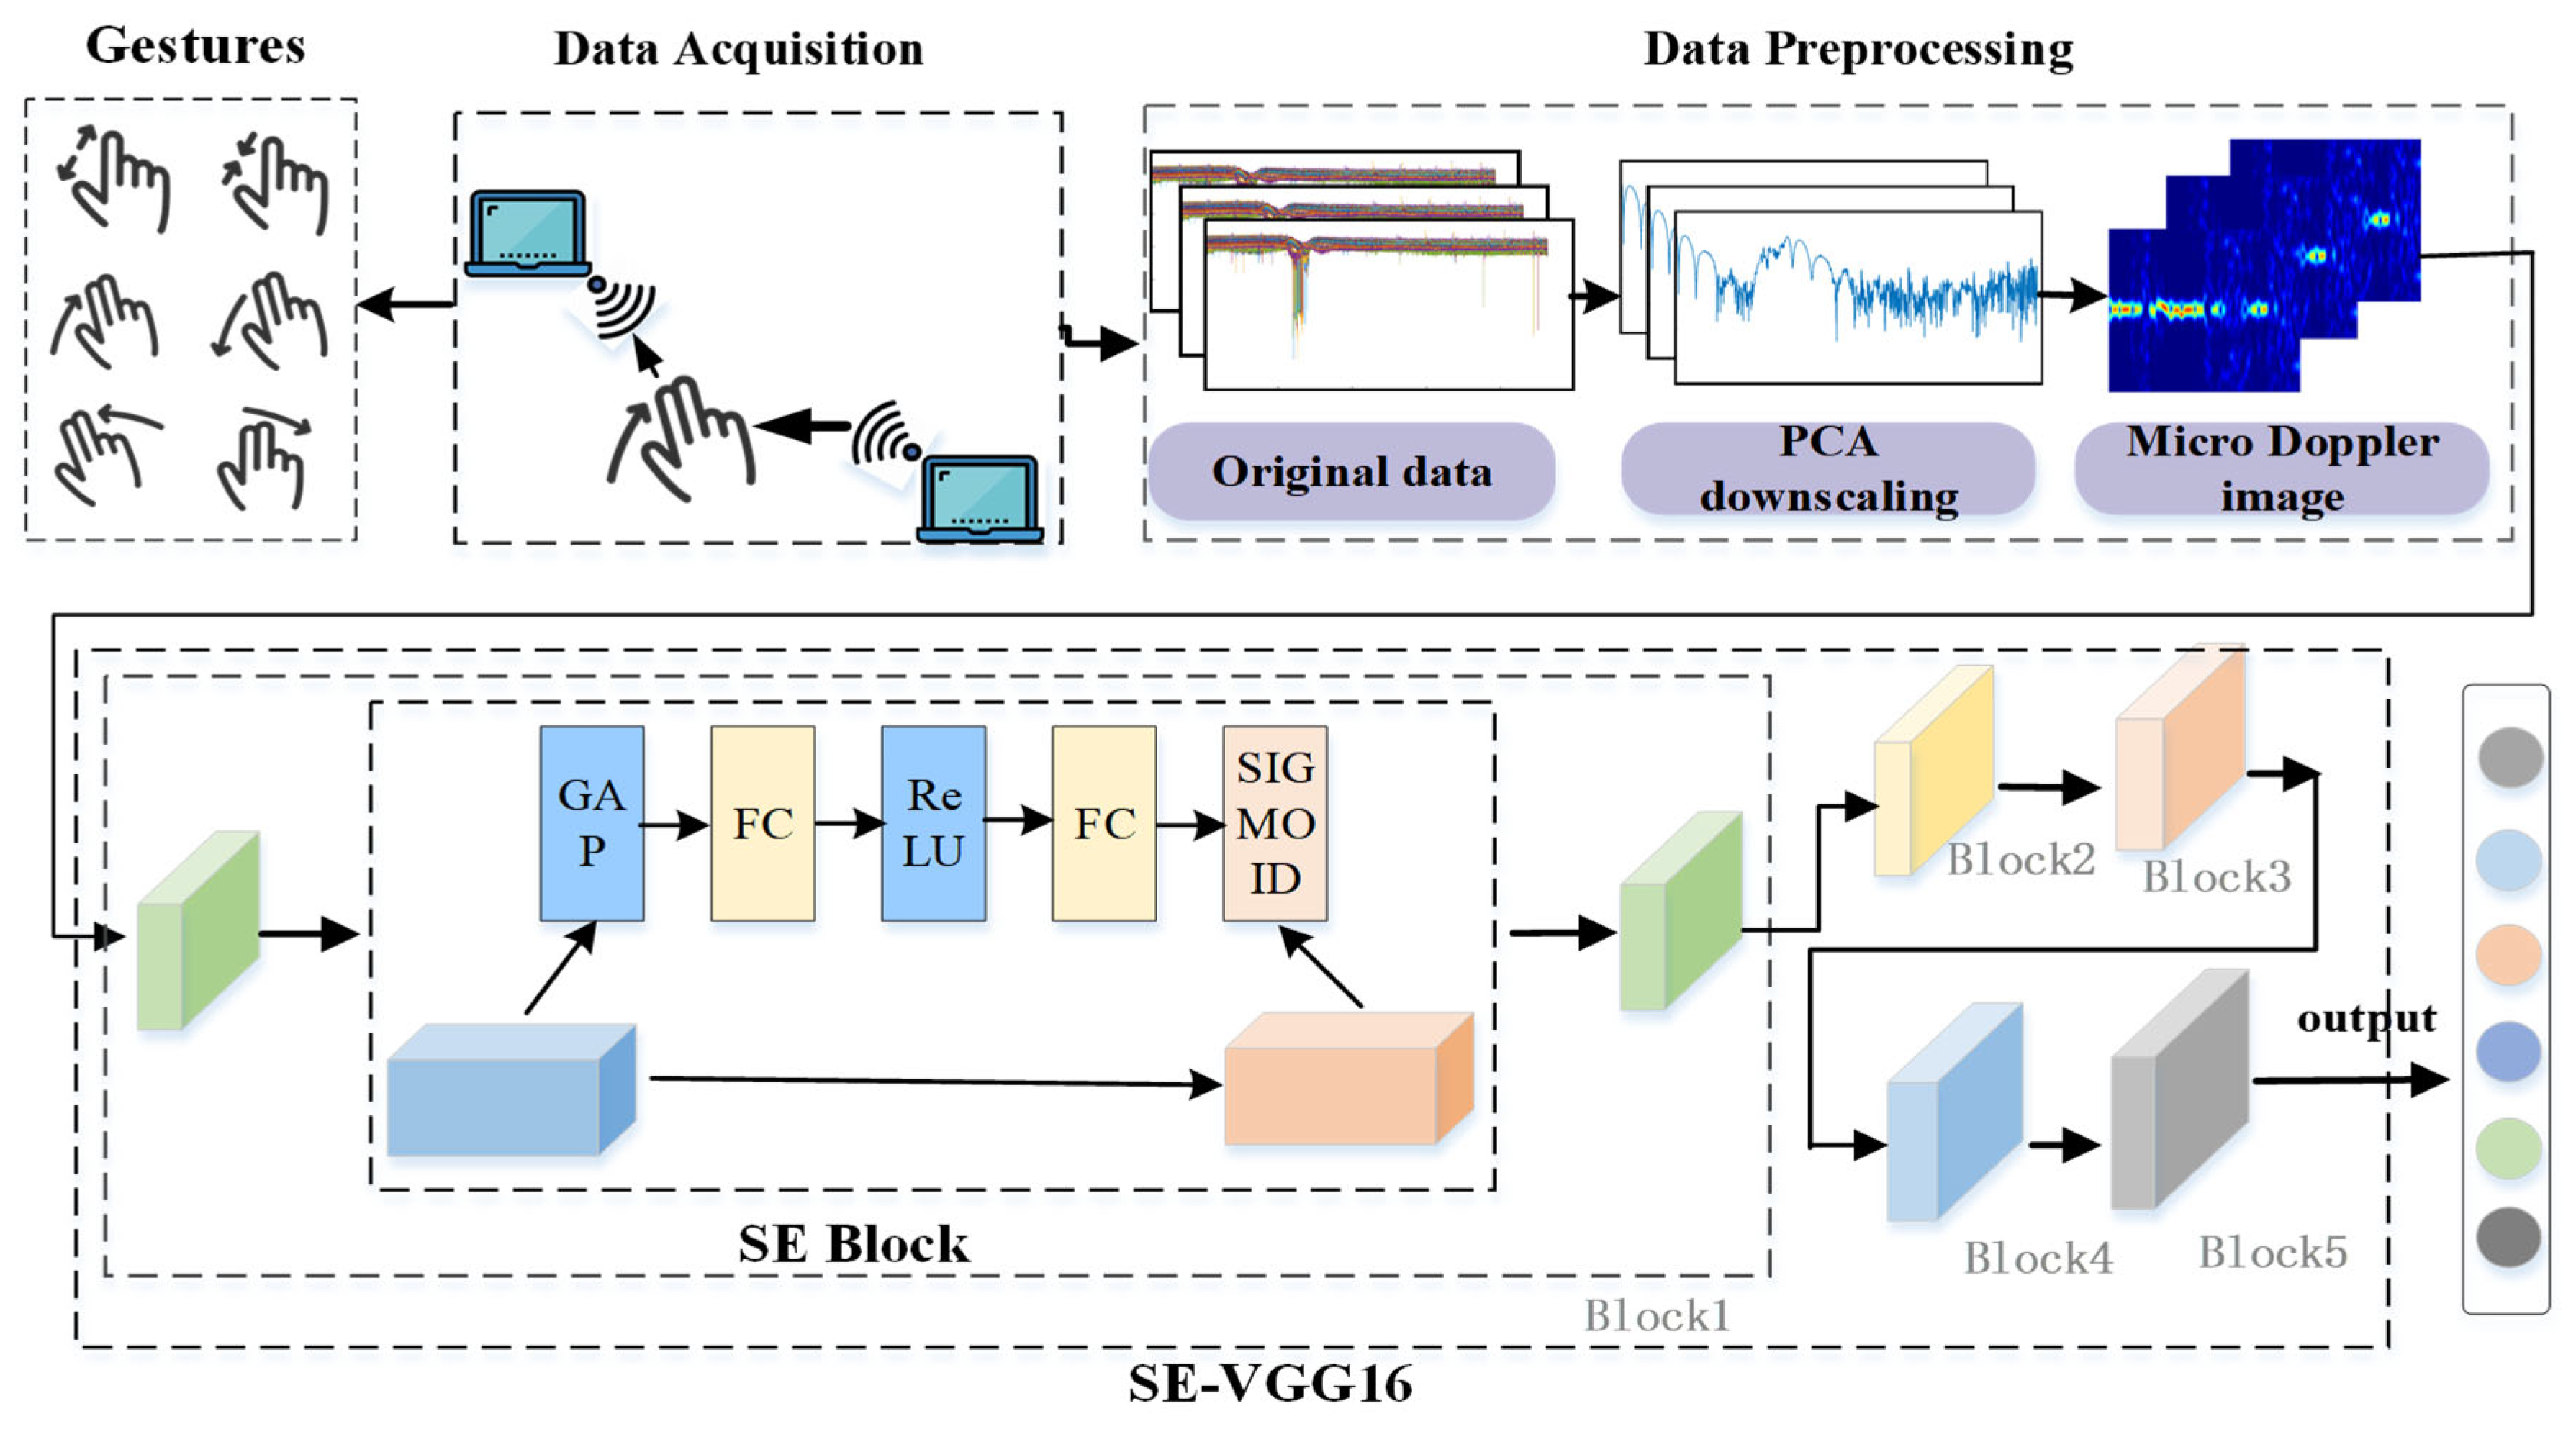
Our experimental results demonstrate significant performance differences among the evaluated approaches. Shallow learning models relying on hand-crafted features (WiGest and HMM) achieve relatively low accuracy (approximately 70%), as manual feature extraction frequently fails to capture critical discriminative characteristics. In comparison, deep learning-based approaches (LSTM and GRU) show superior performance by automatically learning optimal feature representations. Notably, the ABLSTM method outperforms standard LSTM through its bidirectional architecture and attention mechanism. Among all benchmarked methods, our proposed SE-WiGR technique achieves the highest recognition accuracy across all gesture categories. This performance advantage stems from the effective integration of the SE module with the VGG16 network, which synergistically combines their complementary strengths for robust feature extraction and classification.
4.3.2. Robustness Experiments
(1) Evaluation of User Diversity and Cross-User Generalization
This method evaluates its robustness through a multi-faceted validation framework. First, a dual mechanism assesses:
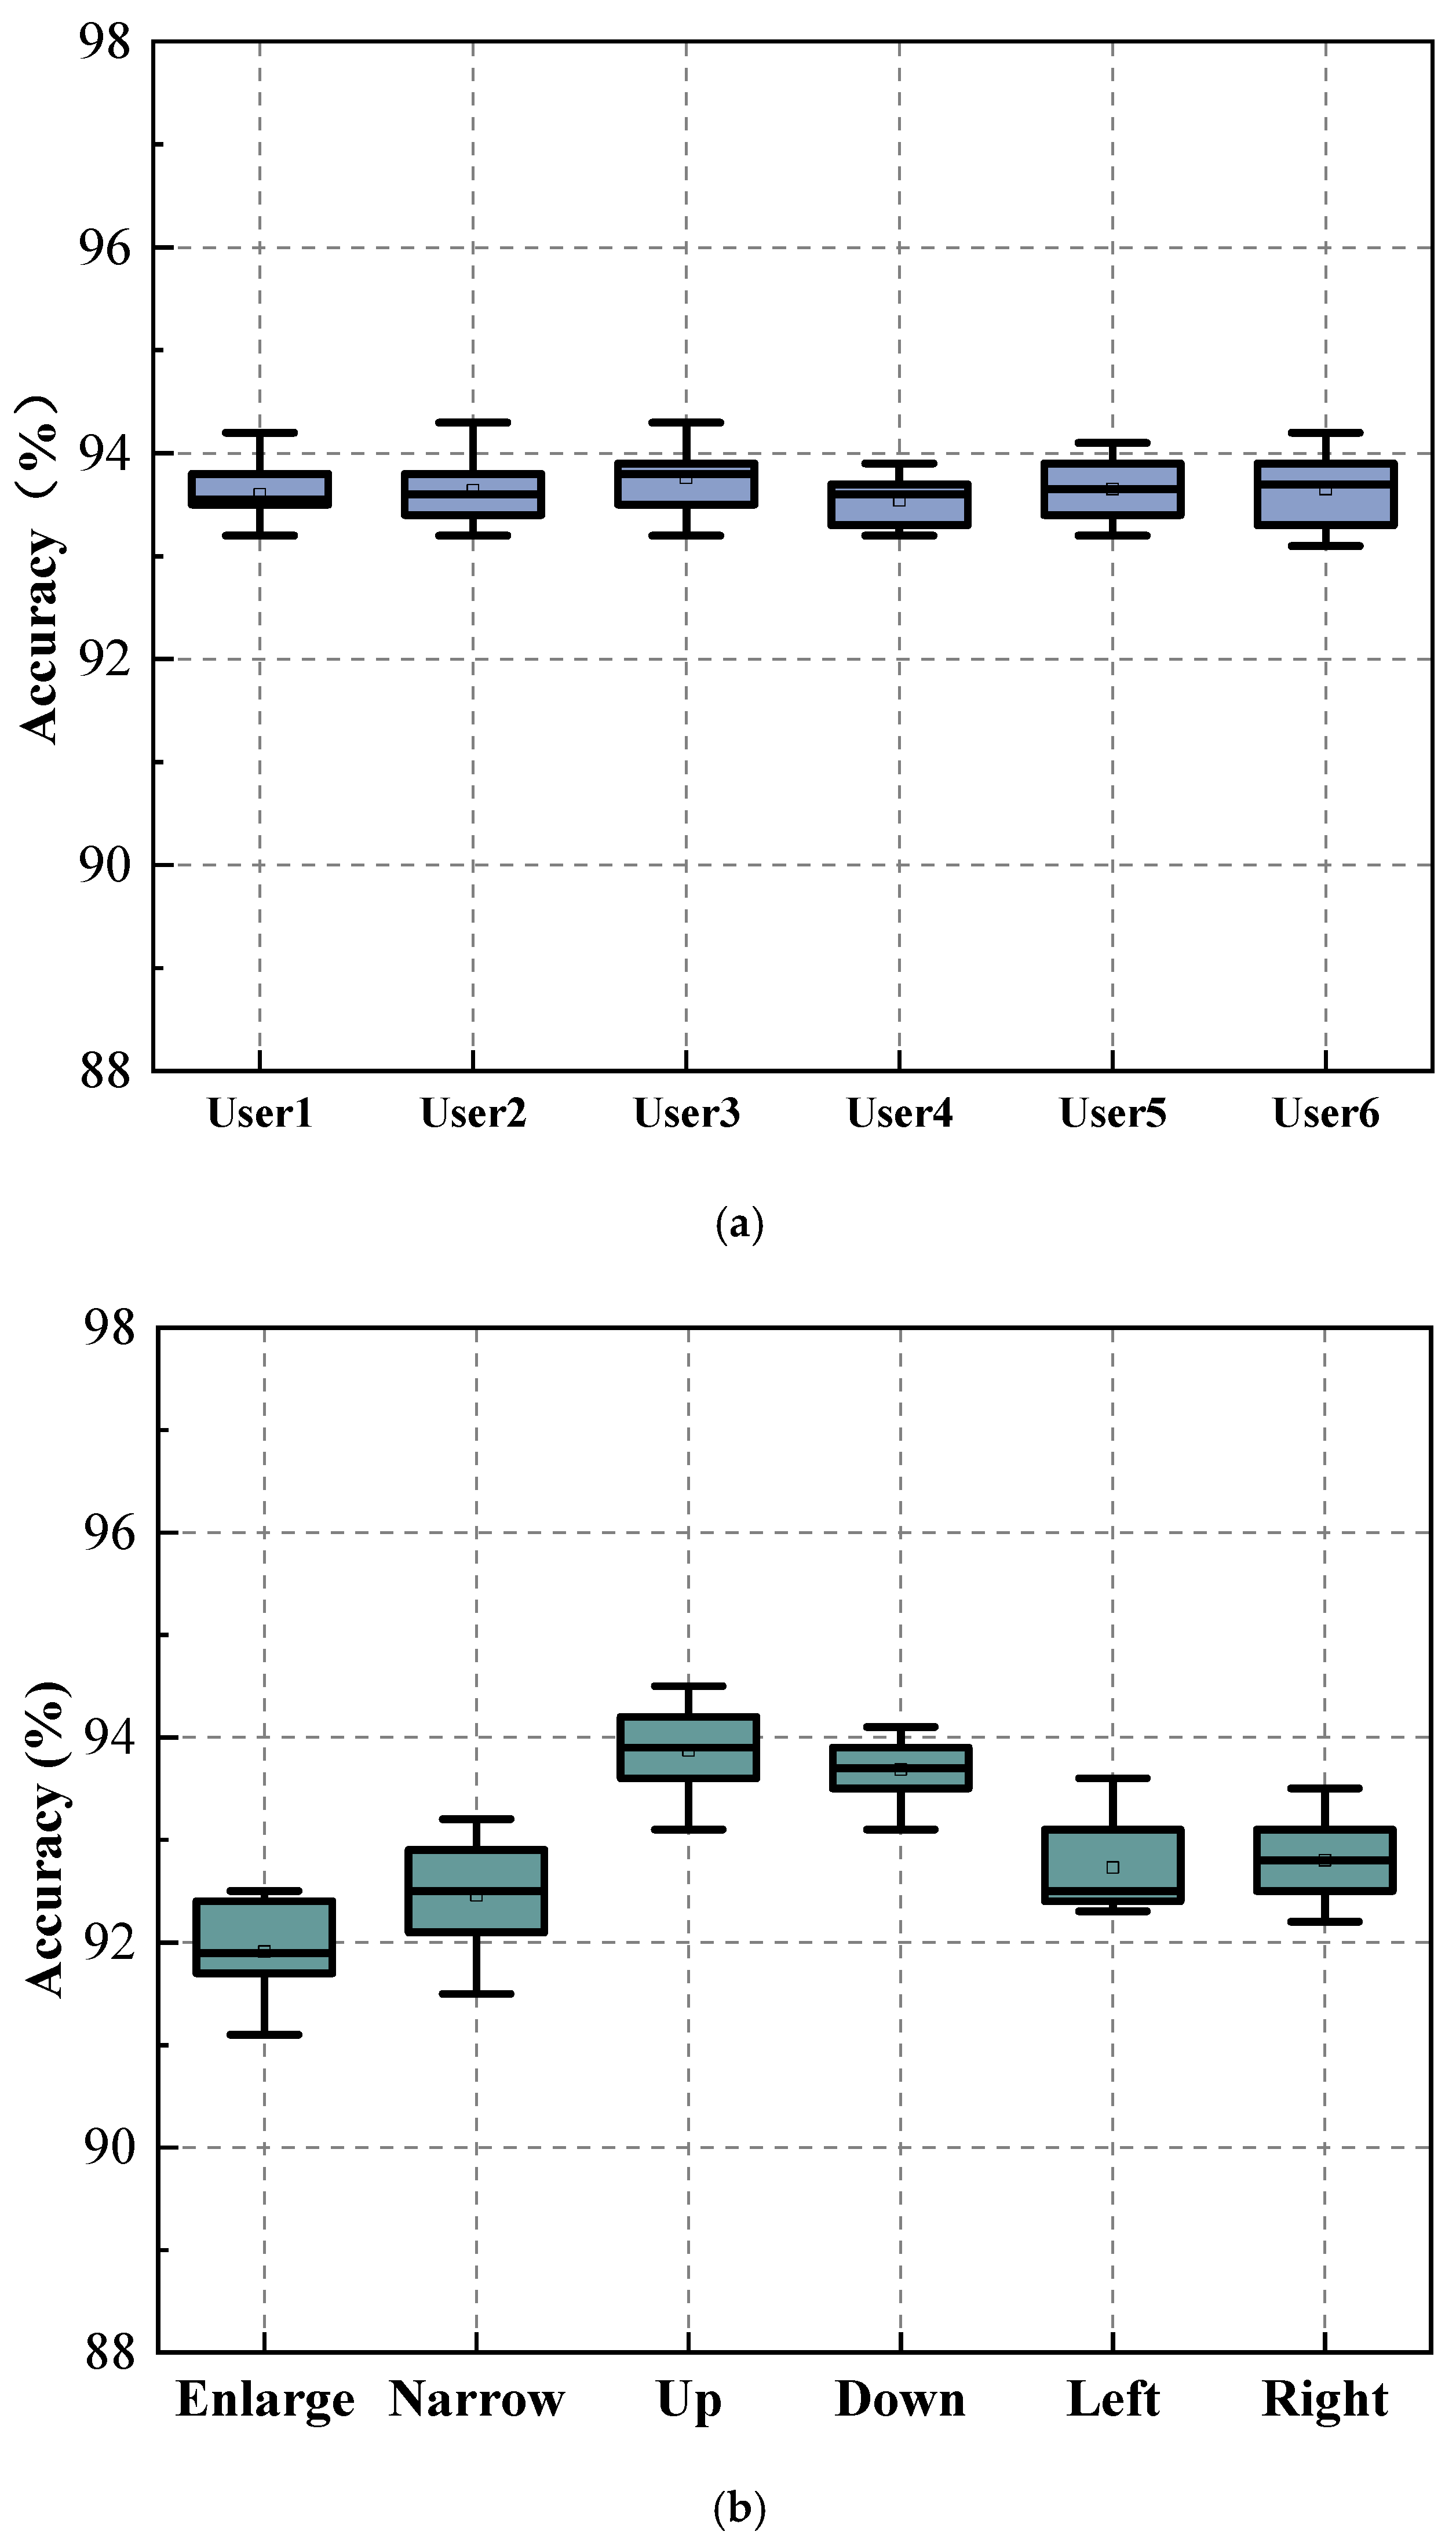
Inter-User Variability: The recognition effect of the same gesture executed by different users (
Figure 11a), where users 1–6 show minimal accuracy differences despite variations in finger width and execution postures. This indicates the method is insensitive to physiological traits like gender, weight, and height.
Intra-User Consistency: The recognition stability of different gestures from the same user (
Figure 11b), where accuracy fluctuations (within 3.2%) due to gesture amplitude variations do not compromise overall performance.
To quantitatively validate generalization to unseen users, a leave-one-user-out cross-validation strategy was adopted. Data from 9 users were used for training, with the remaining 1 user serving as the test set (repeated 10 times). The results (
Table 6) show average accuracies of 93.95% (office) and 94.26% (conference room), with most users deviating <±1.0% from the mean. Notable exceptions (e.g., U7’s 91.57% in the conference room) likely reflect environmental interference rather than user diversity, demonstrating the model’s resilience to outliers.
The above experiments confirm the robustness of SE-WiGR between inter-user physiological differences and intra-user gesture variations, making it suitable for real-world deployments with different user groups.
(2) Impact of speed diversity
Speed is a crucial perceptual dimension when evaluating the impact of WiFi-based devices on gesture recognition, as the same gesture displays unique speed characteristics at various execution speeds. To comprehensively verify the stability and reliability of the gesture recognition system under different speed conditions, in this study, the gesture execution duration of 4 s, as defined in the training dataset, is adopted as the baseline. To assess the system’s robustness across temporal variations, a set of controlled experiments is conducted at three distinct gesture speeds: rapid (2 s), standard (4 s), and slow (6 s). The results of these experiments are shown in
Table 7.
As shown in
Table 7, gesture speed significantly affects recognition accuracy. The average accuracy is 89.66% for fast gestures, 93.95% for normal-speed gestures, and 92.80% for slow gestures. Normal-speed gestures yield the highest accuracy, with Up and Down gestures reaching 94.31% and 94.65%, respectively. In contrast, fast-speed Enlarge and Narrow gestures have the lowest accuracy at 88.57% and 87.72%, while the Down gesture performs best at this speed (91.75%). For slow gestures, Left and Right gestures achieve the highest accuracy (93.37% and 93.46%, respectively), whereas Enlarge accuracy drops to 91.36%. At normal speeds, gestures exhibit stable and easily detectable signal variations, resulting in higher accuracy. Faster gestures, however, introduce pronounced signal changes with additional noise and interference, complicating recognition. Slow gestures produce smoother signal transitions, but their subtlety may also reduce recognizability. The Enlarge and Narrow gestures involve more intricate multi-finger coordination compared to simple linear motions. This complexity leads to lower accuracy, especially at extreme speeds where signal variability and uncertainty further increase recognition difficulty.
(3) Effect of positional diversity
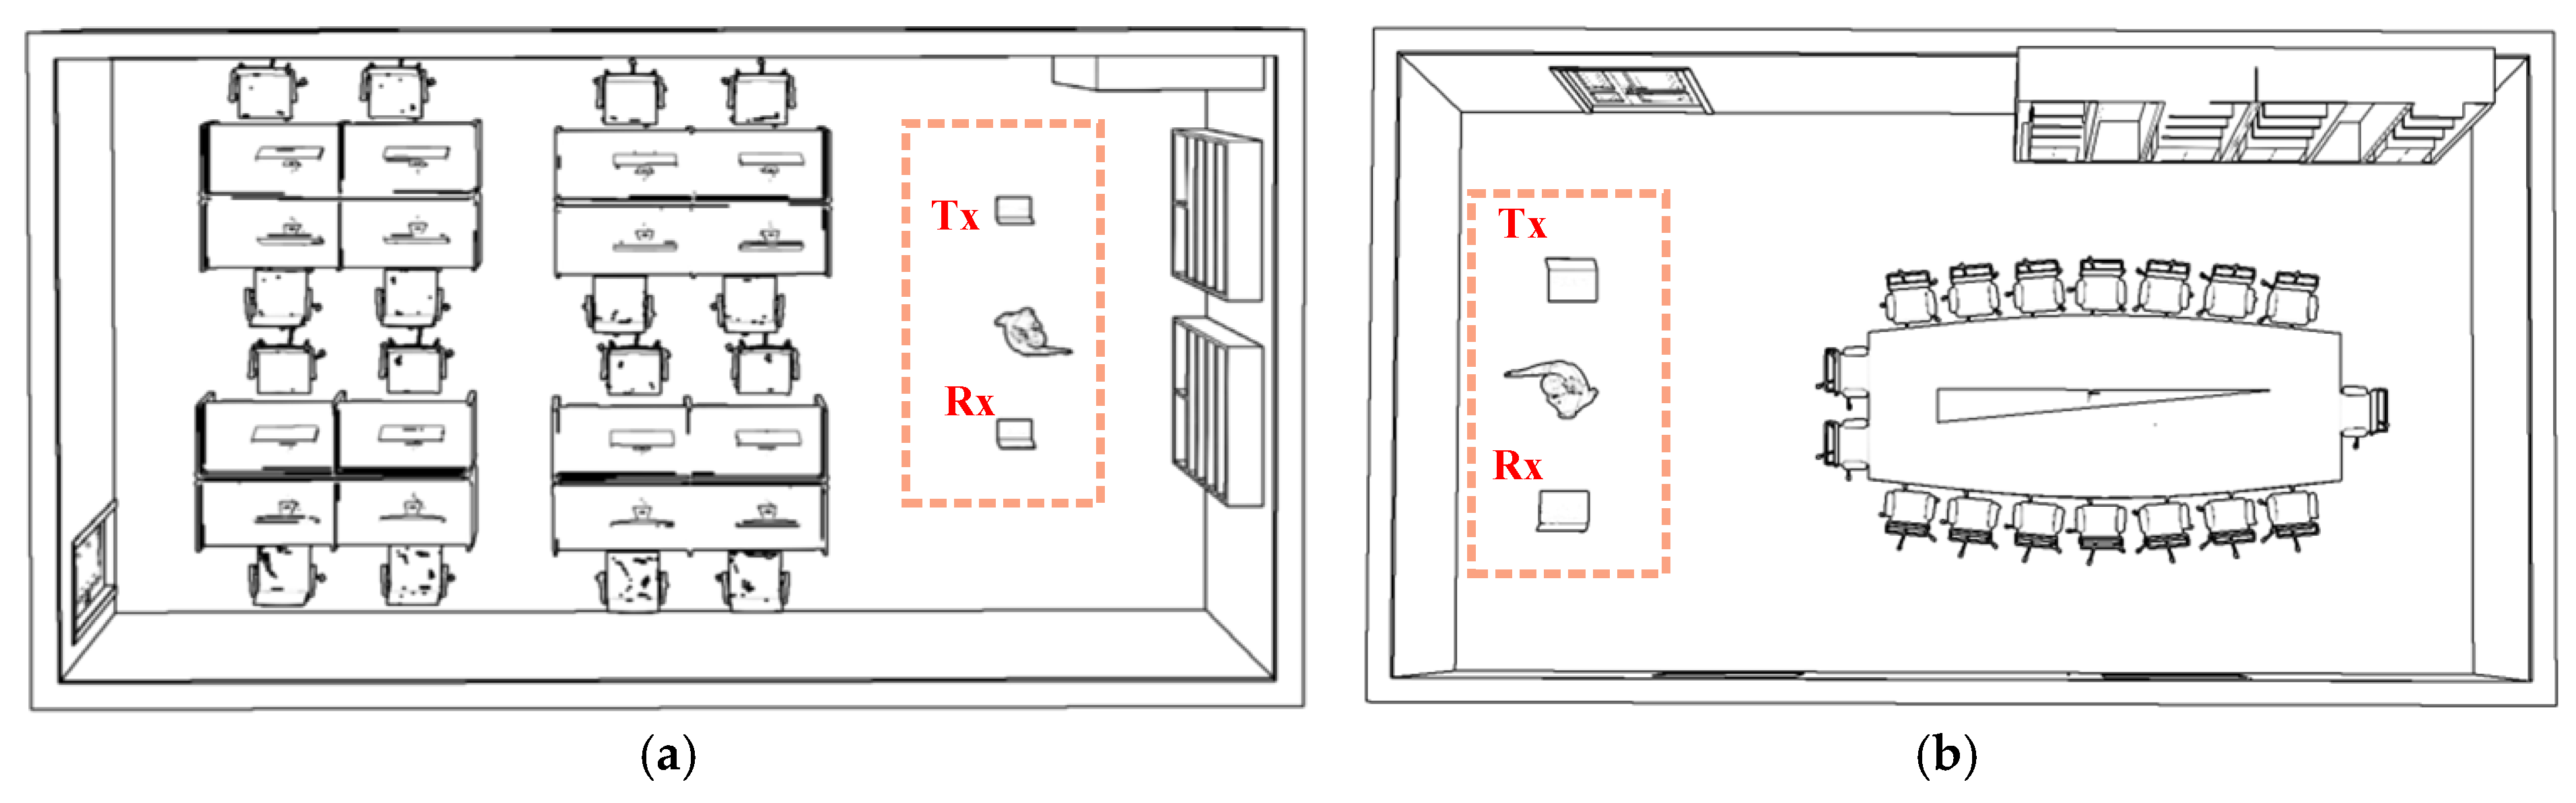
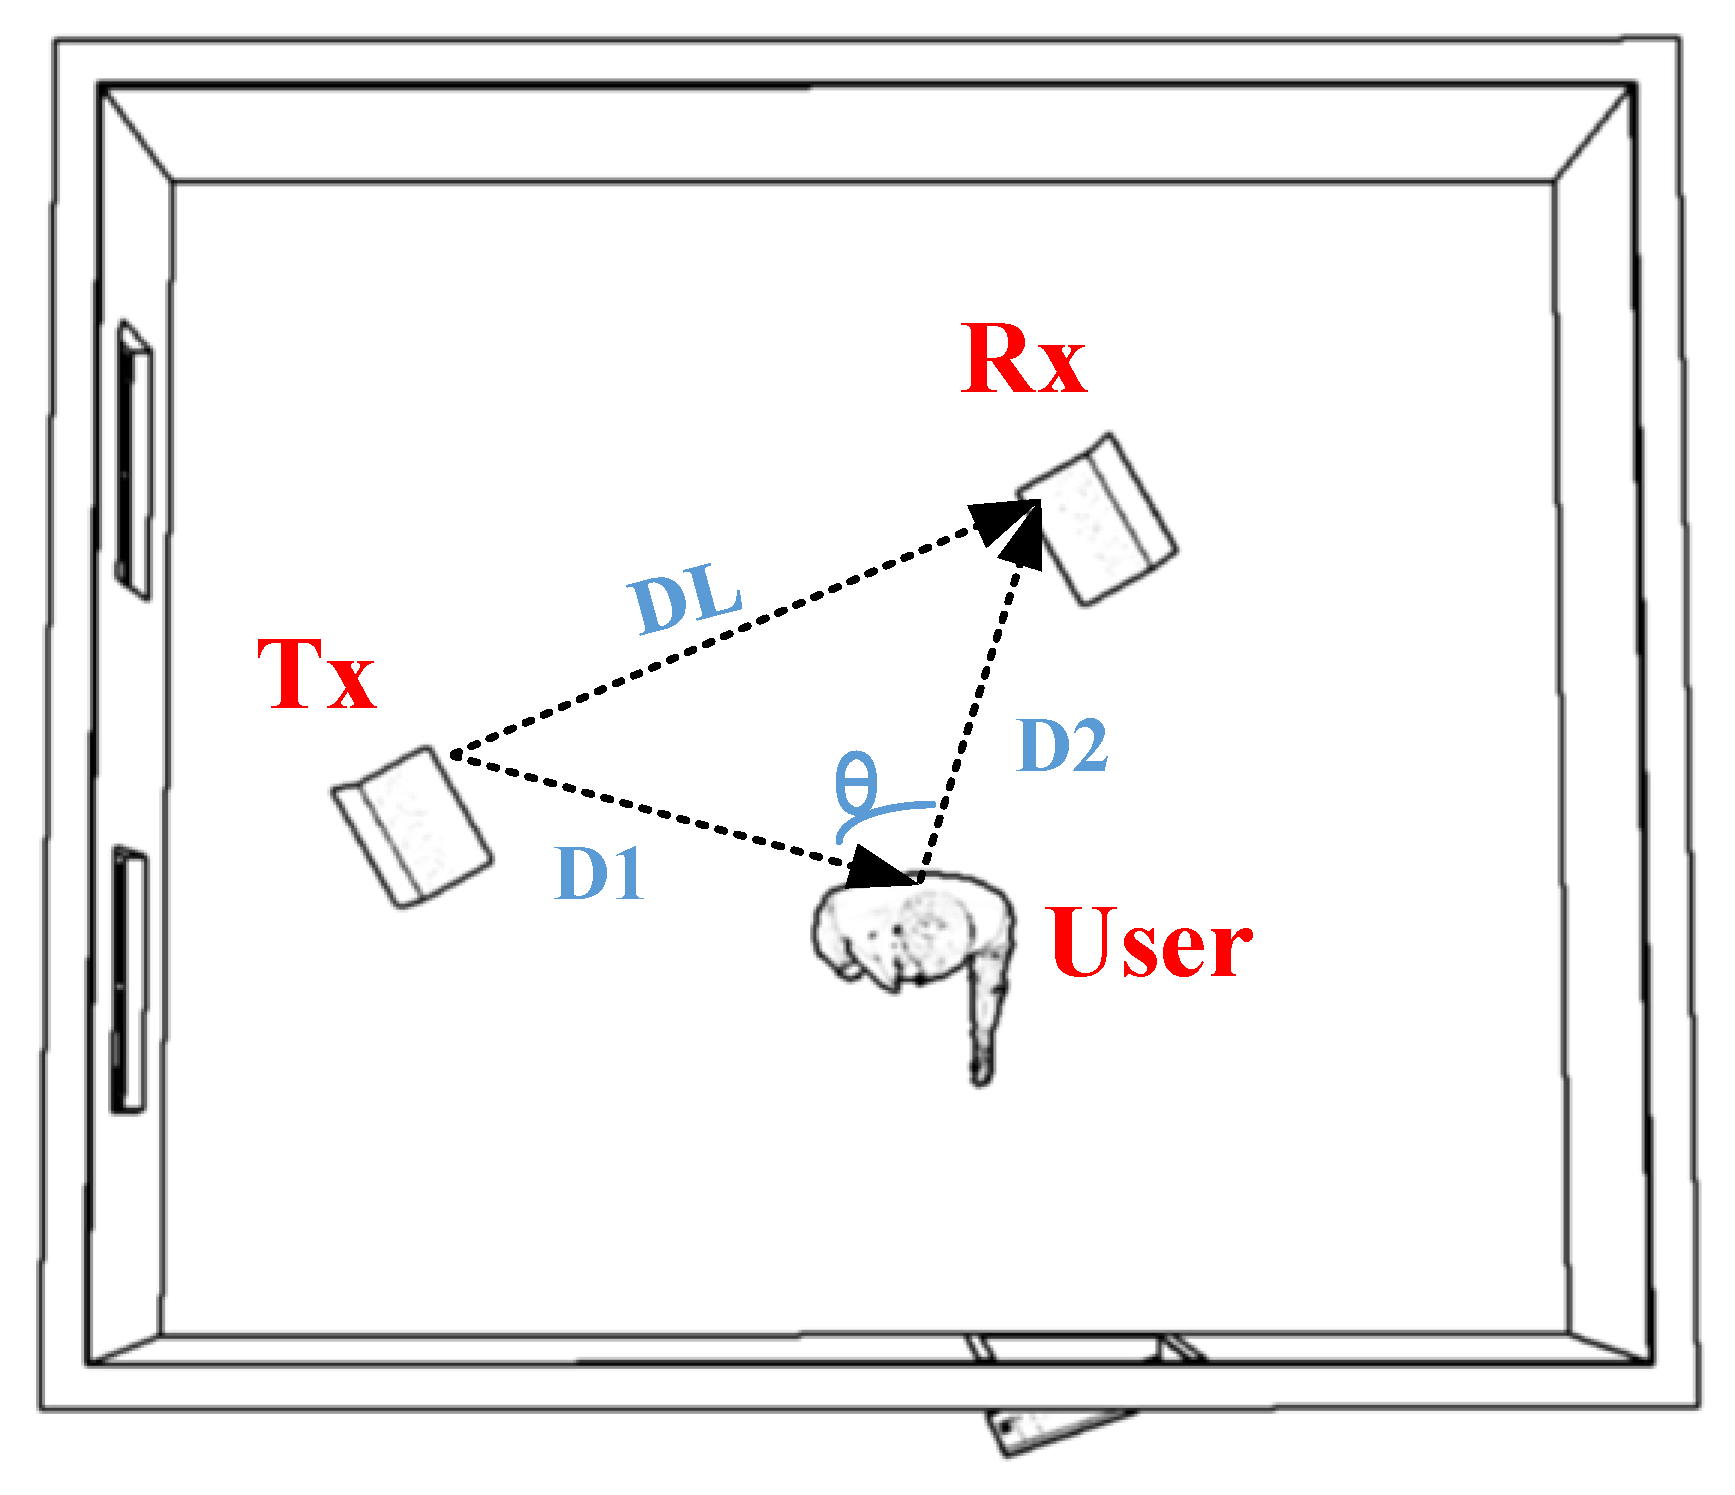
The experiments investigated the attenuation and multipath reflection phenomena of electromagnetic signals as the gesture’s position relative to the device varied. These variations cause differences in the received signals’ amplitude and phase, leading to discrepancies in gesture features related to distance and angle. The impact of these feature variations on gesture recognition accuracy requires further validation. We tested 28 different positions, covering distances (D1 + D2) ranging from 1 m to 4 m and angles (θ) of 0°, 30°, 60°, and 90°. At each position, 10 datasets were collected for each gesture in both office and conference room environments, yielding a total of 560 experimental samples. Using this data, we evaluate the effectiveness of gesture recognition at varying distances and angles to analyze how feature differences affect recognition accuracy. The experimental setup is illustrated in
Figure 12, and the results are shown in
Table 8.
Based on the data in
Table 8, it is evident that recognition accuracy varies significantly with changes in object position and angle, with overall recognition efficiency ranging from 74.36% to 94.25%. Specifically, recognition accuracy peaks at 92.17% when the object is positioned at a 0° angle and a distance of 1 m. In contrast, when the object is placed at a 90° angle and the distance increases to 4 m, recognition accuracy drops to a minimum of 78.75%. Further examination indicates that, under a fixed angular condition, recognition accuracy tends to decline progressively as the distance increases. Likewise, when distance remains constant, variations in the angle also lead to a slight decrease in accuracy, though the extent of this reduction is relatively limited. It is worth emphasizing that although recognition accuracy tends to decline as the distance increases, in practical applications such as smart home interaction or virtual reality systems, the user typically operates within a moderate range from the device. Therefore, the observed reduction in accuracy has a limited impact on the overall user experience.
In the experimental design, when the angle θ between the person and the transceiver device remains constant, the geometry of the signal path stays stable, with the only change being an increase in the total distance (D1 + D2). This alteration results in an elongated signal propagation path, increasing the probability of signal attenuation and interference.
On the contrary, assuming that D1 + D2 remains constant, the accuracy decreases slightly as the θ angle gradually increases from 0° to 90°. This occurs because, at θ = 0°, the signal travels directly along a straight line, making the path the simplest, and the multipath effect has less influence, resulting in the highest recognition accuracy. However, as the θ angle increases, the signal must take a detour, leading to greater diversity and complexity in the propagation path, significantly enhancing the multipath effect. Although D1 + D2 is constant, path variation due to angle changes may cause minor signal strength fluctuations, but these are less significant than those from distance changes.
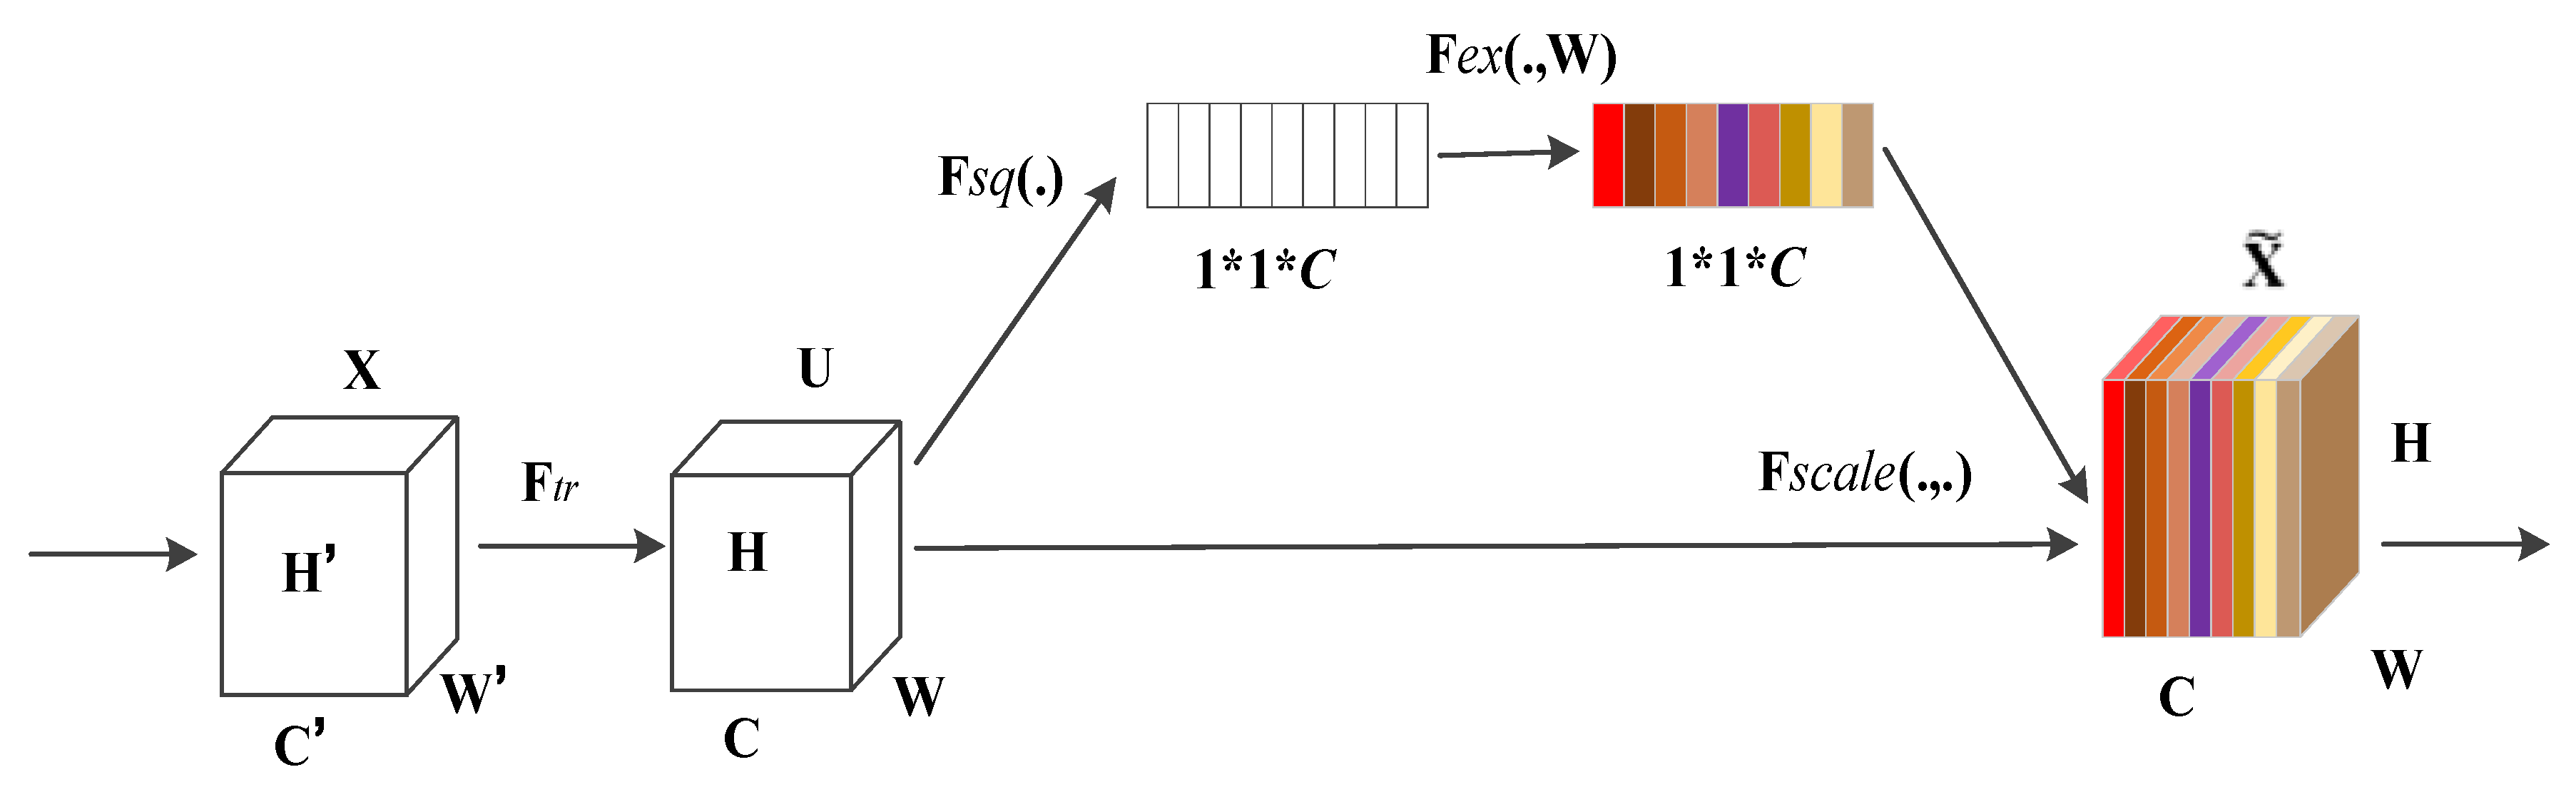
For scenarios where a secondary person performs random movements behind the primary user during gesture execution, the proposed SE-WiGR framework is well-equipped to maintain accurate recognition. The squeeze–excitation (SE) module embedded within the network adaptively recalibrates channel-wise feature responses in the CSI data, enabling the model to prioritize the signal patterns associated with the primary user’s intended gestures. Meanwhile, the hierarchical feature extraction capabilities of the VGG16 network effectively filter out interference from background activities. The robustness demonstrated in previous experiments against environmental noise and occlusions further supports the framework’s ability to handle such complex, real-world interactions.
In addition, combining the data in
Table 8, we can further analyze the mechanism of distance and multipath effect on the recognition accuracy: at closer ranges (e.g., D1 + D2 = 1 m, θ = 0°), the direct signal path dominates with weak multipath interference, enabling CSI to clearly reflect gesture dynamics—“up/down” recognition accuracy reaches 94.25%. At 4 m, signal reflection via walls/furniture causes ~20 dB CSI amplitude attenuation and fuzzy features due to multipath phase superposition, reducing “enlarge/narrow” accuracy to 78.75%, consistent with wireless channel theory.
4.3.3. Model Ablation Experiments
(1) Squeezing operator
In the SE module section, this study compares the effects of two pooling strategies, max-pooling and average-pooling, used in the squeezing operation, with the specific results presented in
Table 9.
From
Table 9, we can see that both pooling methods demonstrate exemplary performance. However, average pooling performs slightly better, which may be due to its greater robustness in handling anomalous or outlier data compared to maximum pooling. It can also better capture the statistical characteristics and patterns of the data. Additionally, this experiment verifies the high robustness of the SE block, as the impact of incorporating the SE block on the performance of the final model remains relatively stable and high, with no significant difference, regardless of the pooling method used.
(2) Different activation functions
The activation functions play a crucial role in neural networks. Their primary function is to introduce nonlinear factors, allowing neural networks to learn and model complex data patterns. Regardless of its depth, such a network would be severely limited in its expressive power, capable only of approximating linear functions or linear combinations, and unable to capture the intricate nonlinear relationships within the data. Therefore, this study investigates the effect of the activation function used for the excitation operator in SE-VGG16 on the results presented in
Table 10. The experimental outcomes in
Table 10 indicate that employing the ReLU activation function yields greater accuracy, making SE-VGG16 more effective.
(3) VGG16 integrates SE blocks at different stages
We integrated SE blocks into each stage of VGG16 sequentially to investigate their impact at different levels of the network. As illustrated in
Table 11, integrating SE blocks at different stages within the VGG16 architecture leads to varying degrees of performance enhancement across the model. This indicates that the benefits produced by SE blocks at various stages are complementary and can collectively enhance the network’s overall performance. Additionally, it is essential to note that while the number of model parameters increases with the addition of SE blocks, this growth remains relatively limited and does not significantly increase model training costs.
(4) Impact of SE: VGG16-SE, NoSqueese, VGG16
To verify the performance of the SE module, we first remove the pooling layer. The original fully connected (FC) layer is replaced with a 1
1 convolutional layer. We refer to the structure after the replacement as NoSqueeze, and the experimental results are shown in
Table 12.
From the detailed data in
Table 12, we can see that the F1 score of the model improves by 4.13% when the SE module is incorporated into the VGG16 network architecture. This improvement is reflected in the increased recognition accuracy and the enhanced learning ability of the model for complex features. Notably, although we introduced the SE module to boost the network’s representation capability, the model’s number of parameters did not substantially increase. This indicates that we successfully optimized the performance of VGG16 while maintaining computational efficiency. This finding is significant for real-world applications, as it allows us to enhance the model’s performance by introducing advanced network modules without sacrificing computational efficiency.
In summary, the data in
Table 12 confirms the significant effect of SE modules on the performance enhancement of the VGG16 network. It also shows that this enhancement is achieved while keeping the model parameters streamlined and ensuring efficient utilization of computational resources. This provides new ideas and directions for us to continue exploring and optimizing deep learning models in the future.


