Abstract
To address the issues of high cutting speeds and low surface precision during milling, this study investigates the effects of front and back cutting face microstructures on ball-end milling cutters processing 304 stainless steel. Firstly, a theoretical energy model for front and back cutting face microstructures is established to verify the feasibility of embedding microstructures. Then, finite element analyses are conducted on cutters with varying microstructure parameters on front and back cutting faces to determine reasonable parameter ranges. Parameter combinations are subsequently used to manufacture front/back microstructured cutters, which undergo FEA validation. Finally, milling experiments are designed with milling forces, tool wear, and workpiece surface roughness as evaluation metrics. The results demonstrate that front/back microstructured cutters reduce milling forces by 19.4%, cutting temperatures by 19%, and workpiece surface roughness (Sa) by 43% compared to non-microstructured cutters, while significantly mitigating tool wear.
1. Introduction
During milling processes, severe frictional contact between the tool surface and workpiece leads to issues such as high temperatures, rapid tool wear, excessive cutting forces, and poor surface quality on the workpiece. These problems are exacerbated under high-speed cutting and dry machining, and when processing hard-to-machine materials, resulting in increased cutting forces, elevated temperatures, and reduced tool life [1]. To address these challenges, biomimetic approaches can be applied. Biomimetic studies reveal that certain animals (e.g., earthworms, pangolins) possess microstructures on their epidermis or exoskeletons, which exhibit friction reduction, anti-adhesion, and hydrophobic properties. Accordingly, fabricating microstructures with diverse morphologies on tool surfaces enhances cutting performance and mitigates tool wear [1,2,3], making this a prominent research focus.
To validate the efficacy of tool surface microstructures in enhancing milling performance, numerous scholars have conducted finite element analyses (FEAs) on microstructures with varied geometries and morphologies [4]. Li Yuanyuan et al. [5] fabricated microstructures on the front cutting face and revealed through FEA and experiments that front cutting face microstructures reduce chip-tool friction and mitigate cutting temperature. Gao Huanhuan et al. [6] designed multiple-surface microstructure types on front cutting faces, demonstrating that groove-shaped microstructures most effectively reduce drilling forces, temperatures, and drill bit wear. Chen Jin et al. [7] developed crescent-shaped microstructure tools inspired by the smooth internal structure of pitcher plants, integrating them into front cutting faces to enhance cutting performance.
Ni Jing et al. [8] fabricated raindrop groove microstructures on the back cutting face of broaching tools. Studies have shown that microstructured tools outperform conventional ones by reducing tapping temperatures, minimizing the thermal deformation of cutting edges, and enhancing tapping performance. Fatima et al. [9] developed bio-inspired scale-shaped microstructures on back cutting faces, inspired by the wear-resistant properties of reptile scales, improving tool wear resistance. Tiffany D. L. et al. [10] designed sub-back cutting face groove-type microstructure tools, validated through titanium alloy machining to effectively reduce adhesion and extend tool life.
Current research indicates that rationally designed surface microstructure cutting tools can enhance cutting performance; however, the effects of microstructures applied at different tool locations exhibit varying impacts on performance improvements. Due to insufficient research on rake face and flank face microstructure, a biomimetic arc-shaped microstructure cutting tool three-dimensional modeling diagram was developed based on the carp arc-shaped scale microstructure shown in Figure 1, as illustrated in Figure 2. This design replicates the natural arcuate scale morphology observed in carp scales to optimize stress distribution. Experimental investigations focused on elucidating the synergistic effect mechanism between the front and back face microstructures.

Figure 1.
Carp scales.
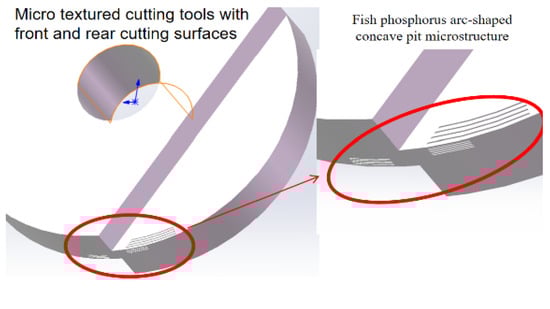
Figure 2.
Three-dimensional modeling diagram.
2. Modeling the Frictional Energy of the Microstructure-Dominated Chip–Contact Interface
2.1. Theoretical Modeling of the Weaving Structure of the Front Blade Surface
A microstructured ball-end milling cutter with planar-edge microtextures was selected for modeling. To simplify the analysis of the cutting process, the energy generated during metal chip formation was categorized into two types, shear energy in the first deformation zone and frictional energy in the second and third deformation zones, as illustrated in Figure 3. According to the functional mechanism of microstructures, their friction reduction and wear resistance primarily manifest in the second and third deformation zones.
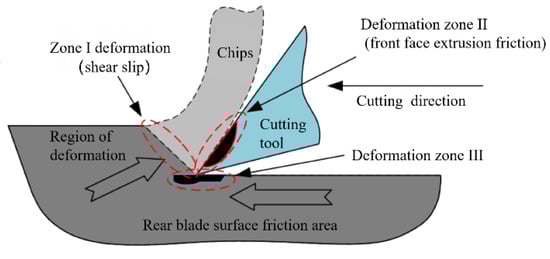
Figure 3.
Cutting deformation zone.
The cutting energy U per unit of time is divided into two main parts, the shear energy per unit of time Us and the friction energy per unit of time [11], as shown in Equations (1)–(3).
where Fs is the shear force; Vs is the shear velocity; Ff is the friction force; Vc is the chip velocity. The microwaving cutting model of the front surface of the blade is shown in Figure 4.
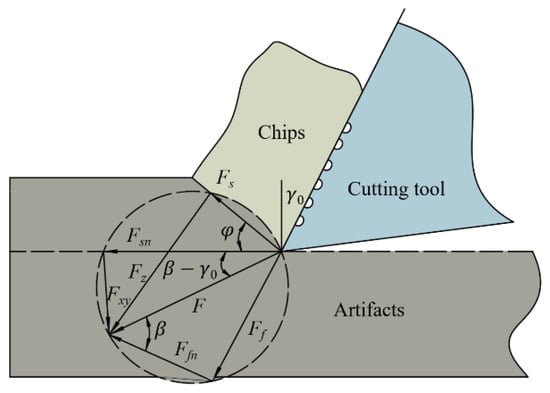
Figure 4.
Microtexture cutting model of rake face.
The shear force Fs in Figure 4 can be expressed as follows:
where is the shear strength of the workpiece; is the shear area.
According to the micro-weave cutting model of the front blade face in Figure 2, the relationship between the shear force Fs, friction force Ff, and the combined force F is shown in Equations (5)–(7).
where is the friction angle; is the precession angle Equation; is the shear angle.
The combination of Equations (4)–(6) results in :
The effective frictional area between the tool and chip is set as , and the relationship between and is given by Equation (9).
From Equations (8) and (9), the expression for is changed to Equation (10).
The shear velocity and chip velocity are related to the cutting speed , lead angle, and shear angle, as shown in Equation (11) and Equation (12), respectively.
Based on Equation (3) and Equation (9), the expression for the friction energy at the front face during cutting is as follows:
The microtexture is placed in the chip contact area of the ball-end mill, and the effective friction area of the actual contact after the weaving is placed is called .
where is the area of a single microtome, is the effective friction area, and is the number of microtomes.
In summary, the energy of new friction between the front face of the microtexture configuration ball-end mill and the chip is as follows:
Equations (14) and (15) show that incorporating the microtexture structure on the face of the ball-end mill reduces the effective frictional surface between the tool and the chip, thus reducing the frictional energy to a certain extent.
2.2. Theoretical Modeling of the Weaving Structure of the Rear Blade Surface
During milling, plastic deformation occurs on the frictional surfaces of the tool, storing strain energy in deformed regions. As the original surface wears away, new surfaces formed during subsequent machining generate additional deformation. These accumulated strain energies are predominantly converted into heat during the milling process [12].
During milling, the front and back cutting faces exhibit similar frictional interactions with the workpiece, but the back cutting face demonstrates two distinct friction regimes: one characterized by tight-contact dominance, as shown in the AB segment deviating from Coulomb friction theory, and another partially obeying classical sliding friction laws where frictional force correlates linearly with normal pressure as shown in the BD segment presented in Figure 5 illustrating back cutting face microstructures [13].
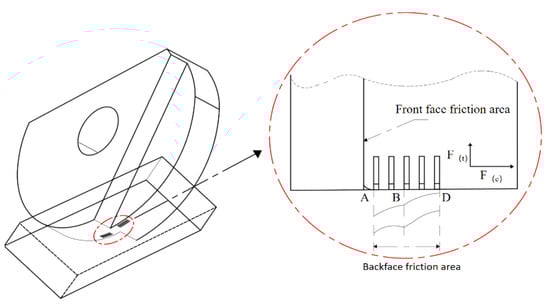
Figure 5.
Back cutting face microstructures during milling operations (A,B,D are milling positions).
Assuming the relative sliding velocity between the back cutting face and the machined surface over the entire contact zone equals the shear velocity of the workpiece, the friction coefficient on the back cutting face can be expressed as Equation (16), where a, c, and k are undetermined parameters satisfying 0 < k < 1. As shown in Figure 5, Point A represents the intersection of the back cutting face and the cutting edge arc, where the tangential contact stress is zero. The total length of the back cutting face friction zone AD is denoted as lAD.
In the contact zone AB between the back cutting face and the machined workpiece, normal stress induces plastic strain during tool–workpiece contact, achieving tight contact. Embedding microstructures in zone AB effectively reduces frictional interaction.
The normal contact stress in the friction region of the back surface of the tool is distributed in an exponential form as shown in Figure 5; in the contact region near the cutting edge of the tool, the material will flow plastically and the normal contact stress of the tool will change drastically, which can be expressed as Equation (17).
where is the stress distribution coefficient of the tool surface, is the maximum positive stress at the cutting edge of the tool, and is the distance from any point in the friction region to point A.
The sectional distance of the friction area is , the sectional distance of the friction area BD is , the total friction length is , the friction force in the close contact area between the rear blade surface of the micro-weaving tool and the workpiece is , and the normal force in the total friction area of the rear blade surface of the tool is . The relationship between the two and the tangential contact stress and the normal contact stress is represented by Equations (19) and (20).
The expression for the friction energy on the back face was calculated as (21), employing the identical energy model for the chip–contact interface on the front face.
Analysis based on Equation (19) indicates that the frictional force on the back cutting face is proportional to the contact length lAB in the tight-contact zone. Embedding microstructures on the back cutting face reduces the contact length lAB, thereby decreasing frictional force and frictional energy generation. Equation (20) further reveals that the normal stress generated by the interaction between the back cutting face and machined surface is directly correlated with the total contact length lAD. By embedding microstructures in non-tight-contact zones (where friction coefficients remain constant), normal stress is reduced, achieving frictional energy reduction. Ignoring heat dissipation to the atmosphere, frictional energy between the back cutting face and workpiece is fully converted into heat; thus, microstructure integration on the back cutting face partially mitigates heat generation.
Based on theoretical studies on microstructure integration on rake and back cutting faces, the feasibility of microstructure-enhanced tooling was demonstrated. A finite element analysis (FEA) computational model was established to simulate machining processes, with experimental validation conducted through tribological and wear resistance assessments.
3. Finite Element Modeling
The question about the chemical composition of stainless steel 304 is investigated in this study, which employs 304 stainless steel as the material [14] for simulations and experiments. Briefly, 304 stainless steel is a versatile austenitic stainless steel with a chemical composition comprising the following: carbon (C) ≤ 0.08%, silicon (Si) ≤ 1.00%, manganese (Mn) ≤ 2.00%, phosphorus (P) ≤ 0.045%, sulfur (S) ≤ 0.03%, chromium (Cr) 17.00–20.00%, and nickel (Ni) 8.00–10.50%. This material exhibits excellent corrosion resistance, formability, and weldability, making it highly suitable for precision machining applications.
Building upon the front cutting face analysis, finite element analysis (FEA) was conducted for simulation and experimental validation. The workpiece material was defined as a 20 mm × 10 mm × 5 mm 304 stainless-steel cube. Key parameters included a milling speed of 5000 r/min, a milling depth of 3 mm, and an initial material temperature of 25 °C. The material model parameters and 304 stainless steel properties are listed in Table 1 and Table 2. Finite element software: Abaqus 2019 was used to create four tool configurations, non-textured tools, front-cutting-face-textured tools, back-cutting-face-textured tools, and combined front/back-cutting-face-microstructured tools, followed by FEA-based simulations.

Table 1.
Material parameters of 304 stainless steel based on Johnson Cook model.
Table 2.
Basic parameters of 304 stainless steel.
This study designates four tool configurations with abbreviations: T1 (non-microstructured tool), T2 (front-cutting-face-microstructured tool), T3 (back-cutting-face-microstructured tool), and T4 (front-/back-cutting-face-microstructured tool).
4. Orthogonal Tests of Microstructure Parameters
4.1. Effect of Different Microstructure Parameters on Milling Force on the Front Face of the Cutter
In the design of microstructure cutting tools, the geometric parameters of groove microstructures significantly influence cutting performance. Research indicates that when the groove texture width (D) is D = 50 μm, a balanced state between oil retention capacity and stress distribution can be achieved. However D = 90 μm may induce stress concentration; thus, the recommended range for D is 30 μm, 50 μm, and 70 μm. For microstructure depth (H), a H = 40 μm configuration demonstrates superior oil film load-carrying capacity, while H = 70 μm reduces tool rigidity. Consequently, H should be selected from 20 μm, 40 μm, and 60 μm. Regarding microstructure spacing (L1), a spacing of L1 = 120 μm ensures favorable hydrodynamic lubrication effects between adjacent microstructure units, whereas excessive spacing at L1 = 150 μm may cause oil film rupture. Therefore, L1 should range within 100 μm, 120 μm, and 140 μm. For the distance from microstructures to the cutting edge (L2), L2 = 120 μm effectively prevents chip adhesion while maintaining edge strength. When L2 = 160 μm, the microstructures become too distant from the cutting edge to fully utilize their beneficial effects, making the permissible range for L2 80 μm, 100 μm, and 120 μm.
A four-factor three-level 9-group orthogonal experimental design was established and an orthogonal array, shown in Table 3, was created. The data were imported into Abaqus 2019 software: Abaqus for simulation, and front-cutting force results, presented in Table 4, were obtained using nine distinct experimental parameter sets.
Table 3.
Nine sets of microtexture-parameter-factor-level table.
Table 4.
The results of the temperature of the front cutting surface and milling force.
Based on the milling force simulation data from Table 4, range analysis was applied to process the data and generate an intuitive analysis table for front-cutting force, as shown in Table 5.
Table 5.
Variance analysis of milling forces on the front face of a cutting tool.
A range analysis was conducted on Table 6, revealing the order of range values for the four factors as L2 > H > D > L1. The magnitude of the range reflects the degree of influence on cutting force, establishing the impact hierarchy: L2 > H > D > L1. The findings indicate that L2 exhibits the highest variance contribution, signifying its significant effect on cutting force, while L1 has the smallest variance contribution. This ranking aligns with Song Shuangzhu’s [15] research on the relationship between microstructure geometric parameters and milling force. The variation trend of tool parameters’ influence on cutting force is illustrated in Figure 6.
Table 6.
Variance results of milling force.
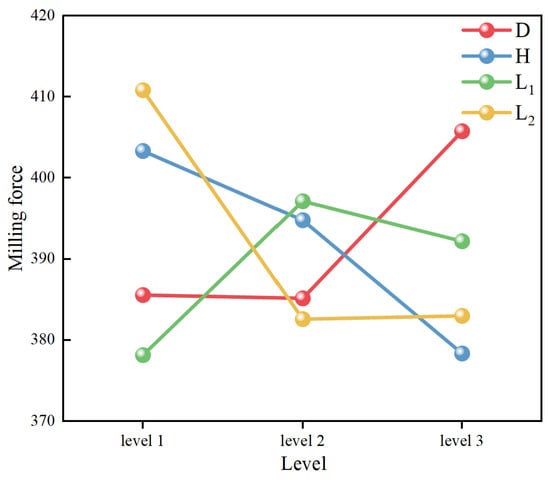
Figure 6.
The influence of different textures on cutting force.
As shown in Figure 4, the cutting force exhibits an initial decrease followed by an increase as L2 increases. During L2 adjustment from Level 1 to Level 2, the stress concentration at the tool–chip interface decreases, enhancing the tool’s wear and friction reduction performance, thereby reducing the milling force. However, L2 increases from Level 2 to Level 3, and the microstructure’s effectiveness in force reduction diminishes, leading to increased cutting forces. For parameter H, increasing H from Level 1 to Level 3 progressively reduces the milling force. This is attributed to the enhanced debris collection capacity of deeper microstructures, which lowers cutting resistance. Conversely, as L1 increases, the cutting force initially rises. For L1, from Level 1 to Level 2, the enlarged-texture area improves debris collection, reducing forces. However, for L1, at Level 3, reduced groove density per unit area weakens wear and friction reduction effects, resulting in force escalation.
In conclusion, when selecting parameters based on tool milling force criteria, the optimal groove microstructure parameters derived from Table 4 are as follows: D = 40 μm, H = 60 μm, L1 = 100 μm, and L2 = 100 μm.
4.2. Temperature Effects of Different Microtexturing Parameters on the Front Blade Surface
The microstructure parameters from Table 3 were imported into finite element simulation software: Abaqus 2019 for simulations, obtaining the front cutting face temperature results shown in Table 7 during milling. These data were processed using range analysis, shown in Table 8, to derive intuitive temperature distribution metrics for the front cutting face.
Table 7.
The result of milling temperature.
Table 8.
Polar visualization analysis of milling temperatures.
Based on the data from Table 8, a temperature range analysis chart for front-cutting-fac- microstructure tools was generated, as illustrated in Figure 7.
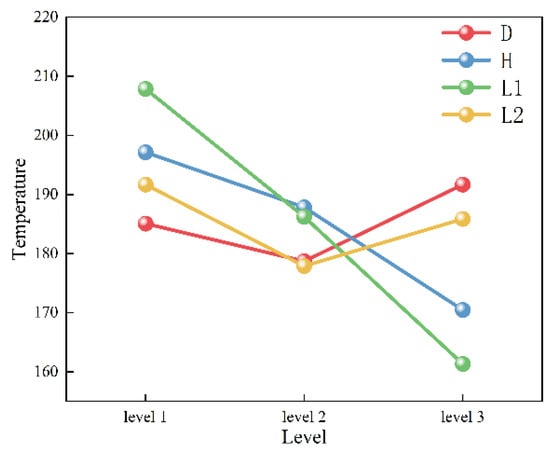
Figure 7.
The influence of different textures on temperature.
According to Table 9, the descending order of ranges for the four microstructure parameters is L1 > H > L2 > D. The magnitude of the range reflects the influence degree on temperature, thereby determining the parameter impact sequence on temperature as follows: L1 > H > L2 > D. This indicates that L1 exerts the most significant influence on temperature, while D has a minimal effect.
Table 9.
Variance analysis of milling temperature.
As shown in Table 8 and Figure 7, the temperature of front-cutting-face-microstructure tools exhibits distinct trends with parameter variations: as L1 increases from Level 1 to Level 3, the temperature initially decreases due to optimized L1 reducing the chip friction area while increasing the microstructure’s heat dissipation surface area, enhancing heat exchange with external media. When H is elevated from Level 1 to Level 3, temperature decreases as the enlarged microstructure’s surface area improves the overall heat dissipation capacity. For D, temperature reduction occurs at Level 1 to Level 2 due to wider grooves improving chip containment and wear resistance, but rises at Level 3 as the excessive groove width forms cutting edges that induce secondary cutting effects, increasing heat generation. With L2 increasing from Level 1 to Level 2, temperature declines as microstructures within the effective cutting zone enhance heat dissipation; however, further elevation to Level 3 causes a temperature rise due to microstructures exceeding the optimal cutting range, reducing efficacy and increasing cutting heat.
In conclusion, when selecting a tool’s microstructure parameters based on cutting temperature criteria, the optimal groove microstructure parameters are determined as follows: D = 50 μm, H = 40 μm, L1 = 140 μm, and L2 = 80 μm.
When simultaneously evaluating the combined effects of temperature and cutting force on cutting tools, this study utilized Grey Relational Analysis (GRA) to analyze Table 4, Table 5, Table 7, and Table 8. The results, as shown in Table 10, revealed that among the microstructural parameters (D, H, L1, L2), H exhibited the highest relational degree (0.777, optimized to 60 μm), followed by D (diameter, 0.738, optimized to 50 μm). In contrast, the microtexture spacing parameters for L1/L2 showed lower correlations (0.743/0.678, optimized to 100 μm each). The optimal parameter combination was determined as D = 50 μm, H = 60 μm, L1 = 100 μm, and L2 = 100 μm.
Table 10.
Grey Relational Analysis (GRA) results.
4.3. Effect of Milling Force on the Back Face of the Cutter with Different Microwaving Parameters
Nine groups of parameters, shown in Table 11, with identical quantities but varying configurations were designed for back-cutting-face microstructures, mirroring the parameter count of front-cutting-face microstructures to ensure uniformity. Simulation results of temperature and cutting force for tools with varying microstructure parameters are presented in Table 12.
Table 11.
Visual analysis of milling temperature.
Table 12.
Temperature and cutting force results.
According to Table 12, microtextures on the flank face demonstrate minimal improvement in milling force optimization, eliminating the need for range analysis. Based on milling force considerations, the optimized microstructure parameters for the flank face are configured as follows: D = 40 μm, H = 50 μm L1 = 160 μm, and L2 = 130 μm.
4.4. Effect of Temperature on the Back Face of the Cutter with Different Microtexturing Parameters
Compared to the impact of back-cutting-face microstructures on milling force, microstructure effects on temperature are more significant. Simulation data derived from experiments, processed via range analysis, yield intuitive temperature analysis results for back-cutting faces in Table 13.
Table 13.
Variance analysis chart of rear blade surface temperature.
Using range analysis on the range values of the data, the temperature effect curve of microstructures is derived and visualized in Figure 8.
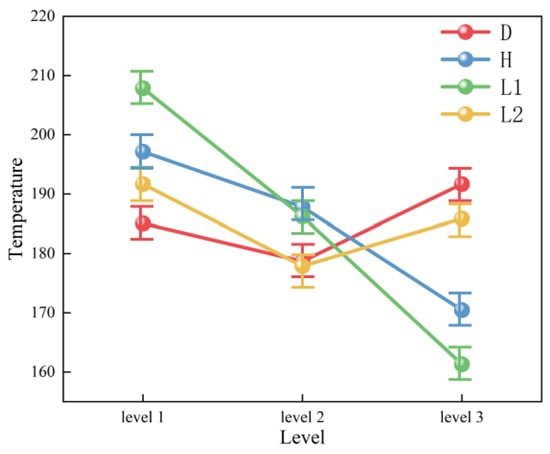
Figure 8.
Temperature effect curve of microstructures, derived and visualized.
During the tool simulation process, the tool temperature gradually increases. As L1 increases, the tool temperature initially shows a significant downward trend. This is attributed to the reduced friction area between chips due to optimized microstructure spacing, while the total microstructure area increases, enhancing heat dissipation efficiency at the cutting edge. When H increases, the tool temperature decreases markedly, as the inner surface area of the microstructures expands, improving the tool’s heat dissipation capacity. An increase in D further reduces tool temperature by enlarging chip containment volume and enhancing anti-friction performance. Conversely, as L2 increases, the tool temperature rises because the effective cutting section of the microstructures diminishes, leading to greater heat accumulation.
Considering both tool temperature and cutting force, based on Grey Relational Analysis (GRA) from Table 11, Table 12 and Table 13, the optimal back microstructure parameters for the cutting tool are determined as D = 40 μm (groove width), H = 50 μm (groove depth), L1 = 140 μm (spacing), and L2 = 90 μm (density), as shown in Table 14. This parameter combination demonstrated the highest comprehensive relational degree (D: 0.667, H: 0.683, L1: 0.768, L2: 0.785) in the GRA ranking, confirming its superiority in minimizing tool temperature while balancing cutting force requirements.
Table 14.
Back microstructure results from GRA.
5. Simulation Study of Front- and Back-Microstructure Tools
Based on simulation studies of T2 and T3, appropriate front cutting face and back cutting face microstructure parameters were selected for application on T4 tools to conduct simulation experiments. The front-cutting face parameters for T4 tools were defined as follows: D = 50 μm, H = 60 μm, L1 = 100 μm, and L2 = 100 μm. The back cutting face microstructure parameters were specified as follows: D = 40 μm, H = 50 μm, L1 = 140 μm, and L2 = 90 μm.
A comparative analysis of temperature and milling force simulation results for four tool configurations is presented in Figure 9. During the initial simulation phase (AB segment), the T4 tool exhibited a slower temperature rise compared to other tools. In the BC segment, microstructures became active: they initiated chip collection and reduced friction between the cutting face and workpiece, thereby decelerating the temperature increase. Notably, T4 maintained a more stable thermal profile than other tools, achieving a significantly lower peak temperature at the machining completion stage.
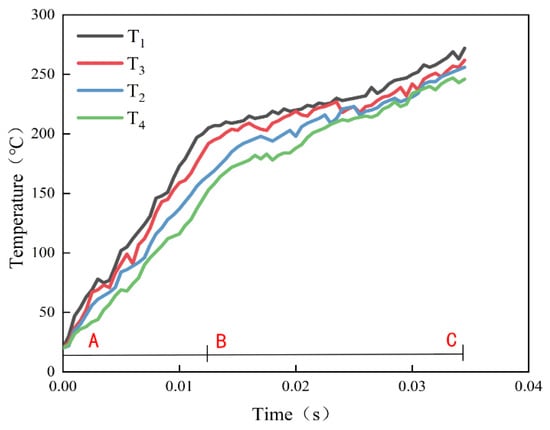
Figure 9.
Temperature comparison chart (A,B,C are milling processes).
A comparative analysis of average temperatures for four tool configurations is shown in Figure 10, with the temperature ranking as T1 > T3 > T2 > T4. The dual microstructures of T4 demonstrated superior thermal performance by reducing a temperature rise, caused by metal shear slip and extrusion friction near the cutting edge on the back cutting face, further minimizing tool–chip friction, lowering frictional heat generation, and enhancing the heat dissipation area. Compared to T1, T4 achieved a 19% reduction in temperature, demonstrating its effectiveness in lowering tool temperature and significantly improving overall thermal conductivity.
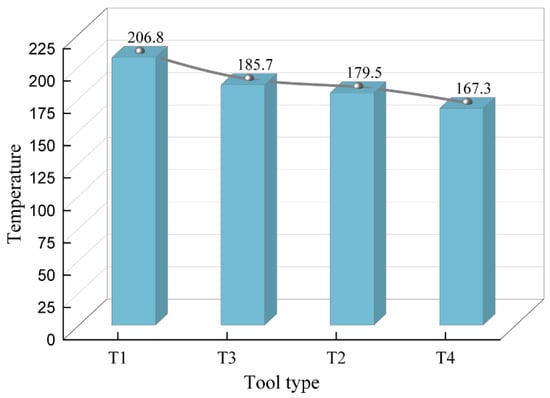
Figure 10.
Four types of tool temperatures: a comparison chart.
As shown in Figure 11, during the AB segment, the tool begins milling the workpiece. The workpiece undergoes elastic deformation under tool indentation, with shear stress continuously increasing until the material reaches its maximum allowable strain. At this point, the cutting layer fractures, causing an instantaneous stress drop on the tool. In the BC segment, the metal is separated from the workpiece and flows along the front cutting face as chips. Here, the front cutting face microstructures reduce friction between chips and the tool. Simultaneously, the back cutting face microstructures store chips, lowering the temperature on T4’s back cutting face and indirectly reducing milling forces.
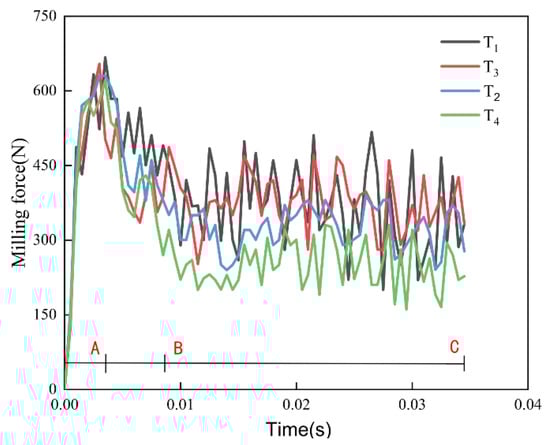
Figure 11.
Comparison chart of milling forces (A,B,C are milling processes).
The average milling forces for the four tool configurations are presented in Figure 12. The findings indicate that the milling forces of T4 and T2 are comparable, with T4 showing a 14% reduction compared to T3 and a 16% decrease relative to T1. Compared to T1 and T2, T4 demonstrates superior capability in reducing milling forces generated during machining.
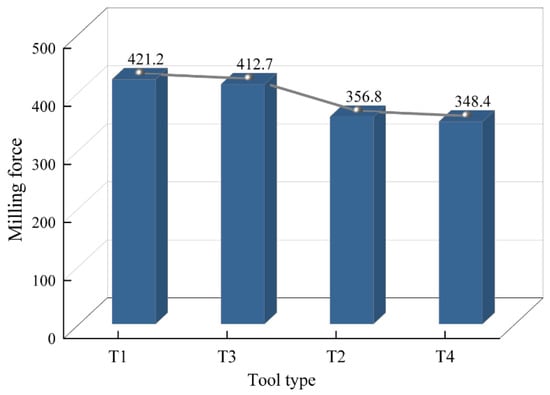
Figure 12.
Comparison diagram of milling forces for four types of cutting tools.
6. Milling Test
6.1. Milling Force Test Analysis
The T2, T3, and T4 tools in Figure 13 were fabricated via fiber laser machining. The simulation-derived tool parameters were applied to the experimental tools, which underwent milling tests on a three-axis vertical machining center using unidirectional climb milling. The milling parameters matched simulation settings to ensure accuracy: spindle speed = 5000 r/min, feed rate = 0.5 m/min, milling path length = 120 mm, and cutting depth = 0.35 mm. The workpiece was clamped at a 0° angle relative to the machine tool guide rail horizontal plane. Milling forces, tool wear amounts, and workpiece surface roughness were analyzed for all three tool configurations.
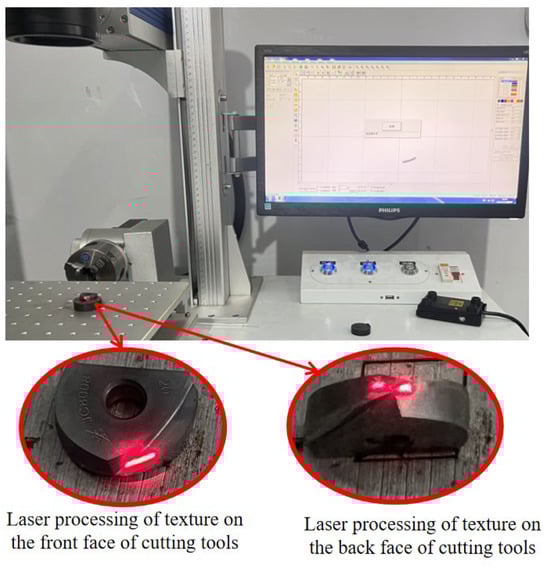
Figure 13.
Laser preparation of microtextured cutting tools.
Milling tests were conducted on four tool configurations. During stable milling phases, force dynamometers were used to capture milling forces, as shown in Figure 14 and Figure 15.
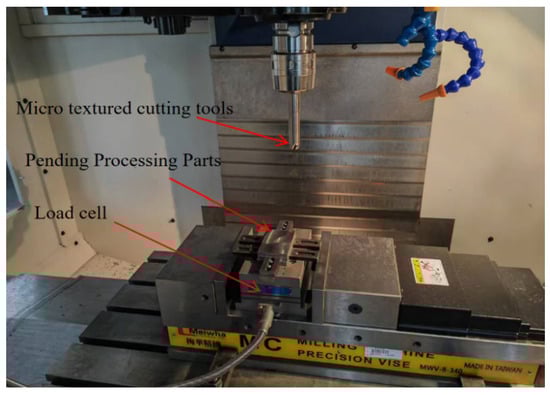
Figure 14.
Milling force test.
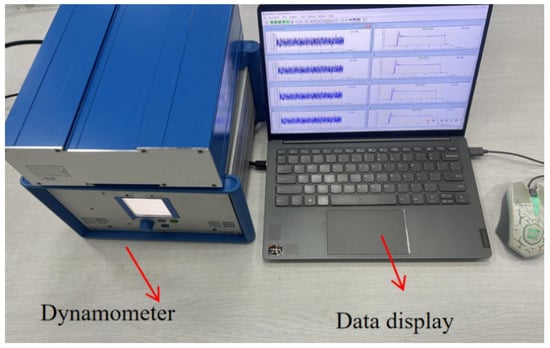
Figure 15.
Milling force acquisition device.
The milling forces for the four tool configurations are shown in Figure 16, Figure 17, Figure 18 and Figure 19. The resultant milling force calculation is presented in Equation (22).
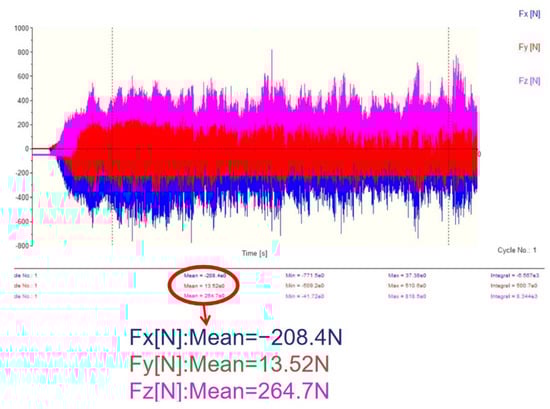
Figure 16.
T1 milling force (336.4 N).
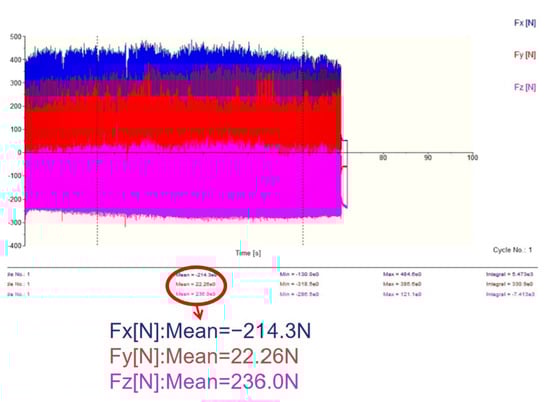
Figure 17.
T2 milling force (319.3 N).
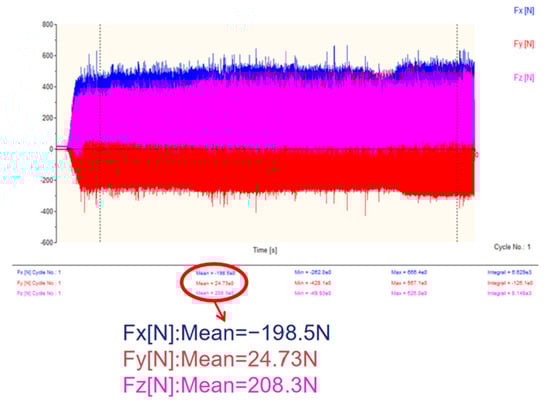
Figure 18.
T3 milling force (288.1 N).
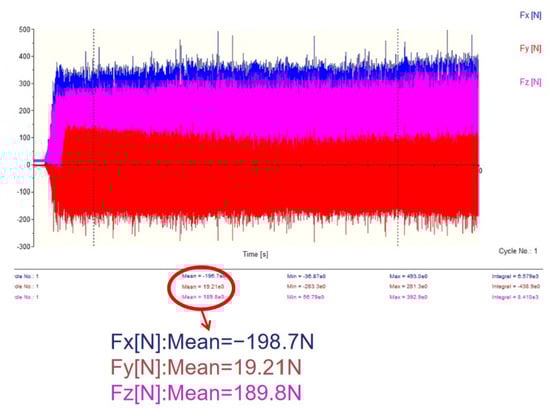
Figure 19.
T4 milling force (274.3 N).
As shown in Figure 16, Figure 17, Figure 18 and Figure 19 and Equation (22), the resultant milling forces for the four tool configurations are as follows: T1 (336.4 N), T2 (319.3 N), T3 (288.1 N), and T4 (274.3 N). Compared to T1, T2, T3, and T4 demonstrated varying degrees of milling force reduction (5%, 14.3%, and 19.5%, respectively). This reduction is attributed to the microstructures’ ability to store and reduce the chip volume, thereby decreasing cutting forces and minimizing tool–workpiece friction. Enhanced chip storage lowers contact pressure between chips and tool surfaces, further reducing vibration during machining and improving stability. Consequently, the microstructured tools exhibited significant force reductions compared to the non-microstructured tool.
Compared to T1, T2, T3, and T4 demonstrated varying degrees of milling force reduction (5%, 14.3%, and 19.5%, respectively). This reduction is attributed to the microstructures’ ability to store and reduce chip volume, thereby decreasing cutting forces. Enhanced chip storage minimizes contact between chips and tool surfaces, reduces tool–chip friction, further mitigates vibration during machining, and improves stability. Consequently, the resultant milling forces of microstructured tools were significantly lower than those of the non-microstructured tool. Figure 20 compares experimental and simulation results for T1 and T4. Despite numerical discrepancies, the trend consistency between experimental and simulated milling forces is evident.

Figure 20.
Comparison diagram of simulation and experimental milling force.
6.2. Tool Wear Test Analysis
A high-precision three-dimensional microscope with an extended depth of field, shown in Figure 21, was used to systematically characterize the wear morphologies of the four microstructured tools (T1, T2, T3, T4) under continuous milling conditions. The key observation areas selected were the front cutting face and main back cutting face regions of the tools.
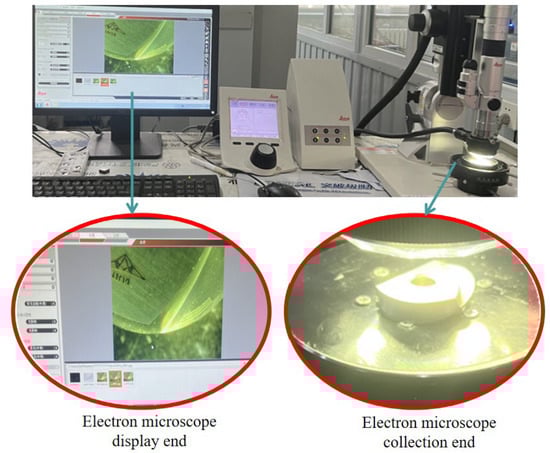
Figure 21.
High-precision ultra-depth 3D microscope observation of cutting tools.
The wear patterns of the T1, T2, T3, and T4 microstructured tools were systematically observed. Figure 22 shows magnified wear on T1, revealing severe edge chipping and significant tool wear. Figure 23 and Figure 24 present magnified views of the front cutting face of T2 and the back cutting face of T3, respectively. T2 exhibited localized crater wear on its front cutting face, while T3 experienced microstructure flattening due to high temperatures and elevated milling forces during machining. Among all tools, T4 displayed minimal wear in Figure 25, with no noticeable degradation in front cutting face microstructures. However, partial microstructure flattening was observed on T4’s back cutting face. Under identical machining conditions, T4 demonstrated superior wear resistance. During operation, T4’s front cutting face microstructures effectively retained and channeled chips, reducing flow resistance and secondary friction between chips and tool surfaces. Additionally, the back cutting face microstructures enhanced heat dissipation, further improving tool longevity.
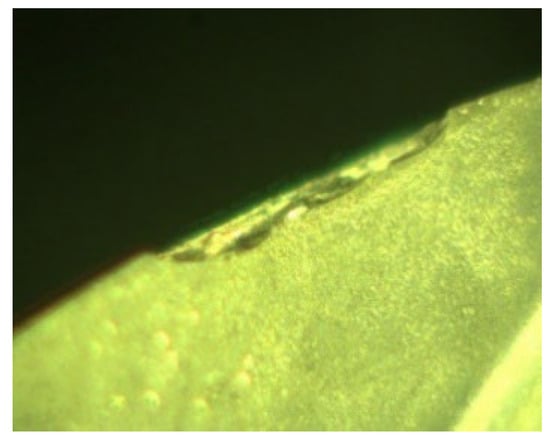
Figure 22.
T1 tool image.
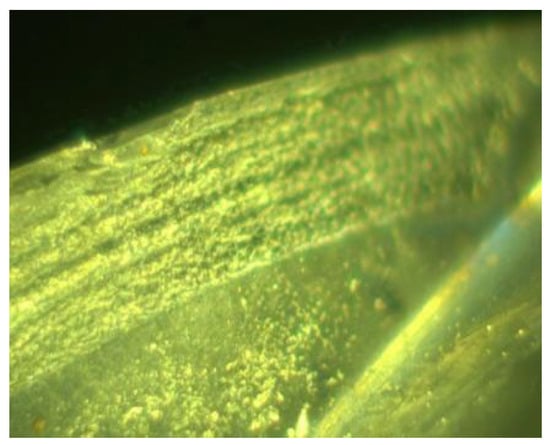
Figure 23.
T2 tool image.
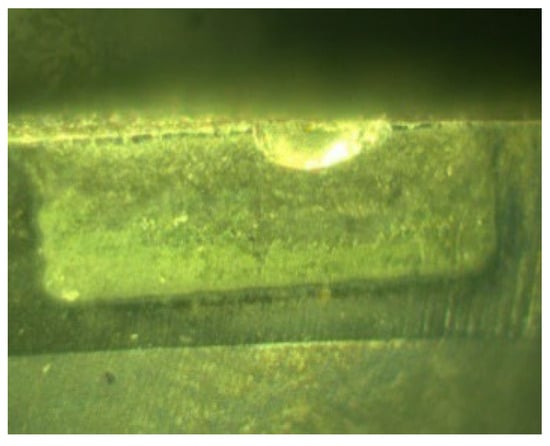
Figure 24.
T3 tool image.
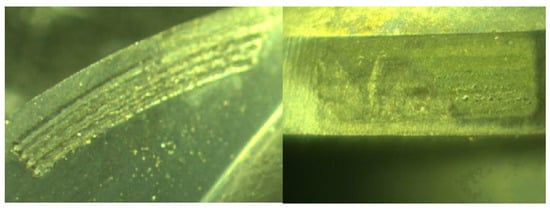
Figure 25.
T4 tool image.
6.3. Analysis of Workpiece Surface Roughness Results
This study employed a high-precision three-dimensional surface topography measurement system (model: Super View W1) to conduct comprehensive three-dimensional roughness characterization of workpiece surfaces. The system quantitatively evaluated the three-dimensional surface roughness parameter Sa in accordance. Equipped with white light interferometry technology, the device performed non-contact measurements of surface roughness under controlled conditions, as shown in Figure 26.
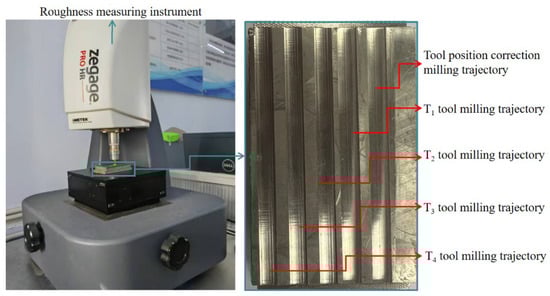
Figure 26.
Measurement of the surface roughness of the workpiece.
The surface roughness of workpieces machined by the four tool configurations (T1–T4) is quantified in Figure 27, Figure 28, Figure 29 and Figure 30, with T2, T3, and T4 demonstrating proportional reductions in Ra compared to T1, and T4 achieving the optimal surface finish. This improvement is attributed to the synergistic effects of front cutting face and back cutting face microstructures: (1) front cutting face microstructures trapped abrasive particles and metal chips, reducing cutting friction and minimizing secondary wear on the workpiece surface caused by chip retraction; (2) back cutting face microstructures enhanced heat dissipation through increased surface area and fluid dynamic pressure effects (via microstructure–airflow interactions), accelerating thermal energy removal. Reduced frictional heat and forces further lowered milling forces and temperatures, indirectly refining surface roughness by mitigating subsurface deformation and material adhesion during chip formation.
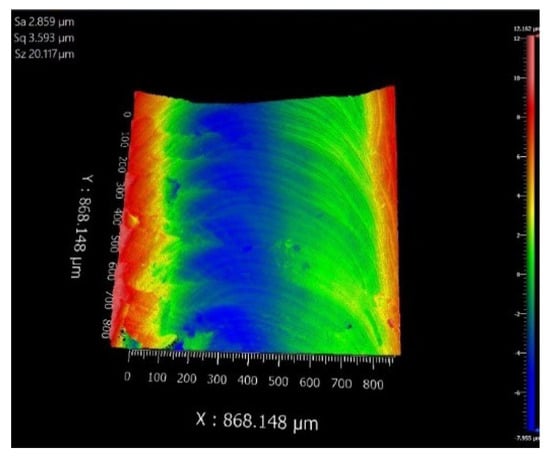
Figure 27.
Surface of T1 milling chips.
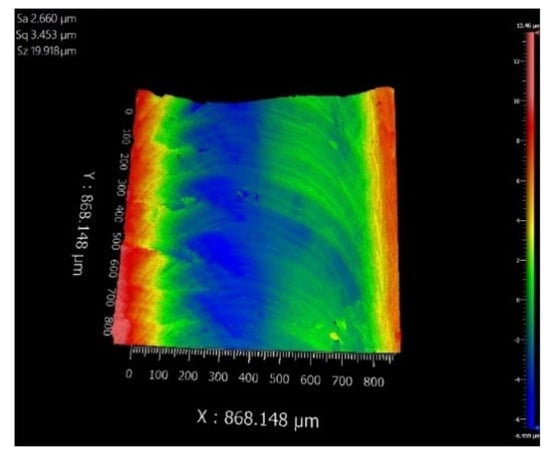
Figure 28.
Surface of T2 milling chips.
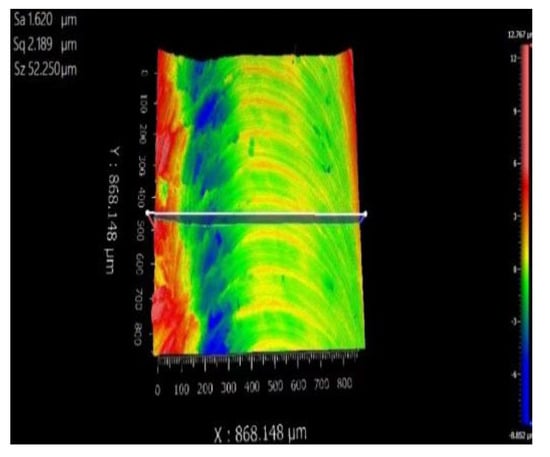
Figure 29.
Surface of T3 milling chips.
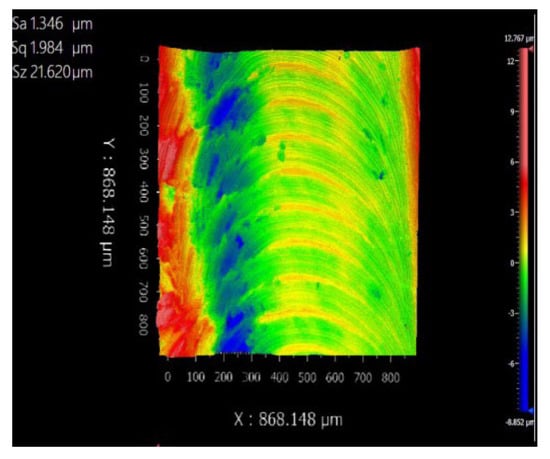
Figure 30.
Surface of T4 milling chips.
7. Conclusions
This study systematically investigated the effects of dual microstructures on ball-end milling tools through orthogonal experiments (four factors, three levels) and finite element simulations. The key conclusions are as follows:
- Optimized Parameters: The optimal microstructure configuration (T4: D = 50 μm, H = 60 μm, L1 = 100 μm, L2 = 100 μm) significantly improved tool performance. Compared to T1, T4 reduced milling forces by 19.5% (T4 vs. T1), 14.3% (T4 vs. T3), and 5% (T4 vs. T2), while cutting temperatures decreased by 19.1%, 9.9%, and 6.7%, respectively.
- Wear Resistance: T4 exhibited the lowest wear volume, attributed to its dual microstructures’ ability to trap chips, reduce friction, and enhance heat dissipation. The front cutting face microstructures minimized secondary wear via chip containment, while the back cutting face microstructures increased heat dissipation area and fluid dynamic pressure effects for accelerated thermal energy removal.
- Surface Finish: T4 achieved up to a 52.9% improvement in surface roughness (Ra) compared to T1, demonstrating its capacity to mitigate subsurface deformation and material adhesion through reduced frictional heat and forces.
- Mechanistic Insights: The synergistic effects of dual microstructures—front cutting face chip management and back cutting face thermal regulation—enabled T4 to outperform single-structure tools, validating their potential for enhancing machining efficiency and tool longevity.
Author Contributions
Conceptualization, Q.L. and Q.G.; methodology, W.X.; software, Q.G.; validation, T.X., Y.J. and Q.L.; formal analysis, Q.L.; investigation, Q.L.; resources, Q.G.; data curation, T.X.; writing—original draft preparation, T.X.; writing—review and editing, Q.G.; visualization, Q.G.; supervision, Q.L.; project administration. All authors have read and agreed to the published version of the manuscript.
Funding
This research received no external funding.
Data Availability Statement
Data are contained within the article.
Conflicts of Interest
The authors declare no conflict of interest.
References
- Gracie, W. Current status and progress of research on microstructure of tool surface. J. Shandong Univ. Technol. (Nat. Sci. Ed.) 2019, 39–44. [Google Scholar] [CrossRef]
- Yang, C.; Liu, X.; Yang, H.; Liu, K. Influence of Surface Texture on Cutting Performance and Friction Characteristics of the Front Face of a Tool; Tongfang Knowledge Network Technology Co., Ltd.: Beijing, China, 2015; pp. 228–235. [Google Scholar] [CrossRef]
- Zhou, X.; He, L.; Yuan, S.; Zhou, T.; Tian, P.; Zou, Z. Advances in the Study of Surface Microstructures in the Cutting Process; Tongfang Knowledge Network Technology Co., Ltd.: Beijing, China, 2022; pp. 100–127. [Google Scholar] [CrossRef]
- Yuan, Y.; Xu, H.; Huang, Y.; Li, S.; Wang, Y. Abaqus-Based Optimization Study of Cutting TC4 Tool Parameters for Micro-Weaving Tools. Int. J. Front. Eng. Technol. 2022, 4, 15–19. [Google Scholar]
- Li, Y.; Yu, X.; Yue, X.; Han, S. Effect of tool microstructure on cutting performance of 6061 aluminum alloy. Weapon Mater. Sci. Eng. 2023, 24–28. [Google Scholar] [CrossRef]
- Gao, H. Design and Preparation of Microweave Twist Drill and Drilling Performance Research; Shandong University: Jinan, China, 2015. [Google Scholar]
- Chen, J. Study on Friction Reduction Performance of Medical Tools Based on Bionic Microtexturing. Master’s Thesis, Tianjin Polytechnic University, Tianjin, China, 2020. [Google Scholar]
- Ni, J.; Li, B.; Xu, J. Wear-Reducing Lubrication Mechanism for Raindrop-Like Weaving Broaches. J. Shanghai Jiao Tong Univ. 2018, 340–347. [Google Scholar] [CrossRef]
- Anis, F.; Paul, T.M. On the comparative cutting performance of nature-inspired structured cutting tool in dry cutting of AISI/SAE 4140. Proc. Inst. Mech. Eng. Part B J. Eng. Manuf. 2017, 231, 1941–1948. [Google Scholar]
- Tiffany, D.L.; Pinzhi, L.; Shangwu, X.; Donald, G.; Jian, C.Q.; Jane, W.; Xia, Z.C.; Rajesh, T. Surface Texturing of Drill Bits for Adhesion Reduction and Tool Life Enhancement. Tribol. Lett. 2013, 52, 113–122. [Google Scholar]
- Su, S. Design of Microstructure Distribution on the Surface of Ball end Milling Cutter and Its Anti-Wear and Friction Reduction Mechanism Research. Master’s Thesis, Harbin Institute of Technology, Harbin, China, 2021. [Google Scholar] [CrossRef]
- Hanpei. Design and Parameter Optimization of Microstructure Distribution of Ball End Milling Cutter Under Milling Stability Conditions. Master’s Thesis, Harbin Institute of Technology, Harbin, China, 2021.
- Shucai, Y.; Tianjiao, W.; Wei, R.; Shuai, S. Micro-texture design criteria for cemented carbide ball-end milling cutters. J. Mech. Sci. Technol. 2020, 34, 127–136. [Google Scholar]
- Yao, S.; Chen, Z.-Y.; Zhang, Y.; Cao, F.-H.; Sun, Y. Optimization of cutting residual stress analysis and prediction of 304 stainless steel large parts. Agric. Equip. Veh. Eng. 2023, 140–144. [Google Scholar]
- Song, S.; Zhang, N.; Song, W. Finite element simulation of milling process of microwave ball end milling cutter based on DEFORM-3D. Tool Technol. 2020, 65–69. [Google Scholar]
Disclaimer/Publisher’s Note: The statements, opinions and data contained in all publications are solely those of the individual author(s) and contributor(s) and not of MDPI and/or the editor(s). MDPI and/or the editor(s) disclaim responsibility for any injury to people or property resulting from any ideas, methods, instructions or products referred to in the content. |
© 2025 by the authors. Licensee MDPI, Basel, Switzerland. This article is an open access article distributed under the terms and conditions of the Creative Commons Attribution (CC BY) license (https://creativecommons.org/licenses/by/4.0/).