Article

A Strawberry Ripeness Detection Method Based on Improved YOLOv8

1
College of Information Engineering, Tarim University, Aral 843300, China
2
College of Mechanical and Electrical Engineering, Tarim University, Aral 843300, China
3
Key Laboratory of Tarim Oasis Agriculture, Tarim University, Ministry of Education, Aral 843300, China
*
Author to whom correspondence should be addressed.
Appl. Sci. 2025, 15(11), 6324; https://doi.org/10.3390/app15116324
Submission received: 22 April 2025 / Revised: 26 May 2025 / Accepted: 2 June 2025 / Published: 4 June 2025

Abstract

:
An enhanced YOLOv8-based network was developed to accurately and efficiently detect the ripeness of strawberries in complex environments. Firstly, a CA (channel attention) mechanism was integrated into the backbone and head of the YOLOv8 model to improve its ability to identify key features of strawberries. Secondly, the bilinear interpolation operator was replaced with DySample (dynamic sampling), which optimized data processing, reduced computational load, accelerated upsampling, and improved the model’s sensitivity to fine strawberry details. Finally, the Wise-IoU (Wise Intersection over Union) loss function optimized the IoU (Intersection over Union) through intelligent weighting and adaptive tuning, enhancing the bounding box accuracy. The experimental results show that the improved YOLOv8-CDW model has a precision of 0.969, a recall of 0.936, and a mAP@0.5 of 0.975 in complex environments, which are 8.39%, 18.63%, and 12.75% better than those of the original YOLOv8, respectively. The enhanced model demonstrates higher accuracy and faster detection of strawberry ripeness, offering valuable technical support for advancing deep learning applications in smart agriculture and automated harvesting.

1. Introduction

Strawberries (Fragaria spp., family Rosaceae) are perennial herbaceous plants widely appreciated for their nutritional value, sweet flavor, and juiciness. Owing to their distinctive aroma, they are often referred to as the “Queen of Fruits” [1]. China is the world’s largest producer of strawberries, with Xinjiang Province recognized for cultivating particularly high-quality varieties due to its arid and sunny climate, which contributes to elevated sugar content and unique flavor profiles. In 2022, the United Nations FAO (Food and Agriculture Organization) reported that China’s strawberry cultivation area reached approximately 221.18 km2, with Xinjiang’s share expanding steadily as strawberry farming becomes a key component of local agriculture [2].
Despite the widespread cultivation, strawberry harvesting and sorting in Xinjiang still rely heavily on manual labor, which is both time-consuming and costly. To improve efficiency and reduce labor intensity, the integration of robotics and intelligent technologies in strawberry production has become an important research direction. Accurate identification of strawberry ripeness is critical for enabling intelligent harvesting systems, as it directly impacts sorting precision, reduces post-harvest losses, and ensures fruit quality.
Traditional fruit ripeness detection methods typically rely on manually extracted features such as color, shape, and texture [3,4,5], followed by classification based on pixel-level differences between the fruit and background. These classical image processing approaches have been applied to various fruits, including grapes [6], dragon fruit [7], and bananas [8]. While hyperspectral imaging has shown impressive accuracy in controlled environments—for example, Li et al. achieved a 91.25% classification accuracy for plums using a PLS discriminant model [9]—the high cost of the equipment and its limited performance under natural occlusion pose challenges for its practical use [10,11,12,13].
The rise of deep learning has introduced new possibilities for fruit ripeness detection in complex environments. CNNs (convolutional neural networks) and target detection algorithms have been successfully applied to various fruits such as oil palms [14], blueberries [15,16], apples [17,18,19], mangoes [20], and tomatoes [21]. Notably, lightweight YOLO variants have enabled real-time fruit detection on mobile platforms [22,23], and enhanced models such as RFCAConv-YOLOv8 have been used for the multi-stage classification of coffee cherries with competitive accuracy [24]. However, studies focusing specifically on automated strawberry detection and ripeness classification remain limited.
To address this gap, the present study proposes an improved strawberry detection model based on YOLOv8, aiming to enhance detection accuracy and speed in complex field environments. This work seeks to provide a real-time, accurate solution to support automated strawberry harvesting and intelligent agricultural production.

2. Materials and Methods

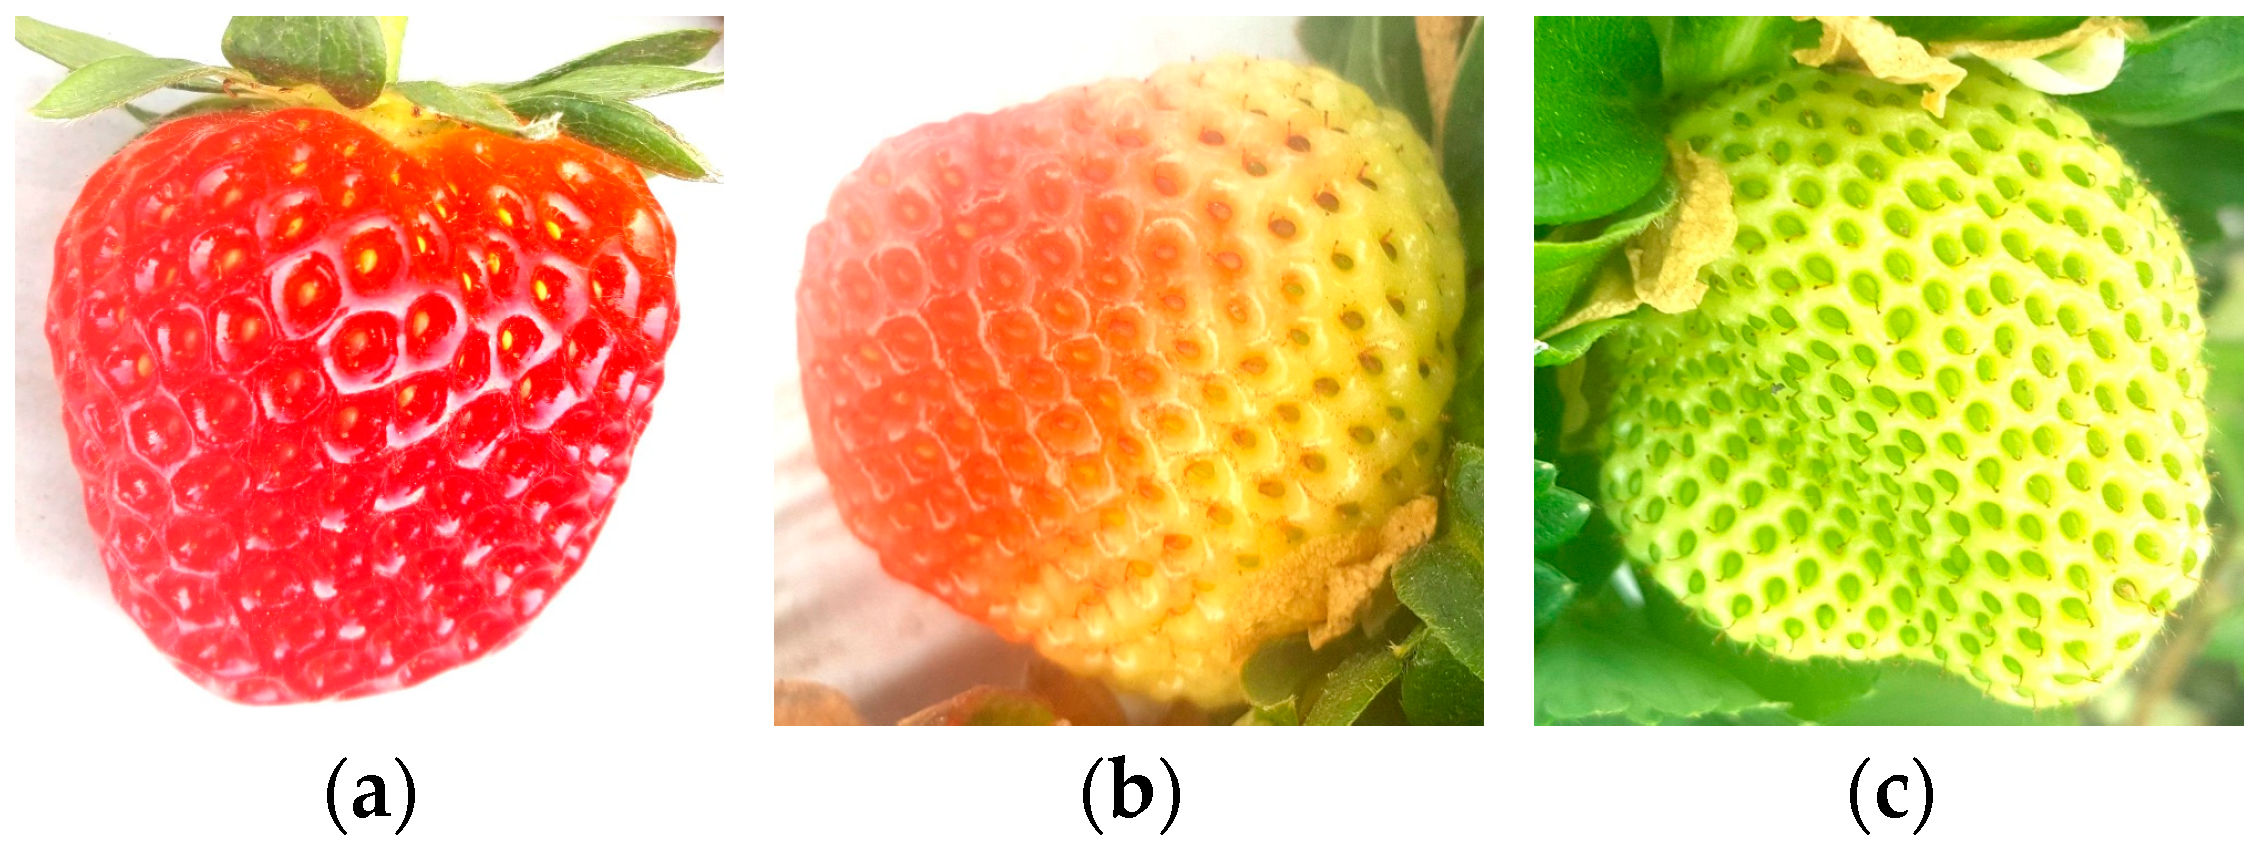
2.1. Image Collection

The present study collected experimental data from the Shijianpeng Agricultural Cooperative (the cooperative experimental greenhouse of Tarim University), the 10th Regiment of the Xinjiang Production and Construction Corps in Aral City, in the Xinjiang Uygur Autonomous Region. The geographic coordinates are 81.300663° E, 40.618134° N according to the WGS84 coordinate system. The data were collected in March 2024. The image acquisition devices included a digital camera with a resolution of 6000 × 4000 pixels and a smartphone with a resolution of 4096 × 3072 pixels. No flash or zoom was applied during image capture. All images were taken under natural lighting conditions at a distance of approximately 40–80 cm from the strawberries, maintaining a 1:1 shooting ratio. A total of 1000 images were obtained.

2.2. Dataset Construction

In this study, all images were resized to square dimensions with a resolution of 640 × 640 pixels. The dataset was then divided into training, validation, and testing sets at a ratio of 8:1:1. To mitigate underfitting caused by limited data, Python-based data augmentation techniques were applied. Random flipping and mirroring were performed, expanding the dataset to three times its original size, as illustrated in Figure 1.
After image preprocessing, abnormal samples were discarded, resulting in 2970 training images, 372 validation images, and 371 testing images, as shown in the figure. Subsequently, the LabelImg tool (Version: 1.8.6) was used to annotate the images with rectangular bounding boxes. Ripe strawberries correspond to image Figure 2a and are labeled as “ripe”, unripe ones correspond to image Figure 2c and are labeled as “raw”, while those in intermediate stages correspond to image Figure 2b and are labeled as “turning”.

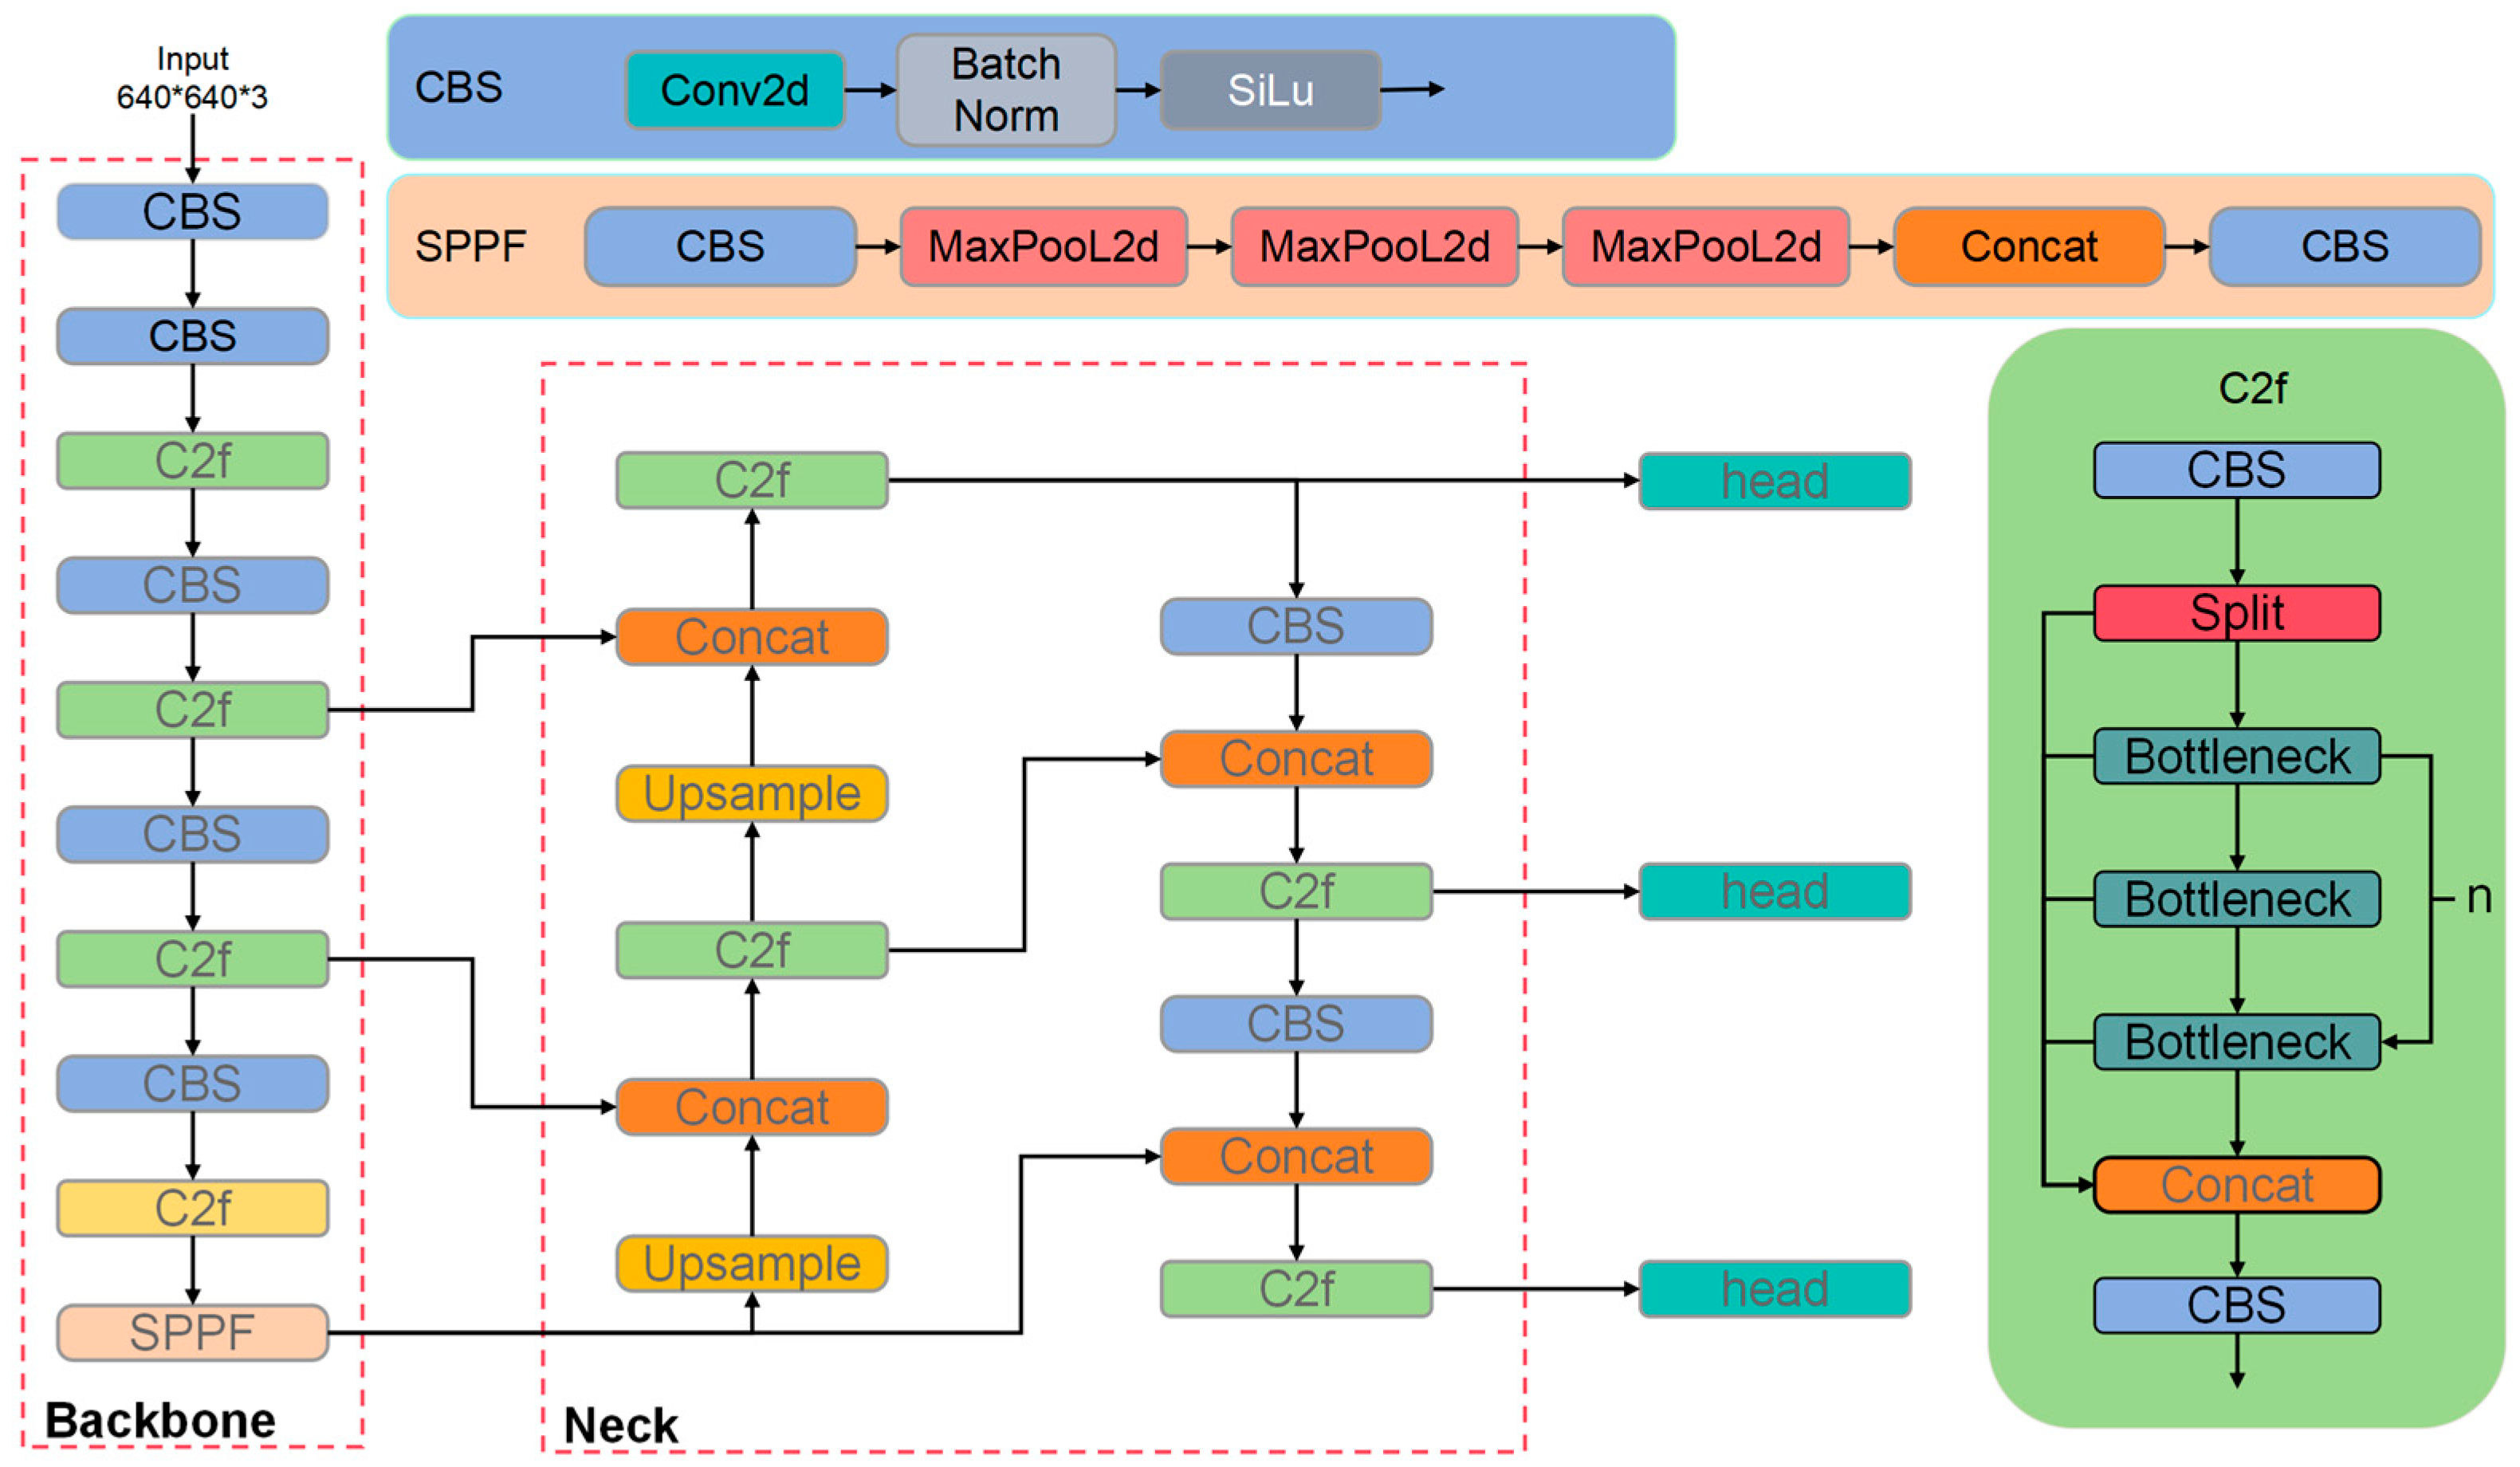
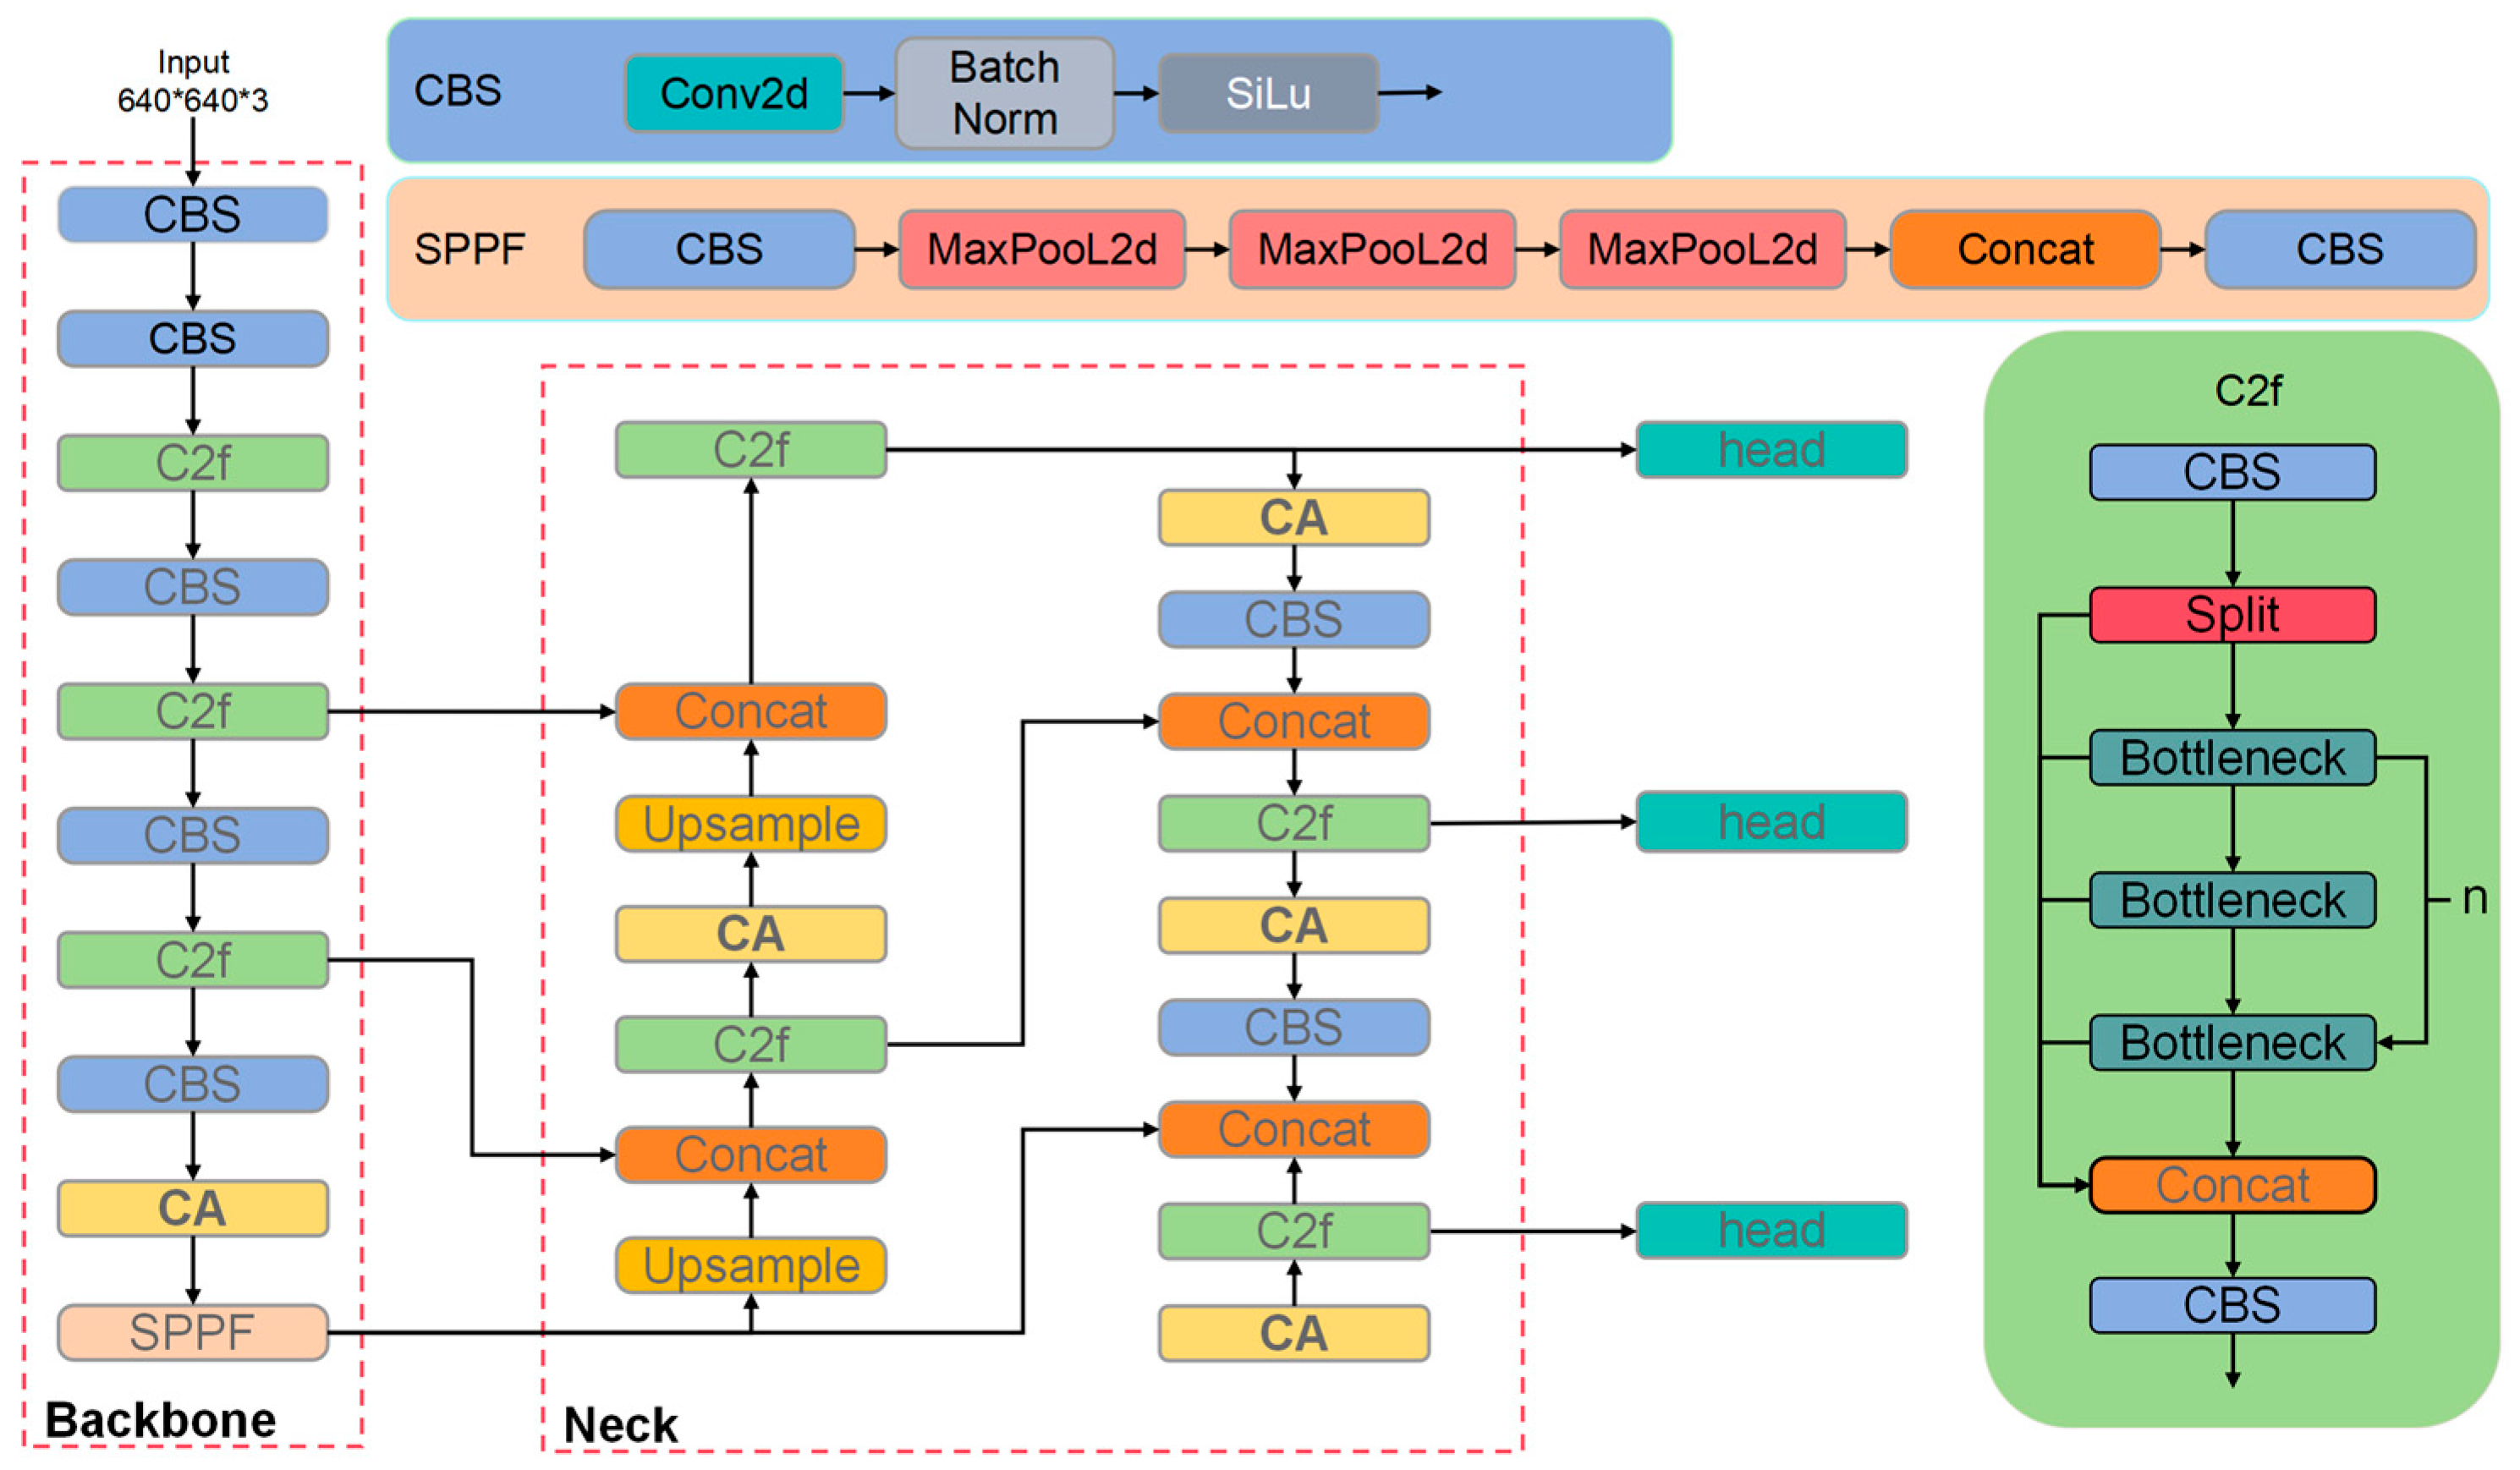
2.3. Network Model Architecture for Strawberry Ripeness Detection

The YOLOv8 object detection algorithm consists of three core components: the backbone, neck, and head. The backbone is responsible for extracting high-level semantic features from the input image, capturing object shape, texture, and contextual information. The neck fuses multi-scale feature maps to improve detection performance across targets of varying sizes. These aggregated features are then passed to the head for final object classification and localization. Notably, YOLOv8 incorporates the decoupled head architecture from YOLOX, which separates the classification and localization branches to enhance detection efficiency. This decoupling is particularly beneficial for strawberry ripeness detection in complex environments, as it enables more precise identification and localization of strawberries amidst cluttered backgrounds, thereby improving ripeness classification accuracy. In addition, YOLOv8 adopts an anchor-free detection mechanism, addressing challenges such as inaccurate localization and the imbalance between positive and negative samples. Inspired by the parallel gradient flow concept in ELAN (used in YOLOv7), YOLOv8 replaces the C3 module of YOLOv5 with the more efficient C2f module, enhancing gradient propagation while preserving the model’s lightweight characteristics. Regarding label assignment, YOLOv8 continues the strategy introduced in YOLOv6, further improving detection accuracy and robustness in complex scenes. This strategy also enhances the model’s ability to handle uncertainty in target position and scale. As an enhanced single-stage detection algorithm, YOLOv8 integrates multiple architectural innovations, offering strong performance in detecting objects of various sizes. These features make it particularly well suited for strawberry ripeness detection in unstructured, real-world environments. The overall architecture of YOLOv8 is illustrated in Figure 3.

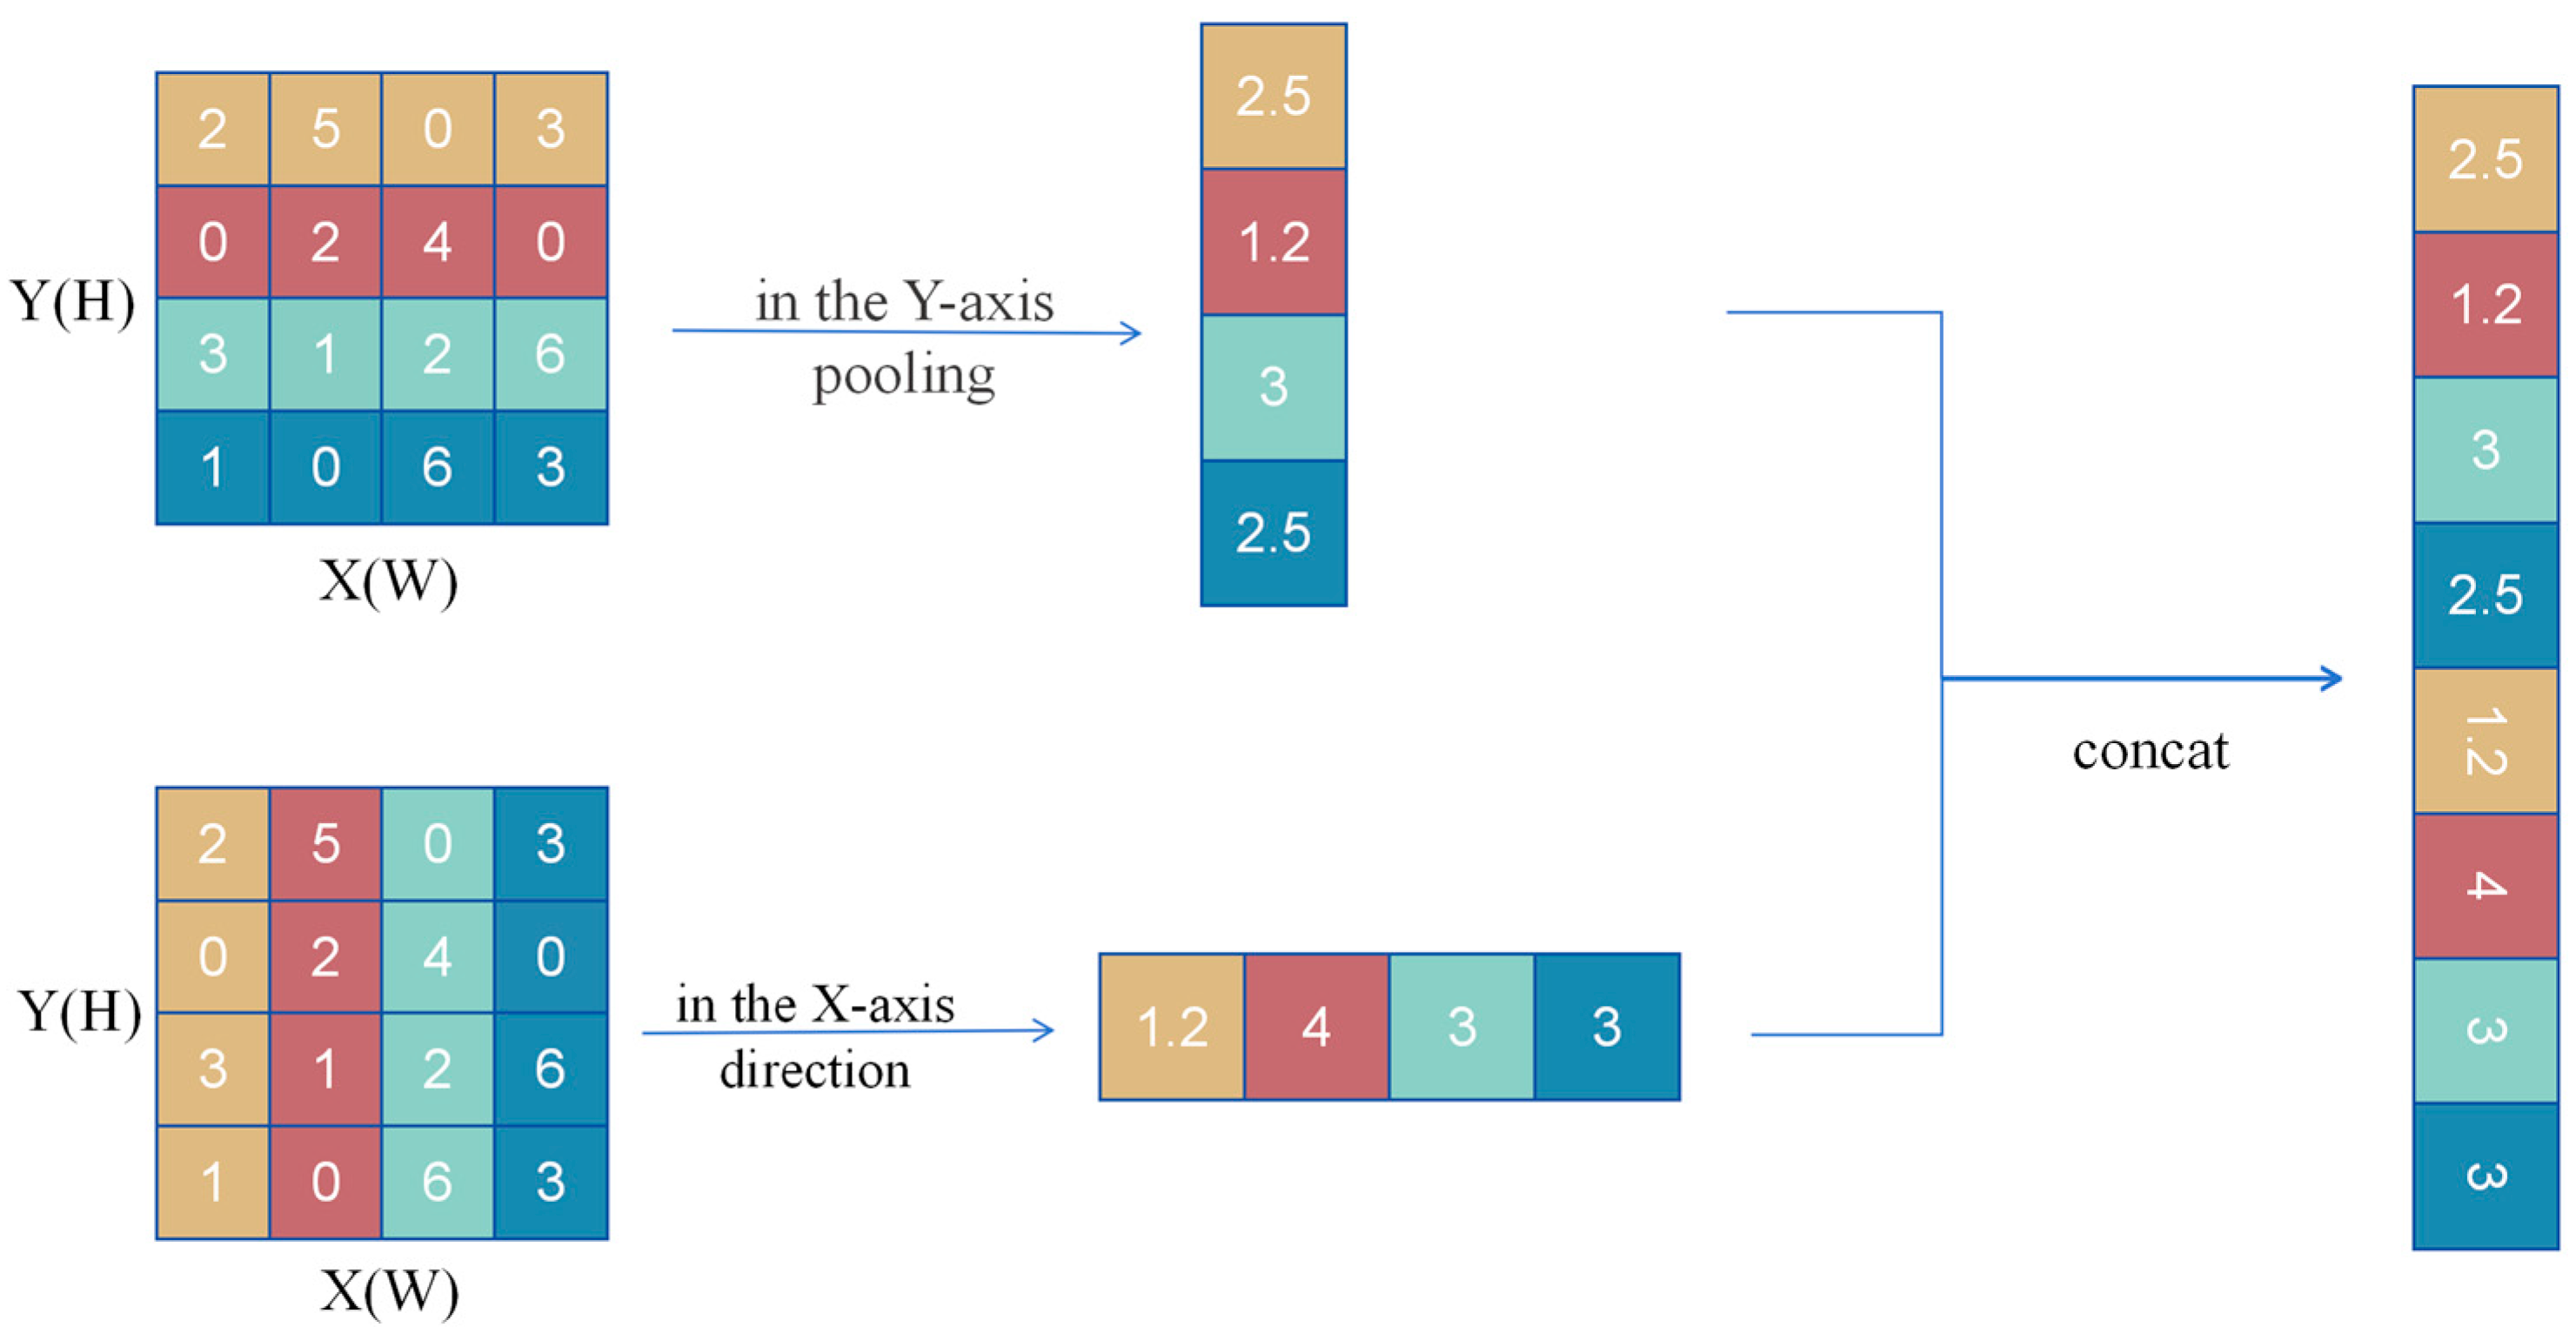
2.3.1. Channel Attention

To address the issue of feature redundancy during the extraction of ripe strawberry image features, this study introduces a CA mechanism into the model architecture. The attention mechanism enables the neural network to focus more effectively on the color features of ripe strawberries, enhancing the extraction of relevant information while suppressing background noise and other irrelevant content. Specifically, the CA mechanism analyzes channel-wise information within the feature map and dynamically adjusts the corresponding channel weights. This process strengthens the network’s response to critical features and improves its overall feature representation capability.
In real-world environments, the color of unripe strawberries is often similar to that of surrounding leaves, while under varying lighting conditions, the color of ripe strawberries may closely resemble that of semi-ripe ones. To address these challenges, this study incorporates a CA mechanism, which captures correlations between different spatial regions and channel information in strawberry images, thereby enhancing the model’s ability to distinguish strawberries in different ripening stages. Moreover, the CA mechanism effectively suppresses background noise and irrelevant information, further improving detection accuracy. The detailed structure of the CA module is illustrated in Figure 4.
In order to circumvent the compression of all spatial information into the channel dimension, the CA attention mechanism does not utilize global average pooling. In order to effectively capture long-range spatial interactions with precise positional information, a decomposition of the global average pooling operation is performed, as detailed below.
In the CA mechanism, the global average pooling operation is decomposed into two separate one-dimensional feature encoding processes along the spatial height and width dimensions. For each channel c , the height-wise pooled feature c h z h is computed by averaging the input feature map x c over the width dimension W , as formulated by [25]:
c h z h = 1 W 0 i < W x c ( h , i )
Similarly, the width-wise pooled feature c w z w is obtained by averaging over the height dimension H [26]:
c w z w = 1 H 0 j < H x c ( j , w )
This decomposition facilitates the network’s ability to capture long-range dependencies along a single spatial direction while concurrently preserving precise positional information along the other. Consequently, it has been demonstrated to effectively enhance the spatial attention capability by preserving positional cues that are often lost in traditional global pooling operations. It has been demonstrated that such a design is particularly advantageous in tasks requiring accurate spatial localization and context modeling.
Given an input feature map with dimensions C × H × W , spatial pooling is applied independently along the horizontal (width) and vertical (height) axes. This results in two distinct feature maps with dimensions C × H × 1 and C × 1 × W , respectively, as illustrated in the Figure 5 below.
The feature map of size C × 1 × W is first transformed and then concatenated with the other feature map. The corresponding formulation is given by [26]:
f = δ ( F 1 ( z h , z w ) )
The feature maps z h and z w are concatenated to form the feature map illustrated in the Figure 5. Subsequently, a dimensionality reduction is performed on the concatenated feature map using a 1 × 1 convolutional kernel—similar to the operation in the SE attention mechanism—followed by an activation function. This results in the output feature map f R c r × ( H + W ) × 1 .
Along the spatial dimensions, the feature map f is split into two components: f h R c r × H × 1 and f w R c r × 1 × w . A 1 × 1 convolution is then applied to both f h and f w for dimensionality expansion, followed by the application of a sigmoid activation function. This results in the final attention vectors g h R C × H × 1 and g w R C × 1 × W . Ultimately, the output of CA can be expressed by Equation (6) [26]:
g h = σ ( F h ( f h ) )
g w = σ ( F w ( f w ) )
y c i , j = x c ( i , j ) × c h g ( i ) × c w g ( j )
The core concept of the CA mechanism is to decompose the channel attention into two one-dimensional feature encoding processes, which aggregate features along the horizontal and vertical directions, respectively. This design enables the model to capture long-range dependencies along one spatial axis while preserving precise positional information along the other. Specifically, the CA module first applies two one-dimensional global pooling operations—horizontal and vertical—to extract direction-aware feature maps. These feature maps are then passed through a sequence of operations, including convolution, batch normalization, and activation functions, to generate attention weight maps for both directions. The resulting attention maps are multiplied with the original feature maps to produce enhanced feature representations, effectively refining the input features. The CA mechanism offers the advantage of jointly considering both channel-wise and spatial information with minimal computational overhead, making it highly suitable for deployment on mobile and edge devices. Its flexibility and efficiency also make it a powerful component for enhancing the performance of existing neural network architectures.
In the context of strawberry ripeness detection, the CA mechanism has demonstrated a significant ability to enhance model performance. Accurate ripeness classification depends on the precise analysis of subtle color transitions and surface texture characteristics of strawberries. By aggregating channel-wise information and incorporating spatially directional feature encoding, the CA mechanism effectively captures key ripeness-related features, thereby improving classification accuracy. Furthermore, the lightweight nature of the CA module ensures a low computational cost, making it suitable for real-time processing and efficient deployment on mobile and edge devices. The integration of the CA mechanism significantly improves the model’s robustness and generalization ability, enabling reliable performance under complex environmental conditions. Its application within the YOLOv8 framework is illustrated in Figure 6.

2.3.2. DySample

In orchard environments, strawberries at various ripeness levels are often intermingled, with a common occurrence of adhesion between ripe fruits, making precise segmentation particularly challenging. Although the YOLOv8 object detection algorithm has demonstrated notable improvements in performance, it still employs traditional bilinear interpolation for upsampling. This approach inevitably results in the loss of fine-grained details, especially in scenarios involving overlapping or adhered strawberries, where the issue becomes more pronounced.
To address this limitation, this study introduces DySample as an alternative upsampling method to enhance YOLOv8’s capability in capturing fine details of strawberry fruits. DySample offers high efficiency, low computational overhead, and improved accuracy, making it well suited for retaining critical features such as fruit contours, size, and shape. Its integration into the YOLOv8 architecture significantly improves detection accuracy and robustness in complex orchard environments. The implementation and optimization effects of DySample within the YOLOv8 framework are illustrated in Figure 7.
The Table 1 presents a comparative evaluation of various upsampling methods integrated with the Faster R-CNN framework on the MS COCO dataset. Notably, the DySample approach demonstrates superior detection performance while maintaining parameter efficiency. For instance, with the ResNet-50 backbone, DySample+ achieves an AP (average precision) of 38.7%, outperforming conventional methods such as Nearest and Deconv, particularly in stringent metrics like AP75 and across small to large object scales. Moreover, using a more powerful ResNet-101 backbone, DySample+ further improves AP to 40.5%. These results substantiate the effectiveness of dynamic sampling strategies in enhancing feature upsampling, thereby boosting object detection accuracy and robustness. This outstanding performance is the primary reason why we choose DySample as the key focus for improvement. This aligns with findings reported by Zhou et al. (2023) [27], emphasizing the potential of advanced upsampling techniques in object detection tasks.
DySample dynamically adjusts the sampling strategy by reorganizing features within a predefined region based on variations in feature content. Each spatial location is assigned multiple sampling weights to accommodate different scene requirements. The rearranged features are subsequently combined into spatial blocks to perform feature upsampling. In contrast to conventional bilinear interpolation, which relies exclusively on pixel positions to define the upsampling kernel and disregards the semantic information contained within the feature map, DySample employs an adaptive approach that incorporates semantic context. The bilinear method is relatively “mechanical,” relying on fixed spatial positions and failing to capture complex feature distributions. DySample, on the other hand, benefits from a larger receptive field and greater adaptability to diverse feature distributions, without significantly increasing model parameters or computational cost. Accordingly, this study replaces the bilinear upsampling method in YOLOv8 with DySample to enhance the model’s feature representation and detection performance. Its implementation within the YOLOv8 framework is illustrated in Figure 8.

2.3.3. Wise-IoU Loss Function

Traditional loss functions typically consider only the IoU (Intersection over Union) between the predicted and ground-truth bounding boxes while neglecting classification-related information. As a result, detection accuracy can be further improved by designing more comprehensive loss functions. YOLOv8 adopts DFLoss (distribution focal loss) and CIoU (Complete IoU) Loss to compute the bounding box regression loss. However, CIoU employs a monotonic focusing mechanism and does not account for the balance between hard and easy samples. Consequently, when the training set contains a significant number of low-quality or noisy samples, the overall detection performance may degrade. The formulation of CIoU is provided in the following equation [28]:
L C L o U = 1 I o U + ρ 2 ( b A , b B ) c 2 + α v
where ρ 2 ( b A , b B ) is the Euclidean distance between the centers of the predicted box b A and ground-truth box b B , c is the diagonal length of their minimum enclosing box, v measures aspect ratio consistency, and α is a positive trade-off parameter.
This study introduces the Wise-IoU loss function, which incorporates a dynamic non-monotonic focusing mechanism to better balance sample contributions during training. Instead of relying solely on geometric factors such as distance and aspect ratio, Wise-IoU employs an outlier-aware evaluation strategy to assess the quality of predicted boxes. This approach prevents the model from being overly penalized by poorly aligned predictions, thereby enhancing the robustness of the loss function. The mathematical formulation of Wise-IoU is presented in Equations (8)–(10) [29,30].
L W I o U = r R W I o U L I o U , r = β δ α β α
β = I o U L L I o U ¯ [ 0 , + )
R W I o U = e x p ( ( x x g t ) 2 + ( y y g t ) 2 ( w 2 c + h 2 c ) )
Here, r and δ are positive hyperparameters controlling the base focusing strength and its scale, while Equation (9) compares the current IoU loss to a reference so that harder samples ( β > 1) receive more focus and easier ones ( β < 1) are down-weighted. The exponential term R W I o U (Equation (10)) further boosts well-aligned predictions by measuring the squared center-point offset normalized by the enclosing box dimensions ( c w , c h ).
The formulas represent the IoU-based loss calculation. When the overlap between the anchor box and the predicted box is high, the loss function reduces the penalty term for high-quality anchor boxes and increases the emphasis on the distance between their center points. The second formula defines the penalty term specific to Wise-IoU, which enhances the loss contribution of anchor boxes with ordinary quality. In the equations, the superscript * indicates exclusion from backpropagation, effectively preventing the model from generating non-convergent gradients. The normalization factor represents an incremental sliding average value. The outlier degree, also defined in the formulas, quantifies the deviation of a sample. A smaller value indicates a high-quality anchor box and is therefore assigned a smaller gradient gain. Conversely, predicted boxes with larger outlier degrees are also assigned smaller gradient gains, which suppresses the influence of noisy or low-quality samples. This mechanism allows the loss function to concentrate more effectively on anchor boxes of ordinary quality, thereby improving the overall robustness and detection performance of the network.

2.4. Evaluation Indicators

The evaluation metrics adopted in this paper include precision (P), recall (R), mAP (mean average precision), and the F1 score, which are defined as follows:
P = T P T P + F P
R = T P T P + F N
m A P = 1 n 1 N 0 1 P ( R ) d R
F 1 = 2 × P r e c i s i o n × R e c a l l P r e c i s i o n + R e c a l l
True positives (TP) denote the number of samples that have been correctly identified, false positives (FP) refer to samples that have been incorrectly identified as objects, and false negatives (FN) indicate the number of positive samples that were not detected, despite being present. The term “AP” (average precision) is used to denote the area under the precision–recall curve, whilst “mAP” (mean average precision) denotes the mean of AP values across multiple categories. The term “mAP@0.5” refers to the mean AP calculated at an IoU threshold of 0.5, whereas “mAP@0.95” is computed at IoU thresholds up to 0.95, reflecting stricter accuracy criteria compared to mAP@0.5. In this study, Q represents the total number of categories, which is equal to three.
Equations (11)–(14) represent standard evaluation metrics employed in object detection tasks to assess the precision, recall, and overall effectiveness of detection models. The aforementioned formulas have been adapted from widely accepted benchmarks, including the PASCAL VOC and COCO evaluation protocols. It is widely acknowledged that mAP is the most comprehensive of these metrics, as it integrates the area under the precision–recall curve across a range of IoU thresholds. Definitions and evaluation practices are detailed in Everingham et al. (2010) and Lin et al. (2014) [31,32].

2.5. Experimental Environment

The experimental environment included an Intel® Core™ i5-12400 CPU running at 4.4 GHz, 32 GB of memory, and a GeForce RTX 3060 GPU with 12 GB of video memory. The equipment was purchased in Aksu, Xinjiang, China, from Intel Corporation, headquartered in Santa Clara, CA, USA, and the GPU was manufactured by NVIDIA Corporation, also purchased in Aksu, Xinjiang, China. The deep learning framework used was PyTorch 1.8, implemented with Python 3.8. The proposed model was trained for 200 epochs on the GPU with a batch size of 128. Model performance was evaluated using metrics including mAP, computational complexity, and inference speed.

3. Analysis of Experimental Results

3.1. Comparative Experiment

To verify the superiority of the baseline model, experiments were conducted on FAST R-CNN, YOLOv5, YOLOv7, and YOLOv8 using the self-collected strawberry dataset. These models were compared under similar parameter counts and computational complexity. The detailed comparison results are presented in Table 2. During training, not all models utilized pre-trained weights. The testing environment and experimental configuration were consistent across all experiments.
As shown in Table 2, the YOLOv8 model achieved the best balance between detection accuracy and efficiency. Therefore, selecting YOLOv8 as the baseline model is justified.
Figure 9 illustrates the training results for different algorithms, indicating that YOLOv8_CDW outperforms the other methods.
As demonstrated in Figure 10, the normalized confusion matrices of the original YOLOv8 model and the improved YOLOv8 model are presented, thus facilitating a clear comparative analysis of their detection performance across four object categories. The words “raw”, “turning”, “ripe”, and “background” are employed. The horizontal axis denotes the ground-truth labels, while the vertical axis represents the predicted classes. The figure illustrates the mean classification accuracy for each cell. The darker the color, the higher the prediction precision.
For the original YOLOv8 model, the detection accuracies for “raw”, “turning”, and “ripe” were approximately 68%, 91%, and 85%, respectively. However, a significant misclassification was observed between the “raw” and “background” classes, with 66% of “raw” instances being incorrectly predicted as background. In a similar vein, the “turning” class was subject to a degree of confusion, with approximately 21% of cases being misclassified as background. Errors were also exhibited by the background class, with 32% of “raw” and 10% of “ripe” instances being misidentified.
In contrast, the enhanced YOLOv8 model demonstrated superior recognition accuracy and enhanced class separation. For instance, the detection accuracy for the “ripe” class increased to 84%, while misclassification between “turning” and “background” was noticeably reduced. This enhancement indicates that the proposed improvements have been effective in reducing the confusion between similar classes and backgrounds. Consequently, this has led to an enhancement in the robustness and precision of the overall detection process.
The performance comparison between the original YOLOv8 model and the enhanced YOLOv8-CDW model is comprehensively illustrated in Figure 11 across four key evaluation metrics: recall (Figure 11a), precision (Figure 11b), mAP@0.5 (Figure 11c), and mAP@0.5:0.95 (Figure 11d).
As shown in Figure 12a, the YOLOv8-CDW model consistently achieves higher recall values than the original YOLOv8 throughout the training process. This superiority is especially pronounced in later epochs where the recall stabilizes at a higher level, indicating improved capability in detecting true positive instances and reducing missed detections.
Similarly, Figure 11b reveals that the precision curve of the YOLOv8-CDW model demonstrates significant improvement with a smoother progression and fewer fluctuations compared to the original model. This suggests a reduction in false positive detections and enhanced accuracy in distinguishing objects.
Figure 11c presents the mAP@0.5 metric, where the YOLOv8-CDW model attains rapid gains early in training and maintains a consistent advantage over all epochs. This reflects the model’s improved performance in both object localization and classification.
Finally, Figure 11d shows the most stringent metric, mAP@0.5:0.95, which further highlights the enhanced performance of the YOLOv8-CDW model, particularly at higher Intersection over Union (IoU) thresholds. This improvement suggests a superior ability for fine-grained object detection and more precise boundary delineation.
Collectively, these results demonstrate that integrating the CDW mechanism enhances the YOLOv8 model’s detection accuracy, stability, and generalization ability, supporting its robust deployment in complex real-world detection scenarios.
In Figure 13, a comparative analysis of the detection performance is presented among three configurations: the original image (Origin), the baseline YOLOv8 model, and the proposed YOLOv8-CDW model. It is evident that each column corresponds to a distinct test scenario in real-world strawberry cultivation environments. These environments are characterized by varying lighting conditions, occlusion, and fruit maturity levels.
The top row (Origin) displays the raw images without any detection overlay, serving as reference visuals. The middle row of the figure displays the results obtained from the standard YOLOv8 model. Despite the fact that YOLOv8 is capable of detecting multiple strawberries, it exhibits notable limitations. These include excessive overlapping bounding boxes, false positives, and ambiguous classification, particularly in scenes where there is a high density of objects, occlusion, and immature fruits (e.g., third column).
In contrast, the bottom row illustrates the detection results produced by the enhanced YOLOv8-CDW model. This version incorporates enhanced mechanisms for contextual discrimination and weighting, thereby facilitating more precise object localization and clearer class differentiation. YOLOv8-CDW has been demonstrated to reduce redundant detections and to successfully categorize fruits into distinct maturity stages, including “raw”, “turning”, and “ripe”. Such performance enhancements are especially pronounced in complex environments, where fruit appearance and occlusion vary significantly.
The visual outcomes demonstrate that YOLOv8-CDW enhances detection precision and semantic segmentation, thus demonstrating its superior applicability in intelligent agricultural tasks such as automated fruit grading and yield estimation.

3.2. Ablation Experiment

To evaluate the effectiveness of the improved model, an ablation experiment was performed on the strawberry maturity dataset. The enhanced YOLOv8_CDW model was compared with existing models. Table 2 summarizes the algorithm combinations used in this paper, including YOLOv8_C, YOLOv8_D, and other variants. The mAP@0.5 curves and loss values were utilized to assess model performance. Figure 14 shows the mAP values of different models with the improved approach.
As shown in Table 3, incorporating the proposed modules into the baseline model leads to an improvement in mAP@0.5. Replacing the standard upsampling module with DySample significantly reduces the model’s parameter size and computational complexity while maintaining detection accuracy, which is advantageous for real-time strawberry and ripeness detection in agricultural environments. Furthermore, integrating the CA mechanism results in a notable increase in recall. Finally, the proposed YOLOv8_CDW model achieves an optimal balance among mAP@0.5, parameter size, and computational cost, demonstrating its superiority in strawberry fruit and ripeness detection tasks.

3.3. Heatmap Visualization

In order to further investigate the differences in attention regions among object detection models when recognizing strawberry targets, this study adopted the GradCAM++ method to visualize and compare the performance of FAST-R CNN, YOLOv5, YOLOv7, YOLOv8, and the improved YOLOv8_CDW. The configuration of the visualization settings was as follows: the method was set to GradCAMPlusPlus, the layer to [12], and the backward_type to all, with a confidence threshold of 0.2. In order to maintain consistency, both the bounding box display (show_box = False) and the renormalization (renormalize = False) functions were disabled. The regions that are indicated by a red coloration are indicative of a greater degree of model attention.
As illustrated in Figure 15, the application of each model to three exemplary strawberry images is represented by heatmaps. As demonstrated, the YOLOv8_CDW model demonstrates the most concentrated activation regions, with clear attention focused on the strawberry objects and minimal background interference, indicating superior specificity and robustness. The standard YOLOv8 model demonstrates a marginal decrease in performance, exhibiting generally accurate focus but occasional instances of edge diffusion. YOLOv6 demonstrates a greater degree of concentrated attention in comparison to YOLOv5, indicating an enhancement in architectural design. It has been demonstrated that FAST-RCNN, during the generation of multiple hotspots, incorporates irrelevant background regions. This finding suggests a higher degree of reliance on non-target regions during the process of decision-making.
In conclusion, it is evident that under identical GradCAM++ configurations, the YOLOv8_CDW model consistently yields the most interpretable and reliable attention distribution, thereby rendering it particularly well suited for high-precision detection in complex environments.

4. Discussion

With the continued growth of the global population and mounting pressure on arable land resources, enhancing agricultural productivity has become an urgent priority. Automated harvesting robot technology, a pivotal advancement in intelligent agriculture, significantly improves harvesting efficiency while reducing labor costs [33]. However, traditional methods for fruit ripeness detection primarily rely on simple features such as color and size, which are insufficient under variable environmental conditions and large color differences. Although several methods have been proposed, they often remain highly dependent on external environments and struggle to balance detection accuracy and computational efficiency [27]. Thus, developing a robust and efficient algorithm for strawberry ripeness detection is of critical importance.
To address these challenges, this study proposes an improved YOLOv8-based model, named YOLOv8_CDW which enhances detection accuracy and robustness without compromising real-time performance. In the data collection phase, variations in lighting, occlusion, and viewing angles were fully considered, thereby improving the model’s adaptability to real-world agricultural conditions. Furthermore, key structural modifications were made: the conventional bilinear interpolation upsampling module was replaced with the DySample module, and a CA mechanism was integrated into the C2F layer.
Despite the fact that the overall quantitative metrics of all of the models under comparison demonstrate analogous trends, the integration of CA and DySample modules results in substantial enhancements in classification precision and background suppression. The present findings are consistent with earlier studies suggesting that attention mechanisms have the capacity to augment feature representation by accentuating salient channels and mitigating inter-class confusion. CA recalibrates feature responses for each channel in order to facilitate the network’s ability to focus on discriminative information that is relevant to the target categories. DySample is a dynamic sampling strategy that adjusts the sample selection based on the data distribution. This helps the model learn from difficult examples and improves its generalization ability.
The experimental results demonstrate that the proposed YOLOv8_CDW model achieves significant improvements in strawberry ripeness detection, with 96.9% precision, 93.6% recall, 97.3% mAP@0.5, and an F1 score of 95.5%. Compared to the baseline YOLOv8, this corresponds to gains of 8.39%, 18.63%, and 12.75% (mAP@0.5), respectively. These advancements contribute to minimizing misclassification of ripeness stages, thereby optimizing harvest timing and enhancing consistency in field application, even under variable environmental conditions.
Nonetheless, this study has several limitations. While the model performs well in strawberry detection, its generalizability to other fruits or crops remains to be tested. The complex interplay between climate, soil, and crop physiology also poses a challenge to model stability. Moreover, although variations in lighting and occlusion were considered, this study did not fully examine physiological traits. Future research should quantify these factors’ impacts and further optimize the architecture.
To overcome these limitations, future work should explore the model’s generalization across different fruit types and developmental stages. Special attention should also be given to its adaptability and stability under diverse real-field scenarios, including variable climate conditions and pest interference. Continuous optimization will further contribute to the development of smart agriculture and autonomous harvesting systems, supporting sustainable agricultural productivity.

5. Conclusions

In this study, we proposed an enhanced version of the YOLOv8 object detection model, termed YOLOv8_CDW, specifically designed to accurately and comprehensively identify the ripeness stages of strawberries under complex agricultural environments. In addition to architectural improvements to the detection network, we also introduced a complementary image-processing-based classification strategy to further refine the detection and categorization of strawberry ripeness stages.
The main contributions and findings of this study are summarized as follows:
  • The integration of a CA mechanism into the backbone network of the original YOLOv8 significantly enhances the model’s capacity to capture fine-grained features by reinforcing inter-channel dependencies within feature maps. This modification allows the model to better represent the subtle visual cues associated with different ripeness stages, such as variations in surface texture and color gradients, thereby improving its discriminative power in challenging scenarios.
  • The incorporation of the Wise-IoU loss function during training enables the model to dynamically adjust the weights assigned to bounding boxes based on their quality. This adaptive weighting mechanism increases the influence of high-quality bounding boxes while effectively reducing the impact of noisy or low-quality samples. As a result, the model better handles the imbalance between easy and hard samples—a common challenge in object detection tasks involving variable natural conditions.
  • Experimental results on a self-collected strawberry dataset demonstrate the superior performance of the proposed YOLOv8_CDW model. It achieved an accuracy of 96.9%, a recall of 93.6%, a mAP@50 of 0.973, and an F1 score of 95.5%, outperforming baseline models including FAST R-CNN, YOLOv5, YOLOv7, and the original YOLOv8 in both accuracy and inference speed. Notably, in visually complex environments where unripe strawberries closely resemble the surrounding foliage in color and texture, YOLOv8_CDW maintained high detection robustness. These results validate the model’s ability to support efficient, precise, and real-time fruit detection, which is essential for intelligent agricultural applications such as automated harvesting and field monitoring.

Author Contributions

Y.Y. contributed to writing—original draft, review and editing, validation, software development, methodology design, and conceptualization. H.W. was responsible for the review and editing, resource provision, project administration, and funding acquisition. S.X. contributed to manuscript review, editing, and validation. All authors have read and agreed to the published version of the manuscript.

Funding

No external funding was received for this study.

Institutional Review Board Statement

Not applicable.

Informed Consent Statement

Not applicable.

Data Availability Statement

The original contributions presented in this study are included in the article. Further inquiries can be directed to the corresponding authors.

Conflicts of Interest

The authors declare no conflicts of interest.

References

  1. Ma, Z.; Guo, J. Current Status of Machine Vision Technology for Fruit Positioning. South. Agric. Mach. 2024, 55, 6–9. [Google Scholar]
  2. Food and Agriculture Organization of the United Nations (FAO). FAOSTAT Database. Available online: https://www.fao.org/faostat/zh/#data/QCL (accessed on 24 March 2023).
  3. Qian, J.P.; Yang, X.T.; Wu, X.M.; Chen, M.X.; Wu, B.G. A method for recognizing ripe apples in natural scenes based on hybrid color space. J. Agric. Eng. 2012, 28, 137–142. [Google Scholar]
  4. Khojastehnazhand, M.; Mohammadi, V.; Minael, S. Maturity detection and volume estimation of apricot using image processing technique. Sci. Hortic. 2019, 251, 247–251. [Google Scholar] [CrossRef]
  5. Fu, L.; Duan, J.; Zou, X.; Lin, G.; Song, S.; Ji, B.; Yang, Z. Banana detection based on color and texture features in the natural envronment. Comput. Electron. Agric. 2019, 167, 105057. [Google Scholar] [CrossRef]
  6. Zhou, W.J.; Zha, Z.H.; Wu, J. Improved circular Hough transform for in-field red globe grape cluster ripeness discrimination. J. Agric. Eng. 2020, 36, 205–213. [Google Scholar]
  7. Khisanudin, I.S. Dragon fruit maturity detection based-HSV space color using naive bayes classifier method. In IOP Conference Series: Materials Science and Engineering; IOP Publishing: Bristol, UK; Yogyakarta, Indonesia, 2020; Volume 771, p. 12022. [Google Scholar]
  8. Sinanoglou, V.J.; Tsiaka, T.; Aouant, K.; Mouka, E.; Ladika, G.; Kritsi, E.; Konteles, S.J.; Ioannou, A.-G.; Zoumpoulakis, P.; Strati, I.F.; et al. Quality assessment of banana ripening stages by combining analytical methods and image analysis. Appl. Sci. 2023, 13, 3533. [Google Scholar] [CrossRef]
  9. Jiang, W.; Xu, H.; Chen, G.; Zhao, W.; Xu, W. An improved edge-adaptive image scaling algorithm. In Proceedings of the IEEE 8th International Conference on ASIC, Changsha, China, 20–23 October 2009; pp. 895–897. [Google Scholar]
  10. Malik, M.H.; Zhang, T.; Li, H.; Zhang, M.; Shabbir, S.; Saeed, A. Mature tomato fruit detection algorithm based on improved HSV and watershed algorithm. IFAC PapersOnLine 2018, 51, 431–436. [Google Scholar] [CrossRef]
  11. Mohammadi, V.; Kheiralipour, K.; Ghasemi-Varnamkhastl, M. Detecting maturity of persimmon fruit based on image processing technique. Sci. Hortic. 2015, 184, 123–128. [Google Scholar] [CrossRef]
  12. Jiang, H.; Hu, Y.; Jiang, X.; Zhou, H. Maturity stage discrimination of Camellia oleifera fruit using visible and nearinfrared hyperspectral imaging. Molecules 2022, 27, 6318. [Google Scholar] [CrossRef]
  13. Sun, M.; Jiang, H.; Yuan, W.; Jin, S.; Zhou, H.; Zhou, Y.; Zhang, C. Discriminaion of maturity of Camellia oleifera fruit on-site based on generaive adversarial network and hyperspectral imaging technique. J. Food Meas. Charact. 2023, 18, 10–25. [Google Scholar] [CrossRef]
  14. Septiarini, A.; Sunyoto, A.; Hamdani, H.; Kasim, A.A.; Utaminingrum, F.; Hatta, H.R. Machine vision for the maturity classification of oil palm fresh fruit bunches based on color and texture features. Sci. Hortic. 2021, 286, 110245. [Google Scholar] [CrossRef]
  15. Wang, L.S.; Qin, M.X.; Lei, J.Y.; Wang, X.F.; Tan, K.Z. A method for blueberry ripeness recognition based on the improved YOLOv4-Tiny model. J. Agric. Eng. 2021, 37, 170–178. [Google Scholar]
  16. MacEachern, C.B.; Esau, T.J.; Schumann, A.W.; Hennessy, P.J.; Zaman, Q.U. Detection of fruit maturity stage and yield estimation in wid blueberry using deep learing convolutional neural networks. Smart Agric. Technol. 2023, 3, 100099. [Google Scholar] [CrossRef]
  17. Xiao, B.; Nguyen, M.; Yan, W.Q. Apple ripeness identification from digital images using transformers. Multimed. Tools Appl. 2024, 83, 7811–7825. [Google Scholar] [CrossRef]
  18. Zhao, H.; Qiao, Y.J.; Wang, H.J.; Yue, Y.J. Apple fruit recognition in complex orchard environments based on the improved YOLOv3 model. J. Agric. Eng. 2021, 37, 127–135. [Google Scholar]
  19. Zhang, L.; Hao, Q.; Cao, J. Attention-based fine-grained lightweight architecture for fuji apple maturity classification in an open-world orchard environment. Agriculture 2023, 13, 228. [Google Scholar] [CrossRef]
  20. Ignacio, J.S.; Eisma, K.N.A.; Caya, M.V.C. A YOLOv5-based deep leaning model for in-situ detection and matunity grading of mango. In Proceedings of the 6th Intenational Conference on Communication and Information Systems (ICCIS), Chongqing, China, 14–16 October 2022; pp. 141–147. [Google Scholar]
  21. Wang, Z.; Ling, Y.; Wang, X.; Meng, D.; Nie, L.; An, G.; Wang, X. An improved Faster R-CNN model for multi-object tomato maturity detection in complex scenarios. Ecol. Inform. 2022, 72, 101886. [Google Scholar] [CrossRef]
  22. Yan, B.; Fan, P.; Lei, X.; Liu, Z.; Yang, F. A real-time apple targets detection method for picking robot based on improved YOLOv5. Remote Sens. 2021, 13, 1619. [Google Scholar] [CrossRef]
  23. Zhang, J.N.; Bi, Z.Y.; Yan, Y.; Wang, P.C.; Hou, C.; Lv, S.S. Rapid recognition of greenhouse tomatoes based on attention mechanism and improved YOLO. J. Agric. Mach. 2023, 54, 236–243. [Google Scholar]
  24. Gao, X.Y.; Wei, S.; Wen, Z.Q.; Yu, T. Improved YOLOv5 lightweight network for citrus detection. Comput. Eng. Appl. 2023, 59, 212–221. [Google Scholar] [CrossRef]
  25. Zhang, H.; Zhang, K.; Zhang, J.; Tao, D. SCNet: Spatial and Channel-wise Attention for Semantic Segmentation. In Proceedings of the Thirty-Fifth AAAI Conference on Artificial Intelligence (AAAI), Palo Alto, CA, USA, 2–9 February 2021; Volume 35, pp. 10765–10773. [Google Scholar]
  26. Woo, S.; Park, J.; Lee, J.-Y.; Kweon, I.S. CBAM: Convolutional Block Attention Module. In Proceedings of the 15th European Conference on Computer Vision (ECCV), Munich, Germany, 8–14 September 2018; Volume 11211, pp. 3–19. [Google Scholar]
  27. Zhou, X.; Liu, Y.; Yin, J.; Yang, J. Strawberry Ripeness Detection Using Improved YOLOv5 Model under Complex Backgrounds. Appl. Sci. 2023, 13, 1861. [Google Scholar]
  28. Hou, Q.; Zhou, D.; Feng, J. Coordinate Attention for Efficient Mobile Network Design. In Proceedings of the IEEE/CVF Conference on Computer Vision and Pattern Recognition (CVPR), Nashville, TN, USA, 19–25 June 2021; pp. 13708–13717. [Google Scholar]
  29. Zheng, Z.; Wang, P.; Liu, W.; Li, J.; Ye, R.; Ren, D. Distance-IoU Loss: Faster and Better Learning for Bounding Box Regression. In Proceedings of the AAAI Conference on Artificial Intelligence (AAAI), New York, NY, USA, 7–12 February 2020; Volume 34, pp. 12993–13000. [Google Scholar]
  30. Tong, Z.J.; Chen, Y.H.; Xu, Z.W.; Yu, R. Wise-IoU: Bounding Box Regression Loss with Dynamic Focusing Mechanism. arXiv 2023, arXiv:2301.10051. [Google Scholar]
  31. Everingham, M.; Van Gool, L.; Williams, C.K.; Winn, J.; Zisserman, A. The Pascal Visual Object Classes (VOC) Challenge. Int. J. Comput. Vis. 2010, 88, 303–338. [Google Scholar] [CrossRef]
  32. Lin, T.Y.; Maire, M.; Belongie, S.; Hays, J.; Perona, P.; Ramanan, D.; Dollár, P.; Zitnick, C.L. Microsoft COCO: Common Objects in Context. In Proceedings of the Computer vision–ECCV 2014: 13th European Conference (ECCV), Zurich, Switzerland, 6–12 September 2014; pp. 740–755. [Google Scholar]
  33. Wang, X.; Wang, J.; Yu, H.; Liu, Z. Design and Experiment of a Strawberry Picking Robot with Visual Identification and Deep Learning. Appl. Sci. 2021, 11, 2327. [Google Scholar]
Figure 1. Data augmentation.
Applsci 15 06324 g001
Figure 2. Example of strawberry maturity classification: (a) ripe; (b) turning; (c) raw.
Applsci 15 06324 g002
Figure 3. YOLOv8 network structure diagram.
Applsci 15 06324 g003
Figure 4. Detailed design of the CA module.
Applsci 15 06324 g004
Figure 5. Feature maps after pooling along the X and Y directions.
Applsci 15 06324 g005
Figure 6. YOLOv8 network structure diagram with CA.
Applsci 15 06324 g006
Figure 7. Detailed design of DySample.
Applsci 15 06324 g007
Figure 8. YOLOv8 network structure diagram with CA + DySample.
Applsci 15 06324 g008
Figure 9. Comparison of mAP@0.5 of different algorithms.
Applsci 15 06324 g009
Figure 10. Normalized confusion matrix: (a) original YOLOv8 model; (b) YOLOv8-CDW.
Applsci 15 06324 g010
Figure 11. The four evaluation metrics before and after improvement: (a) Recall, (b) Precision, (c) mAP@0.5, and (d) mAP@0.5:0.95: (a) original YOLOv8 model; (b) YOLOv8-CDW.
Applsci 15 06324 g011
Figure 12. Comparison of various performance metrics between YOLOv8 and the improved YOLOv8: (a) original YOLOv8 model; (b) YOLOv8-CDW.
Applsci 15 06324 g012
Figure 13. Performance comparison of YOLOv8 and its enhanced version across experimental metrics.
Applsci 15 06324 g013
Figure 14. Several different improvement methods in mAP@0.5.
Applsci 15 06324 g014
Figure 15. Detection result comparison diagram of FAST R-CNN, YOLOv5, YOLOv7, YOLOv8, and YOLOv8_CDW. Red: Areas with the highest model attention, indicating the highest confidence that the target (strawberry) is present. Orange: Areas with high model attention and relatively high confidence. Yellow: Areas with moderate model attention, possibly containing partial target features. Green: Areas with low model attention and low confidence. Blue: Areas with minimal model attention, indicating very low confidence that the target is present.
Applsci 15 06324 g015
Table 1. Object detection results with Faster R-CNN on MS COCO. Best performance is in boldface and second best is underlined.
FAST R-CNNBackboneParamsAPAP50AP75APSAPMAPL
NearestR5046.8 M37.558.240.821.941.148.9
DeconvR50+2.4 M37.357.840.321.341.148.0
PiexlShuffleR50+9.4 M37.558.540.421.541.548.3
CARAFER50+0.3 M38.659.942.223.342.249.7
IndexNetR50+8.4 M37.658.440.921.541.349.2
A2UR50+38.9 K37.358.740.021.741.148.5
FADER50+0.2 M38.559.641.823.142.249.3
SAPA-BR50+0.1 M37.859.240.622.441.449.1
DySample-SR50+4.1 K38.559.542.122.542.150.2
DySample-S+R50+8.2 K38.659.842.122.542.150.0
DySampleR50+32.7 K38.659.942.022.942.150.2
DySample+R50+65.5 K38.760.042.222.542.450.2
NearestR10165.8 M39.460.143.122.443.751.1
DySample+R101+65.5 K40.561.643.824.244.552.3
Table 2. Comparison of results of different YOLO baseline models.
ModelPrecisionRecallmAP@0.5mAP@0.5:0.95F1 Score
FAST R-CNN0.7130.6110.8370.6300.660
YOLOv50.8890.7930.8850.5590.856
YOLOv70.8920.8080.8970.7630.847
YOLOv80.8940.7890.8620.6490.860
YOLOv8_CDW0.9690.9360.9730.8230.972
Table 3. Comparison of improvement results based on YOLOv8 model.
ModelPrecisionRecallmAP@0.5mAP@0.5:0.95F1 Score
YOLOv80.8730.7890.8630.6490.860
YOLOv8_WioU0.9510.9260.9570.7930.924
YOLOv8_CA0.9510.9260.9580.7930.938
YOLOv8_DySample0.9510.9260.9580.7930.943
YOLOv8_CA_DySample0.9470.9310.9650.8150.944
YOLOv8_CDW0.9690.9360.9730.8230.972
Disclaimer/Publisher’s Note: The statements, opinions and data contained in all publications are solely those of the individual author(s) and contributor(s) and not of MDPI and/or the editor(s). MDPI and/or the editor(s) disclaim responsibility for any injury to people or property resulting from any ideas, methods, instructions or products referred to in the content.

