Article

Assessing Building Seismic Exposure Using Geospatial Technologies in Data-Scarce Environments: Case Study of San José, Costa Rica

by
Javier Rodríguez-Saiz
1,2,*,
Beatriz González-Rodrigo
3,
Juan Gregorio Rejas-Ayuga
2,4,
Diego A. Hidalgo-Leiva
5 and
Miguel Marchamalo-Sacristán
2,6,*
1
Buin Ingenieros SL, 28036 Madrid, Spain
2
Departamento de Ingeniería y Morfología del Terreno, Escuela Técnica Superior de Ingenieros de Caminos, Canales y Puertos (ETSICCP), Universidad Politécnica de Madrid, 28040 Madrid, Spain
3
Departamento de Ingeniería y Gestión Forestal, Escuela Técnica Superior de Ingeniería de Montes, Forestal y del Medio Natural (ETSIMFMN), Universidad Politécnica de Madrid, 28040 Madrid, Spain
4
Instituto Nacional de Técnica Aeroespacial (INTA), 28850 Torrejón de Ardoz, Spain
5
Laboratorio de Ingeniería Sísmica, Universidad de Costa Rica, San José 11501-2060, Costa Rica
6
Centro de I+D+i en Infraestructuras Inteligentes y Sostenibles (CIVILis), Escuela Técnica Superior de Ingenieros de Caminos, Canales y Puertos (ETSICCP), Universidad Politécnica de Madrid, 28040 Madrid, Spain
*
Authors to whom correspondence should be addressed.
Appl. Sci. 2025, 15(11), 6318; https://doi.org/10.3390/app15116318
Submission received: 11 March 2025 / Revised: 23 May 2025 / Accepted: 26 May 2025 / Published: 4 June 2025
(This article belongs to the Special Issue Infrastructure Resilience Analysis)

Abstract

:
The world population affected by seismic risk is increasing due to urban sprawl, especially in vulnerable areas of countries with high population growth. Despite this trend, seismic exposure assessments have predominantly focused on cities in high-income countries, leaving a knowledge gap in data-scarce, seismically active urban areas. This research presents a novel, scalable geospatial methodology for seismic exposure assessment in contexts with limited data availability and its application to San José, Costa Rica, evaluating its time and cost efficiency. The methodology prioritizes the use of free and open-access geospatial data to construct city-scale Geospatial Exposure Databases (city-GEDs) at the individual building level. These databases integrate key attributes from the Global Earthquake Model (GEM) taxonomy, including the building footprint, the plan regularity, the construction date, the roof material, the relative position within the urban block, and urban block compactness. Random Forest classification models were developed to assign buildings to expert-defined building typologies (BTs). In the case of San José, 7226 buildings were classified into eight typologies using the derived attributes, achieving a classification error of 46%. When the building height—visually sampled—was included, the error decreased significantly to 13%, confirming its importance in typology prediction and emphasizing the need for efficient acquisition strategies. This approach is essential for quick pre- or post-disaster seismic risk assessment, allowing time and cost-effective data collection and analysis. This contribution is particularly relevant for Central America and other seismically active regions with limited data, supporting improved risk analysis and urban resilience planning.

1. Introduction

Understanding seismic exposure is fundamental for comprehensive seismic risk assessments, which are essential for reducing the human and economic losses associated with earthquakes. Although global mortality from natural disasters has decreased in recent decades, earthquakes remain as particularly devastating events. The catastrophic earthquakes of 2004 and 2010 alone accounted for 93% and 69% of disaster-related deaths, respectively, in those years [1]. Between 1900 and 2019, seismic events caused approximately 2.6 million deaths globally and generated USD 828 billion in economic losses, ranking as the third and second most significant causes of disaster mortality and damage, respectively [2]. Given the inability to predict the time, location, and magnitude of earthquakes, reduction through exposure assessment and preparedness is paramount. Seismic exposure refers to the quantification of assets, such as populations, buildings, and infrastructure, located in hazard-prone areas, that are potentially vulnerable to seismic impacts. As a key component of seismic risk analysis, exposure studies rely on the accurate identification of building characteristics that influence structural performance during earthquakes. Traditionally, these assessments have been conducted through field surveys and extrapolation techniques, which, although informative, are often limited by low spatial resolution (district or neighborhood scales) and high resource demands.
In recent years, there has been rapid advancement and widespread adoption of geospatial or geomatic technologies, which provide a broad range of tools and methodologies for acquiring, processing, analyzing, and visualizing spatially referenced data. These techniques have become especially relevant with the development of Geospatial Databases (GDs), which facilitate more efficient data acquisition and management [3]. The use of geospatial technologies (GTs) is now recognized as a fundamental phase prior to field survey design, allowing for the selection of optimized sampling areas [4].
These advancements support the extraction of critical building attributes at various spatial scales, from census sections and urban blocks to individual buildings. The Global Earthquake Model (GEM) framework identifies 13 essential attributes for assessing a building’s seismic vulnerability [5]. GTs have proven particularly effective in directly obtaining several of these attributes, such as the building height, the construction or retrofit date, structural irregularity, orientation, and the building plan shape. Additional attributes, like the lateral load-resisting system or the roof system material, can be inferred from secondary variables derived from remote sensing or ancillary data sources.
All of these attributes can be integrated into Geospatial Exposure Databases (GEDs), enabling more comprehensive and scalable seismic risk modelling [6]. Nevertheless, certain attributes, such as exterior wall materials, foundation types, or floor systems, still require field verification. To overcome this limitation, probabilistic methodologies have been proposed to estimate non-surveyed building characteristics based on nearby sampled structures, significantly reducing uncertainty and enhancing accuracy [7].
The foundational step in exposure assessment involves obtaining detailed spatial footprint coverages of buildings at the desired scale. These footprints are typically digitized manually [8] using high-resolution orthophotos and LiDAR (Light Detection and Ranging) models [9] derived from UAV (Unmanned Aerial Vehicle) or aerial platforms, as well as satellite imagery [10]. The building height can be retrieved from 3D point clouds generated through photogrammetry or LiDAR [11] or derived from satellite data sources such as TanDEM-X, Sentinel-2 [12], or even Google Street View [8], with the vertical resolution ranging from centimeters to entire floors. Remote sensing is increasingly leveraged to identify attributes such as the construction age, the roof materials through both manual classification and multi/hyperspectral image analysis [11,13,14], and urban compactness [15].
While most existing exposure studies focus on urban areas in high-income countries like those in Western Europe [16,17], the United States [18,19], Japan [20], and China [10,21,22], there is a growing need for similar assessments in data-scarce but seismically active regions such as Central America [23,24], the Caribbean [11], Pacific South America [25,26], and the Pacific Ring of Fire [8,9]. In such contexts, the availability and strategic use of open-access geospatial data become particularly critical for improving seismic risk mitigation efforts.
Costa Rica, located within the seismically active zone, exemplifies the need for robust seismic exposure assessments. The Gran Área Metropolitana (GAM), which includes the capital city San José and constitutes the most densely populated region of the country, has approximately 0% of the country’s population. Historically, the GAM has experienced numerous destructive earthquakes due to its location within the tectonically active Central Valley, which is intersected by a complex system of active faults. In particular, several active fault systems are located in close proximity to the Central Cantón of San José, which could generate critical hazard scenarios [27]. Since the publication of its first seismic code in 1974 [28] by the CFIA (Colegio Federado de Ingenieros y Arquitectos de Costa Rica), Costa Rica has progressively incorporated advanced seismic design principles into its building regulations. The 1986 code [29] introduced seismic risk studies and standards for prefabricated systems, while the 2002 code [30] expanded structural classifications and adopted nonlinear analysis methods. The most recent code in 2010 [31] further updated design requirements, particularly for timber and steel constructions. These evolving regulations offer a robust framework for distinguishing between pre- and post-code structures based on their Lateral load-resisting system.
Several exposure studies have been conducted in Costa Rica, predominantly focusing on the capital city. These studies have employed diverse methodologies, ranging from basic census-based estimates to the use of tools such as Hazus [32] and GEM [33]. A detailed summary of these efforts, including their spatial scales, data sources, and attributes assessed, is provided in Table 1. Recent projects have increasingly adopted geomatic technologies to enhance the accuracy, efficiency, and granularity of exposure datasets, positioning Costa Rica as a relevant case study in the broader context of seismic risk assessment in data-limited settings.
Recent technological advancements have improved the precision and depth of building characterization for seismic assessment. In Costa Rica, there has been a growing adoption of the Global Earthquake Model (GEM) methodology, representing a milestone toward the use of standardized, internationally recognized frameworks for evaluating seismic exposure in a region historically limited by data constraints.
The objective of this research is to improve the technical and economic efficiency of seismic exposure studies in areas with high risk and data scarcity by reducing time and costs. To this end, a methodology for the obtention of GEDs and the classification of buildings is developed, ensuring the achievement of building-scale results and the optimum transfer of knowledge to competent institutions.
The main contribution of this methodology is the efficient characterization of all buildings in a city with relevant exposure attributes obtained from open geospatial sources. The use of geomatic techniques to determine building attributes at the individual scale marks a new milestone in seismic exposure studies in Costa Rica in comparison to previous studies (Table 1). Once all possible attributes are characterized using GTs, a Random Forest algorithm is trained to predict building typologies (BTs), which constitute the basis for vulnerability assessment within the seismic risk assessment framework.

2. Methodology

The workflow for the characterization of seismic exposure at the individual building scale for a target city is presented in Figure 1. It is organized in two workflows: geospatial and fieldwork. The geospatial workflow outputs a geospatially characterized city-GED with the attributes obtained with geomatic techniques. A sample of this database (sample-GED) is selected and characterized by fieldwork, incorporating the measured field attributes, including the building height. Buildings in the sample-GED are also classified by expert criteria in the corresponding building types defined after expert consensus in each city. Machine learning classifiers are calibrated with the sample-GED to estimate building typologies from geospatial attributes.

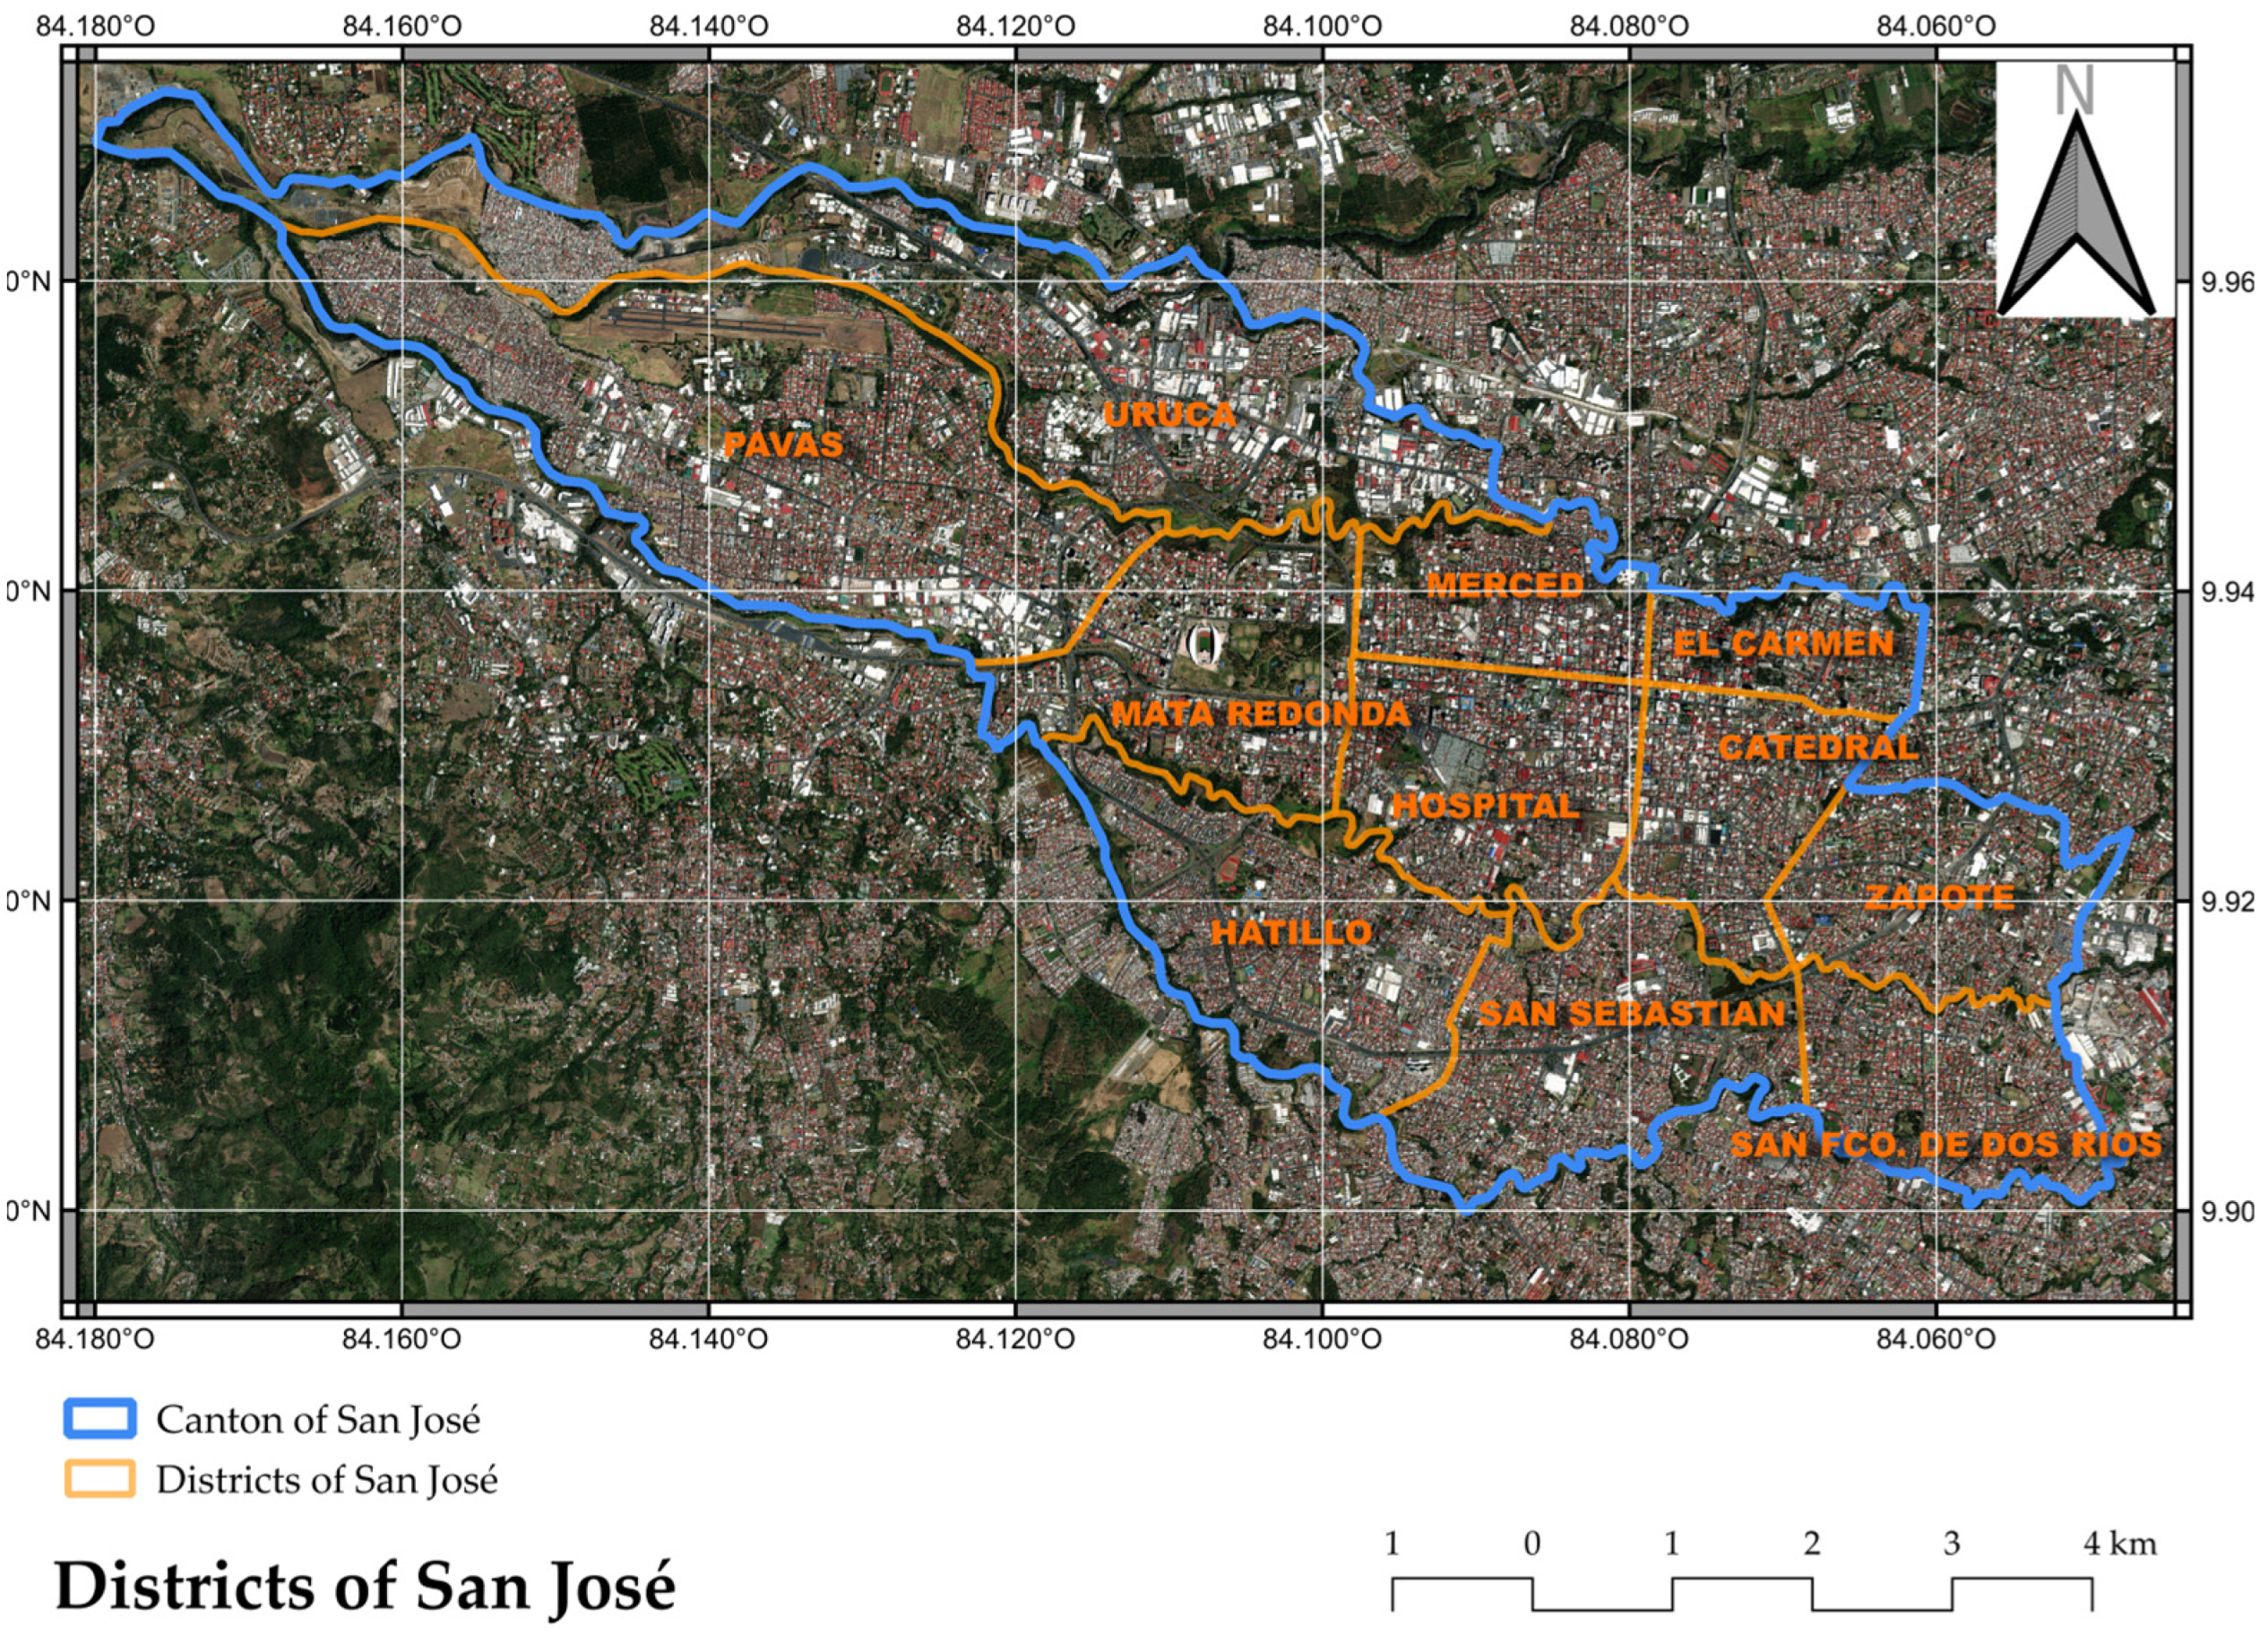
2.1. Study Area, City-GED, and Sample-GED

The canton of San José includes the historic center of the city of San José, which is the capital of Costa Rica. The San José canton (Figure 2) covers an area of 44.37 km2 and has a population, according to the 2011 Census, of 322,155 inhabitants, making it the largest population center in the province. The San José canton is divided into 11 districts: Catedral, El Carmen, Hatillo, Hospital, Mata Redonda, Merced, Pavas, San Francisco de Dos Ríos, San Sebastián, Uruca, and Zapote. The canton hosts 84,004 buildings, with a density of 1893 buildings/km2, making it one of the oldest and most dense urban areas of the country [45]. The city-GED includes the geospatially derived attributes for all buildings in the studied area with the presented methodology.
This study was validated with a sample-GED, a subset of the city-GED, characterized by data from previous research by the University of Costa Rica (UCR) [44,46,47]. Thus, the database of 7296 buildings characterized with the attributes of the GEM taxonomy [48] was used for training and validation of the attributes obtained by geomatic techniques. The sample-GED was elaborated with the Rapid Environmental Mapping (REM) technique developed by the Deutsches GeoForschungsZentrum (GFZ-Potsdam) [49]. It involved four phases: (1) the stratification of target areas or regions of interest, (2) sampling and optimizing routing, (3) visual data collection through the MOMA (MObile MApping) system, and (4) analysis of the data collected through the RRVS (Remote Rapid Visual Screening) platform. The generation of this database required at least 3 days of mobile mapping and 2680 working hours of trained assistants to analyze the data [44]. The building height was visually estimated through the RRVS from the street-view imagery collected by the MOMA system. All buildings were assigned a building typology from 20 classes defined by expert criteria [40]. The buildings in the sample-GED were also characterized with the geospatial exposure attributes obtained in this study.

2.2. Data Sources for the Estimation of Exposure Attributes

Table 2 presents the main attributes of the buildings of the GEM taxonomy, highlighting those obtained with GTs, the open data sources used, and the alternative open-access sources for each attribute. Building height is an attribute that is not usually available in data-scarce cities with high seismic risk, as in San José, implying an acquisition cost.

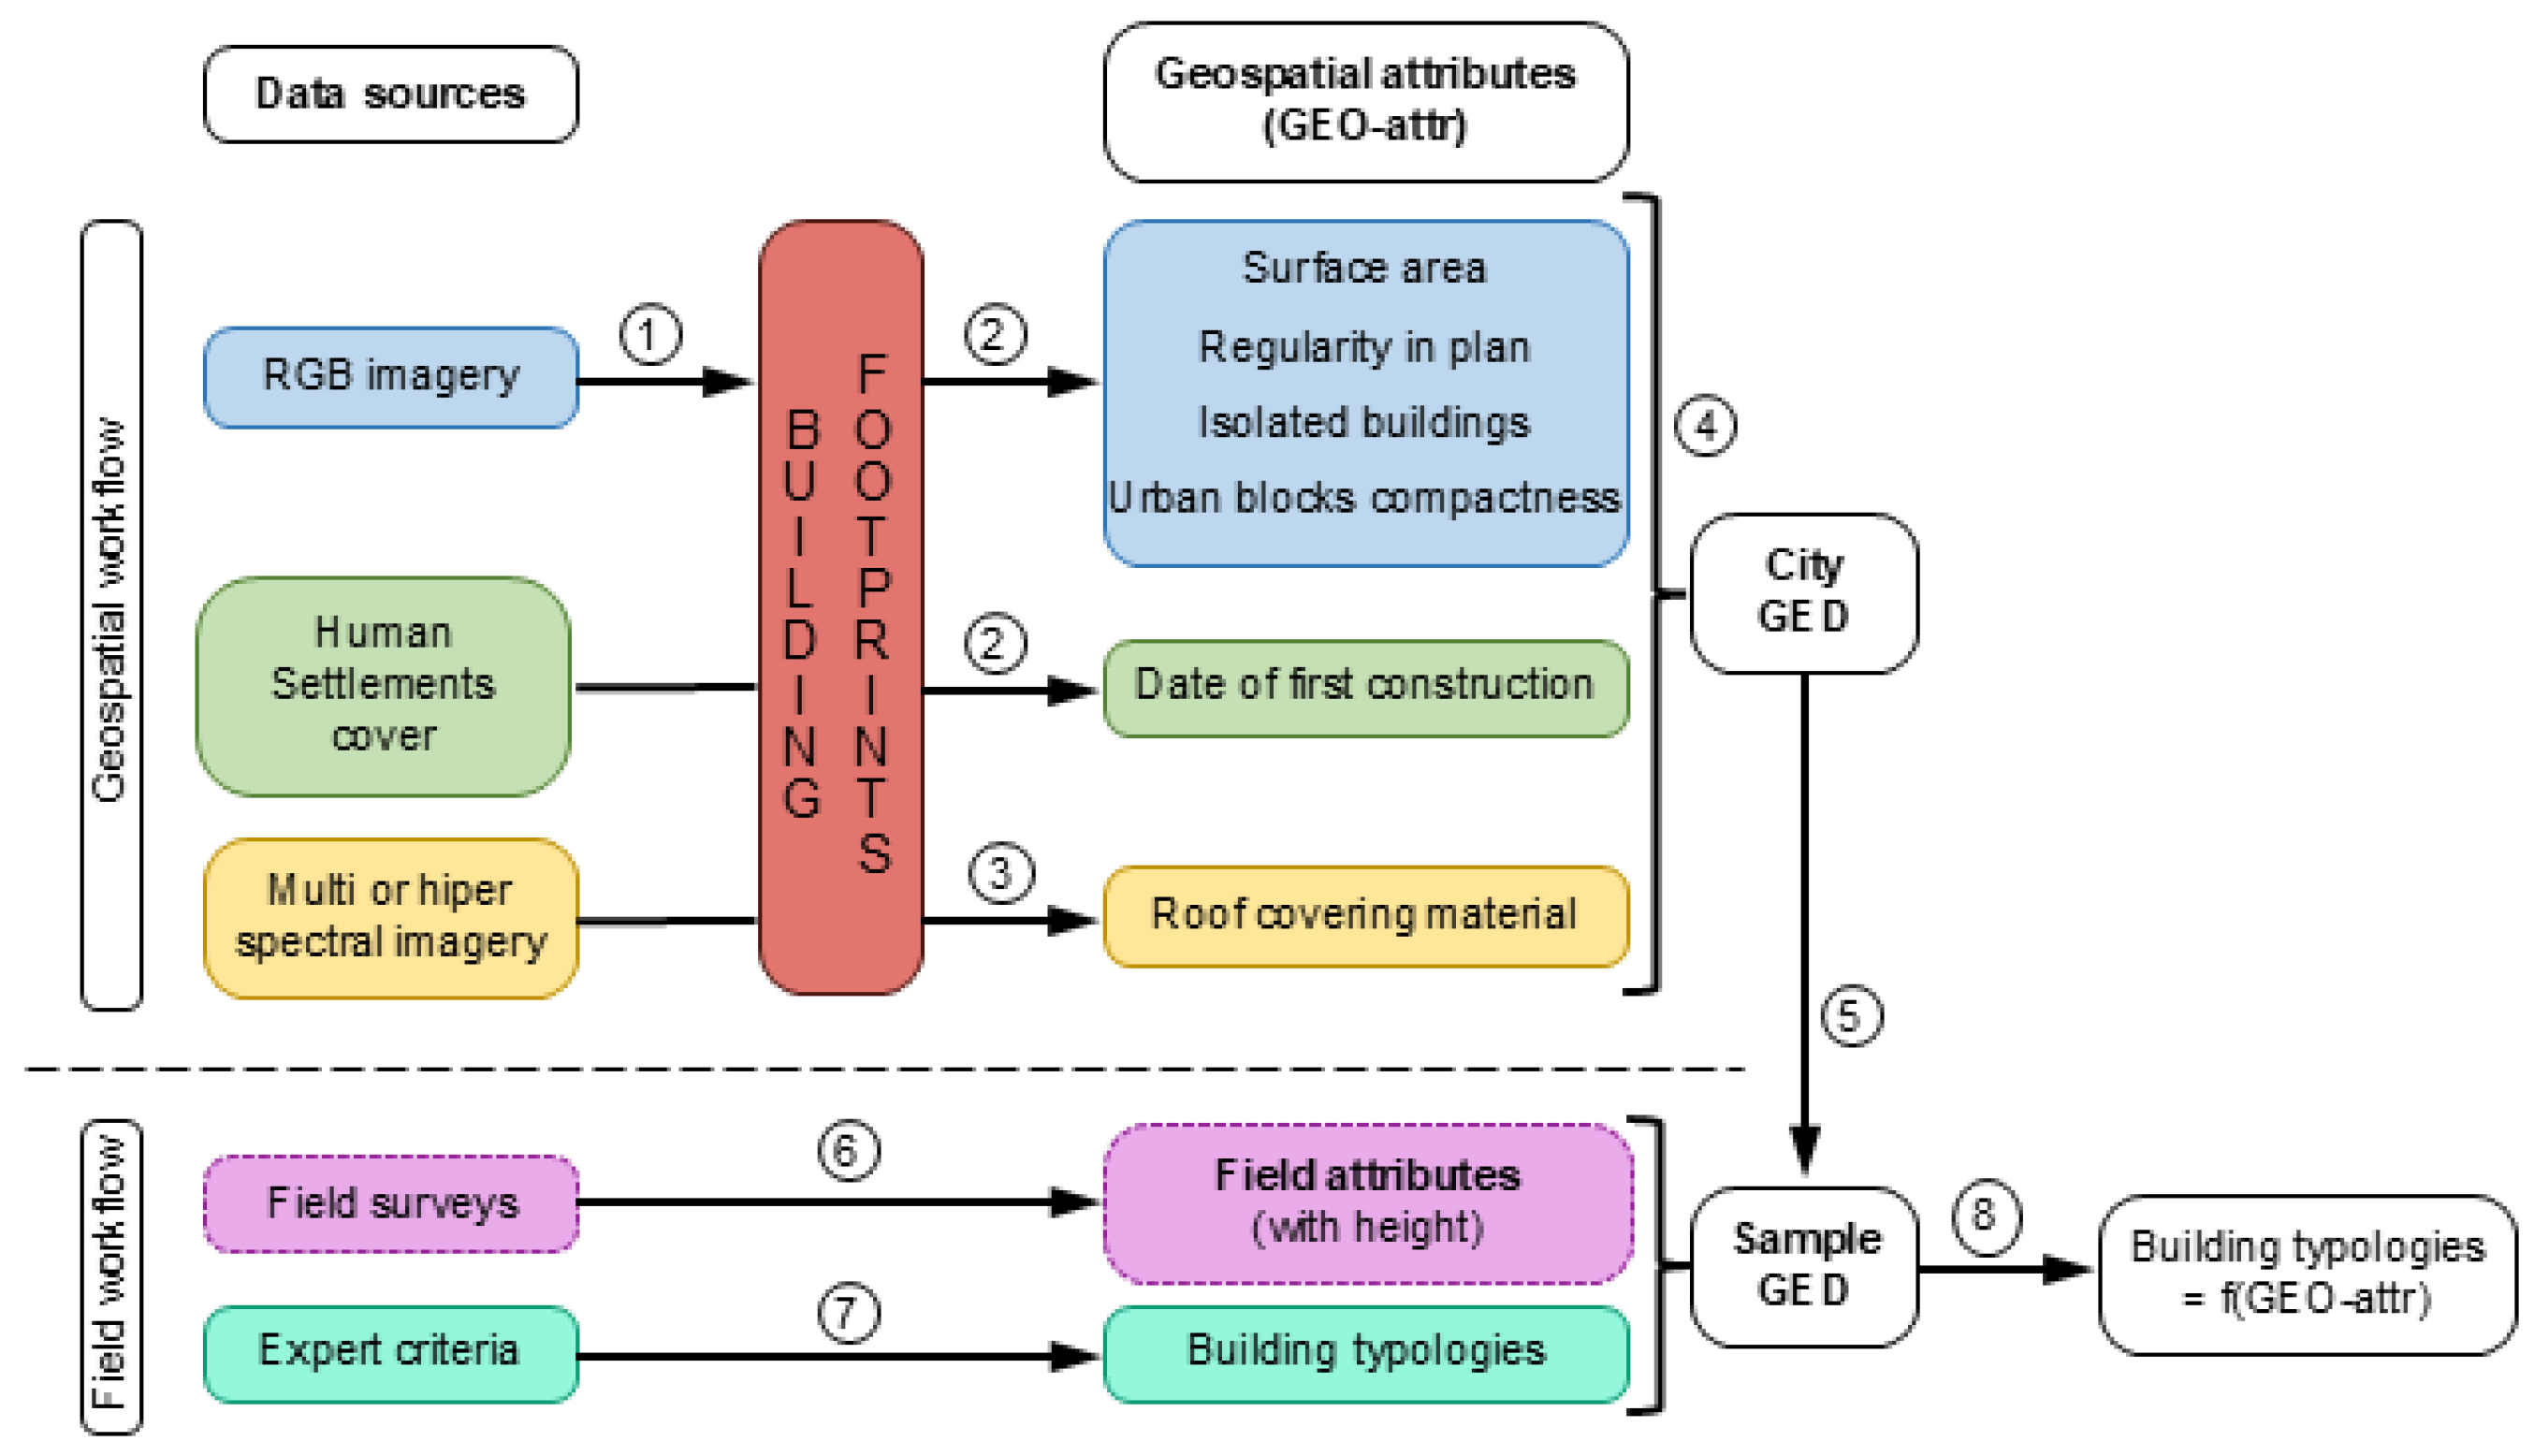
2.3. Integrated Methodology for the Elaboration of Geospatial Exposure Databases

In this chapter, the integrated methodology for the estimation of exposure attributes for the city-GED is presented. The obtention of each of the attributes follows a process adapted to the availability of data. Sources of information vary across the globe and over time, as new data may become available for a given location at any given time. A description of the processes followed in the specific case of the canton of San José is detailed for each attribute.
For the evaluation of efficiency in terms of time and costs, the time dedicated to each task for each member of the research team was registered and priced with actual references in Spain and Costa Rica. The efficiency was compared with full field inventories and mixed methodologies, i.e., the REM method applied in San José by Esquivel et al. [44]. In the case of full building field inventory, the international Project “Sustainable and resilient construction in Central America and the Caribbean in the face of seismic hazard: regional cooperation based on the experience of Costa Rica” provided the planning and budget tables of the survey of the “Calle Morenos” neighborhood with 948 buildings in the San José canton conducted in February 2024 [60].

2.3.1. Footprint of Buildings

The footprints of buildings are the first geospatial element of the GED and can be obtained from different sources. Worldwide coverage is provided by Bing (Microsoft) as open source vector data [58]. Another open alternative source, although not complete, is the building vector cover from OpenStreetMap [52] accessible using OverPass API [61] directly or embedded as a QGIS 3.16.16 plugin. However, the correct delineation at a detailed scale of building footprints is essential to obtain meaningful results in seismic exposure studies, so it is necessary to carry out additional work to ”clean up” these data.
In the case study of San José, footprints were digitized from 2018 national ortophotograps at 1:1000 scale with a 0.5 m accuracy [62].

2.3.2. Plan Regularity

The Polsby–Popper index [63] was calculated for the building footprints polygons to assess the degree of plan irregularity.
P o l s b y P o p p e r   i n d e x = 4 · π · A r e a P e r i m e t e r 2
This index, ranging from 0 to 1, measures how regular a shape is based on its area and perimeter. A value of 1 corresponds to a perfect circle, the most compact shape for a given perimeter. Based on this index, buildings can be classified according to the regularity of their plan.
In seismic design, shapes like squares or rectangles (with one side up to twice the length of the other) are generally considered regular. Buildings with a Polsby–Popper index between 0.65 and 0.85 are classified as very regular. Those with an index between 0.35 and 0.65, or between 0.85 and 1.00, are considered regular. Buildings with an index below 0.35 are considered irregular in plan (example in Figure 3). The 0.35 threshold marks the point where plan irregularity may significantly affect the building’s seismic performance, particularly by introducing torsional effects due to complex or asymmetrical footprints.

2.3.3. Building Height

Building height, expressed either in meters or number of levels, is a relevant attribute in standardized urban cadasters. However, many areas of the world lack this information. In certain urban areas, there is information in OpenStreetMap [52], stored in the key height = * that describes the actual height of a feature (meters) and/or the tag “building.levels”. The building.levels tag records the actual number of above-ground levels (=floors = storeys) of a building or building part, considering that the underground levels and the roof do not count as levels.
If the building height is not available, its obtention implies an investment that should be periodic, as cities evolve over time. The most fitted geomatic technique to estimate height is the calculation from the Z (heights) of a 3D point cloud derived from satellite, plane, or UAV photogrammetry or LiDAR clouds [52].
In the case study of San José, heights were not available, so the attribute was not included in the city-GED. In order to test its relevance in forecasting building typologies, two samples of height were processed, the heights obtained visually for the 7226 buildings of the sample-GED [48] and the heights obtained from a LiDAR-derived 3D point cloud covering a part of the study area (8010 buildings, 9.5%), provided freely by the CNE. The original flight was conducted in July–August 2012, covering a landslide-prone area over the Cerros de Escazú, with FOV: 45°, laser pulse rate: 68,000 Hz, scan rate: 24.4 Hz, and an average point density of 2 points/m2 [50].

2.3.4. Date of First Construction

The date of construction is a relevant parameter for the estimation of the ductility or the lateral load-resisting system, as it can be inferred from the regulation code in force at that moment. The period of first urbanization was obtained from the Global Human Settlement Layer [53], a freely available remote-sense product provided by the JRC (Joint Research Centre) of the European Commission. This product, made from Landsat imagery, covers the entire Earth and indicates the time gap of the first construction of an area (before 1975, between 1975 and 1990, from 1990 to 2000, and finally from 2000 to 2014) with a spatial resolution of 30 meters [64].
In the case study of San José, the periods were reclassified into seismic-code periods as follows: pre-code (before 1974), low code (1974–1986), medium code (1986–2002), and high code (from 2003 onwards).

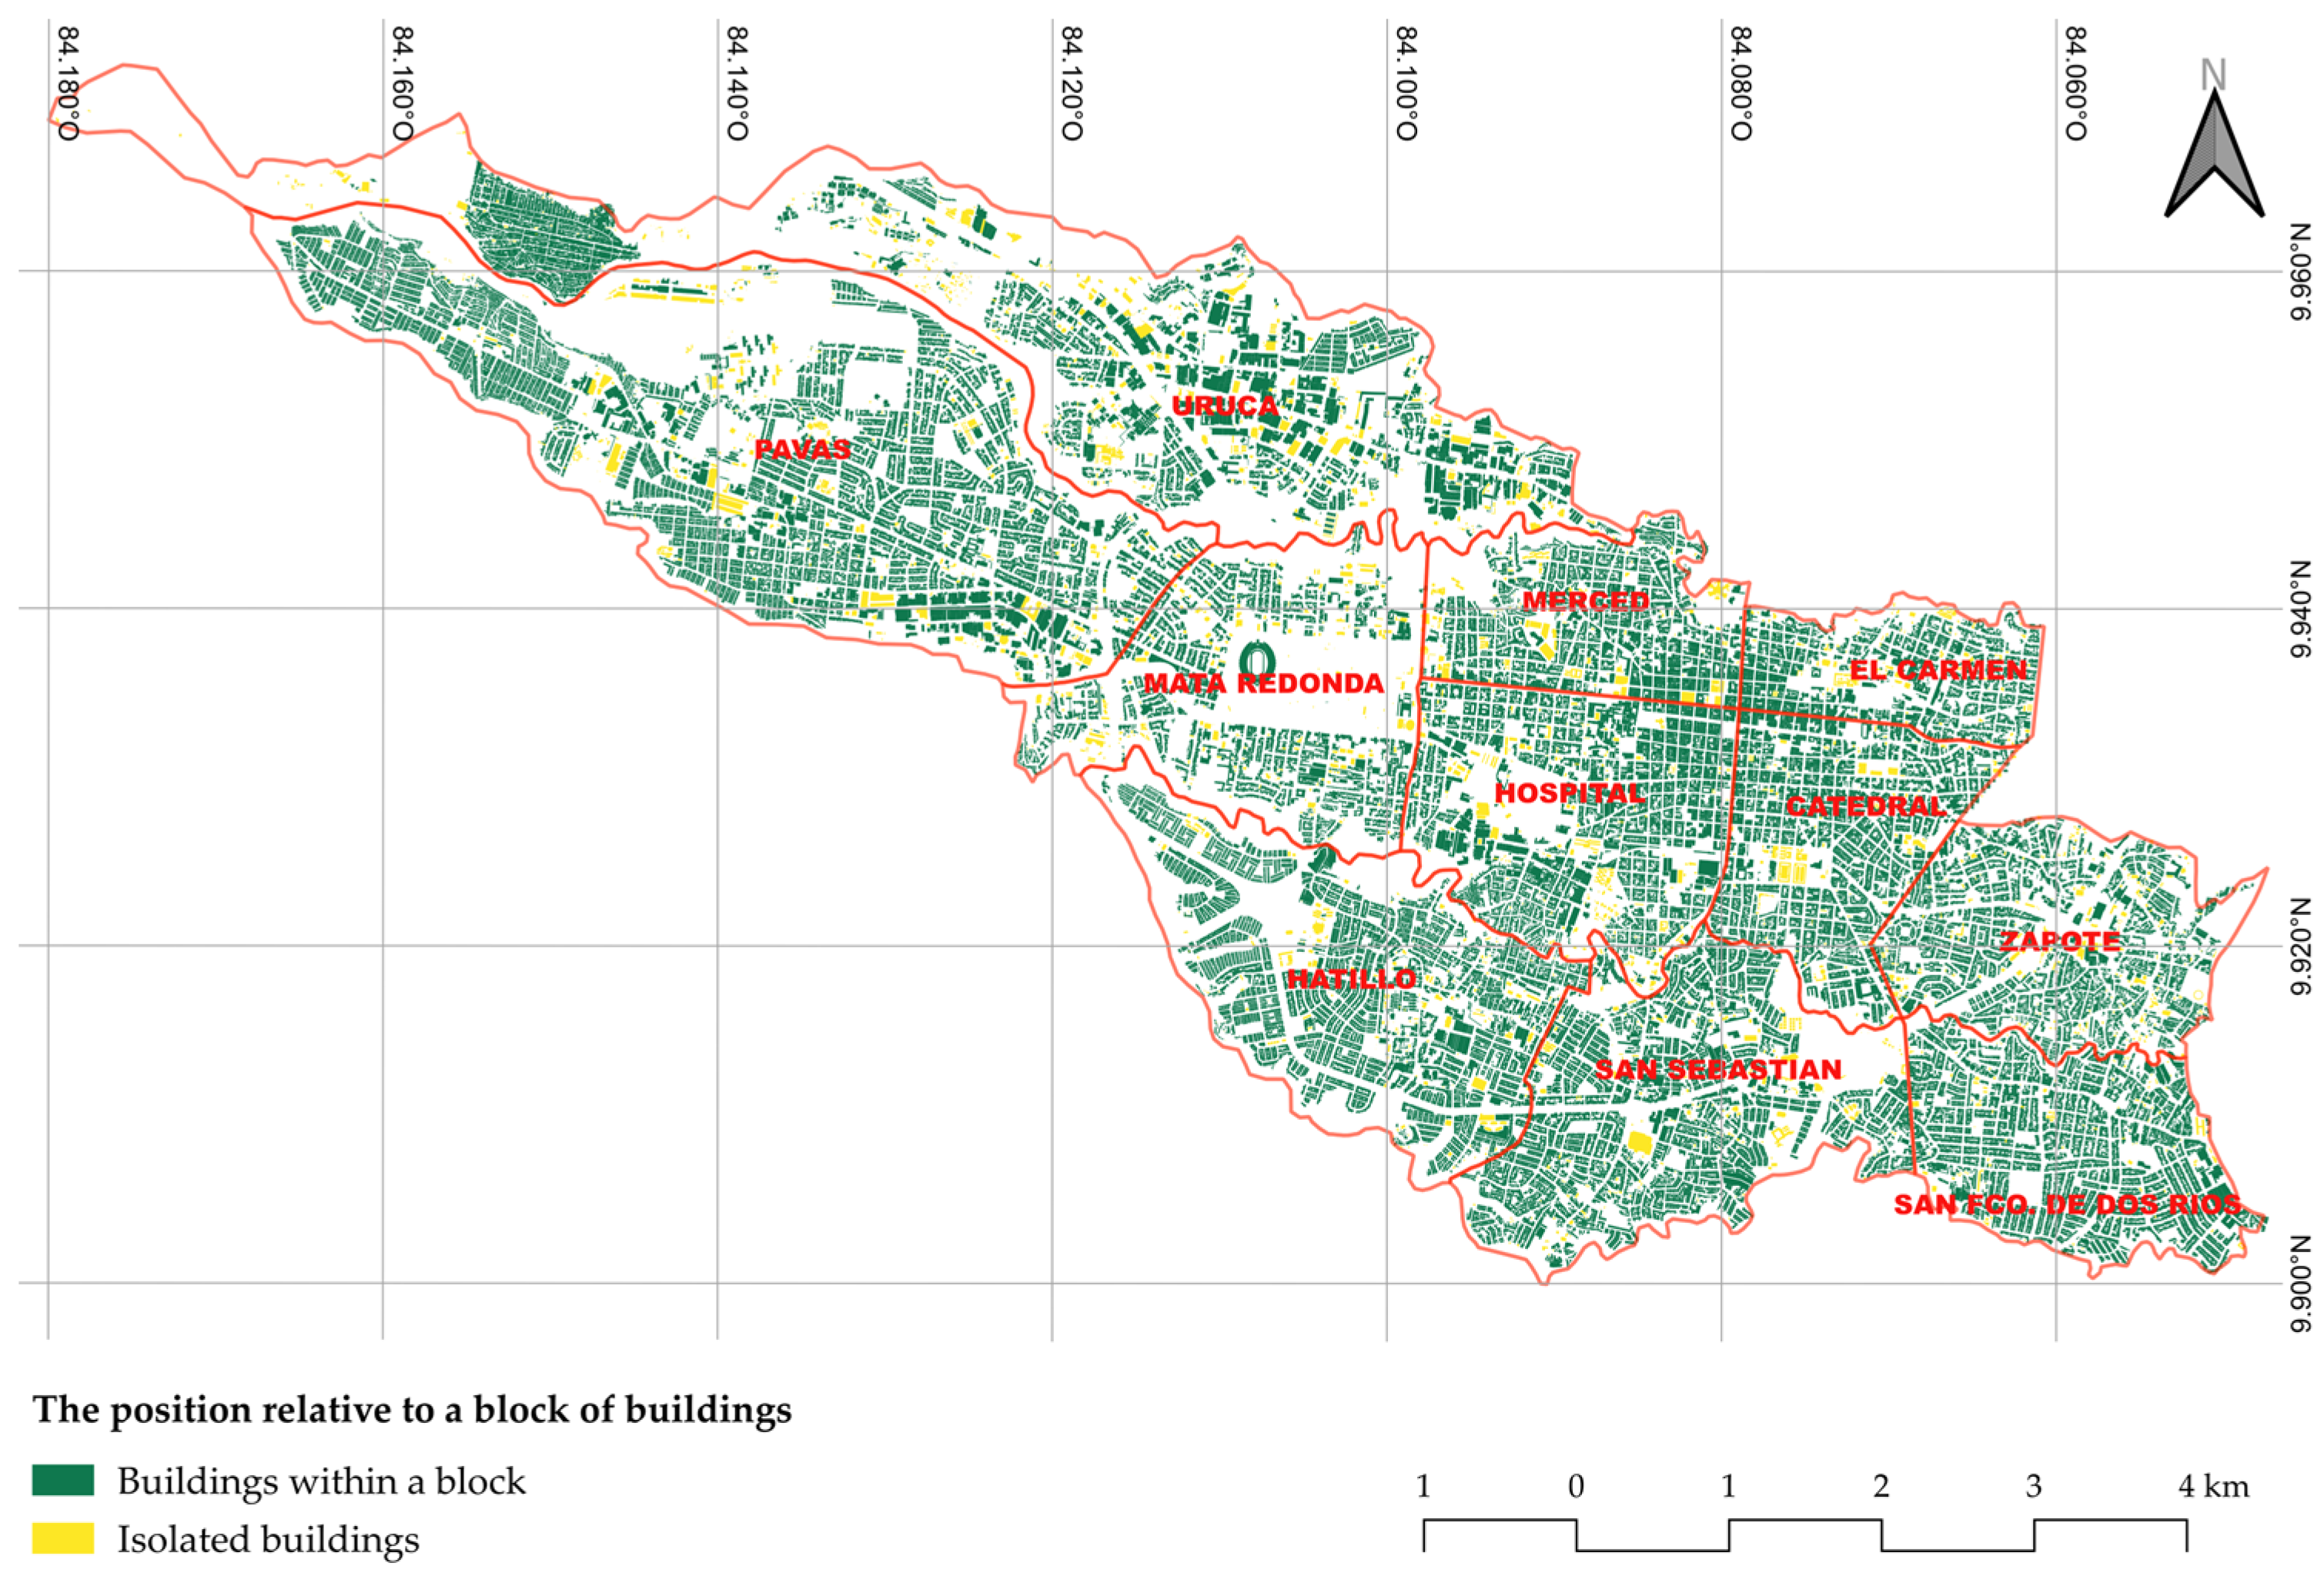
2.3.5. The Position of the Building Within the Urban Block and Urban Block Compactness

The position of a building within an (aggregate) urban block is an important variable in the structural behavior of buildings subjected to an earthquake [65]. The proposed methodology involves three phases: (a) the delimitation of urban blocks, (b) the characterization of the urban blocks, and (c) the classification of buildings by their relative position in the block.
The delimitation of the urban blocks can be performed in GIS either by manual digitization or GIS analysis. In the case study of San José, the urban blocks were defined in QGIS 3.16.16 by subtracting the urban area, the area of the streets, roads, and train lines, and river feature layers downloaded from OpenStreetMap through OverPass API [61]. In the second step, unbuilt and vegetated areas were identified by NDVI analysis of Sentinel-2 imagery and subtracted from previous results. Once delimited and topologically corrected, the urban blocks were characterized by calculating the degree of compactness, as the ratio between the built area and the total area.
Finally, the buildings were classified as isolated and non-isolated. Isolated buildings were identified by a QGIS model involving the buffering of the buildings. To consider a building as separate from the one next to it, the minimum separation was set at 1 meter. This distance was determined based on the precision with which the footprints were obtained, since inaccuracies in the outline of the footprint may occur with distances of less than 1 m, which in turn could lead to errors in the results.

2.3.6. Roof Covering Material

The roof covering material is estimated by unsupervised classification of a fusion product of multispectral imagery and high-resolution orthophotos. For this purpose, free high spectral resolution sources are preferred, as ASTER imagery [56]. An alternative is Sentinel-2 satellite images [55], which are freely available worldwide. Thus, the fused image is characterized by both a high spectral resolution (from the multi or hyperspectral image) and a spatial resolution (from the orthoimage).
In the case of San José, a fused image of the 1:1000 orthoimage and an airborne hyperspectral MASTER image [59] of the city of San José was classified. MASTER imagery, a proxy of ASTER, was shared freely by request to the CENAT. They were obtained in 2006 in the frame of the CARTA Mission, during the development of the ASTER program [66]. The preprocessing, fusion, and classification processes were performed in SNAP 8.0 and ENVI 4.8 software. The fusion algorithm was based on the Gram–Schmidt transform [67]. The classification algorithm used was the k-means algorithm [68]. As classes were not defined previously, an unsupervised algorithm was selected in this case. The classification was carried out using the building footprints as a mask for the fused image, resulting in 5 spectral classes or clusters that were ultimately identified (see Section 3) with 3 informational classes or roof covering material types.

2.4. Prediction of Building Typologies from Geospatial Attributes

Once all the attributes have been obtained using GTs, the next step is to infer those that cannot be directly determined by these methods [69]. Building Typologies (BTs) can be defined by combining the material of the lateral load resisting system (MLLRS), the building height, and ductility. Vulnerability assessment involves the assignment of damage probability curves to each BT to proceed with the generation of seismic risk scenarios. Previous studies [44] classified the BT in San José into 20 categories, which were later integrated into eight classes by expert criteria based on the similarity of their seismic damage probabilities [70] (see Table 3).
Predictive models were trained and developed using Random Forest (RF) algorithms to classify buildings into the defined BTs based on geospatial variables. In the case of San José, the models were trained with the validation database of 7296 buildings using all geospatial variables to predict the eight BT classes in Table 3.
In the case of height, as the LiDAR-derived height did not cover the entire area, the visually surveyed height was included as a proxy of the geospatially obtained height. To check the relevance of height, the first model was run without height (RF1) and the second one was run including the attribute (RF2). The models were evaluated in terms of their mean estimated error (%) and the confusion matrices between classes. A feature importance ranking of the attributes was conducted with the Mean Decrease Gini index calculated by the Random Forest (RF) algorithm [71].

3. Results

3.1. Characterization of the Building Stock of San José

The application of the methodology resulted in a Geospatial Exposure Database of the 84,004 buildings in the study area (city-GED) characterized by the geospatial attributes obtained from open geospatial data.
The following sections present the results for each of the attributes obtained in this work. These results are presented for the whole canton and include frequency graphs of the variables along with some additional statistical results.

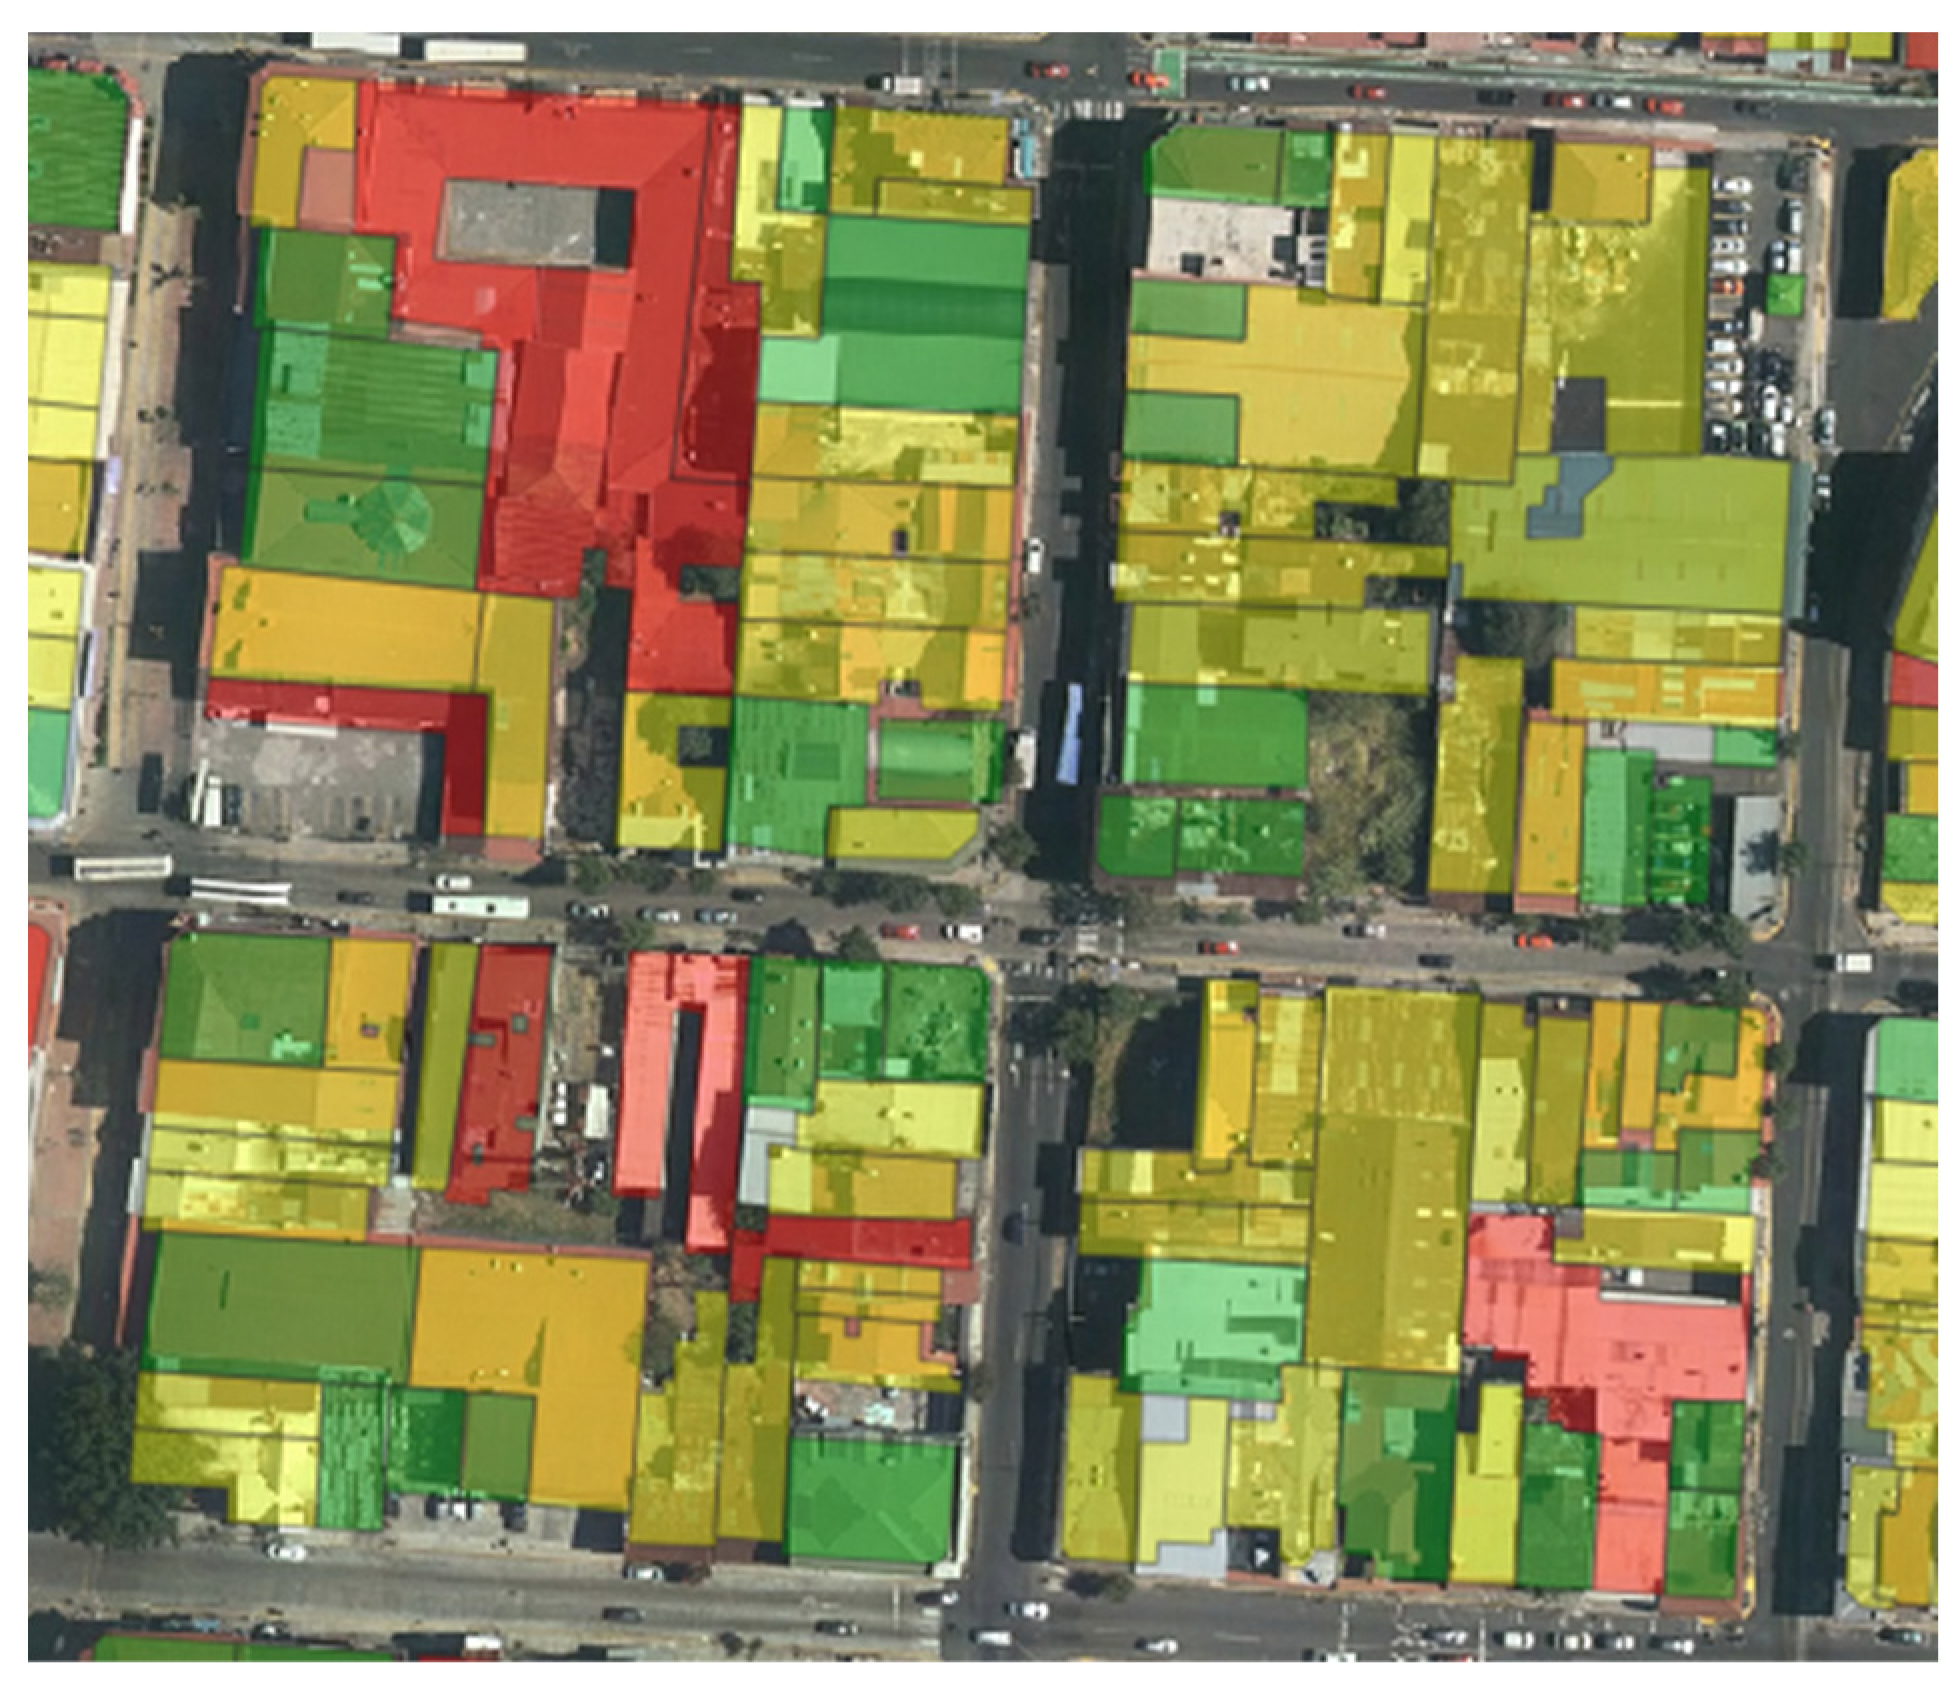
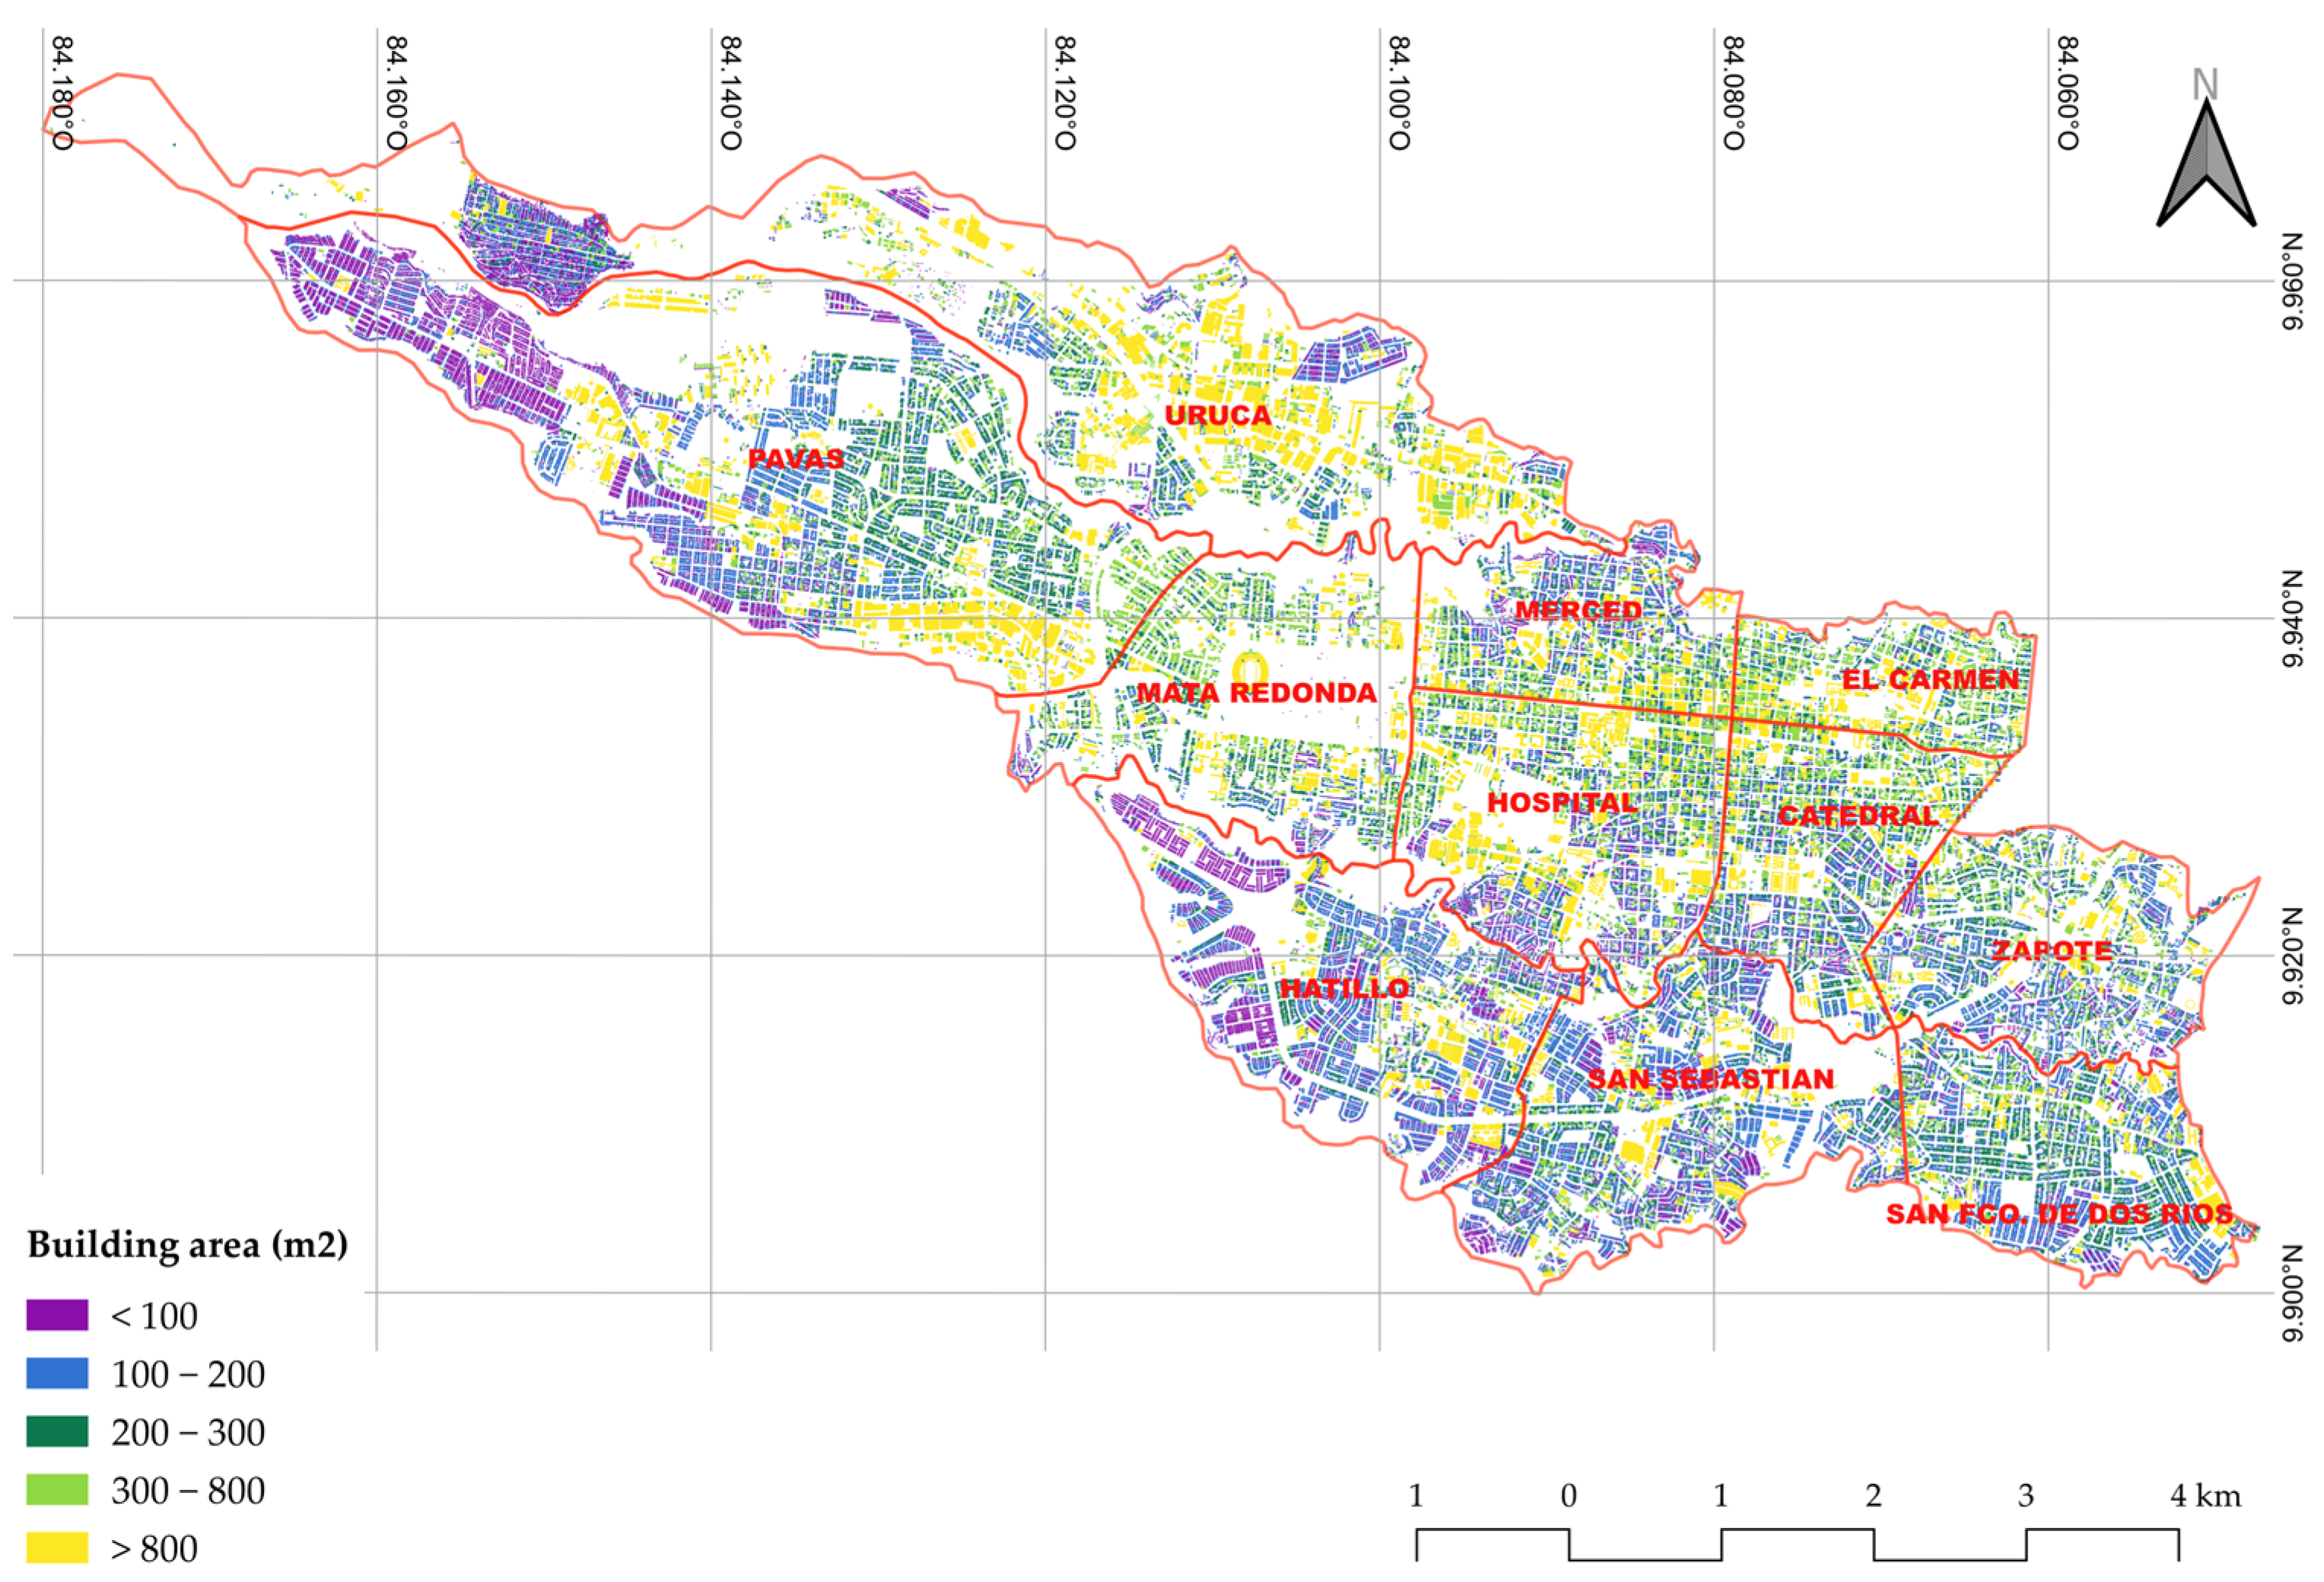
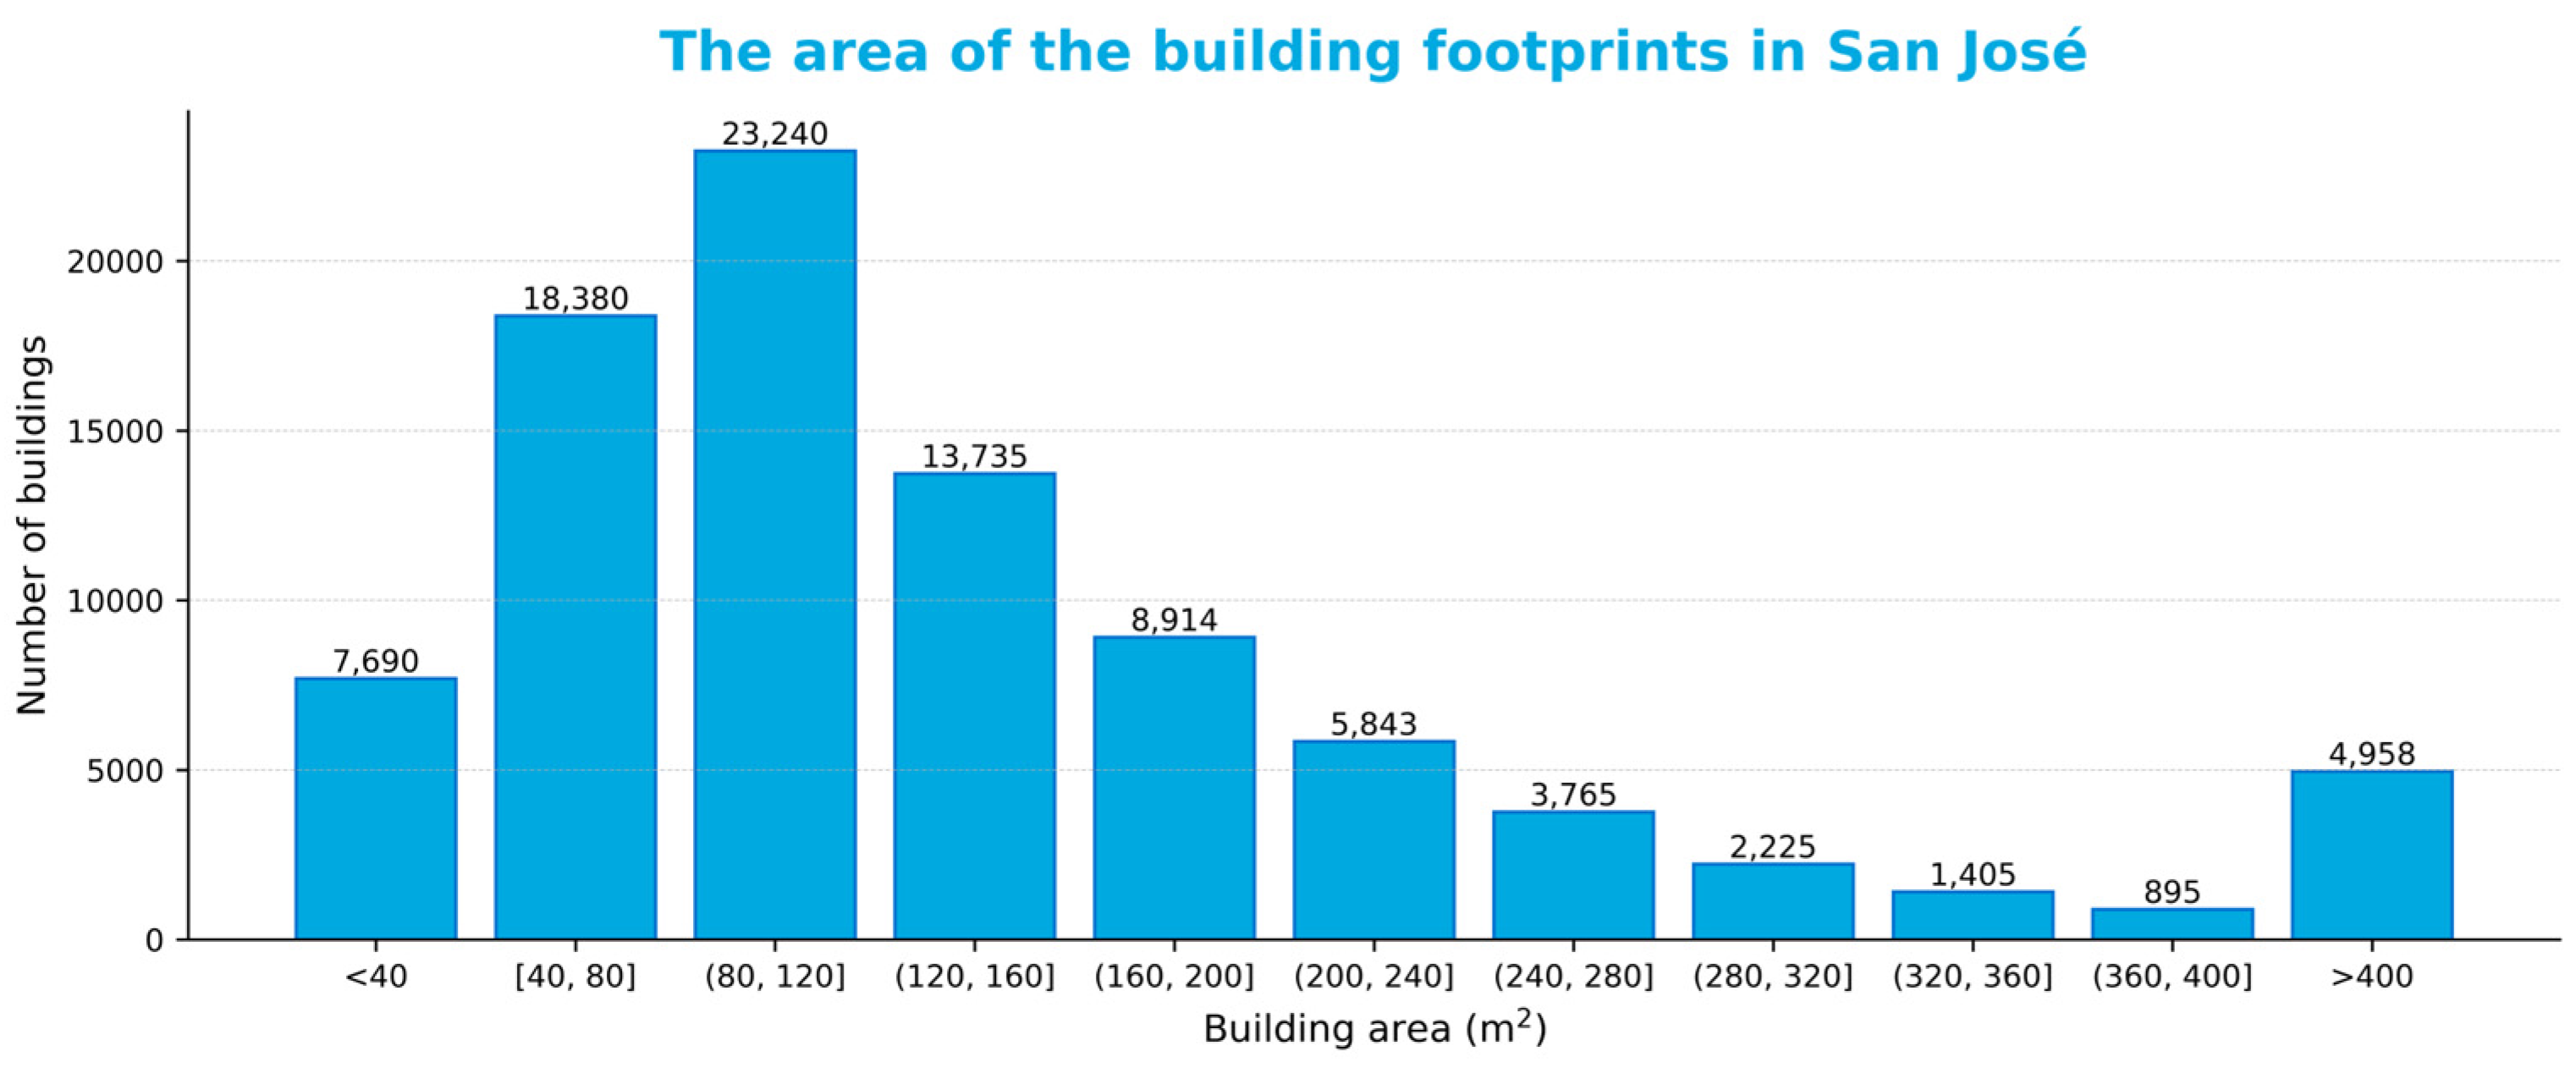
3.1.1. Building Footprint Area

After analyzing the data of the structures in the canton of San José, it can be concluded that the average area of the buildings’ footprints is 174.166 m2 with a median of 111.504 m2. The first quantile presents a value of 74.389 m2 and the third, 181.022 m2. Therefore, it can be concluded that most of the footprint buildings in the canton measure less than 200 m2 (Figure 4). San José is characterized by the fact that most of the buildings are detached or are structures that consist of two dwellings. In contrast, there are few blocks of flats, that is, multi-family buildings with several storeys (Figure 5).

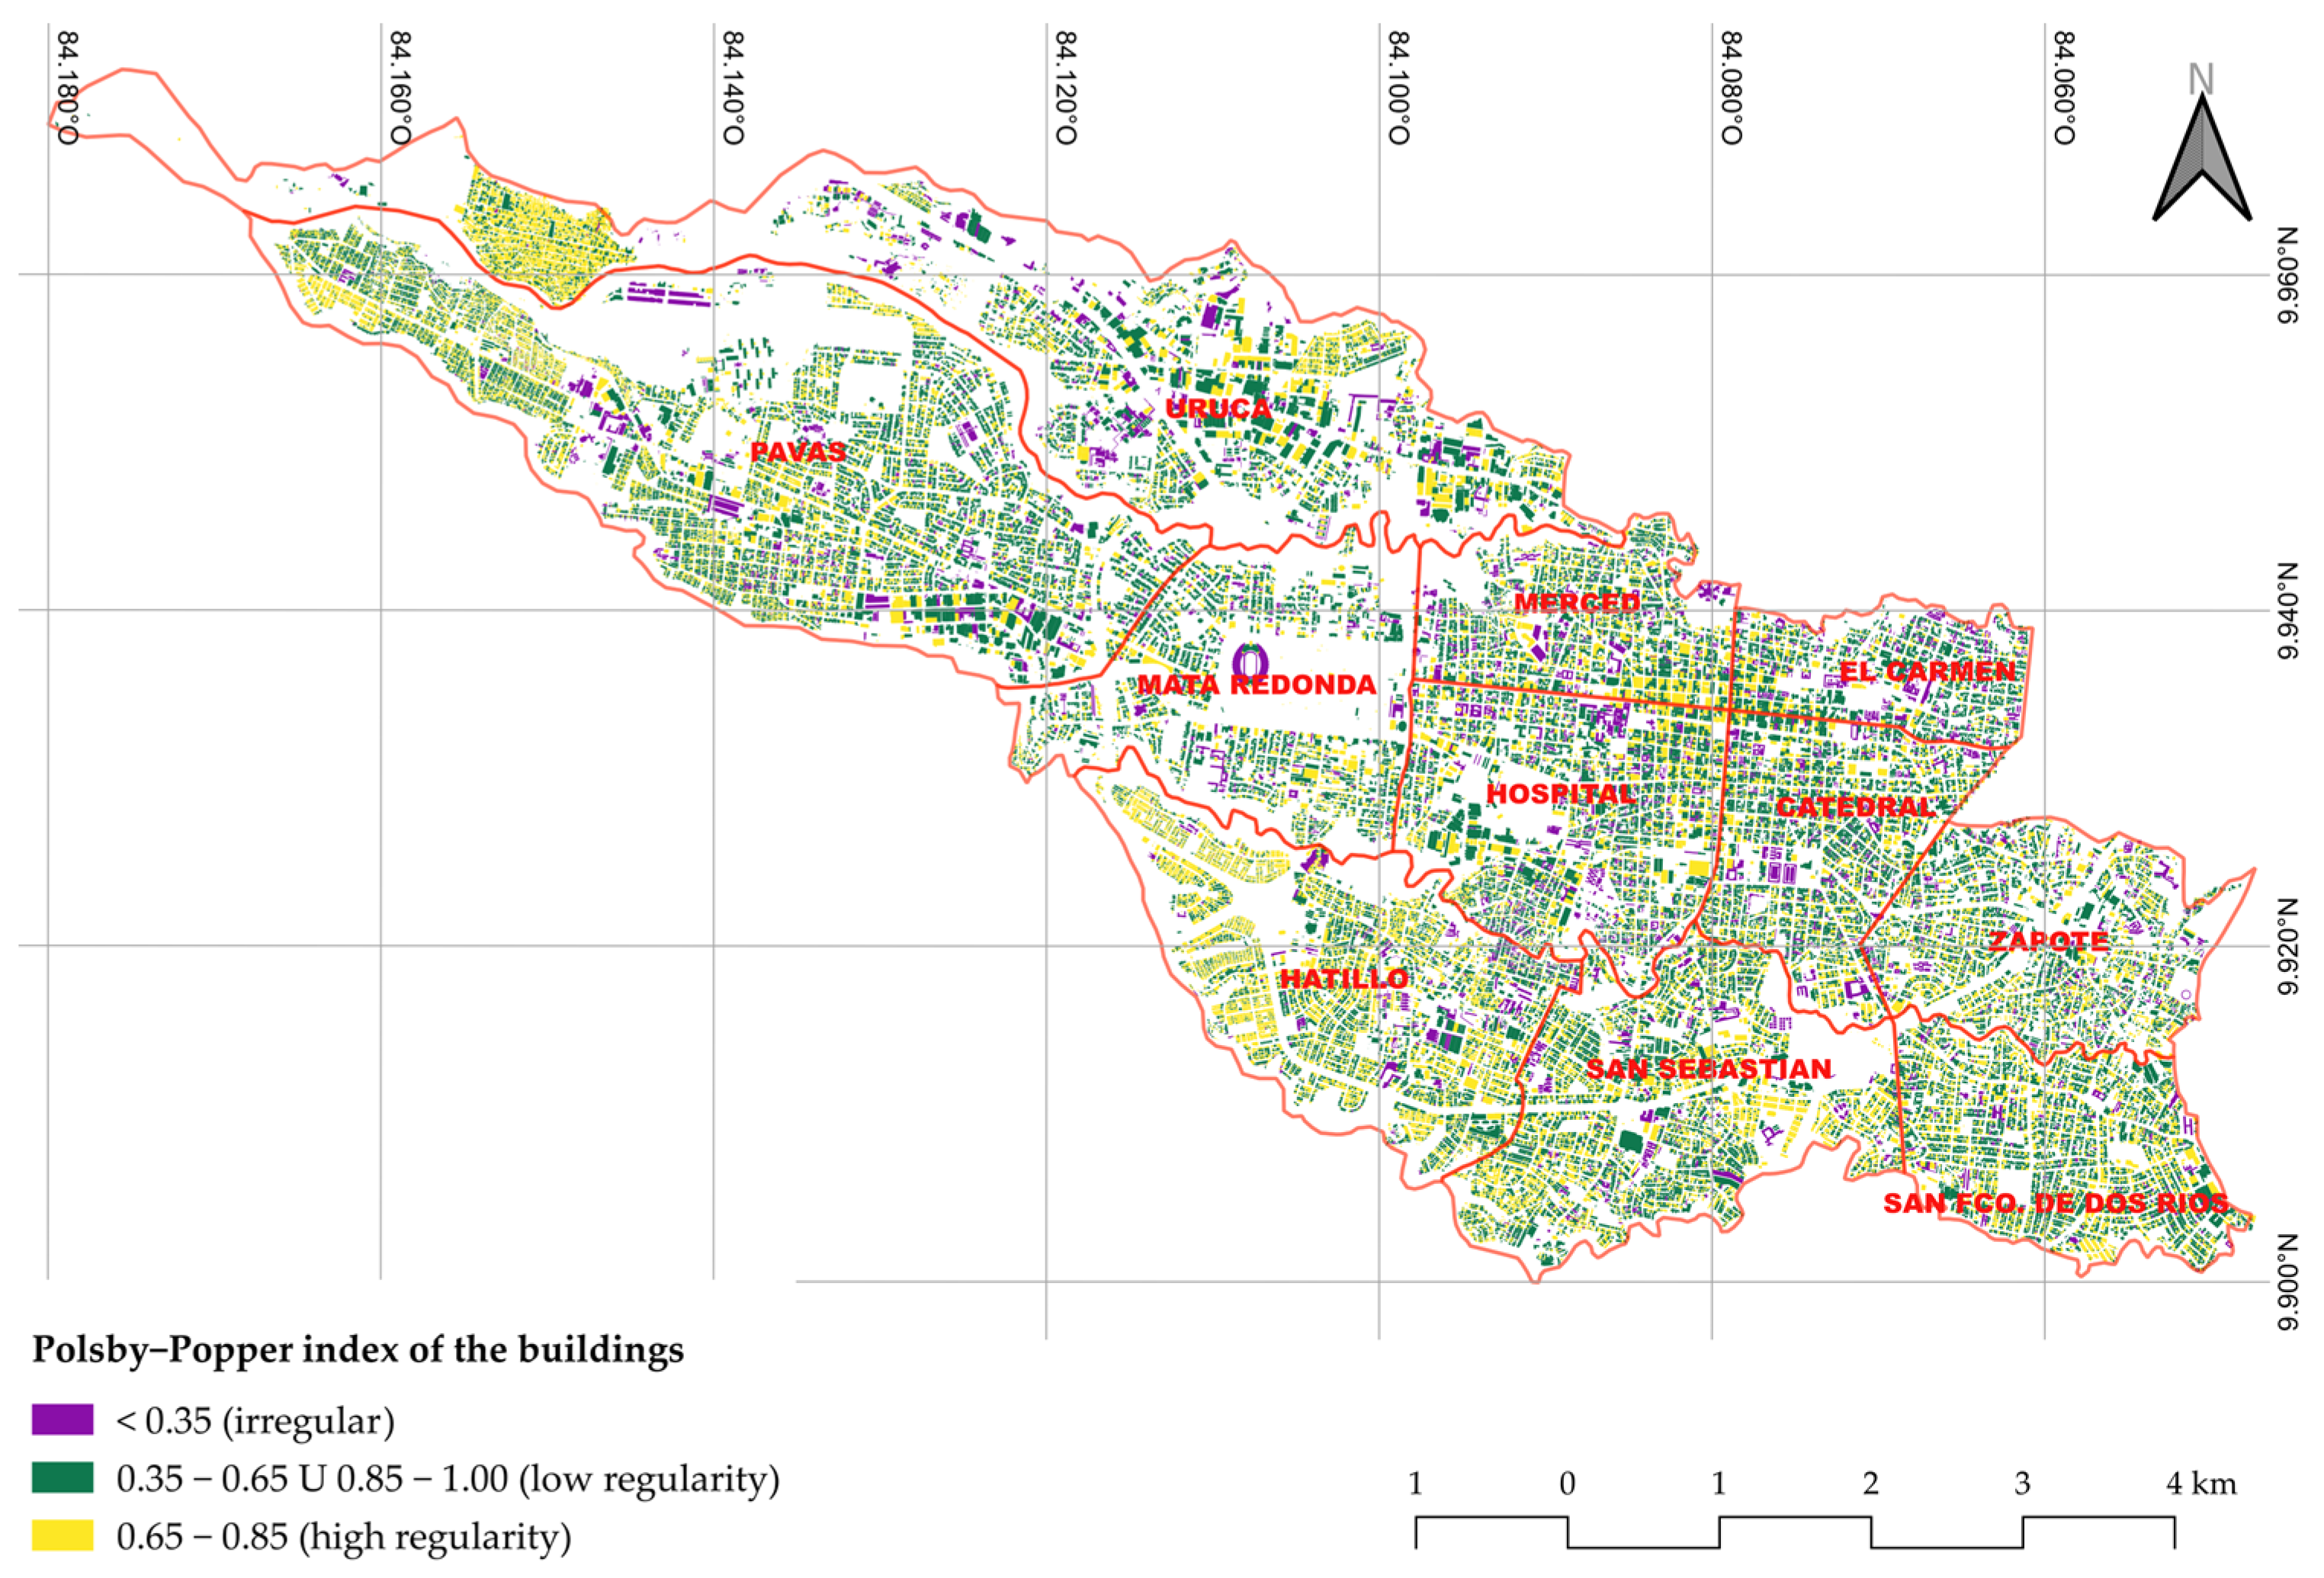
3.1.2. Regularity in Plan

The Polsby–Popper index analysis (Figure 6) indicates that the mean value is 0.620 and the median is 0.644. The first quartile is 0.548, and the third quartile is 0.719. According to these results, buildings are mainly regular polygons, with a considerable number of rectangular-shaped buildings and fewer buildings with very irregular shapes. Buildings below the threshold of 0.35 constitute 1.9% of the buildings in San José (Figure 7) and are present in all districts of the capital. These constructions, due to their irregularity, can be affected by torsional effects under seismic loads.

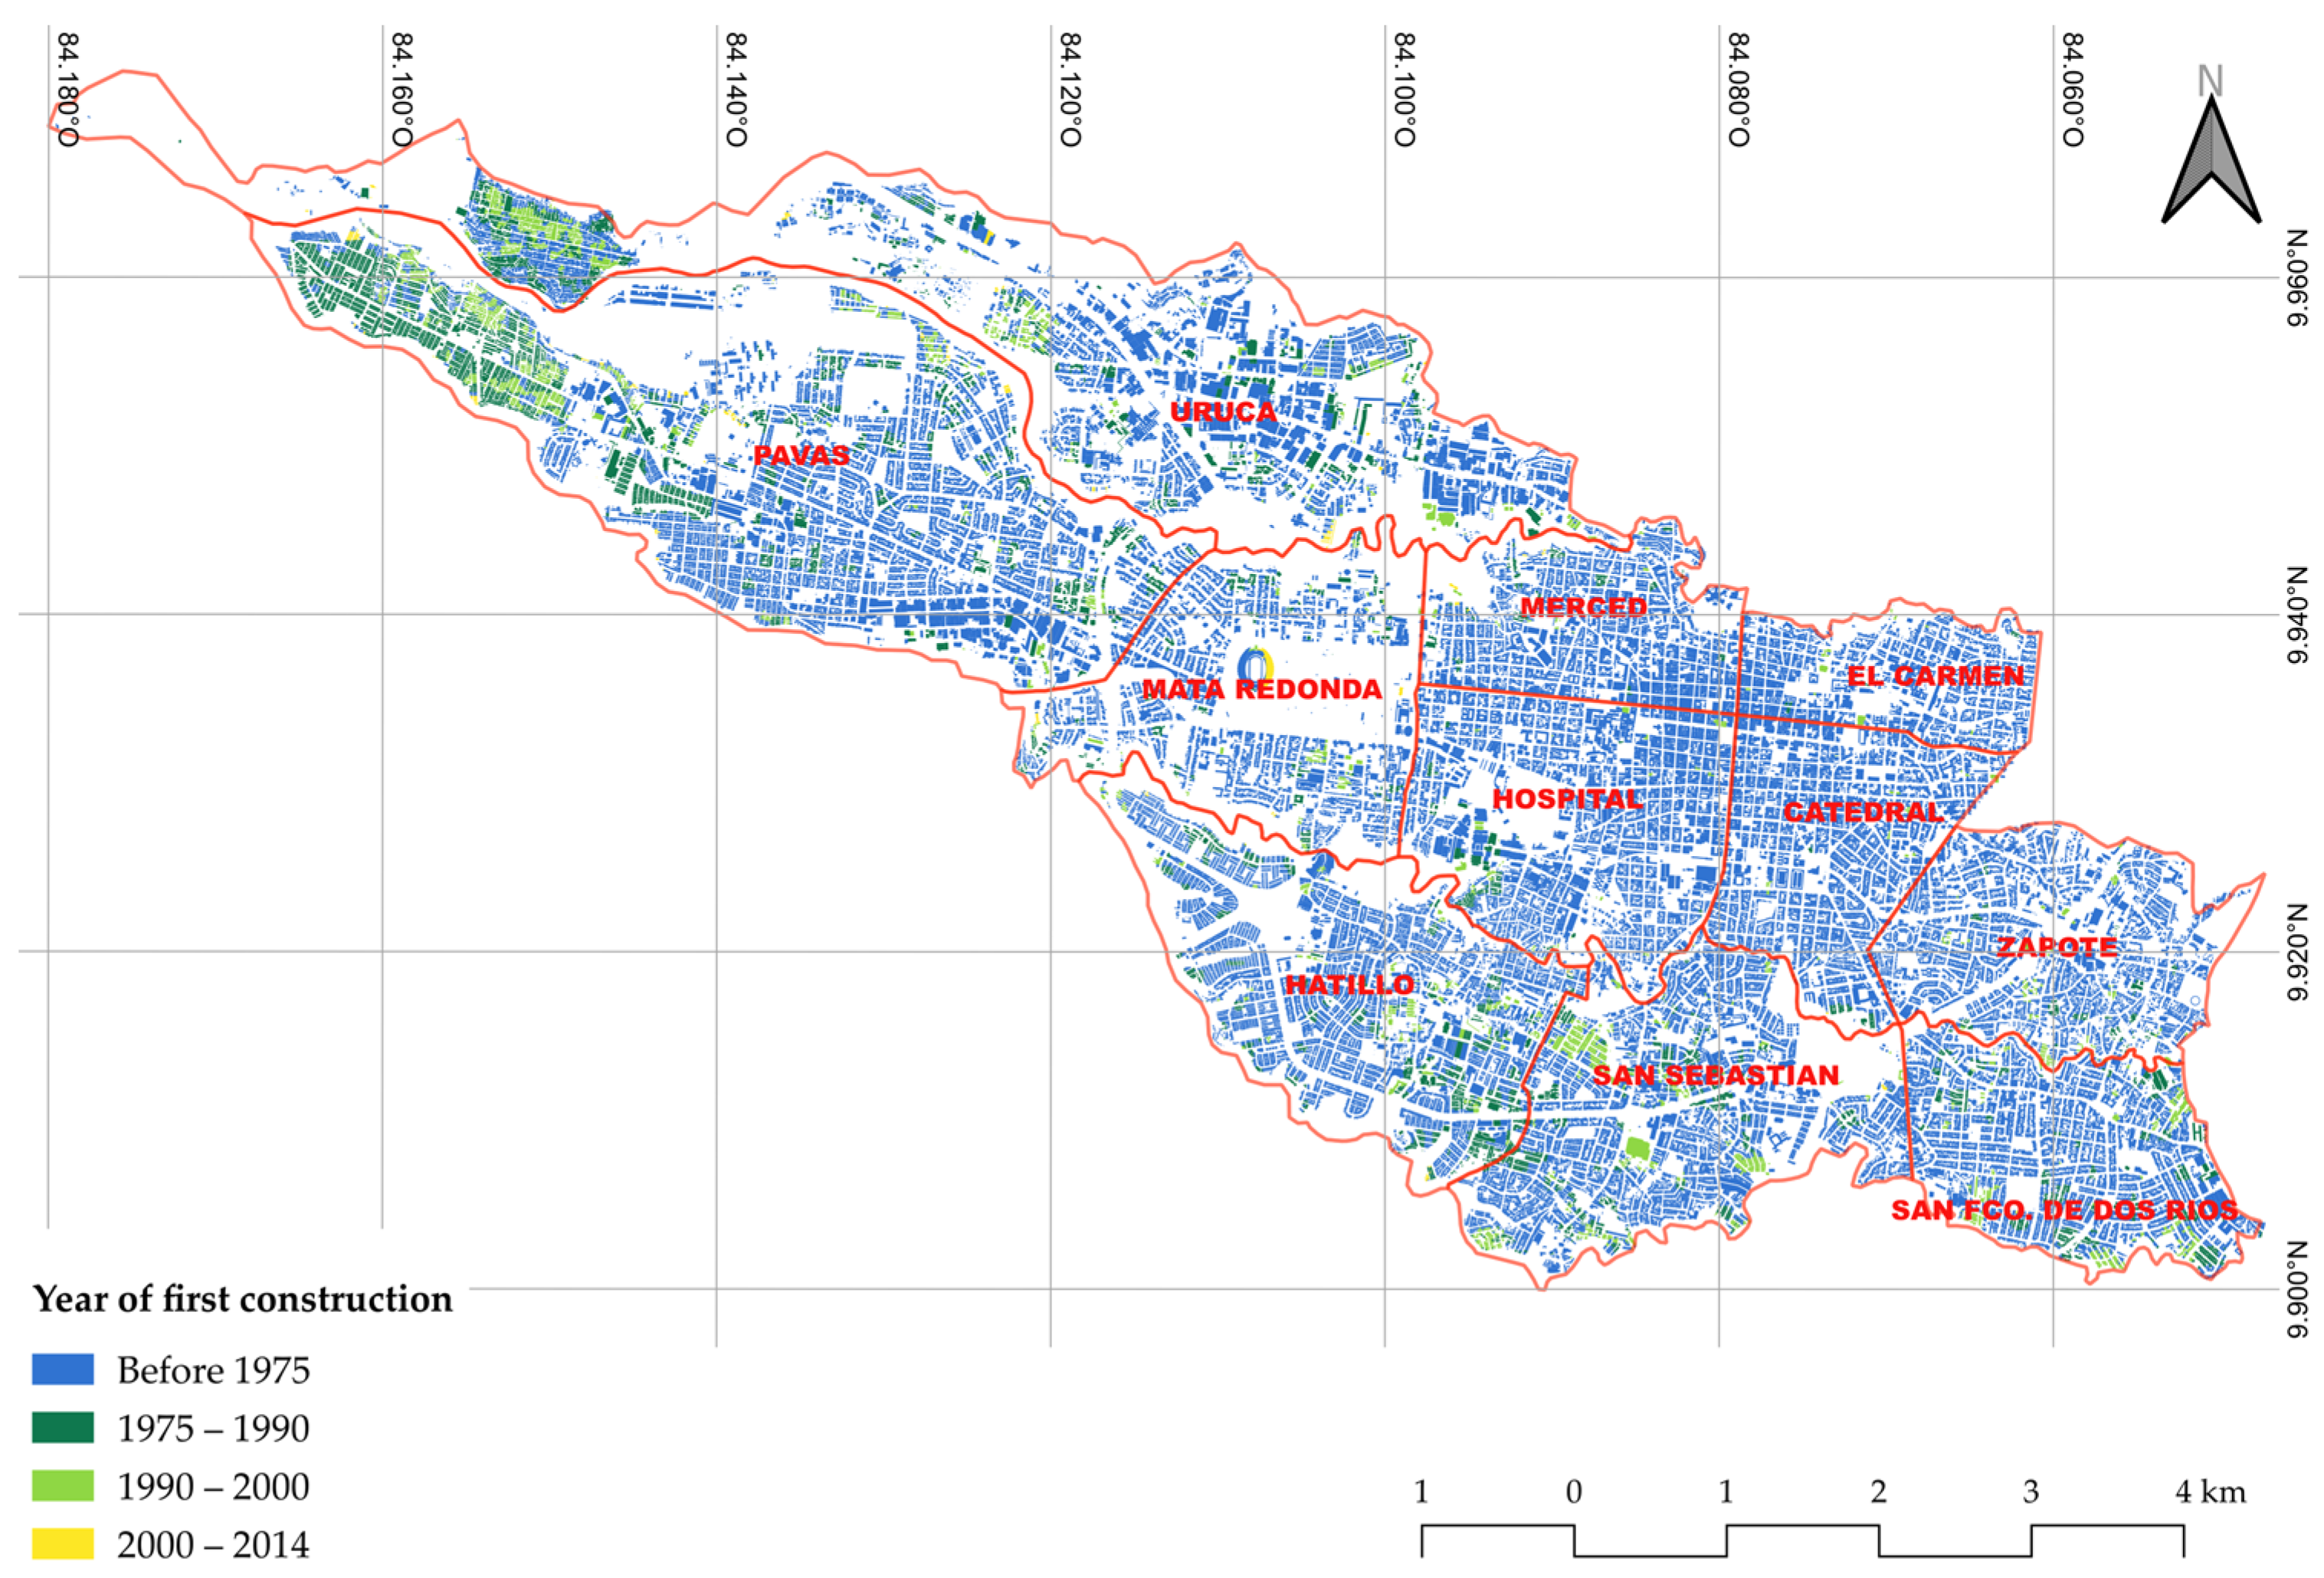
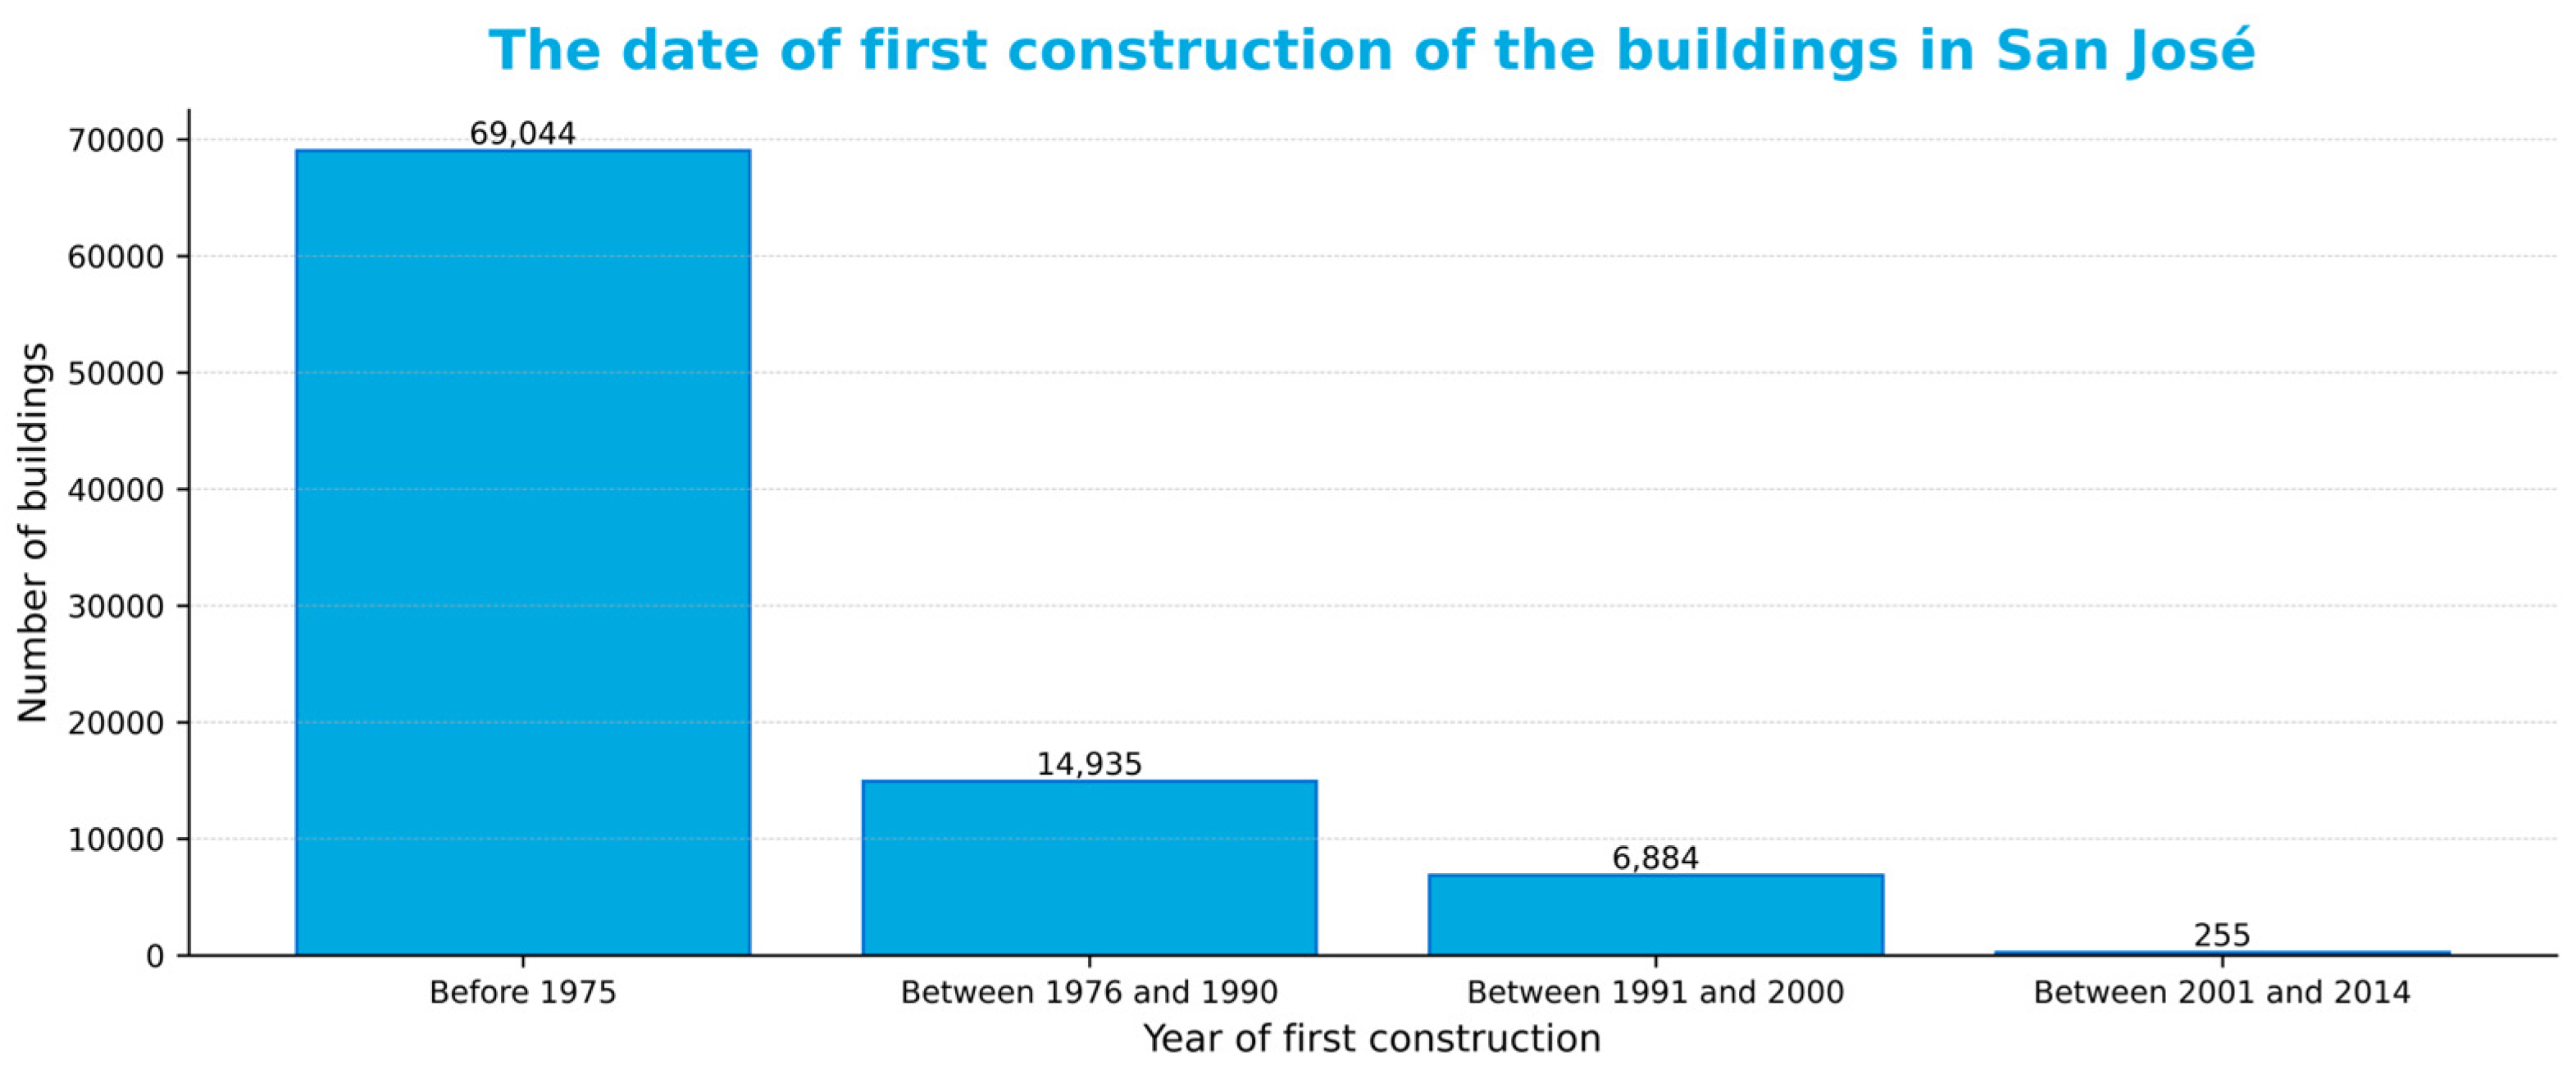
3.1.3. Date of First Construction

The canton of San José is the oldest part of the city, where the city began to expand. Due to this historical evolution, 75.77% of the buildings in the canton were built before 1975, the first period considered in this study (Figure 8). The percentage of buildings constructed from bare soil in the 21st century is lower than 1%, which corresponds to only a few hundred buildings (Figure 9).

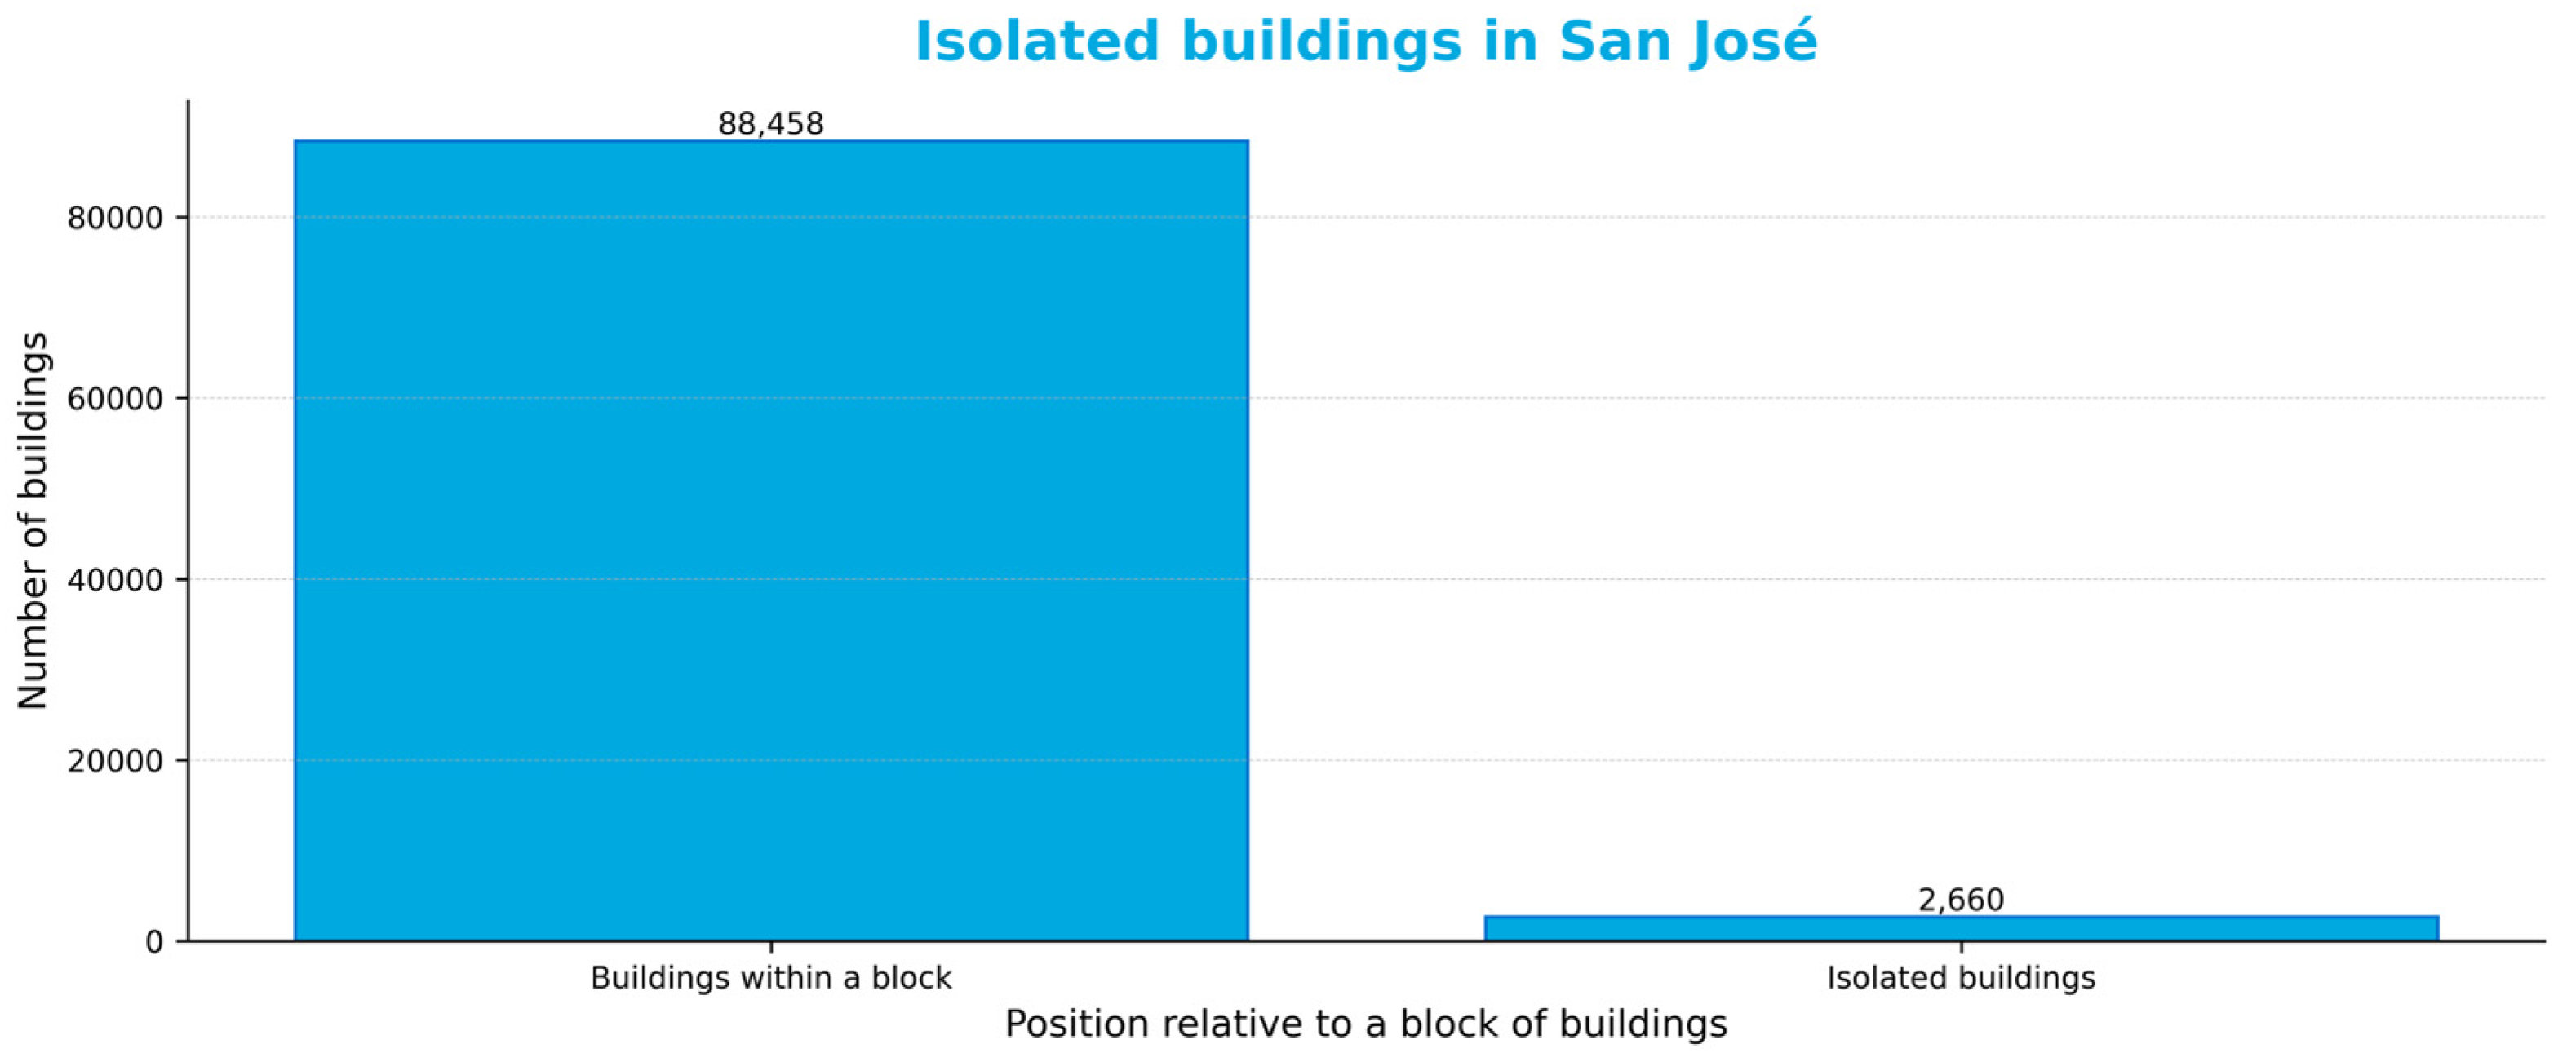
3.1.4. Isolated Buildings

The study of isolated buildings, those without other adjacent structures, reveals that this group accounts for 2660 buildings, which is only 3% of the total (Figure 10).
When observing the layout of the city, one would logically expect only a minority of buildings to be of this type since it is unusual for buildings to be widely separated in large cities, which are normally densely built-up areas (Figure 11). However, rather than determining the number of these buildings, the main interest here is to locate these buildings, since their behavior in an earthquake will not be the same as that found between other structures, either because of the benefit of being confined within the walls of adjacent buildings or because of the negative effect of the shaking that can occur between buildings.

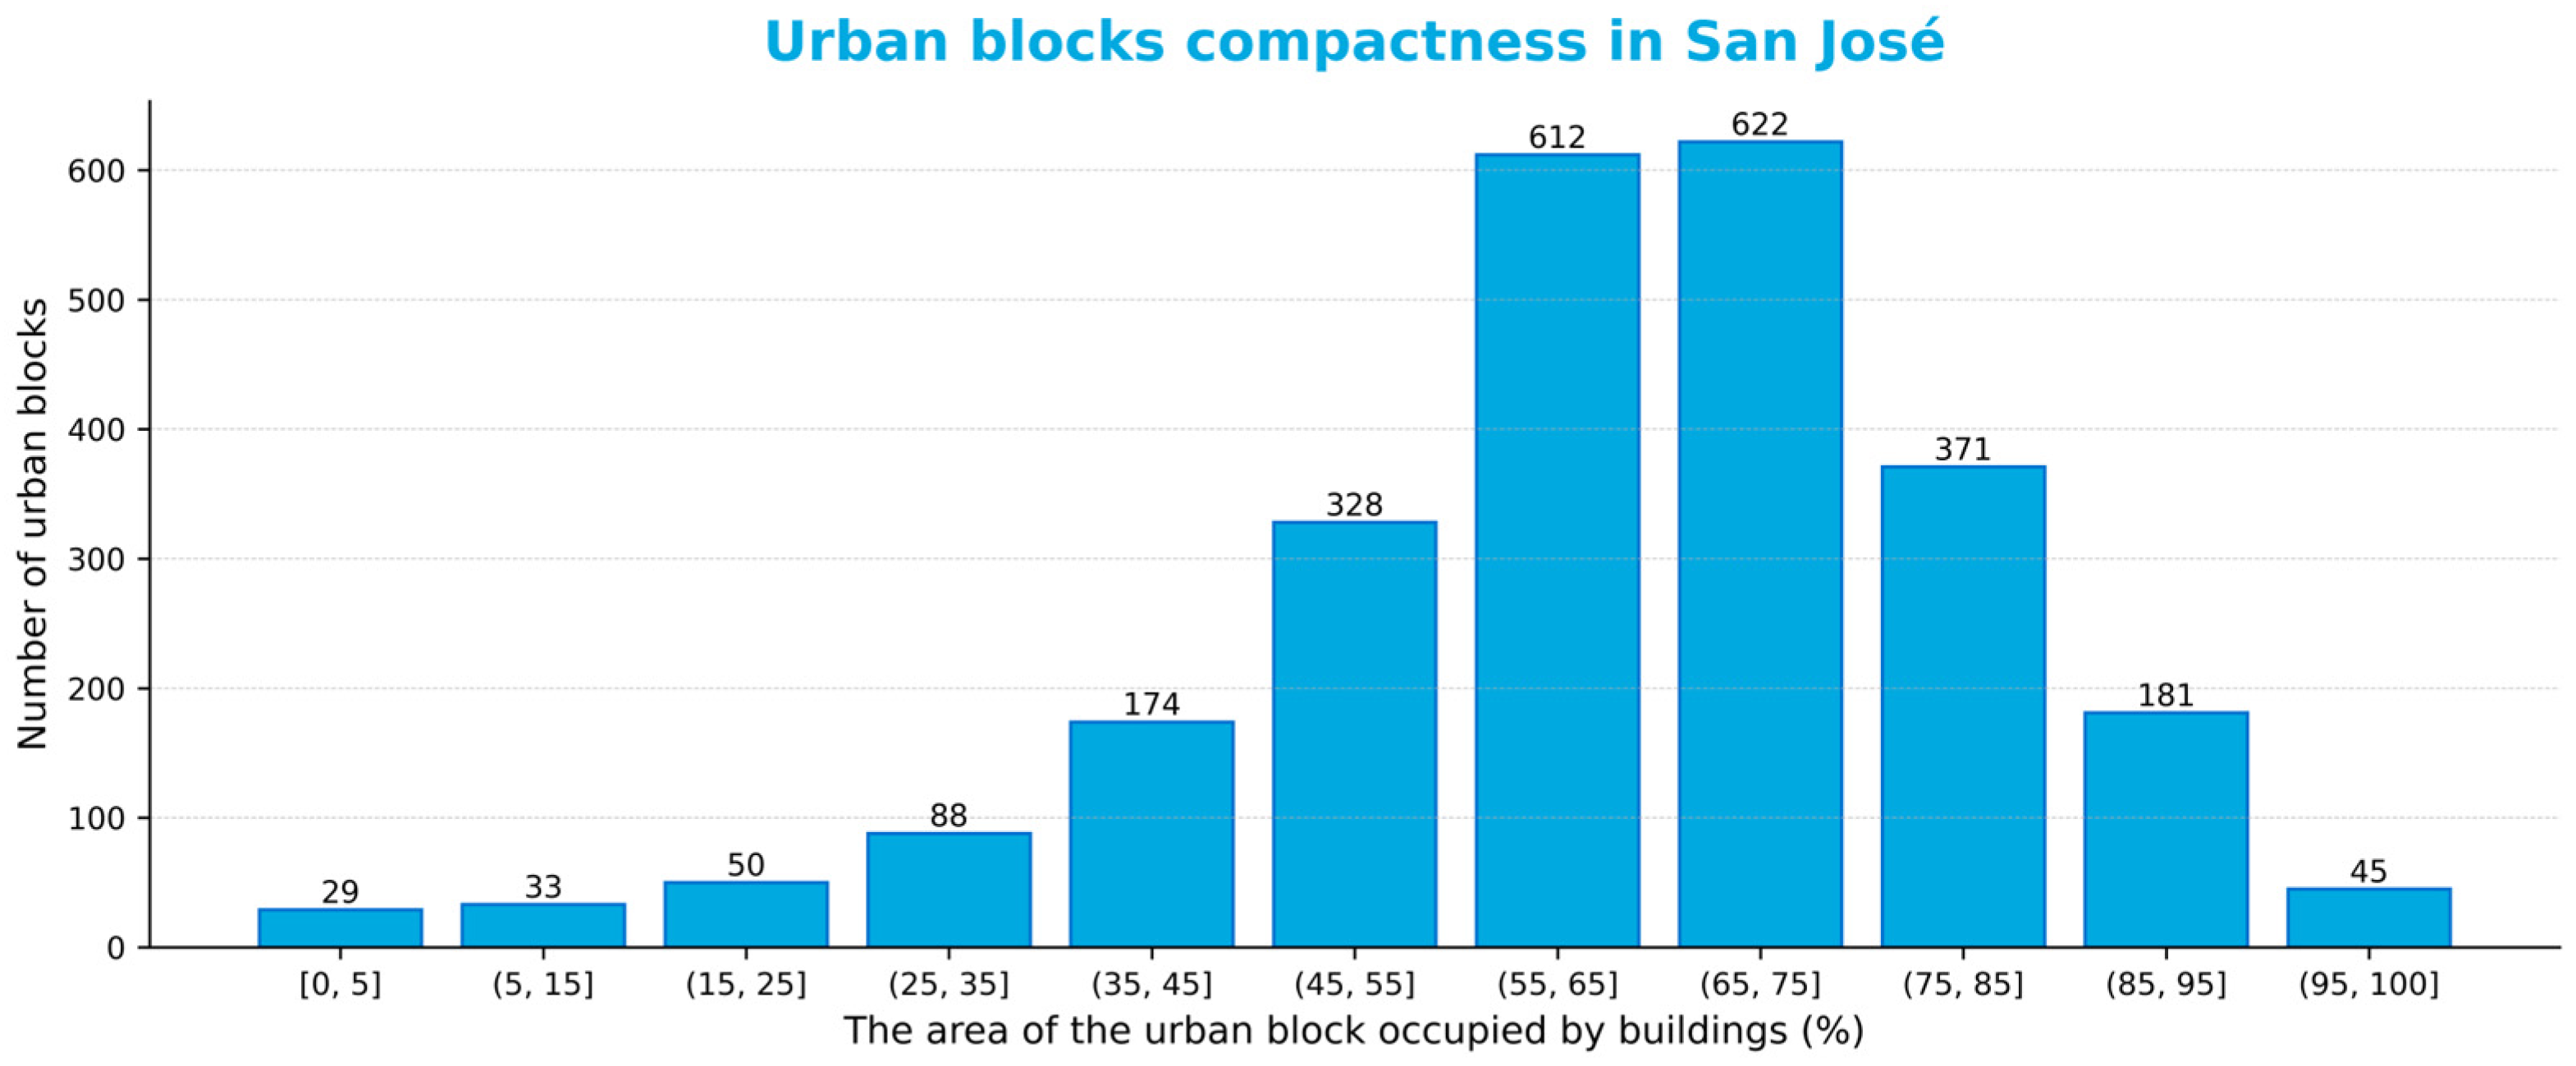
3.1.5. Urban Blocks Compactness

The analysis of data reveals that the built surface represents a high percentage of the blocks. In the canton of San José, a total of 2533 urban blocks were identified, with 88% of them with buildings accounting for more than 50% of the space (Figure 12 and Figure 13). It is also noteworthy that very few structures are located in urban blocks where more than 90% of the floor space is occupied by buildings, which is also an indicator that there are common or green areas between buildings. Therefore, it can be concluded that urban blocks in San José are compact, although not fully occupied by buildings.

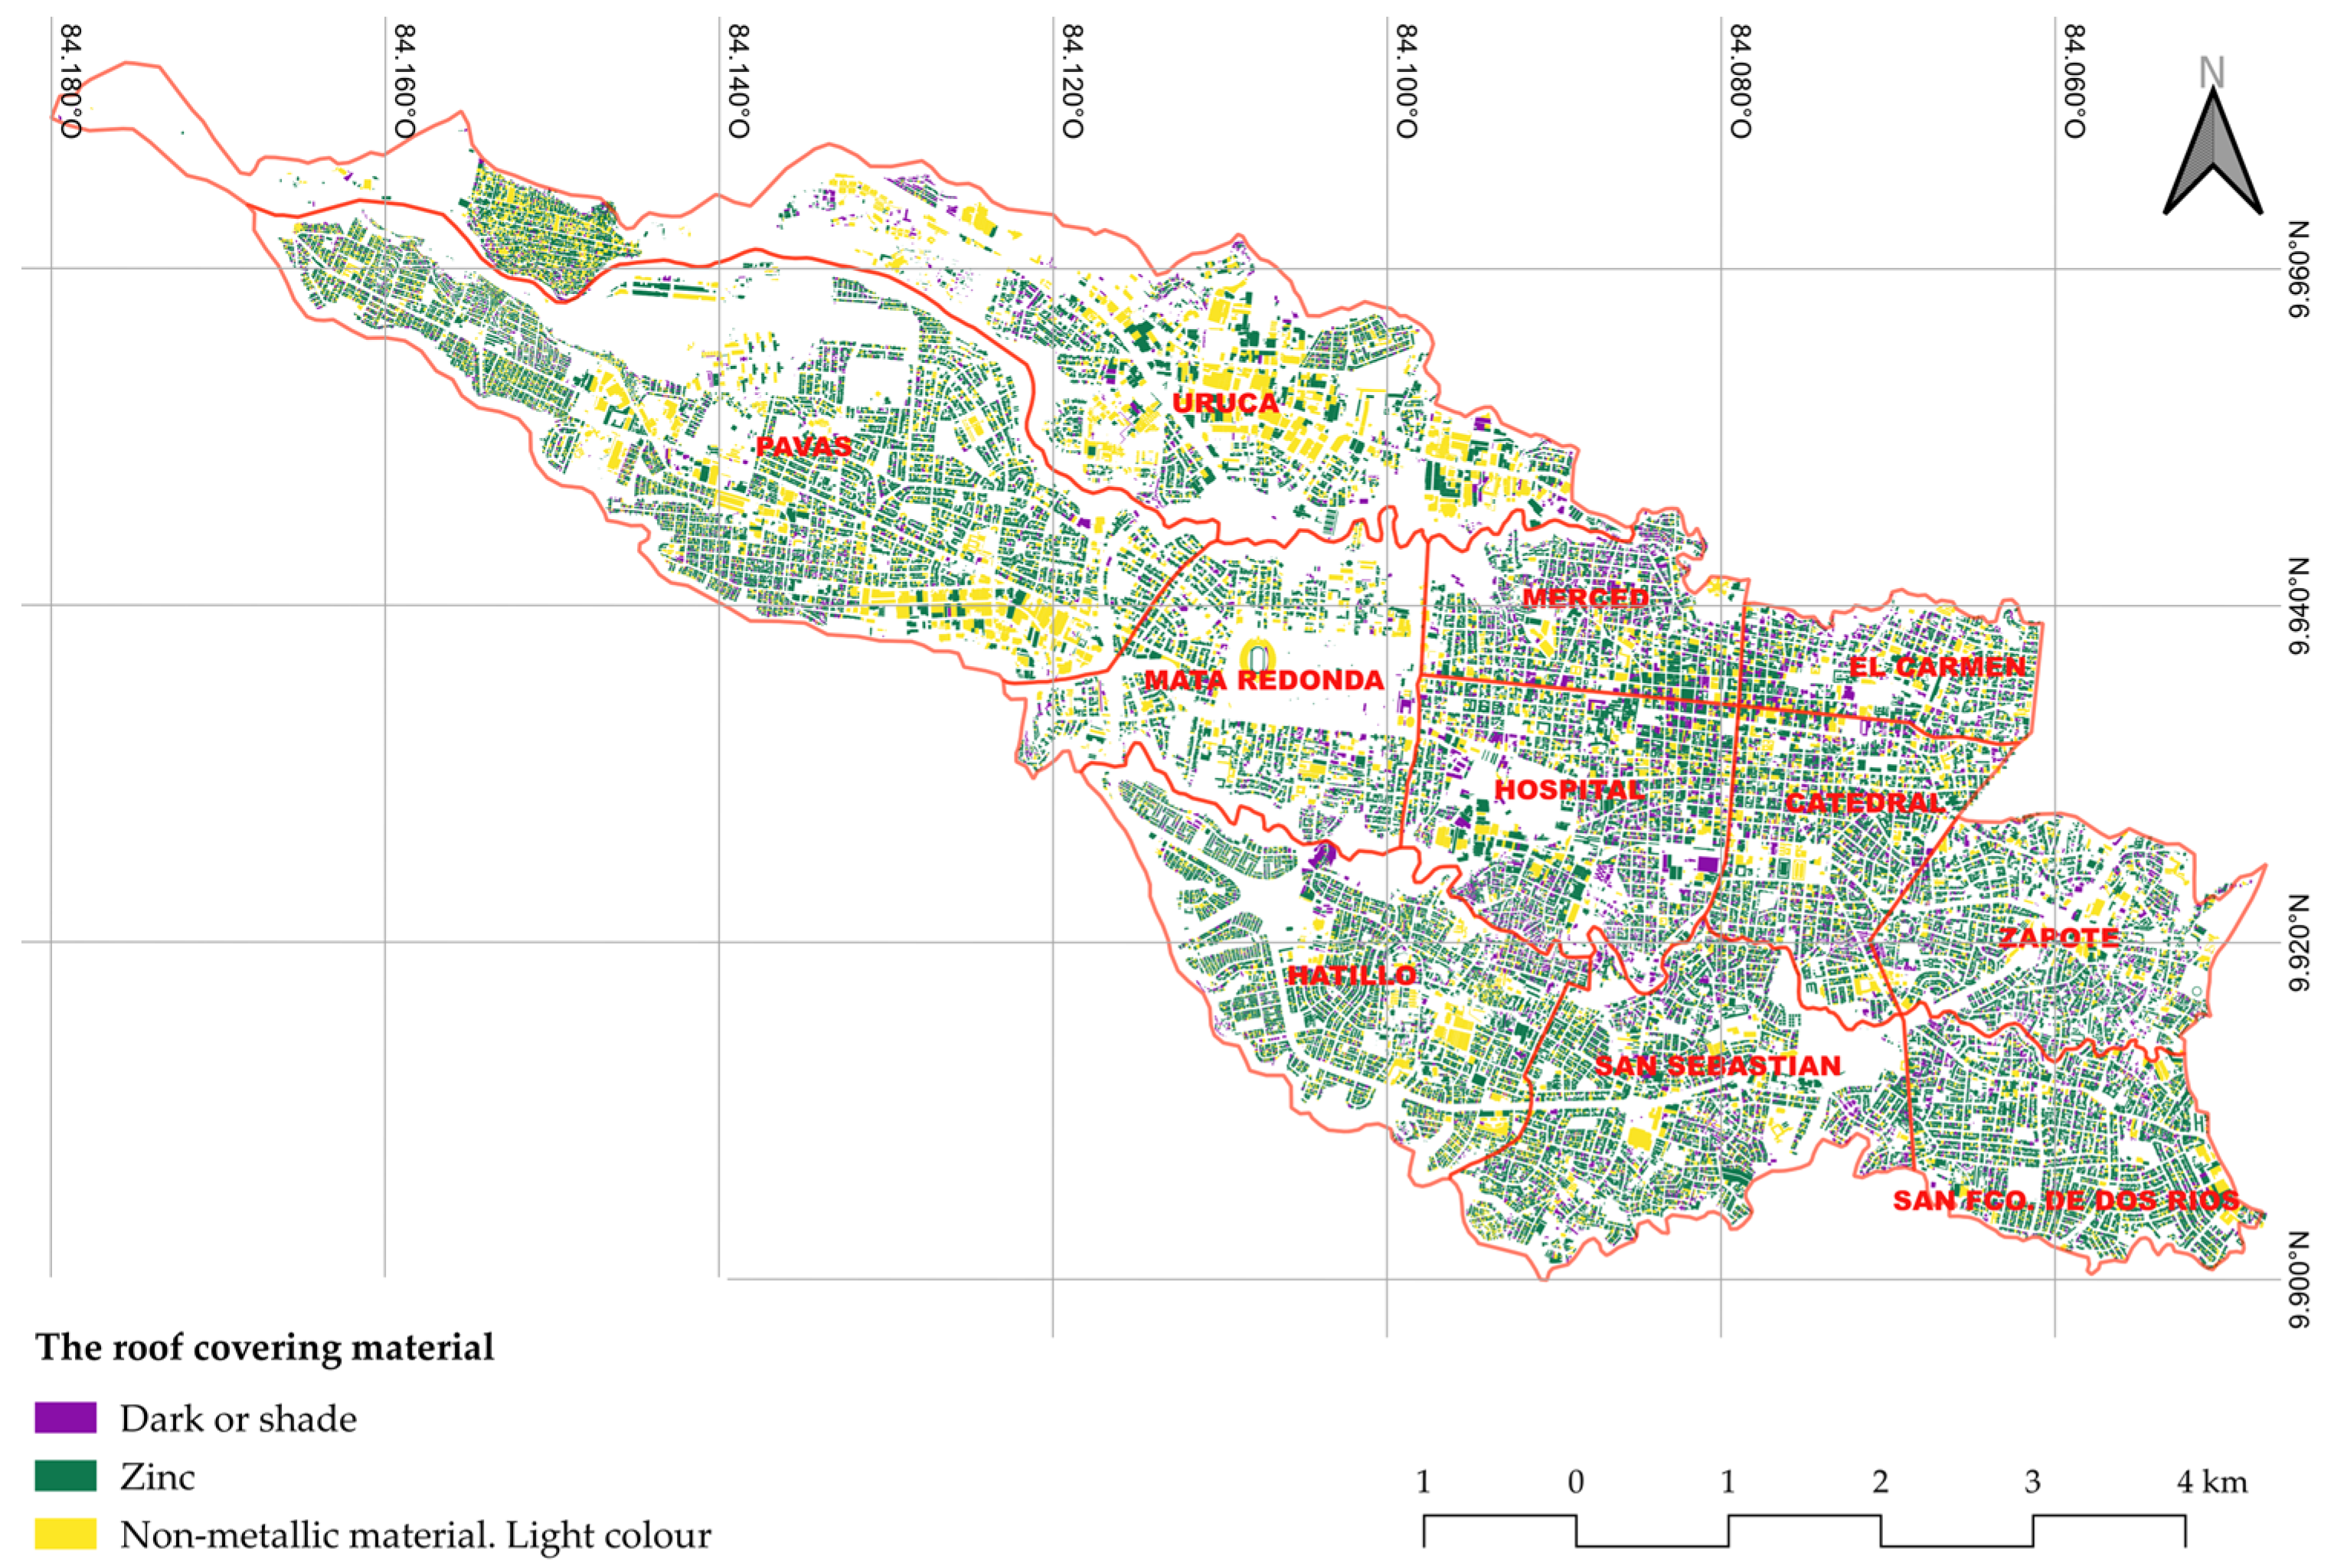
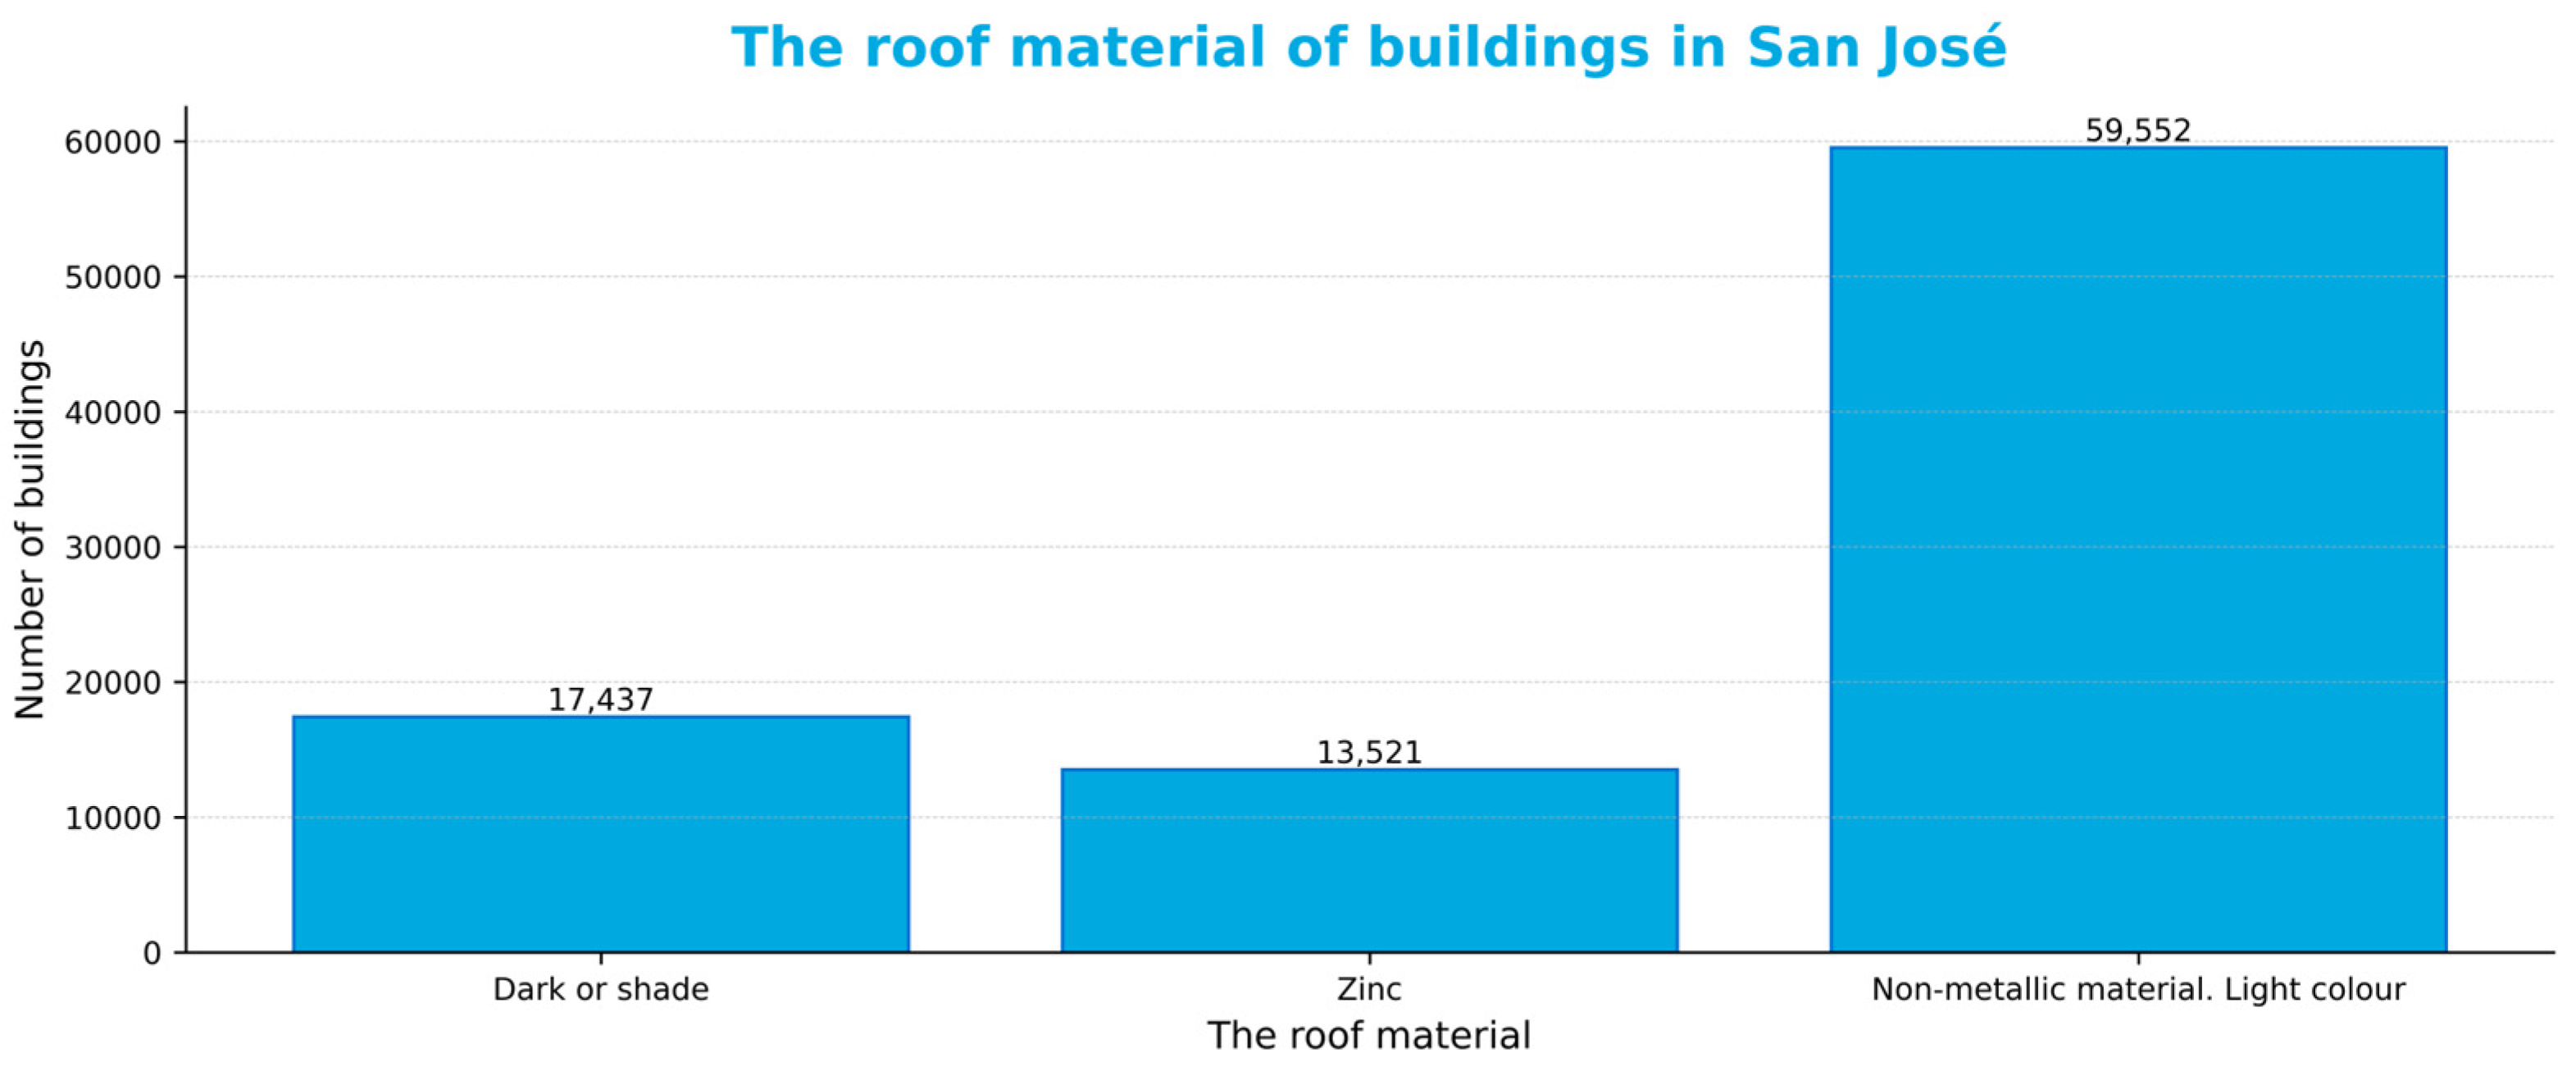
3.1.6. Roof Covering Material

The predominant roofing material used in buildings in the canton of San José is zinc. Metallic roofs of this type make up two-thirds of the total number of roofs studied (Figure 14). Of the remaining third, almost half are very dark roofs or shaded areas where it was not possible to determine the exact roofing material; hence, it is possible that the percentage of metal roofs is even higher.
The remaining roofs are light-colored roofs that may not be metallic (Figure 15). Light-colored roofs cover buildings with large surface areas, many of which are presumably industrial buildings. For this reason, this type of roofing accounts for a significant surface in the canton, as can be seen in Figure 15.
After classifying the roofs of the structures, the confusion matrix of the classification algorithm (k-means) was calculated to estimate the accuracy of the process (Table 4). The classification accuracy percentage was 79.09%, with a kappa coefficient equal to κ = 0.7172.
After a ground validation with the sample-GED [44], it was established that Class 1 corresponded to dark roofs or shaded areas, Classes 2 and 3 corresponded to zinc roofs, and Classes 4 and 5 corresponded to light-colored non-metallic roofs. The table shows that the confusion is greater between Classes 1 and 2, which indicates that some zinc roofs, which are of intense colors, can be confused in some cases with shaded areas or very dark roofs. In the rest of the cases, the highest errors were observed between Classes 2 and 3 or between Classes 4 and 5 which were joined so that these errors did not modify the results of this study.

3.2. The Time and Cost Efficiency of the Integrated Methodology

In order to complete the acquisition, processing, and data quality assessment of the Geospatial Exposure Database of the canton of San José, with 44.37 km2, a total of 243 working hours (5.48 h/km2) were needed, involving different profiles such as a superior technician, an intermediate technician, a basic technician, and a member of the administrative support staff. In terms of equipment, a dedicated server was required to host the GED.
In the same study area, Rapid Environmental Monitoring (REM) required a total of 3 days of mobile mapping and 2680 working hours of basic trained technicians, which increased to 3713 h (83.67 h/km2) considering the time dedicated by administrative profiles and superior and intermediate technicians. In addition, the recent individual building full survey of the “Calle Morenos” neighborhood required 408 h for 0.53 km2, with an efficiency of 769.81 h/km2. Table 5 presents a comparison between the three levels of the survey.

3.3. Classification of Buildings According to Their Exposure to Seismic Risk

Predictive models were developed to classify buildings into official BTs. Random Forest algorithms were trained and validated to assign the buildings in the study sample to a BT class according to the attributes obtained via GTs. A sensitivity analysis of the influence of building height was performed to confirm the degree of influence of height in seismic exposure analysis, as suggested by the literature.
Table 6 shows the results of the Random Forest classifier (RF1) trained using the geospatial variables (except for building height) to classify the buildings of the sample-GED ca [46] into the eight classes (A–H) proposed in this study (Table 3). The estimated error ratio for the results obtained is 46.22%.
In the previous matrix, it can be noted that more represented classes in the sample are predicted with higher accuracy, whereas less represented classes are not well assigned. This can be due to the over representation of Classes A and B, with confined or reinforced masonry being the most usual construction systems in San José de Costa Rica. Figure 16 presents the attributes that are most decisive for the algorithm to assign a class to each building.
The most relevant variables in the RF1 classifier are the area of the building footprint, its location, and the Polsby–Popper irregularity index. With less relevance, we identified variables such as the neighborhood and district, complementing the location variables, and the roof material.
A second classifier was developed, Random Forest RF2, which included building height. Random Forest RF2 included field-survey data of the height of the buildings from the sample-GED of the UCR Seismic Engineering Laboratory [46]. The classification was made in the eight classes proposed in Table 3 in order to compare RF1 and RF2 with the same conditions, and only adding the parameter of the height of the buildings. RF2 classification performs an estimated error rate of 13.55%, which is lower than in the case without height (RF1). RF2 classification achieves results that are good enough to characterize the building stock in the study area. This reduction in error supports the fact that building height is one of the most relevant attributes for building typology classification.
The confusion matrix for this RF2 is presented in Table 7, showing an improvement in the assignment of Classes A and B (masonry) and C and D (reinforced concrete over five stories). There is still a high degree of dispersion in the prediction of less frequent building typologies with one storey (Classes C, F, G, H). Nevertheless, this classifier is suitable for a quick assignment of building typologies in case of an emergency, as it classifies accurately higher buildings and the main represented classes. Figure 17 shows the importance of the building height attribute, which is five-fold the importance of the second parameter, the footprint area.
In addition, the most decisive variables in this classification case are presented in Figure 17.

4. Discussion

The methodology presented in this paper fulfils the objective of improving the technical and economic efficiency of seismic exposure studies in areas with high risk and data scarcity by reducing time and costs. This objective is achieved, both in the reduction in time and costs for the assessment of seismic exposure and the successful classification of building typologies from the GED attributes.
Regarding times and costs, the GED methodology is more efficient than the most intensive REM and full survey methodologies. The cost per square kilometer of the GED methodology is 12% and 2% of the costs of REM [44] and full survey methods [60], respectively. However, the level of confidence is higher in full survey and REM methods that include a visual human assessment of the surveyed buildings.
It is necessary to validate the accuracy and reliability of the GED approach, which implies the contrast with a representative sample of buildings obtained with a more detailed methodology. It is evident that a highly detailed database enhances the precision and reliability of large-scale seismic vulnerability assessments. However, this level of detail typically requires substantial resources, making such an approach impractical for extensive areas. Therefore, it becomes necessary to strike a balance between the accuracy and reliability of the data and the limitations imposed by available resources. The case study of San José was been carried out with the validation database of 7296 buildings obtained with REM methodology.
A critical evaluation of the advantages and limitations of the proposed methodology is necessary, particularly through a comparison with similar approaches previously presented in the literature. To this end, there are many references in the literature of data-collection strategies aimed at creating GIS databases [11] and at characterizing the typical building typologies found in historical urban centers [24]. Nevertheless, most of these methodologies were developed in data-rich environments, with freely available updated and detailed cadasters [43], GIS databases [72], orthophotos and LiDAR data [9], and remote sensing data [73] developed in Europe (mainly in Italy), North America [18,19], Japan [20], and, more recently, in China [21].
Most efforts in the literature support the development of a comprehensive urban-level database, implemented within a GIS environment, to facilitate subsequent seismic vulnerability assessments [6,46]. The integration of diverse data sources is an effective means to derive comprehensive urban-scale information, which is crucial for identifying representative building typologies and associated characteristics. The application of GIS tools plays a key role in organizing and managing this extensive dataset, thereby enhancing the interpretability and utility of the database.
The estimation of attributes using GTs is first and foremost influenced by data availability and data quality. Not all data sources are available and openly accessible everywhere in the world. The gathering of sufficient quality baseline data to conduct such studies will directly influence the quality of the results. Once the information gathering is complete, some attributes can be obtained directly, but others require a process that may increase the uncertainty of the characterization.
The footprints of buildings are essential for the creation of a GED. In addition, the correct digitization of building footprints clearly improves the quality and accuracy of attributes obtained for the buildings, such as the floor area of each building. Building footprints are measured by hand in many studies and by many local authorities, as in the case of the Municipality of San José. However, many studies have attempted to develop new methodologies aimed at automating, albeit partially, the process of obtaining these footprints. Currently, these novel methodologies have not yielded products that provide an adequate level of detail, and therefore it is often preferable to produce these footprints manually. In a recent study in Haiti [11], footprints were obtained through both semi-automatic and manual methods, and in the end, the manually produced footprints were used.
The estimation of building heights involves an investment in many parts of the world, requiring photogrammetry or LiDAR acquisition and processing [9]. Traditionally, point clouds were obtained by photogrammetry from aerial flights, although in recent years, drone flights are the main source, if permitted by the local regulations, making this attribute more affordable. The increased development of machine learning for image analysis is enabling the extraction of measurements from in-street images, as proposed by Ureña-Pliego et al. [74]. This technology is limited to the availability of training sets of images, adapted to the reality of the city landscape in every part of the world. Street-view imagery repositories are increasing worldwide, such as Google Street View (not open) [75] and Mapillary (open) [76], but their coverage is not uniform in space nor in time.
The height of buildings is one of the more determinant parameters in the process of classifying BTs, as it directly affects the behavior of a structure in a seismic event. A study carried out in the city of Osijek, Croatia, [16] concluded that it is one of the basic parameters for the characterization of a building by means of GEM taxonomy, together with the lateral load-resisting system. New methodologies are being developed for the estimation of height, in meters or in the number of levels, among which there is an increasing interest in the analysis of street-view-like imagery, either manually [8] or automatically [74].
The determination of the roofing material has been carried out traditionally by visual assessment in the field or orthoimages [11]. In this research, we successfully adapted the methodologies proposed by Rejas Ayuga et al. [13,14] to obtain the roof covering material in San José from hyperspectral imagery. In case ASTER or other hyperspectral sources are not available, Sentinel-2 is the open recommended source, although the radiometric resolution is worse, so an increase in the error of assignment is expected.
The calibration of Random Forest algorithms [71] is of utmost importance with regard to the usefulness of the results obtained and as a source of information for other phases of the seismic risk study. The technology used in the process of predicting and assigning a class to buildings is constantly evolving and improving, thus allowing better results to be obtained and reducing the margins of error. It is also necessary to consider the specific characteristics of each city, the regulations, and any other circumstances that allow for the definition of additional compatibility criteria between attributes identified using geomatic techniques and those estimated during the process of BT assignment.
As stated by Yepes-Estrada [77], the use of the GEM taxonomy to analyze the characteristics of buildings through the proposed attributes and the subsequent classification of structures provides a methodology that has been and continues to be developed in many places in recent years. The associated challenges are related to the adoption of new geospatial and computational techniques to enhance this methodology. In this case, it was decided that buildings would be assigned to a given class using a Random Forest algorithm. This algorithm is suitable for class assignment problems such as those encountered in the study of seismic exposure. However, the evolution of machine learning is leading to new products which further improve the benefits of these algorithms.

5. Conclusions

Geomatic techniques based on open data offer a significant advantage for seismic exposure analysis. This advantage is remarkable in the acquisition and measurement of certain attributes, such as footprint characteristics, the date of first construction, and within-block attributes. Continuous Geospatial Exposure Databases (GEDs) permit the assessment of individual buildings, improving the level of detail of exposure analysis as compared to classical district or neighborhood scale approaches. However, some essential attributes, such as height, are not usually available in high-risk seismic cities and must be obtained at a cost, with periodic actualizations depending on the rate of change of the city.
Despite the advantages of geomatic techniques, they cannot completely replace traditional methodologies when performing an exhaustive, accurate seismic exposure study. Geomatic techniques do not directly provide all essential variables in a seismic risk study, as compared to lateral load resisting systems or structural class. A significant sample of buildings is required to validate GED databases and calibrate machine learning models to infer non-measured attributes.
The application of geomatic techniques improves the overall study of seismic exposure in several ways, especially in quick assessments, emergencies, and field survey design. GEDs can be used to quickly characterize a city or district in the case of an emergency. They can also be used to optimize the design of field surveys, thus reducing time and costs and optimizing the human and economic resources while maximizing the accuracy of the results.
Seismic exposure studies based exclusively on geomatic techniques could be very useful in emergency situations where resources, time, and access to some areas are limited. In these cases, such surveys, while not providing the same amount of structural information as those carried out under optimal conditions, can be crucial for obtaining essential data on seismic exposure at critical times when no other alternative is available.
Geomatic techniques employ several technologies that are evolving quickly, as well as data quality, resolution, and availability. The methodology developed in this study is designed to integrate all available information about seismic exposure of an area into GEDs, in this case, the canton of San José in Costa Rica. We expect that the evolution in methods, data availability, and machine learning will improve the methods and the quality of the attributes in the GED and even allow for the estimation of new attributes of buildings that cannot currently be obtained.

Author Contributions

Conceptualization, J.R.-S., M.M.-S. and B.G.-R.; methodology, J.R.-S. and M.M.-S.; validation, J.R.-S., M.M.-S., J.G.R.-A. and D.A.H.-L.; formal analysis, J.R.-S.; investigation, J.R.-S., M.M.-S. and J.G.R.-A.; writing—original draft preparation, J.R.-S.; writing—review and editing, M.M.-S. and B.G.-R.; supervision, J.G.R.-A. and D.A.H.-L. All authors have read and agreed to the published version of the manuscript.

Funding

This research received public funds from the Comunidad de Madrid Industrial Doctorate Program (IND2023/TIC-28743 and IND2020/TIC-17528), the “Proyecto de Cooperación Triangular UE-Costa Rica-ALC Adelante-2 Construcción sostenible y resiliente en Centroamérica y el Caribe ante la amenaza sísmica: cooperación regional basada en la experiencia de Costa Rica”, and the SIAGUA Project, reference PID2021-128123OB-C22, funded by MCIN, Spain/AEI, Spain/FEDER, UE.

Data Availability Statement

The datasets used in this study can be found in online repositories. The datasets of seismic exposure attributes and building photographs developed by the Seismic Engineering Laboratory-Engineering Research Institute-University of Costa Rica (LIS-INII-UCR) can be found in the following links: https://doi.org/10.17632/8BY7R5SZCN.2 and https://doi.org/10.4121/c.5618230.v1. Base geospatial data can be downloaded from the SNIT (https://www.snitcr.go.cr/ accessed on 14 January 2025) and COPERNICUS (https://dataspace.copernicus.eu/ accessed on 28 November 2024) sites. LiDAR data can be accessed by request to the CNE (http://www.cne.go.cr/ accessed on 27 November 2024).

Acknowledgments

The authors would like to thank Belén Benito and researchers of the Kuk-Ahpan project for the scientific support and the opportunity to work in San José de Costa Rica. We also thank Luis Esquivel for his support in the processing of the University of Costa Rica field database. The authors thank San José’s council (Werner Obando) and CNE (Guido Matamoros) for sharing the available GIS and LiDAR data.

Conflicts of Interest

Author Javier Rodríguez-Saiz was employed by the company Buin Ingenieros, S.L. The remaining authors declare that the research was conducted in the absence of any commercial or financial relationships that could be construed as a potential conflict of interest.

References

  1. NOAA National Centers for Environmental Information. NCEI/WDS Global Significant Earthquake Database. National Geophysical Data Center. Available online: https://www.ngdc.noaa.gov/hazel/view/hazards/earthquake/search (accessed on 16 January 2025).
  2. Guha-Sapir, D. EM-DAT: The Emergency Events Database. Université Catholique de Louvain. Available online: https://www.emdat.be/ (accessed on 16 January 2025).
  3. Dell’Acqua, F.; Gamba, P.; Jaiswal, K. Spatial aspects of building and population exposure data and their implications for global earthquake exposure modeling. Nat. Hazards 2013, 68, 1291–1309. [Google Scholar] [CrossRef]
  4. Porter, K.; Hu, Z.; Huyck, C.; Bevington, J. User Guide: Field Sampling Strategies for Estimating Building Inventories; Technical Report 2014-02; GEM Foundation: Pavia, Italy, 2014. [Google Scholar] [CrossRef]
  5. Silva, V.; Brzev, S.; Scawthorn, C.; Yepes, C.; Dabbeek, J.; Crowley, H. A building classification system for multi-hazard risk assessment. Int. J. Disaster Risk Sci. 2022, 13, 161–177. [Google Scholar] [CrossRef]
  6. Leggieri, V.; Mastrodonato, G.; Uva, G. GIS Multisource data for the seismic vulnerability assessment of buildings at the urban scale. Buildings 2022, 12, 523. [Google Scholar] [CrossRef]
  7. Zsarnóczay, A.; Deierlein, G.; McKenna, F. Accelerate innovation in regional simulations through shared computational workflows & data. In Proceedings of the World Conference of Earthquake Engineering, Milan, Italy, 30 June–5 July 2024; International Association of Earthquake Engineering: Milan, Italy, 2024. [Google Scholar]
  8. Evangelista, M.K.; Aquino, D.H.; Ramos, J.A. Utilizing Google Street View for Rapid Seismic Vulnerability Assessment: Case Study in the City of Manila, Philippines. In Proceedings of the IOP Conference Series: Earth and Environmental Science, Online, 15 December 2021–16 December 2021; Institute of Physics: Bristol, UK, 2022. [Google Scholar] [CrossRef]
  9. De Los Santos, M.J.D.; Principe, J.A. Gis-based rapid earthquake exposure and vulnerability mapping using lidar dem and machine learning algorithms: Case of porac, pampanga. Int. Arch. Photogramm. Remote Sens. Spat. Inf. Sci. 2021, 46, 125–132. [Google Scholar] [CrossRef]
  10. Zhou, J.; Liu, Y.; Nie, G.; Cheng, H.; Yang, X.; Chen, X.; Gross, L. Building Extraction and Floor Area Estimation at the Village Level in Rural China Via a Comprehensive Method Integrating UAV Photogrammetry and the Novel EDSANet. Remote Sens 2022, 14, 5175. [Google Scholar] [CrossRef]
  11. Torres, Y.; Martínez-Cuevas, S.; Molina-Palacios, S.; Arranz, J.J.; Arredondo, Á. Using remote sensing for exposure and seismic vulnerability evaluation: Is it reliable? GIsci. Remote Sens. 2023, 60, 2196162. [Google Scholar] [CrossRef]
  12. Geiß, C.; Priesmeier, P.; Pelizari, P.A.; Calderon, A.R.S.; Schoepfer, E.; Riedlinger, T.; Vega, M.V.; María, H.S.; Zapata, J.C.G.; Pittore, M.; et al. Benefits of global earth observation missions for disaggregation of exposure data and earthquake loss modeling: Evidence from Santiago de Chile. Nat. Hazards 2023, 119, 779–804. [Google Scholar] [CrossRef]
  13. Rejas Ayuga, J.G.; Marín, R.M.; Velasco, J.A.M. Hyperspectral remote sensing application for semi-urban areas monitoring. In Urban Remote Sensing Joint Event; IEEE: Paris, France, 2007; pp. 1–5. [Google Scholar] [CrossRef]
  14. Rejas Ayuga, J.G.; Marín, R.M.; Sacristán, M.M.; Bonatti, J.; Ojeda, J.C. Hyperspectral anomaly detection in urban scenarios. Int. Arch. Photogramm. Remote Sens. Spat. Inf. Sci.. 2016, 41, 111–116. [Google Scholar] [CrossRef]
  15. Lan, T.; Shao, G.; Xu, Z.; Tang, L.; Sun, L. Measuring urban compactness based on functional characterization and human activity intensity by integrating multiple geospatial data sources. Ecol. Indic. 2021, 121, 107177. [Google Scholar] [CrossRef]
  16. Pavić, G.; Hadzima-Nyarko, M.; Bulajić, B.; Jurković, Ž. Development of seismic vulnerability and exposure models-A case study of Croatia. Sustainability 2020, 12, 973. [Google Scholar] [CrossRef]
  17. Liuzzi, M.; Pelizari, P.A.; Geiß, C.; Masi, A.; Tramutoli, V.; Taubenböck, H. A transferable remote sensing approach to classify building structural types for seismic risk analyses: The case of Val d’Agri area (Italy). Bull. Earthq. Eng. 2019, 17, 4825–4853. [Google Scholar] [CrossRef]
  18. Toké, N.A.; Boone, C.G.; Arrowsmith, J.R. Fault zone regulation, seismic hazard, and social vulnerability in Los Angeles, California: Hazard or urban amenity? Earths Future 2014, 2, 440–457. [Google Scholar] [CrossRef]
  19. Derakhshan, S.; Hodgson, M.E.; Cutter, S.L. Vulnerability of populations exposed to seismic risk in the state of Oklahoma. Appl. Geogr. 2020, 124, 102295. [Google Scholar] [CrossRef]
  20. Rianto, S.; Lu, X.; Gu, D.; Xu, Z. An end-to-end framework for fire following earthquake simulation at regional scale: A case study on the 2024 Japan Noto Peninsula earthquake. Int. J. Disaster Risk Reduct. 2024, 113, 104859. [Google Scholar] [CrossRef]
  21. Cheng, Q.; Li, A.; Ren, H.; Por, C.C.; Liao, W.; Xie, L. Rapid seismic-damage assessment method for buildings on a regional scale based on spectrum-compatible data augmentation and deep learning. Soil Dyn. Earthq. Eng. 2024, 178, 108504. [Google Scholar] [CrossRef]
  22. Fan, X.; Nie, G.; Xia, C.; Zhou, J. Estimation of pixel-level seismic vulnerability of the building environment based on mid-resolution optical remote sensing images. Int. J. Appl. Earth Obs. Geoinf. 2021, 101, 102339. [Google Scholar] [CrossRef]
  23. Calderón, A.; Silva, V.; Avilés, M.; Méndez, R.; Castillo, R.; Gil, J.C.; López, M.A. Toward a uniform earthquake loss model across Central America. Earthq. Spectra 2022, 38, 178–199. [Google Scholar] [CrossRef]
  24. Dávila, L.D.; Cabrero, J.M.; Flores, O. New seismic exposure modeling approach for Guatemala City. Bull. Earthquake. Eng. 2023, 21, 739–766. [Google Scholar] [CrossRef]
  25. Rivera, F.; Rossetto, T.; Twigg, J. An interdisciplinary study of the seismic exposure dynamics of Santiago de Chile. Int. J. Disaster Risk Reduct. 2020, 48, 101581. [Google Scholar] [CrossRef]
  26. Zapata, J.C.G.; Zafrir, R.; Pittore, M.; Merino, Y. Towards a Sensitivity Analysis in Seismic Risk with Probabilistic Building Exposure Models: An Application in Valparaíso, Chile Using Ancillary Open-Source Data and Parametric Ground Motions. ISPRS Int. J. Geoinf. 2022, 11, 113. [Google Scholar] [CrossRef]
  27. Benito, M.B.; Arroyo-Solorzano, M.; Climent, A.; Montero, W.; E Alvarado, G.; López, A.; García-Lanchares, C.; Marchamalo, M.; Ornelas, A.; Hernández-Rubio, O.; et al. Seismic hazard scenarios for the city of San José, Costa Rica: Evaluation of critical ruptures on nearby faults. Earthq. Spectra 2025. [Google Scholar] [CrossRef]
  28. Colegio Federado de Ingenieros y Arquitectos de Costa Rica. Código Sísmico de Costa Rica 1974; Editorial Tecnológica de Costa Rica: Cartago, Costa Rica, 1974. [Google Scholar]
  29. Colegio Federado de Ingenieros y Arquitectos de Costa Rica. Código Sísmico de Costa Rica 1986; Editorial Tecnológica de Costa Rica: Cartago, Costa Rica, 1986. [Google Scholar]
  30. Colegio Federado de Ingenieros y Arquitectos de Costa Rica. Código Sísmico de Costa Rica 2002; Editorial Tecnológica de Costa Rica: Cartago, Costa Rica, 2002. [Google Scholar]
  31. Colegio Federado de Ingenieros y Arquitectos de Costa Rica. Código Sísmico de Costa Rica 2010; Editorial Tecnológica de Costa Rica: Cartago, Costa Rica, 2010. [Google Scholar]
  32. FEMA. Hazus. Available online: https://www.fema.gov/es/flood-maps/products-tools/hazus (accessed on 14 November 2024).
  33. Global Earthquake Model Foundation. Available online: https://www.globalquakemodel.org/ (accessed on 14 November 2024).
  34. Navas-Sánchez, L.; Jiménez-Martínez, M.; González-Rodrigo, B.; Hernández-Rubio, O.; Dávila-Migoya, L.D.; Orta-Rial, B.; Hidalgo-Leiva, D. A methodology to assess and select seismic fragility curves: Application to the case of Costa Rica. Earthq. Spectra 2023, 39, 1380–1409. [Google Scholar] [CrossRef]
  35. Sauter, F.; Shah, H. Study of Insurance for Earthquakes; National Insurance Institute: San José, Costa Rica, 1978. [Google Scholar]
  36. Montoya, L. Urban Disaster Management: A Case Study of Earthquake Risk Assessment in Cartago, Costa Rica. Ph.D. Thesis, Utrecht University, Utrecht, The Netherlands, 2002. Available online: https://www.researchgate.net/publication/241884744 (accessed on 10 April 2025).
  37. Climent, A.; Salgado, D.; Slob, S.; van Westen, C.J. Amenaza Sísmica y Vulnerabilidad Física en la Ciudad de Cañas, Guanacaste, Costa Rica; International Institute for Geo-Information Science and Earth Observation: Enschede, The Netherlands, 2003. [Google Scholar]
  38. Alvarado, L.A.S. Evaluación del Riesgo Sísmico en Edificaciones Residenciales del Área Metropolitana de San José en Función de Pérdidas de Vidas Humanas. Ph.D. Thesis, Universidad de Costa Rica, San José, Costa Rica, 2003. [Google Scholar]
  39. GeoHazards International. United Nations Centre for Regional Development. In Global Earthquake Safety Initiative (GESI); Pilot Project; GeoHazards International: Pleasanton, CA, USA, 2001. [Google Scholar]
  40. Arboleda, O.D.C. Estimación Holística del Riesgo Sísmico Utilizando Sistemas Dinámicos Complejos. Ph.D. Thesis, Universitat Politècnica de Catalunya, Barcelona, Spain, 2001. [Google Scholar]
  41. Cardona, A.O.D.; Yamín, L.L.E.; Bernal, G.G.A.; Ordaz, S.M.G.; Reinoso, A.E.; Horia, B.A.B.; Carreño, T.M.L. Informe Técnico ERN-CAPRA T2-5. Caracterización Local de la Vulnerabilidad de Edificaciones. 2010. Available online: www.ecapra.org (accessed on 25 May 2025).
  42. Miyamoto International Inc. Programa USAID/OFDA PREPARE. Preparación del Personal de Rescate y Emergencia Para Mejorar la Respuesta a Los Terremotos. Informe Final. Fase I: Evaluación de Los Riesgos del Terremoto. San José, Costa Rica. 2016. Available online: www.miyamotointernational.com (accessed on 28 November 2024).
  43. Calderon, A.; Silva, V. Probabilistic seismic vulnerability and loss assessment of the residential building stock in Costa Rica. Bull. Earthq. Eng. 2019, 17, 1257–1284. [Google Scholar] [CrossRef]
  44. Esquivel-Salas, L.C.; Schmidt-Díaz, V.; Pittore, M.; Hidalgo-Leiva, D.; Haas, M.; Moya-Fernández, A. Remote structural characterization of thousands of buildings from San Jose, Costa Rica. Front. Built. Environ. 2022, 8, 947329. [Google Scholar] [CrossRef]
  45. Saenz, S.P.B.; Esquivel-Salas, L.C. Estimación del período de construcción de las edificaciones del cantón de San José por medio de análisis de fotografías aéreas. Rev. Geográfica América Central 2021, 2, 85–106. [Google Scholar] [CrossRef]
  46. Esquivel-Salas, L.C.; Schmidt-Díaz, V.; Pittore, M.; Hidalgo-Leiva, D.A.; Haas, M.; Moya-Fernández, A. Dataset of the Attributes Affecting Seismic Performance of a Sample of Buildings from San José-Costa Rica; German Research Centre for Geosciences: Postdam, Germany, 2021. [Google Scholar] [CrossRef]
  47. Esquivel-Salas, L.; Pittore, M.; Schmidt-Díaz, V.; Haas, M. Photographsof Buildings from San Jose canton, CostaRica, Taken from the Street; 4TU.ResearchData Collection: Leiden, The Netherlands, 2021. [Google Scholar] [CrossRef]
  48. Brzev, S.; Scawthorn, C.; Charleson, A.W.; Allen, L.; Greene, M.; Jaiswal, K.; Silva, V. GEM Building Taxonomy Version 2.0; GEM Foundation: Pavia, Italy, 2013. [Google Scholar] [CrossRef]
  49. Parolai, S. DB2 Software Platform and Processing Tools; SIBYL (Seismic monitoring and vulnerability framework for civil protection), German Research Centre for Geosciences: Postdam, Germany, 2016; pp. 1–33. Available online: https://www.sibyl-project.eu/ (accessed on 25 May 2025).
  50. Ruiz Cubillo, P.; Soto, G. Preparación del Mapa de Susceptibilidad a Deslizamientos Utilizando Imágenes Lídar en los Cerros de Escazú, cantones Aserrí, Desamparados, Alajuelita, Santa Ana y Escazú; Comisión Nacional de Prevención de Riesgos y Atención de Emergencias: San José, Costa Rica, 2014. [Google Scholar] [CrossRef]
  51. Salas, L.C.E. Inventario de Edificaciones del Cantón de San José Para el Caso Específico de Amenaza Sísmica Utilizando el Método de Mapeo Ambiental Rápido. Ph.D. Thesis, Univerisdad de Costa Rica, San José, Costa Rica, 2020. [Google Scholar]
  52. OpenStreetMap. Available online: https://www.openstreetmap.org/ (accessed on 14 November 2024).
  53. Corbane, C.; Florczyk, A.; Pesaresi, M.; Politis, P.; Syrris, V. GHS-BUILTR2018A-GHS Built-Up Grid, Derived from Landsat, Multitemporal (1975–1990–2000–2014); European Commission, Joint Research Centre (JRC): Ispra, Italy, 2018. [Google Scholar] [CrossRef]
  54. Marconcini, M.; Metz-Marconcini, A.; Esch, T.; Gorelick, N. Understanding current trends in global urbanisation-The world settlement footprint suite. GI_Forum 2021, 9, 33–38. [Google Scholar] [CrossRef]
  55. Sentinel-2|Copernicus Data Space Ecosystem. Available online: https://dataspace.copernicus.eu/explore-data/data-collections/sentinel-data/sentinel-2 (accessed on 16 December 2024).
  56. NASA. Earthdata. Available online: https://search.earthdata.nasa.gov/search (accessed on 16 December 2024).
  57. Sistema Nacional de Información Territorial. Costa Rica Orthoimage 2015–2018 1k. Available online: https://www.snitcr.go.cr/ico_servicios_ogc_info?k=bm9kbzo6NjA=&nombre=Ortofoto%202015-2018%201k (accessed on 28 April 2025).
  58. Microsoft Bing. Global ML Building Footprints. Available online: https://github.com/microsoft/GlobalMLBuildingFootprints?tab=readme-ov-file (accessed on 16 December 2024).
  59. Zhao, Q.; Wentz, E.A. A MODIS/ASTER Airborne Simulator (MASTER) Imagery for Urban Heat Island Research. Data 2016, 1, 7. [Google Scholar] [CrossRef]
  60. González-Rodrigo, B.; Hidalgo-Leiva, D.; Flores, O.; Germoso, C.; Jiménez-Martínez, M.; Navas-Sánchez, L.; Orta, B.; Tarque-Ruiz, N.; Hernández-Rubio, O.; Marchamalo-Sacristán, M.; et al. Sustainable and resilient construction in Central America and the Caribbean in the face of seismic hazard: Regional cooperation based on the experience of Costa Rica (9063-03). Triangular Cooperation between the EU, Latin America, and the Caribbean (LAC), European Union’s flagship program Adelante 2. 2024. Available online: https://sismica.lis.ucr.ac.cr/ (accessed on 10 April 2025).
  61. OverPass API. Available online: https://wiki.openstreetmap.org/wiki/Overpass_API (accessed on 10 April 2025).
  62. Sistema Nacional de Información Territorial. Costa Rica. Mosaico Ortofotos Escala 1:100. 2015–2018. 2018. Available online: https://geos1.snitcr.go.cr/Ortofoto1k/wmts?VERSION=1.0.0 (accessed on 10 April 2025).
  63. Polsby, D.D.; Popper, R.D. The Third Criterion: Compactness as a Procedural Safeguard Against Partisan Gerrymandering. Yale Law Policy Rev. 1991, 9, 301–353. [Google Scholar] [CrossRef]
  64. Corbane, C.; Pesaresi, M.; Kemper, T.; Politis, P.; Florczyk, A.J.; Syrris, V.; Melchiorri, M.; Sabo, F.; Soille, P. Automated global delineation of human settlements from 40 years of Landsat satellite data archives. Big Earth Data 2019, 3, 140–169. [Google Scholar] [CrossRef]
  65. Torres-Olivares, S.; González-Rodrigo, B.; Saavedra-Flores, E.I.; Mosquera-Feijoo, J.C. Seismic behaviour of reinforced-masonry aggregate under different types of interaction between adjacent dwellings. Bull. Earthq. Eng. 2024, 22, 583–609. [Google Scholar] [CrossRef]
  66. Hook, S.J.; Myers, J.J.; Thome, K.J.; Fitzgerald, M.; Kahle, A.B. The MODIS/ASTER airborne simulator (MASTER)—A new instrument for earth science studies. Remote Sens. Environ. 2001, 76, 93–102. [Google Scholar] [CrossRef]
  67. He, Y.; Zhang, Z.; Xiang, R.; Ding, B.; Du, R.; Yin, H.; Chen, Y.; Ba, Y. Monitoring salinity in bare soil based on Sentinel-1/2 image fusion and machine learning. Infrared Phys. Technol. 2023, 131, 104656. [Google Scholar] [CrossRef]
  68. Ahmed, M.; Seraj, R.; Islam, S.M.S. The k-means algorithm: A comprehensive survey and performance evaluation. Electronics 2020, 9, 1295. [Google Scholar] [CrossRef]
  69. Pittore, M.; Haas, M.; Megalooikonomou, K.G. Risk-oriented, bottom-up modeling of building portfolios with faceted taxonomies. Front Built. Environ. 2018, 4, 41. [Google Scholar] [CrossRef]
  70. Jiménez-Martínez, M.; Navas-Sánchez, L.; González-Rodrigo, B.; Hernández-Rubio, O. A methodology to assess and select seismic fragility curves: Calibration from expert survey and fuzzy analysis. Int. J. Disaster Risk Reduct. 2024, 114, 104930. [Google Scholar] [CrossRef]
  71. Belgiu, M.; Drăgu, L. Random forest in remote sensing: A review of applications and future directions. ISPRS J. Photogramm. Remote Sens. 2016, 114, 24–31. [Google Scholar] [CrossRef]
  72. Coskun, O.; Aldemir, A. Machine learning network suitable for accurate rapid seismic risk estimation of masonry building stocks. Nat. Hazards 2023, 115, 261–287. [Google Scholar] [CrossRef]
  73. Schröter, K.; Lüdtke, S.; Redweik, R.; Meier, J.; Bochow, M.; Ross, L.; Nagel, C.; Kreibich, H. Flood loss estimation using 3D city models and remote sensing data. Environ. Model. Softw. 2018, 105, 118–131. [Google Scholar] [CrossRef]
  74. Ureña-Pliego, M.; Martínez-Marín, R.; González-Rodrigo, B.; Marchamalo-Sacristán, M. Automatic Building Height Estimation: Machine Learning Models for Urban Image Analysis. Appl. Sci. 2023, 13, 5037. [Google Scholar] [CrossRef]
  75. Google. Google Street View. Available online: https://www.google.com/intl/en_uk/streetview/ (accessed on 28 April 2025).
  76. Meta. Mapillary. 2014. Available online: https://www.mapillary.com (accessed on 28 April 2025).
  77. Yepes-Estrada, C.; Calderon, A.; Costa, C.; Crowley, H.; Dabbeek, J.; Hoyos, M.C.; Martins, L.; Paul, N.; Rao, A.; Silva, V. Global Building Exposure Model for Earthquake Risk Assessment. Earthq. Spectra 2023, 39, 2212–2235. [Google Scholar] [CrossRef]
Figure 1. A scheme of the proposed methodology for building exposure assessment with the consecutive phases: (1) digitalization, (2) GIS analysis, (3) remote sensing, (4) database integration, (5) sampling, (6) field work, (7) building typology classification, and (8) machine learning classification.
Applsci 15 06318 g001
Figure 2. Districts of the canton of San José, Costa Rica.
Applsci 15 06318 g002
Figure 3. Presentation of the Polsby–Popper index result: very regular buildings (green), regular buildings (yellow), and irregular buildings (red).
Applsci 15 06318 g003
Figure 4. Map of buildings in San José classified by surface area.
Applsci 15 06318 g004
Figure 5. A histogram of the surface area of buildings in San José.
Applsci 15 06318 g005
Figure 6. Map of buildings in San José classified by plan regularity.
Applsci 15 06318 g006
Figure 7. A histogram of the plan regularity of buildings in San José.
Applsci 15 06318 g007
Figure 8. Map of buildings in San José classified by their first construction date.
Applsci 15 06318 g008
Figure 9. A histogram of the date of first construction of buildings in San José.
Applsci 15 06318 g009
Figure 10. Map of isolated buildings in San José.
Applsci 15 06318 g010
Figure 11. A histogram of the isolated buildings in San José.
Applsci 15 06318 g011
Figure 12. A map of the degree of occupancy of the urban blocks in San José.
Applsci 15 06318 g012
Figure 13. A histogram of the percentage of occupancy of the urban blocks in San José.
Applsci 15 06318 g013
Figure 14. Map of buildings in San José classified by roof covering material.
Applsci 15 06318 g014
Figure 15. A histogram of the roof covering material of buildings in San José.
Applsci 15 06318 g015
Figure 16. Graph of influence of attributes on building typology assignment using geospatial attributes with Random Forest classifier RF1, without considering building height.
Applsci 15 06318 g016
Figure 17. Graph of influence of attributes on class assignment to buildings using geospatial attributes with Random Forest classifier RF2, including building height.
Applsci 15 06318 g017
Table 1. Seismic exposure studies carried out in Costa Rica, modified from Navas et al. [34].
Name of the ProjectScope of the Study in Costa RicaYear of the StudyCharacterization of BuildingsData Sources for ExposureMethodologyGeospatial DatabaseAttributes Obtained by Remote Sensing/GIS Analysis
National project [35]National1978 INEC (Instituto Nacional de Estadística y Censo) CensusOwnNoNo
Urban disaster manager: a case study of risk assessment in Cartago, Costa Rica [36]Cartago2002(a), (b), (c)INEC Census and field workHazusYesNo
Capacity Building for Natural Disaster Reduction for Central America [37]Cañas, Guanacaste2003(a), (c), (d)INEC Census and field workOwnNoNo
Assessment of seismic risk in residential buildings in the San José Metropolitan Area in terms of loss of human lives [38]San José Metropolitan Area2003(e), (f)2000 INEC Census, database of IMAS (Joint Institute for Social Care of San José) and MIVAH (Ministry of Housing and Human Settlements of Costa Rica).GESI [39] and Cadorna [40]NoNo
Technical Report ERN-CAPRA T2-5. Local Characterisation of Building Vulnerability [41]San José2009(a), (b), (e), (f), (g)Field work and review of prior documentation. Google Maps.Own from the CAPRA program on Google Maps imageryNoNo
USAID/OFDA Prepare Programme [42]San José2016(a), (b)Field work, development patterns, and satellite imageryGEM for seismic exposure. Hazus for Seismic VulnerabilityYesNo
Probabilistic assessment of seismic vulnerability and loss of residential building stock in Costa Rica [43]National2019(b), (c), (e), (g), (h)2011 INEC Census, CFIA endorsed projects database between 2003 and 2010.GEMNoNo
Remote structural characterisation of thousands of buildings in San José, Costa Rica [44]San José2019(a), (b), (c), (e), (g), (h), (i), (j)Field surveys from Street View images and orthoimagesRapid Environmental Mapping and GEMYesNo
Toward a uniform earthquake loss model in Central America [23]National2021(b), (e), (g), (i)2018 INEC CensusGEMNoNo
(a) Load resistant system, (b) height or number of stories, (c) year of construction, (d) apparent condition, (e) construction materials, (f) structure diaphragm, (g) structure ductility, (h) type of dwelling, (i) lateral load-resisting system, (j) structural irregularity.
Table 2. The main building attributes of the GEM taxonomy, highlighting those calculated with geomatic techniques, data sources, and open access alternative sources.
Group of
Attributes
AttributeData Source (San José)Open Access Alternatives
Structural systemDirection
Material of the lateral load-resisting system
Lateral load-resisting system
Building informationHeight (*)LiDAR 3D point cloud [50]/Visual estimation in street-view imagery (*) [51]OpenStreetMap (**) [52]
Date of construction or retrofitGlobal Human Settlement (JRC) [53]World Settlement Footprint (DLR) [54]
Occupancy
Urban block compactnessOpenStreetMap and Sentinel-2 imagery [52,55]Other local layers/Landsat/ASTER imagery [56]
Exterior attributesBuilding position within a blockFootprints digitized from National 1:1000 orthophotographs [57]Bing or OpenStreetMap footprints/Bing/ESRI/Google imagery [52,58]
Shape of the building planFootprints digitized from National 1:1000 orthophotographs [57]Bing or OpenStreetMap footprints/Bing/ESRI/Google imagery [52,58]
Structural irregularityFootprints digitized from National 1:1000 orthophotographs [57]Bing or OpenStreetMap footprints/Bing/ESRI/Google imagery [52,58]
Exterior walls
Roof, floors, and foundationRoofMASTER imagery [59]Sentinel-2 or ASTER imagery [55,56]
Floor
Foundation system
Attributes with gray background color are those included in this case study. (*) Building height is not usually available in data-scarce cities with high seismic risk, as in San José, implying an acquisition cost. (**) OpenStreetMap still offers very limited coverage in terms of building heights across most cities and populated areas worldwide.
Table 3. Building typologies in the canton of San José, according to GEM Taxonomy 2.0 [5].
IDNameBuilding Typologies Material of Lateral
Load-Resisting System
Ductility Height (Levels)
AMCF.AMCF-MR/DUC/H:1Reinforced or confined masonryDUC1
BMCF.BMCF-MR/DUC/H:2++Reinforced or confined masonryDUC2 or more
CCR.ACR/DUC/HBET:5,1Prestressed or reinforced concreteDUC1–5
DCR.BCR/DUC/HBET:10,6Prestressed or reinforced concreteDUC6–10
ECR.CCR/DUC/H:11++Prestressed or reinforced concreteDUC11 or more
FS/W.AS-W/DUC/H:1Lightweight systems of steel or woodDUC1
GS.BS/DUC/H:2++SteelDUC2 or more
HINFORMAT99/DNO/H99Informal buildingsDNO1
Table 4. A confusion matrix for the classification of roofing materials.
Ground Truth (%)12345
Not classified4.3810.278.3911.283.78
187.1313.840.430.000.00
23.7761.619.682.851.11
33.3310.7168.606.663.04
41.113.3511.4070.3811.08
50.280.221.518.8380.99
Table 5. A comparison of the efficiency in time and costs of three surveys conducted in the canton of San José (Costa Rica): GED methodology—the present study—, REM methodology [44] and a full survey [60]. The costs were estimated in Euros based on reference costs of engineering profiles in Spain (75 EUR/h for a superior technician, 45 EUR/h for an intermediate technician, and 15 EU/h for a basic technician and administration).
GED MethodologyREM MethodologyFull Survey
h/km2EUR/km2h/km2EUR/km2h/km2EUR/km2
Preparation1.1952.0015.00525.0075.471698.00
Field work 4.50270.00313.215604.00
Digitalization4.28191.0064.171189.00381.135943.00
Total5.47243.0083.671984.00769.8113,245.00
Table 6. A confusion matrix of the building typology (A–H) assignment from the geospatial attributes, with Random Forest classifier RF1, without considering building height.
IDABCDEFGHError
A2506840190017410.2601
B1500132770011110.5339
C11314223002400.9190
D3114000001.0000
E434000001.0000
F28917660030600.9408
G89564008910.9461
H2440000070.8000
Table 7. A confusion matrix of the building typology (A–H) assignment from the geospatial attributes, with Random Forest classifier RF2, including building height.
IDABCDEFGHError
A3333050038920.0159
B0282423000000.0081
C8815534002500.8803
D0031320000.2778
E000380000.2727
F3757920045600.9112
G78685009610.9641
H25000000100.7143
Disclaimer/Publisher’s Note: The statements, opinions and data contained in all publications are solely those of the individual author(s) and contributor(s) and not of MDPI and/or the editor(s). MDPI and/or the editor(s) disclaim responsibility for any injury to people or property resulting from any ideas, methods, instructions or products referred to in the content.

