1. Introduction
Truck haulage is a pivotal transportation method for both ore and waste materials in open-pit mining operations [
1,
2,
3]. The cost of truck transportation accounts for 45% to 60% of the total production cost, with fuel consumption being a significant component [
4,
5]. Despite the gradual implementation of electric-driven trucks in open-pit mines [
6,
7,
8], many of these mines are expected to continue utilizing fuel-driven trucks for an extended period. Hence, the investigation of methods to decrease fuel consumption holds significant value in managing the operational expenses associated with open-pit mining.
Road roughness is one of the most critical factors affecting the fuel consumption of trucks [
9,
10], and the quality of the road not only increases the fuel consumption but also reduces the transport efficiency of trucks. The investigation of roughness encompasses numerous international standards [
11,
12]. One prominent approach to quantifying road roughness is the International Roughness Index (IRI), a well-established indicator that has found extensive application, particularly in the field of highway engineering [
13,
14,
15].
The application of the IRI may vary across different countries, depending on the specific contextual factors within each region [
16,
17]. As a case in point, Tehrani, Falls and Mesher [
18] applied the IRI in Canada, identifying IRI thresholds for categorizing pavement conditions into good, fair, and poor based on public perception. Radovic, Jokanovic, Matic, and Seslija [
19] used IRI to assess the pavement roughness along an extensive network of roads spanning 13,191.34 km in Serbia. Similarly, Park, Shin, and Chung [
20] studied the effect of pavement roughness by IRI on the dynamic impact coefficient of bridges in Korea. Chen, Lin, Tang, Chu, and Cheng [
21] detected the pavement roughness in China and recommended appropriate IRI thresholds for road rehabilitation. Furthermore, Sidess, Ravina, and Oged [
22] developed a model that predicts IRI deterioration and calibrates its parameters based on pavement structural factors. This model combined empirical-mechanistic and regressive empirical approaches and was validated against road sections within the Pavement Management System of Netivei Israel, representing various climate zones.
Based on the aforementioned literature, the IRI has been widely applied in road quality evaluation, but its application in open-pit mines remains limited. To implement IRI in open-pit coal mines, it is first necessary to define its application objectives, followed by establishing IRI standards. However, in practice, variations in road materials and haulage vehicles across different open-pit mines make it challenging to develop a universal standard applicable to most cases [
23,
24]. Instead, a more pressing need lies in establishing an IRI-based design methodology.
Given that fuel consumption constitutes the primary cost factor in truck haulage operations in open-pit mines, and considering the evident positive correlation between road quality and fuel consumption, this study innovatively proposes a quantitative relationship between road quality and fuel consumption. This approach ultimately enables fuel-efficient road classification for open-pit mines.
The fuel-efficient road classification method proposed in this study had the aim of reducing fuel consumption in open-pit mining operations. The approach involves establishing a Digital Elevation Model (DEM) and calculating road IRI using point cloud data obtained through UAV mapping. A linear relationship between IRI and fuel consumption is derived through linear regression. Subsequently, K-means clustering is employed to classify truck fuel consumption. The fuel efficiency classification is determined by applying node values regarding fuel consumption to the established linear relationship. This study offers theoretical guidance for scientific mine road construction, reduction in truck fuel consumption, and the promotion of sustainable development in open-pit mining operations.
2. Materials and Methods
The present investigation focused on understanding the impact of road roughness on the fuel consumption of haulage trucks in open-pit mines. To achieve this, the characteristics of haul roads were studied, and a data collection process was designed and executed. To ensure the integrity and accuracy of the assessment, the data collection locations were planned, specific road sections were selected, and suitable data collection equipment was used, as detailed in the following sections.
2.1. Workflow
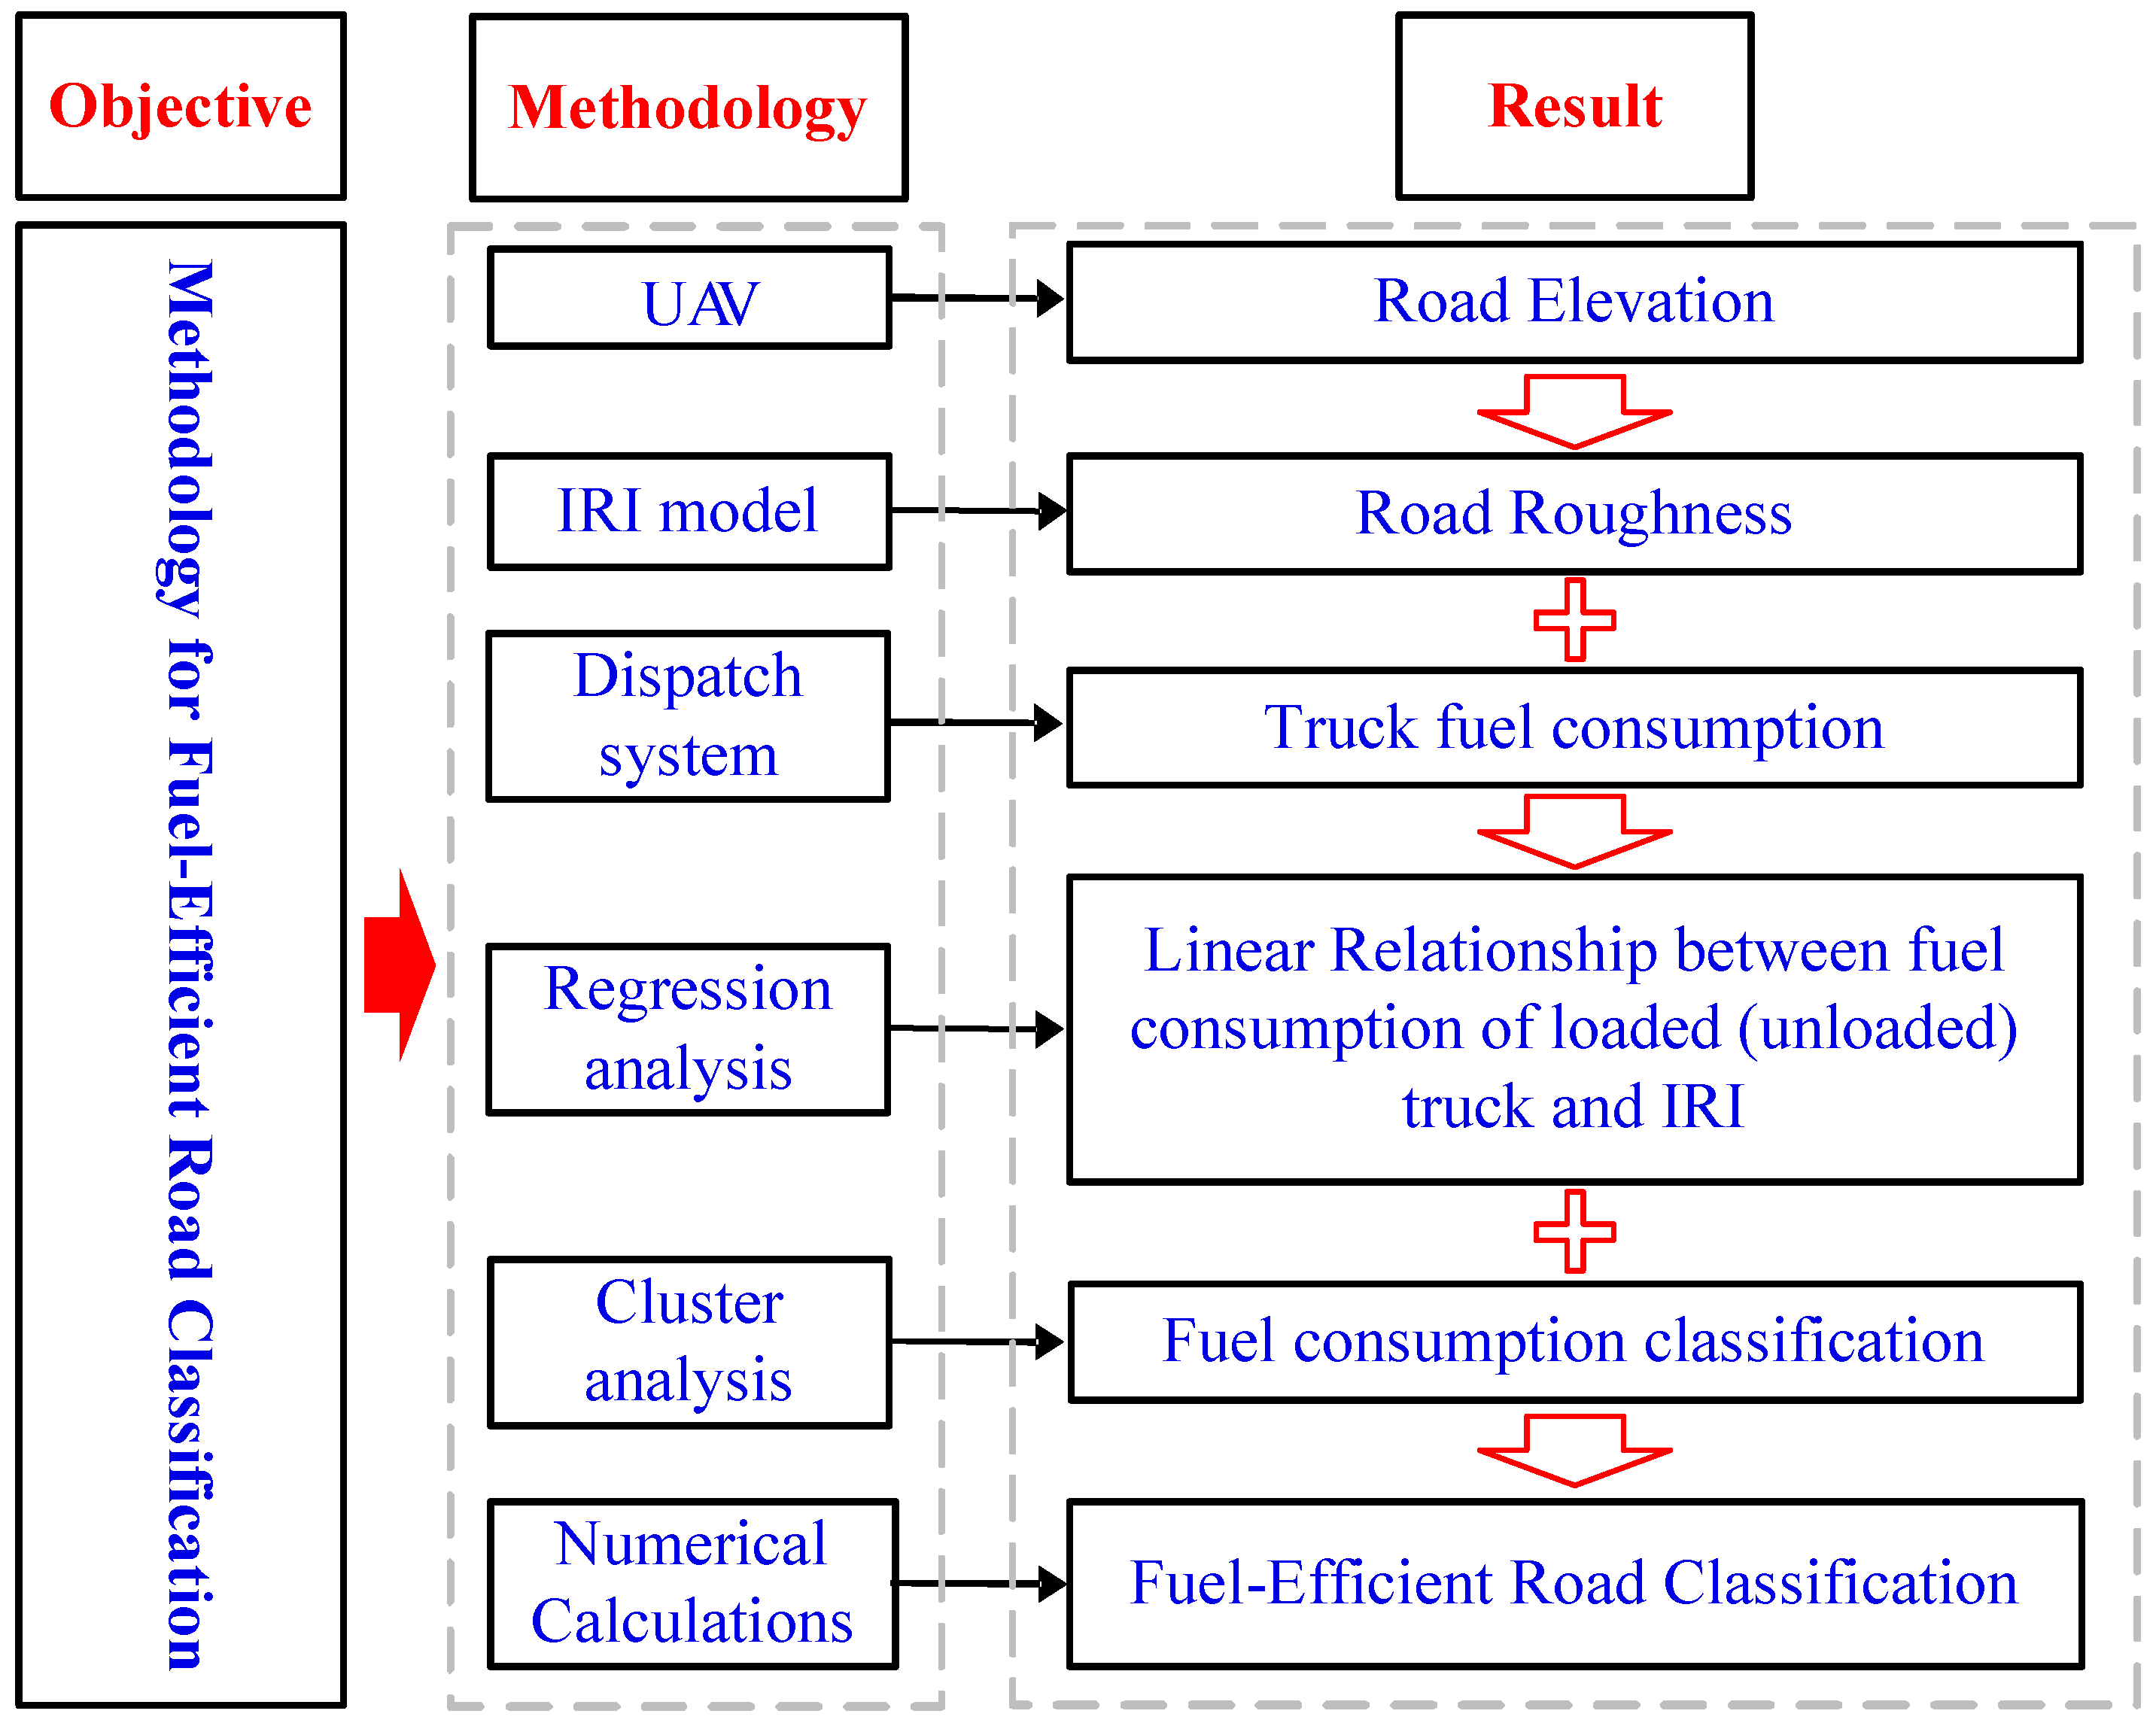
In order to derive the methodology for classifying fuel-efficient roads, this research entailed establishing the correlation between fuel consumption and road roughness. The subsequent classification of fuel consumption was subsequently employed to achieve the classification of road roughness. The research process involved the use of UAVs to obtain road elevation information, as well as the application of IRI models to determine road roughness. The specific workflow is shown in
Figure 1.
2.2. Data Acquisition
2.2.1. Elevation Data
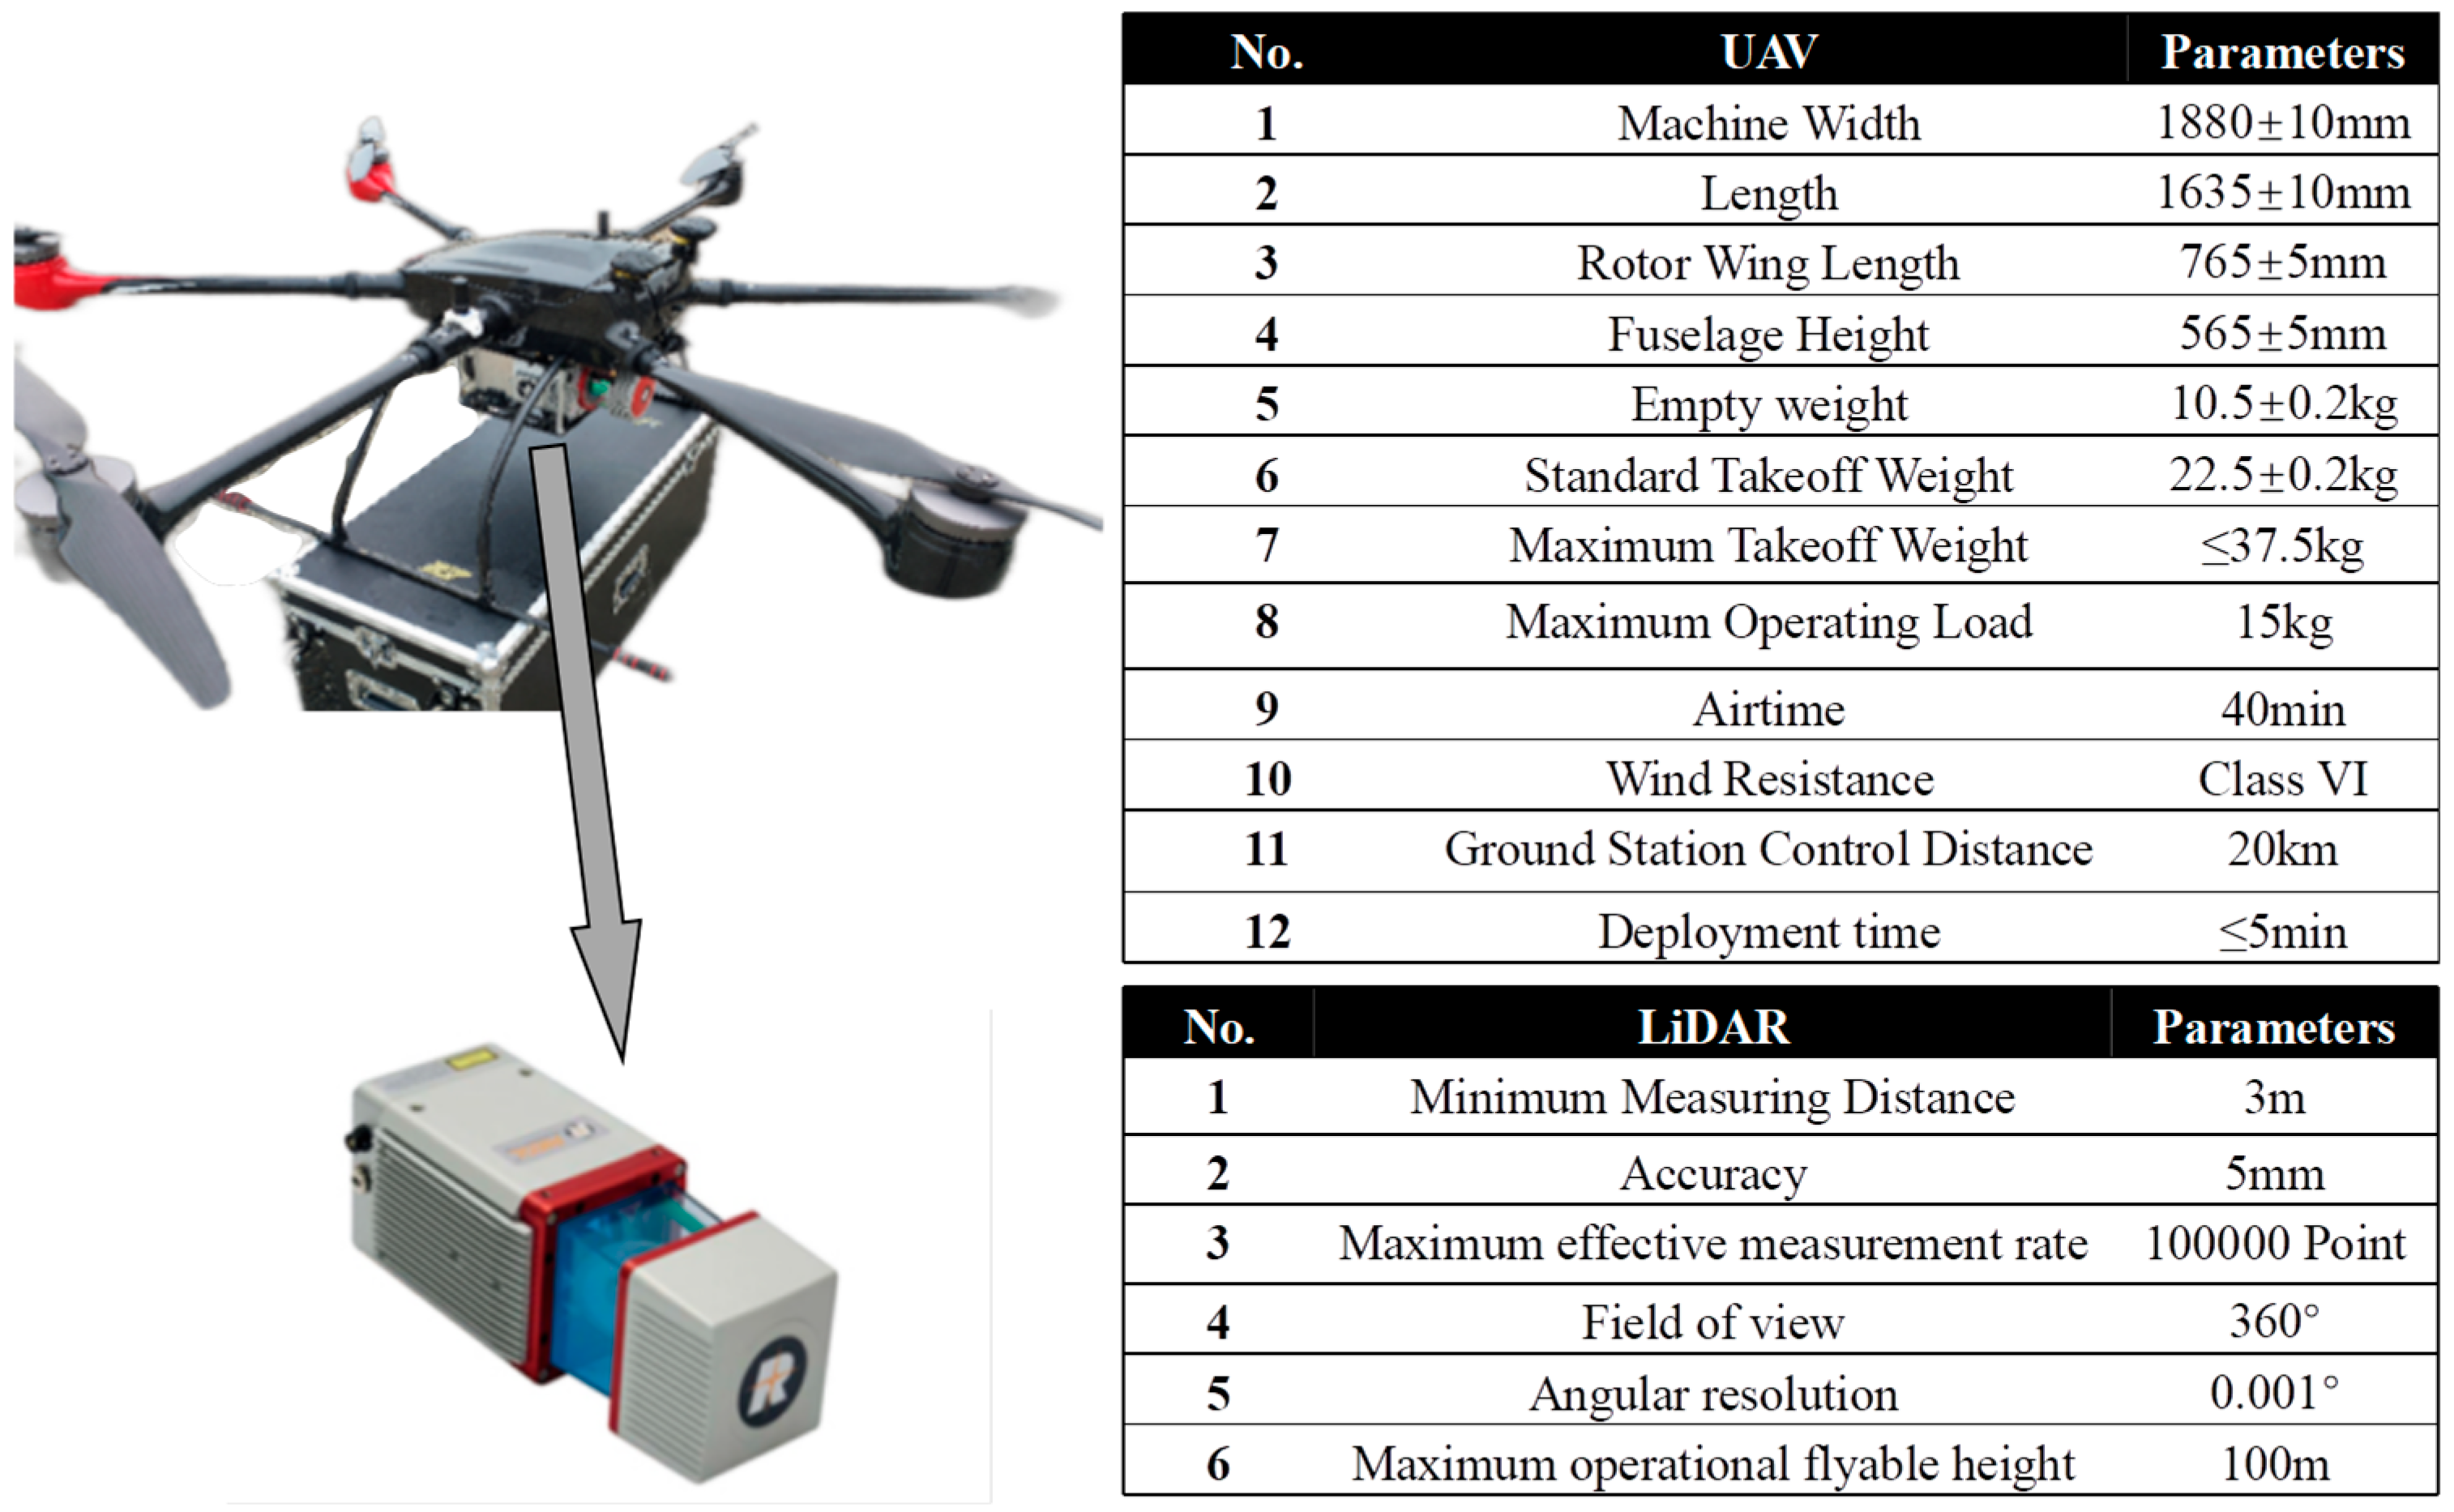
The elevation data was obtained from the point cloud pit model provided by the Haerwusu Open-pit Coal Mine. Point cloud model data was collected using the PH-25EX hexacopter, developed by Chengdu Zongheng Dapeng UAV Technology Co., Ltd. (Chengdu, China), equipped with Light Detection and Ranging (LiDAR) technology. This enabled high-quality detection of multiple objects and accurate echo data acquisition. The acquired point cloud data was clear, retaining the distinctive characteristics of the object with high resolution. The specifications regarding the PH-25EX and the LiDAR system are provided in
Figure 2.
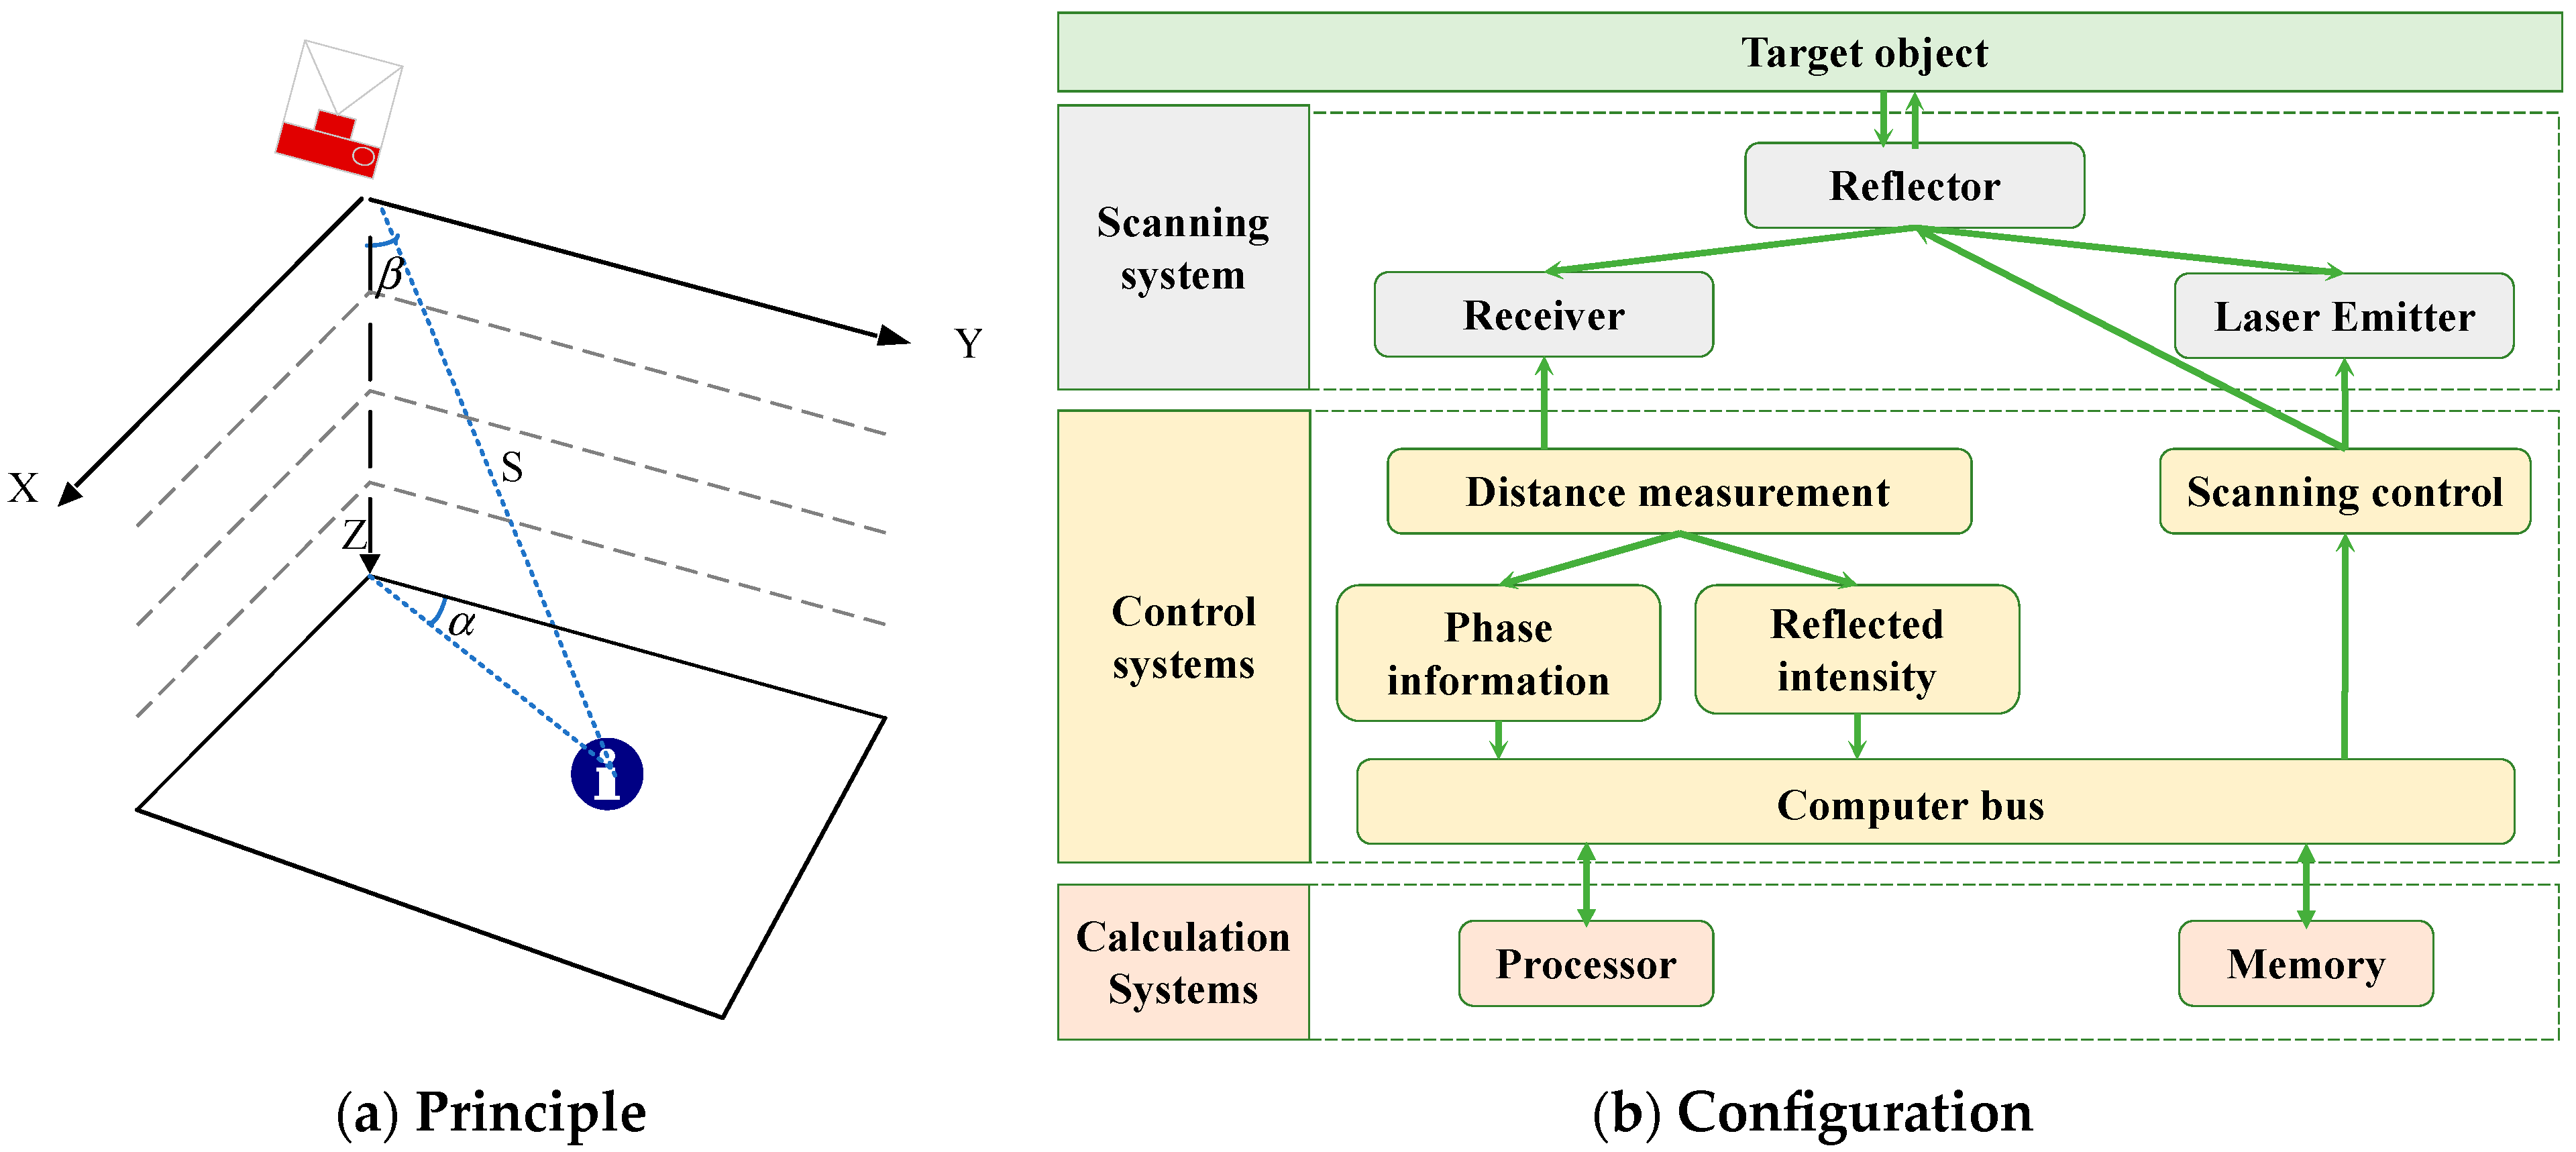
The LiDAR scanner operates based on the principle of laser ranging to measure the distance to feature points on the surface of an object and calculate their three-dimensional coordinates. This data was then used to generate a three-dimensional surface that provides spatial information. The LIDAR system comprises three main components: the scanning system, the control system, and the computer module. The control system, managed via a computer bus, is responsible for controlling the scanning and ranging modules. Meanwhile, the computer module primarily consists of a microprocessor and memory, facilitating the exchange of information with the control system. The schematic representation of the principle and configuration of the LiDAR system are depicted in
Figure 3a and
Figure 3b, respectively.
2.2.2. Fuel Consumption
The fuel consumption data for the haulage trucks was sourced from the truck dispatch system employed at the Haerwusu open pit coal mine in China. The system meticulously records fuel consumption data for each truck, which was the primary source of data for this study.
2.3. IRI Model
IRI is the standard roughness index of pavement management employed to acquire quantitative longitudinal surface-bump data of road surfaces [
25,
26]. The longitudinal profile elevation data of roads reflects the undulation of the road surface to a certain extent, making it a cross-sectional type of smoothness evaluation indicator.
As defined in The International Road Roughness Experiment Standard for Measurements, a technical paper published by the World Bank [
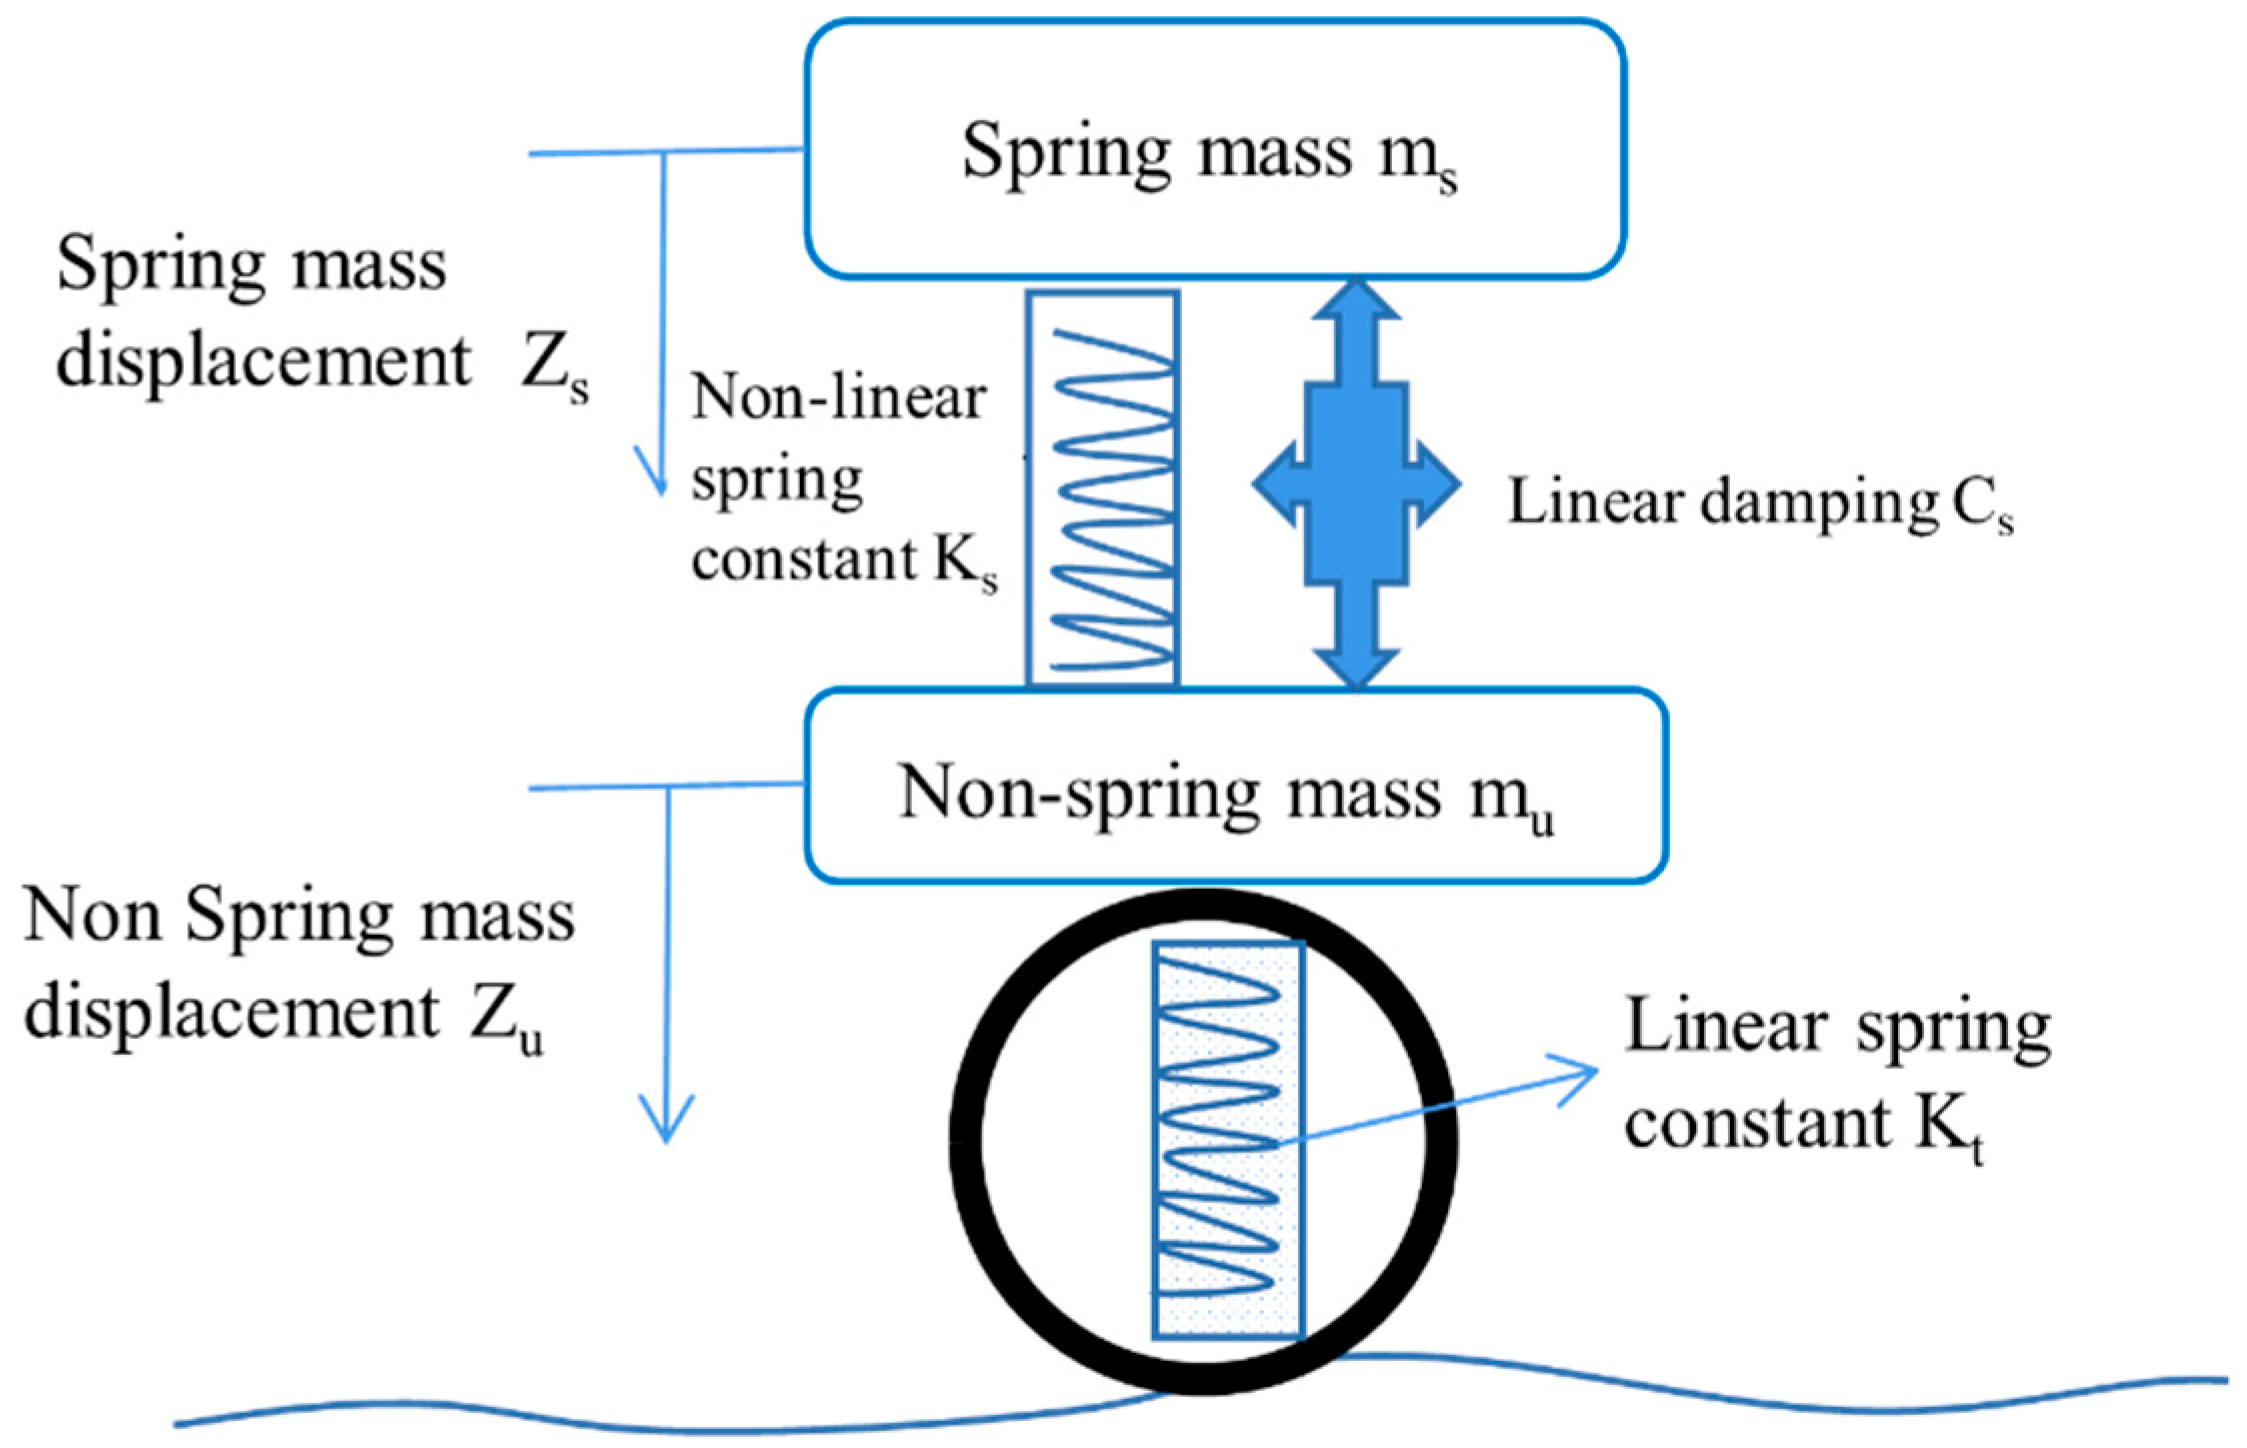
27], the value of IRI reflects the smoothness of the road surface. A smaller IRI value indicates a smoother road, with an ideal road condition reflected when IRI equals 0. The physical meaning of IRI is that when the vehicle steadily drives through the measured road section at a specific speed, the cumulative vertical displacement of the vehicle (measured in meters) to the distance traveled (measured in kilometers). Its unit is m/km. The specific derivation of IRI is based on a quarter-car model that employs the same road-vehicle vibration equations to establish a unified evaluation metric, exhibiting excellent applicability. The basic principle is shown in
Figure 4.
Based on the model shown in
Figure 4, the standard IRI calculation formula is given by Equation (1) as follows:
where
zs is the spring mass displacement,
zu is the unspring mass displacement; and
L is the total length of the tested road.
The specific application process of Equation (1) was to achieve the calculation of the vertical cumulative displacement by installing the corresponding sensors on the vehicle. Whereas, with the adoption of Lidar, Equation (1) needs to be adjusted accordingly, as in Equation (2):
where the elevation of the former sample point is
Hs, the latter is
Hu,
Lp is The horizontal spacing between sampling points
α is the slope gradient of the inclined surface, such as a ramp.
It is important to emphasize that the calculation must be performed separately for horizontal and inclined road segments, as mixed-type sections should not be included in the analysis.
In the practical application of Equation (2), the process of obtaining continuous sample points for IRI calculation from the mine road surface model involves the following steps: First, UAV-acquired point cloud data of the mining area is obtained. However, as the spacing between point cloud data points is non-uniform, while Equation (2) requires equal intervals between sample points, further processing is necessary. The point cloud model is therefore converted into a DEM (Digital Elevation Model). This conversion enables the generation of continuous, equally spaced sample points by projecting a line composed of uniformly distributed points onto the DEM surface. Once these regularly spaced sample points are acquired, the IRI can be calculated. The complete workflow is illustrated in
Figure 5.
Naturally, given the substantial elevation variations characteristic of open-pit mine haul roads, the analysis requires segmentation of the road into multiple sections. Each segment is then individually evaluated using Equation (2) to compute discrete IRI values. The resulting series of IRI measurements effectively captures the progressive variation in road surface roughness.
2.4. K-Means Clustering Analysis
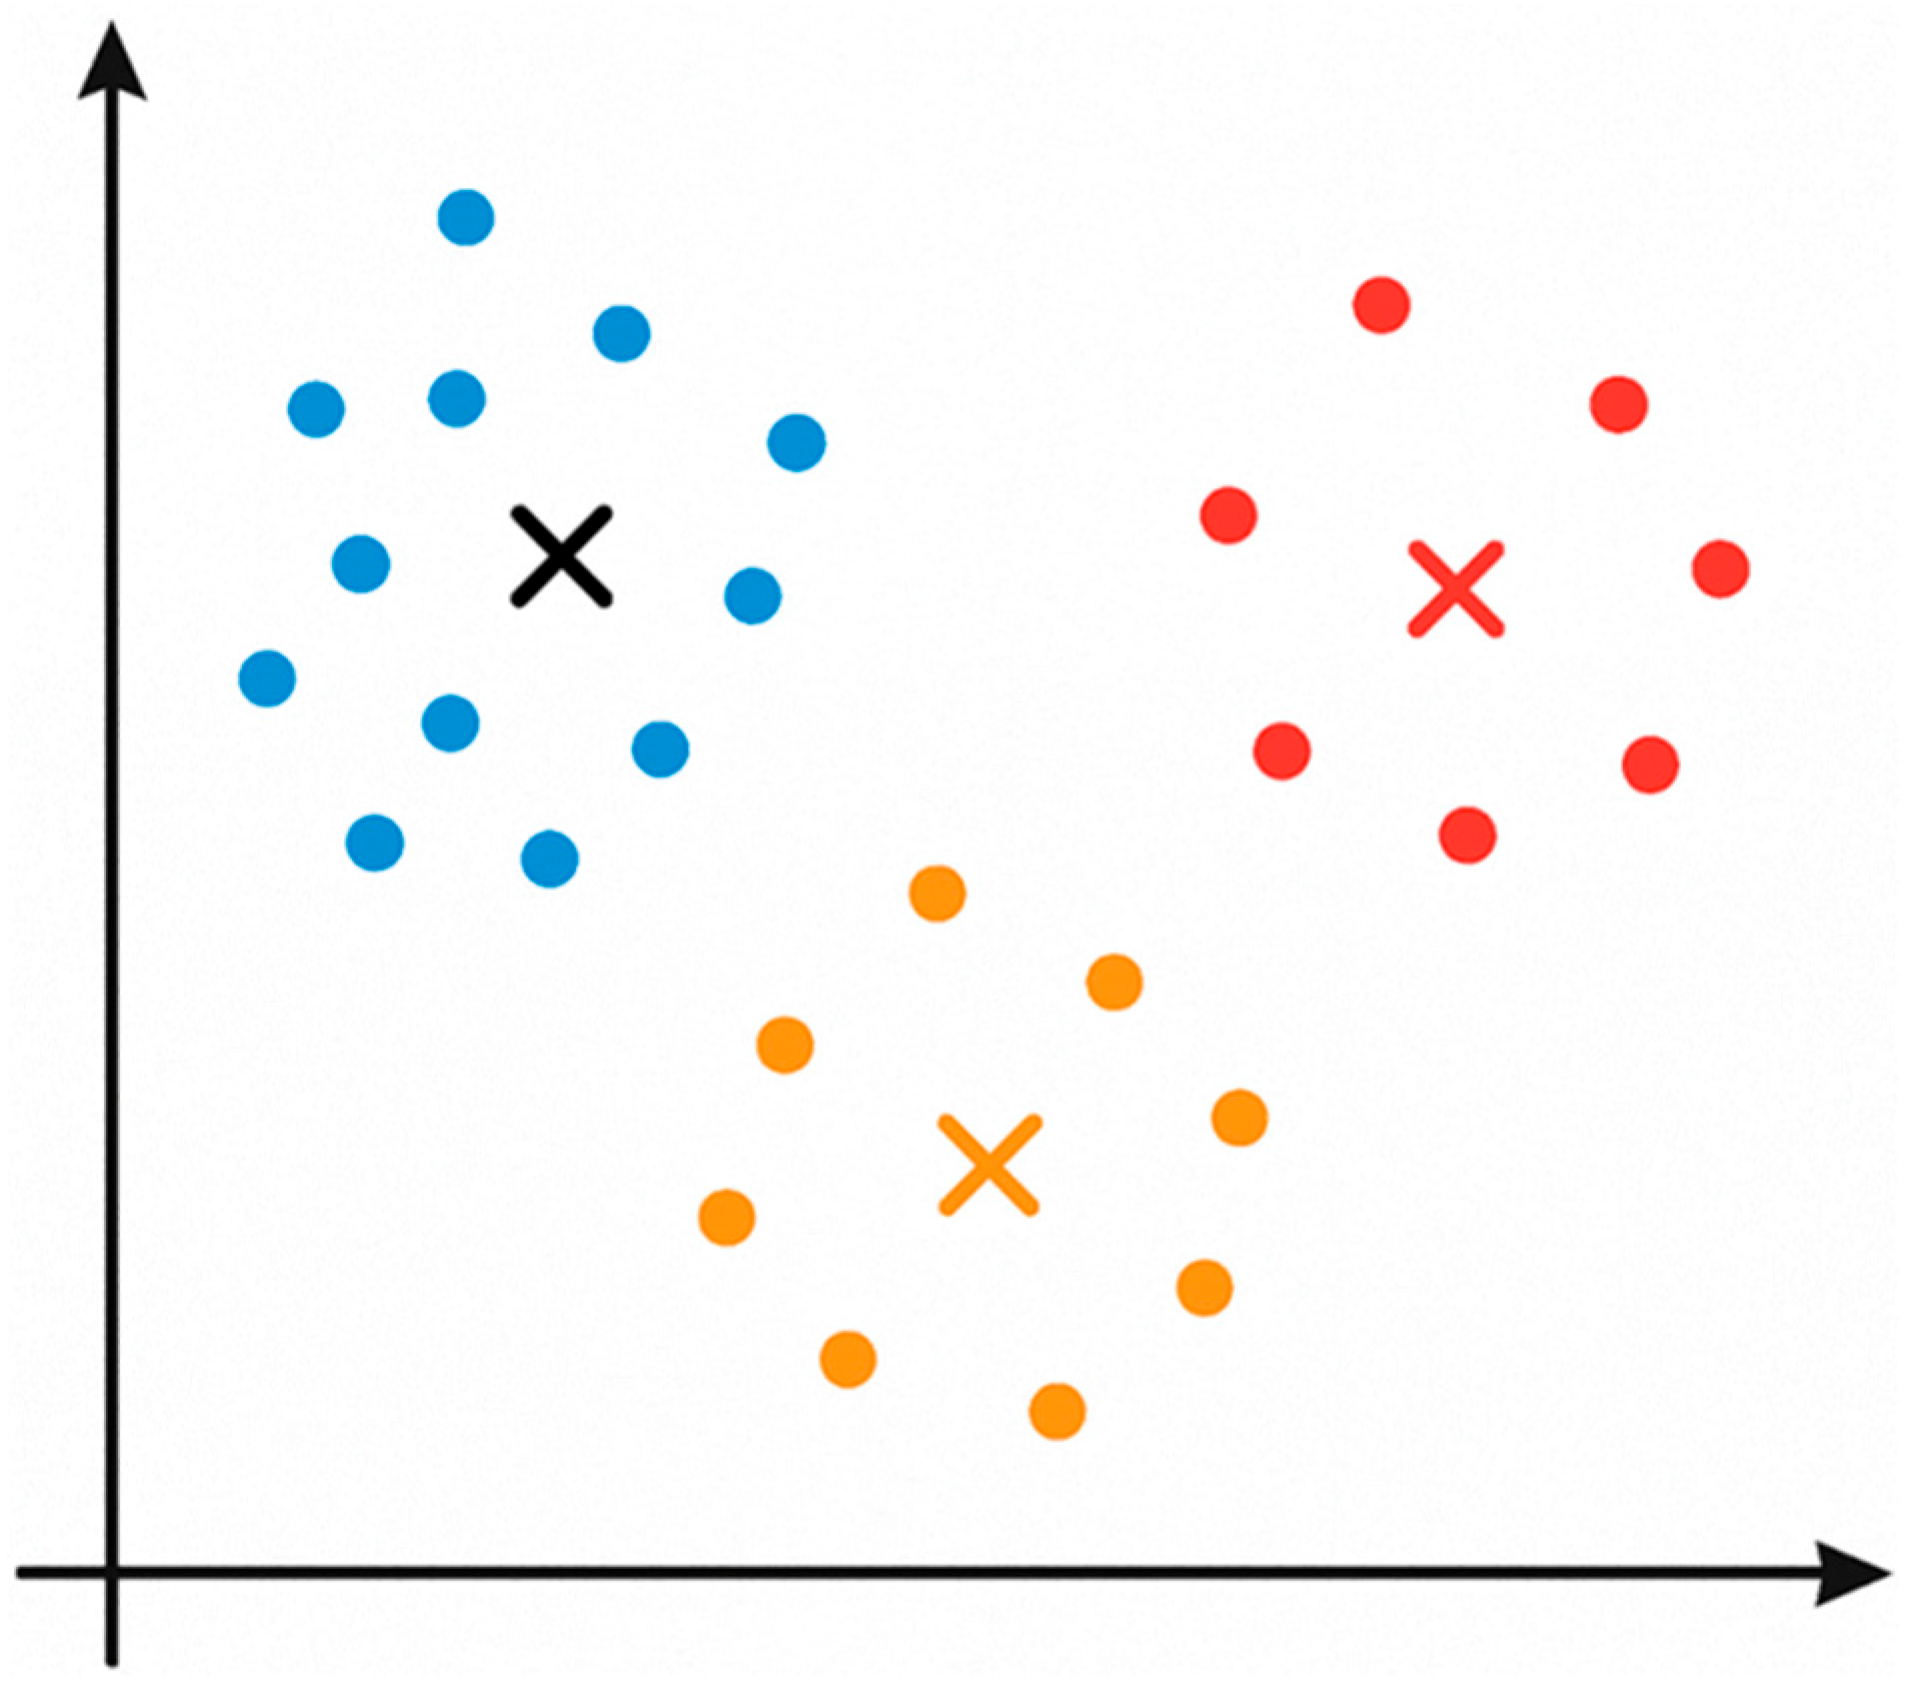
Clustering is the process of classifying and organizing data points in a dataset that are similar in some way (
Figure 6), a technique often referred to as unsupervised learning [
28]. The K-means is one of the well-known clustering algorithms, and its simplicity and efficiency make it the most widely used [
29,
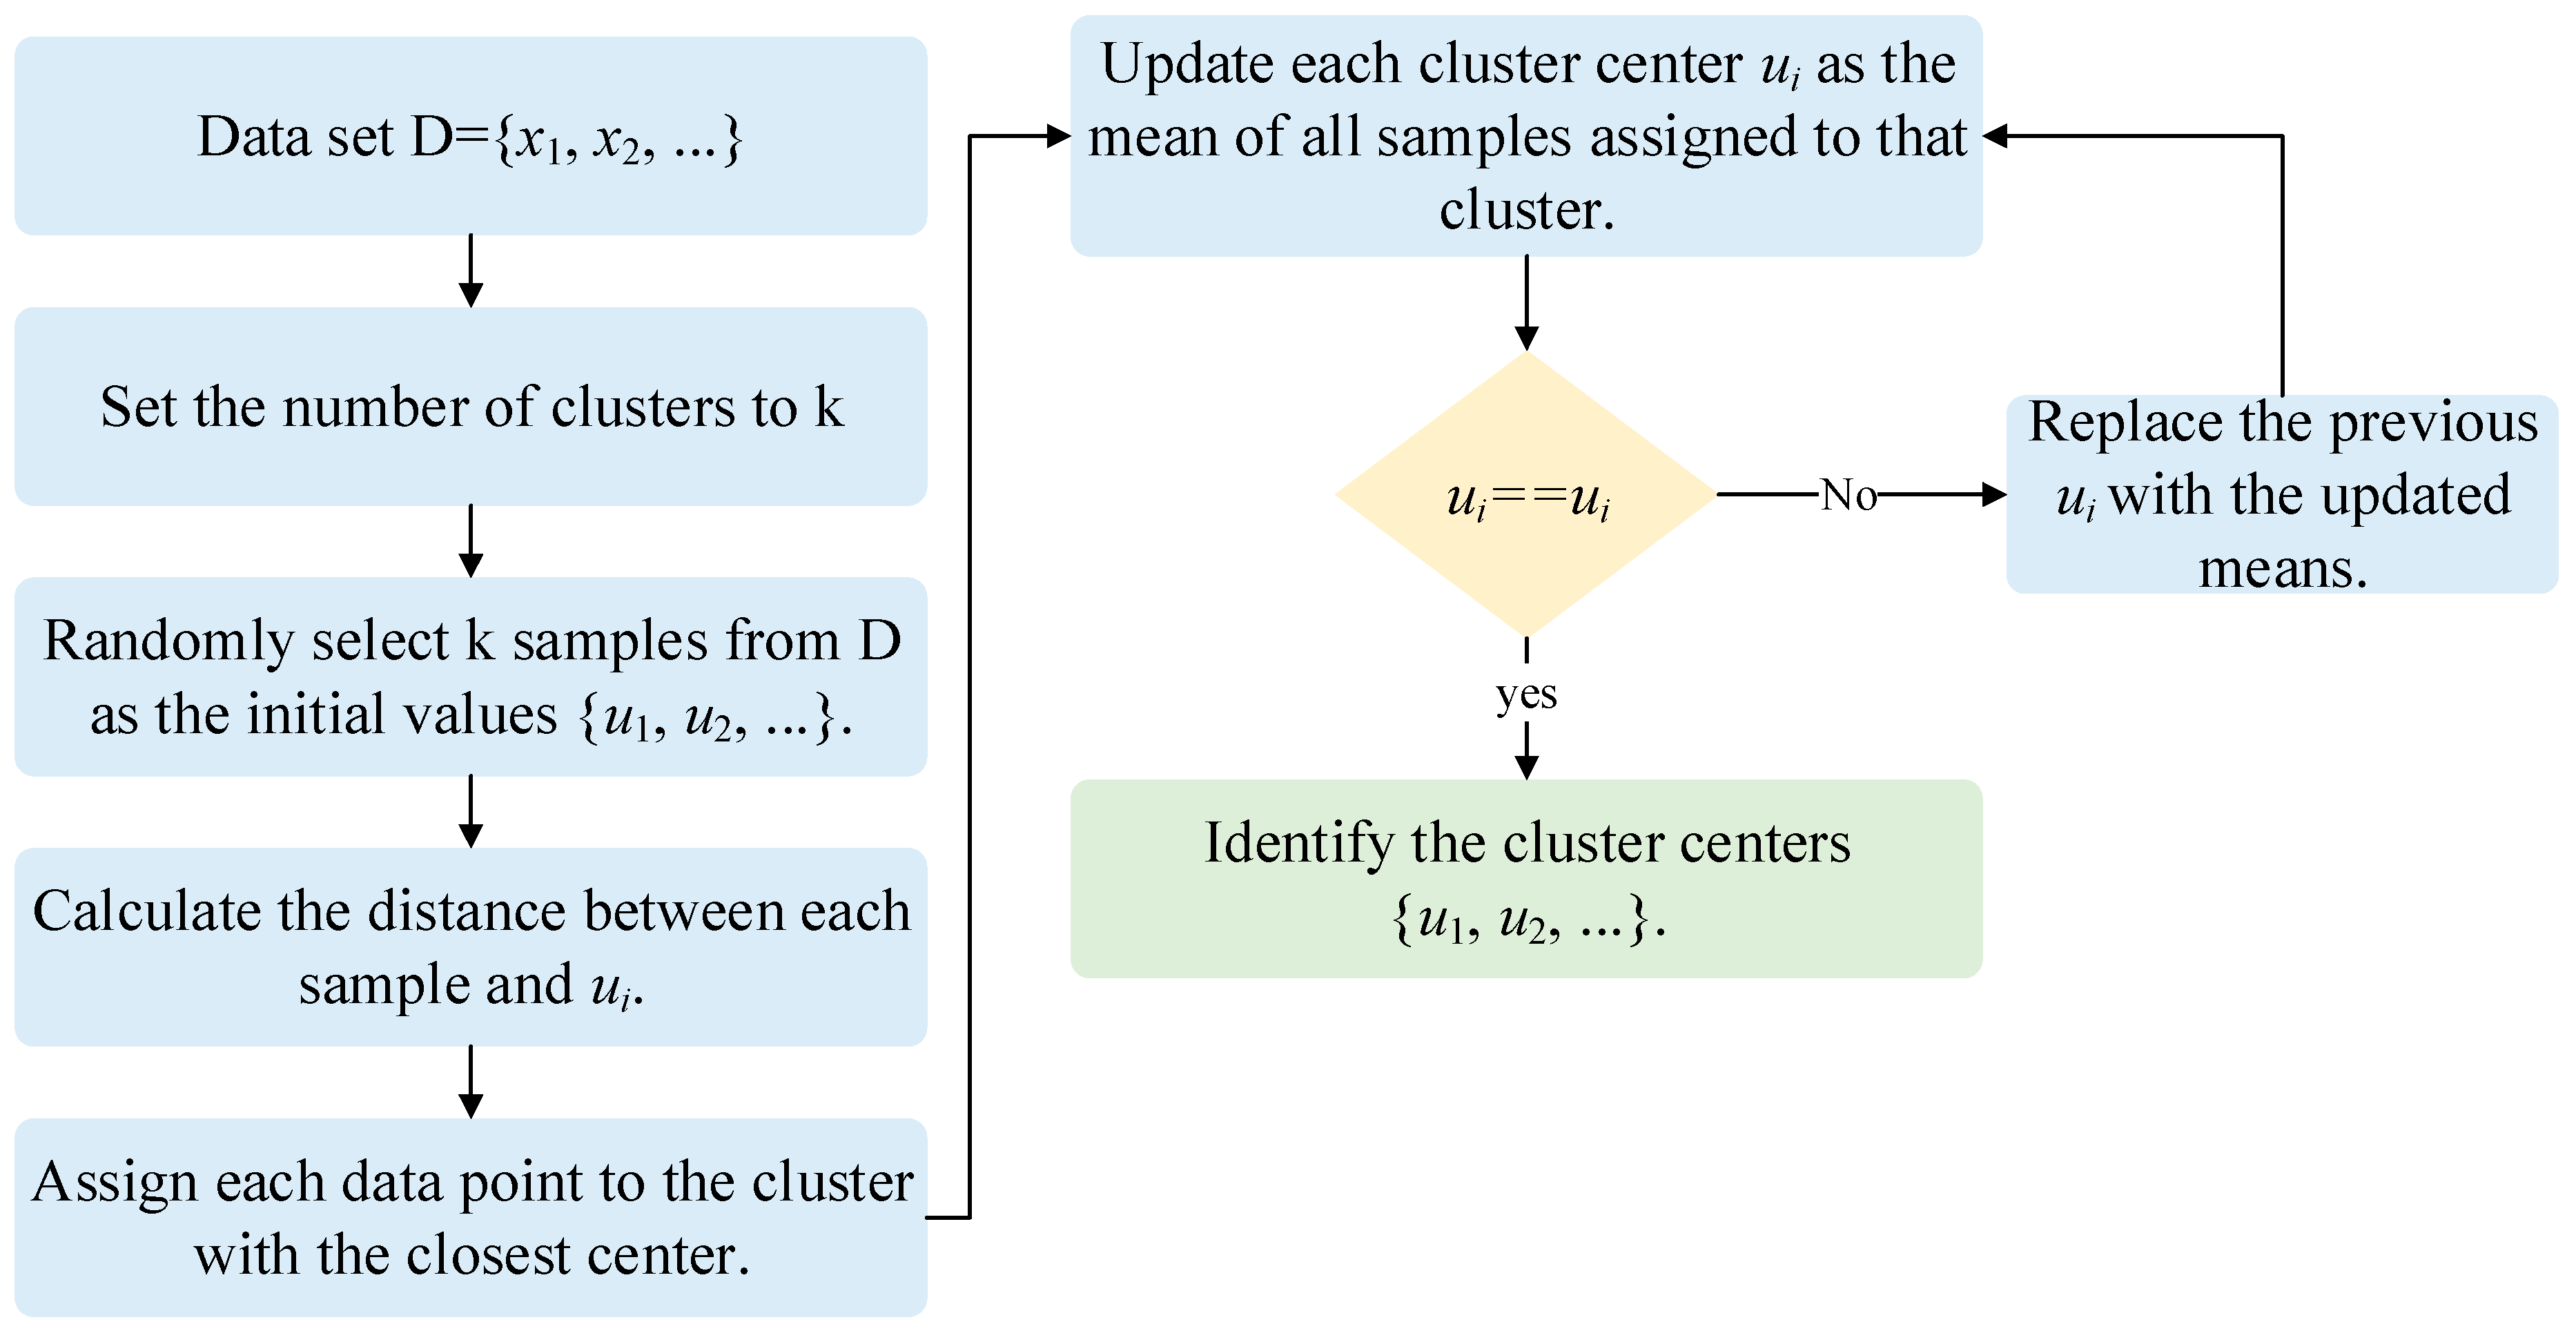
30]. In this study, the K-means algorithm was used to classify truck fuel consumption. In general, the K-means algorithm comprises five steps, as is shown in
Figure 7.
Specifically, in this study, the corresponding fuel consumption data under different IRIs is the dataset being classified, and the reasonableness of the classification results under a different number of classifications is tested and judged to derive a reasonable fuel consumption classification.
3. Case Study
3.1. Point Cloud Data Processing
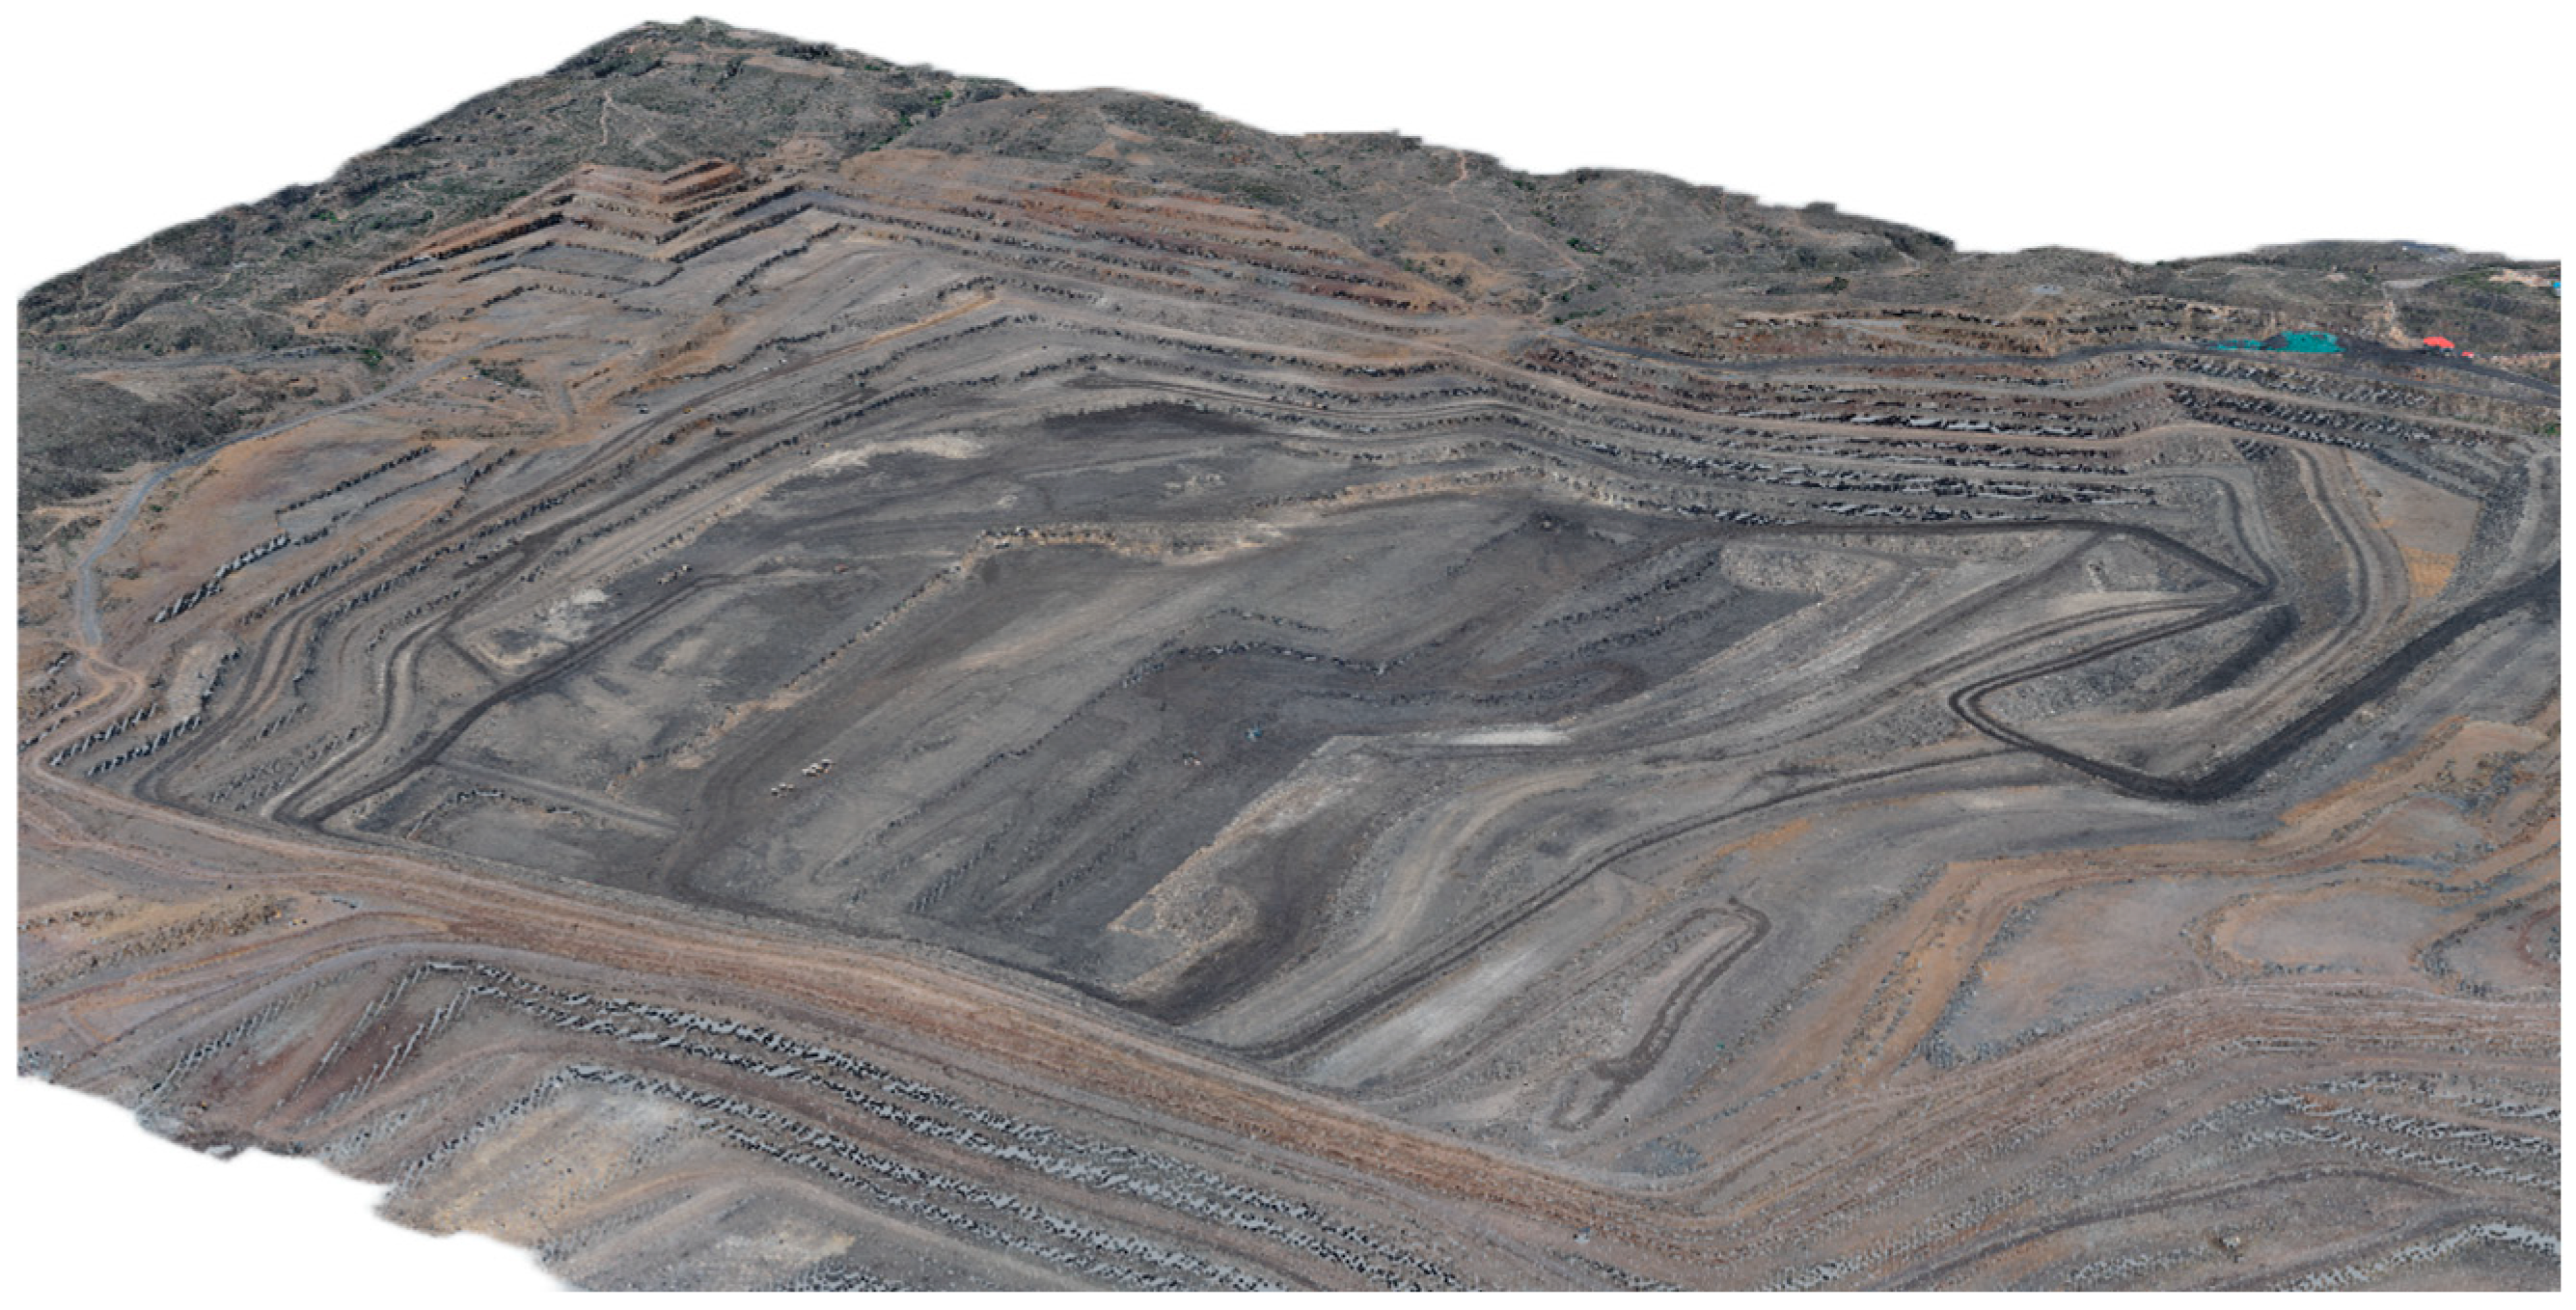
The subject of investigation for this study was the Haerwusu open-pit coal mine in China.
Figure 8 presents the point cloud model representing the mine. The point cloud model comprises 2,541,887 discrete data points. The coal deposits within the mine are primarily characterized by horizontal deposition, and the haulage roads predominantly follow near-horizontal roads.
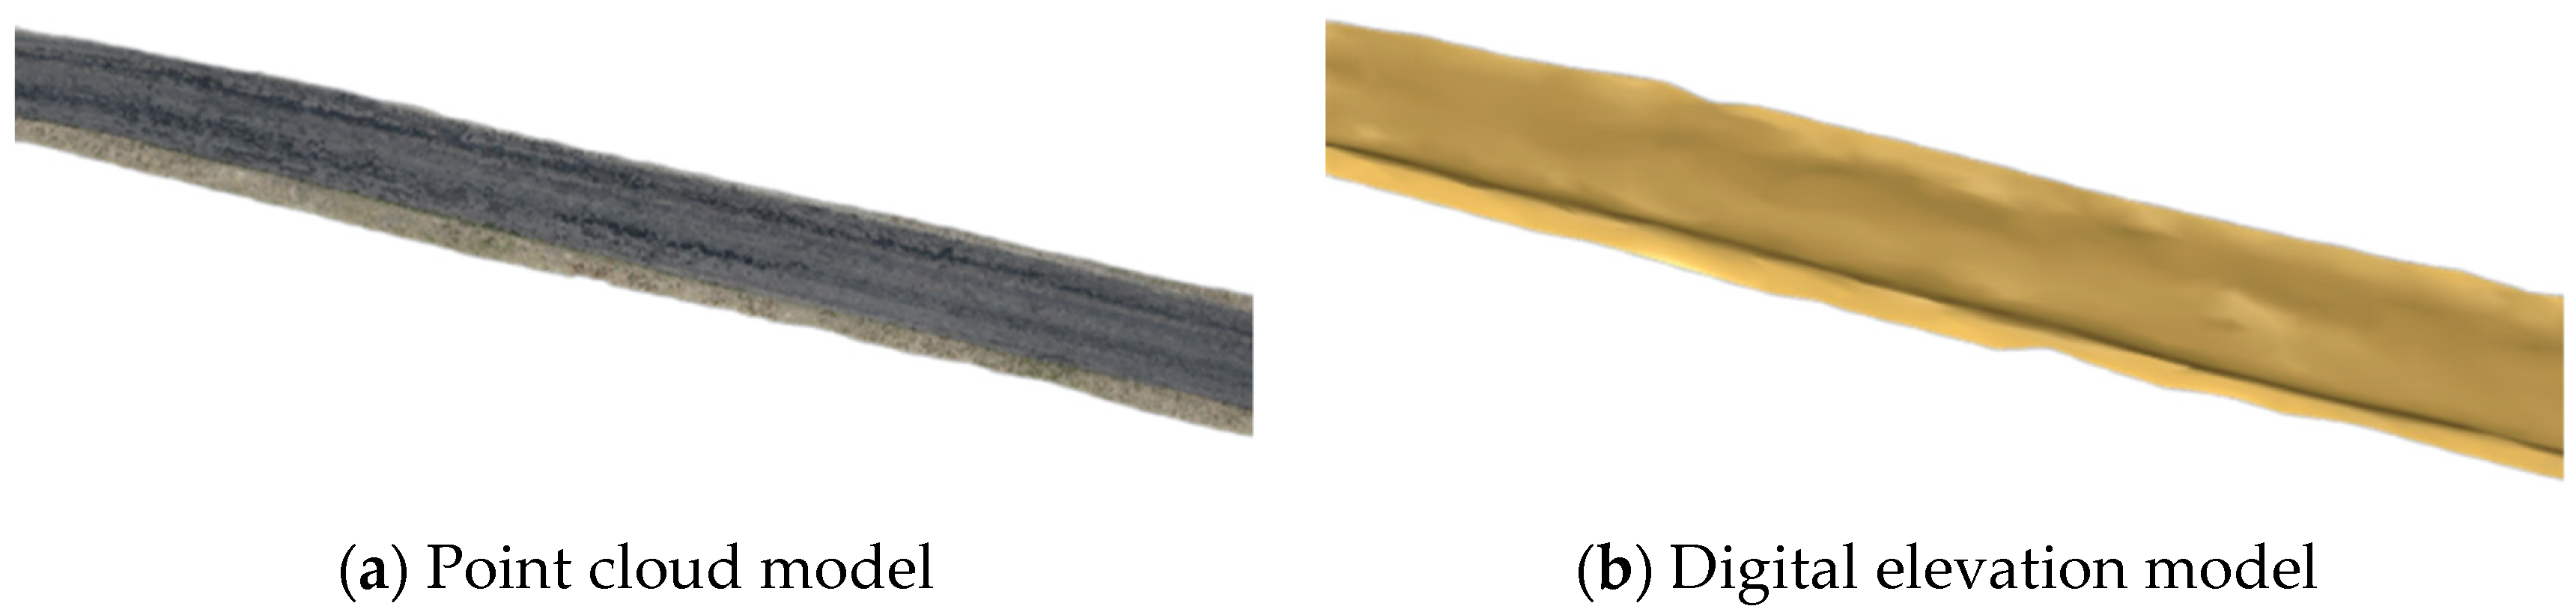
Part of the point cloud data of the road captured by the UAV is shown in
Figure 9a. The point cloud model is a filtered model with some erroneous points removed. The model is complete, but it is difficult to obtain continuous point cloud elevations with consistent length intervals because some points are filtered. Therefore, this study constructed a road DEM, as shown in
Figure 9b, based on the TIN (Triangulated Irregular Network) method, which is usually used for high-precision modeling of smaller areas [
31], which makes the discrete point cloud road model, into a continuous surface model, and facilitates the acquisition of the continuous elevation changes in the road.
3.2. IRI Calculation for Haul Roads
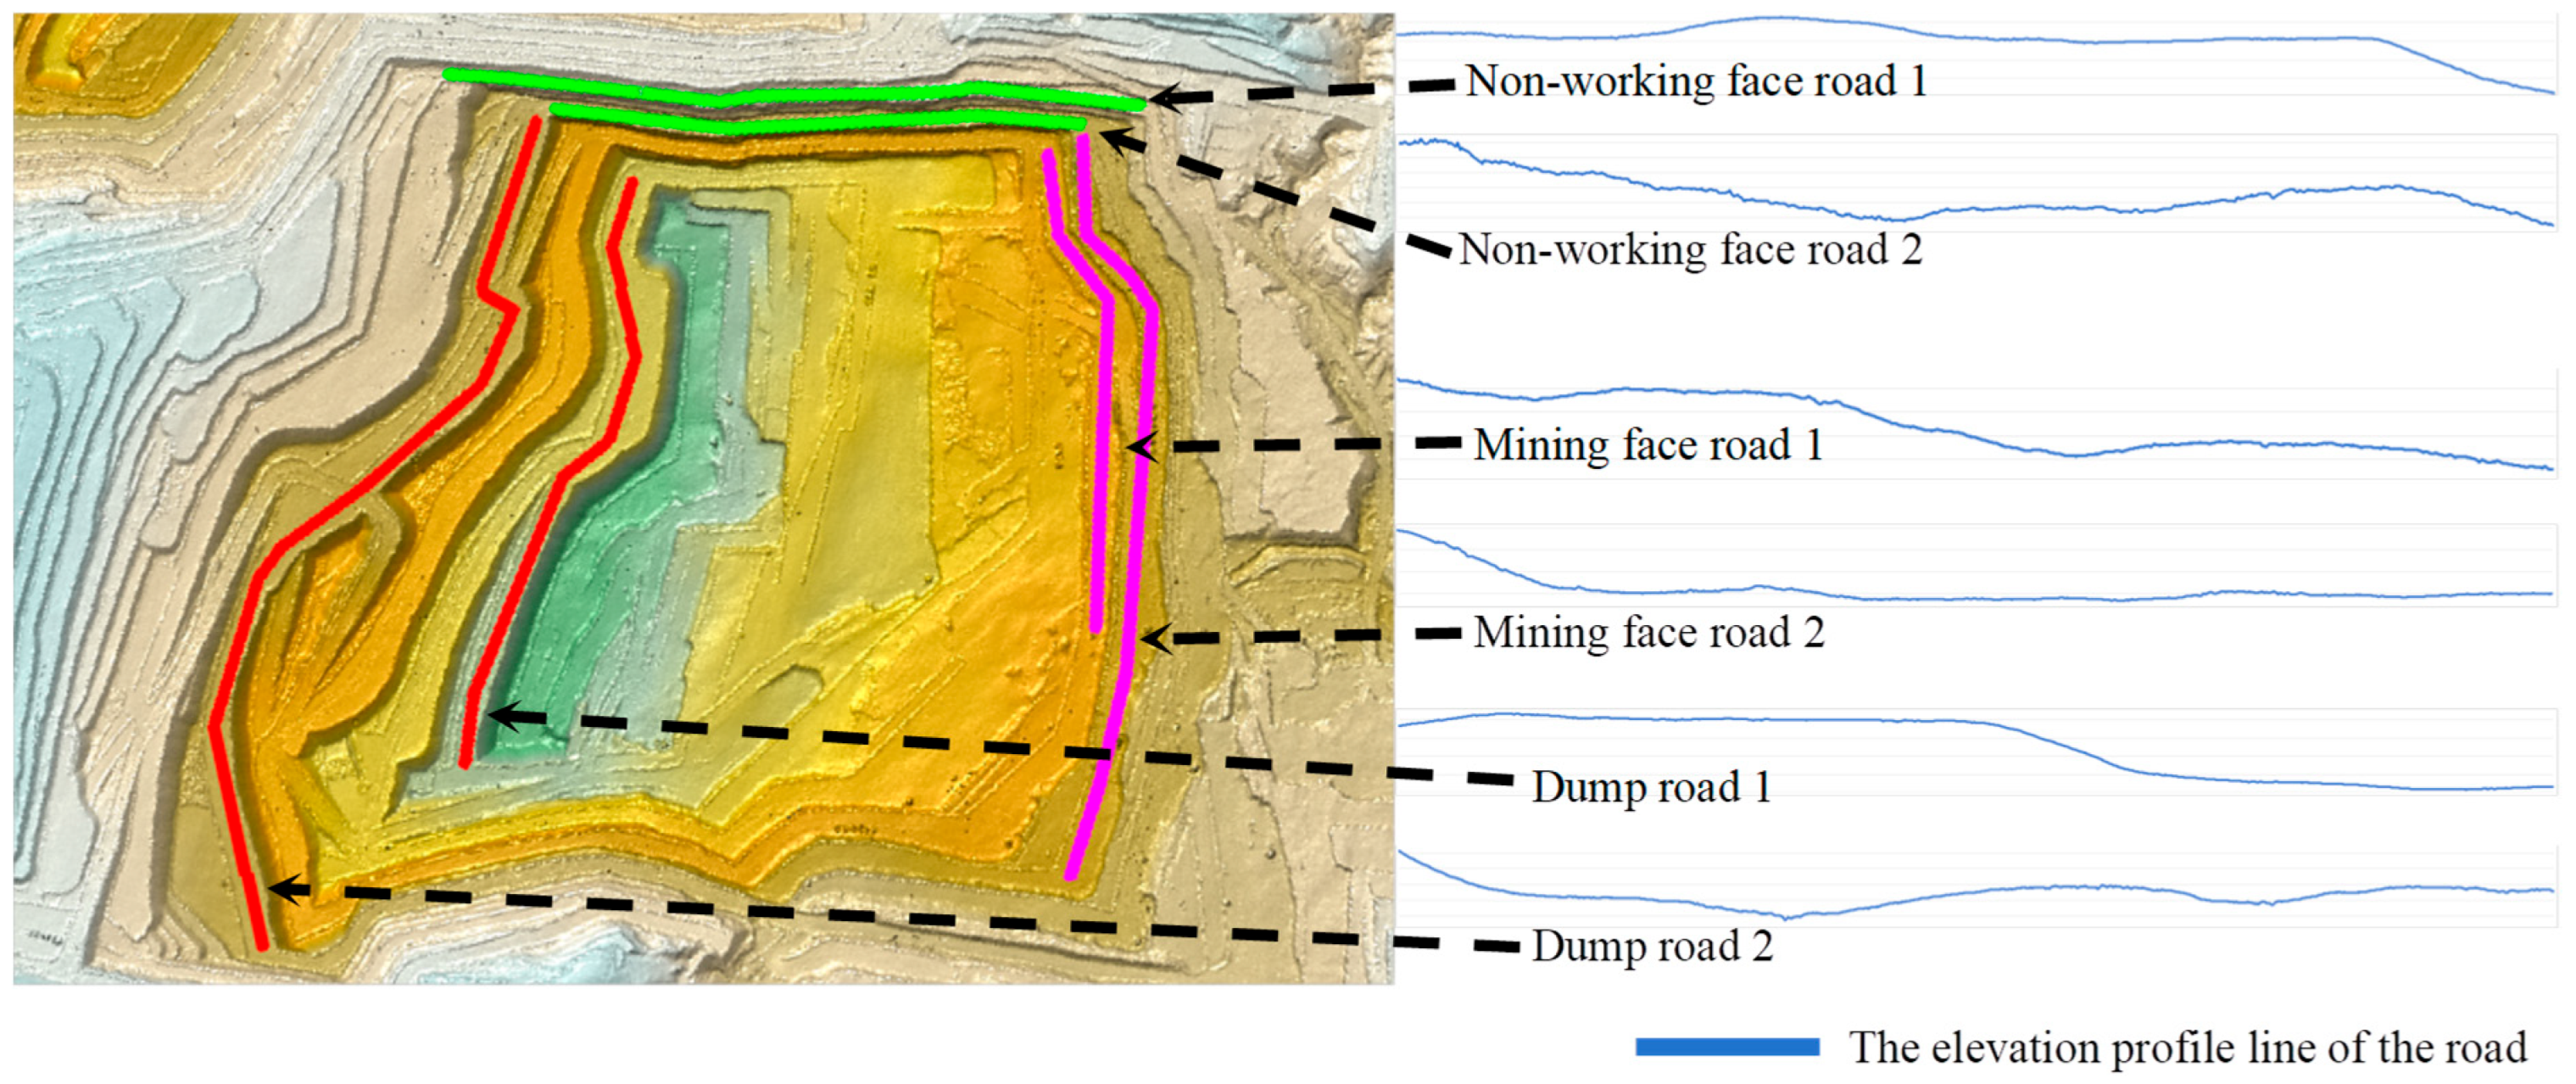
The determination of the IRI necessitates a thorough assessment of a road section, as per Equation (2). This process entails the division of the entire road into smaller sections at regular intervals. The choice of appropriate intervals significantly impacts the accuracy of IRI calculations. To ensure that the selected road intervals are representative of the majority of transport roads within open-pit mines, as illustrated in
Figure 10, this study examined two non-working roads, two mining face roads, and two dump roads from the pit. The objective was to analyze the distribution of IRIs across transport roads under different interval settings.
Typically, employing smaller statistical intervals yields more precise feedback on road roughness, whereas larger intervals result in less precise feedback. Notably, there are no specific regulations on this matter. The choice of interval size is typically adapted to the specific context or requirements. For example, in China’s current highway standards, a statistical interval of 100 m is commonly employed. In this study, the IRI values with different statistical intervals of 10 m, 20 m, 40 m, 50 m, 100 m, and 200 m were tested to determine the most appropriate statistical interval.
The statistical process was based on the Chinese 3DMine 2016 version software, a mining design software similar to Surpac developed by Beijing 3DMine Software Ltd. [
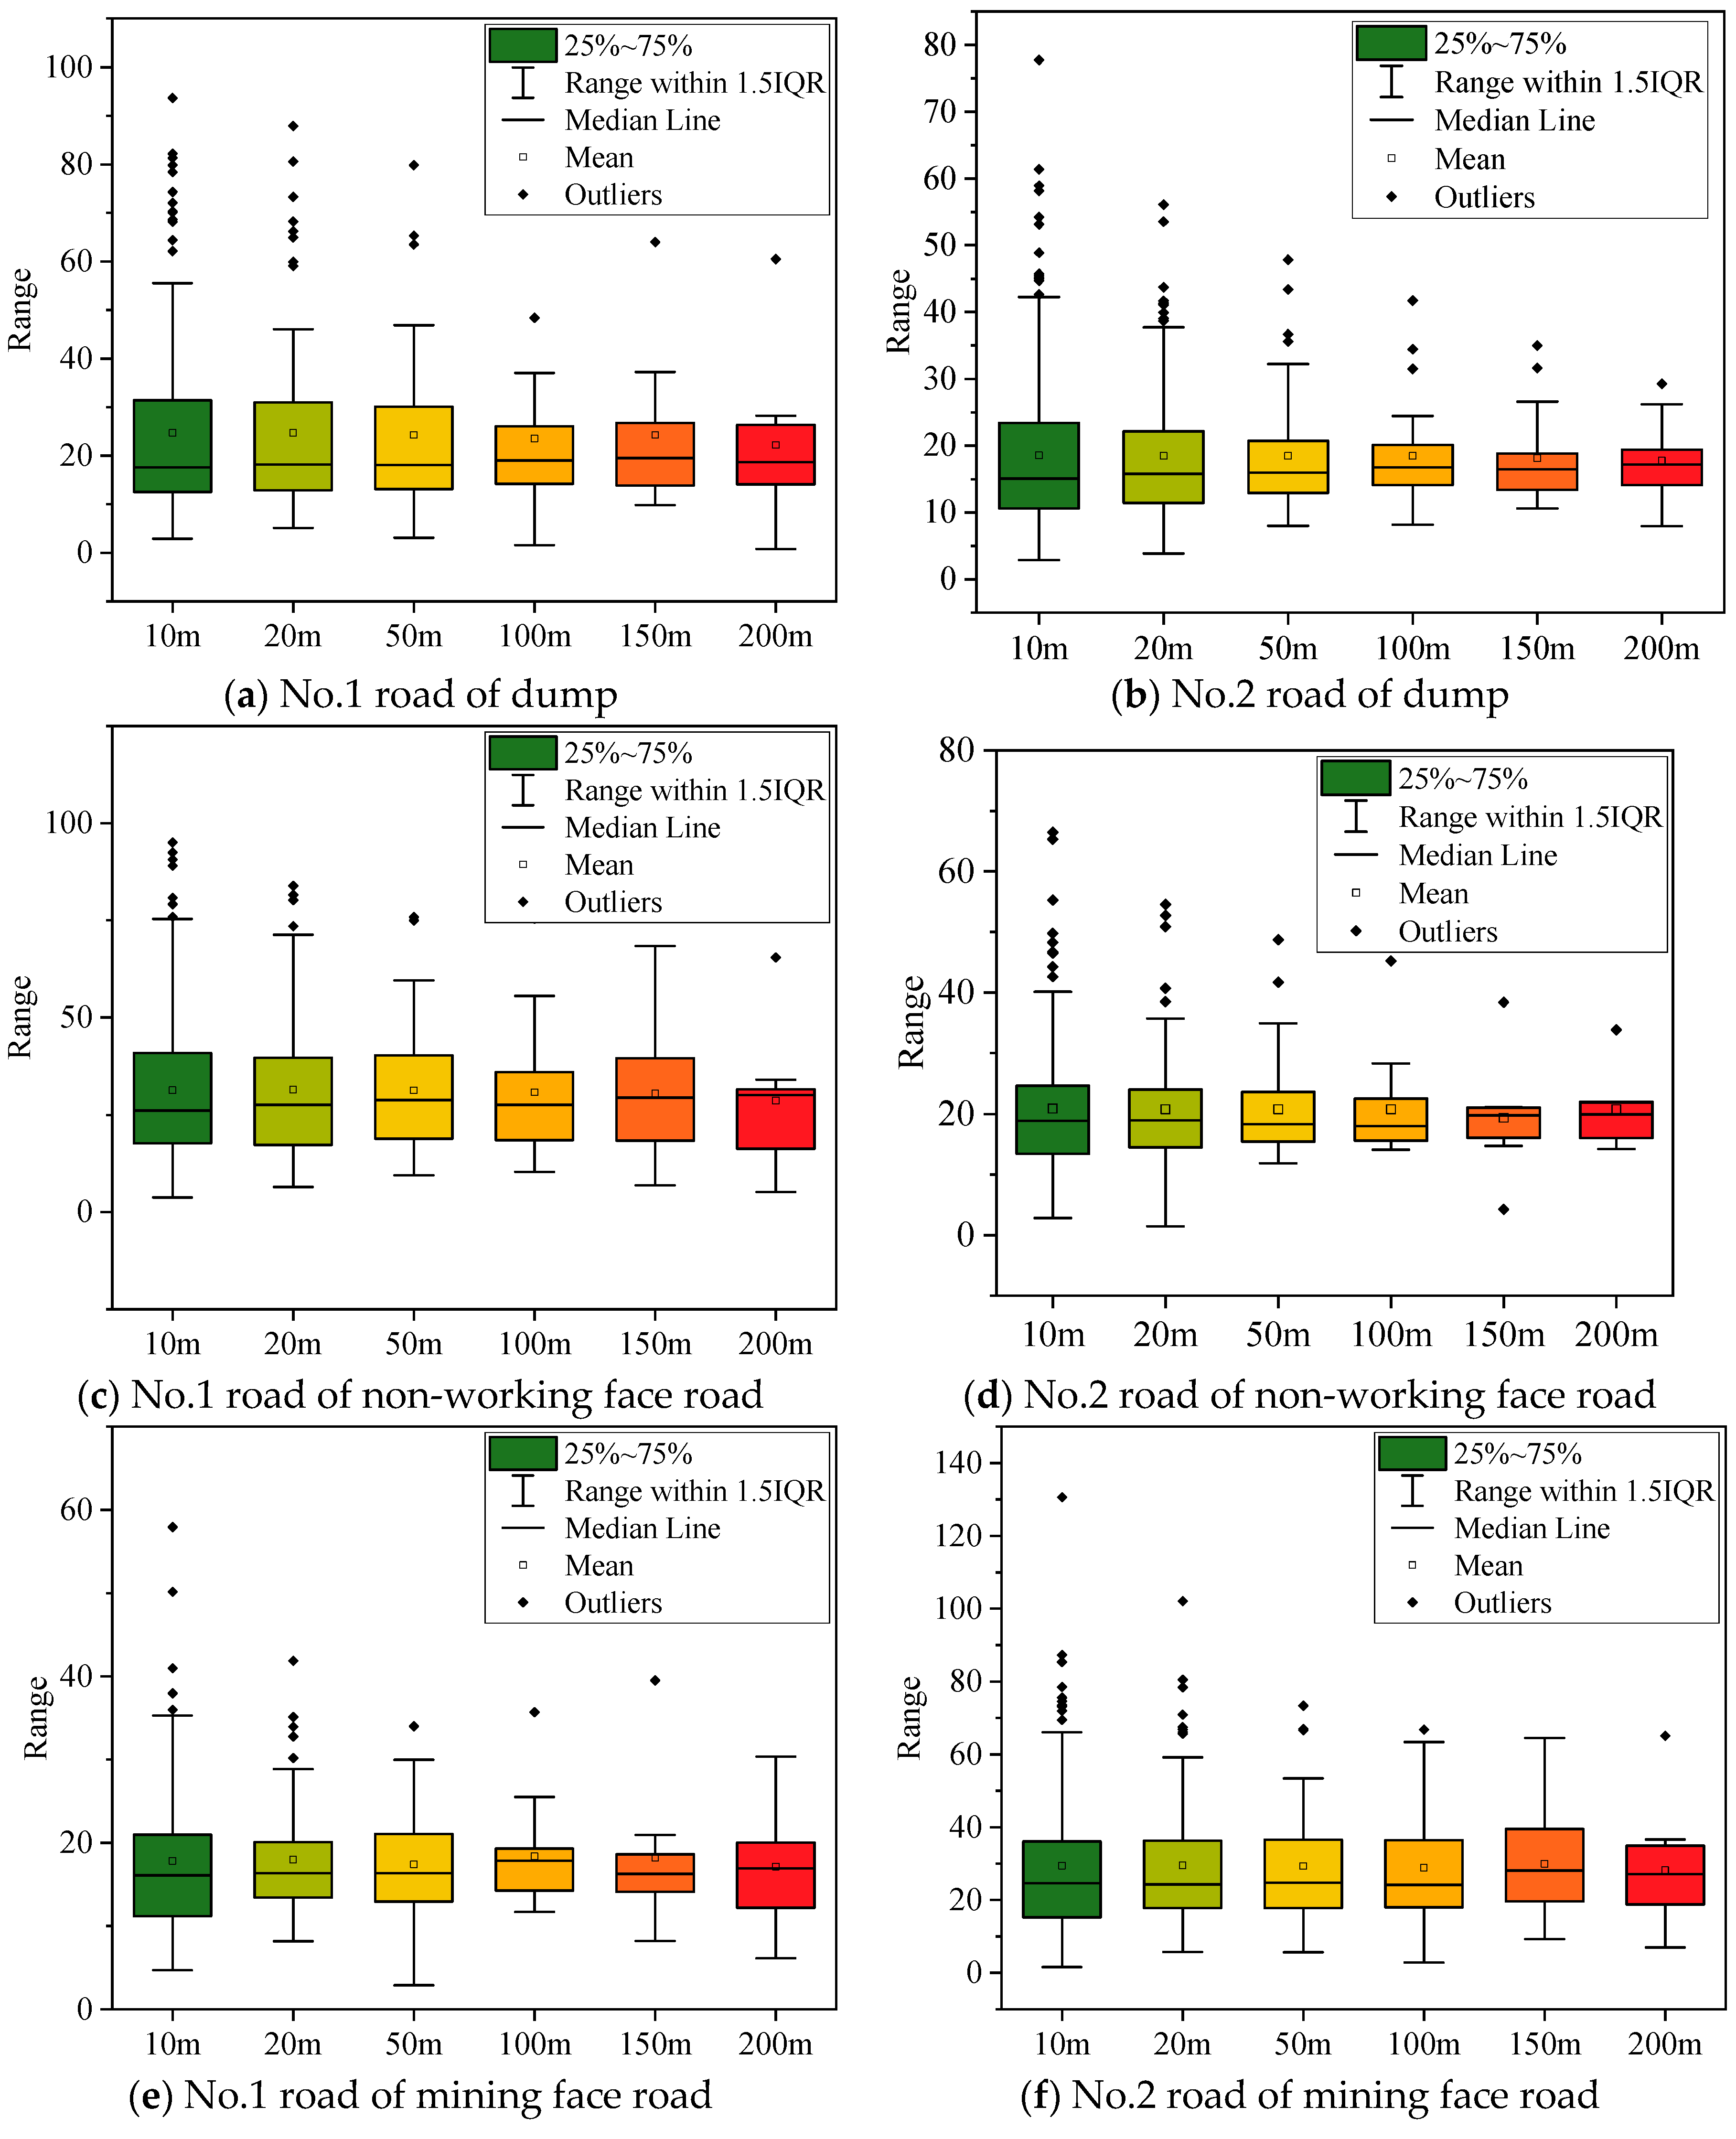
32]. Initially, the point cloud data provided by the mine was imported into the software, and a DEM was generated. Subsequently, the route within the selected road area was delineated at 1 m point intervals. In the final step, the elevation change curve of the road was obtained by mapping all the points along the line onto the DEM. The elevation of each point, representing the sampling point as described in Equation (2), was used for the calculation of the IRI. The statistical results for the six distinct road sections are visualized in
Figure 11.
In addition to reflecting the overall distribution of the data, the box plot can clearly display outliers within the dataset. As shown in
Figure 11, a considerable number of outliers are observed when the interval ranges between 10 and 50 m, indicating that the classification method at this stage fails to adequately represent the variations in road quality. When the interval is set to 200 m, the range of variation exhibits a statistically distinct pattern compared to intervals of 100 and 150 m, as illustrated in
Figure 11c,e,f, suggesting that intervals of 100 and 150 m are relatively reasonable. Comparing the 100 m and 150 m intervals, this study concludes that the larger interval is more practical for real-world applications. Therefore, a 150 m interval is ultimately selected as the statistical interval.
Certainly, it is important to emphasize that in actual practice, the interval derived from the above data analysis should only be considered as a reference. We still need to adjust it based on real-world feedback. However, this method offers a reliable experimental range for application, accelerating the process of determining the optimal interval.
3.3. Relationship Between Fuel Consumption and IRI
The unloaded and loaded status of the truck is also an important factor affecting fuel consumption, so the study investigated the relationship between fuel consumption and IRI under unloaded and loaded separately. Restricted by the mine’s prohibition of truck modification, the fuel consumption data obtained is the daily fuel consumption data of each truck in the dispatch system. However, as the Haerwusu open pit coal mine is a near-horizontal deposit, the main transport section in the cycle operation of trucks transporting rocks for loading, haulage, and dumping is the non-working face road, while the ramp accounts for a smaller proportion of the total transport.
Moreover, the truck dispatch system of the Haerwusu open-pit mine adopts a fixed allocation method, and most trucks have relatively fixed daily transport routes. Therefore, fuel is mainly consumed in the non-working face road. For this study, the horizontal part of the non-working face road is selected at a sampling interval of 150 m. And the average IRI of roads at 150 m sampling intervals was used to analyze the linear relationship with daily fuel consumption.
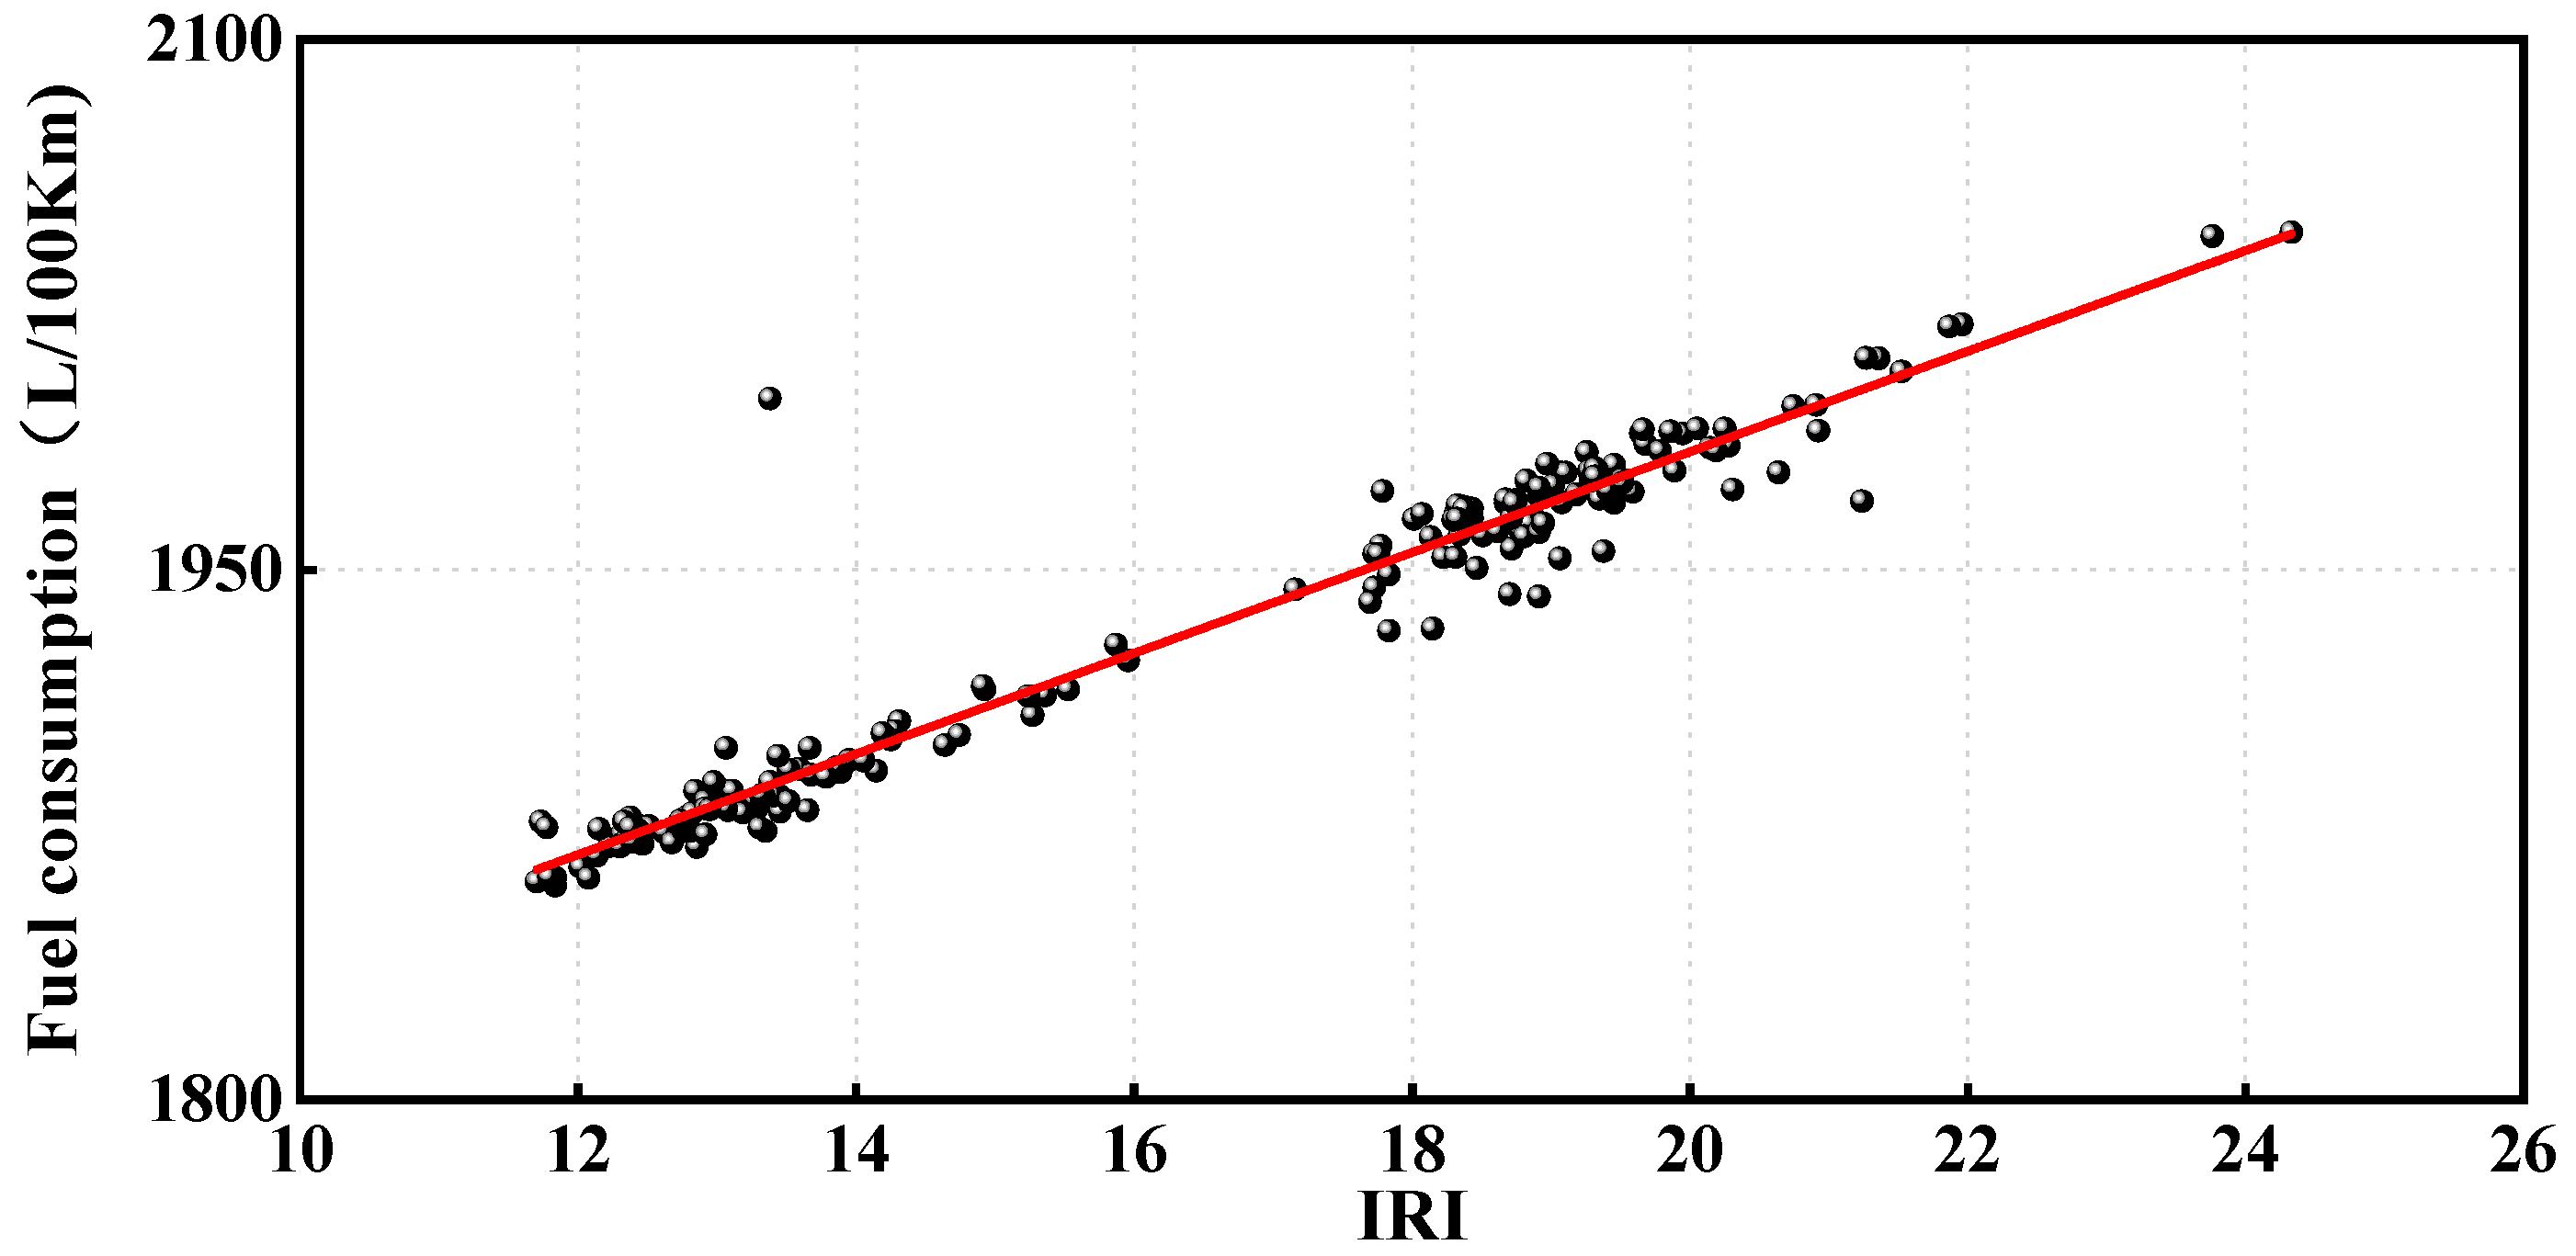
Based on the transport records in the truck dispatch system of the Haerwusu open pit coal mine, the transport routes of the trucks were obtained, and the specific trajectories of the trucks were determined in the DEM based on the positions recorded by GPS in order to calculate the IRI. The total number of data points is 188. The fitted relationship between the fuel consumption of the loaded trucks and the IRI is shown in
Figure 12.
As this subsection focuses on relatively smooth roads, the magnitude and distribution of IRI values are relatively small. Overall, a more obvious linear relationship and clustering phenomenon is shown.
With Q representing fuel consumption, the fitting equation is as follows:
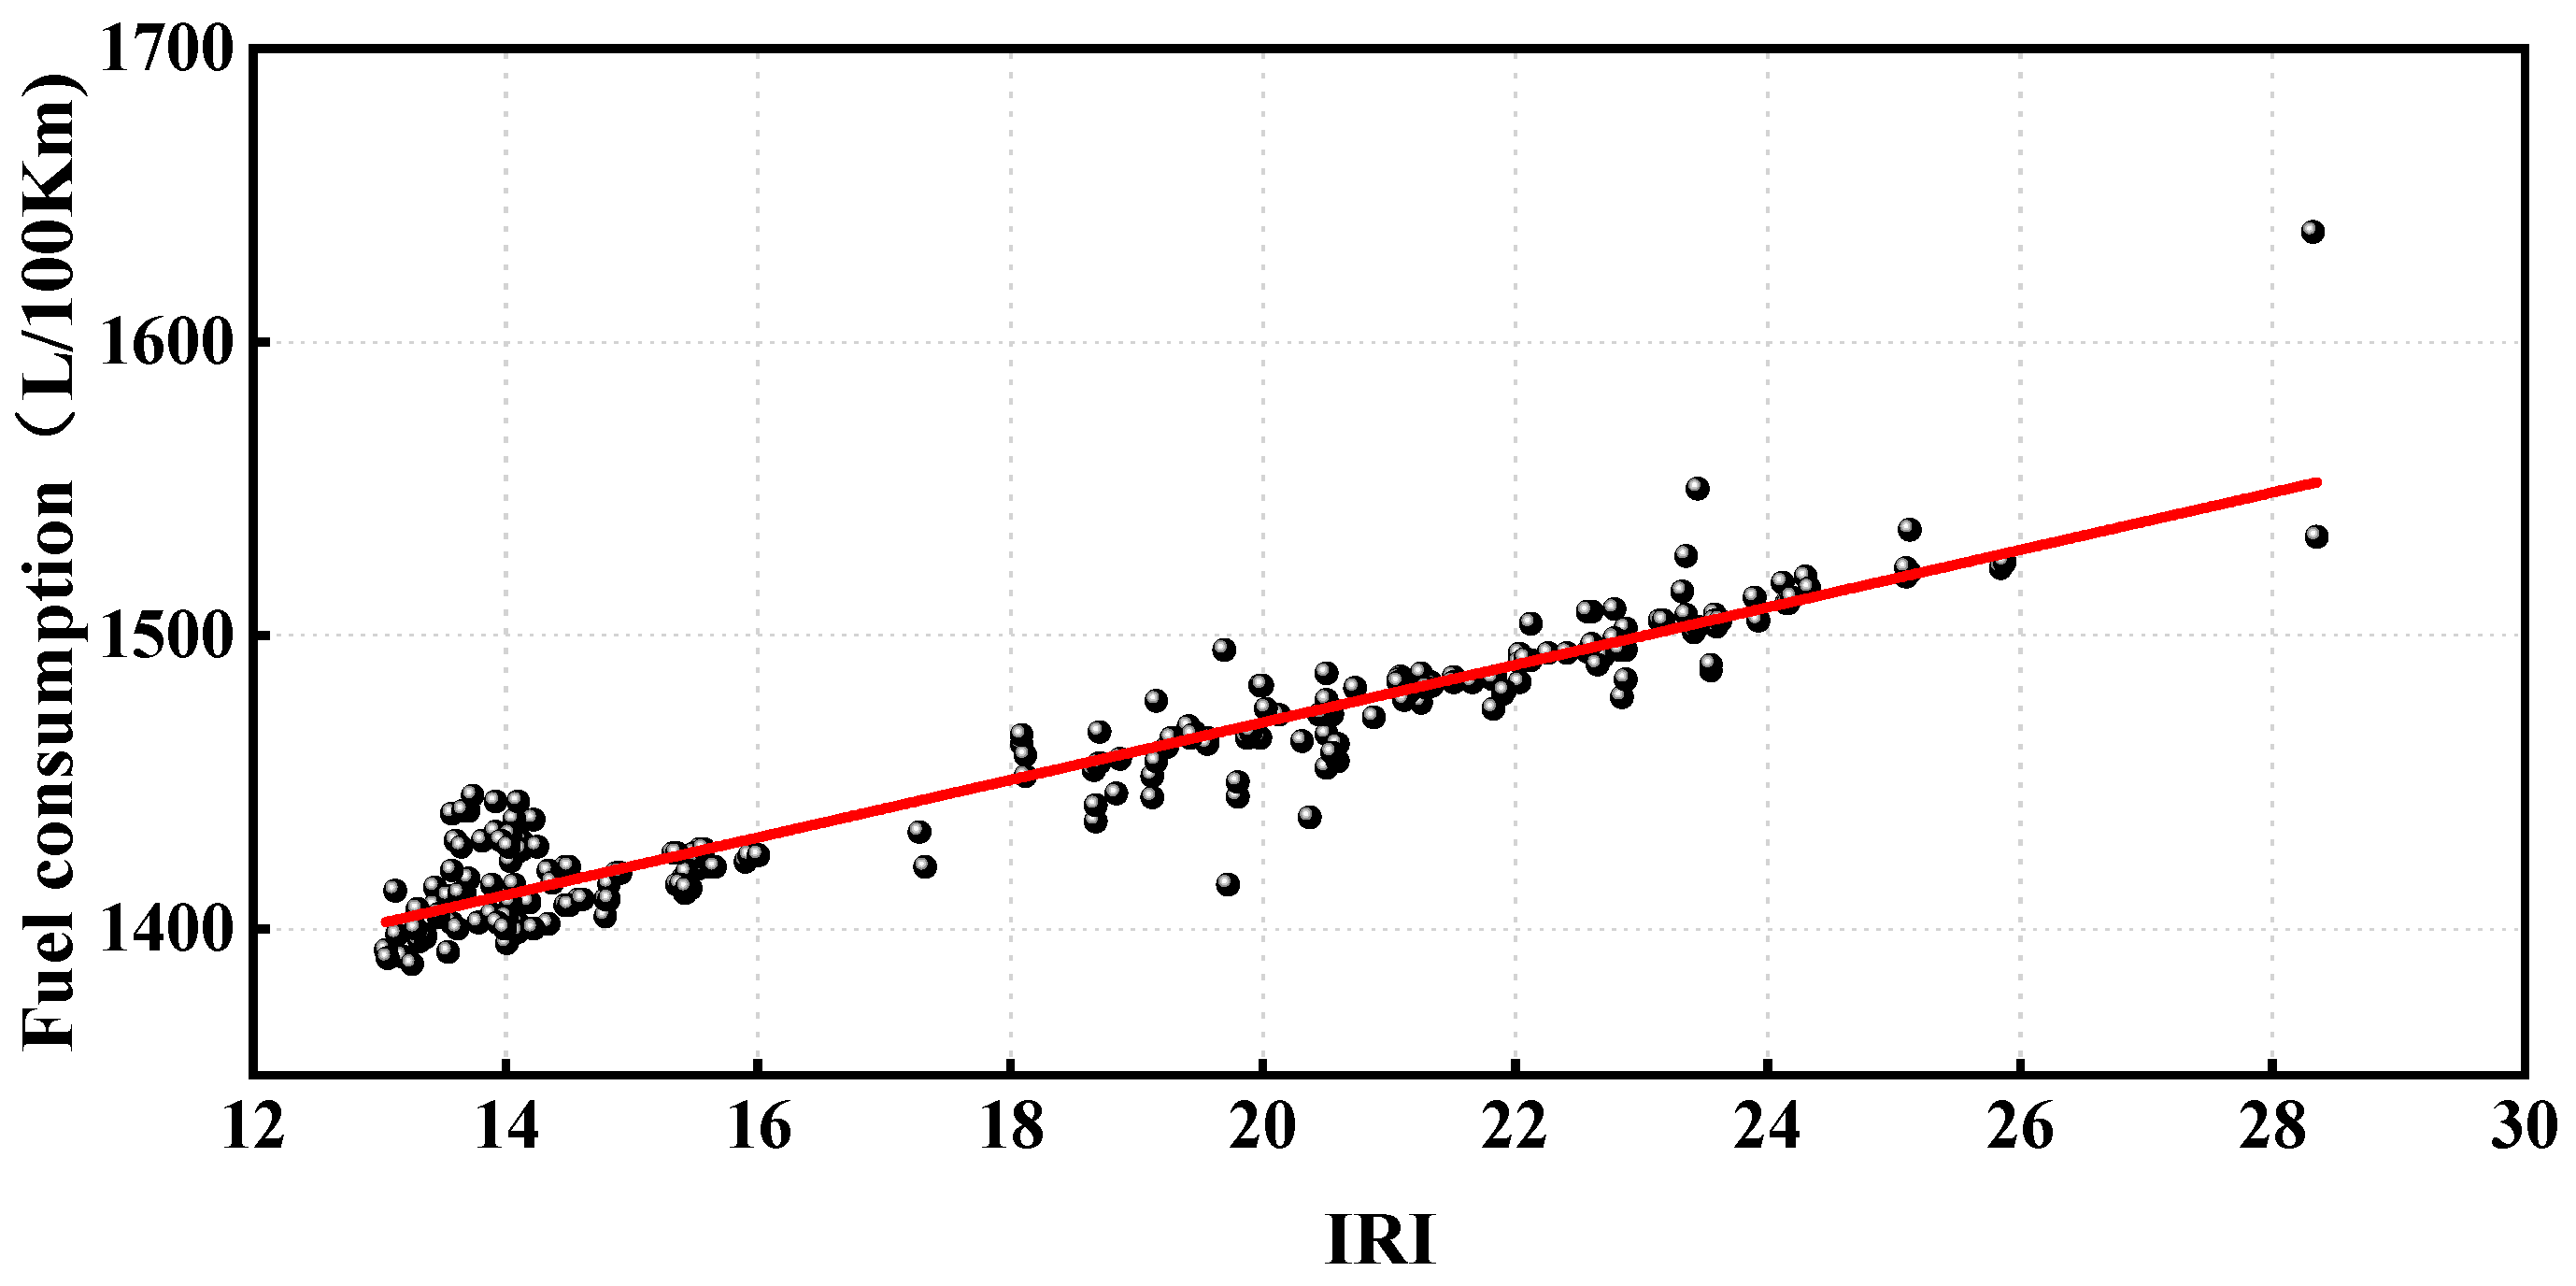
The results of the regression model show Pearson’s coefficient of 0.973, which indicates that the regression model has good fitting ability and can better reflect the relationship between the smoothness index of the truck trajectory line and the fuel consumption of loaded trucks. For unloaded trucks, as shown in
Figure 13, the total number of data points is 227, and the IRI value data are distributed between 12 and 28, and the regression results are shown in Equation (4), with a Pearson’s coefficient of 0.945, indicating a good fit.
4. Results and Discussion
4.1. Fuel-Efficient Road Classification
The classification of fuel-efficient roads is dependent on the classification of fuel consumption. To achieve this, the K-means classification method was initially employed to classify fuel consumption. Subsequently, the fuel consumption classification was utilized in conjunction with the linear relationship derived in the preceding subsection to determine the classification of road roughness, thereby establishing the classification of fuel-efficient roads. The categorization of fuel-efficient roads was executed separately for two scenarios: loaded trucks and unloaded trucks.
4.1.1. Loaded Trucks
The clustering method of K-means requires the specification of the number of classes, and the study tested the clustering when the number of clusters was 3, 4, and 5 based on a linear relationship, as shown in
Table 1. The further distance between classes and the closer intra-class distance indicates better classification. The best classification was achieved with a clustering number of three. All other clustering numbers showed too close intra-class distances at different classifications. Therefore, the fuel consumption data was categorized into three levels: fuel-efficient, moderate, and fuel-intensive. The corresponding results are presented in
Table 2.
Substituting the node values 1868 and 1978 into Equation (3) yields the classification of fuel-efficient roads for loaded trucks, as demonstrated in
Table 3.
4.1.2. Unloaded Trucks
The calculation process for unloaded trucks remains consistent. Likewise, as depicted in
Table 4, for cluster numbers 4 and 5, the inter-class distances are close, with cluster number 3 emerging as the optimal choice. The results of the fuel consumption classification for unloaded trucks are shown in
Table 5. Substituting the values 1420 and 1470 into Equation (4) produces a classification of fuel-efficient roads, presented in
Table 6.
When comparing the classification of unloaded trucks with that of loaded trucks, it becomes evident that unloaded trucks exhibit a slightly higher IRI requirement for roads categorized as “good”. The result aligns with the principle that the heavier the truck, the higher the road quality requirements. This indicates that the above findings are consistent with objective reality and possess a certain degree of reliability.
4.2. Economic Analysis and Discussion of Road Classification
The primary objective of road classification is to enhance the economic efficiency of truck transportation by reducing fuel consumption. To analyze the economic benefits of the proposed fuel-efficient road classification method, two additional haul roads in the Haerwusu open-pit coal mine were selected (
Figure 9). Two roads with relatively smooth southern benches were chosen for the case study. The testing involved measuring the IRI of these two roads in segments at 150 m intervals, and the relevant road selections and statistical data are presented in
Figure 14. For both loaded and unloaded trucks, the selected roads were evenly distributed between “medium” and “poor” quality roads, with only a limited number of “good” quality roads.
The fuel price was calculated as CNY/L 7.4. Fuel costs were calculated for every 150 m road interval. The IRI values calculated every 150m for the two road sections, the unit fuel consumption computed according to Equations (3) and (4), and the total fuel costs of the roads are shown in
Table 7. The findings show that loaded trucks incur a cost of CNY 420.05, while unloaded trucks cost CNY 311.26.
For comparison, if the road quality of the two sections is upgraded from poor to medium, the fuel costs for trucks under loaded and unloaded conditions would decrease to 407.57 CNY and 305.44 CNY, respectively. For loaded trucks, the medium-quality upgraded road adopts an intermediate IRI value of 16, while for unloaded trucks, the IRI is set at 18. The computed fuel costs following road quality upgraded are presented in
Table 8, The highlighted sections represent the road segments where the quality was improved from poor to medium. The results demonstrate that the fuel costs for loaded and unloaded conditions decreased to CNY 407.57 and CNY 305.44, respectively, representing cost savings of 3% and 2%.
Therefore, it is evident that large open-pit coal mines could potentially save millions of CNY by constructing roads in compliance with the established fuel-efficient roads standard. Furthermore, enhancing road quality can lead to reduced vehicle maintenance costs, such as those associated with tires.
5. Conclusions
Road quality is a critical factor affecting truck transportation efficiency and costs in open-pit coal mines. Currently, road quality assessment in such mines relies primarily on driver feedback. This study proposes an innovative fuel-efficient road classification method, quantifying the relationship between road quality and truck fuel consumption. The findings provide a systematic approach for evaluating and constructing haul roads in open-pit coal mines, offering both economic and operational benefits. To elaborate, the proposed methodology initiated with the acquisition of an overall point cloud model of the mining site using a UAV. Subsequently, this point cloud model undergoes conversion into a DEM. The mine design software 3DMINE was then deployed to capture road roughness sampling points at 1 m intervals. The ensuing stage encompasses the substitution of these sampling points into the IRI model, facilitating the determination of appropriate road division intervals. This is followed by the establishment of a linear relationship between fuel consumption and IRI through regression analysis. Finally, the k-means algorithm was used to classify the fuel consumption, with the intervening nodes integrated into the linear relationship. This ultimately led to the classification of IRI, culminating in the categorization of road types as fuel-efficient.
This study takes the Haerwusu Open-Pit Coal Mine as a case study, selecting two haul roads each from the mining area, dump site, and non-working area to establish road classifications. The results IRI values of 12 and 20 serve as thresholds for classifying poor, moderate, and good roads under loaded truck conditions, while thresholds of 15 and 21 are identified for unloaded truck operations. To evaluate the economic impact of road classification, two additional haul roads in the Haerwusu Open-Pit Coal Mine were selected for comparative analysis. The results demonstrate that the fuel costs for loaded and unloaded conditions decreased to 407.57 CNY and 305.44 CNY, respectively, representing cost savings of 3% and 2%.
This research contributes to sustainable mining by offering valuable scientific insights into the utilization of UAVs for the monitoring and management of mine roads, thus enhancing operational efficiency and reducing environmental impact. Nonetheless, the current study presents certain limitations that pave the way for future research endeavors. The investigation focused on relatively horizontal roads, which may have limited practical applicability to mine ramps. Additionally, the lack of detailed fuel consumption monitoring data constituted a key limiting factor preventing the study’s extension to cover ramp scenarios. Future research efforts should place a priority on improving fuel monitoring equipment to capture more comprehensive fuel data and facilitate a more detailed classification of mine roads.
Author Contributions
Conceptualization, B.L. and W.Z.; data curation, B.L. and Z.H.; investigation, Z.A. and Z.H.; methodology, B.L. and Z.H.; resources, W.Z.; visualization, Z.A. and Z.H.; writing—original draft, B.L. and Y.X.; writing—review and editing, B.L. All authors have read and agreed to the published version of the manuscript.
Funding
This research was supported by the “Fundamental Research Funds for the Central Universities (2024QN11004)”.
Institutional Review Board Statement
Not applicable.
Informed Consent Statement
Not applicable.
Data Availability Statement
Mine data are confidential and not available to the public, but are available from the corresponding author on reasonable request.
Acknowledgments
The authors thank the Haerwusu Open-pit Coal Mine for providing a research base for this paper.
Conflicts of Interest
The authors declare no conflicts of interest.
References
- Baek, J.; Choi, Y. A new method for haul road design in open-pit mines to support efficient truck haulage operations. Appl. Sci. 2017, 7, 747. [Google Scholar] [CrossRef]
- Choi, Y.; Park, H.D.; Sunwoo, C.; Clarke, K.C. Multi-criteria evaluation and least-cost path analysis for optimal haulage routing of dump trucks in large scale open pit mines. Int. J. Geogr. Inf. Sci. 2009, 23, 1541–1567. [Google Scholar] [CrossRef]
- Nehring, M.; Knights, P.F.; Kizil, M.S.; Hay, E. A comparison of strategic mine planning approaches for in-pit crushing and conveying, and truck/shovel systems. Int. J. Min. Sci. Technol. 2018, 28, 205–214. [Google Scholar] [CrossRef]
- Purhamadani, E.; Bagherpour, R.; Tudeshki, H. Energy consumption in open-pit mining operations relying on reduced energy consumption for haulage using in-pit crusher systems. J. Clean. Prod. 2021, 291, 125228. [Google Scholar] [CrossRef]
- Tadubana, G.K. Prediction of Fuel Consumption of Haulage Trucks in Open Pit Mines. Master’s Thesis, Botswana International University of Science & Technology, Palapye, Botswana, 2021. [Google Scholar]
- Lindgren, L.; Grauers, A.; Ranggård, J.; Mäki, R. Drive-cycle simulations of battery-electric large haul trucks for open-pit mining with electric roads. Energies 2022, 15, 4871. [Google Scholar] [CrossRef]
- Zhang, Y.; Zhang, Y.; Ai, Z.; Feng, Y.; Hu, Z. A cross iteration estimator with base vector for estimation of electric mining haul truck’s mass and road grade. IEEE Trans. Ind. Inform. 2018, 14, 4138–4148. [Google Scholar] [CrossRef]
- Feng, Y.; Dong, Z. Optimal energy management with balanced fuel economy and battery life for large hybrid electric mining truck. J. Power Sources 2020, 454, 227948. [Google Scholar] [CrossRef]
- Liu, X.; Al-Qadi, I.L. Mechanistic excess fuel consumption of a 3D passenger vehicle on rough pavements. J. Transp. Eng. Part B Pavements 2023, 149, 04022065. [Google Scholar] [CrossRef]
- El Khoury, J.; Akle, B.; Katicha, S.; Ghaddar, A.; Daou, M. A microscale evaluation of pavement roughness effects for asset management. International. J. Pavement Eng. 2014, 15, 323–333. [Google Scholar] [CrossRef]
- Hou, T.; Liu, S.; Ling, J.; Tian, Y.; Li, P.; Zhang, J. Vibration Response Law of Aircraft Taxiing under Random Roughness Excitation. Appl. Sci. 2023, 13, 7386. [Google Scholar] [CrossRef]
- Daraghmi, Y.A.; Wu, T.H.; İk, T.U. Crowdsourcing-based road surface evaluation and indexing. IEEE Trans. Intell. Transp. Syst. 2020, 23, 4164–4175. [Google Scholar] [CrossRef]
- Li, J.; Zhang, Z.; Wang, W. International roughness index and a new solution for its calculation. J. Transp. Eng. Part B Pavements 2018, 144, 06018002. [Google Scholar] [CrossRef]
- Mirtabar, Z.; Golroo, A.; Mahmoudzadeh, A.; Barazandeh, F. Development of a crowdsourcing-based system for computing the international roughness index. Int. J. Pavement Eng. 2022, 23, 489–498. [Google Scholar] [CrossRef]
- Múčka, P. International Roughness Index specifications around the world. Road Mater. Pavement Des. 2017, 18, 929–965. [Google Scholar] [CrossRef]
- Zhang, Z.; Deng, F.; Huang, Y.; Bridgelall, R. Road roughness evaluation using in-pavement strain sensors. Smart Mater. Struct. 2015, 24, 115029. [Google Scholar] [CrossRef]
- Levesque, W.; Bégin-Drolet, A.; Lépine, J. Effects of pavement characteristics on rolling resistance of heavy vehicles: A literature review. Transp. Res. Rec. 2023, 2677, 296–309. [Google Scholar] [CrossRef]
- Tehrani, S.S.; Falls, L.C.; Mesher, D. Road users’ perception of roughness and the corresponding IRI threshold values. Can. J. Civ. Eng. 2015, 42, 233–240. [Google Scholar] [CrossRef]
- Radović, N.; Jokanović, I.; Matić, B.; Šešlija, M. A measurement of roughness as indicator of road network condition–case study Serbia. Teh. Vjesn. 2016, 23, 881–884. [Google Scholar] [CrossRef]
- Park, Y.S.; Shin, D.K.; Chung, T.J. Influence of road surface roughness on dynamic impact factor of bridge by full-scale dynamic testing. Can. J. Civ. Eng. 2005, 32, 825–829. [Google Scholar] [CrossRef]
- Chen, S.L.; Lin, C.H.; Tang, C.W.; Chu, L.P.; Cheng, C.K. Research on the international roughness index threshold of road rehabilitation in metropolitan areas: A case study in Taipei city. Sustainability 2020, 12, 10536. [Google Scholar] [CrossRef]
- Sidess, A.; Ravina, A.; Oged, E. A model for predicting the deterioration of the international roughness index. Int. J. Pavement Eng. 2022, 23, 1393–1403. [Google Scholar] [CrossRef]
- Maharaj, Y.; Tapamo, J.R. Road network extraction from satellite images using deep learning. In Communication and Intelligent Systems: Proceedings of ICCIS 2021; Springer Nature: Singapore, 2022; pp. 39–51. [Google Scholar]
- Gu, Q.; Xue, B.; Song, J.; Li, X.; Wang, Q. A high-precision road network construction method based on deep learning for unmanned vehicle in open pit. Min. Metall. Explor. 2022, 39, 397–411. [Google Scholar] [CrossRef]
- Hettiarachchi, C.; Yuan, J.; Amirkhanian, S.; Xiao, F. Measurement of pavement unevenness and evaluation through the IRI parameter–An overview. Measurement 2023, 206, 112284. [Google Scholar] [CrossRef]
- Tian, Y.; Liu, S.; Liu, L.; Xiang, P. Optimization of international roughness index model parameters for sustainable runway. Sustainability 2021, 13, 2184. [Google Scholar] [CrossRef]
- Sayers, M.W.; Gillespie, T.D.; Queiroz, C.A. The International Road Roughness Experiment; The International Bank for Reconstruction and Development: Washington, DC, USA, 1986. [Google Scholar]
- Sinaga, K.P.; Hussain, I.; Yang, M.S. Entropy K-means clustering with feature reduction under unknown number of clusters. IEEE Access 2021, 9, 67736–67751. [Google Scholar] [CrossRef]
- Ikotun, A.M.; Ezugwu, A.E. Enhanced firefly-K-means clustering with adaptive mutation and central limit theorem for automatic clustering of high-dimensional datasets. Appl. Sci. 2022, 12, 12275. [Google Scholar] [CrossRef]
- Li, H.; Wang, J. Collaborative annealing power k-means++ clustering. Knowl. Based Syst. 2022, 255, 109593. [Google Scholar] [CrossRef]
- Ouyang, J.; Zhou, C.; Liu, Z.; Zhang, G. Triangulated irregular network-based probabilistic 3D geological modelling using Markov Chain and Monte Carlo simulation. Eng. Geol. 2023, 320, 107131. [Google Scholar] [CrossRef]
- Wang, L.; Zhang, X.; Yin, S.; Zhang, X.; Jia, Y.; Kong, H. Evaluation of stope stability and displacement in a subsidence area using 3Dmine–Rhino3D–FLAC3D coupling. Minerals 2022, 12, 1202. [Google Scholar] [CrossRef]
Figure 1.
Visual representation of step-by-step workflow.
Figure 1.
Visual representation of step-by-step workflow.
Figure 2.
Specification of PH-25EX and LiDAR system.
Figure 2.
Specification of PH-25EX and LiDAR system.
Figure 4.
A quarter-car model.
Figure 4.
A quarter-car model.
Figure 5.
Lidar-based IRI calculation process.
Figure 5.
Lidar-based IRI calculation process.
Figure 6.
Principle of K-means.
Figure 6.
Principle of K-means.
Figure 7.
Flowchart of the K-Means algorithm.
Figure 7.
Flowchart of the K-Means algorithm.
Figure 8.
Experimental road.
Figure 8.
Experimental road.
Figure 9.
Model of experimental road.
Figure 9.
Model of experimental road.
Figure 10.
Elevation of experimental road.
Figure 10.
Elevation of experimental road.
Figure 11.
IRI statistical results.
Figure 11.
IRI statistical results.
Figure 12.
Relationship between IRI and fuel consumption for loaded trucks.
Figure 12.
Relationship between IRI and fuel consumption for loaded trucks.
Figure 13.
Relationship between IRI and fuel consumption for unloaded trucks.
Figure 13.
Relationship between IRI and fuel consumption for unloaded trucks.
Table 1.
Clustering results for loaded trucks.
Table 1.
Clustering results for loaded trucks.
| Number of Clusters | Cluster Center | Distance Between Classes | Intra-Class Distance |
|---|
| 3 | 1673 | - | 58 |
| 1900 | 227 | 61 |
| 2086 | 186 | 88 |
| 4 | 1666 | - | 53 |
| 1704 | 38 | 59 |
| 1900 | 196 | 61 |
| 2086 | 186 | 88 |
| 5 | 1665 | - | 47 |
| 1698 | 33 | 62 |
| 1900 | 313 | 39 |
| 2050 | 39 | 47 |
| 2115 | 65 | 50 |
Table 2.
Fuel consumption classification for loaded trucks.
Table 2.
Fuel consumption classification for loaded trucks.
| Range (L/100 km) | 0–1868 | 1869–1978 | Greater than 1978 |
| Classification | fuel-efficient | moderate | fuel-intensive |
Table 3.
Fuel-efficient road classification for loaded trucks.
Table 3.
Fuel-efficient road classification for loaded trucks.
| Classification | Good | Medium | Poor |
| IRI | 0–12.00 | 12.00–20.00 | 20.00 and above |
Table 4.
Clustering results for unloaded trucks.
Table 4.
Clustering results for unloaded trucks.
| Number of Clusters | Cluster Center | Distance Between Classes | Intra-Class Distance |
|---|
| 3 | 1403 | - | 43 |
| 1436 | 33 | 46 |
| 1498 | 62 | 56 |
| 4 | 1399 | - | 33 |
| 1420 | 21 | 23 |
| 1450 | 30 | 30 |
| 1498 | 48 | 56 |
| 5 | 1397 | - | 29 |
| 1415 | 18 | 19 |
| 1434 | 19 | 25 |
| 1473 | 39 | 38 |
| 1515 | 42 | 31 |
Table 5.
Fuel consumption classification for unloaded trucks.
Table 5.
Fuel consumption classification for unloaded trucks.
| Range (L/100 km) | 0–1420 | 1421–1470 | Greater than 1470 |
| Classification | fuel-efficient | moderate | fuel-intensive |
Table 6.
Fuel-efficient road classification for unloaded trucks.
Table 6.
Fuel-efficient road classification for unloaded trucks.
| | Good | Moderate | Poor |
| IRI | 0–15 | 15–21 | 21 and above |
Table 7.
Calculation results of road fuel costs for the case study.
Table 7.
Calculation results of road fuel costs for the case study.
| | Loaded Trucks | Unloaded Trucks |
|---|
| IRI for Every 150 m | Fuel Consumption (L/100 km) | Fuel Consumption
for 150 m (L) | Cost
(CNY) | Fuel Consumption (L/100 km) | Fuel Consumption
for 150 m | Cost
(CNY) |
|---|
| Road 1 | 25.95 | 2068.05 | 3.10 | 22.96 | 1528.39 | 2.29 | 16.97 |
| 21.57 | 2005.66 | 3.01 | 22.26 | 1485.49 | 2.23 | 16.49 |
| 19.04 | 1969.71 | 2.95 | 21.86 | 1460.78 | 2.19 | 16.21 |
| 17.41 | 1946.49 | 2.92 | 21.61 | 1444.81 | 2.17 | 16.04 |
| 18.62 | 1963.76 | 2.95 | 21.80 | 1456.68 | 2.19 | 16.17 |
| 23.57 | 2034.15 | 3.05 | 22.58 | 1505.08 | 2.26 | 16.71 |
| 26.15 | 2070.99 | 3.11 | 22.99 | 1530.41 | 2.30 | 16.99 |
| 18.70 | 1964.86 | 2.95 | 21.81 | 1457.44 | 2.19 | 16.18 |
| 20.57 | 1991.46 | 2.99 | 22.11 | 1475.73 | 2.21 | 16.38 |
| 15.07 | 1913.09 | 2.87 | 21.24 | 1421.85 | 2.13 | 15.78 |
| 19.35 | 1974.15 | 2.96 | 21.91 | 1463.83 | 2.20 | 16.25 |
| Road 2 | 13.45 | 1890.09 | 2.84 | 20.98 | 1406.03 | 2.11 | 15.61 |
| 28.43 | 2103.42 | 3.16 | 23.35 | 1552.70 | 2.33 | 17.23 |
| 20.79 | 1994.61 | 2.99 | 22.14 | 1477.90 | 2.22 | 16.40 |
| 19.11 | 1970.66 | 2.96 | 21.87 | 1461.43 | 2.19 | 16.22 |
| 21.24 | 2001.02 | 3.00 | 22.21 | 1482.30 | 2.22 | 16.45 |
| 28.89 | 2109.89 | 3.16 | 23.42 | 1557.15 | 2.34 | 17.28 |
| 21.81 | 2009.18 | 3.01 | 22.30 | 1487.91 | 2.23 | 16.52 |
| 11.40 | 1860.91 | 2.79 | 20.66 | 1385.98 | 2.08 | 15.38 |
| | | Total fuel costs | 420.05 | Total fuel costs | 311.26 |
Table 8.
Fuel costs after road quality upgraded.
Table 8.
Fuel costs after road quality upgraded.
| | Loaded Trucks | Unloaded Trucks |
|---|
| | Upgraded IRI | Fuel Consumption (L/100 km) | Cost
(CNY) | Upgraded IRI | Fuel Consumption (L/100 km) | Cost
(CNY) |
|---|
| Road 1 | 16.00 | 1926.40 | 21.38 | 18.00 | 1450.58 | 16.10 |
| 16.00 | 1926.40 | 21.38 | 18.00 | 1450.58 | 16.10 |
| 19.04 | 1969.71 | 21.86 | 19.04 | 1460.78 | 16.21 |
| 17.41 | 1946.49 | 21.61 | 17.41 | 1444.81 | 16.04 |
| 18.62 | 1963.76 | 21.80 | 18.62 | 1456.68 | 16.17 |
| 16.00 | 1926.40 | 21.38 | 18.00 | 1450.58 | 16.10 |
| 16.00 | 1926.40 | 21.38 | 18.00 | 1450.58 | 16.10 |
| 18.70 | 1964.86 | 21.81 | 18.70 | 1457.44 | 16.18 |
| 16.00 | 1926.40 | 21.38 | 20.57 | 1475.73 | 16.38 |
| 15.07 | 1913.09 | 21.24 | 15.07 | 1421.85 | 15.78 |
| 19.35 | 1974.15 | 21.91 | 19.35 | 1463.83 | 16.25 |
| Road 2 | 13.45 | 1890.09 | 20.98 | 13.45 | 1406.03 | 15.61 |
| 16.00 | 1926.40 | 21.38 | 18.00 | 1450.58 | 16.10 |
| 16.00 | 1926.40 | 21.38 | 20.79 | 1477.90 | 16.40 |
| 19.11 | 1970.66 | 21.87 | 19.11 | 1461.43 | 16.22 |
| 16.00 | 1926.40 | 21.38 | 18.00 | 1450.58 | 16.10 |
| 16.00 | 1926.40 | 21.38 | 18.00 | 1450.58 | 16.10 |
| 16.00 | 1926.40 | 21.38 | 18.00 | 1450.58 | 16.10 |
| 11.40 | 1860.91 | 20.66 | 11.40 | 1385.98 | 15.38 |
| | | Total fuel costs | 407.57 | Total fuel costs | 305.44 |
| Disclaimer/Publisher’s Note: The statements, opinions and data contained in all publications are solely those of the individual author(s) and contributor(s) and not of MDPI and/or the editor(s). MDPI and/or the editor(s) disclaim responsibility for any injury to people or property resulting from any ideas, methods, instructions or products referred to in the content. |
© 2025 by the authors. Licensee MDPI, Basel, Switzerland. This article is an open access article distributed under the terms and conditions of the Creative Commons Attribution (CC BY) license (https://creativecommons.org/licenses/by/4.0/).


