Article

VCAFusion: A Framework for Infrared and Low Light Visible Image Fusion Based on Visual Characteristics Adjustment

1
Southwest Institute of Technical Physics, Chengdu 610041, China
2
College of Electronics and Information Engineering, Sichuan University, Chengdu 610065, China
*
Author to whom correspondence should be addressed.
Appl. Sci. 2025, 15(11), 6295; https://doi.org/10.3390/app15116295
Submission received: 21 April 2025 / Revised: 25 May 2025 / Accepted: 25 May 2025 / Published: 3 June 2025

Abstract

Infrared (IR) and visible (VIS) image fusion enhances vision tasks by combining complementary data. However, most existing methods assume normal lighting conditions and thus perform poorly in low-light environments, where VIS images often lose critical texture details. To address this limitation, we propose VCAFusion, a novel approach for robust infrared and visible image fusion in low-light scenarios. Our framework incorporates an adaptive brightness adjustment model based on light reflection theory to mitigate illumination-induced degradation in nocturnal images. Additionally, we design an adaptive enhancement function inspired by human visual perception to recover weak texture details. To further improve fusion quality, we develop an edge-preserving multi-scale decomposition model and a saliency-preserving strategy, ensuring seamless integration of perceptual features. By effectively balancing low-light enhancement and fusion, our framework preserves both the intensity distribution and the fine texture details of salient objects. Extensive experiments on public datasets demonstrate that VCAFusion achieves superior fusion quality, closely aligning with human visual perception and outperforming state-of-the-art methods in both qualitative and quantitative evaluations.

1. Introduction

With advancements in sensor technology, acquired images now feature high information content, resolution, and multi-source diversity. However, a single processing method often proves inadequate for synthesizing multi-modal information effectively. Multi-modal image fusion addresses this challenge by integrating data from multiple sensors into a single composite image that combines their distinct characteristics, thereby providing a more comprehensive scene representation [1]. Among fusion techniques, infrared and visible image fusion is the most widely applied. Visible images provide high spatial resolution and detailed scenes but are affected by adverse conditions, like nighttime, fog, or obstacles [2,3]. Infrared sensors capture thermal radiation, enabling clear target–background differentiation. Fusing these modalities preserves thermal targets while retaining rich background details [4,5], making it crucial in military reconnaissance, target tracking, security monitoring, and remote sensing [6].
Researchers have developed numerous fusion methods for multi-modal image processing, which can be broadly categorized into traditional approaches and deep learning-based techniques [2,7]. Traditional methods encompass multi-scale decomposition (MSD) [8,9,10], sparse representation [11,12], saliency-based approaches [13,14], and subspace techniques [15,16]. Deep learning-based methods leverage various architectures, including CNNs, auto-encoders, GANs, and transformers [17,18,19,20]. However, most existing methods primarily address normal lighting conditions, often neglecting the challenges posed by nighttime illumination degradation. While infrared data provides critical thermal information, excessive reliance on it may result in the loss of valuable scene details, ultimately undermining the fundamental objective of complementary information integration [2].
To overcome these limitations, we present VCAFusion, an innovative infrared-visible fusion framework designed to enhance visual perception while addressing illumination degradation. Our methodology integrates the following three key technical contributions: (1) an adaptive brightness adjustment model based on the retinex theory and multi-scale principles that effectively enhances weak details in visible images; (2) a biologically-inspired adaptive enhancement function that optimizes texture refinement while maintaining edge sharpness; and (3) a multi-scale decomposition model employing side window filtering [21] for precise scale separation and robust feature extraction. Furthermore, we incorporate a saliency-preserving strategy that effectively maintains critical information across different scales, thereby ensuring enhanced clarity and structural integrity in the fused output. While existing methods have advanced multi-modal fusion, significant gaps remain in handling nighttime conditions. Table 1 further summarizes the advantages and disadvantages of different fusion methods.
As shown in Figure 1, VCAFusion outperforms some state-of-the-art methods, like MSID [10] and SeAFusion [17], delivering richer visual features. It highlights high-temperature targets, enhances subtle textures, and seamlessly integrates essential information. The red and green regions in the comparison further illustrate these improvements.
In summary, this paper makes the following main contributions:
  • An infrared-visible fusion method enhancing detail preservation and visual quality in low-light conditions.
  • A lighting correction and contrast enhancement approach to strengthen weak details while maintaining edge clarity.
  • A hybrid multi-scale decomposition (MSD) for better structure handling and a saliency-preserving strategy for improved detail integration.
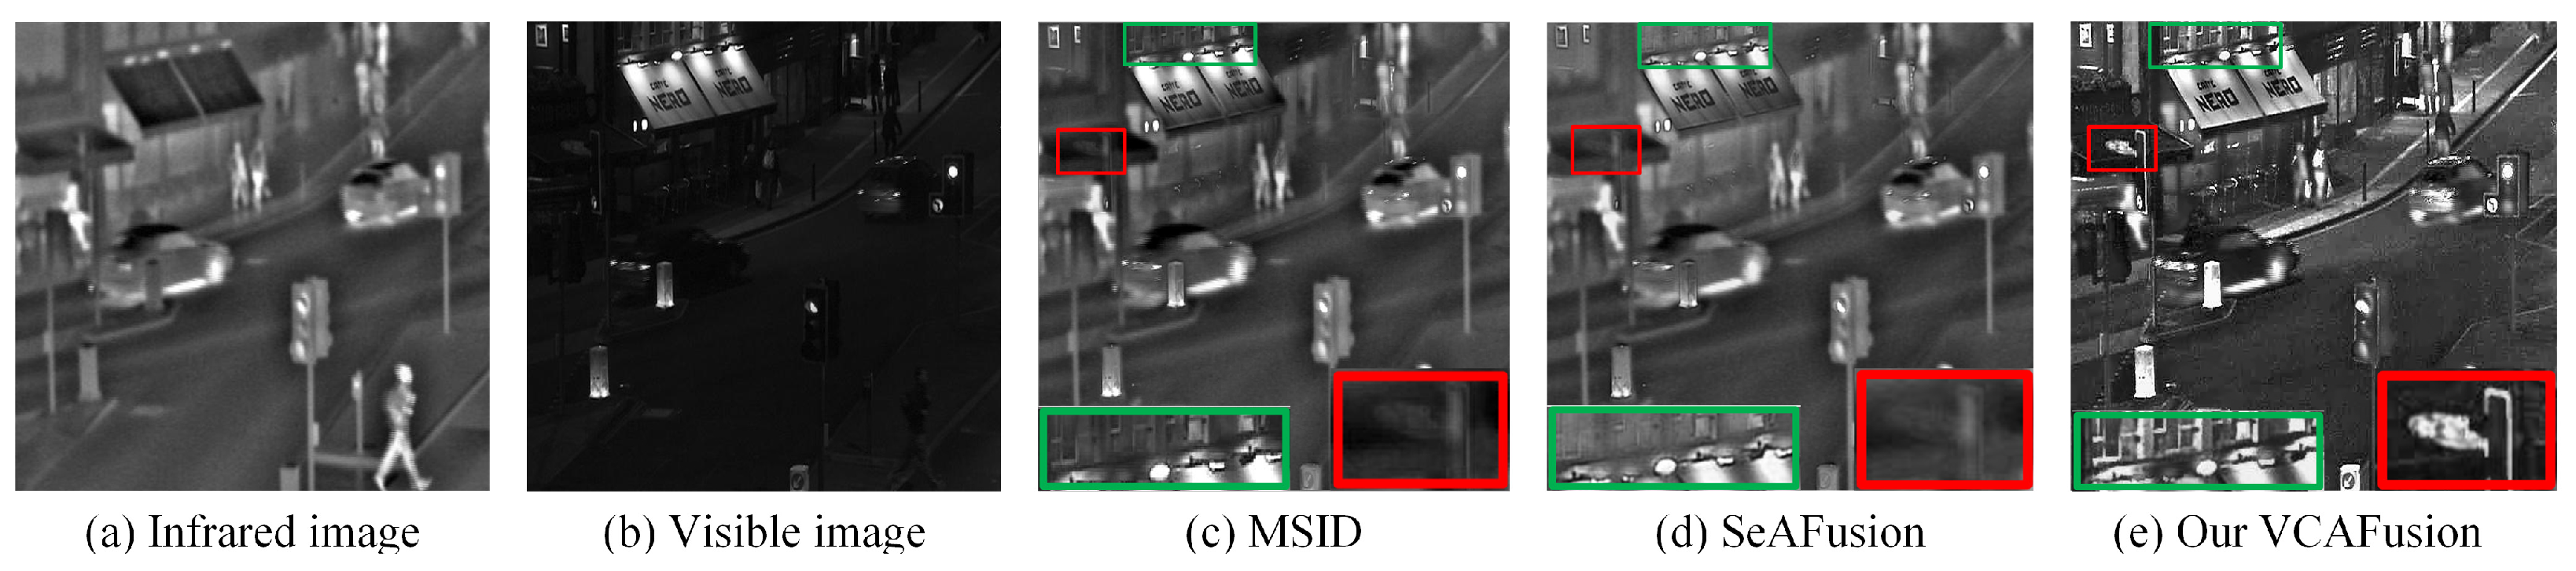
  • Our method adapts to lighting variations and outperforms state-of-the-art methods in object highlighting and detail preservation (Figure 1e).

2. Related Works

2.1. Infrared and Visible Image Fusion

2.1.1. Traditional Image Fusion

In recent years, transform domain-based image fusion has gained significant attention [6]. Multi-scale decomposition (MSD) methods, such as the Laplacian pyramid, wavelet, and contourlet transforms [22,23,24,25], offer a balance between efficiency and visual quality. Edge-preserving filters [26,27,28,29] enhance fusion by leveraging spatial features across scales. Sparse representation methods using dictionary learning capture finer details, while subspace methods [30,31,32] improve efficiency by reducing dimensionality but may increase processing time. Saliency-based methods highlight key features but often overlook background details in low-light conditions. Hybrid and optimization-based methods further refine fusion performance by integrating multiple techniques.

2.1.2. Deep Learning-Based Fusion Methods

In recent years, deep learning has been increasingly applied to image fusion, leading to various advancements. Li and Wu employed a pre-trained VGG-19 network to extract high-frequency details [33], while Xu et al. proposed an unsupervised framework using DenseNet’s loss function for feature extraction and reconstruction [34]. Ma et al. introduced FusionGAN [35] to preserve infrared thermal radiation and visible image gradients, though the results often lacked sharpness. Prabhakar et al. [36] utilized an autoencoder (AE) network, but its simple structure failed to capture deep features effectively, leading to information loss. Despite promising visual outcomes, deep learning-based fusion faces challenges in preserving weak textures and edges [29], suffers from poor interpretability, and heavily depends on training data, limiting generalization [3]. While these methods have improved fusion quality, they have yet to demonstrate clear superiority over traditional methods.

2.2. Low-Light Image Enhancement Methods

Current infrared and visible image fusion techniques often neglect illumination attenuation in nighttime visible imagery, leading to weak details being lost in noise or poor lighting. A practical solution is to apply advanced low-light enhancement algorithms as a preprocessing step, thereby improving image clarity and informativeness [29]. Common methods include global curve transformation [37], histogram equalization [38], retinex [39,40], and deep learning-based methods [41,42], each with its own limitations. Global curve transformation lacks local adaptivity, reducing contrast; histogram equalization enhances contrast but risks detail loss; retinex methods are computationally expensive and prone to color distortion; while deep learning requires large datasets, is time-intensive, and lacks interpretability. An improved approach is needed to effectively integrate low-light enhancement with image fusion.

3. Materials and Methods

The proposed fusion framework is shown in Figure 2. First, an adaptive low-light enhancement algorithm corrects lighting degradation and enhances visible image features. Then, a multi-scale structural decomposition (MSSD) method extracts multi-scale representations while preserving edges. Based on a feature analysis, three fusion rules integrate perceptual features, and the final image is reconstructed through inverse transformation.

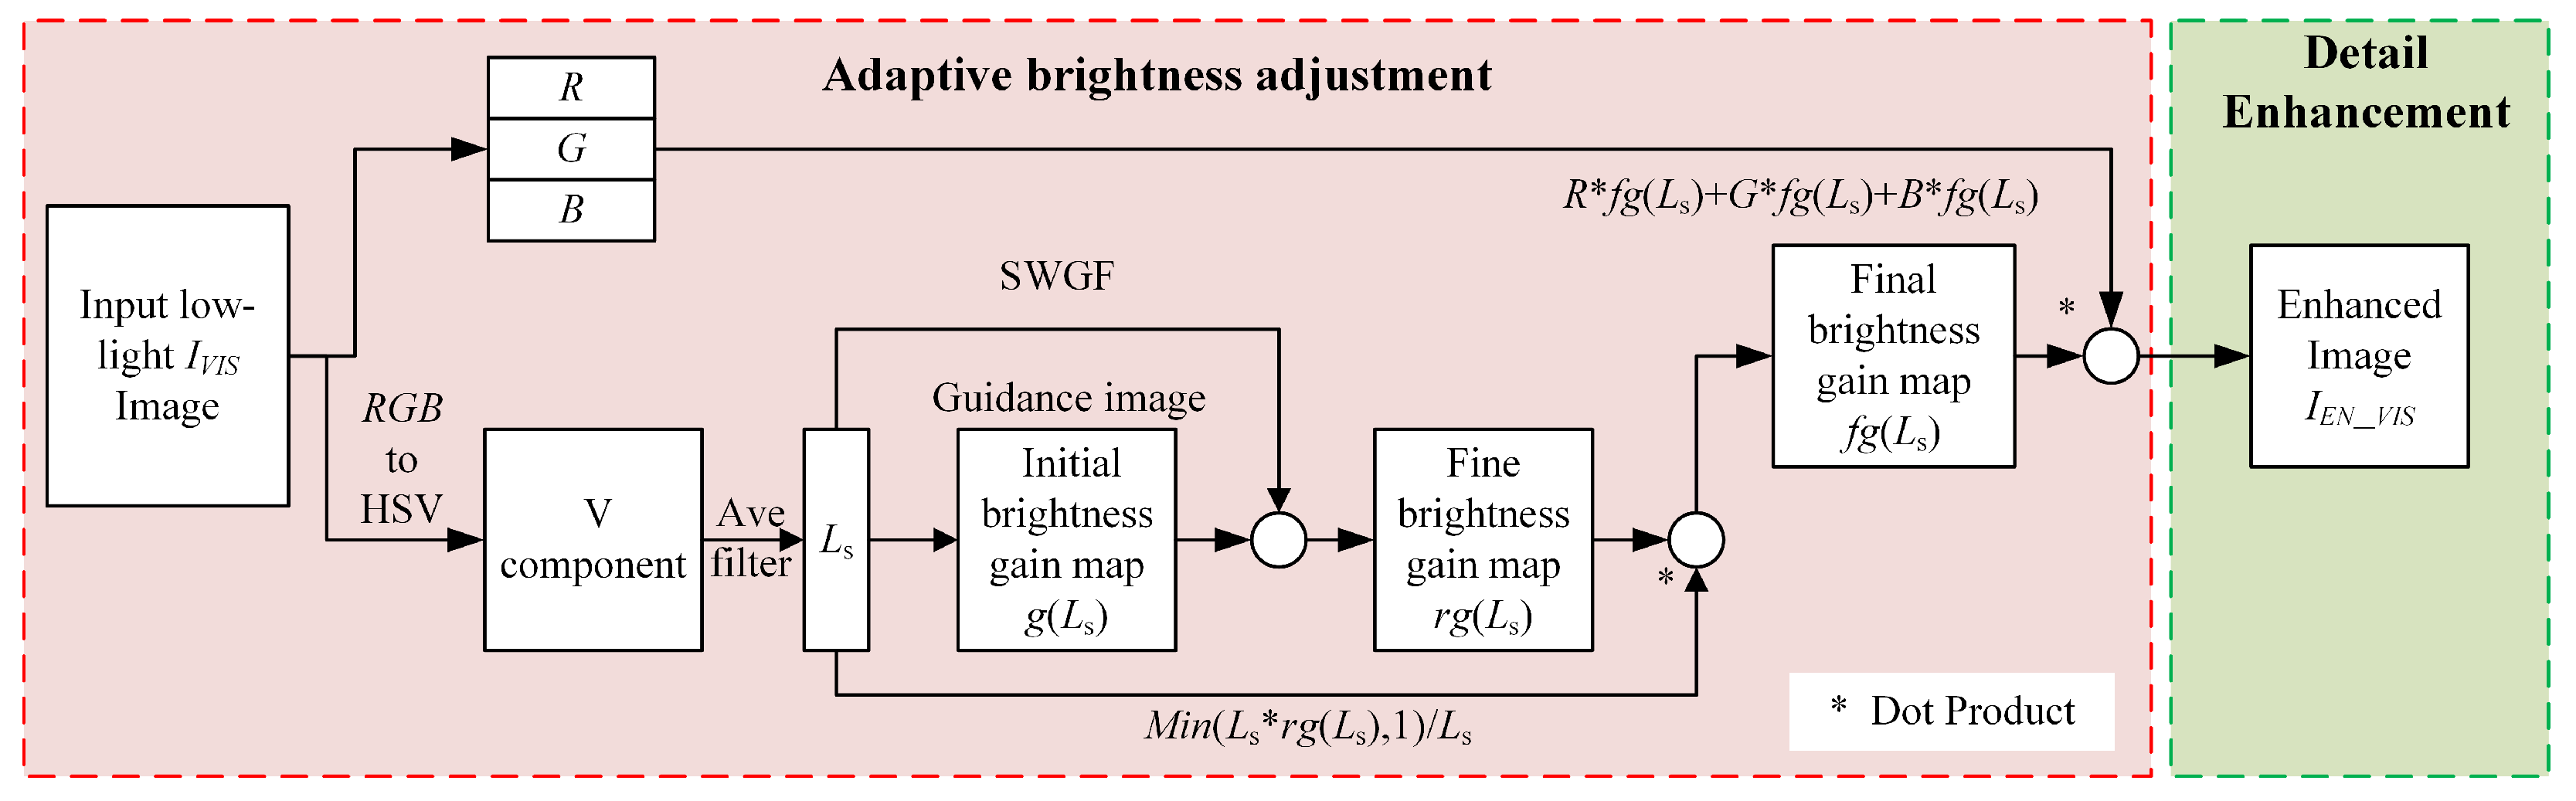
3.1. Adaptive Low-Light Enhancement

Based on the retinex theory [43], we propose an adaptive brightness adjustment model to correct illumination degradation in night scenes and to enhance weak textures. The process is shown in Figure 3.
Since HSV color space aligns better with human visual perception, we first convert the low-light image to HSV. Within this space, the scene’s lighting components are extracted using a multi-scale mean function, defined as follows:
L s = i i = 1 N 1 M x , y S x y V x , y , i = 1 , 2 , , N  
where N is the number of scales, M is a mean filter window of size m × n, Sxy indicates that the center point is at (x,y), and V(x,y) is the brightness component of the original image.
Subsequently, an adaptive brightness enhancement function can be formulated based on the localized average illumination components’ distribution. This method dynamically modifies the enhancement function’s parameters in accordance with the image’s illumination components distribution, thereby enhancing the overall image quality in the presence of non-uniform illumination. The expression is presented as follows:
g = 1 + C 1 1 + e α x β 1 1 + e α 1 β / 1 1 + e α 0 β 1 1 + e α 1 β
g L s = L s i g L s N g N , i = 1 , 2 , , N  
where α, β, and C control the steepness, inflection point, and maximum gain of the brightness gain curve, respectively, while x represents the illumination.
The adaptive low-light enhancement function is shown in Figure 4. The function dynamically adjusts brightness gains based on localized illumination components, with C directly influencing the upper bound of enhancement intensity. As demonstrated in the figure, when C is incrementally set to 2, 4, 6, 8, and 10, the brightness gain curve shifts upward, indicating heightened amplification for darker regions (lower input gray levels) while preserving brighter areas (higher input gray levels). This selective enhancement ensures a balanced luminance distribution, mitigating over-saturation in well-lit regions. The parameter α governs the transition sharpness between enhanced and non-enhanced zones, while β determines the threshold at which maximal gain is applied. Such adaptability allows the function to address non-uniform illumination effectively, optimizing perceptual quality across diverse lighting conditions. The resultant brightness gain map, g(Ls), thus reflects spatially variant corrections tailored to the image’s intrinsic illumination profile.
Next, we use a side window guided filter (SWGF) [21,29] to remove halo artifacts of the brightness gain map. Then, the corresponding mathematical operation is performed to obtain the final brightness gain map fg (Ls), as follows:
f g L s = M i n L s S W G F L s , g L s , r , e p s , 1 / L s
Next, the lighting component fg (Ls) is independently processed for each of the R, G, and B channels to generate the final low-light-enhanced image, as follows:
I a j _ V I S = R f g L s + G f g L s + B f g L s
In low-light images, weak edges are easily overlooked. According to Weber’s law, a bright spot with luminance I + ΔI is perceptible only if ΔI exceeds a threshold, known as the just-noticeable difference (JND). As shown in Figure 5a, low illumination results in poor luminance discrimination, which improves as brightness increases. To balance over-enhancement in strong edges and under-enhancement in flat areas, we design a local detail adjustment function based on the Weber ratio curve. As shown in Figure 5b, setting G to 0.25, 0.45, 0.65, and 0.85 increases local brightness accordingly, enhancing details while preventing excessive sharpening. The function is defined as follows:
I E N _ V I S = β I a j _ V I S x , y I V I S _ b a s e x , y + I a j _ V I S x , y
β = 1 G sin I V I S _ b a s e π 1 + λ 1 e I V I S _ det a i l / λ 2 2
where IVIS_base is the filtered images by the SWGF, β is the local detail adjustment function, G is a detail enhancement coefficient, λ1 is the maximum magnification of details, and λ2 is the amplification coefficient’s attenuation rate with the details’ increase.

3.2. Infrared and Visible Image Fusion Based on SWGF

3.2.1. Image Decomposition

First, we use the SWGF functions to obtain the base layer and the detail layer of the input images, as follows:
B i = S W G F I E N _ V I S , I E N _ V I S , r , e p s ,   i = I R , V I S
D i = I E N _ V I S B i ,   i = I R , V I S
Visual saliency-based methods can preserve the integrity of salient object regions and thus are widely used in IR and VIS image fusion. The salient matrices {SIR, SVIS} of the source images are computed as follows:
S i = g a u s s i a n i · a v e f i l t e r i · , i = I R , V I S
where avefilter () is the arithmetic mean pixel value of the image and gaussian () is the Gaussian blurred version of the original image to eliminate fine texture details as well as noise.

3.2.2. Weight Mapping-Based Detail Layer Fusion

Infrared images capture critical yet invisible details, while visible images provide rich background information. To leverage both, we directly integrate bright, prominent targets from the infrared image into the visible image. A simple saliency detection method is used to extract a saliency map from the infrared detail layer, as follows:
P I R = D I R D V I S ,   i f   D I R D V I S > 0 0 , otherwise
where PIR represents the saliency map of the detail layer within the infrared image.
Saliency maps often contain artifacts and noise. To mitigate this, we propose a weight map optimization method based on a SWGF, which reduces noise while preserving detail transmission. The SWGF is applied to the saliency map of the detail layer, using the corresponding infrared and visible source images as guides. The optimization is defined as follows:
w d 1 = S W G F I I R , P I R , r , e p s
w d 2 = S W G F I V I S , P V I S , r , e p s
where SWGF () represents the side window guided filter function, wd1 and wd2 are the weight maps of the detail layer, respectively. Then, perform linear weighted summation to obtain the following detail layer fusion results:
D F = w d 1 D I R + w d 2 D V I S

3.2.3. Nonlinear Function-Based Saliency Layer Fusion

Unlike the detail layer information, the salient regions are characterized by elevated pixel values relative to their surroundings. However, conventional averaging fusion often leads to energy loss in key areas, reducing contrast in the final fused image. To address this, we introduce the arctangent function λ for weight mapping, optimizing fusion within the salient layers. The salient layer R of the infrared target is defined as follows:
R = S I R S V I S ,   i f   S I R S V I S   0   , otherwise  
We could normalize R by using the following equation:
P = R / max x Ω R
where max x Ω R x , y denotes the maximum pixel value within the entire image and P denotes the normalized outcome of R.
Finally, the weight maps of the IR and VIS salient layer can be expressed as follows:
S λ α = arctan λ α / arctan λ
where α∈[0, 1], and the range Sλ always remains at [0, 1]. λ is a regularization parameter.
The infrared and visible salient layer fusion image can be expressed as follows:
w s 1 = arctan λ P / arctan λ
S F = w s 1 S I R + 1 w s 2 S V I S

3.2.4. Visual Saliency-Based Base Layer Fusion

The goal of base layer fusion is to retain the large-scale structures of infrared and visible images while maintaining contrast similar to the infrared image. Since infrared targets exhibit strong saliency and energy distribution, ensuring fusion robustness requires accounting for structural and brightness differences. To achieve this, we design a weighted average fusion rule that preserves the salient regions. The weight maps are expressed as follows:
w b 1 = 0.5 + S I R S V I S / 2
where S I R and S V I S are the visual saliency maps of the IR and VIS images.
The base layer fusion results are as follows:
B F = w b 1 B I R + 1 w b 2 B V I S

3.2.5. Image Reconstruction

In the final step, an inverse transformation is applied to generate the fused image F.
F = S F + B F + D F

4. Discussion

4.1. Datasets and Parameters Selection

The source images used in this study were selected from two widely recognized datasets: TNO [44] and M3FD [18], which provide diverse multi-spectral scenarios. To achieve an optimal balance between computational efficiency and performance, we set the SWGF filter radius r to 7 and the regularization coefficient ε to 0.01. For the contrast enhancement in Equation (2), the parameters were empirically determined as C = 6, α = 10, and β = 0.1. The detail enhancement factor G in Equation (7) was set to 0.45 through comprehensive visual assessment. To prevent over-enhancement, we configured the regularization parameters in Equation (7) as λ1 = 0.95 and λ2 = 0.45. In the saliency fusion layer (Equation (17)), the parameter λ controls infrared feature prominence—increasing values enhance thermal visibility while maintaining background integrity. Our experiments demonstrate that λ = 20 achieves the optimal trade-off between infrared detail preservation and natural background representation.

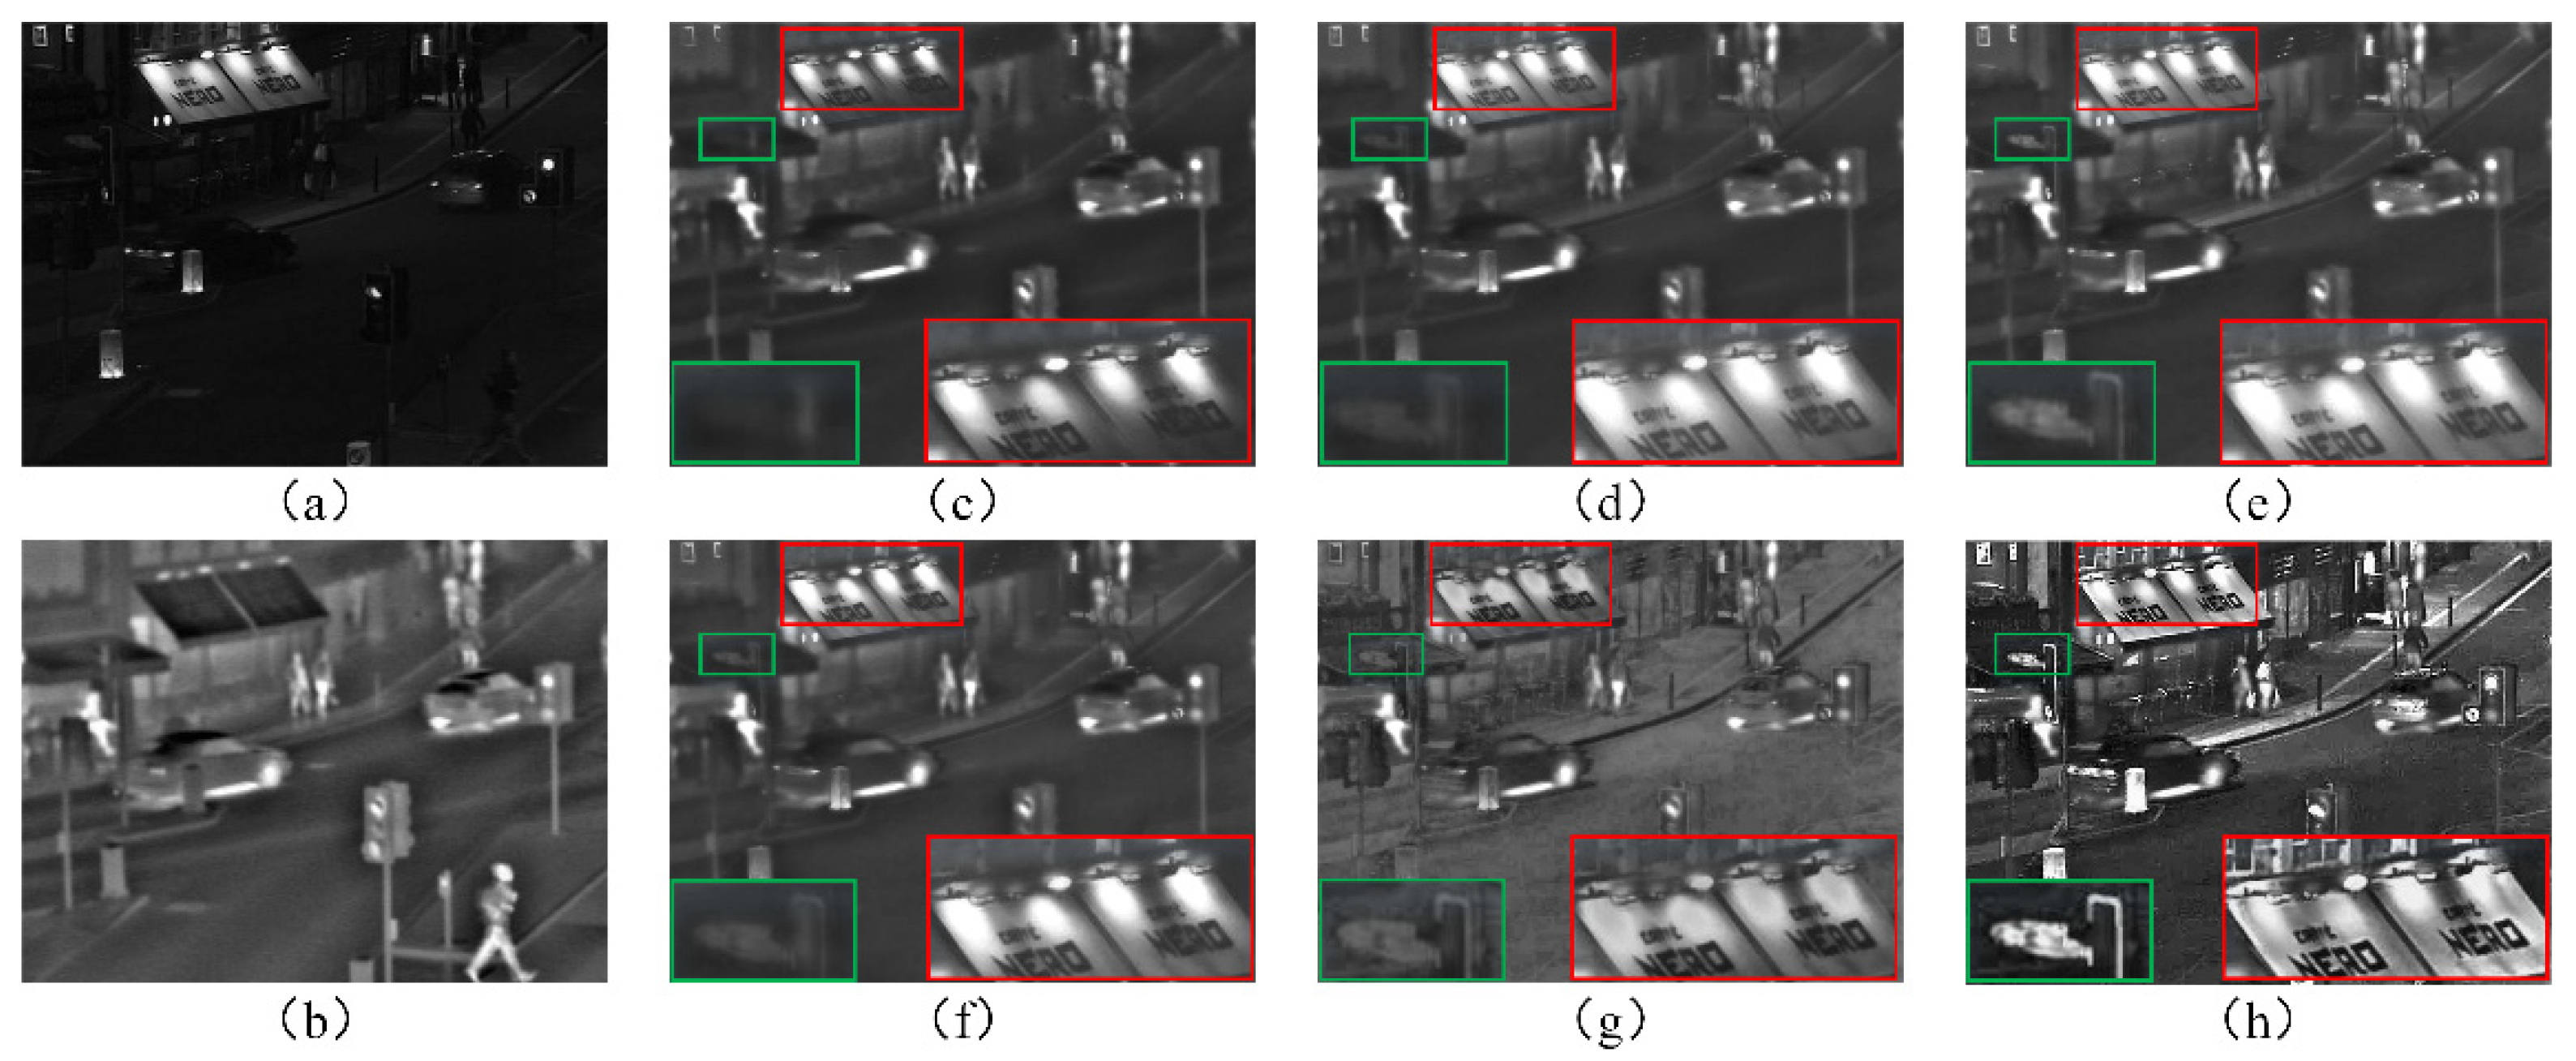
4.2. Low-Light Enhancement Algorithm

We evaluated the proposed low-light enhancement algorithm and compared it with others, as shown in Figure 6. Figure 6a is the Queen’s Road image, while Figure 6b–f present results from gamma correction [37], GFCE [45], SRIE [46], MSretinex [47], and our adaptive dimming method. From Figure 6b,d, it is apparent that, while the gamma correction and SRIE methods successfully improve background brightness, their enhancements are constrained, with certain local details remaining poorly resolved. Figure 6c shows the results of the GFCE method, which exhibits marginally better visual quality. The MSretinex method (Figure 6e) enhances the contrast but introduces significant color distortion. By comparison, both Figure 6c,f achieve substantial improvements. However, in Figure 6c, streetlights and billboards within the red-framed region appear blurred, lacking the contrast attained by the proposed adaptive low-light adjustment method in Figure 6f.
We examined the impact of low-light enhancement on fusion results, as shown in Figure 7. Without enhancement (Figure 7c), the fusion suffers from poor brightness and contrast, whereas our method (Figure 7h) preserves rich details and superior visual quality. Zoomed-in comparisons of the two rectangular regions highlight the improved clarity and brightness in streetlights and billboards. Overall, the adaptive dimming algorithm effectively integrates complementary information and enhances weak textures in dark scenes.

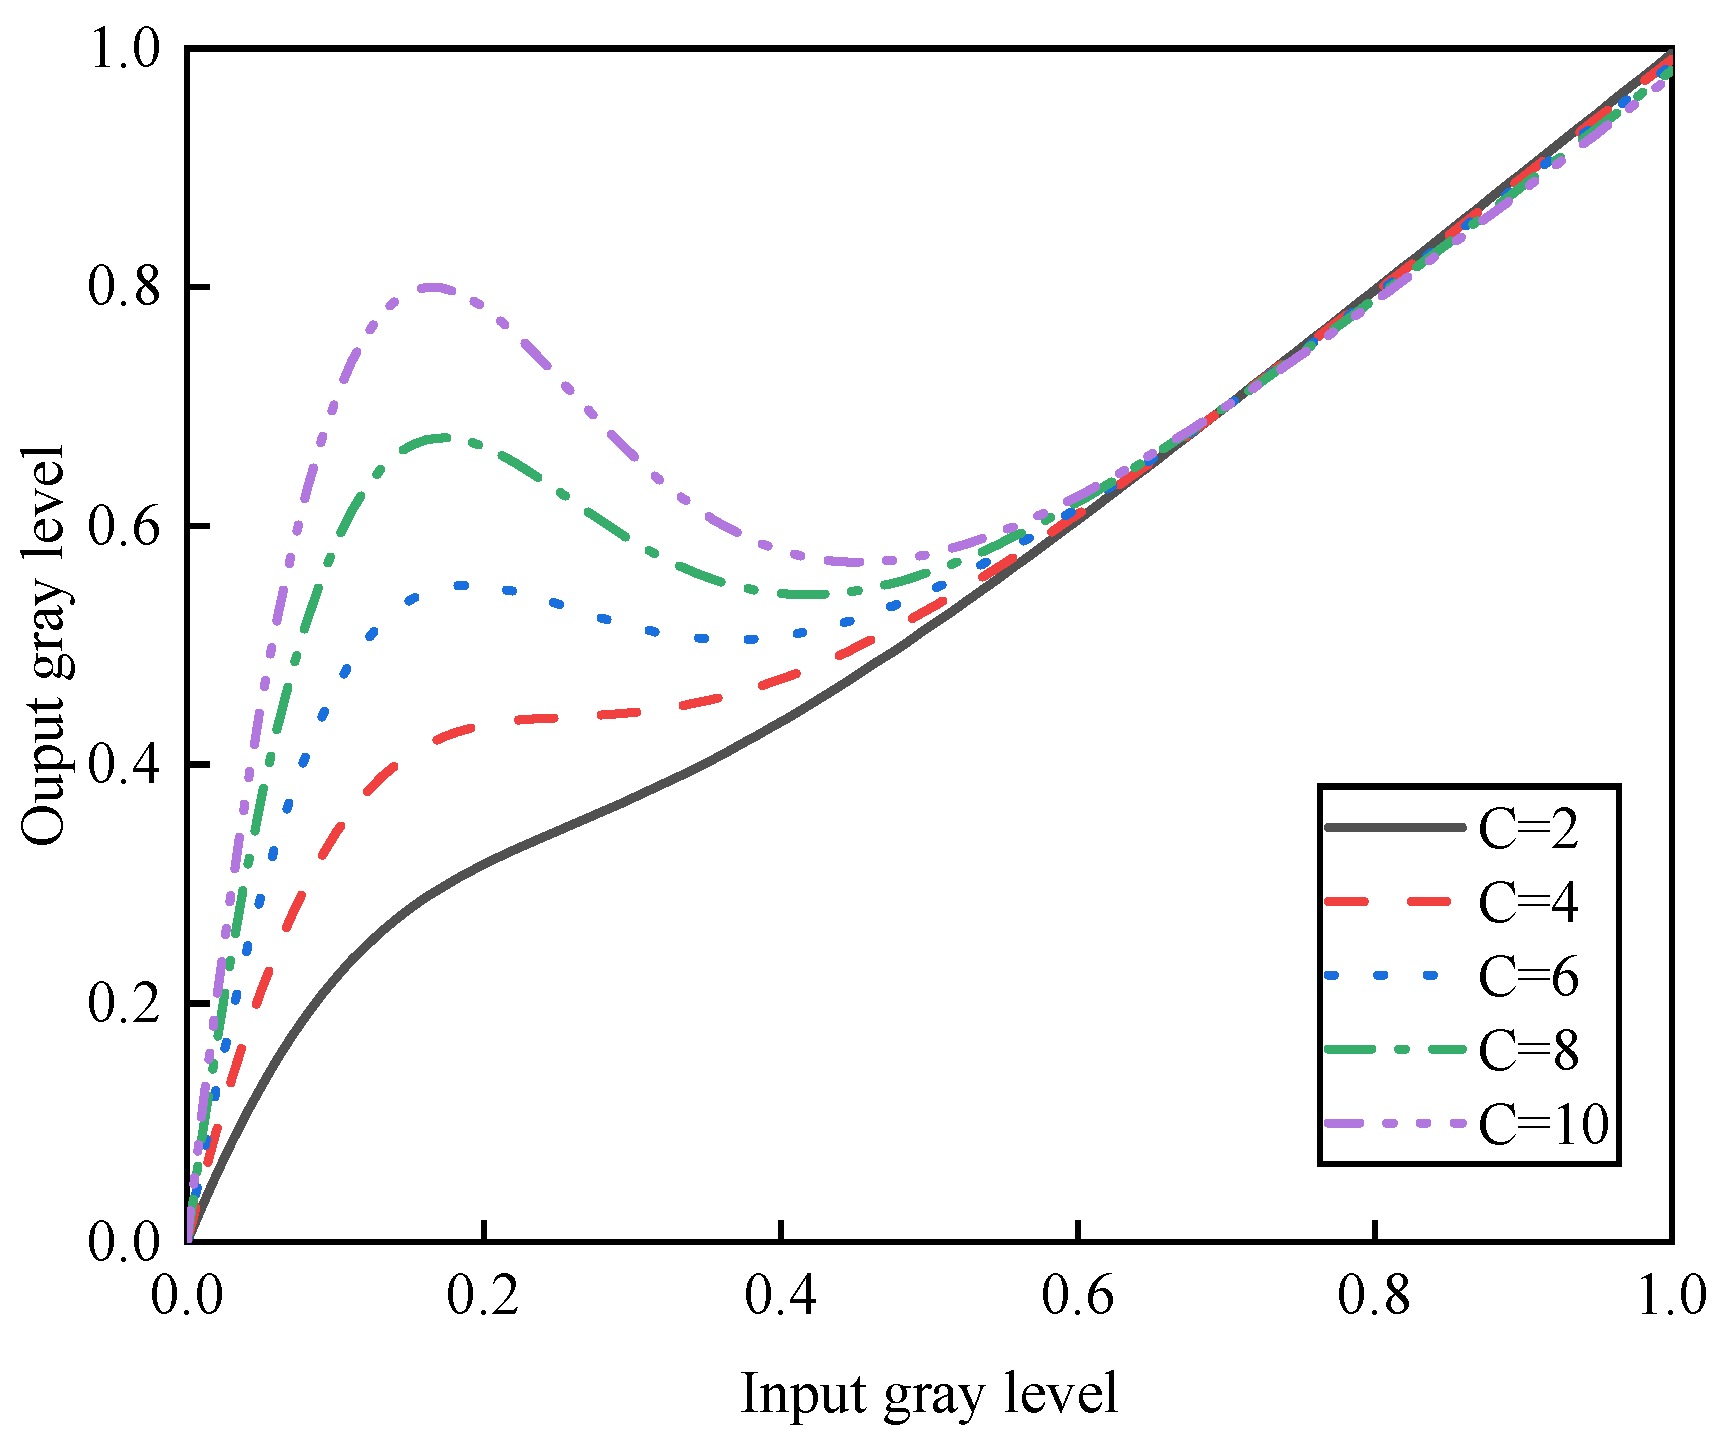
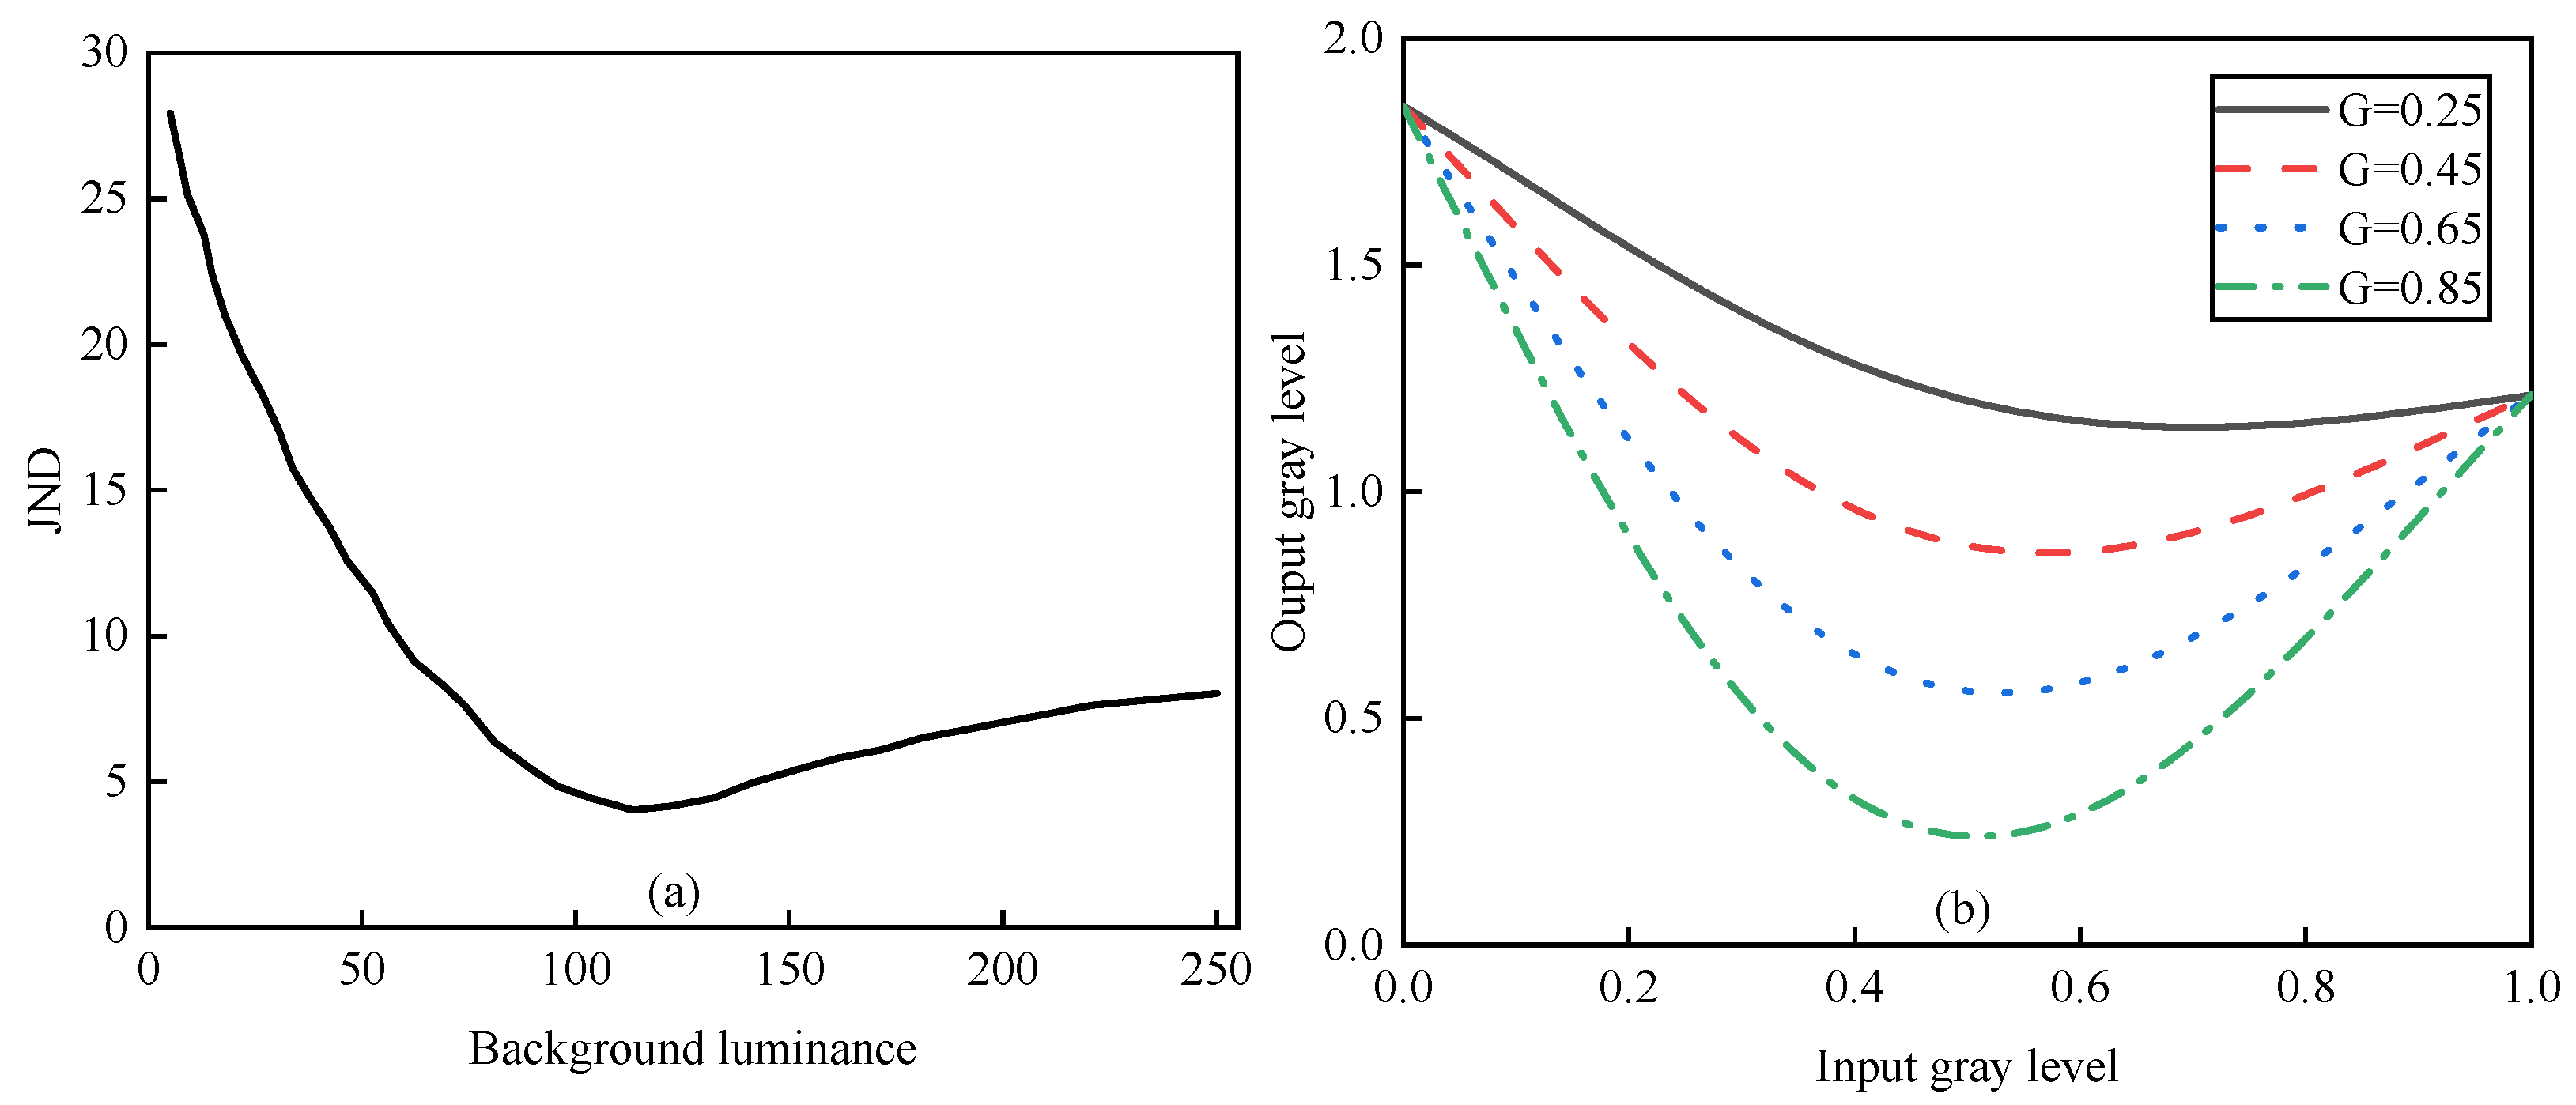
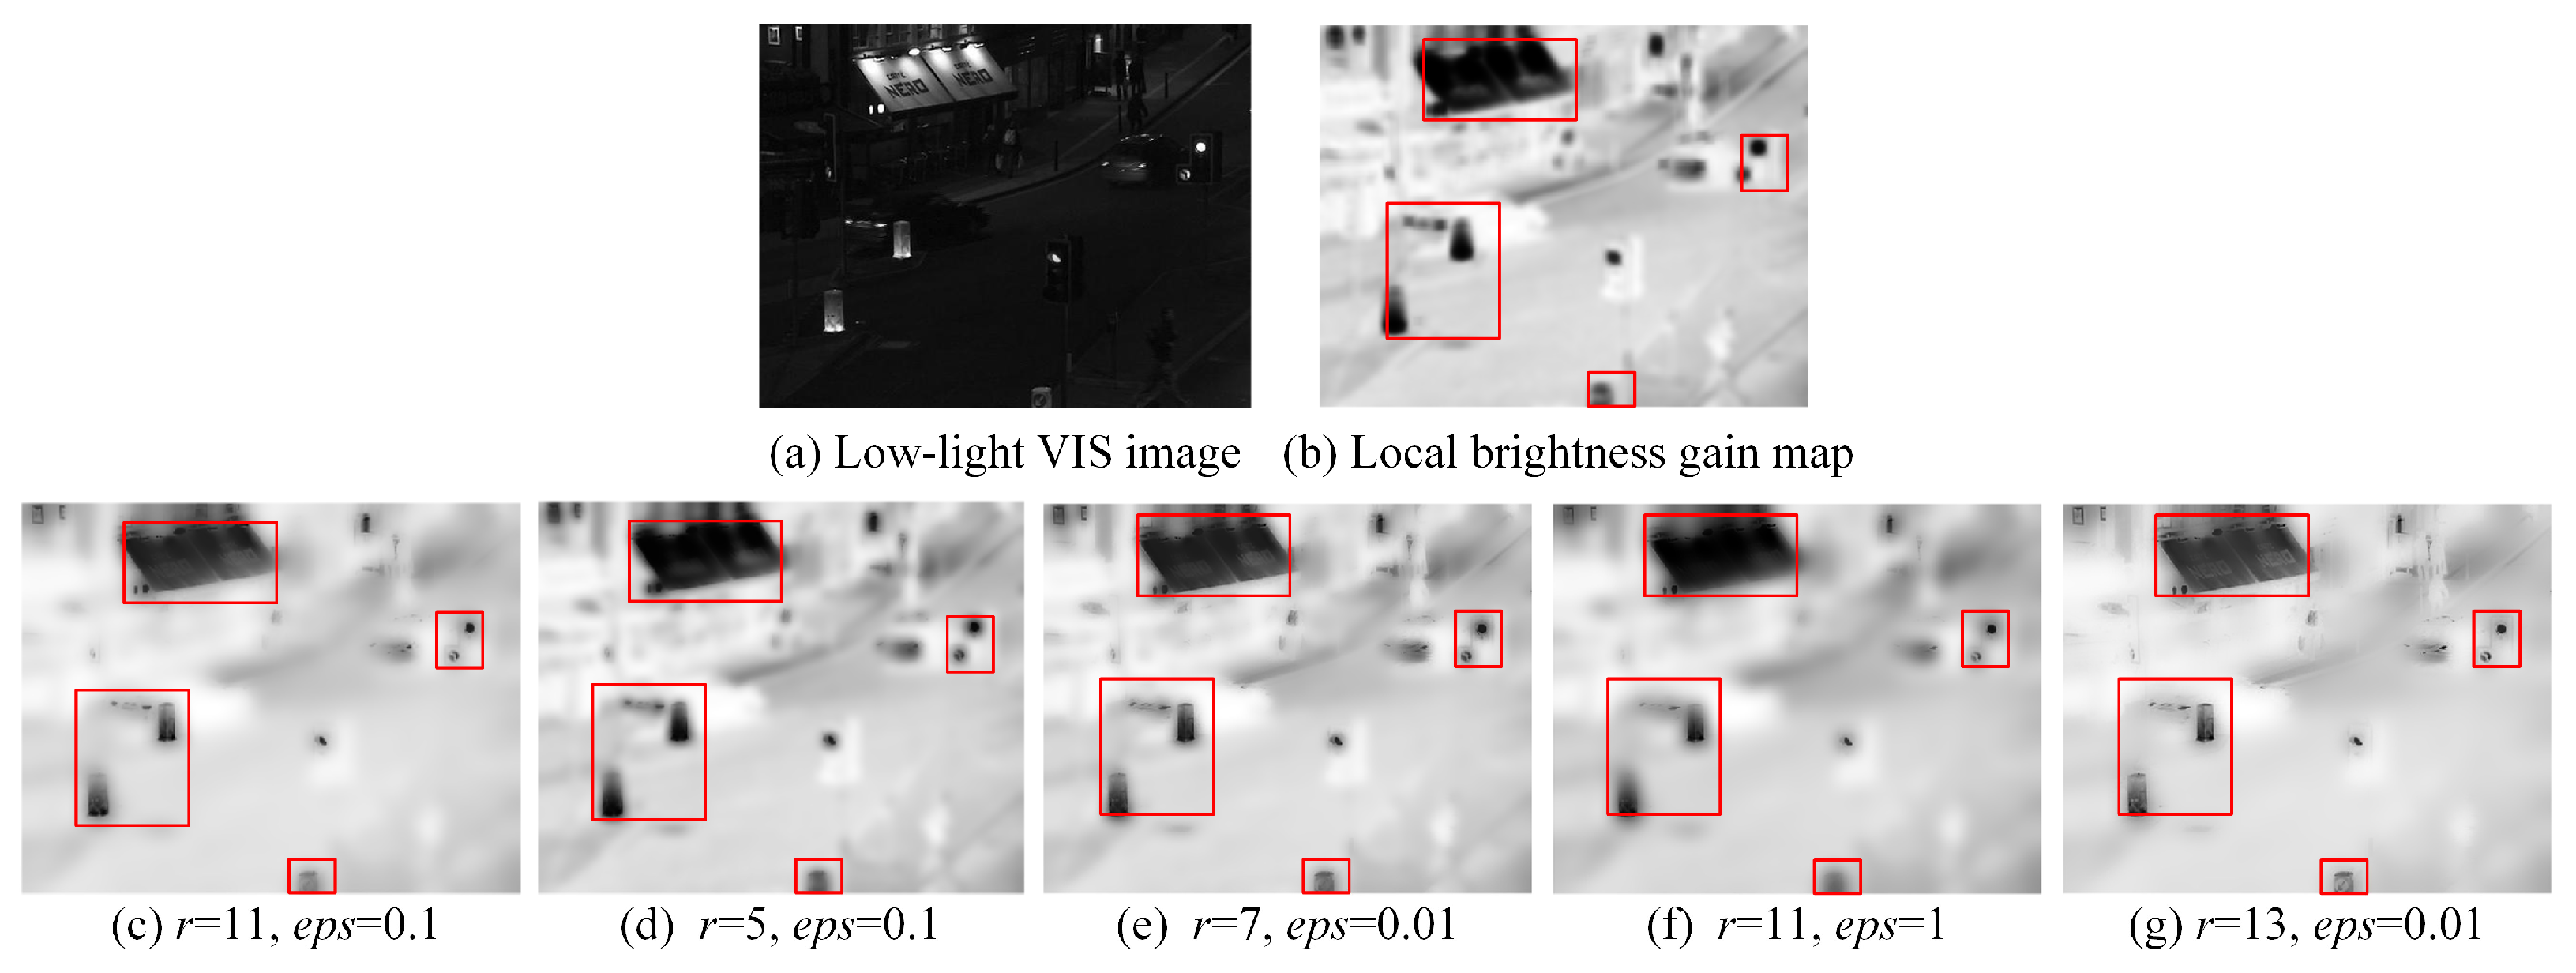
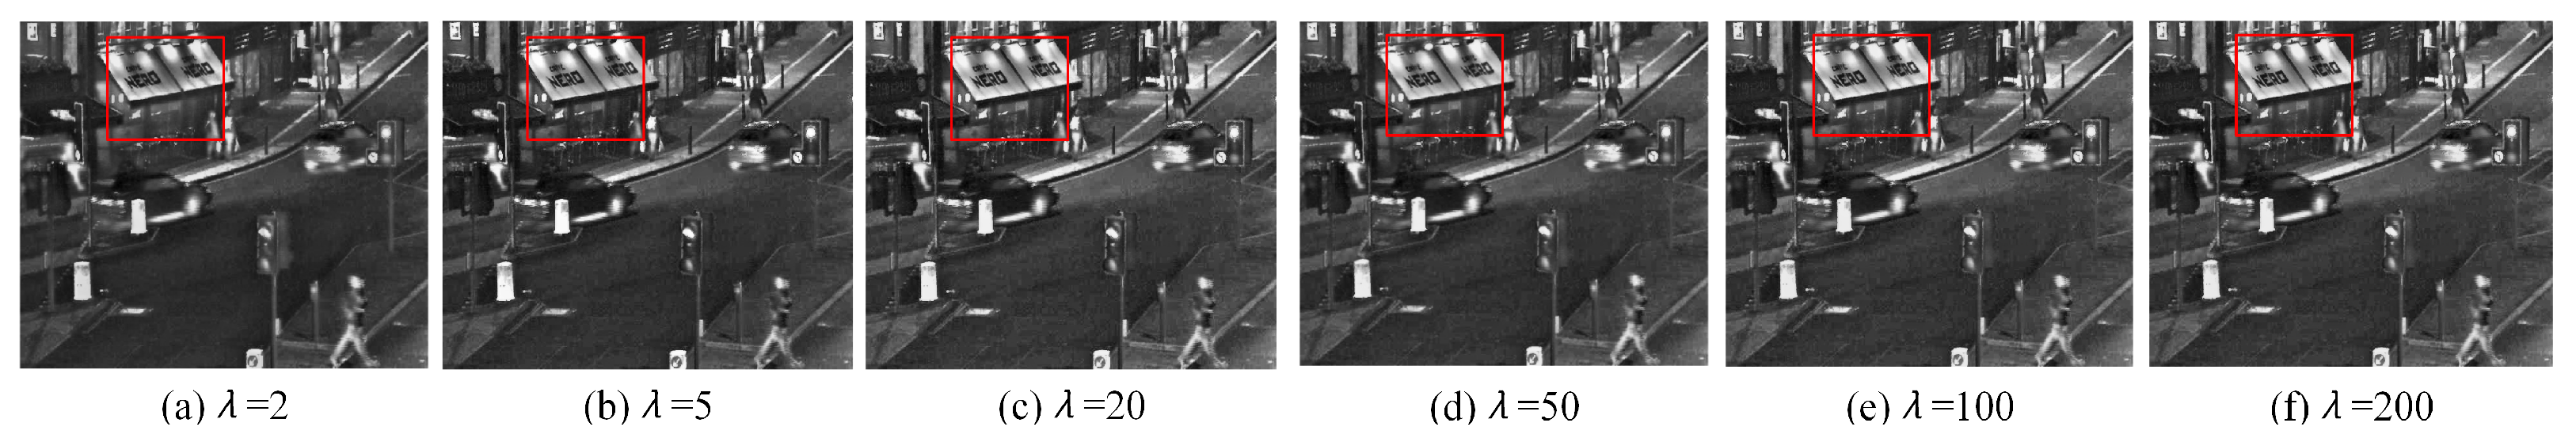
4.3. Effect Analysis of Free Parameters

The brightness gain coefficient C in Equation (2) controls the degree of enhancement applied to the source image. A small C value results in insufficient contrast enhancement, failing to reveal object details, while an excessively large C over-amplifies edges, causing contrast imbalance. Figure 8 shows a detailed analysis of histogram evolution under varying enhancement parameters (C = 2 to 10). The results reveal that, while increasing C values effectively expand the histogram and improve image contrast, they introduce characteristic artifacts in the mid-tone range (0.4–0.6 intensity). Specifically, at C = 6, the histogram begins to exhibit subtle discontinuities—manifested as minor gaps and abrupt transitions—due to the algorithm’s localized contrast stretching of originally smooth luminance gradients. These artifacts become significantly more pronounced at C = 8, where the histogram shows visible fragmentation and artificial segmentation of continuous tonal distributions. This phenomenon occurs because the enhancement algorithm’s aggressive contrast expansion disproportionately amplifies mid-tone variations, particularly in regions with naturally gradual transitions, like skies or shadows. Importantly, while the artifacts at C = 6 remain below perceptual thresholds and only detectable through statistical analysis, those at C = 8 may become visually apparent in certain scenarios. Our comprehensive evaluation confirms that C = 6 represents the optimal trade-off, providing substantial contrast improvement while maintaining acceptable histogram integrity, whereas higher values prioritize dynamic range expansion at the cost of introducing noticeable artifacts in the mid-tone regions.
In Equation (4), mean filtering generates the initial brightness gain map but introduces halo artifacts and edge blurring. To mitigate these issues, we employ the SWGF method for refined mapping, which effectively suppresses halos. As illustrated in Figure 9, the optimal results are achieved with parameters r = 13 and ε = 0.01, preserving edge sharpness. Furthermore, Figure 10 analyzes the influence of parameter λ in Equation (17) on fusion performance. At λ = 2, infrared details appear faint. Increasing λ enhances the prominence of infrared features, particularly in bright regions; however, excessively high values (e.g., λ > 20) lead to overexposure. The best fusion performance is attained at λ = 20.

4.4. Comparisons of Fusion Results with Different Methods

We evaluated the proposed fusion method using ten image pairs from the TNO and M3FD datasets. For comparison, we selected eight state-of-the-art techniques: six traditional methods (CBF [48], DRTV [49], MLGCF [50], MSID [12], PM [51], and RGFTV [17]) and two deep learning-based approaches (DenseFuse [32] and SeAFusion [17]). All methods were implemented according to their original papers. The experiments were conducted on a desktop equipped with a 3.6 GHz Intel Core CPU and 64 GB of RAM. To objectively assess performance, we employed eight evaluation metrics: VIF [52], SF [53], AG [54], SD [55], CC [56], PSNR [57], EN [58], and QABF [59]. These metrics cover both reference and non-reference indices, providing a comprehensive assessment of information content, human perception, and image characteristics.

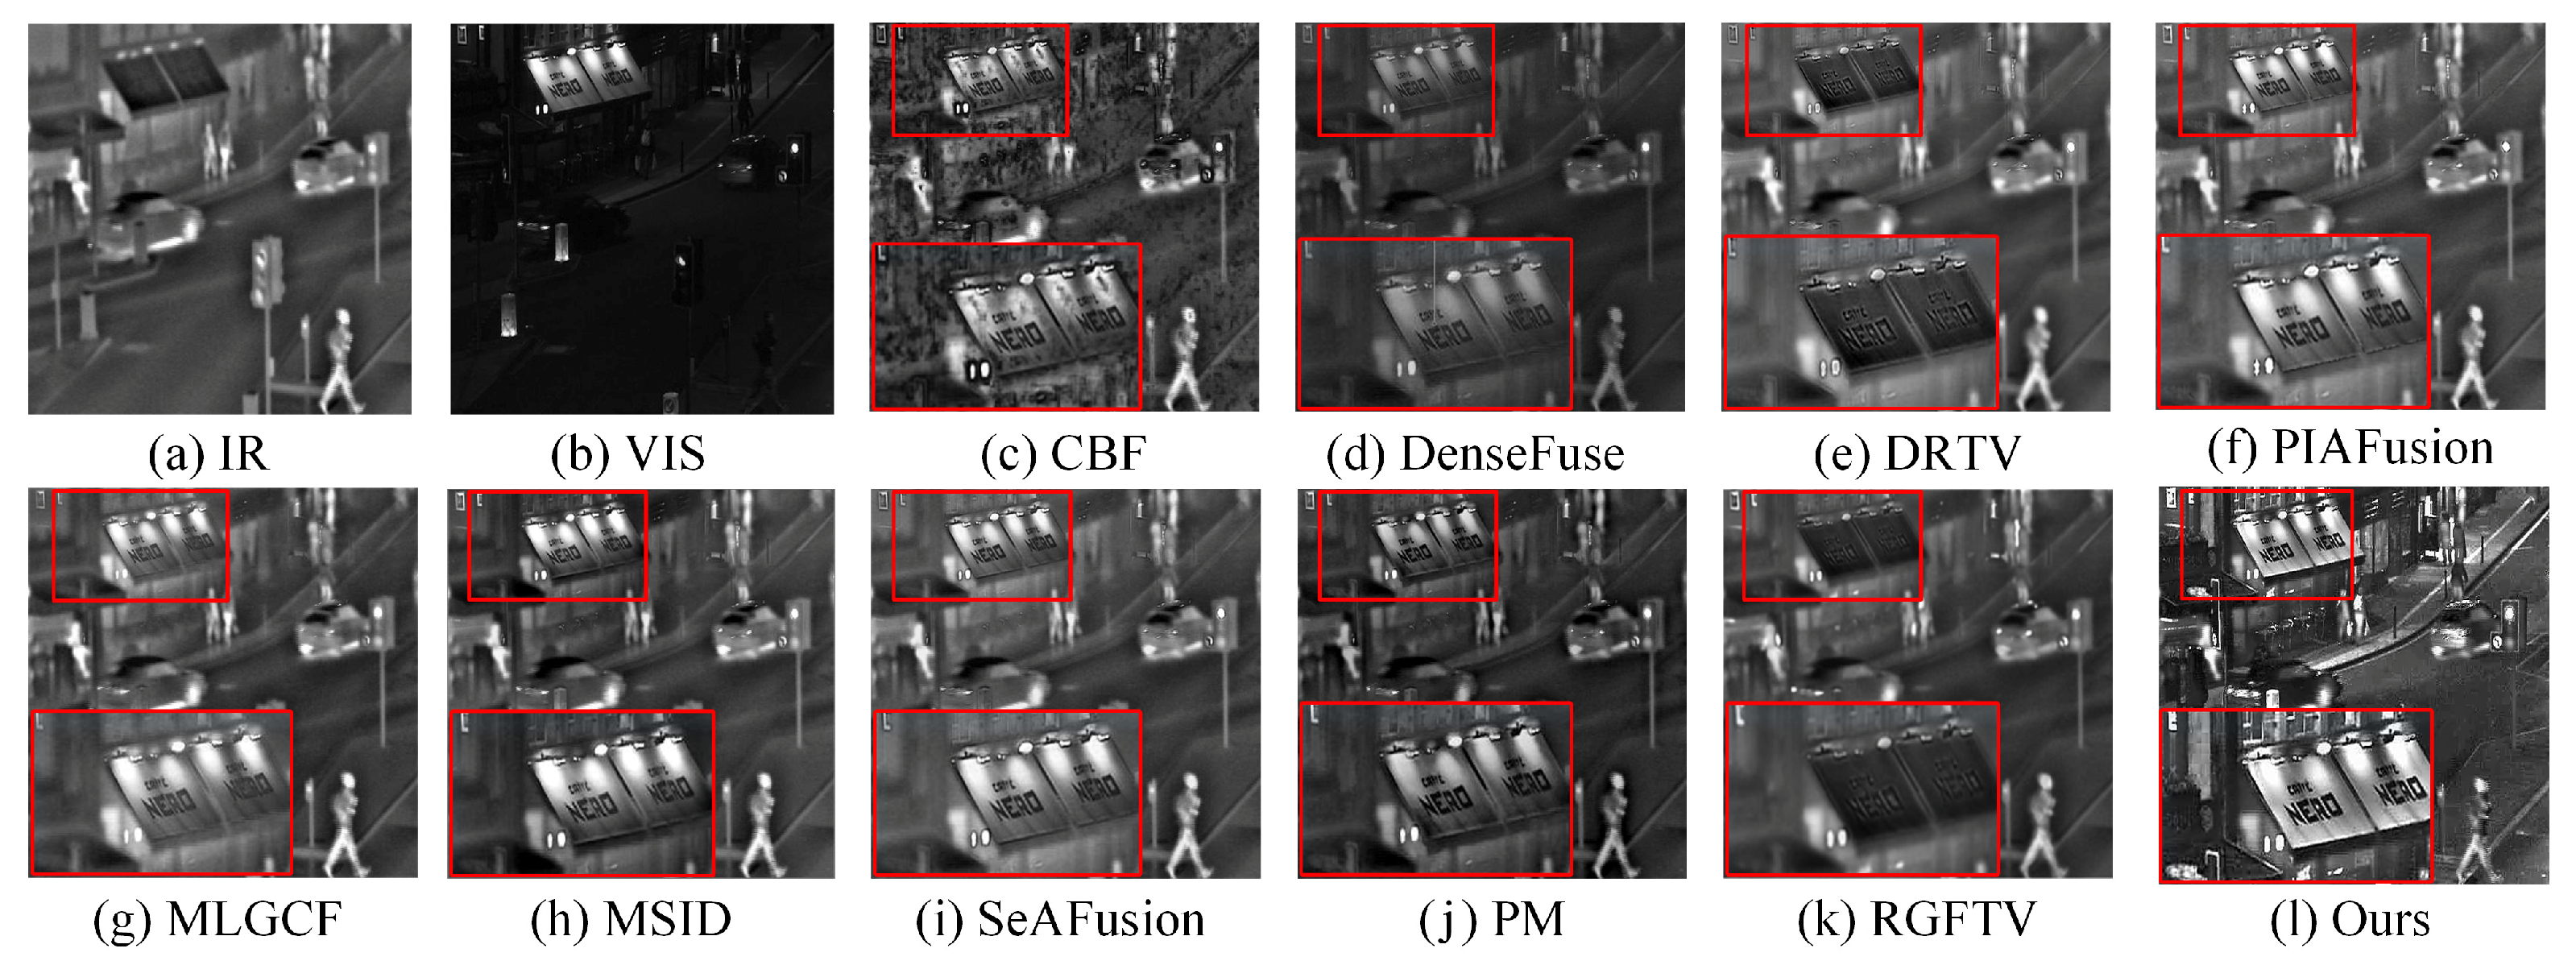
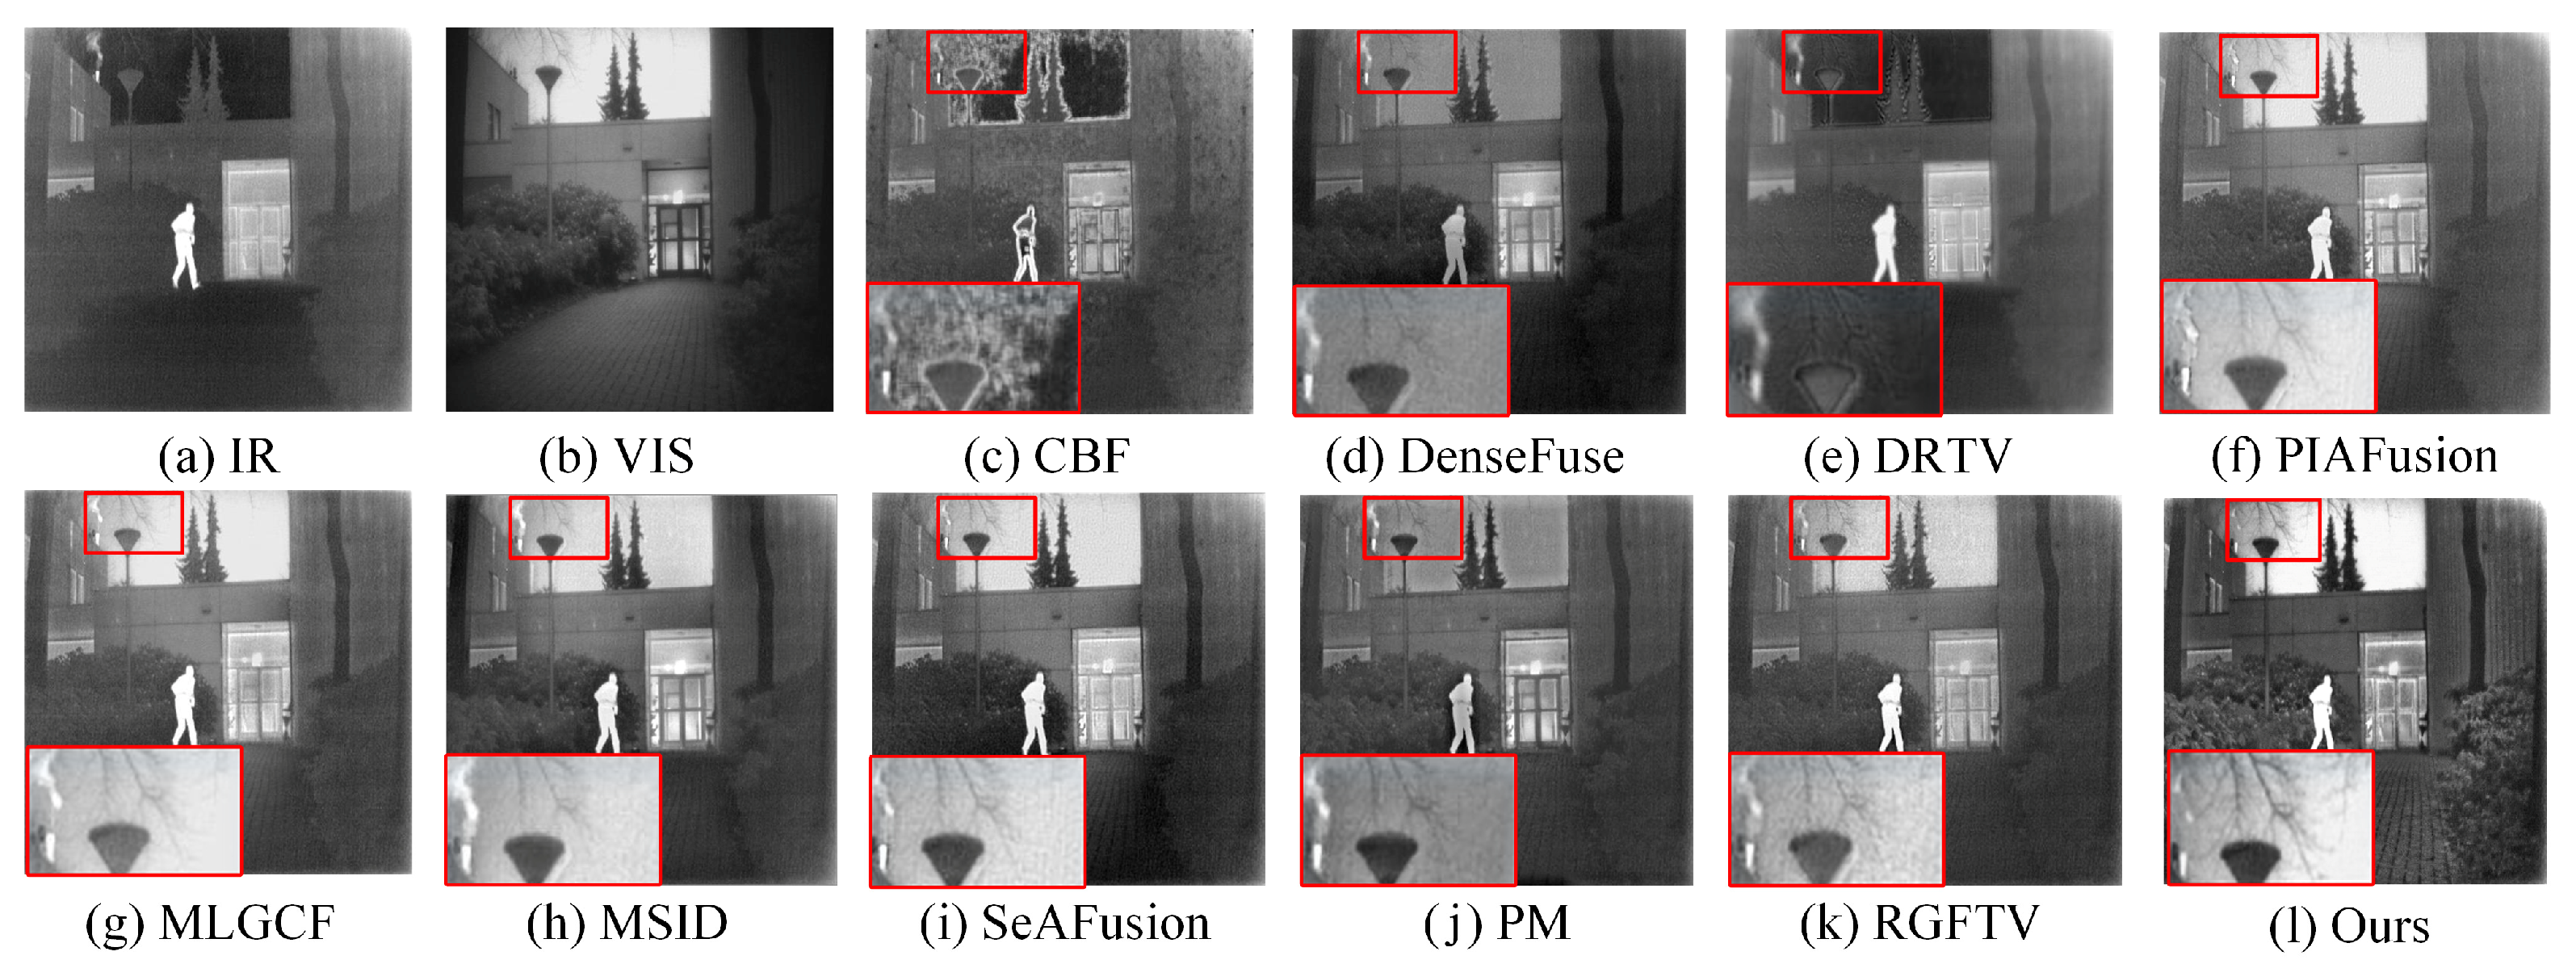
4.4.1. Qualitative Comparisons

Figure 11 shows a comparative analysis of fusion results using the “Queens Road” image pair. The visible (VIS) image in Figure 11a clearly depicts pedestrians, vehicles, and street lighting, while the corresponding low-brightness image in Figure 11b only retains legible text (“NERO”) with most other visual information lost. As shown in Figure 11c–j, the existing methods exhibit noticeable limitations, particularly in preserving fine textures and edge details, as evidenced by the blurred or missing features in the marked regions. By contrast, our proposed method (Figure 11k) demonstrates superior performance by simultaneously maintaining thermal targets and enhancing subtle details in low-light areas, as clearly visible in the magnified inset.
Figure 12 shows the fusion result of the “Kaptein_1123” image pair. Figure 12a,b show the clear image of a passerby. Figure 12c–k display fused images from various methods. CBF, DenseFuse, DRTV, and PM fail to preserve the sky’s brightness and introduce artifacts around the people. By contrast, MLGCF, MSID, SeAFusion, RGFTV, and VCAFusion retain the background brightness and key elements. However, VCAFusion excels by preserving edges and details in low-light regions, as seen in the enlarged red area, with clearer details of bushes, ground gaps, and tree branches in Figure 12k.
Figure 13 shows the fusion performance analysis for the “01432” image pair under challenging visibility conditions. The thermal image (Figure 13a) clearly displays pedestrian thermal signatures, while the corresponding visible (VIS) image (Figure 13b) suffers from significant smoke occlusion that obscures the pedestrian details. Our comparative evaluation reveals that most fusion methods, with the exception of MLGCF, SeAFusion, and our proposed approach, fail to adequately preserve thermal target information. While MLGCF successfully enhances the thermal target brightness, it introduces undesirable edge blurring in the pedestrian regions. By contrast, both SeAFusion and our method demonstrate robust performances, with our approach exhibiting superior capabilities in (1) maintaining optimal contrast balance, (2) preserving finer texture details (particularly evident in the annotated regions), and (3) achieving more comprehensive information integration from both modalities.
Figure 14 presents the fusion results for the “01454” image pair, consisting of an infrared (IR) image (Figure 14a) and a visible (VIS) image (Figure 14b) captured under low-light conditions that significantly degrade texture details. A comparative analysis of the nine fusion methods (Figure 14c–k) reveals distinct performance characteristics. DenseFuse and MLGCF exhibit noticeable blurring artifacts in the highlighted region (red box). While DRTV, MSID, SeAFusion, PM, RGFTV, and our method successfully maintain both infrared targets and visible features, our approach demonstrates superior performance in three key aspects, including (1) enhanced contrast optimization, (2) improved detail preservation in architectural elements (window structures), and (3) clearer rendering of natural features (tree branches), as particularly evident in the marked region of Figure 14k.
In summary, all nine methods completed the fusion task. MSID and SeAFusion excelled in capturing heat targets and VIS textures but struggled in low-light conditions. Other methods often suffered from brightness imbalances and detail loss. VCAFusion adapted brightness and contrast, avoided artifacts, and retained weak textures and thermal targets effectively, making it versatile in varying lighting environments.

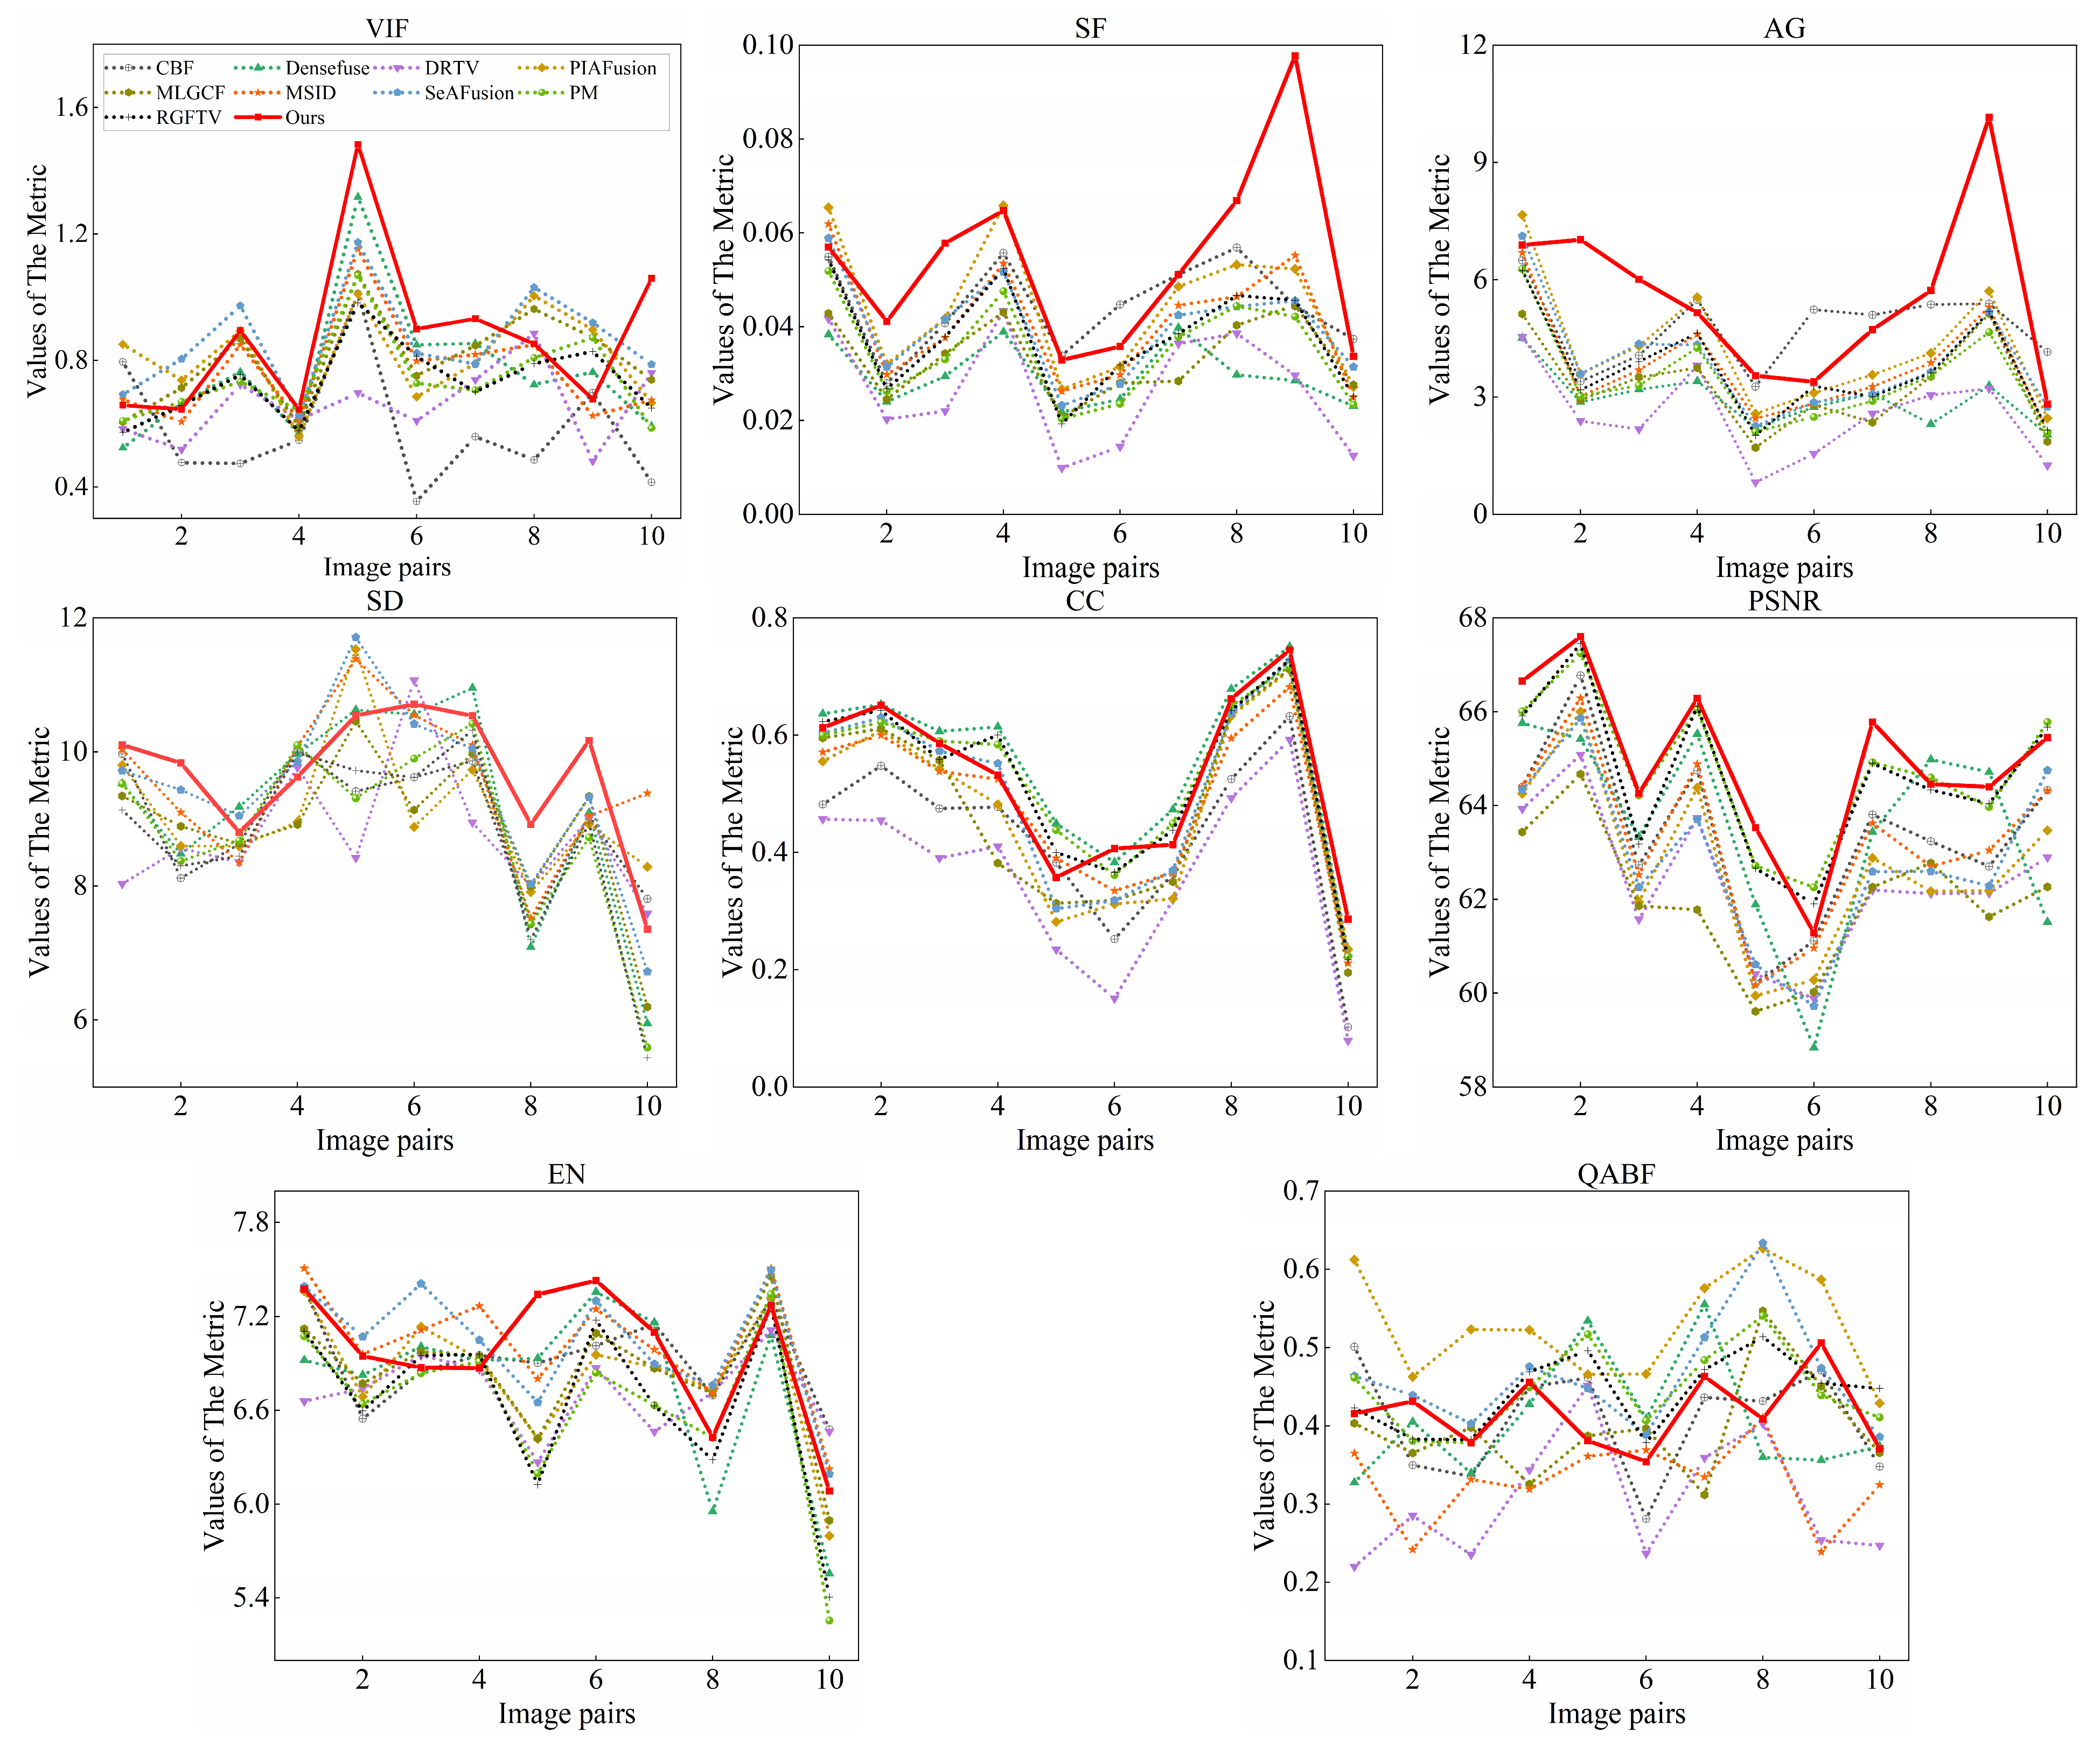
4.4.2. Quantitative Comparisons

The quantitative evaluation presented in Table 2 and Table 3 demonstrates VCAFusion’s superior performance across multiple metrics. Our method achieved the highest scores in visual information fidelity (VIF), spatial frequency (SF), average gradient (AG), and correlation coefficient (CC), while securing second place in both peak signal-to-noise ratio (PSNR) and QABF metrics. These results highlight the following two key strengths of our approach: (1) exceptional preservation of edge details and gradient information, as evidenced by its leading SF and AG scores, and (2) outstanding visual saliency representation, indicated by its top VIF performance. The consistent superiority of VCAFusion is further corroborated by the comparative line graphs in Figure 15 and Figure 16, which show our method maintaining dominant positions in VIF, SF, and AG metrics while remaining competitive across all other evaluated criteria.
Table 4 shows a comparative analysis of computational efficiency across different fusion methods. While deep learning-based approaches (e.g., DenseFuse, SeAFusion) achieve reasonable processing speeds with GPU acceleration, they incur substantial training overhead and lack interpretability due to their black-box nature. By contrast, the traditional methods exhibit higher computational efficiency without requiring pre-training. Our method strikes an optimal balance, delivering competitive processing speeds while avoiding the training burden and transparency limitations of deep learning. Although our approach involves multiple steps (retinex decomposition, SWGF, saliency weighting, and three-layer fusion), its computational complexity remains manageable for real-time deployment. Specifically, the runtime scales linearly with input resolution, and the memory footprint is dominated by intermediate feature maps rather than learned parameters.

4.5. Ablation Study

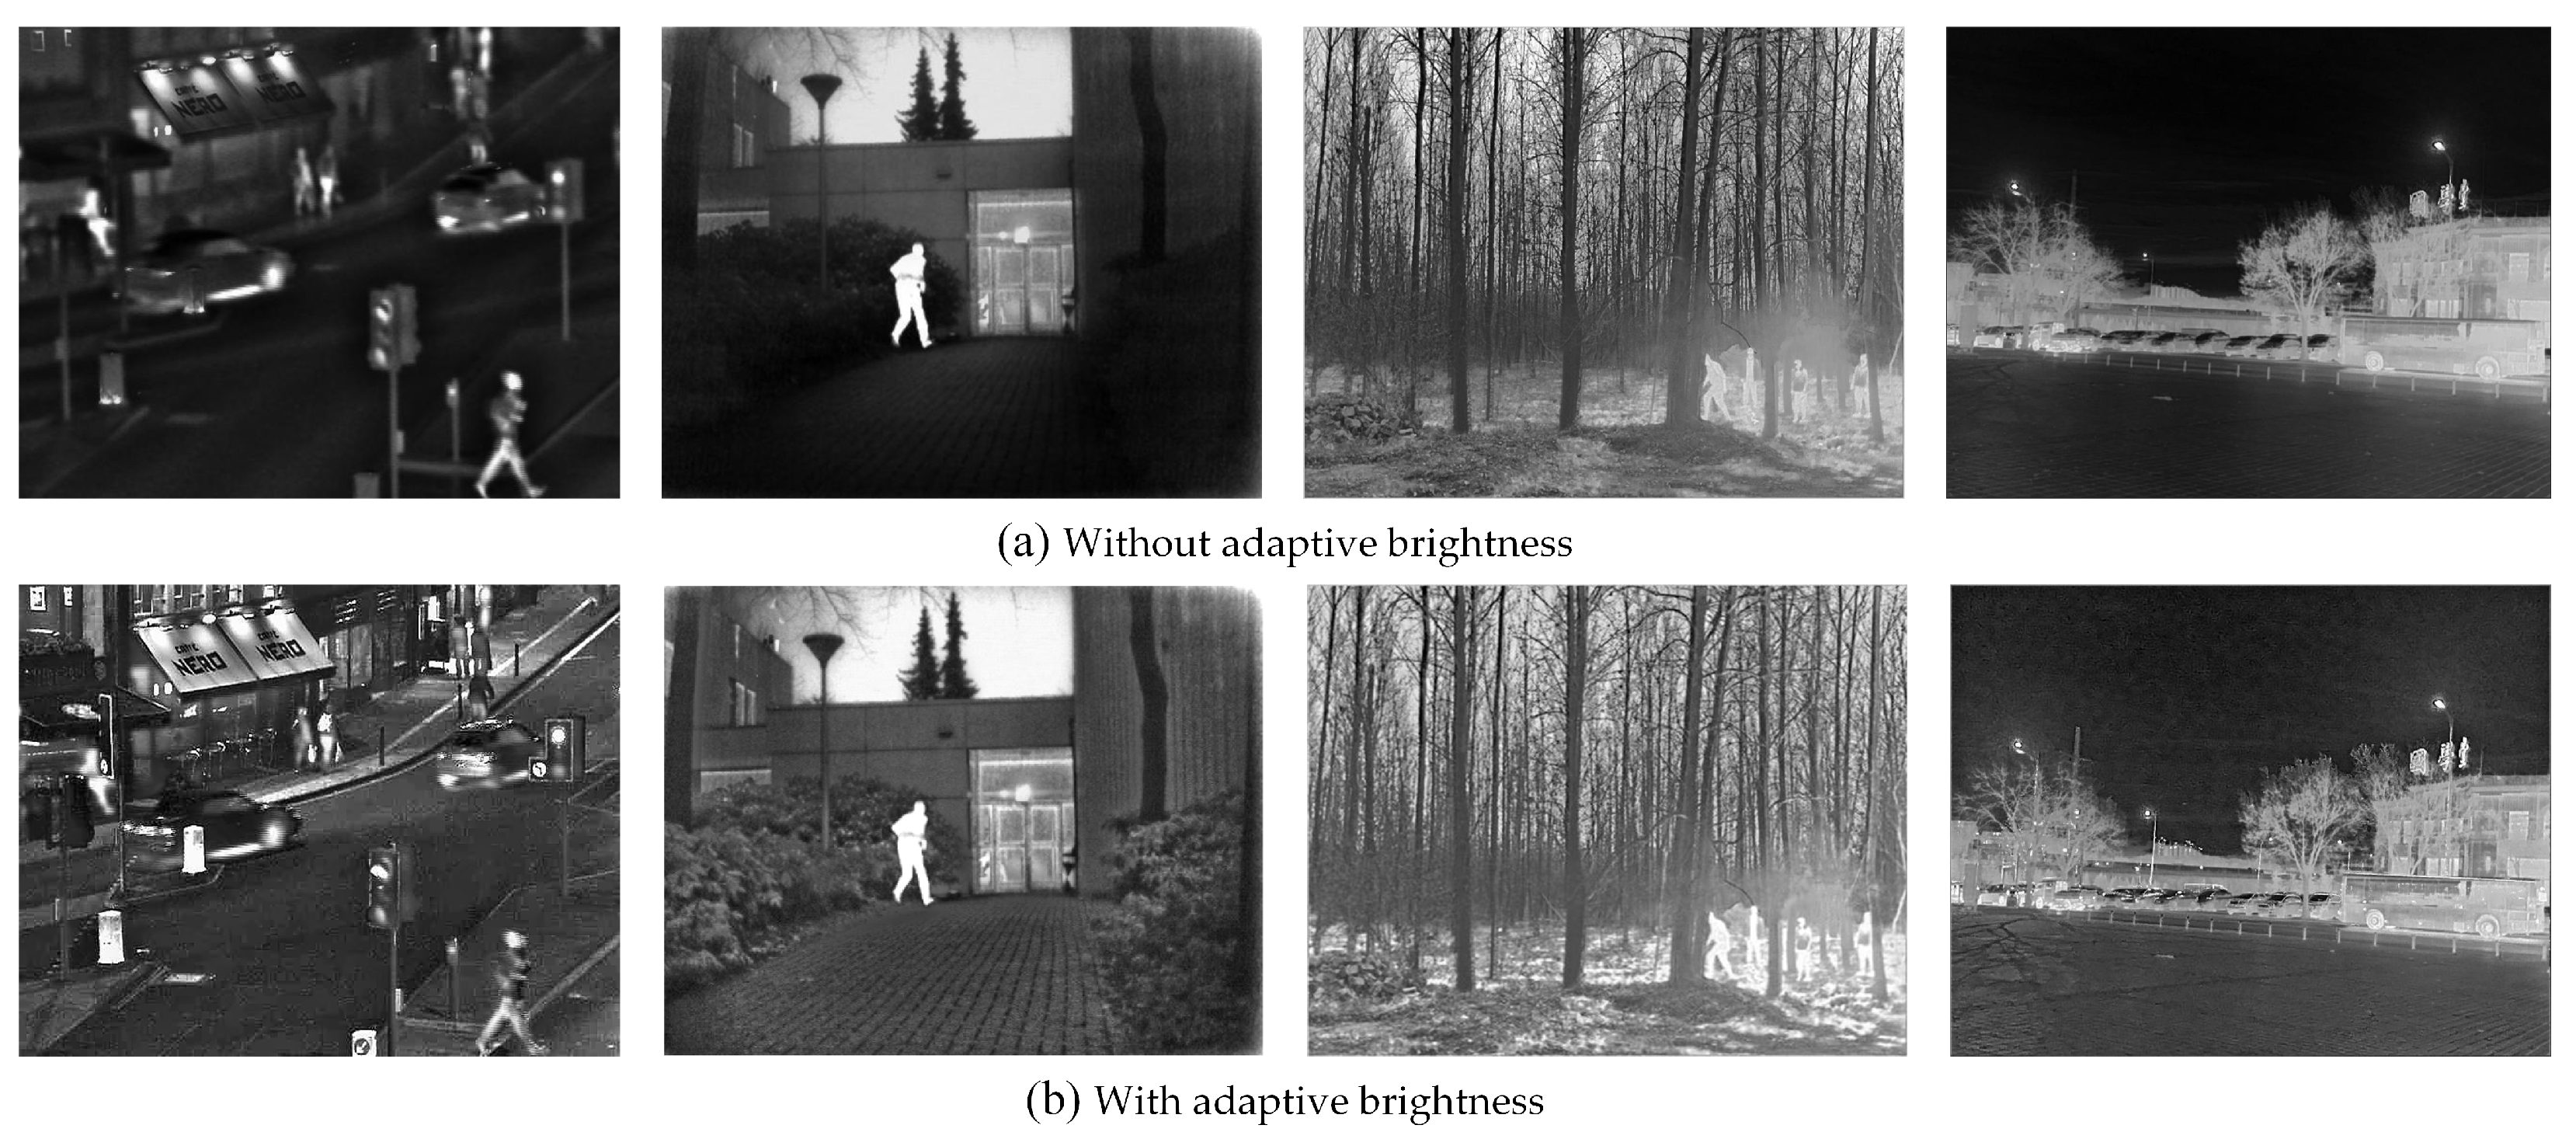
4.5.1. Analysis on Adaptive Brightness

To evaluate the effectiveness of the proposed adaptive brightness enhancement (ADB) in multiscale information fusion, we conducted a comparative analysis of fusion performance with and without ADB. As shown in Figure 17, the fused images produced without ADB exhibited inferior quality, demonstrating the necessity of ADB for effectively integrating multiscale contrast features in our method. The quantitative results in Table 5 further validated this observation. Across all evaluation metrics—VIF, SF, AG, CC, and EN—the ADB-enhanced approach consistently outperformed the non-ADB variant. For instance, in the “Queens Road” image, ADB improved VIF from 0.758 to 0.82 and AG from 2.294 to 3.683. Similarly, for “Kaptein_1123,” ADB increased SF from 0.03 to 0.057 and AG from 2.281 to 5.01. These results highlight the significant role of ADB in enhancing fusion performance, as it achieves superior results in all tested scenarios.

4.5.2. Analysis of Saliency-Preserving Strategy

To evaluate the effectiveness of the proposed saliency-preserving strategy (SAP) for multiscale information fusion, we conducted ablation experiments comparing fusion performance with and without SAP. As shown in Figure 18, the fused images without SAP exhibited noticeable quality degradation, demonstrating the importance of the saliency-preserving strategy for effective multiscale feature integration. The quantitative results in Table 6 further confirmed this observation, where the SAP strategy consistently outperformed the baseline across all evaluation metrics. For example, significant improvements can be seen in metrics like Average Gradient and Spatial Frequency, particularly for images such as “Kaptein_1123” and “01432”. These results clearly validate the necessity of incorporating the saliency-preserving strategy in our fusion framework.

5. Conclusions

This paper presents a novel darkness-free infrared and visible image fusion framework based on visual characteristics adjustment. The proposed adaptive low-light adjustment model effectively eliminates degraded illumination while preserving weak details. By employing multi-scale structure decomposition and tailored fusion strategies for the base, detail, and saliency layers, our method enhances both thermal and visual information. Comprehensive evaluations demonstrate that our approach surpasses eight existing methods in both objective metrics and visual quality, delivering fused images with superior detail preservation and contrast. The proposed technique holds significant potential for applications such as low-light image enhancement, surveillance, and object detection in challenging environments.
Despite these advantages, several limitations warrant further investigation. First, the current framework assumes well-registered input images; the performance may degrade under significant sensor misalignment, necessitating robust registration preprocessing. Second, while the model adapts to varying illumination, parameter-tuning may still be required for extreme conditions, such as dense fog, occlusion, or thermal saturation. Additionally, real-time deployment under computational constraints remains an open challenge. Future work will explore task-driven fusion strategies and optimization for real-time processing to broaden the method’s applicability.

Author Contributions

Conceptualization, J.L.; data curation, J.L.; methodology, J.L., J.P. and R.Z.; software, J.L.; validation, J.L., J.P. and Z.H.; formal analysis, J.L.; resources, J.P.; investigation, J.P.; writing—original draft preparation, J.L.; writing—review and editing, Z.H. and R.Z.; supervision, X.Z. and R.Z. All authors have read and agreed to the published version of the manuscript.

Funding

This research was funded by [Presidential Foundation of CAEP] grant number [YZJJZQ2022001]. This research was funded by [Presidential Foundation of China Academy of Engineering Physics], grant number YZJJZQ2022001.

Institutional Review Board Statement

Not applicable.

Informed Consent Statement

Not applicable.

Data Availability Statement

The raw data supporting the conclusions of this article will be made available by the corresponding author upon reasonable request after the completion of ongoing related studies.

Acknowledgments

We sincerely thank Xiaoyan Wu, Yumeng Feng, and Shaoqin Yuan for their valuable suggestions on graphical visualization that significantly improved the manuscript’s presentation.

Conflicts of Interest

The authors declare no conflicts of interest.

References

  1. Liu, H.; Ma, M.; Wang, M.; Chen, Z.; Zhao, Y. SCFusion: Infrared and Visible Fusion Based on Salient Compensation. Entropy 2023, 25, 985. [Google Scholar] [CrossRef] [PubMed]
  2. Tang, L.; Xiang, X.; Zhang, H.; Gong, M.; Ma, J. DIVFusion: Darkness-free infrared and visible image fusion. Inf. Fusion 2023, 91, 477–493. [Google Scholar] [CrossRef]
  3. Zhou, Z.; Fei, E.; Miao, L.; Yang, R. A perceptual framework for infrared visible image fusion based on multiscale structure decomposition and biological vision. Inf. Fusion 2023, 93, 174–191. [Google Scholar] [CrossRef]
  4. Zhang, X.; Demiris, Y. Visible and infrared image fusion using deep learning. IEEE Trans. Pattern Anal. Mach. Intell. 2023, 45, 10535–10554. [Google Scholar] [CrossRef]
  5. Cai, H.; Zhuo, L.; Chen, X.; Zhang, W. Infrared and visible image fusion based on BEMSD and improved fuzzy set. Infrared Phys. Technol. 2019, 98, 201–211. [Google Scholar] [CrossRef]
  6. Ma, J.; Tang, L.; Xu, M.; Zhang, H.; Xiao, G. STDFusionNet: An infrared and visible image fusion network based on salient target detection. IEEE Trans. Instrum. Meas. 2021, 70, 5009513. [Google Scholar] [CrossRef]
  7. Luo, X.; Fu, G.; Yang, J.; Cao, Y.; Cao, Y. Multi-modal Image Fusion via Deep Laplacian Pyramid Hybrid Network. IEEE Trans. Circ. Syst. Video. Technol. 2023, 33, 7354–7369. [Google Scholar] [CrossRef]
  8. Sharma, A.M.; Dogra, A.; Goyal, B.; Vig, R.; Agrawal, S. From pyramids to state-ofthe-art: A study and comprehensive comparison of visible–infrared image fusion techniques. IET Image Process. 2020, 14, 1671–1689. [Google Scholar] [CrossRef]
  9. Guo, L.; Cao, X.; Liu, L. Dual-tree biquaternion wavelet transform and its application to color image fusion. Signal Process. 2020, 171, 107513. [Google Scholar] [CrossRef]
  10. Chen, J.; Li, X.; Luo, L.; Ma, J. Multi-focus image fusion based on multi-scale gradients and image matting. IEEE Trans. Multim. 2021, 24, 655–667. [Google Scholar] [CrossRef]
  11. Li, H.; Qi, X.; Xie, W. Fast Infrared and visible image fusion with structural decomposition. Knowl.-Based Syst. 2020, 204, 106182. [Google Scholar] [CrossRef]
  12. Zhang, S.; Huang, F.; Liu, B.; Li, G.; Chen, Y.; Chen, Y.; Zhou, B.; Wu, D. A multi-modal image fusion framework based on guided filter and sparse representation. Opt. Lasers Eng. 2021, 137, 106354. [Google Scholar] [CrossRef]
  13. Yang, Y.; Zhang, Y.; Huang, S.; Zuo, Y.; Sun, J. Infrared and visible image fusion using visual saliency sparse representation and detail injection model. IEEE Trans. Instrum. Meas. 2020, 70, 5001715. [Google Scholar] [CrossRef]
  14. Chen, J.; Wu, K.; Cheng, Z.; Luo, L. A saliency based multiscale approach for infrared and visible image fusion. Signal Process 2021, 182, 107936. [Google Scholar] [CrossRef]
  15. Liu, X.; Huo, H.; Yang, X.; Li, J. A three-dimensional feature- based fusion strategy for infrared and visible image fusion. Pattern Recognit. 2025, 157, 110885. [Google Scholar] [CrossRef]
  16. Xu, C.; Liu, L.; Kong, X. The fusion of Infrared and visible images via decomposition-based structure transfer and local saliency detection. Opt. Lasers Technol. 2022, 149, 107787. [Google Scholar]
  17. Tang, W.; He, F.; Liu, Y. ITFuse: An interactive transformer for infrared and visible image fusion. Pattern Recognit. 2024, 156, 110822. [Google Scholar] [CrossRef]
  18. Tang, L.; Yuan, J.; Ma, J. Image fusion in the loop of high-level vision tasks: A semantic-aware real-time Infrared and visible image fusion network. Inf. Fusion 2022, 82, 28–42. [Google Scholar] [CrossRef]
  19. Liu, J.; Fan, X.; Huang, Z.; Wu, G.; Liu, R.; Zhang, W.; Luo, Z. Target-aware dual adversarial learning and a multi-scenario multi-modality benchmark to fuse Infrared and visible for object detection. In Proceedings of the IEEE International Conference on Computer Vision, New Orleans, LA, USA, 18–24 June 2022; pp. 5802–5811. [Google Scholar]
  20. Tang, L.; Zhang, H.; Xu, H.; Ma, J. Rethinking the necessity of image fusion in high-level vision tasks: A practical infrared and visible image fusion network based on progressive semantic injection and scene fidelity. Inf. Fusion 2023, 99, 101870. [Google Scholar] [CrossRef]
  21. Yin, H.; Gong, Y.; Qiu, G. Side window filtering. In Proceedings of the IEEE International Conference on Computer Vision, Long Beach, CA, USA, 15–20 June 2019; pp. 8758–8766. [Google Scholar]
  22. Liu, Y. Region level based multi-focus image fusion using quaternion wavelet and normalized cut. Signal Process. 2014, 97, 9–30. [Google Scholar] [CrossRef]
  23. Liu, W.; Mei, W.; Du, H. Structure tensor and nonsubsampled shearlet transform based algorithm for CT and MRI image fusion. Neurocomputing 2017, 235, 131–139. [Google Scholar] [CrossRef]
  24. Choi, M.; Kim, R.Y.; Nam, M.R.; Kim, H.O. Fusion of multispectral and panchromatic satellite images using the curvelet transform. IEEE Geosci. Remote Sens. Lett. 2005, 2, 136–140. [Google Scholar] [CrossRef]
  25. Zhang, Q.; Xavier, M. An adaptive fusion method for infrared and visible images based on NSCT and compressed sensing. Infrared Phys. Technol. 2016, 74, 11–20. [Google Scholar] [CrossRef]
  26. Li, S.; Kang, X.; Hu, J. Image fusion with guided filtering. IEEE Trans. Image Process. 2013, 22, 2864–2875. [Google Scholar]
  27. Hu, J.; Li, S. The multiscale directional bilateral filter and its application to multisensor image fusion. Inf. Fusion 2012, 13, 196–206. [Google Scholar] [CrossRef]
  28. Tan, W.; Zhou, H.; Song, J.; Li, H.; Yu, Y.; Du, J. Infrared and visible image perceptive fusion through multi-level Gaussian curvature filtering image decomposition. Appl. Opt. 2019, 58, 3064–3073. [Google Scholar] [CrossRef]
  29. Zou, D.; Bin, Y. Infrared and low-light visible image fusion based on hybrid multiscale decomposition and adaptive light adjustment. Opt. Lasers Eng. 2023, 160, 107268. [Google Scholar] [CrossRef]
  30. Cvejic, N.; Bull, D.; Canagarajah, N. Region-based multi-modal image fusion using ICA bases. IEEE Sens. J. 2007, 7, 743–751. [Google Scholar] [CrossRef]
  31. Fu, Z.; Wang, X.; Xu, J.; Zhou, N.; Zhao, Y. Infrared and visible images fusion based on RPCA and NSCT. Infrared Phys. Technol. 2016, 77, 114–123. [Google Scholar] [CrossRef]
  32. Kong, W.; Lei, Y.; Zhao, H. Adaptive fusion method of visible light and infrared images based on non-subsampled shearlet transform and fast non-negative matrix factorization. Infrared Phys. Technol. 2014, 67, 161–172. [Google Scholar] [CrossRef]
  33. Li, H.; Wu, X. DenseFuse: A fusion method to infrared and visible images. IEEE Trans. Image Process. 2018, 28, 2614–2623. [Google Scholar] [CrossRef] [PubMed]
  34. Xu, H.; Ma, J.; Le, Z.; Jiang, J.; Guo, X. FusionDN: A unified densely connected network for image fusion. Proc. AAAI Conf. Artif. Intell. 2020, 34, 12484–12491. [Google Scholar] [CrossRef]
  35. Ma, J.; Yu, W.; Liang, P.; Li, C.; Jiang, J. FusionGAN: A generative adversarial network for infrared and visible image fusion. Inf. Fusion 2019, 48, 11–26. [Google Scholar] [CrossRef]
  36. Prabhakar, K.R.; Srikar, V.S.; Babu, R.V. Deepfuse: A deep unsupervised method for exposure fusion with extreme exposure image pairs. In Proceedings of the IEEE International Conference on Computer Vision, Venice, Italy, 22–29 October 2017. [Google Scholar]
  37. Huang, S.; Cheng, F.; Chiu, Y. Efficient contrast enhancement using adaptive gamma correction with weighting distribution. IEEE Trans. Image Process. 2012, 22, 1032–1041. [Google Scholar] [CrossRef]
  38. Kim, T.; Paik, J.; Kang, B. Contrast enhancement system using spatially adaptive histogram equalization with temporal filtering. IEEE Trans. Consum. Electron. 1998, 44, 82–87. [Google Scholar]
  39. Jobson, D.J.; Rahman, Z.; Woodell, G.A. Properties and performance of a center/surround retinex. IEEE Trans. Image Process. 1997, 6, 451–462. [Google Scholar] [CrossRef]
  40. Rahman, Z.; Jobson, D.J.; Woodell, G.A. Retinex processing for automatic image enhancement. J. Electron. Imaging 2004, 13, 100–110. [Google Scholar]
  41. Lore, K.G.; Akintayo, A.; Sarkar, S. Llnet: A deep autoencoder method to natural low-light image enhancement. Pattern Recognit. 2017, 61, 650–662. [Google Scholar] [CrossRef]
  42. Chen, W.; Wang, W.; Yang, W.; Liu, J. Deep retinex decomposition for low-light enhancement. arXiv 2018, arXiv:1808.04560. [Google Scholar]
  43. Wang, W.; Chen, Z.; Yuan, X.; Wu, X. Adaptive image enhancement method for correcting low-illumination images. Inform. Scien. 2019, 496, 25–41. [Google Scholar] [CrossRef]
  44. Toet, A.; Franken, E. Perceptual evaluation of different image fusion schemes. Displays 2003, 24, 25–37. [Google Scholar] [CrossRef]
  45. Zhou, Z.; Dong, M.; Xie, X.; Gao, Z. Fusion of infrared and visible images for night-vision context enhancement. Appl. Opt. 2016, 55, 6480–6490. [Google Scholar] [CrossRef] [PubMed]
  46. Fu, X.; Zeng, D.; Huang, Y.; Zhang, X.; Ding, X. A weighted variational model for simultaneous reflectance and illumination estimation. In Proceedings of the IEEE International Conference on Computer Vision, Las Vegas, NV, USA, 27–30 June 2016; pp. 2782–2790. [Google Scholar]
  47. Fu, X.; Zeng, D.; Huang, Y.; Liao, Y.; Ding, X.; Paisley, J. A fusion-based enhancing method for weakly illuminated images. Signal Process. 2016, 129, 82–96. [Google Scholar] [CrossRef]
  48. Zhang, B.; Gao, M.; Chen, P.; Shang, Y.; Li, S.; Bai, Y.; Liao, H.; Liu, Z.; Li, Z. Infrared and visible image fusion based on contrast enhancement guided filter and Infrared feature decomposition. Infrared Phys. Technol. 2022, 127, 104404. [Google Scholar] [CrossRef]
  49. Du, Q.; Xu, H.; Ma, Y.; Huang, J.; Fan, F. Fusing Infrared and visible images of different resolutions via total variation model. Sensors 2018, 18, 3827. [Google Scholar] [CrossRef]
  50. Kumar, B.K. Image fusion based on pixel significance using cross bilateral filter. Signal Image Video Process. 2015, 9, 1193–1204. [Google Scholar] [CrossRef]
  51. Chen, Y.; Chen, L.; Wu, H.; Mo, F.; Chen, Z. Infrared and visible image fusion based on iterative differential thermal information filter. Opt. Lasers Eng. 2022, 148, 106776. [Google Scholar] [CrossRef]
  52. Han, Y.; Cai, Y.; Cao, Y.; Xu, X. A new image fusion performance metric based on visual information fidelity. Inf. Fusion 2013, 14, 127–135. [Google Scholar] [CrossRef]
  53. Eskicioglu, A.; Fisher, P. Image quality measures and their performance. IEEE Trans. Commun. 1995, 43, 2959–2965. [Google Scholar] [CrossRef]
  54. Cui, G.; Feng, H.; Xu, Z.; Li, Q.; Chen, Y. Detail preserved fusion of visible and Infrared images using regional saliency extraction and multi-scale image decomposition. Opt. Commun. 2015, 341, 199–209. [Google Scholar] [CrossRef]
  55. Rao, Y.; Wu, D.; Han, M.; Wang, T.; Yang, Y.; Lei, T.; Zhou, C.; Bai, H.; Xing, C.L. AT-GAN: A generative adversarial network with attention and transition for infrared and visible image fusion. Inf. Fusion 2023, 92, 336–349. [Google Scholar] [CrossRef]
  56. Benesty, J.; Chen, J.; Huang, Y.; Cohen, I. Pearson correlation coefficient. In Noise Reduction in Speech Processing; Springer: Berlin/Heidelberg, Germany, 2009; pp. 1–4. [Google Scholar]
  57. Jagalingam, P.; Hegde, A. A review of quality metrics for fused image. Aquat. Procedia 2015, 4, 133–142. [Google Scholar] [CrossRef]
  58. Roberts, J.; Aardt, J.; Ahmed, F. Assessment of image fusion procedures using entropy, image quality, and multispectral classification. J. App. Remote Sens. 2008, 2, 023522. [Google Scholar]
  59. Xydeas, C.; Petrovic, V. Objective image fusion performance measure. Electron. Lett. 2000, 36, 308–309. [Google Scholar] [CrossRef]
Figure 1. An example of fusion results comparing our method (VCAFusion) with state-of-the-art methods. (a) Infrared image; (b) Visible image; (c) Fusion result from MSID [10]; (d) Fusion result from SeAFusion [17]; (e) Fusion result from the proposed VCAFusion method. The green and red boxes highlight the target regions in the magnified local areas.
Applsci 15 06295 g001
Figure 2. The overall framework of the proposed VCAFusion.
Applsci 15 06295 g002
Figure 3. Adaptive low light adjustment algorithm framework.
Applsci 15 06295 g003
Figure 4. Local brightness adaptive adjustment curve.
Applsci 15 06295 g004
Figure 5. Local contrast enhancement function. (a) Function curves for local details adjustment. (b) Function curves for contrast limiting.
Applsci 15 06295 g005
Figure 6. Comparison of the proposed method and the other three methods. (a) Original low-light image. (b) Enhanced using gamma correction. (c) Enhanced using GFCE. (d) Enhanced using SRIE. (e) Enhanced using MSretinex. (f) The proposed method. The green and red boxes highlight the target regions in the magnified local areas.
Applsci 15 06295 g006
Figure 7. Fusion results before and after different low-light enhancement methods. (a) Visible image. (b) Infrared image. (c) Fusion result without enhancement. (dh) Fusion results using gamma correction, GFCE, SRIE, MSretinex, and our method, respectively. The green and red boxes highlight the target regions in the magnified local areas.
Applsci 15 06295 g007
Figure 8. Variation in the output image and histogram with C.
Applsci 15 06295 g008
Figure 9. Filtering results of different combinations of r, eps. The red box marks the target area used for comparison.
Applsci 15 06295 g009
Figure 10. Fused results with different parameter λ. The red box marks the target area used for comparison.
Applsci 15 06295 g010
Figure 11. Fusion results of different methods on the “Queens Road” images. The red boxes highlight the target regions in the magnified local areas.
Applsci 15 06295 g011
Figure 12. Fusion results of different methods on the “Kaptein_1123” images. The red boxes highlight the target regions in the magnified local areas.
Applsci 15 06295 g012
Figure 13. Fusion results of different methods on the “01432” images. The red boxes highlight the target regions in the magnified local areas.
Applsci 15 06295 g013
Figure 14. Fusion results of different methods on the “01454” images. The red boxes highlight the target regions in the magnified local areas.
Applsci 15 06295 g014
Figure 15. Evaluation results of the eight fusion metrics for the TNO dataset in eight state-of-the-art methods and our method.
Applsci 15 06295 g015
Figure 16. Evaluation results of the eight fusion metrics for the M3FD dataset in eight state-of-the-art methods and our method.
Applsci 15 06295 g016
Figure 17. The fused images with and without adaptive brightness enhancement (ADB).
Applsci 15 06295 g017
Figure 18. The fused images with and without saliency-preserving (SAP). The red box marks the target area used for comparison.
Applsci 15 06295 g018
Table 1. The summary of existing fusion methods.
TypeDisadvantagesVCAFusion’s Novel Contributions
Traditional MSDSensitive to illumination variations.Adaptive MSD with side window filtering.
Sparse RepresentationLose weak details in dark regions.Retinex-based brightness adjustment.
Deep LearningRequire extensive night-image training.Physics-inspired enhancement (no retraining needed).
Saliency MethodsOver-emphasize infrared thermal features.Biologically-inspired saliency preservation.
Subspace TechniquesPoor edge preservation in low-light.Hybrid MSD with edge-aware texture refinement.
Table 2. Mean quantitative comparison results for the TNO dataset (RED indicates the best result and BLUE represents the second-best result).
MetricsVIFSFAGSDCCPSNRENQABF
CBF0.5810.0444.7948.9920.42363.4036.9260.406
DenseFuse0.7620.0292.9659.1410.54663.5396.7700.408
DRTV0.6610.0262.5358.7730.35862.3946.7090.303
PIAFusion0.8090.0444.2639.1190.46862.7506.8200.527
MLGCF0.8020.0333.2658.8850.46762.0296.82450.395
MSID0.7650.0413.7819.5530.48163.2917.0310.329
SeAFusion0.8610.0393.9139.4290.49362.8697.0200.462
PM0.7420.0353.4638.8040.52364.7736.6140.446
RGFTV0.7320.0373.7208.7090.52164.6156.6490.442
Ours0.8740.0535.5429.6590.52564.9686.9700.416
Table 3. Mean quantitative comparison results for the M3FD dataset (RED indicates the best result and BLUE represents the second-best result).
MetricsVIFSFAGSDCCPSNRENQABF
CBF0.5020.0676.6599.3510.58163.7957.0020.317
DenseFuse0.6630.0494.5919.3550.72964.7766.9340.371
DRTV0.8210.0514.6259.8260.57962.5407.1480.296
PIAFusion0.8200.0817.4429.5060.65863.0387.0720.536
MLGCF0.7540.0555.2839.1330.63262.0317.0130.333
MSID0.7480.0666.0609.5530.64463.5477.2820.316
SeAFusion0.8580.0676.27669.9690.68662.5107.2050.464
PM0.6650.0585.39509.2830.68864.8796.9760.346
RGFTV0.6710.0565.32049.1090.68264.7137.0160.328
Ours0.8800.0726.80769.8850.70465.0257.0070.447
Table 4. The mean running time of nine fusion methods on the TNO and M3FD datasets. (unit: second).
MethodsCBFDenseFuseDRTVPIAFusionMLGCF
Times20.240.061.090.09104.99
MethodsMSIDSeAFusionPMRGFTVOurs
Times0.470.0411.53423.081.88
Table 5. Ablation experimental results on the adaptive brightness strategy, with the best results highlighted in bold.
Image VIFSFAGCCEN
“Queens Road”Without ADB0.7580.0332.2940.6286.103
With ADB0.820.0453.6830.6756.998
“Kaptein_1123”Without ADB0.8370.032.2810.5226.868
With ADB0.8740.0575.010.5856.882
“01432”Without ADB0.7910.0949.6820.5127.5
With ADB0.7240.13611.100.6197.546
“01454”Without ADB0.8360.0282.1560.6477.064
With ADB0.9930.0634.6210.6977.133
Table 6. Ablation experimental results on the saliency-preserving, with the best results highlighted in bold.
Image VIFSFAGCCEN
“Queens Road”Without SAP0.7610.0313.2170.4366.325
With SAP0.820.0453.6830.6756.998
“Kaptein_1123”Without SAP0.8380.0293.4670.346.76
With SAP0.8740.0475.010.5856.882
“01432”Without SAP0.7140.0556.6640.4887.43
With SAP0.7240.13611.100.6197.546
“01454”Without SAP0.9870.0464.2170.6317.327
With SAP0.9930.0634.6210.6977.433
Disclaimer/Publisher’s Note: The statements, opinions and data contained in all publications are solely those of the individual author(s) and contributor(s) and not of MDPI and/or the editor(s). MDPI and/or the editor(s) disclaim responsibility for any injury to people or property resulting from any ideas, methods, instructions or products referred to in the content.

