
Compaction Characteristics and Mechanical Response of Gravel–Glass–Rubber Mixtures †


Abstract
1. Introduction
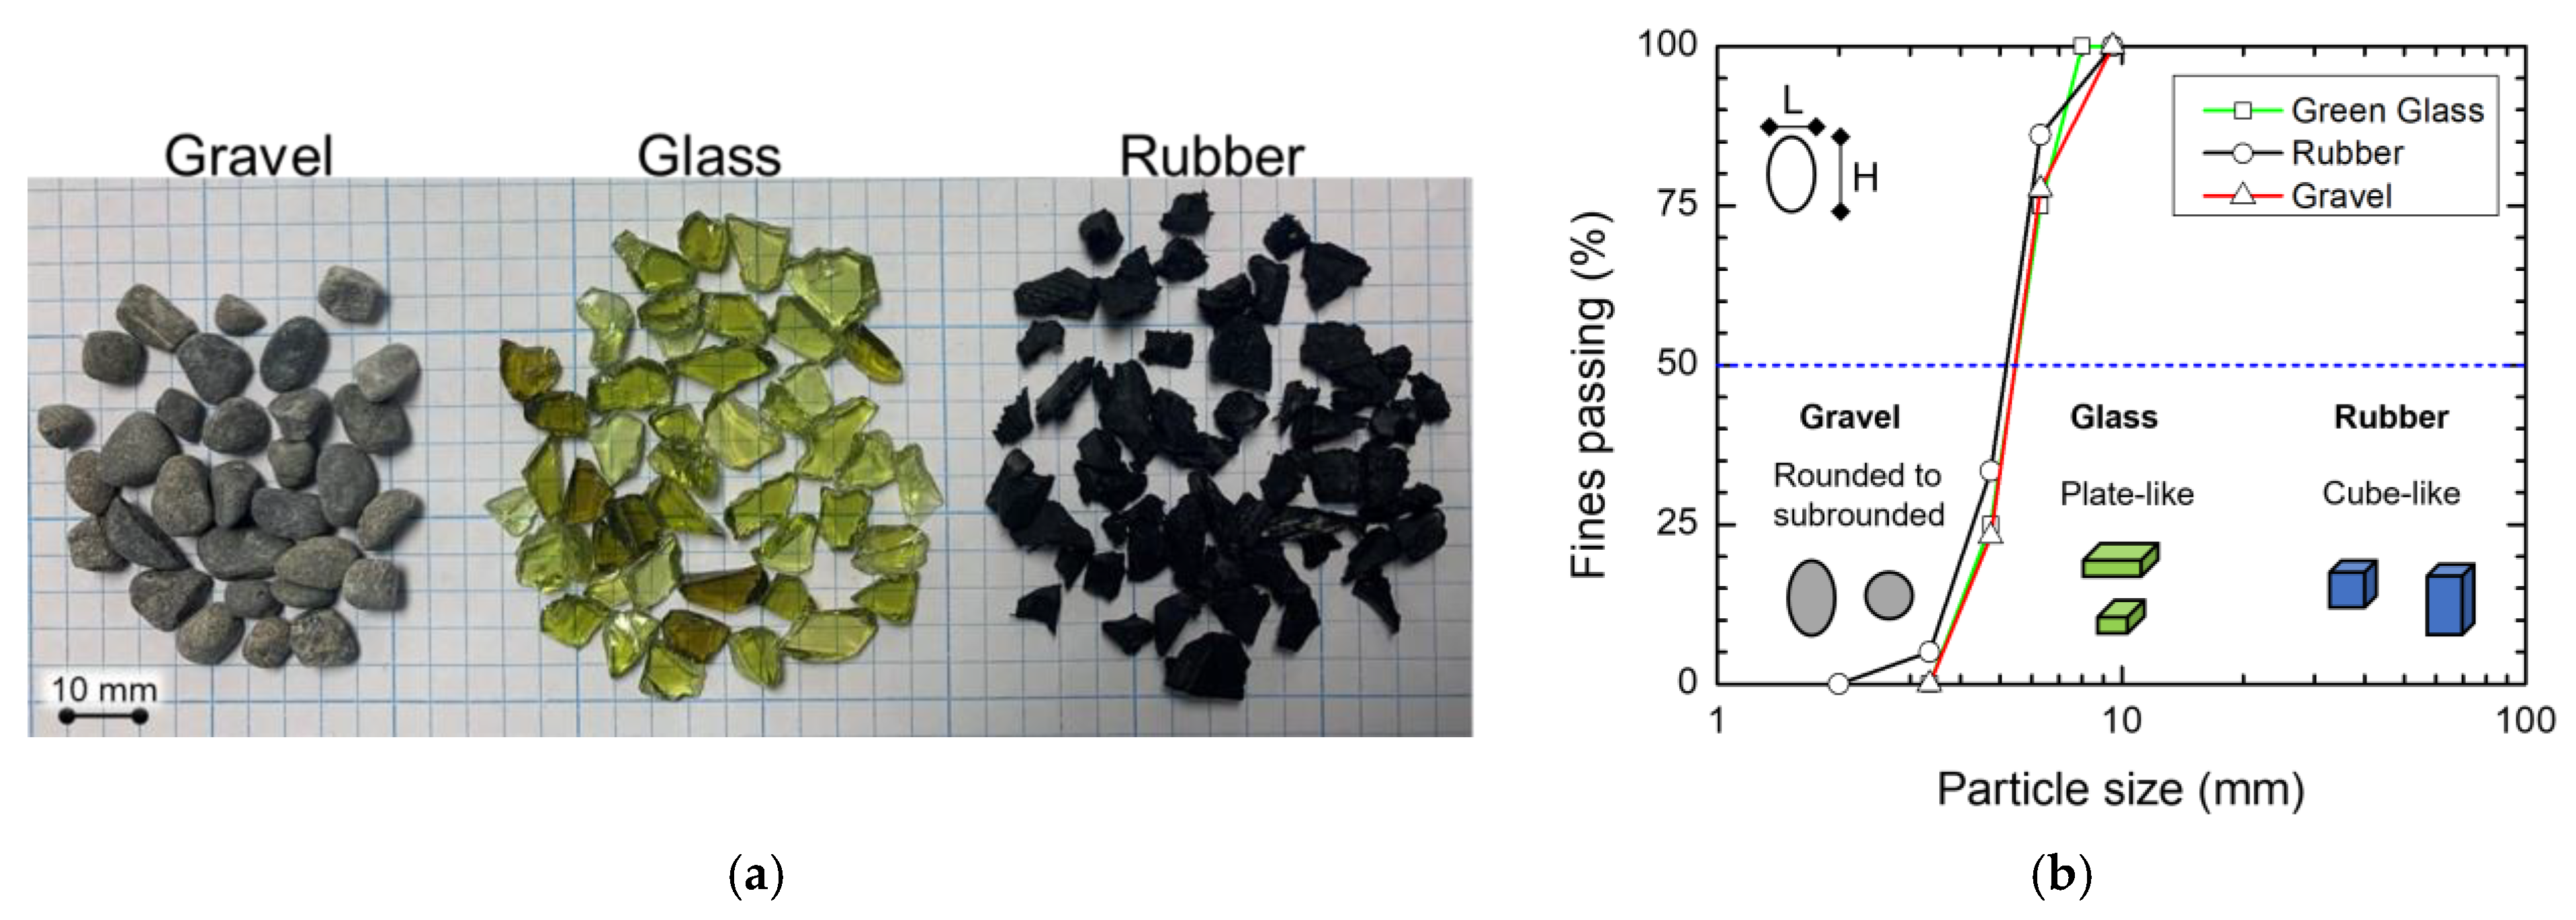
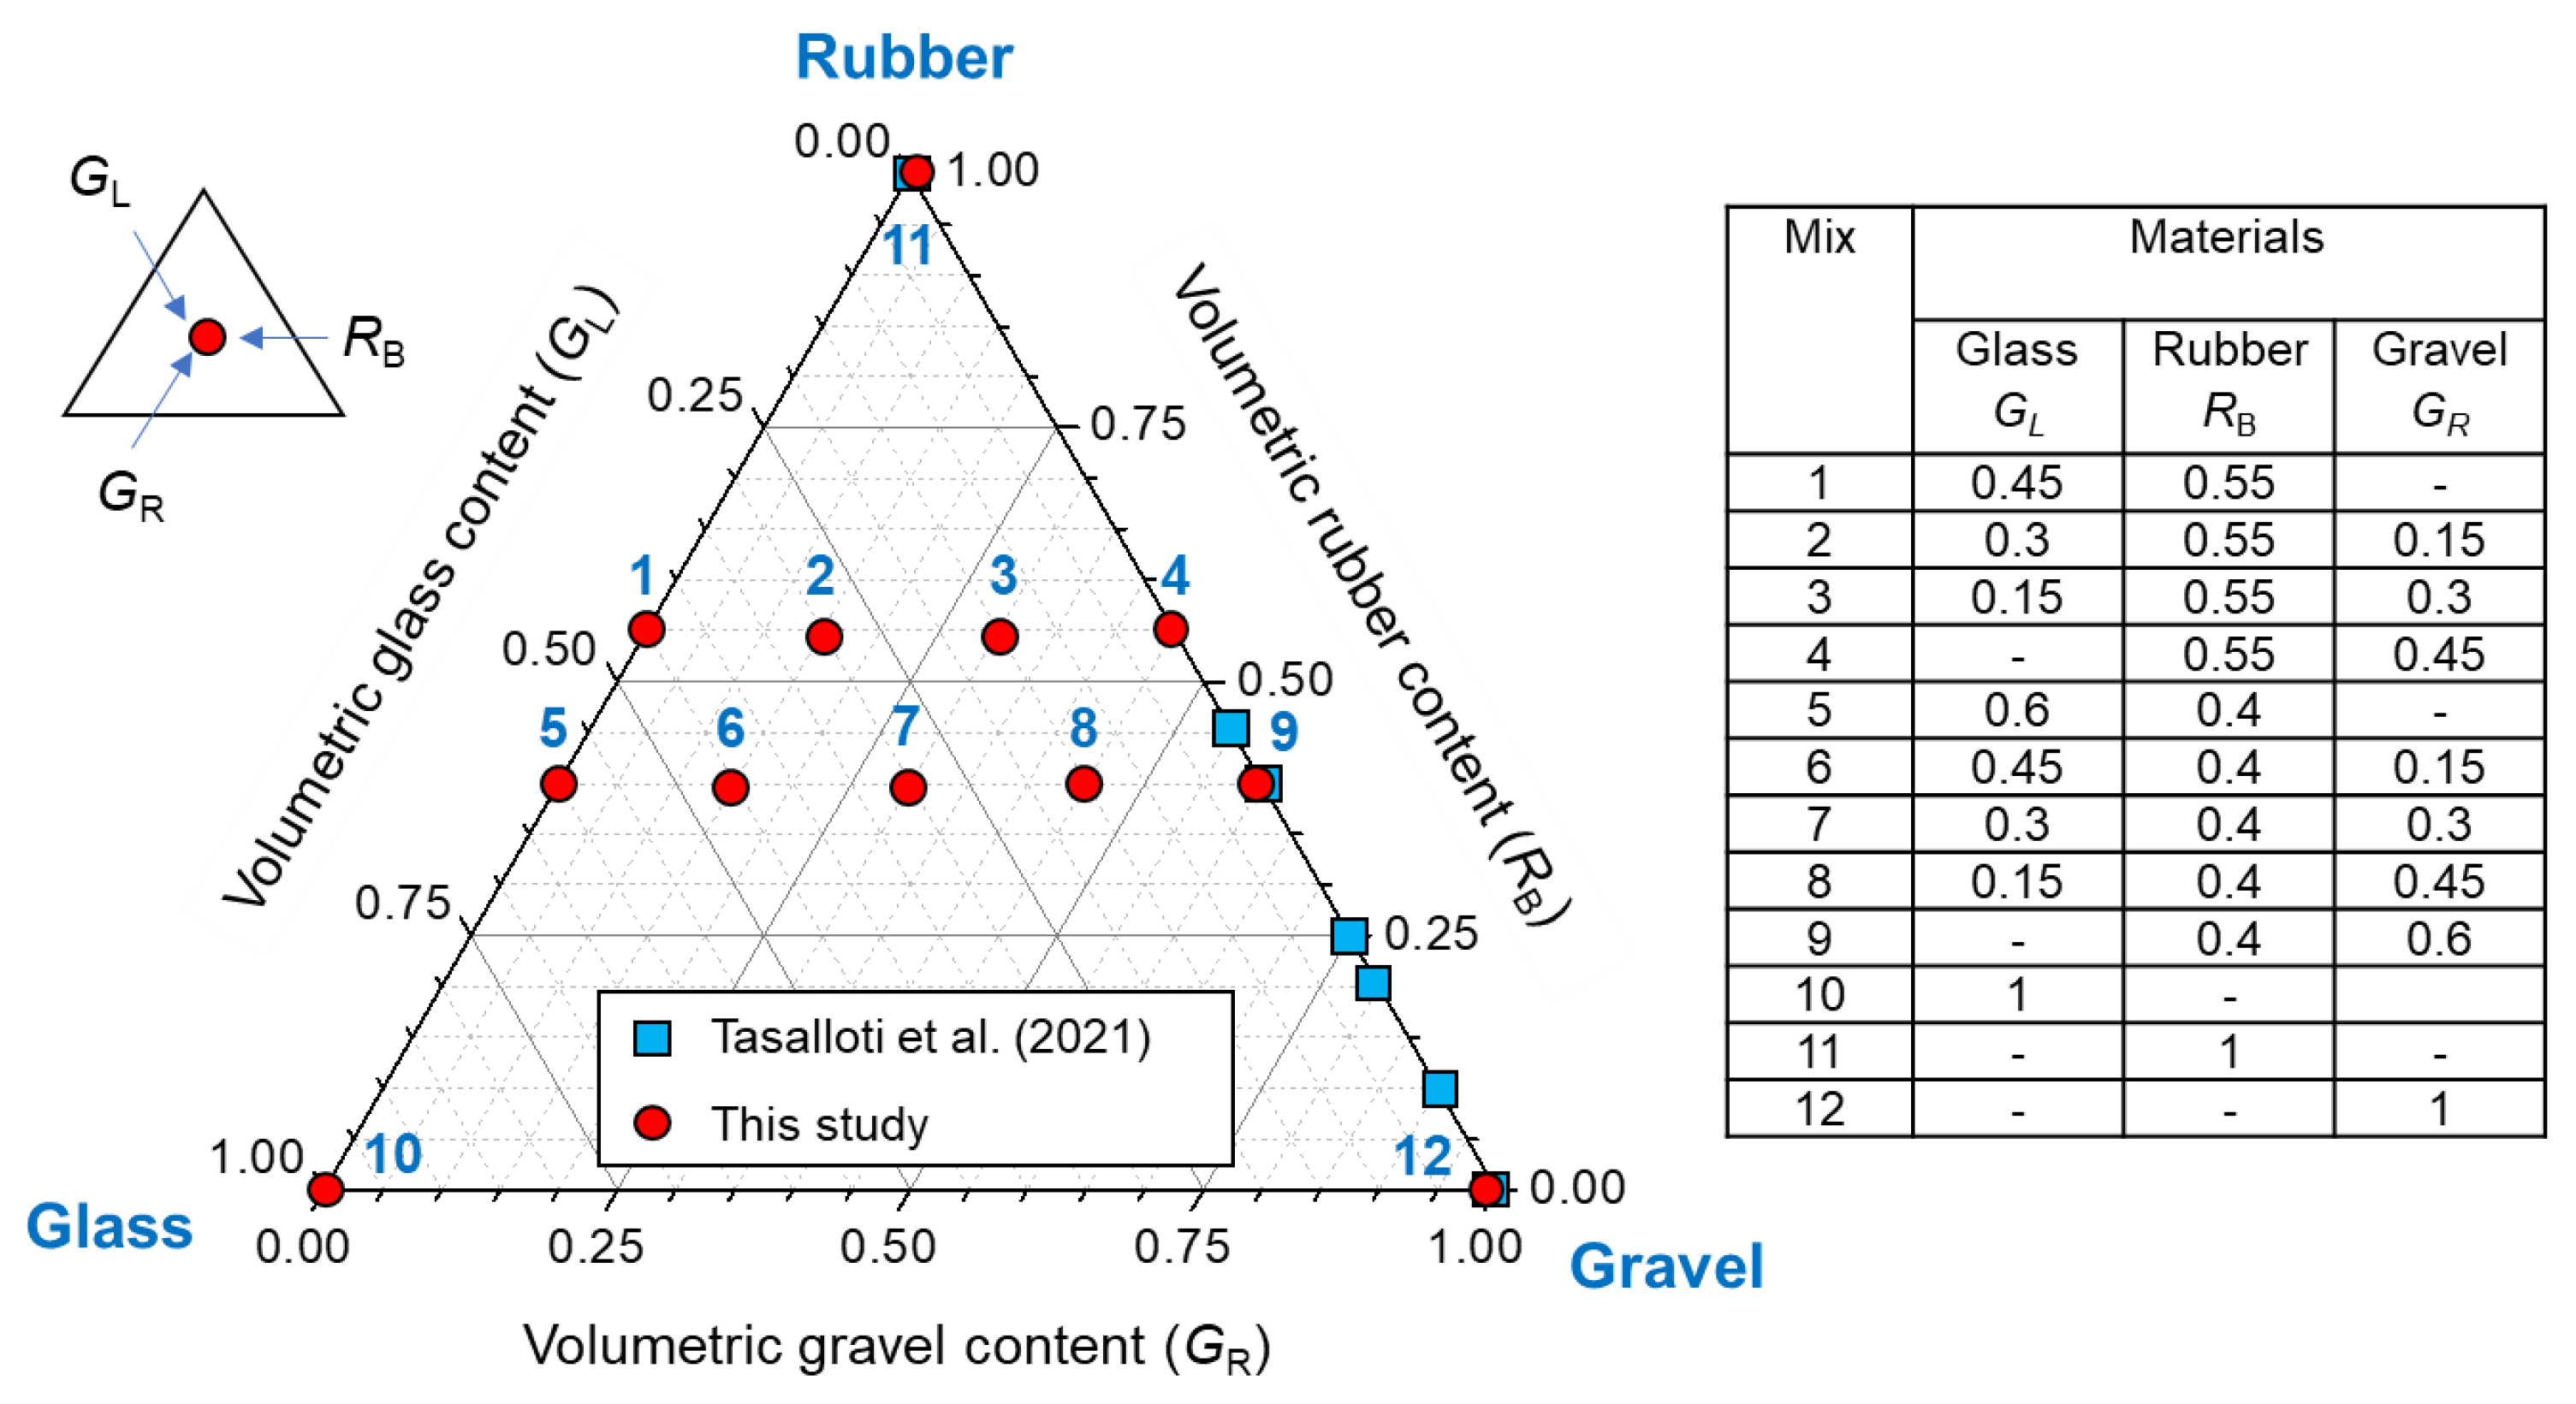
2. Materials
3. Experimental Procedure
3.1. Compaction
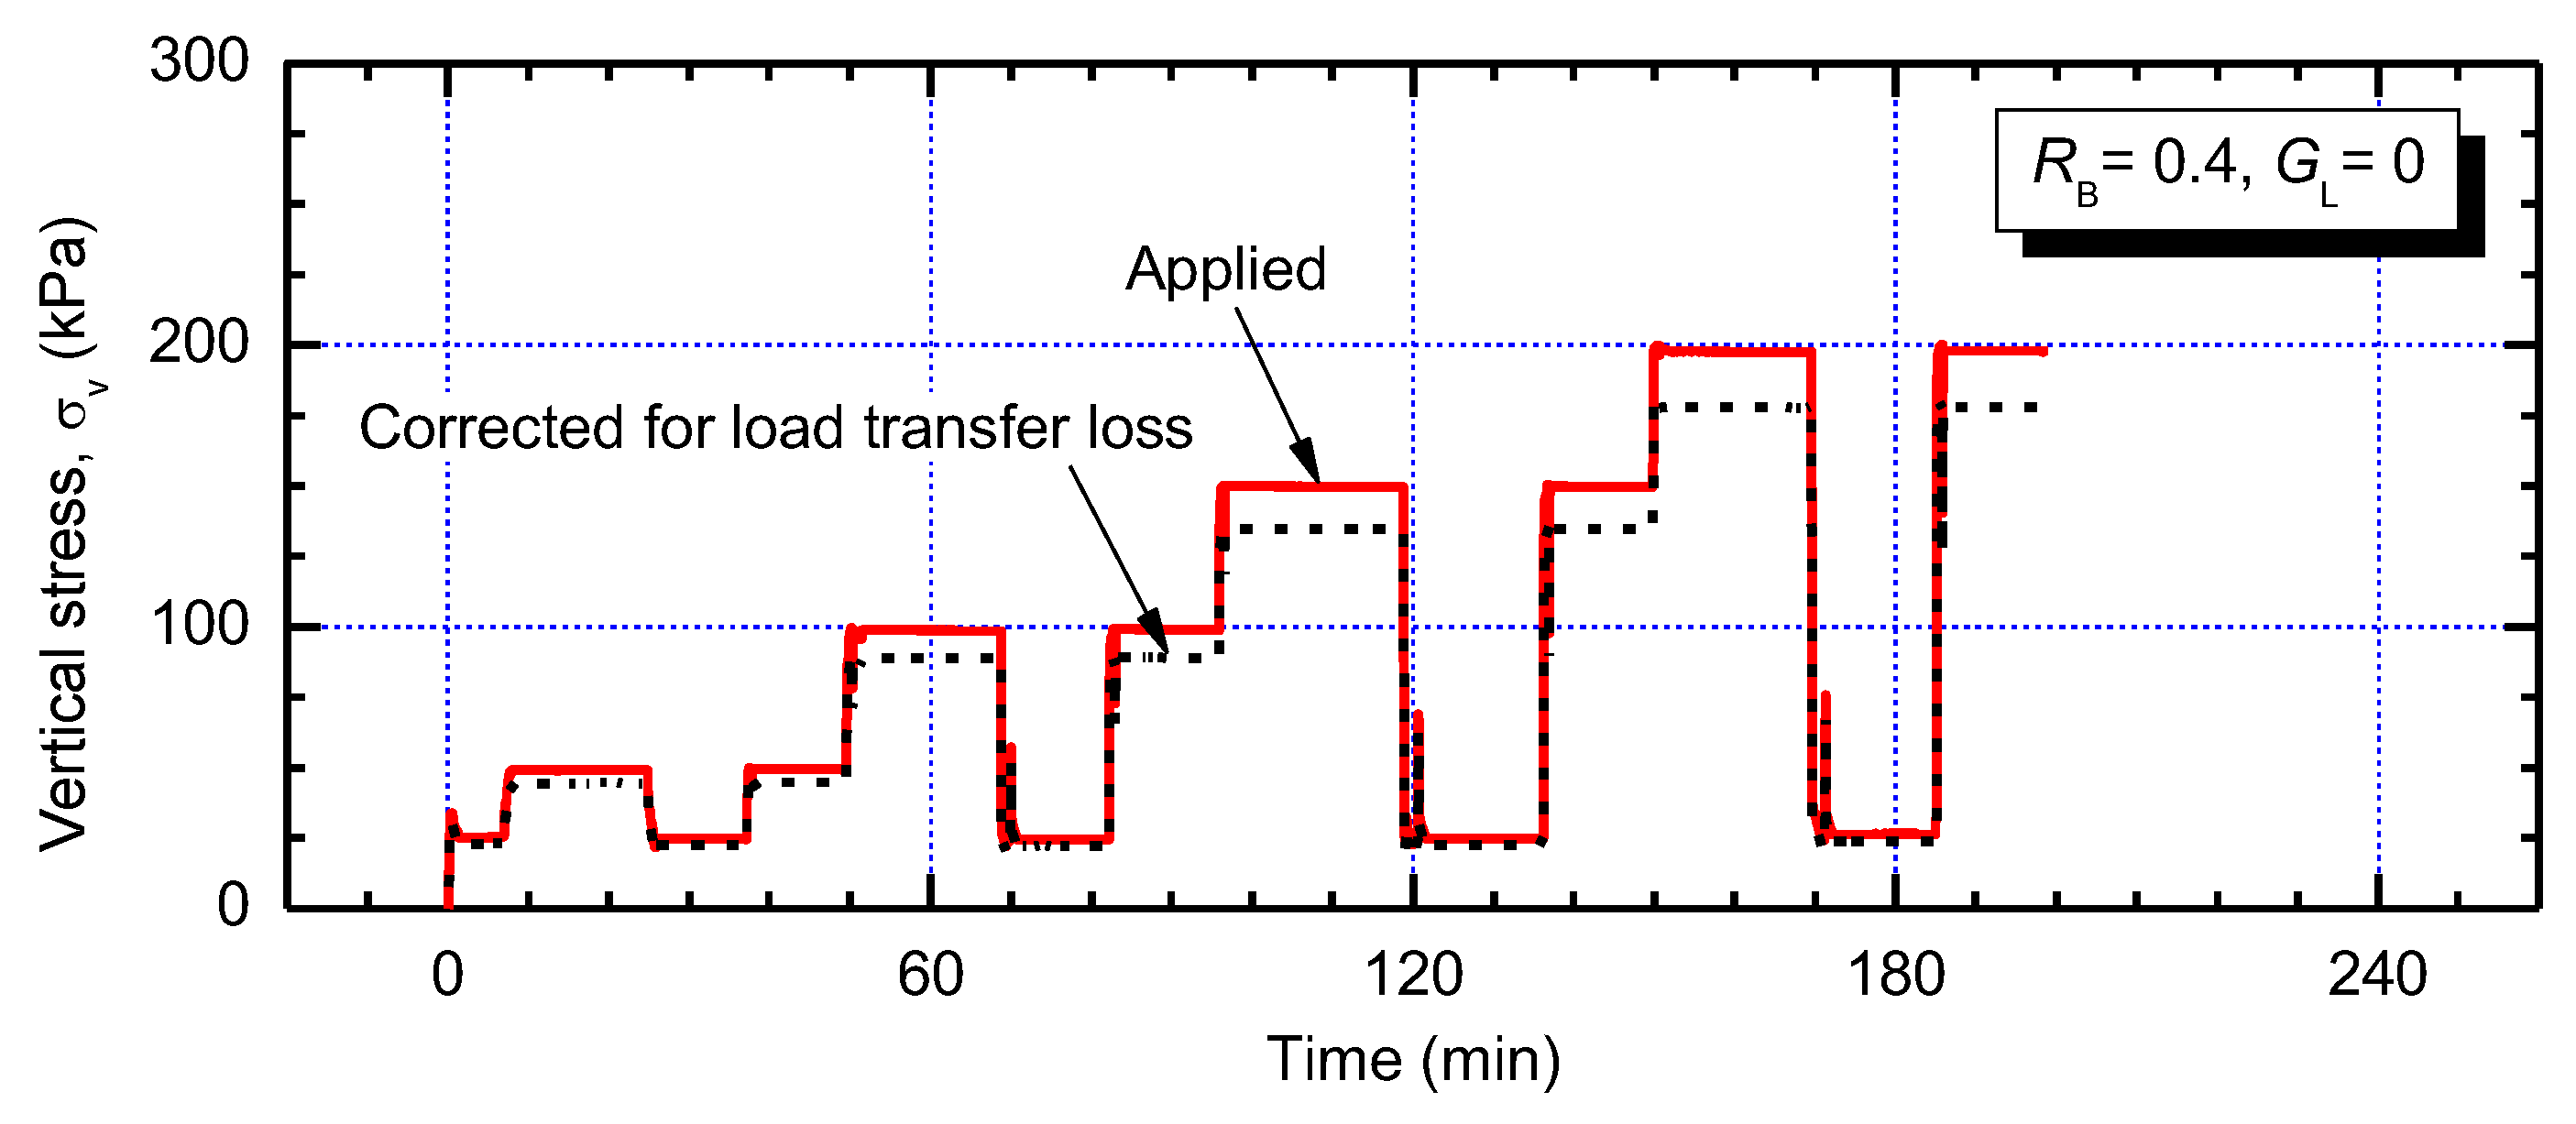
3.2. One-Dimensional Compression
3.3. Shear Strength
4. Experimental Results and Discussions
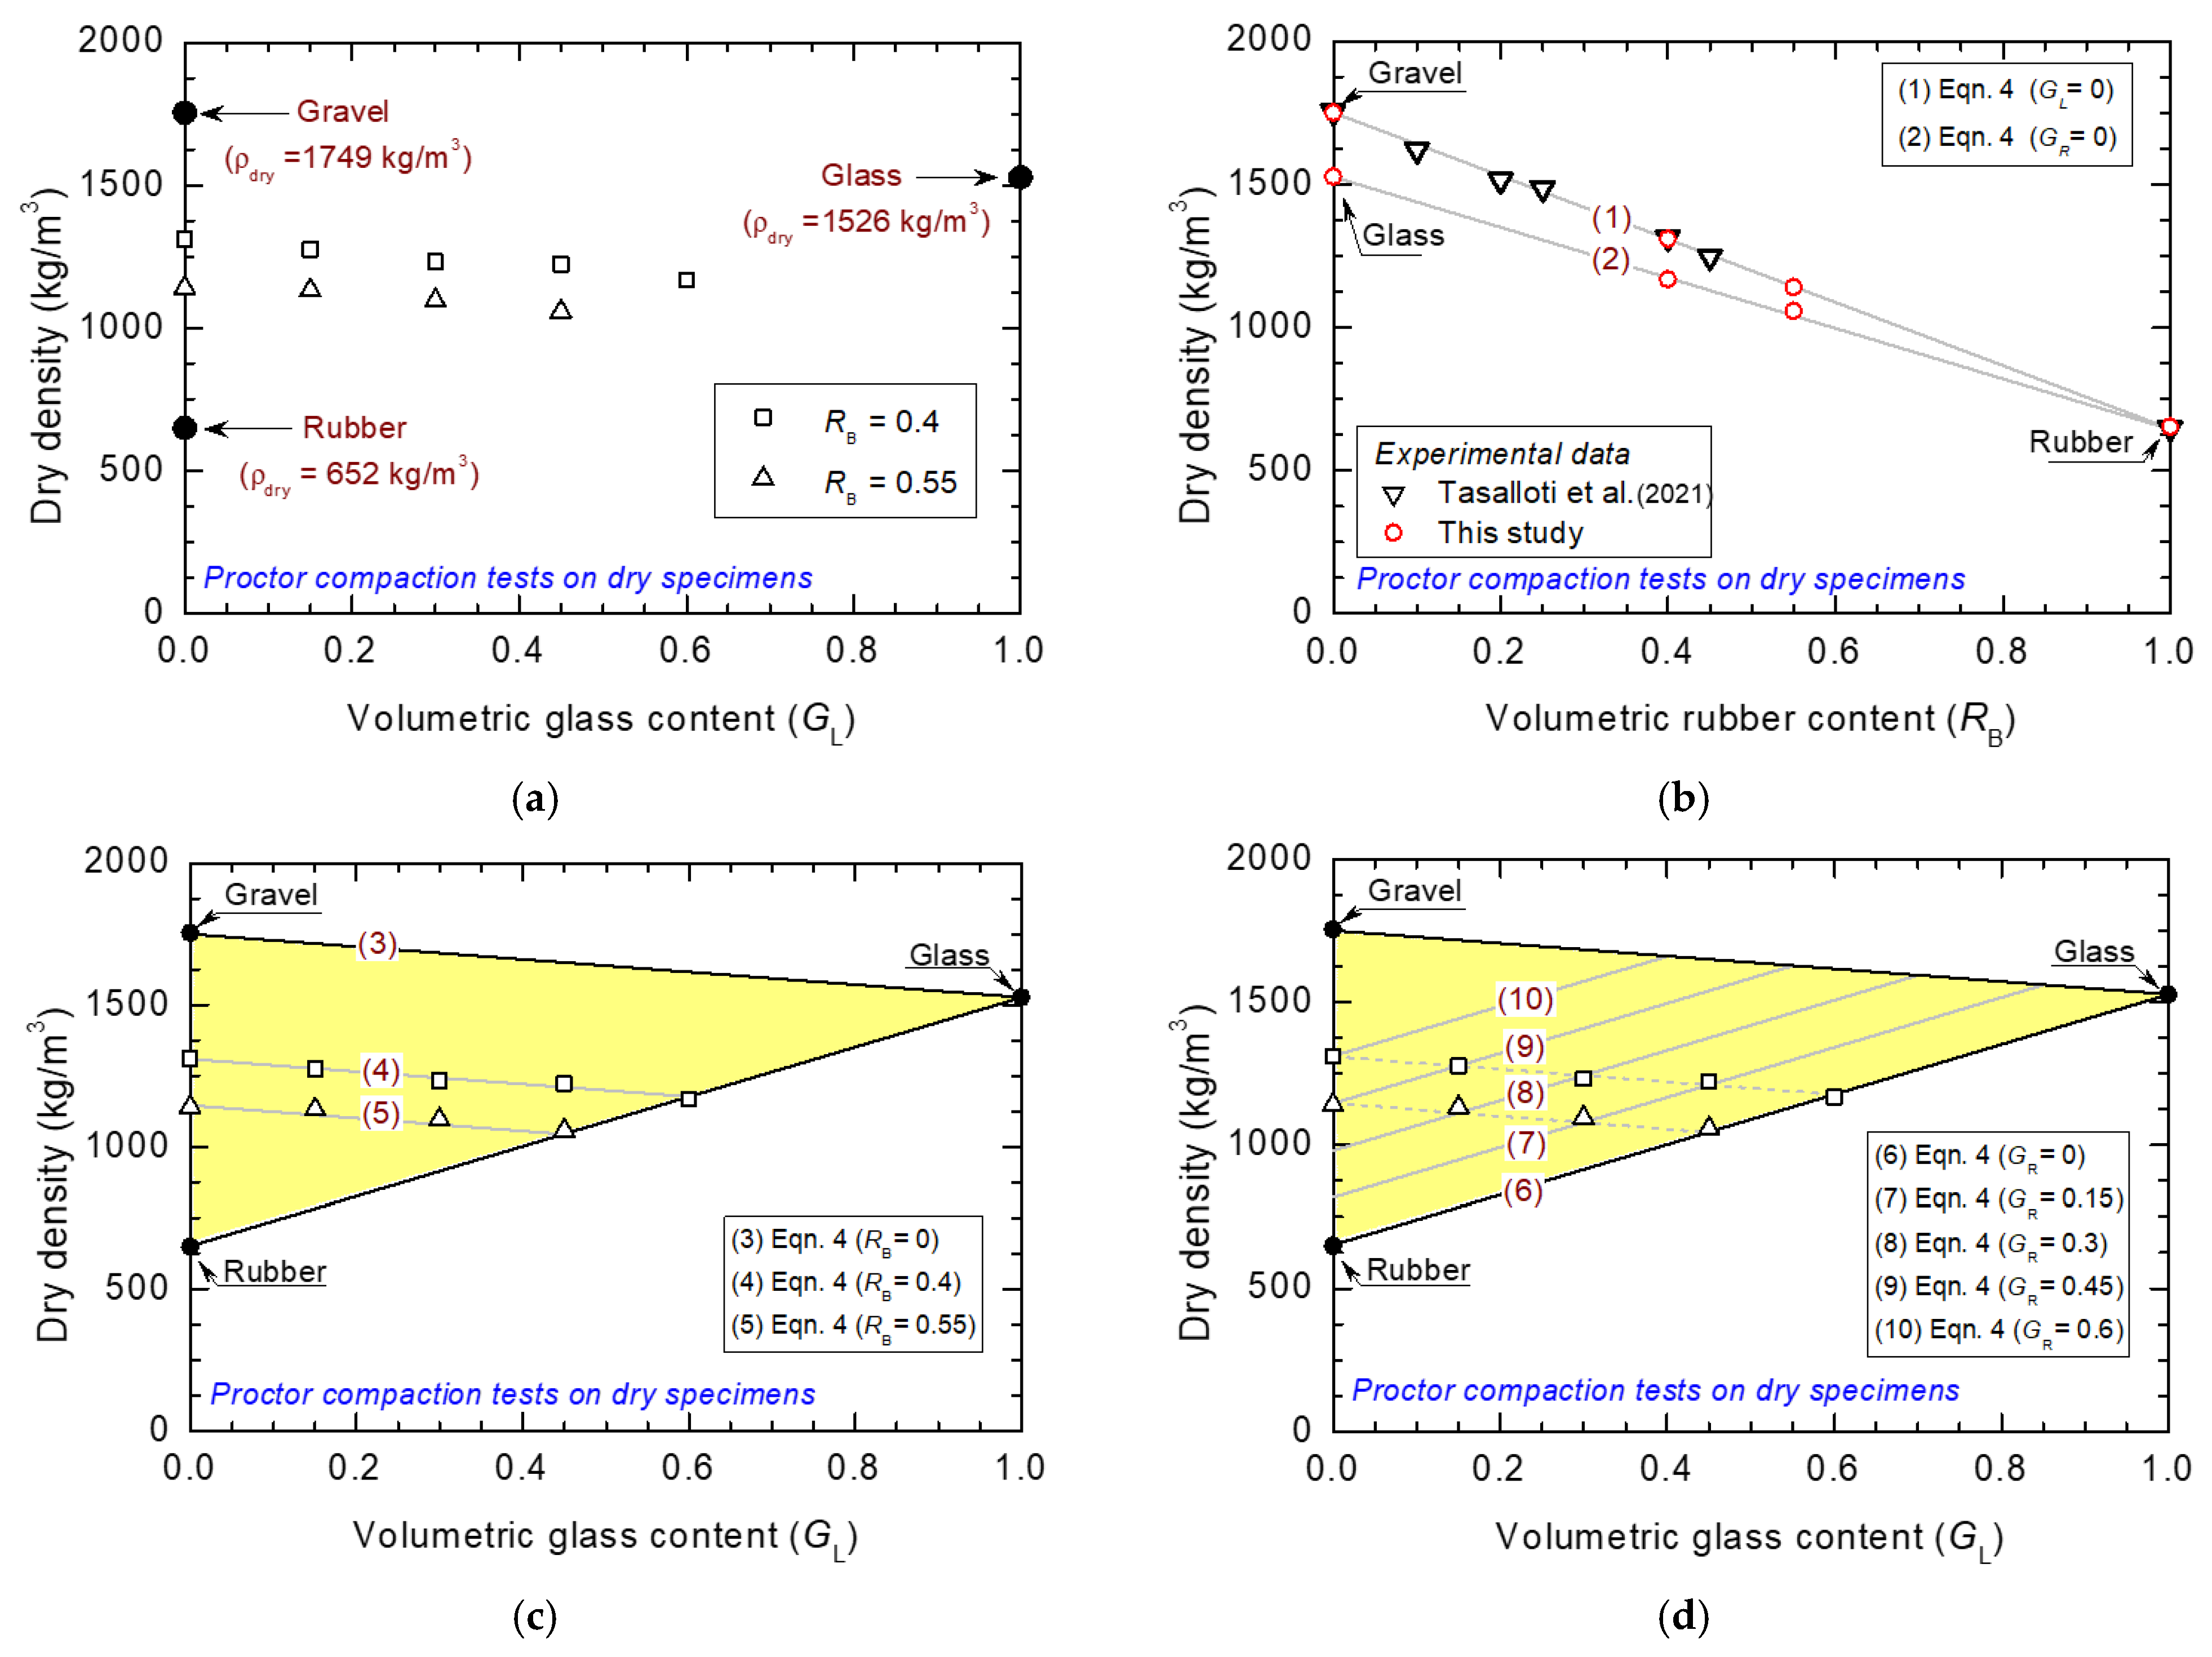
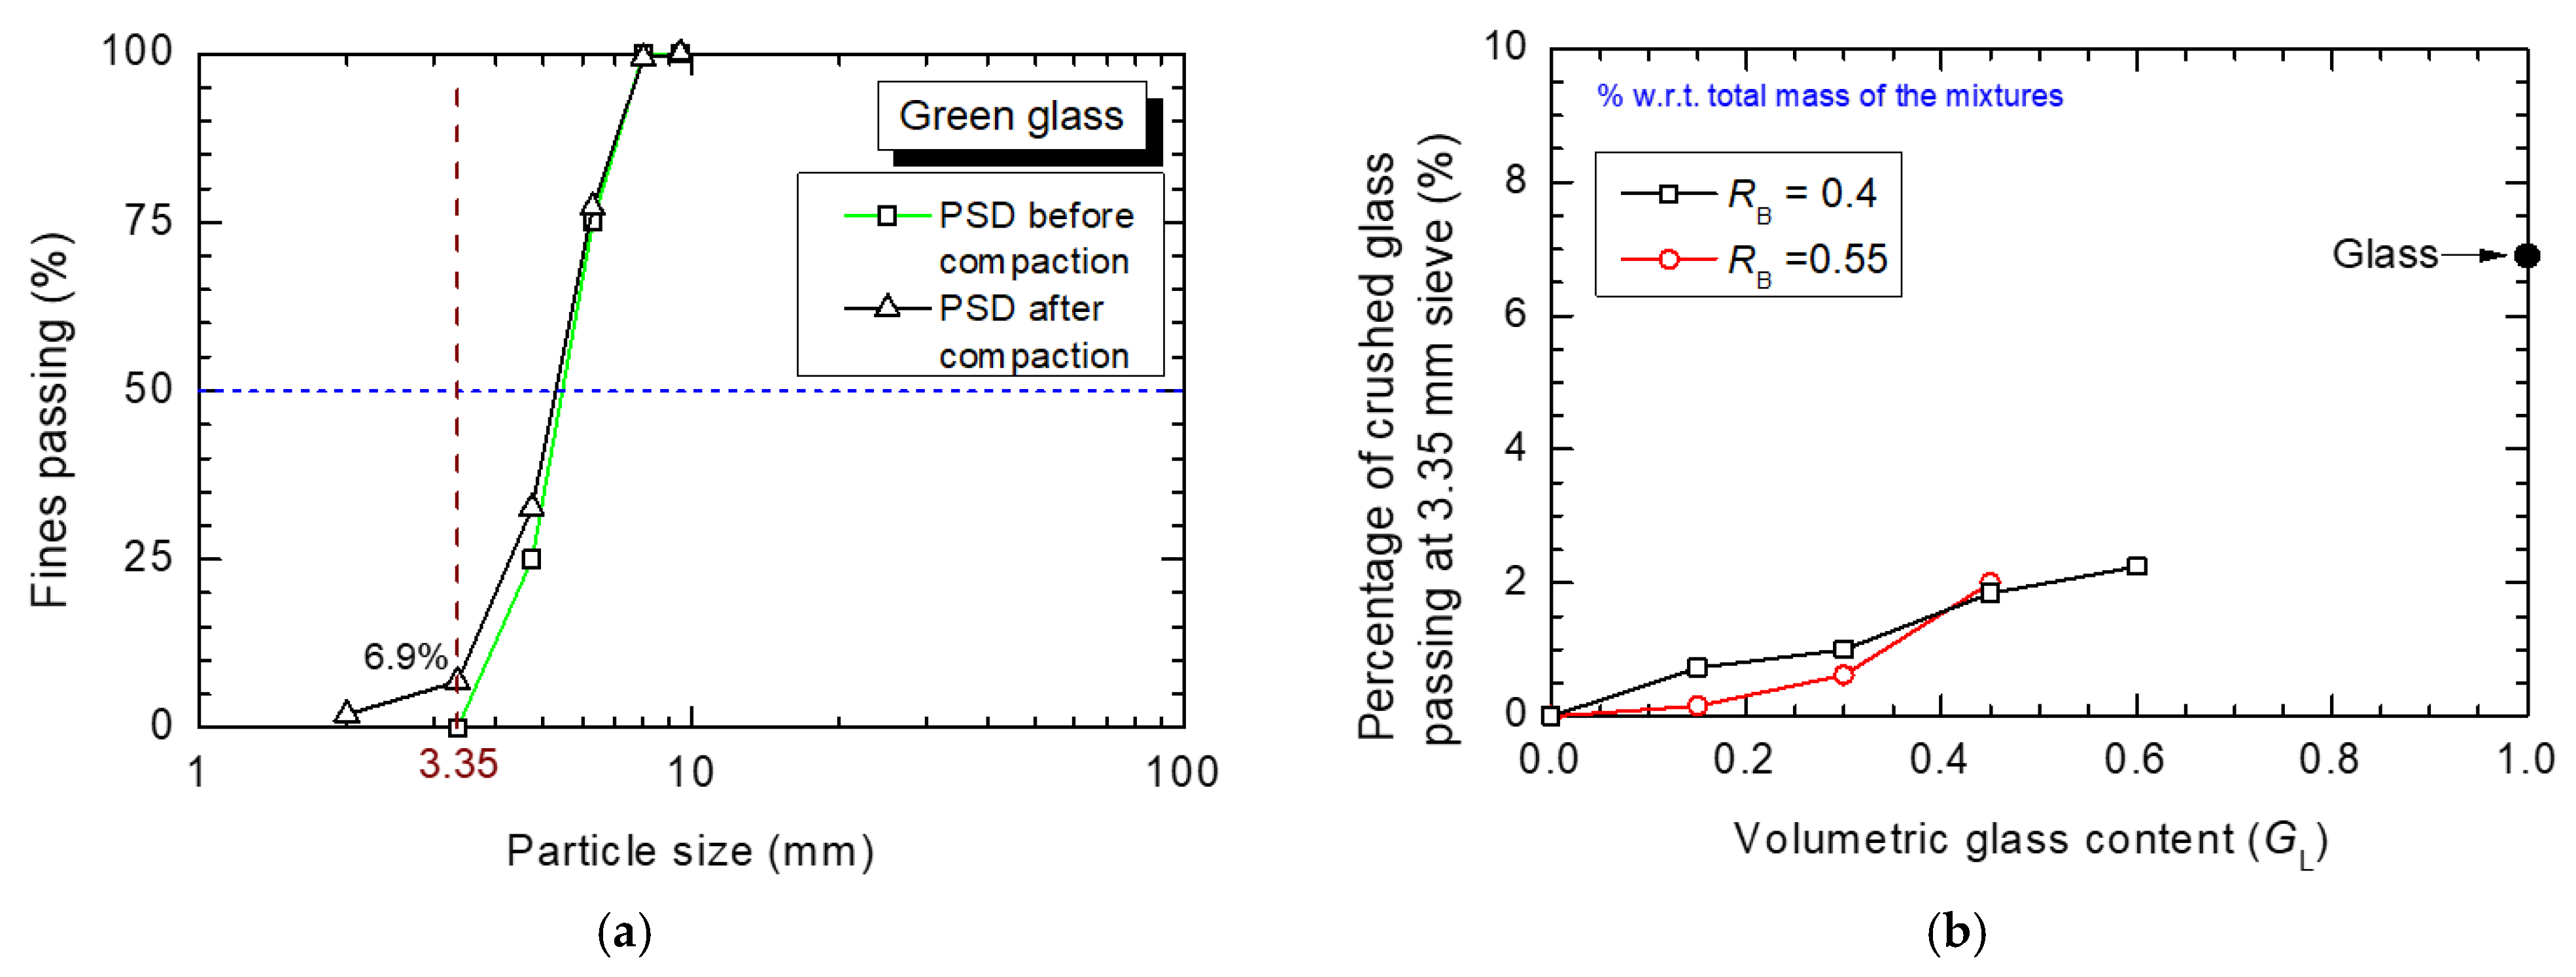
4.1. Compaction Characteristics of GGRM
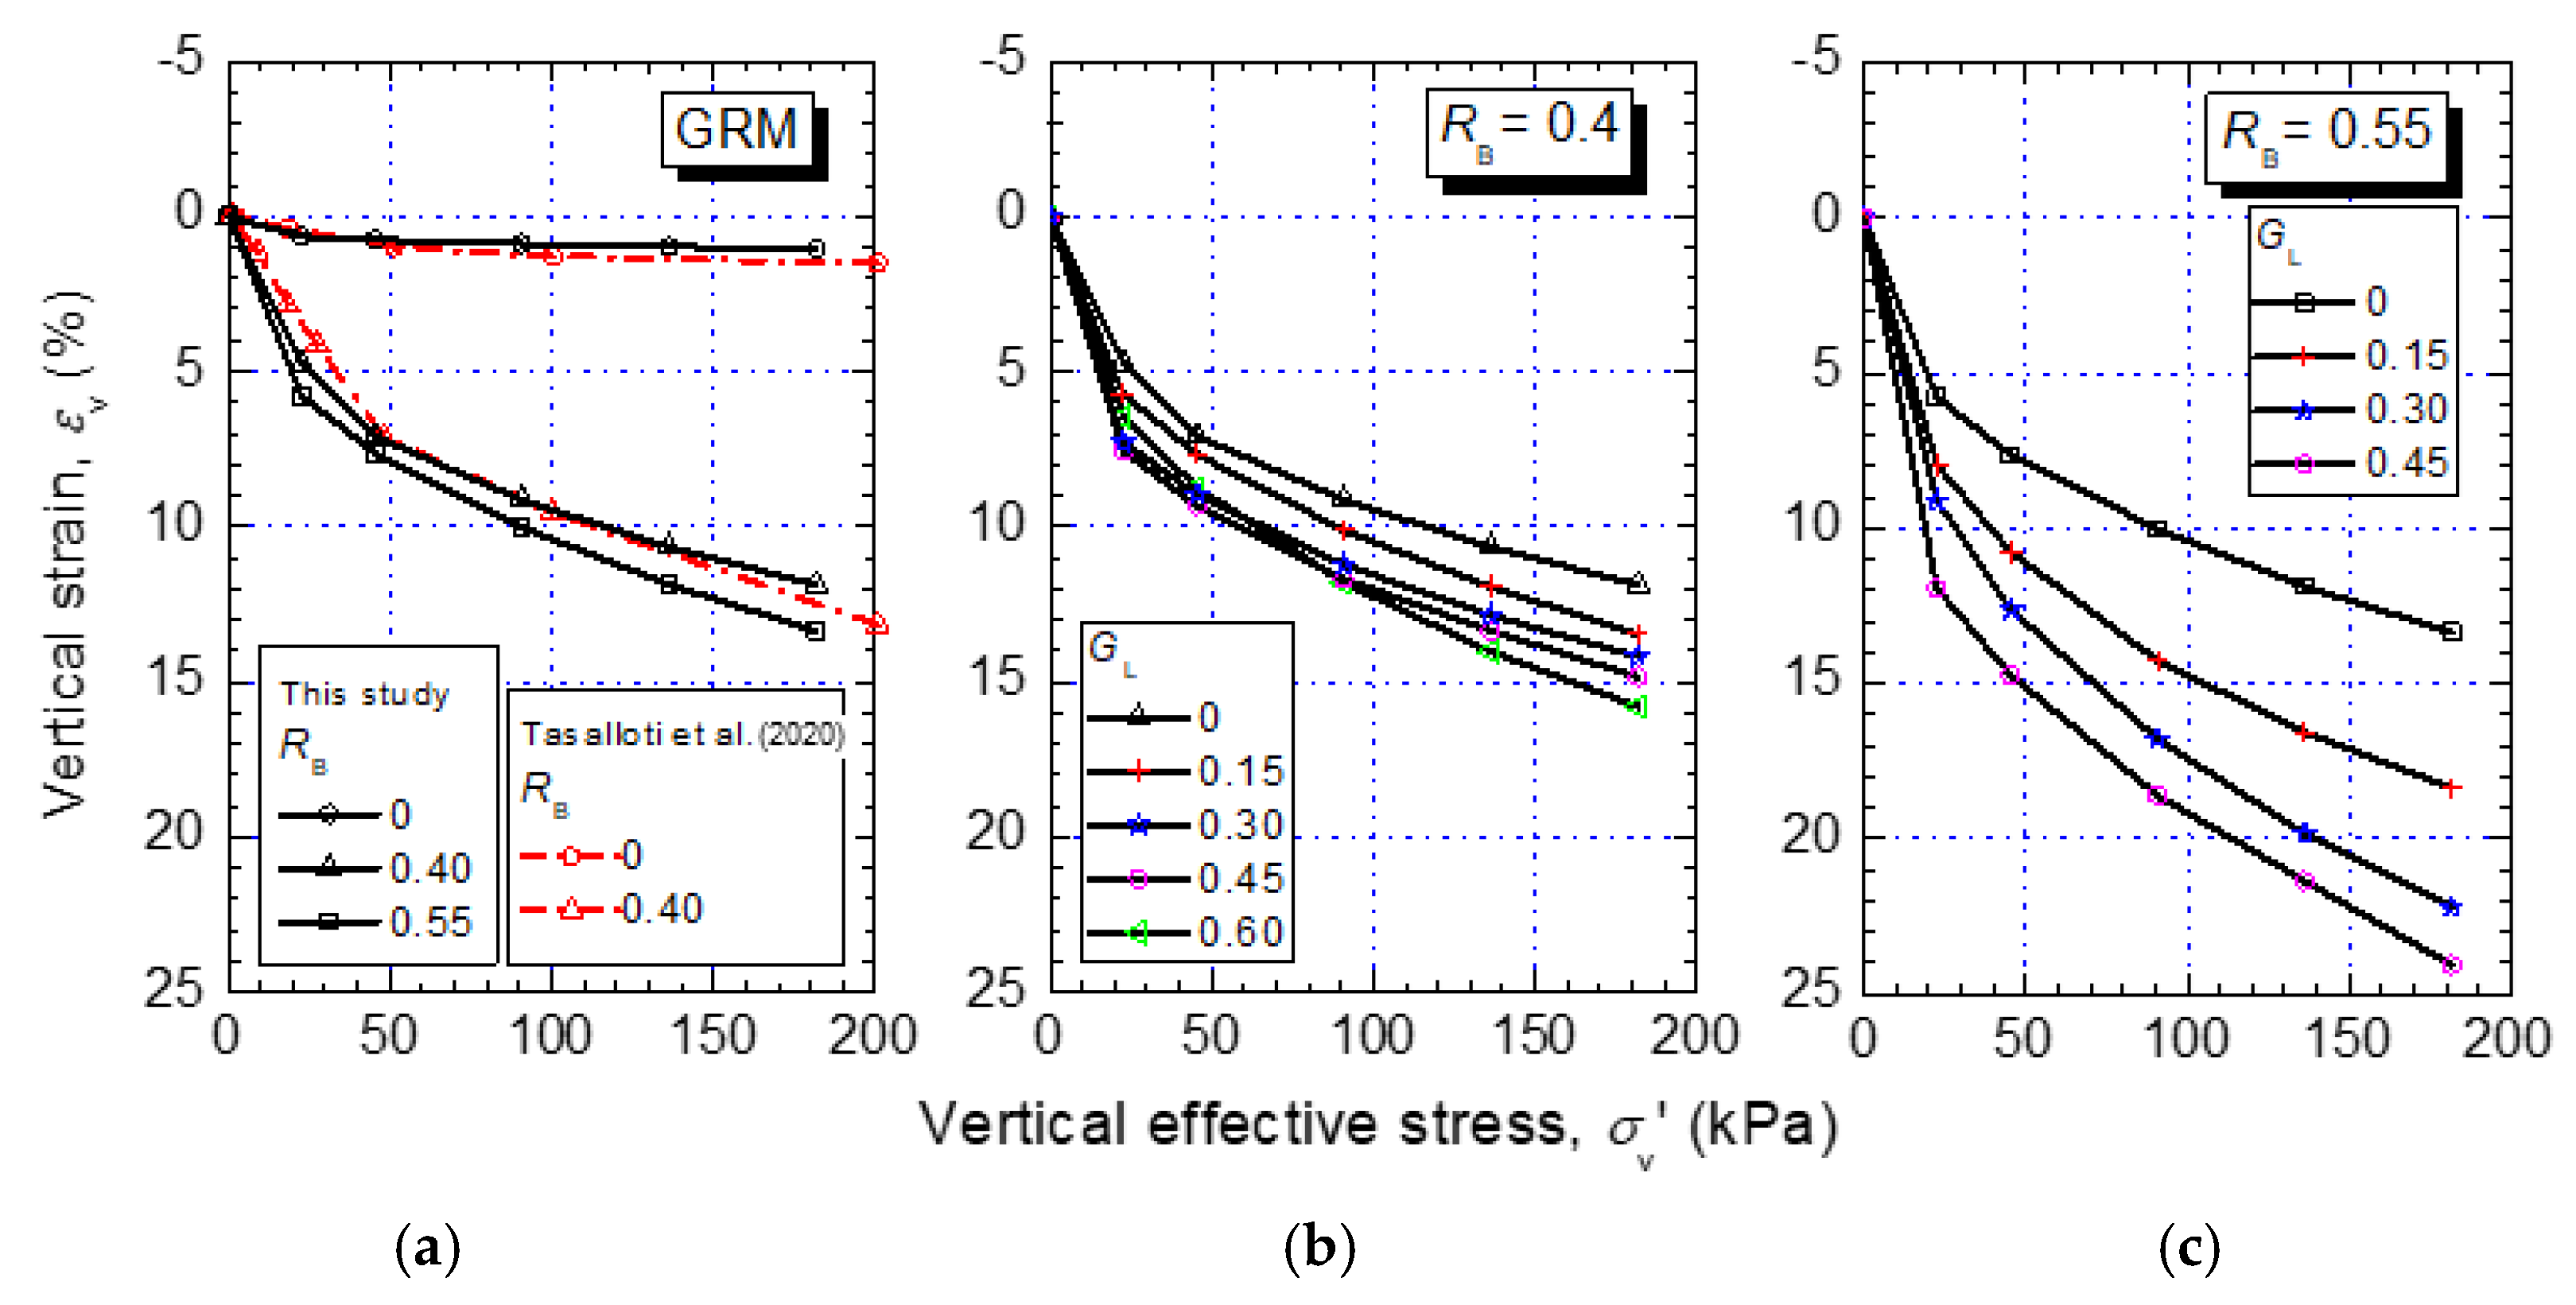
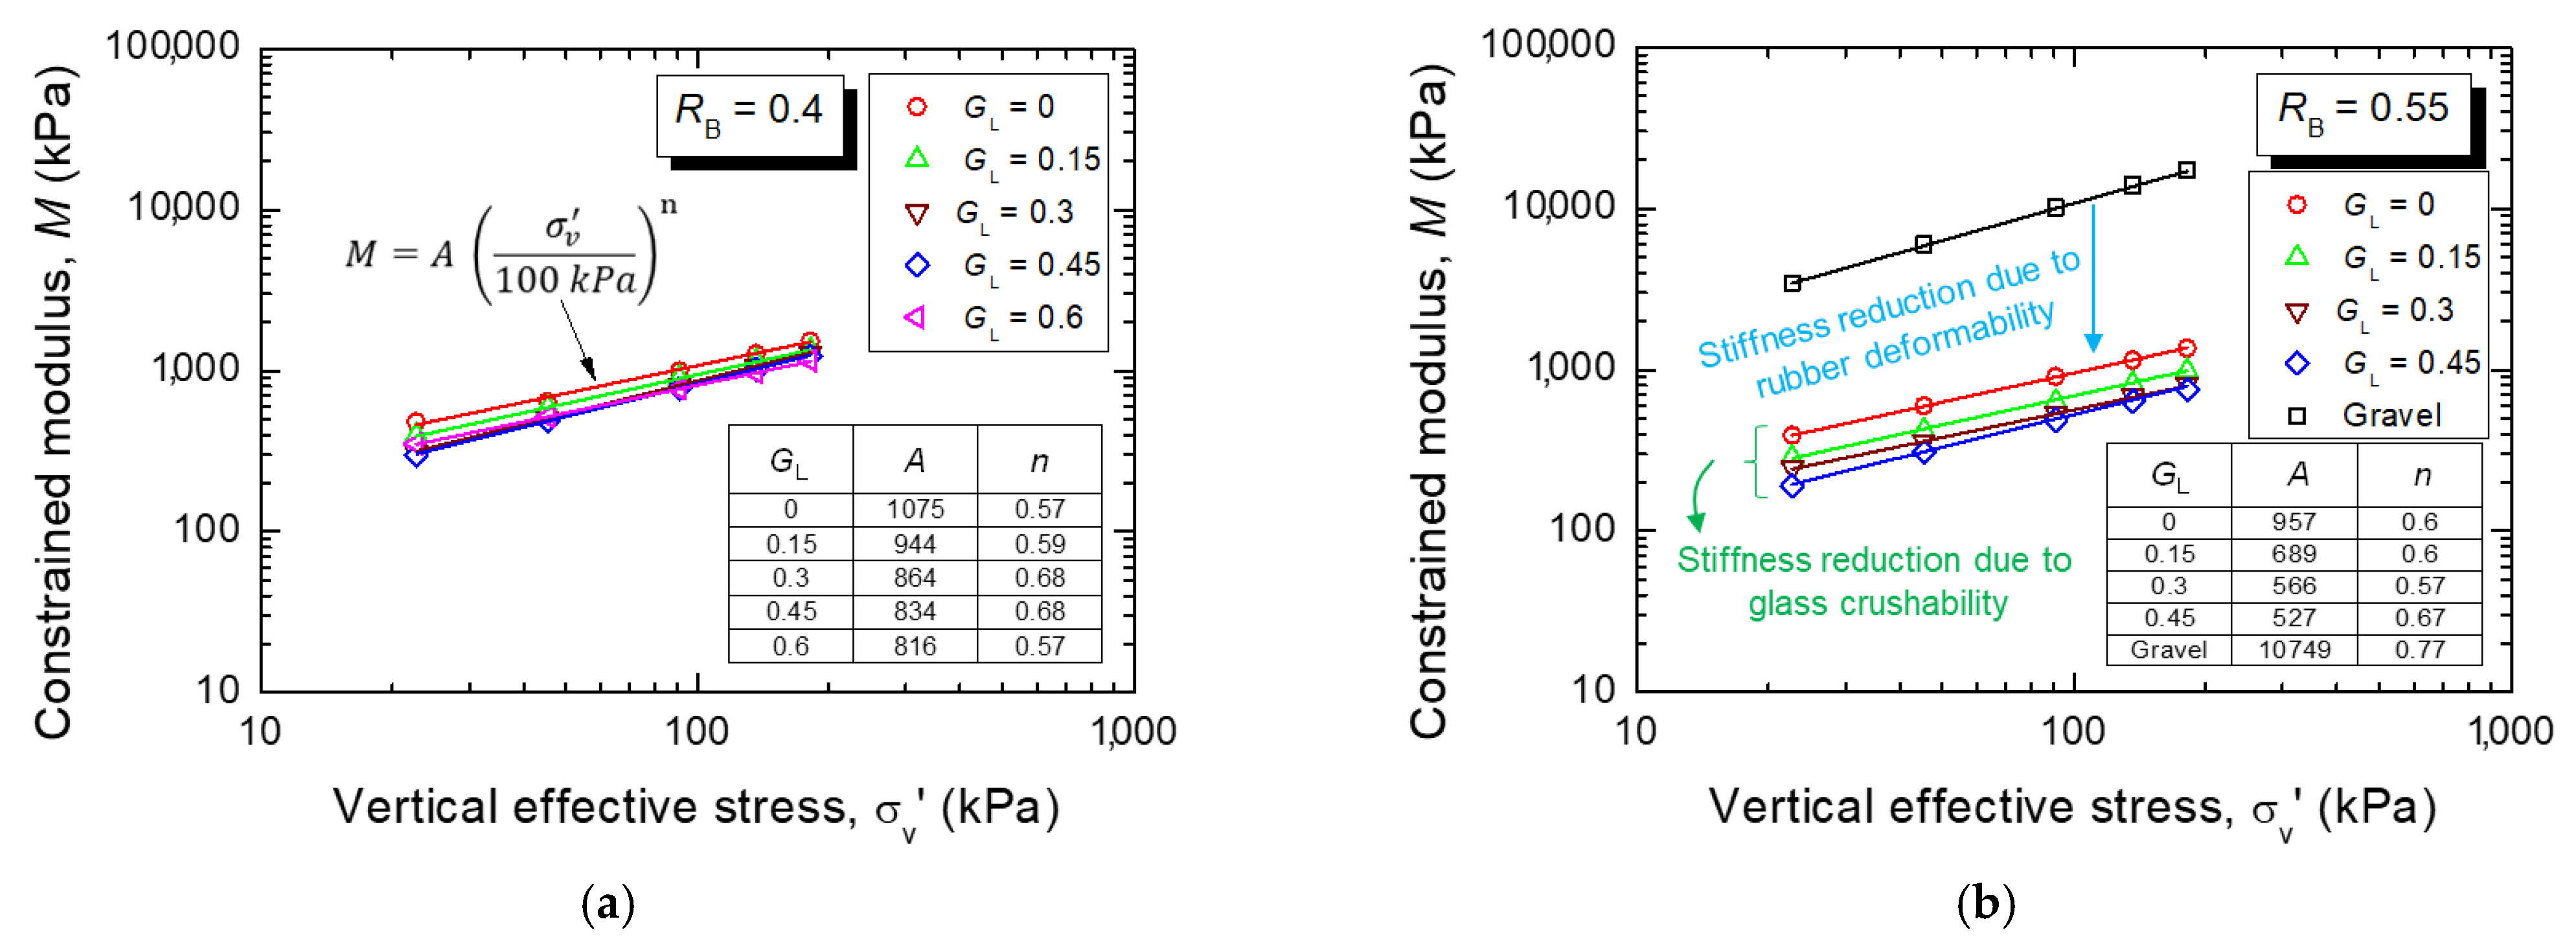
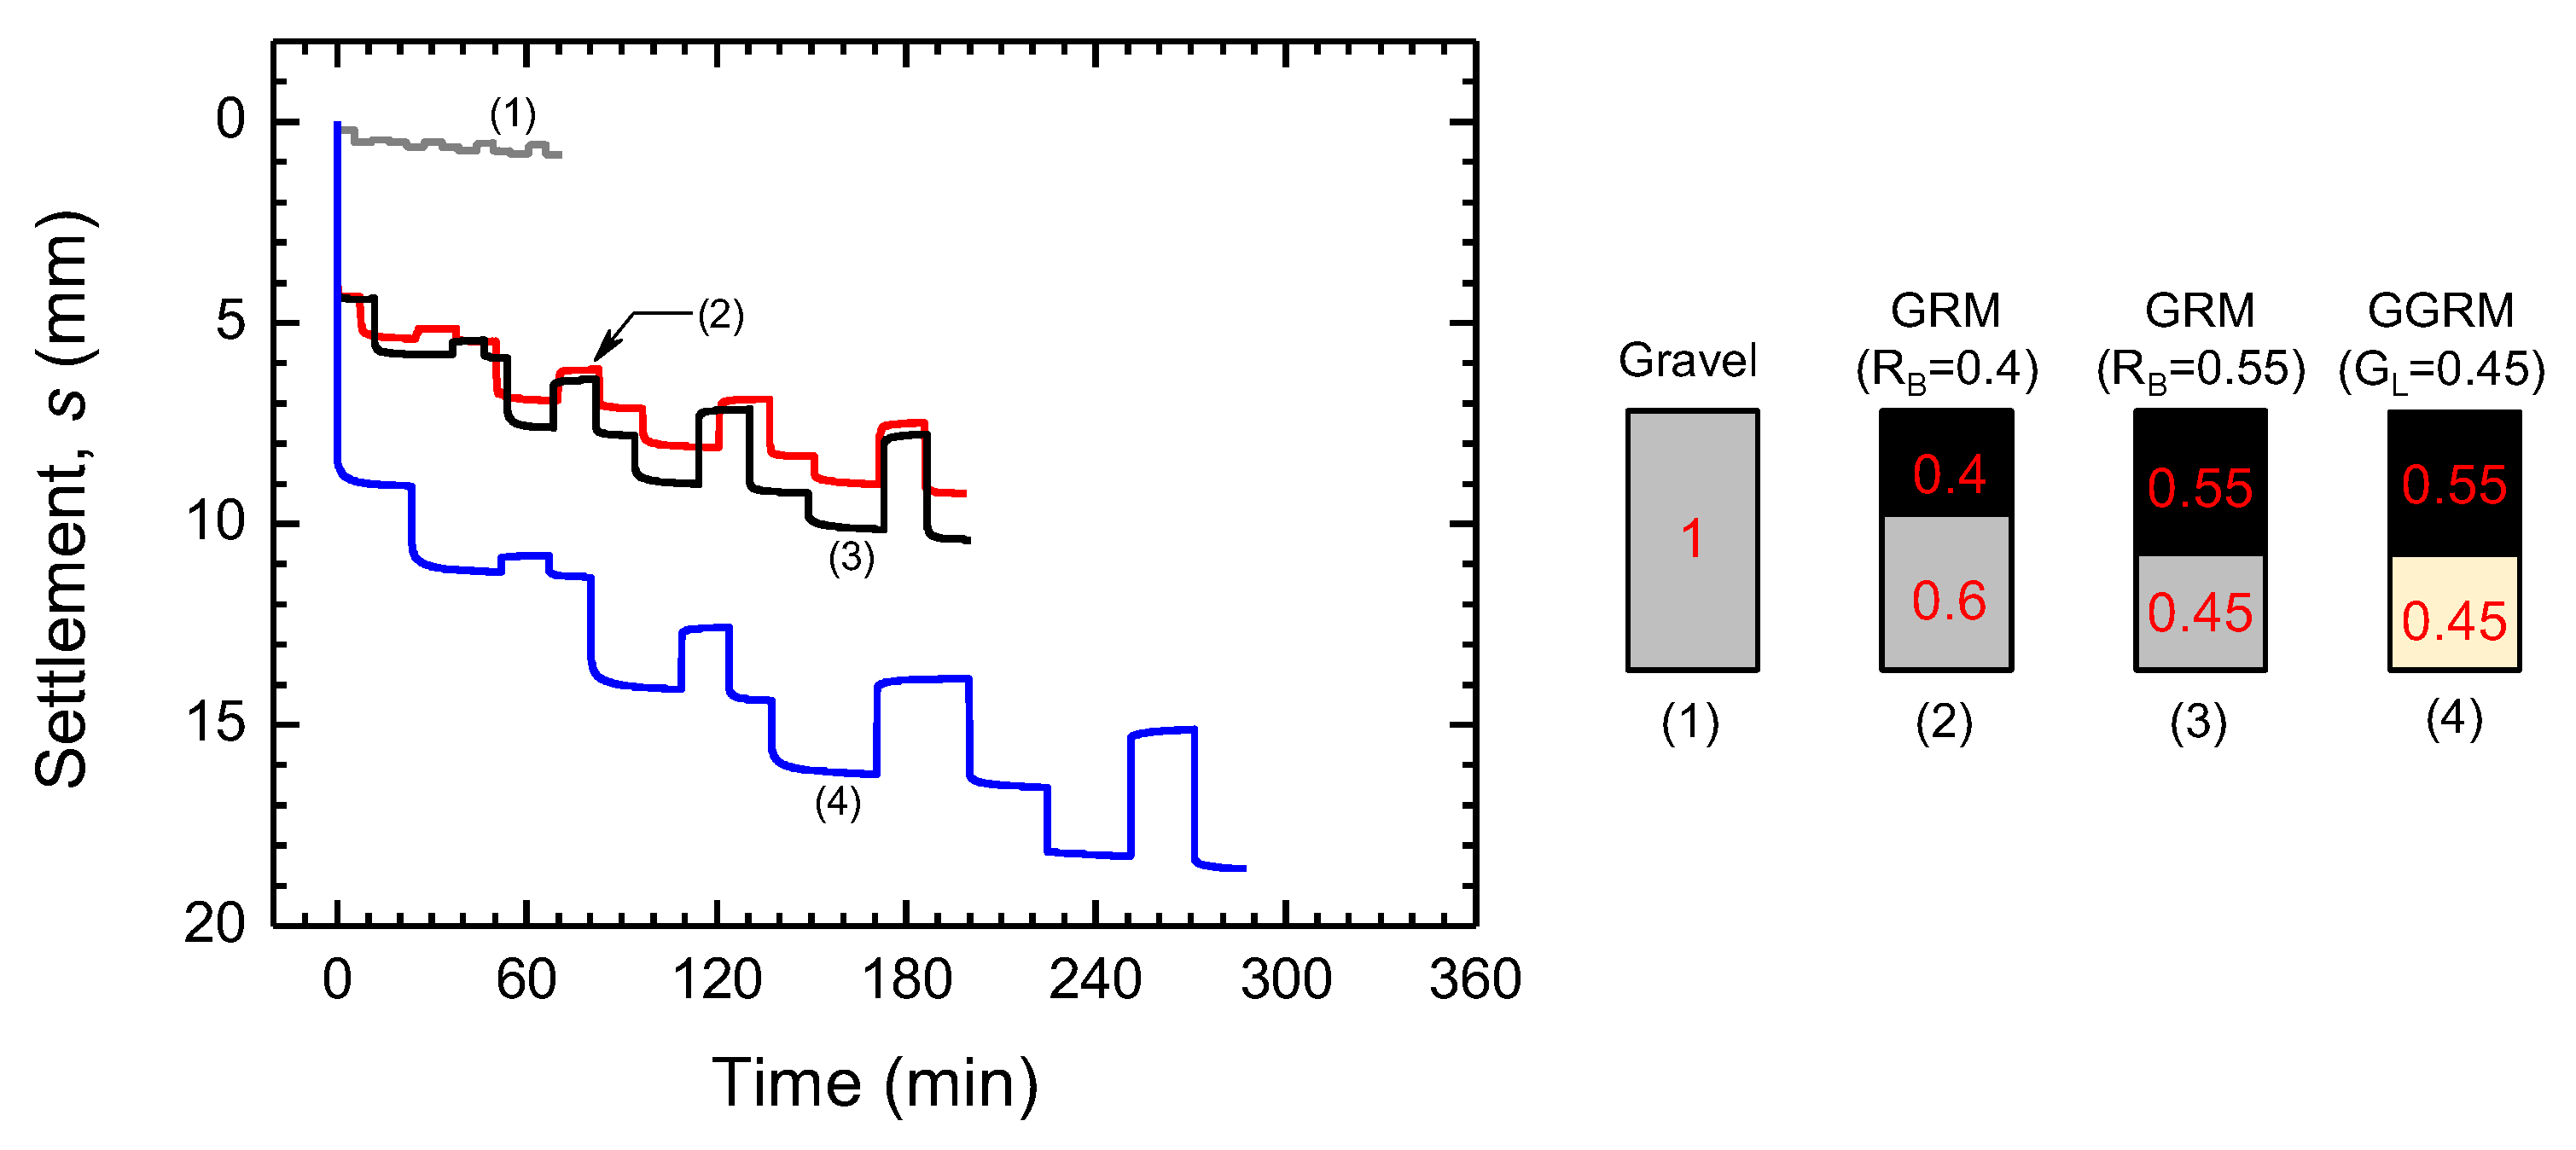
4.2. Compression of Compacted GGRM Under One-Dimensional Loading
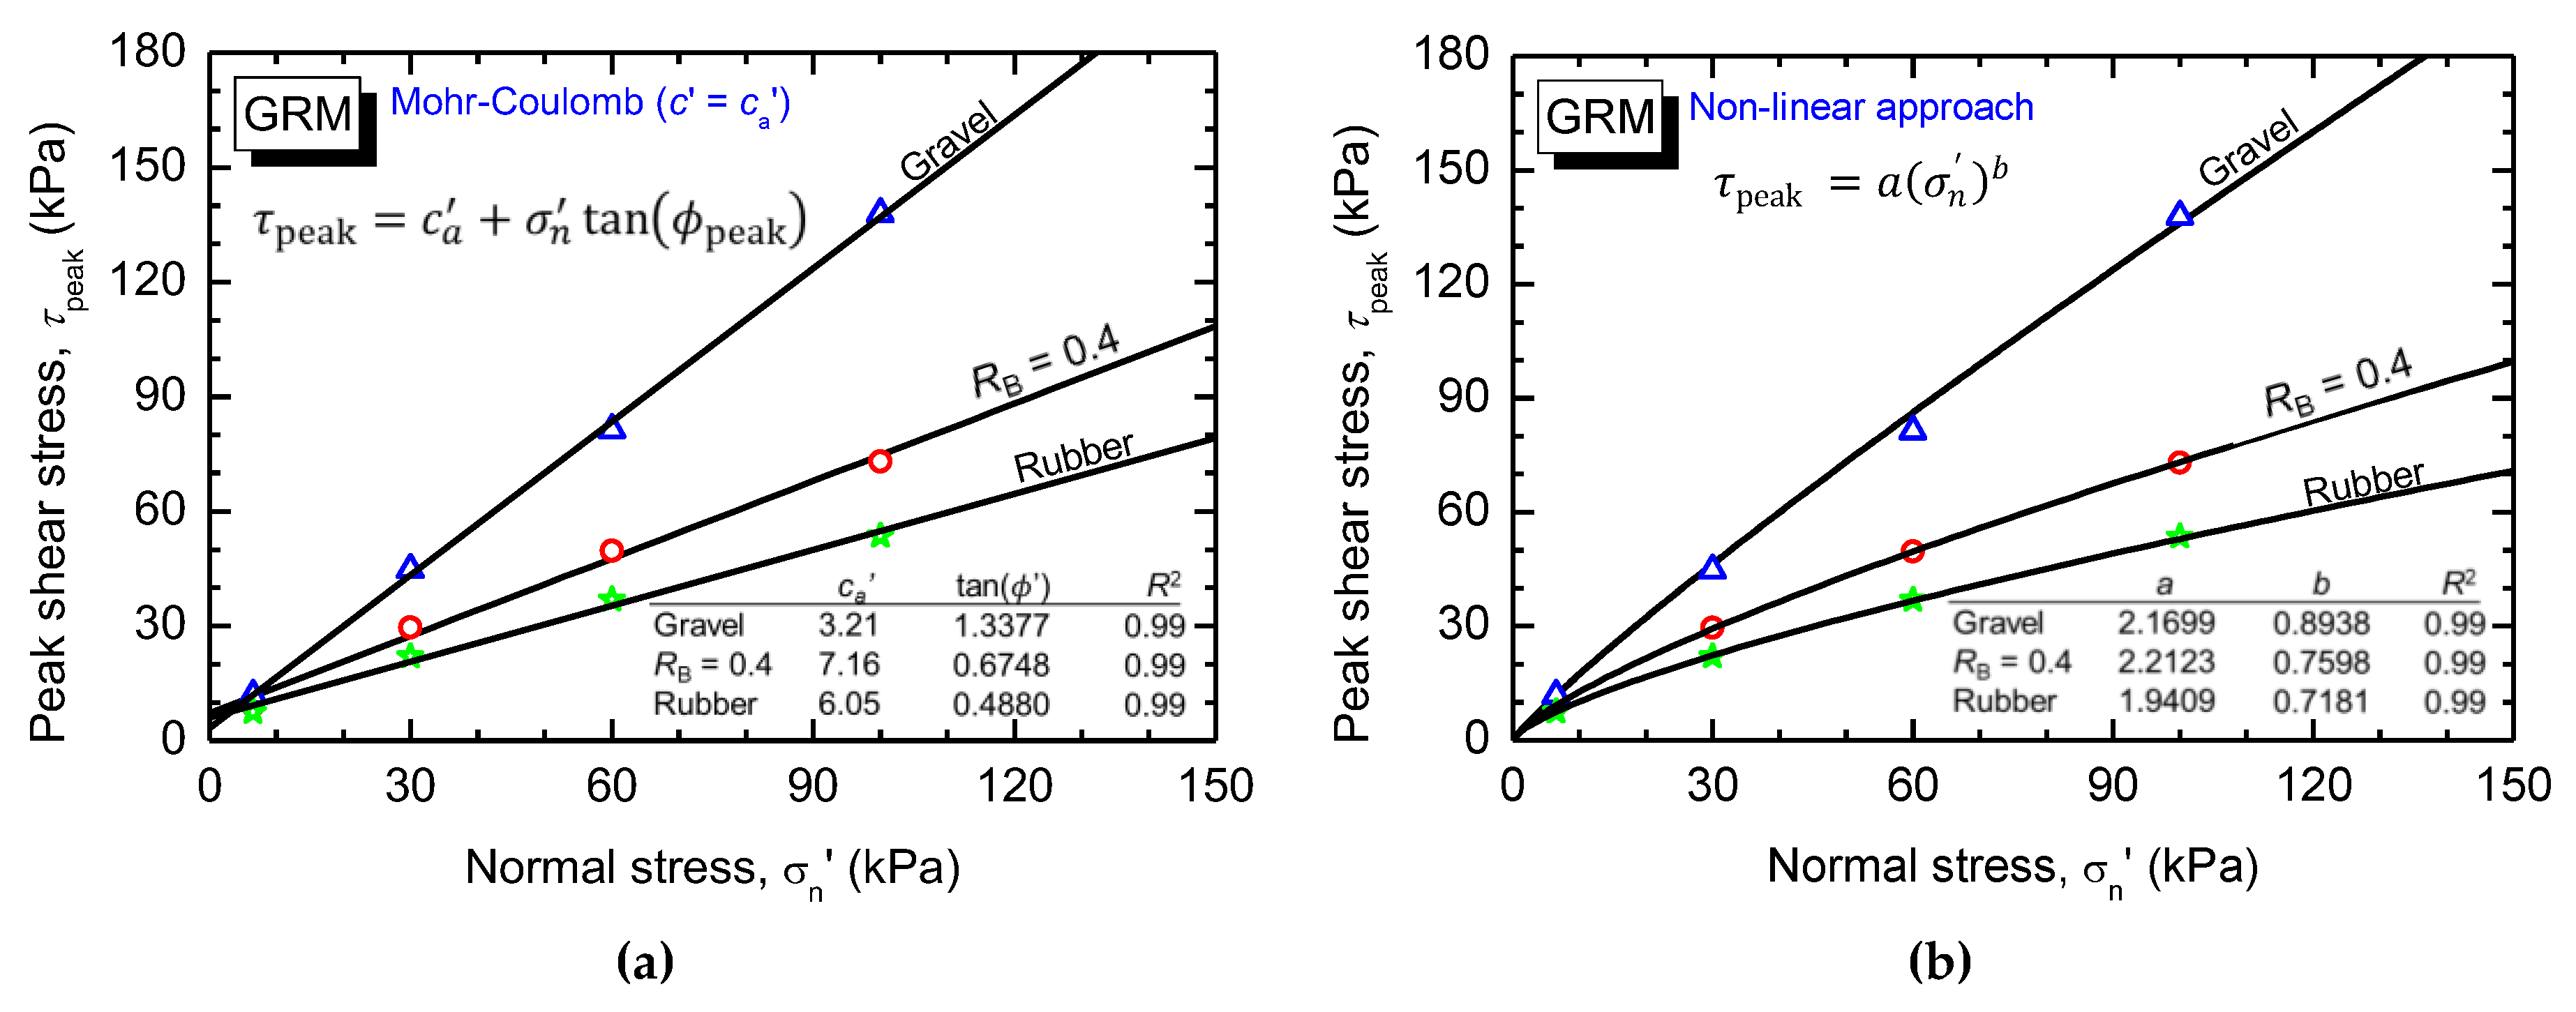
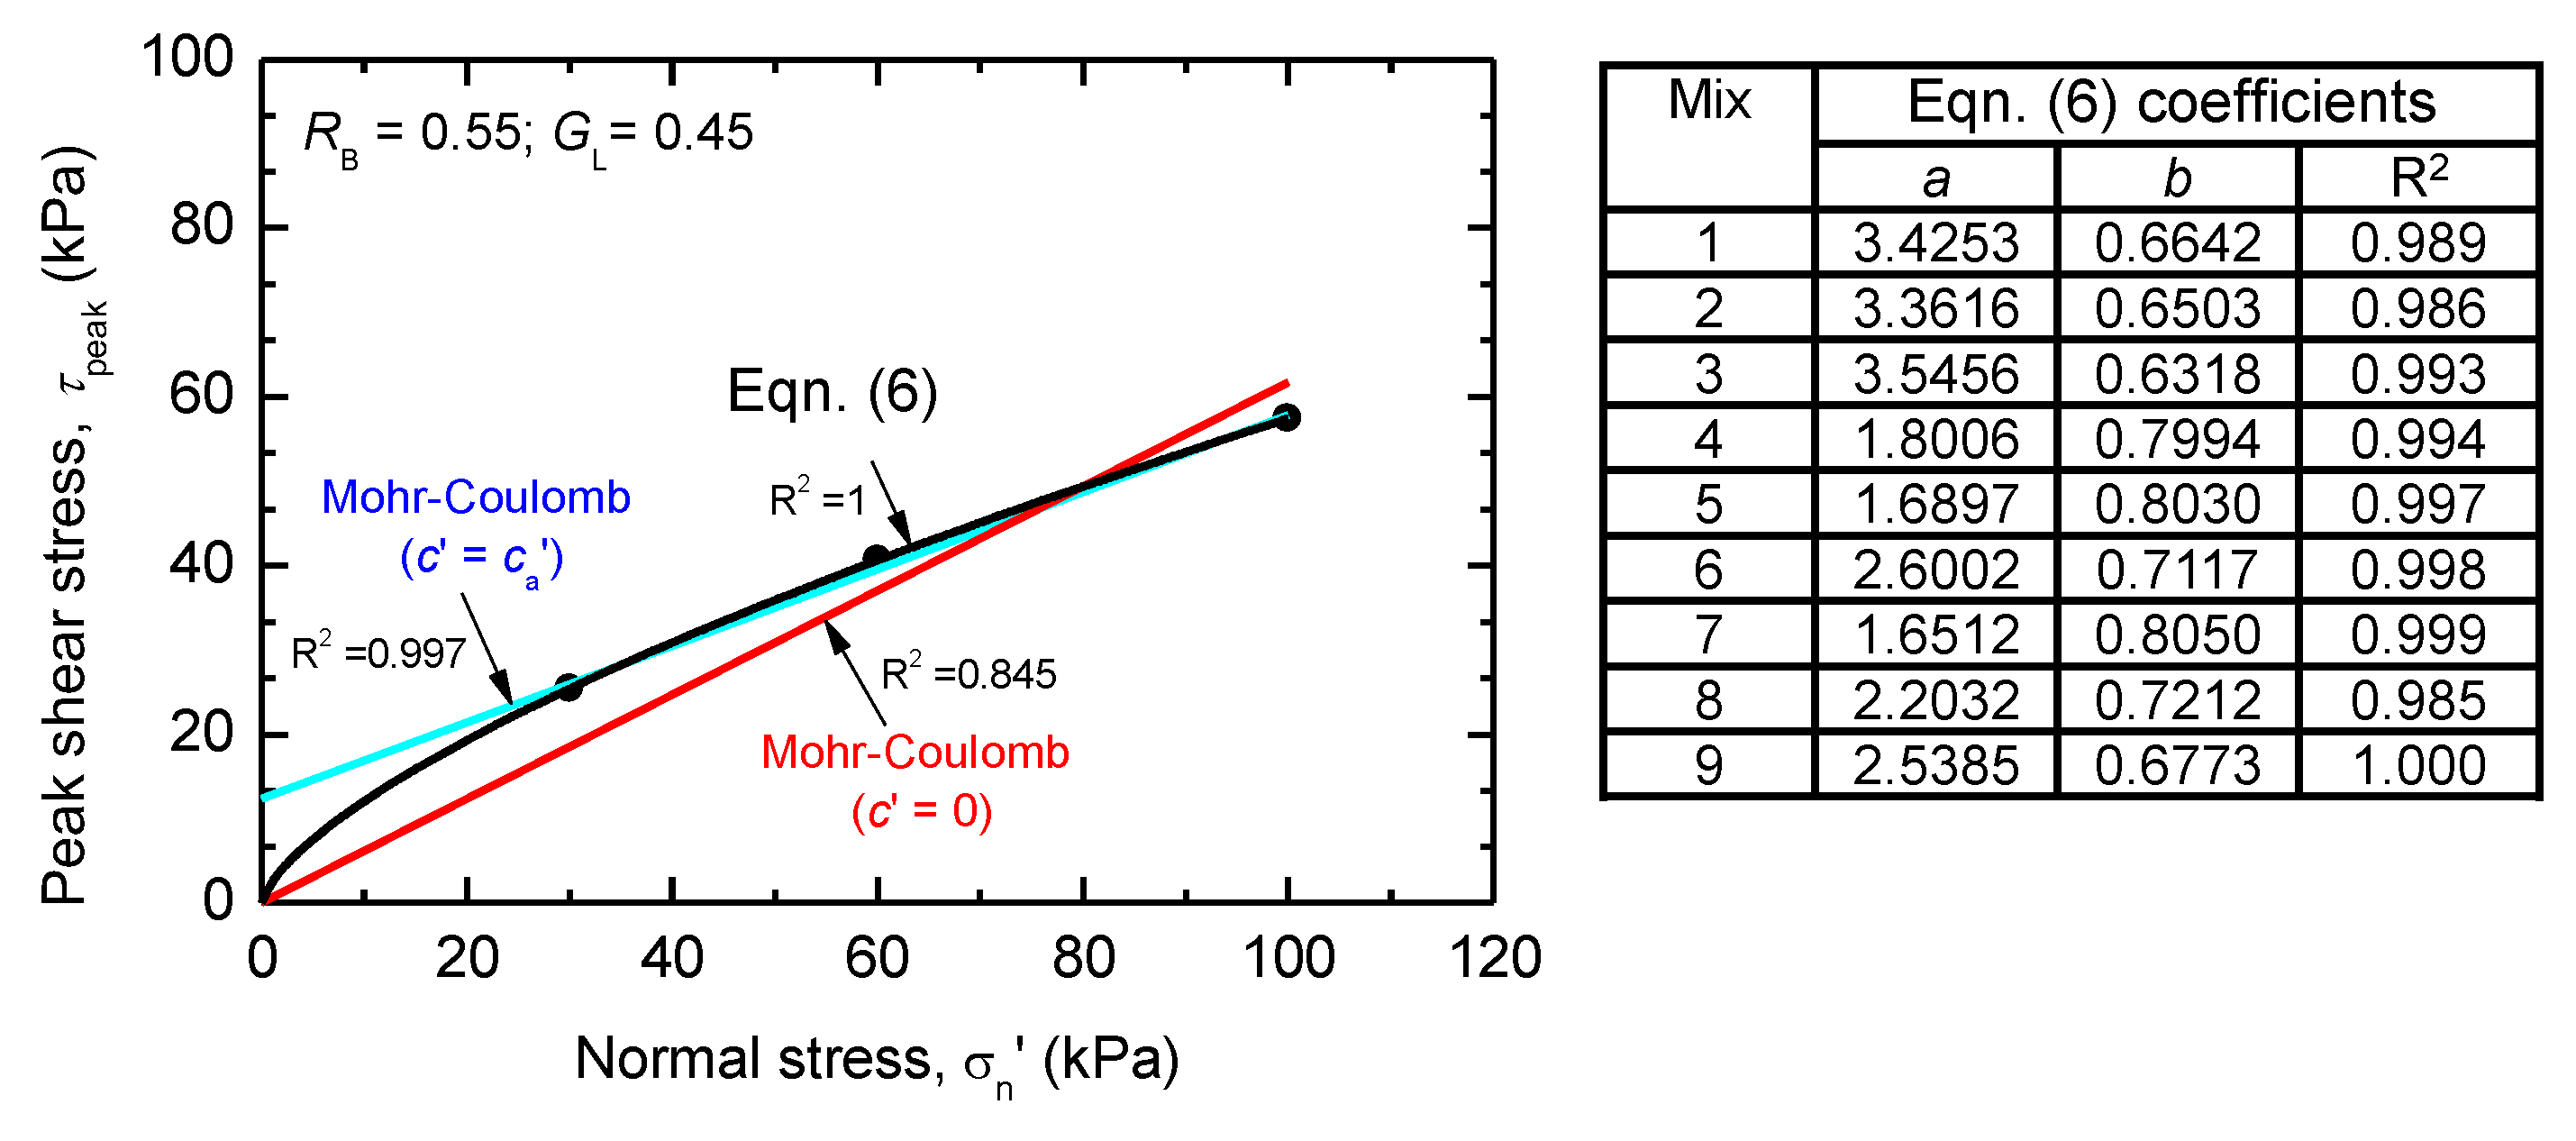
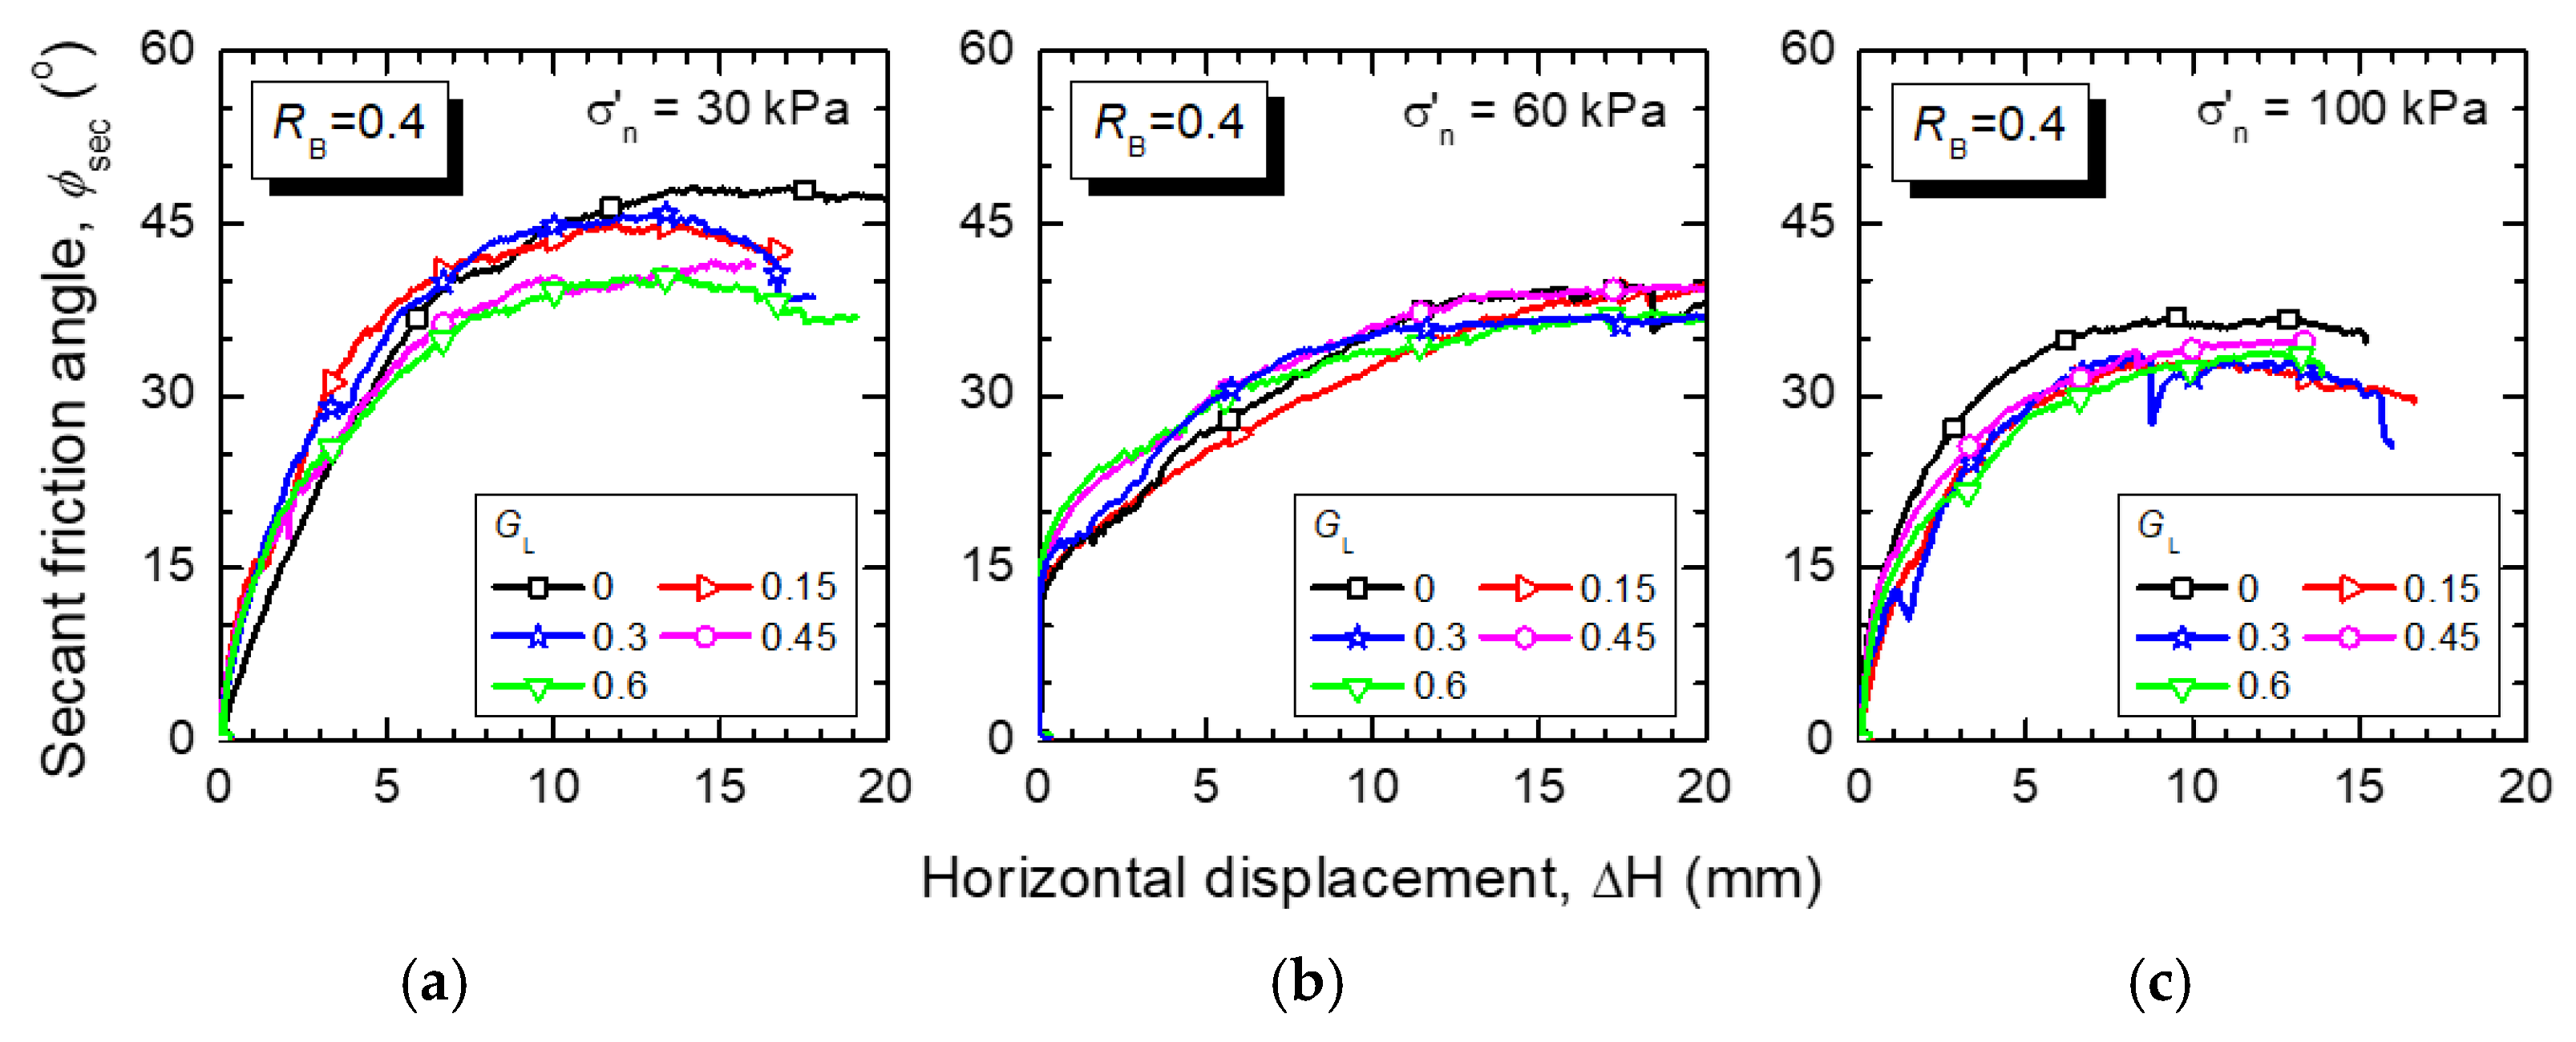
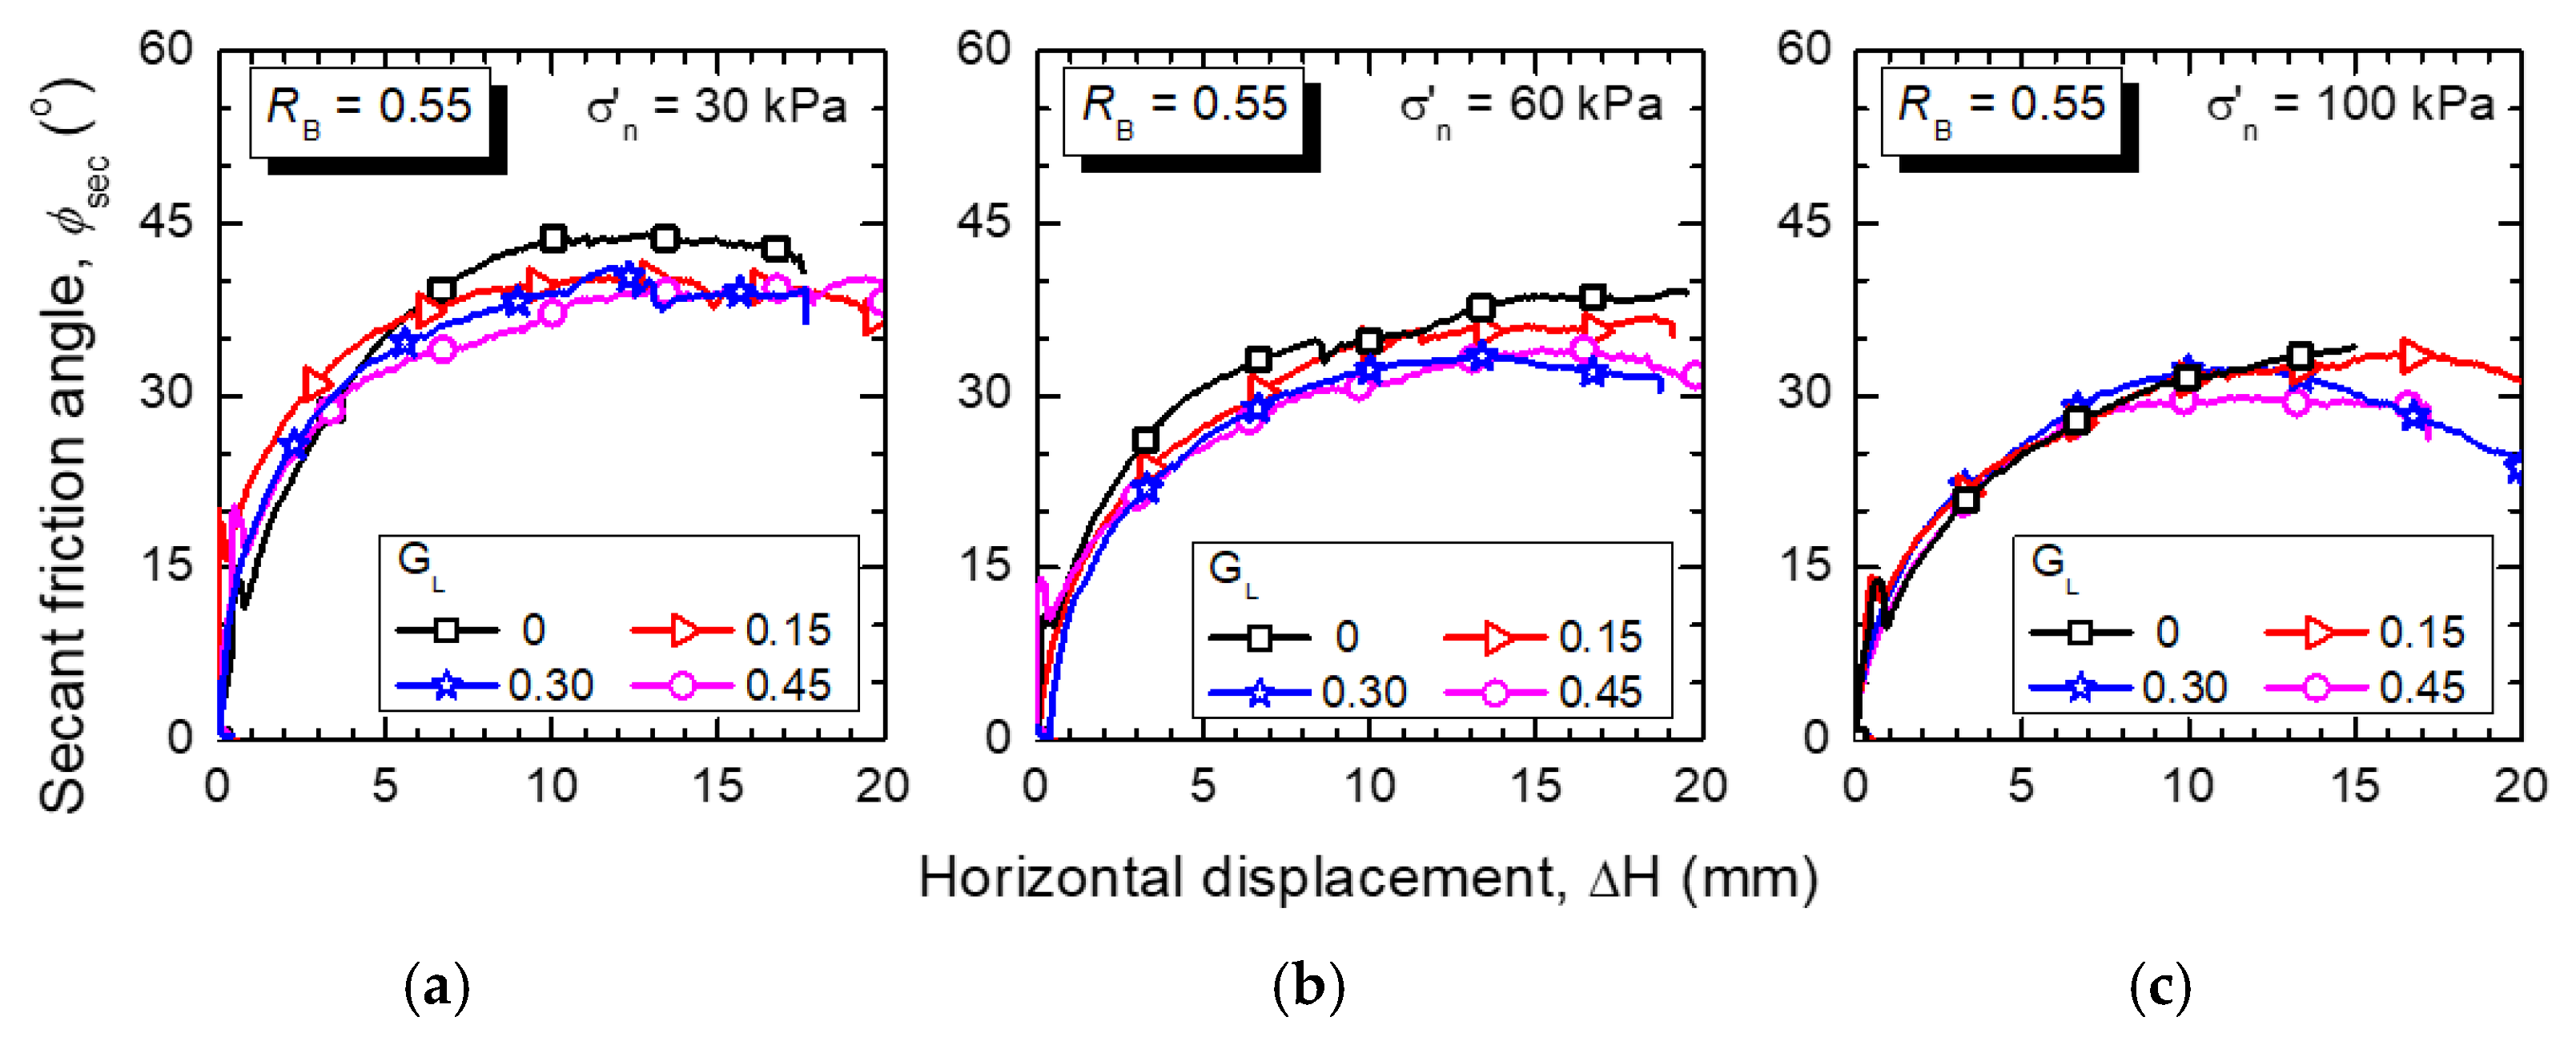
4.3. Strength Characteristics of Compacted GGRM from Direct Shear Tests
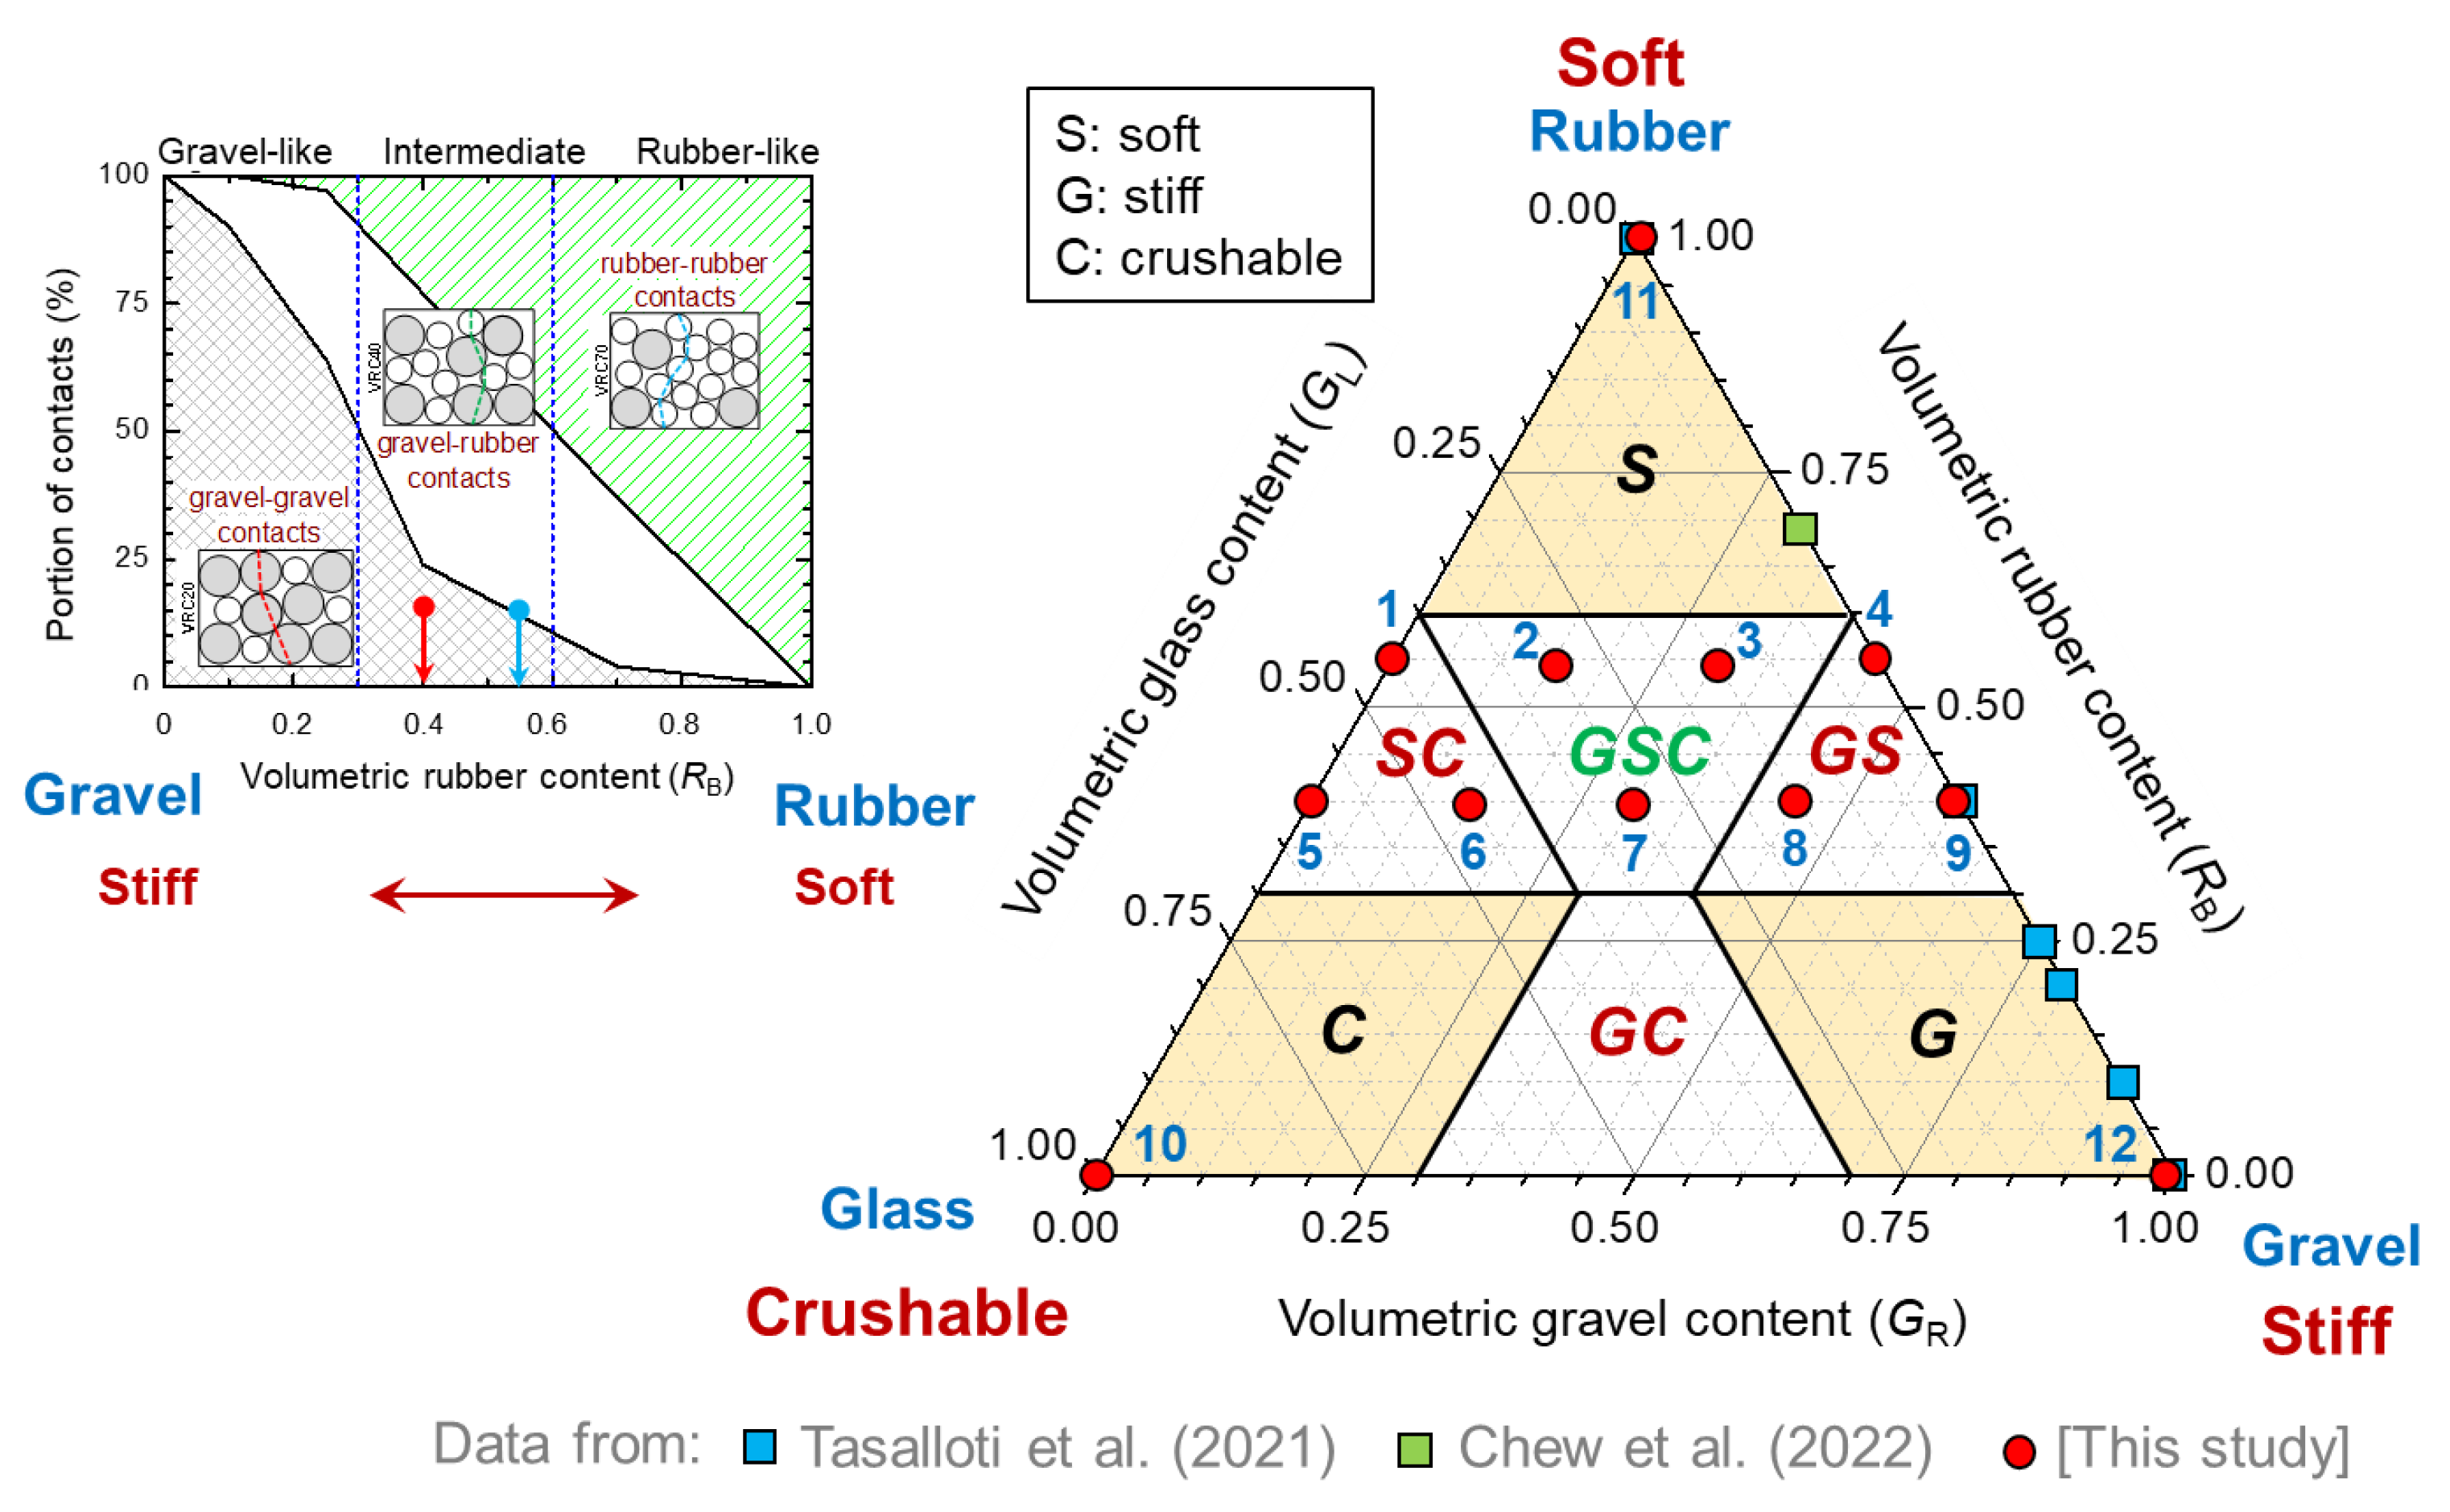
4.4. Behavioral Zones for Compacted GGRM
5. Potential Use of GGRM as Fill Materials in Geotechnical Applications
- GS mixtures (0.3 ≤ RB < 0.6 and GR > 0.4)—due to their high strength and limited compressibility, they can be used as structural fills. Yet, in situations where high vertical loads are applied, improvement by preloading or other ground improvement techniques should be considered to enhance their compressibility.
- GSC mixtures (0.3 ≤ RB < 0.6, GL ≤ 0.4, and GR ≤ 0.4)—due to their compressibility and potential high crushability, they should only be employed as structural fills if improved, for instance, by preloading; alternatively, they can be safely used as general fills.
- SC mixtures (0.3 ≤ RB < 0.6 and GL > 0.4)—due to their higher compressibility and high crushability, their use as structural fills is discouraged unless improved. But they are acceptable as general fills.
- G mixtures (RB < 0.3 and GL < 0.3)—they can be safely used as structural fills due to their high frictional resistance and minimal compressibility [38].
- GC mixtures (RB < 0.3, GL ≥ 0.3, and GR ≥ 0.3)—they should be employed as structural fills only if improved, for example, by preloading, because of their tendancy to exhibit high crushability. Otherwise, they can be safely used as general fills.
- C mixtures (RB < 0.3 and GR < 0.3)—likewise, GC mixtures should be employed as structural fills only if improved due to the high crushability of the glass. Otherwise, they can be safely used as general fills.
- S mixtures (RB ≥ 0.6)—not only are they highly compressible, but from an environmental viewpoint are of concern due to the high concentration of metal leachate from the rubber inclusions and the associated risk of contamination to groundwater and soil [40,41]. While they could be potentially suitable as general fills (from a geotechnical viewpoint), they must be pretreated to reduce their environmental impact before being used as filling materials. Alternatively, they must be enclosed by impermeable geosynthetic membranes to prevent contamination of the surrounding environment [40,41].
6. Conclusions
- Compaction—the dry density of compacted GGRM decreases linearly with increasing GL and RB. This is mainly due to the different specific gravity of the gravel (GS = 2.66), green glass (GS = 2.50), and rubber inclusions (GS = 1.15; lightweight). Moreover, an increase in glass breakage/crushing with increasing GL was observed, with the maximum amount of breakage (2.24%) obtained for RB = 0.4 (GL = 0.6). This is associated with the higher amount of glass in the mixtures. The glass breakage, however, seems to decrease with increasing RB in the mixture; this is because soft rubber inclusions in the GGRM act as a cushion that absorbs part of the impact compaction energy delivered to the specimen.
- One-dimensional compression—the volumetric strain of the studied GGRM significantly increased with GL due mainly to the glass crushability. Nevertheless, if the mixtures are subjected to unloading and reloading, their compressibility is drastically reduced, and their volumetric response becomes essentially elastic. This implies that during the unloading–reloading phase, the glass crushing and gravel grain rearrangement (mainly responsible for the plastic deformation) are minimized, and that the observed elastic response is due primarily to the rubber rebound.
- Shear strength—the shear strength of GGRM evaluated by direct shear tests is comparable to that of gravel–rubber mixtures (GRM) without glass in terms of overall mechanical response, peak shear strength, and friction angle. Specifically, under normal stress up to 100 kPa, the peak friction angle is found to be between 30° and 45°.
- Behavioral zones—seven distinct behavioral zones can be defined for GGRM due to the simultaneous presence of soft rubber-like (S), stiff gravel-like (G), and crushable glass-like (C) materials. The investigated compacted GGRM can be considered intermediate materials; their behavior gradually transitions from stiff–soft (GS) to stiff–soft–crushable (GSC) to stiff–crushable (GC) as glass is added in the mixtures as a replacement for gravel.
- Practical applications—overall, GGRM possesses adequate strength (i.e., a peak friction angle of 30° or greater) to be used as structural fill in eco-friendly geotechnical projects, such as lightweight backfill materials, shallow underground layers for mitigation of liquefaction phenomena, and geotechnical seismic isolation for low-to-medium-rise lightweight structures/infrastructure. While the volumetric compressibility of GGRM may be of concern in applications where high static loads are applied, this study demonstrates that it can be effectively enhanced (for example, by using preloading) and its impact minimized. Additionally, GGRM can be safely used as general fill material.
Author Contributions
Funding
Institutional Review Board Statement
Informed Consent Statement
Data Availability Statement
Acknowledgments
Conflicts of Interest
References
- Chiaro, G.; Indraratna, B.; Tasalloti, S.M.A.; Rujikiatkamjorn, C. Optimisation of coal wash–slag blend as a structural fill. Ground Improv. 2015, 168, 33–44. [Google Scholar] [CrossRef]
- Přikryl, R.; Török, Á.; Theodoridou, M.; Gomez-Heras, M.; Miskovsky, K. Geomaterials in construction and their sustainability: Understanding their role in modern society. Geol. Soc. Spec. Publ. 2016, 416, 1–22. [Google Scholar] [CrossRef]
- Arulrajah, A.; Narsilio, G.; Kodikara, J.; Orense, R.P. Key issues in environmental geotechnics: Australia-New Zealand. Environ. Geotech. 2015, 6, 326–330. [Google Scholar] [CrossRef]
- Qi, Y.; Indraratna, B.; Twak, M. Use of recycled rubber elements in track stabilisation. Geotech. Spec. Publ. 2020, GSP 319, 49–59. [Google Scholar] [CrossRef]
- Ghorbani, B.; Arulrajah, A.; Narsilio, G.; Horpibulsuk, S.; Bo, M.W. Dynamic characterization of recycled glass-recycled concrete blends using experimental analysis and artificial neural network modeling. Soil Dyn. Earthq. Eng. 2021, 142, 106544. [Google Scholar] [CrossRef]
- Jastrzebska, M.; Kazimierowicz-Frankowska, K.; Chiaro, G.; Rybak, J. New frontiers in sustainable geotechnics. App. Sci. 2023, 13, 562. [Google Scholar] [CrossRef]
- Waste Management. Case Study: Tyre Recycling. Available online: https://www.wastemanagement.co.nz/news-and-media/Case-Study-Tyre-Recycling/ (accessed on 27 February 2024).
- Parliamentary Commissioner for the Environment. Resource Use and Waste Generation in Aotearoa New Zealand: A Literature Review; Technical report; Parliamentary Commissioner for the Environment: Wellington, New Zealand, 2024; p. 73. Available online: https://pce.parliament.nz/media/dwihj41m/resource-use-and-waste-generation-in-aotearoa-new-zealand-a-literature-review.pdf (accessed on 27 May 2025).
- Sustainable Development Goals. Available online: https://www.un.org/sustainabledevelopment/ (accessed on 27 February 2024).
- Wartman, J.; Grubb, D.G.; Nasim, A.S.M. Select engineering characteristics of crushed glass. J. Mater. Civ. Eng. 2004, 16, 526–539. [Google Scholar] [CrossRef]
- Disfani, M.; Arulrajah, A.; Bo, M.; Hankour, R. Recycled crushed glass in road work applications. Waste Manag. 2011, 31, 2341–2351. [Google Scholar] [CrossRef]
- Kazmi, D.; Williams, D.J.; Serati, M. Waste glass in civil engineering applications—A review. Int. J. Appl. Ceram. Technol. 2020, 17, 529–554. [Google Scholar] [CrossRef]
- Disfani, M.M.; Tsang, H.-H.; Arulrajah, A.; Yaghoubi, E. Shear and compression characteristics of recycled glass-tire mixtures. J. Mater. Civ. Eng. 2017, 29, 06017003. [Google Scholar] [CrossRef]
- Grubb, D.G.; Davis, A.F.; Sands, S.C.; Carnivale, M.; Wartman, J.; Gallagher, P.M. Field evaluation of crushed glass–dredged material blends. J. Geotech. Geoenviron. Eng. 2006, 132, 577–590. [Google Scholar] [CrossRef]
- Grubb, D.G.; Gallagher, P.M.; Wartman, J.; Liu, Y.; Carnivale, M. Laboratory evaluation of crushed glass–dredged material blends. J. Geotech. Geoenviron. Eng. 2006, 132, 562–576. [Google Scholar] [CrossRef]
- Malasavage, N.E.; Gallagher, P.M.; Grubb, D.G.; Wartman, J.; Carnivale, M., III. Modifying a plastic clay with crushed glass: Implications for constructed fills. Soils Found. 2007, 47, 1017–1027. [Google Scholar] [CrossRef]
- Perera, S.T.A.M.; Saberian, M.; Zhu, J.; Roychand, R.; Li, J. Effect of crushed glass on the mechanical and microstructural behavior of highly expansive clay subgrade. Case Stud. Constr. Mater. 2022, 17, e01244. [Google Scholar] [CrossRef]
- Ali, M.M.Y.; Arulrajah, A.; Disfani, M.M.; Piratheepan, J. Suitability of using recycled glass-crushed rock blends for pavement subbase applications. In Proceedings of the Geo-Frontiers 2011 Conference: Advances in Geotechnical Engineering, Dallas, TX, USA, 13–16 March 2011; pp. 1325–1334. [Google Scholar] [CrossRef]
- Arulrajah, A.; Ali, M.; Disfani, M.M.; Horpibulsuk, S. Recycled-glass blends in pavement base/subbase applications: Laboratory and field evaluation. J. Mater. Civ. Eng. 2014, 26, 04014025. [Google Scholar] [CrossRef]
- Lee, J.; Salgado, R.; Bernal, A.; Lovell, C. Shredded tires and rubber-sand as lightweight backfill. J. Geotech. Geoenviron. Eng. 1999, 125, 132–141. [Google Scholar] [CrossRef]
- Lee, J.S.; Dodds, J.; Santamarina, J.C. Behavior of rigid-soft particle mixtures. J. Mater. Civ. Eng. 2007, 19, 179–184. [Google Scholar] [CrossRef]
- Edinçliler, A.; Baykal, G.; Saygılı, A. Influence of different processing techniques on the mechanical properties of used tires in embankment construction. Waste Manag. 2010, 30, 1073–1080. [Google Scholar] [CrossRef]
- Balunaini, U.; Mohan, V.K.D.; Prezzi, M.; Salgado, R. Shear strength of tyre chip-sand and tyre shred-sand mixtures. Proc. Inst. Civ. Eng. Geotech. Eng. 2014, 167, 585–595. [Google Scholar] [CrossRef]
- Mashiri, M.S.; Vinod, J.S.; Sheikh, M.N.; Carraro, J.A.H. Shear modulus of sand-tyre chip mixtures. Environ. Geotech. 2018, 5, 336–344. [Google Scholar] [CrossRef]
- Mashiri, M.; Vinod, J.; Sheikh, M.N.; Tsang, H.-H. Shear strength and dilatancy behaviour of sand-tyre chip mixtures. Soils Found. 2015, 55, 517–528. [Google Scholar] [CrossRef]
- Sheikh, M.N.; Mashiri, M.S.; Vinod, J.S.; Tsang, H.-H. Shear and compressibility behavior of sand–tire crumb mixtures. J. Mater. Civ. Eng. 2013, 25, 1366–1374. [Google Scholar] [CrossRef]
- Ghazavi, M.; Sakhi, M.A. Influence of optimized tire shreds on shear strength parameters of sand. Int. J. Geomech. 2005, 5, 58–65. [Google Scholar] [CrossRef]
- Kaneko, T.; Orense, R.P.; Hyodo, M.; Yoshimoto, N. Seismic response characteristics of saturated sand deposits mixed with tire chips. J. Geotech. Geoenviron. Eng. 2013, 139, 633–643. [Google Scholar] [CrossRef]
- Kim, H.K.; Santamarina, J.C. Sand-rubber mixtures (large rubber chips). Can. Geotech. J. 2008, 45, 1457–1466. [Google Scholar] [CrossRef]
- Edil, T.; Bosscher, P. Engineering properties of tire chips and soil mixtures. Geotech. Test. J. 1994, 17, 453. [Google Scholar] [CrossRef]
- Masad, E.; Taha, R.; Ho, C.; Papagiannakis, T. Engineering properties of tire/soil mixtures as a lightweight fill material. Geotech. Test. J. 1996, 19, 297–304. [Google Scholar] [CrossRef]
- Bosscher, P.J.; Edil, T.B.; Kuraoka, S. Design of highway embankments using tire chips. J. Geotech. Geoenviron. Eng. 1997, 123, 295–304. [Google Scholar] [CrossRef]
- Tasalloti, A.; Chiaro, G.; Murali, A.; Banasiak, L. Physical and mechanical properties of granulated rubber mixed with granular soils—A literature review. Sustainability 2021, 13, 4309. [Google Scholar] [CrossRef]
- Chiaro, G.; Palermo, A.; Banasiak, L.J.; Granello, G. Direct shear behaviour of gravel-granulated tyre rubber mixtures. In Proceedings of the 13th ANZ Geomechanics Conference, Perth, Australia, 1–3 April 2019. [Google Scholar]
- Chiaro, G.; Palermo, A.; Granello, G.; Tasalloti, A.; Banasiak, L.J. Reuse of waste tires to develop eco-rubber seismic-isolation foundation systems: Preliminary results. Lect. Notes Civ. Eng. 2021, 144, 159–169. [Google Scholar] [CrossRef]
- Chiaro, G. Gravel-rubber mixtures: Macro- and micro-scale engineering properties. In Proceedings of the 2nd International Conference on Construction Resources for Environmentally Sustainable Technologies, Fukuoka, Japan, 20–22 November 2023. [Google Scholar]
- Tasalloti, A.; Chiaro, G.; Murali, A.; Banasiak, L.; Palermo, A.; Granello, G. Recycling of end-of-life tires (ELTs) for sustainable geotechnical applications: A New Zealand perspective. Appl. Sci. 2021, 11, 7824. [Google Scholar] [CrossRef]
- Tasalloti, A.; Chiaro, G.; Banasaik, L.; Palermo, A. Experimental investigation of the mechanical behaviour of gravel-granulated tyre rubber mixtures. Constr. Build. Mater. 2021, 273, 127149. [Google Scholar] [CrossRef]
- Tasalloti, A.; Chiaro, G.; Palermo, A.; Banasiak, L.J. Effect of rubber crumbs volumetric content on the shear strength of gravelly soil in direct shear apparatus. Geotech. Spec. Publ. 2020, GSP 319, 259–266. [Google Scholar] [CrossRef]
- Banasiak, L.J.; Chiaro, G.; Palermo, A.; Granello, G. Recycling of end-of-life tyres in civil engineering applications: Environmental implications. In Proceedings of the WasteMINZ 2019 Conference, Hamilton, New Zealand, 23–26 September 2019. [Google Scholar]
- Banasiak, L.J.; Chiaro, G.; Palermo, A.; Granello, G. Environmental implications of the recycling of end-of-life tires in seismic-isolation foundation systems. Lect. Notes Civ. Eng. 2021, 144, 43–52. [Google Scholar] [CrossRef]
- D698 (ASTM D698); Standard Test Methods for Laboratory Compaction Characteristics of Soil Using Standard Effort (12 2012 400 ft-lbf/ft3 (600 kNm/m3)). American Society for Testing and Materials: West Conshohocken, PA, USA, 2017.
- Lambe, T.W.; Whitman, R.V. Soil Mechanics; John Wiley & Sons Inc.: New York, NY, USA, 1969. [Google Scholar]
- Indraratna, B.; Ionescu, D.; Christie, D.; Chowdhury, R. Compression and degradation of railway ballast under one-dimensional loading. Aust. Geomech. J. 1997, 32, 48–61. [Google Scholar]
- ISO 17892-10:2018; Geotechnical Investigation and Testing—Laboratory Testing of Soil, Part 10: Direct Shear Test. International Organization for Standardization: Geneva, Swiss, 2018; p. 23.
- Abate, G.; Fiamingo, A.; Massimino, M.R. An eco—sustainable innovative geotechnical technology for the structure’s seismic isolation, investigated by FEM parametric analyses. Bull. Earthq. Eng. 2023, 21, 4851–4875. [Google Scholar] [CrossRef]
- Fiamingo, A.; Chiaro, G.; Murali, A.; Massimino, M.R. Geotechnical characterization of soil-rubber mixtures with well graded gravel. Geosynth. Int. 2025, 1–17, in press. [Google Scholar] [CrossRef]
- Hazarika, H.; Pasha, S.M.K.; Ishibashi, I.; Yoshimoto, N.; Kinoshita, T.; Endo, S.; Karmokar, A.K.; Hitosugi, T. Tire-chip reinforced foundation as liquefaction countermeasure for residential buildings. Soils Found. 2020, 60, 315–326. [Google Scholar] [CrossRef]
- Maleska, T.; Beben, D.; Nowacka, J.; Fiamingo, A.; Massimino, M.R. Seismic finite element method simulation of a soil-steel bridge with a gravel-rubber mix. In Proceedings of the 12th International Conference on Bridge Maintenance, Safety and Management, IABMAS 2024, Copenhagen, Denmark, 24–28 June 2024; pp. 1288–1295. [Google Scholar]
- Pasha, S.M.K.; Hazarika, H.; Yoshimoto, N. Physical and mechanical properties of gravel-tire chips mixture (GTCM). Geosynth. Int. 2019, 26, 92–110. [Google Scholar] [CrossRef]
- Pitilakis, D.; Anastasiadis, A.; Vratsikidis, A.; Kapouniaris, A.; Massimino, M.R.; Abate, G.; Corsico, S. Large-scale field testing of geotechnical seismic isolation of structures using gravel-rubber mixtures. Earthq. Eng. Struct. Dyn. 2021, 50, 2712–2731. [Google Scholar] [CrossRef]
- Shrestha, S.; Ravichandran, N.; Raveendra, M.; Attenhofer, J.A. Design and analysis of retaining wall backfilled with shredded tire and subjected to earthquake shaking. Soil Dyn. Earthq. Eng. 2016, 90, 227–239. [Google Scholar] [CrossRef]
- Tsang, H.H.; Tran, D.P.; Gad, E.F. Serviceability performance of buildings founded on rubber–soil mixtures for geotechnical seismic isolation. Aust. J. Struct. Eng. 2023, 24, 265–278. [Google Scholar] [CrossRef]
- Chew, K.; Chiaro, G.; Vinod, J.S.; Tasalloti, A.; Allulakshmi, K. Direct shear behavior of gravel-rubber mixtures: Discrete element modeling and microscopic investigations. Soils Found. 2022, 62, 101156. [Google Scholar] [CrossRef]
- Ghaaowd, I.; McCartney, J.S.; Thielmann, S.S.; Sanders, M.J.; Fox, P.J. Shearing behavior of tire-derived aggregate with large particle size. I: Internal and concrete interface direct shear. J. Geotech. Geoenviron. Eng. 2017, 143, 04017078. [Google Scholar] [CrossRef]
- Duncan, J.M.; Byrne, P.; Wong, K.S.; Mabry, P. Strength, Stress-Strain and Bulk Modulus Parameters for Finite Element Analysis of Stresses and Movements in Soil Masses; Report No. UCB/GT/80-01; Department Civil Engineering, University of California: Berkeley, CA, USA, 1980. [Google Scholar]
- Chiaro, G.; Christian, S.; Goldingham, L.; Murali, A. Direct shear response of gravel-glass-rubber mixtures. In Proceedings of the 14th ANZ Geomechanics Conference, Cairns, Australia, 2–5 July 2023. [Google Scholar]
- Chiaro, G.; Palermo, A.; Banasiak, L.; Tasalloti, A.; Granello, G.; Hernandez, E. Seismic response of low-rise buildings with eco-rubber geotechnical seismic isolation (ERGSI) foundation system: Numerical investigation. Bull. Earthq. Eng. 2023, 21, 3797–3821. [Google Scholar] [CrossRef]
- Forcellini, D.; Chiaro, G.; Palermo, A.; Banasiak, L.; Tsang, H.H. Energy dissipation efficiency of geotechnical seismic isolation with gravel-rubber mixtures: Insights from FE non-linear numerical analysis. J. Earthq. Eng. 2024, 28, 2422–2439. [Google Scholar] [CrossRef]
- Chiaro, G.; Tasalloti, A.; Palermo, A.; Banasiak, L. Small-strain shear stiffness and strain-dependent dynamic properties of gravel–rubber mixtures. Lect. Notes Civ. Eng. 2022, 331, 467–477. [Google Scholar] [CrossRef]
- Fiamingo, A.; Abate, G.; Chiaro, G.; Massimino, M.R. Small-strain stiffness and dynamic properties of well-graded gravel–rubber mixtures. Geotech. Lett. 2025, 15, 1–28. [Google Scholar] [CrossRef]
- Senetakis, K.; Anastasiadis, A.; Pitilakis, K. Dynamic properties of dry sand/rubber (SRM) and gravel/rubber (GRM) mixtures in a wide range of shearing strain amplitudes. Soil Dyn. Earthq. Eng. 2012, 33, 38–53. [Google Scholar] [CrossRef]
- Anastasiadis, A.; Senetakis, K.; Pitilakis, K. Small-strain shear modulus and damping ratio of sand–rubber and gravel–rubber mixtures. Geotech. Geol. Eng. 2012, 30, 363–382. [Google Scholar] [CrossRef]
- Pistolas, G.A.; Anastasiadis, A.; Pitilakis, K. Dynamic properties of gravel–recycled rubber mixtures: Resonant column and cyclic triaxial tests. In Proceedings of the XVI European Conference on Soil Mechanics and Geotechnical Engineering, Edinburgh, UK, 13–17 September 2015; pp. 2613–2618. [Google Scholar]
- Pasha, S.M.K.; Hazarika, H.; Yoshimoto, N. Estimating dynamic characteristics of gravel-tire chips mixtures using artificial intelligence techniques. J. Soc. Mater. Sci. 2020, 69, 1–8. [Google Scholar] [CrossRef]
- Pitilakis, D.; Anastasiadis, A.; Vratsikidis, A.; Kapouniaris, A. Configuration of a gravel-rubber geotechnical seismic isolation system from laboratory and field tests. Soil Dyn. Earthq. Eng. 2024, 178, 108463. [Google Scholar] [CrossRef]


| Materials | Dry Density (kg/m3) | References | |||
|---|---|---|---|---|---|
| Gravel GR | Rubber RB | Glass GL | Measured # | Prediction Equation (4) | |
| 1 | - | - | 1754 | 1754 | Tasalloti et al. [38] |
| 0.9 | 0.1 | - | 1621 | 1643 | |
| 0.8 | 0.2 | - | 1514 | 1533 | |
| 0.75 | 0.25 | - | 1487 | 1477 | |
| 0.6 | 0.4 | - | 1315 | 1312 | |
| 0.55 | 0.45 | - | 1248 | 1257 | |
| - | 1 | - | 649 | 649 | |
| 0.6 | 0.4 | - | 1310 | 1310 | This study |
| 0.45 | 0.4 | 0.15 | 1274 | 1277 | |
| 0.3 | 0.4 | 0.3 | 1232 | 1243 | |
| 0.15 | 0.4 | 0.45 | 1223 | 1210 | |
| - | 0.4 | 0.6 | 1167 | 1176 | |
| 0.45 | 0.55 | - | 1141 | 1146 | |
| 0.3 | 0.55 | 0.15 | 1132 | 1112 | |
| 0.15 | 0.55 | 0.3 | 1095 | 1079 | |
| - | 0.55 | 0.45 | 1058 | 1045 | |
| 1 | - | - | 1749 | 1749 | |
| - | 1 | - | 652 | 652 | |
| - | - | 1 | 1526 | 1526 | |
| Mixture Type | Equation | |
|---|---|---|
| Gravel–glass–rubber | (4) | |
| Gravel–glass (RB = 0) | (4a) | |
| Gravel–rubber (GL = 0) | (4b) | |
| Glass–rubber (GR = 0) | (4c) |
| Mixture | Experimental Data ϕsec(peak) (°) at σn′ | Mohr–Coulomb (Equation (5)) | Nonlinear Model (Equation (7)) ϕsec(peak) (°) at σn′ | |||||||
|---|---|---|---|---|---|---|---|---|---|---|
| (c′ = ca′) | (c′ = 0) | |||||||||
| RB | GL | 30 kPa | 60 kPa | 100 kPa | ϕpeak (°) | ca′ (kPa) | ϕpeak (°) | 30 kPa | 60 kPa | 100 kPa |
| 0.4 | 0 | 48.2 | 39.5 | 36.9 | 30.8 | 14.9 | 38.4 | 47.5 | 40.9 | 36.1 |
| 0.4 | 0.15 | 45.0 | 40.3 | 33.1 | 26.3 | 17.4 | 35.8 | 45.7 | 38.8 | 33.9 |
| 0.4 | 0.3 | 45.8 | 37.1 | 33.6 | 27.0 | 15.3 | 35.4 | 45.4 | 38.1 | 33.0 |
| 0.4 | 0.45 | 41.8 | 39.6 | 34.9 | 31.2 | 10.3 | 36.6 | 42.3 | 38.4 | 35.6 |
| 0.4 | 0.6 | 40.5 | 37.9 | 33.8 | 30.4 | 9.3 | 35.3 | 40.8 | 37.0 | 34.3 |
| 0.55 | 0 | 44.0 | 39.2 | 34.3 | 29.0 | 13.6 | 36.2 | 44.3 | 38.6 | 34.6 |
| 0.55 | 0.15 | 40.3 | 36.8 | 33.8 | 30.6 | 8.3 | 35.0 | 40.4 | 36.6 | 33.9 |
| 0.55 | 0.3 | 41.2 | 33.5 | 32.3 | 28.0 | 9.4 | 33.2 | 40.5 | 35.1 | 31.4 |
| 0.55 | 0.45 | 40.3 | 34.1 | 29.9 | 24.5 | 12.3 | 31.7 | 40.3 | 34.1 | 29.9 |
| Mixture | Model parameters | Duncan Nonlinear Model [56] | ||||||||
| ϕsec(peak) (°) at σn′ | ||||||||||
| RB | GL | ϕ0 (°) | Δϕ (°) | 30 kPa | 60 kPa | 100 kPa | ||||
| 0.4 | 0 | 35.9 | −9.6 | 47.6 | 40.9 | 36.0 | ||||
| 0.4 | 0.15 | 33.8 | −9.7 | 45.5 | 38.8 | 34.1 | ||||
| 0.4 | 0.3 | 32.8 | −10.3 | 45.3 | 38.2 | 32.9 | ||||
| 0.4 | 0.45 | 35.5 | −5.6 | 42.3 | 38.4 | 35.6 | ||||
| 0.4 | 0.6 | 34.0 | −5.5 | 40.7 | 36.9 | 34.1 | ||||
| 0.55 | 0 | 34.5 | −8.0 | 44.2 | 38.7 | 34.6 | ||||
| 0.55 | 0.15 | 33.8 | −5.4 | 40.4 | 36.6 | 33.9 | ||||
| 0.55 | 0.3 | 31.2 | −7.6 | 40.4 | 35.2 | 31.3 | ||||
| 0.55 | 0.45 | 29.7 | −8.7 | 40.3 | 34.3 | 29.8 | ||||
| Symbol | Behavioral Type | Remarks |
|---|---|---|
| S | Soft | RB ≥ 0.6; rubber-like materials, the load-transfer mechanism is due primarily to the interaction between soft rubber inclusions |
| G | Stiff | RB < 0.3 and GL < 0.3; gravel-like materials, the load-transfer mechanism is due mainly to the interaction between stiff gravel grains |
| C | Crushable | RB < 0.3 and GR < 0.3; glass-like materials, the load-transfer mechanism is due mostly to the interaction between crushable glass particles |
| GC | Stiff–crushable | RB < 0.3, GL ≥ 0.3 and GR ≥ 0.3; intermediate materials, the load-transfer mechanism is primarily shared between gravel grains and glass particles; rubber inclusions are mostly inactive |
| GS | Stiff–soft | 0.3 ≤ RB < 0.6 and GR > 0.4; intermediate materials, the load-transfer mechanism is principally shared between gravel grains and rubber inclusions; glass particles are mostly inactive |
| SC | Soft–crushable | 0.3 ≤ RB < 0.6 and GL > 0.4; intermediate materials, the load-transfer mechanism is mainly shared between glass particles and rubber inclusions; gravel grains are mostly inactive |
| GSC | Stiff–soft–crushable | 0.3 ≤ RB < 0.6, GL ≤ 0.4 and GR ≤ 0.4; intermediate materials, gravel grains, glass particles, and rubber inclusions actively and jointly contribute to the load-transfer mechanism |
Disclaimer/Publisher’s Note: The statements, opinions and data contained in all publications are solely those of the individual author(s) and contributor(s) and not of MDPI and/or the editor(s). MDPI and/or the editor(s) disclaim responsibility for any injury to people or property resulting from any ideas, methods, instructions or products referred to in the content. |
© 2025 by the authors. Licensee MDPI, Basel, Switzerland. This article is an open access article distributed under the terms and conditions of the Creative Commons Attribution (CC BY) license (https://creativecommons.org/licenses/by/4.0/).
Share and Cite
Chiaro, G.; Murali, A.; Rees, S. Compaction Characteristics and Mechanical Response of Gravel–Glass–Rubber Mixtures. Appl. Sci. 2025, 15, 6289. https://doi.org/10.3390/app15116289
Chiaro G, Murali A, Rees S. Compaction Characteristics and Mechanical Response of Gravel–Glass–Rubber Mixtures. Applied Sciences. 2025; 15(11):6289. https://doi.org/10.3390/app15116289
Chicago/Turabian StyleChiaro, Gabriele, Arjun Murali, and Sean Rees. 2025. "Compaction Characteristics and Mechanical Response of Gravel–Glass–Rubber Mixtures" Applied Sciences 15, no. 11: 6289. https://doi.org/10.3390/app15116289
APA StyleChiaro, G., Murali, A., & Rees, S. (2025). Compaction Characteristics and Mechanical Response of Gravel–Glass–Rubber Mixtures. Applied Sciences, 15(11), 6289. https://doi.org/10.3390/app15116289