1. Introduction
Trap-based adult monitoring has been proven to be an essential part of managing fruit fly pests [
1]. The olive fly,
Bactrocera oleae (Rossi) (Diptera: Tephritidae), is a key pest of olive groves in the Mediterranean and other areas in the world where the plant is cultivated [
2]. The olive sector represents a major socio-economic pillar in many Mediterranean countries, where fruit damage by
B. oleae can severely impact both yield and oil quality [
3]. Larvae attack the fruit mesocarp, causing significant quantitative and qualitative losses of the product with resultant consistent economic damages [
4,
5]. However, pest monitoring systems allow for the detection of early population increases, the implementation of appropriate and accurate management methods and ultimately the reduction of chemical inputs, while retaining beneficial species [
6,
7]. As a result, integrated pest management programmes always place a high priority on improving monitoring systems’ accuracy.
Trapping devices of various designs have been constructed and used so far to monitor adult olive flies. Attractive stimuli of various kinds have been used to make traps more efficient, for example, using a yellow colour, sexual pheromones or food attractants such as hydrolysed protein baits and different ammonium salts [
8]. Traditionally, human operators regularly inspect trap grids and collect data on catches across the specified control area. The purpose is to obtain information like female maturity and sex ratio and the presence of adult flies and their trend in the field [
9]. Trap captures may feed various Decision Support System (DSS) software models to forecast population dynamics or to make the right management decisions [
10,
11,
12,
13]. However, monitoring traps provide a relative sample measure that is frequently not correlated to fruit damage [
14]. In fact, traps only intercept the portion of the population that responds to attractive stimuli, influenced by factors related to the target pest biological status, the trapping system employed, and the climatic conditions that can act on both the attractant release or the activity of the flies [
15,
16].
In extensive and cost-efficient sampling plans, the suggested trap density is usually 2–3 traps/ha [
9,
17], but it is still not entirely clear whether the given density is sufficient to have a reliable representation of flies in the olive grove and how the portion of the non-trapped population distributes in the field. Addressing this knowledge gap is crucial to adjust sampling strategies and strengthen the accuracy of decision support tools. In addition, testing these parameters using baited yellow panels will offer an additional benefit since, due to their advantages, they are used in e-traps [
18], and any knowledge gathered on their potential to provide a realistic representation of the pest population in the field would be highly valuable for their integration in e-monitoring and decision-making systems.
The aim of the present work is to answer the following questions: How substantial is the population not collected by the monitoring trap network in the field? Does the suggested trap density give a reliable representation of the population in the field? How does population density affect the distribution of B. oleae in the olive grove? Do males and females follow the same distribution pattern in the olive grove?
In order to investigate these questions, an experiment was planned, consisting of arranging a high-density network of unbaited sticky panels between monitoring baited traps deployed at the standard density of 2 traps/ha. The field tests were conducted across five orchards, each one representing a participating country in the experiment: Greece, Italy, Lebanon, Spain and Tunisia. The spatially explicit data were further analysed using SADIE analysis to measure the index of aggregation and the spatial association.
2. Materials and Methods
2.1. Experimental Sites
The experiments were carried out in five countries: Greece, Italy, Lebanon, Spain and Tunisia.
In Greece, the experimental site was in Arkadiko (239 m a.s.l.), Argolis region. The experimental plot was included in an olive grove of 30 ha with cv Manaki. The trees were about 30/40 years old, 3 m high with a crown size of about 4 m; they were spherically trained, with a planting pattern of 5 × 5 m. There was drip irrigation and no tillage, with a rotary cutting of weeds.
In Italy, the experimental site was in Larino (270 m a.s.l.), Molise region. The experimental plot was included in an organic olive grove of 17.5 ha with cv Gentile di Larino. The trees were about 25/30 years old, 5/7 m high with a crown size of about 4 m; they were monocone trained, with a planting pattern of 6 × 6 and 6 × 5 m. There was no tillage, with a rotary cutting of weeds.
In Lebanon, the experimental site was in Hasbaya (550 to 595 m a.s.l., with a slight slope), Al Sahl region. The experimental plot was included in the non-irrigated olives grove Baladi Cultivar of 28 ha. The trees were between 40 and 70 years old, 4/7 m in height, with a 4 × 4 m to 7 × 7.5 m tree canopy diameter. Most of the trees had a spreading growth habit. Chemical fertilisers were manually distributed around the trees. The land was ploughed.
In Spain, the experimental site was in Alcolea (128 m a.s.l), Cordoba. The experimental plot was included in a 40 ha grove of the Picual variety. The trees were about 25–30 years old and 4–6 m high and had a crown diameter of 5–10 m, with a planting frame of 8 × 5 m, giving a density of 250 trees per hectare. The trees had an open canopy formation. The farm used a no-tillage system; herbicides were used twice a year, once in spring and once in autumn before harvest.
In Tunisia, the experiment was conducted at the site Taoues (300 m a.s.l.), belonging to the Olive Tree Institute, located 26 km away from the city of Sfax. The olive trees, of the variety Chemlali, were >80 years old, and included in an olive grove of 13 ha, with a planting frame of 24 × 24 m. The olive trees were rain-fed, with a height of 4–5 m, a foliage volume of 60 m3 or more, and a drooping shape. The plot was ploughed 5 times/year and fertilised with ammonium once a year.
2.2. Experimental Design
A regular grid of traps was established in a rectangular plot of approx. 2 ha within a larger orchard groove. The grid was composed of baited traps (BTs) positioned at a density of 2 traps per ha, placed singly at the corner of each plot and in its middle. Unbaited traps (UTs) were deployed at approx. 15-fold higher density dispersed among BTs. The distance between two UTs was maintained at about 20 m, and the distance between the UTs and BTs was maintained at above 25–30 m.
The exact position and number of traps in each country are indicative, as they were dependent on the position and distance of the trees in the groove and therefore each had a different shape of experimental plot and number of traps. As a result, 8 BTs (9 in Greece) and a number between 36 and 50 UTs, depending on the country, were deployed (
Figure 1). To calculate the above-mentioned density of traps in the plot area, the final number of deployed traps was attained, considering the area covered by traps positioned on the corner, along the side or inside the plot were counted as ¼, ½ and 1, respectively. In Tunisia, due to the large distances between olive trees, the total area covered by traps was 3.88 ha.
2.3. Samplings
In all experimental sites, yellow sticky panels that were locally available were used for olive fly trapping. They were provided by Novagrica Biological Products and Solutions (Agios Paraskevi, Greece) for Greece, FASMI (Cercemaggiore, Italy) for Italy, Russell IPM (Deeside, UK) for Lebanon, Econex (Valencia, Spain) for Spain; in case of Tunisia panels were assembled using plastic panels (Société Ben Jdidia Frères, Sfax, Tunisia) and raticol glue (Zapi spa, Conselve, Italy). The size of the panel used was 14 × 20 cm. The panels were deployed either baited with solid ammonium carbonate (BT) in vials or without any attractant substance (UT). Ammonium carbonate was provided by Novagrica Biological Products and Solutions (Agios Paraskevi, Greece), Novapher (Settimo Milanese, Italy) for Italy, ThermoFisher Scientific (Waltham, MA, USA) for Lebanon, VWR Chemicals (Radnor, PA, USA) for Spain, Sigma-Aldrich (Saint Louis, MO, USA) for Tunisia. In UT case, only visual cues acted in attracting flies, shortening the range of attractivity and minimising the interferences between traps as much as possible, even if the UTs formed a denser grid around the BTs. All traps were placed in the same way, i.e., at 1.8–2 m high, to the south part of the tree canopy. Males and females of the fly were counted and a survey of traps was performed at regular intervals every 4–7 days depending on the country. Dispensers were replaced once per month.
Traps were deployed in the mid-summer–autumn period, when drupes on the trees are susceptible to female oviposition and monitoring traps are usually deployed in the field; however, this was not the case for Tunisia, where the timing of the trap deployment was anticipated because of the very few olive flies usually trapped in summer–autumn.
In addition, fruit load and active fruit infestation were sampled in the trees where the traps (either BT or UT) were placed. For fruit damage, 25 fruits per tree were checked at different intervals in the same period that the traps were in the field.
2.4. Data Analysis
Based on the data collected, the number of adults (males and females) captured per trap per day and the proportion of average BT over UT catches per trap were calculated per each date and site. ANOVA was performed to assess the influence of the device (baited or not), sex, country and interactions on the captured individuals per trap.
The correlation between BT and UT captures per sampling date was calculated at each site and with combined data, using the Pearson coefficient to examine whether the temporal variation in catches in the two types of traps followed a similar trend. The coefficient r, number of observations (N) and p values are reported in the results, where N refers to the single dates of trap checking. Correlations were considered strong, moderate or weak for p values corresponding to ≤0.0001, ≤0.001 and ≤0.05, respectively.
Statistical analyses were conducted using SPSS Statistics version 26.
The characterisation of the spatial distribution was carried out with SADIE (Spatial Analysis by Distance Indices) software (SADIE Shell Version 2.0). This software is specifically designed for analysing counts of individuals at known locations [
19]. The technique seeks to identify areas of clustering of two forms—patch and gap clusters—and quantify the spatial pattern in a sampled population by measuring the total effort of individuals in the observed sample to move to extreme arrangements such as uniform patterns [
20]. The degree of non-randomness within a set of data is quantified by comparing the observed spatial pattern with rearrangements in which counts are redistributed among the units by permutation, which is called distance to regularity, from which an index of aggregation was obtained:
where D is the value of the distance to regularity for the observed data;
Ea = the mean distance to regularity over the randomisations [
21]. Values of
Ia < 1 indicate regularity; values > 1 indicate aggregation. A specific test, with the null hypothesis of a spatially random distribution of counts, was also completed.
Ia was calculated for each sampling date and the whole sampling period for the catches of adults, males and females.
A stepwise regression procedure in determining relationships between Ia and field catches was used to select the variables with slopes different from zero (p < 0.05). Variables included in the analysis were the captures obtained from all traps, both baited and unbaited, expressed as a mean number of individuals per trap per day, and the proportion of baited over unbaited trap catches. Counting data were log-transformed prior to the analysis. Data coming from different countries were analysed together. This analysis was conducted using SPSS software version 26.
The SADIE methodology carried out by using the software SADIE N_AShell Version 1.0 was used to measure the spatial association (χ
k) between two counts of data by overlaying the cluster maps of the male and female distributions that were previously calculated [
20]. The positive value of χ
k arises from coincidences of patches or of gaps in both populations, whereas negative values emerge from opposite cluster types. An overall index of spatial association (Χ) is calculated as the mean of local values. The significance of Χ was tested by randomisations [
22]. The association index was obtained for each sampling date and the whole sampling period to compare the distributions of male and female
B. oleae.
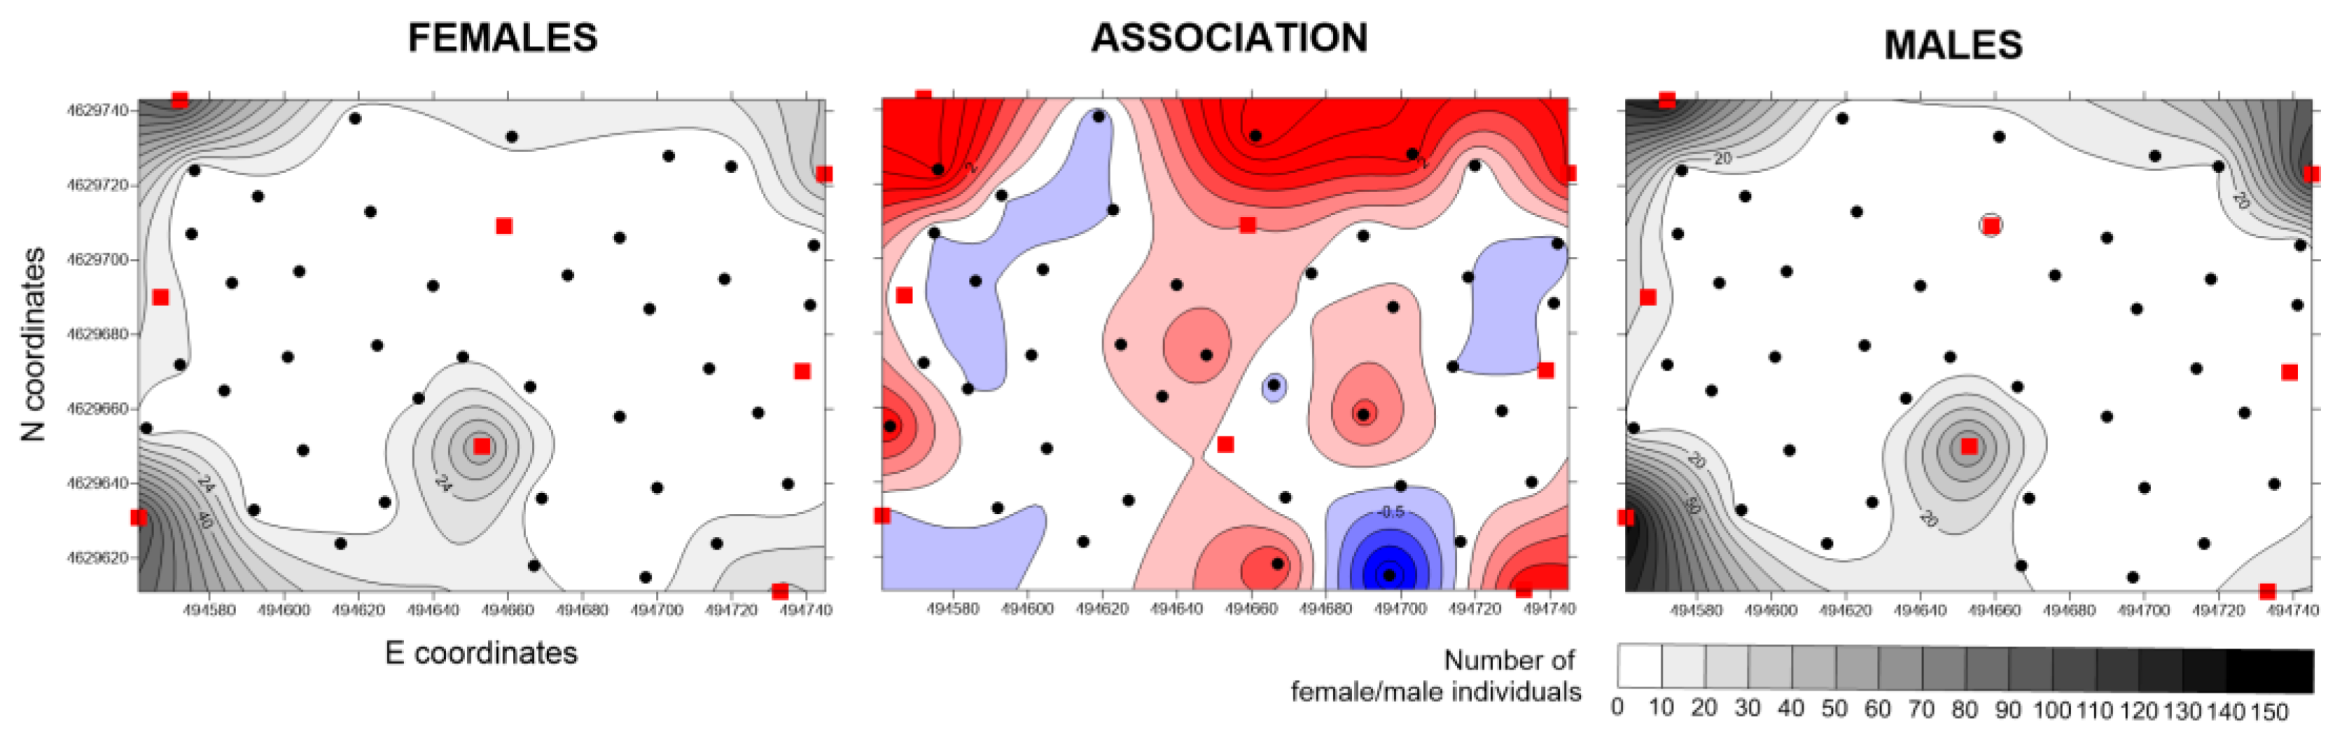
Spatial distribution data and spatial association indices were contoured and mapped with Surfer version 12 (Golden Software, Golden, CO, USA) by using default settings of the software. In the maps, the positive local association (reported in red) highlights areas where both females and males occupy (coincidences of patches) or do not occupy (coincidences of gaps) the same cluster type, while the negative local association (reported in blue) highlights areas with opposite cluster types.
3. Results
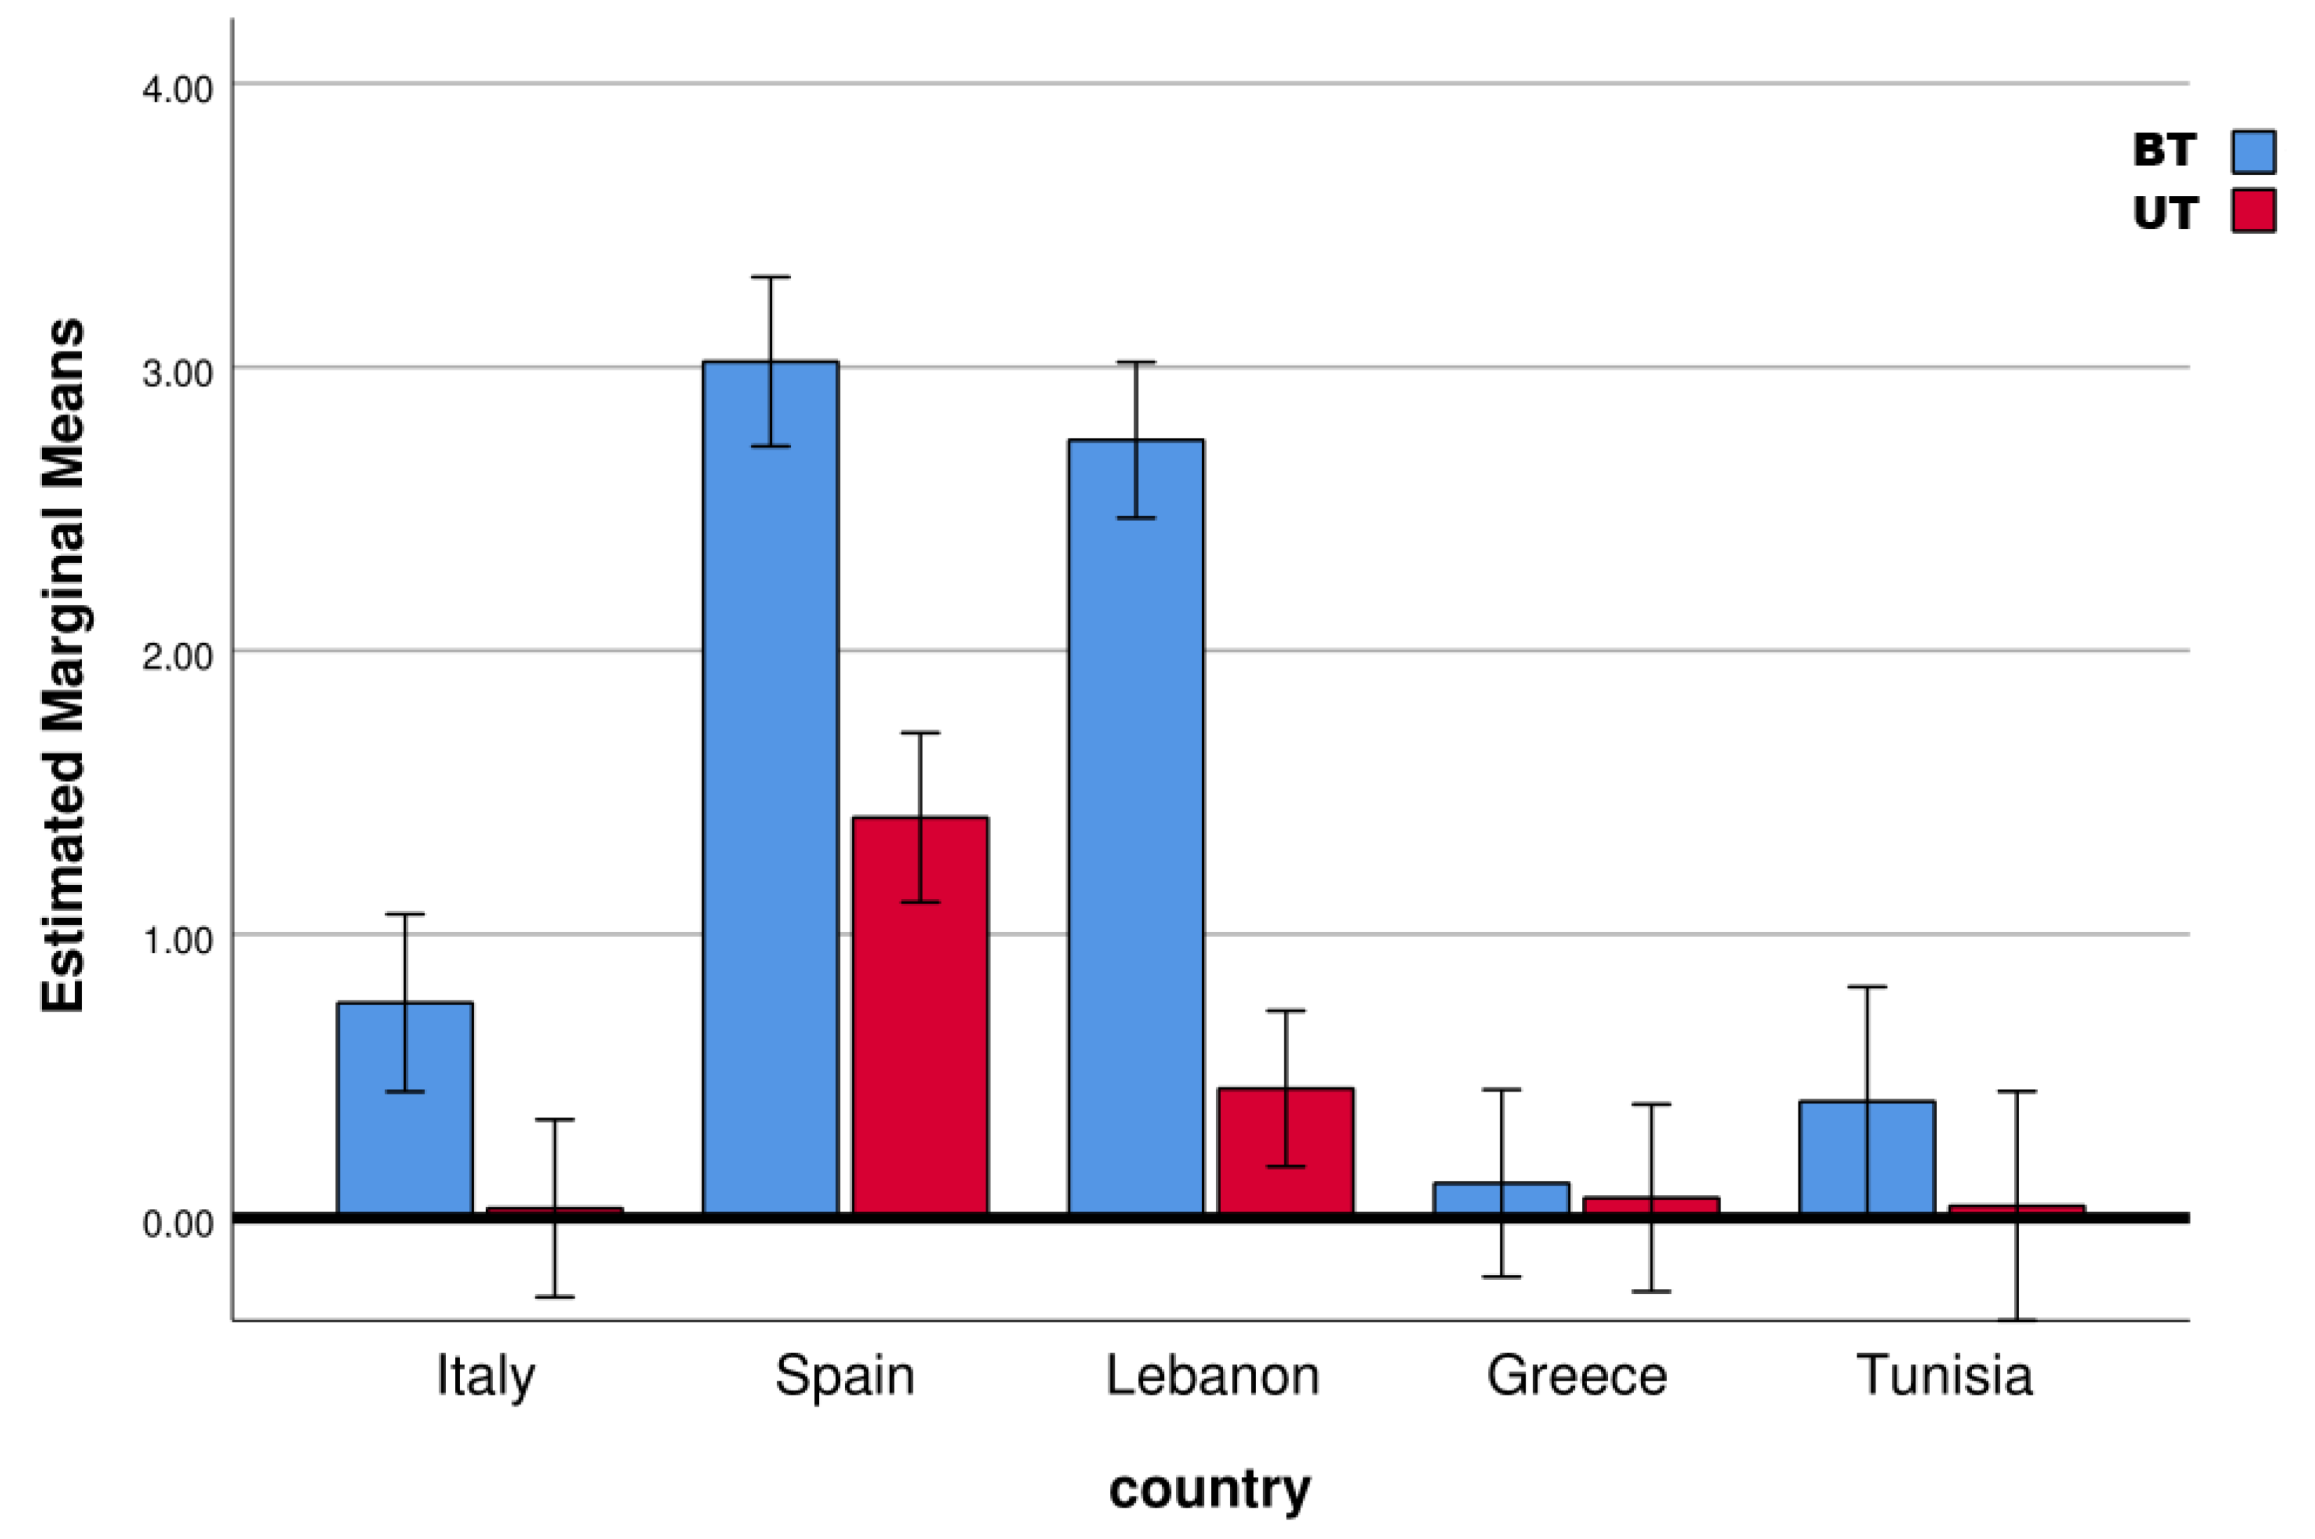
The results from the field experiments showed different capture levels in the different countries. The highest catches were in Spain, with a mean of 5.84 adults per trap per day, followed by Lebanon, Italy, Tunisia and Greece with 5.46, 1.10, 0.57 and 0.02 adults per trap per day, respectively. The proportion of BT over UT catches changed markedly in the different countries: BTs represented 82% of catches in Italy, 61% in Tunisia, 57% in Lebanon, 28% in Spain and 27% in Greece. A prevalence of male captures was observed in all cases, ranging from 72% of males in Tunisia to 69% in Spain, 58% in Italy, 56% in Lebanon and 55% in Greece. ANOVA was significant for device (F = 23.74; df = 1; sig < 0.0001), sex (F = 6.14; df = 1; sig = 0.014) and country (F = 18.06; df = 4; sig < 0.0001). Among the interactions, the only significant interaction was between device and country (F = 4.52; df = 4; sig = 0.002). In particular, in Italy, Spain and Lebanon, captures per trap were significantly higher in BTs than in UTs (
Figure 2).
The temporal dynamic showed great differences in captures for different sampling dates, with intermediate catch peaks in the cases of Italy (maximum on 7 October), Spain (maximum on 26 October) and Tunisia (peak on the 19 June); there was a decreasing temporal trend in Greece, with the highest catches on 13 October, and a slight increasing temporal trend in Lebanon, with the highest catches on 14 November (
Figure 2).
The temporal trend of catches in the two sexes was similar in most cases, with some divergences when considering the different typologies of the traps (BT or UT), such as in the case of Greece and Tunisia (
Figure 3).
The Pearson coefficient calculated for all sites together showed that BT and UT captures per sampling date were found to be highly correlated for adults, males and females, indicating that the temporal variation in the two types of traps followed the same trend (
Table 1).
Elaborating on the data for single countries, the following results were obtained (
Table 1). For adults, BT and UT captures per sampling date were found to be highly correlated for Lebanon, moderately correlated for Spain and not significant for Greece, Italy and Tunisia. For females, BT and UT captures per sampling date were found to be highly correlated for Lebanon, weakly correlated for Spain and not significant for Greece, Italy and Tunisia. For males, BT and UT captures per sampling date were found to be highly correlated for Lebanon, moderately correlated for Spain and Greece and not significant for Italy and Tunisia.
The index of aggregation
Ia calculated in the different countries for adult, male and female counts showed in most cases no significant values (
Table 2).
In the stepwise regression carried out with adult data, only BT catches, among the considered variables, were included (F = 7.33; df = 1,47;
p = 0.009), with a low R
2 = 0.135. The relationship is inverse, i.e., when catches increase,
Ia values decrease (
Figure 4). For male and female catches, regression did not select any significant variable.
The index Χ of the spatial association of male and female distribution was statistically significant in most cases (
Table 3). In Spain and Tunisia, Χ was significant for all sampling weeks; in Italy in all but 1 week; in Lebanon, 3 weeks were not significant; in Greece, 4 weeks out of 9 were significant.
Maps of total catches showed, in general, a prevalence of positive spatial association among male and female distributions.
In Greece, with low population levels, the highest hot spot, coinciding for males and females, corresponded to UTs. The areas of positive association are widespread but did not include BTs. Negative associations were observed that also included two BTs (
Figure 5).
In the case of Italy, male and female distributions overlapped in most of the experimental plot, with extended areas of positive association (
Figure 6). Hot spots in both sexes were limited to BT traps. Negative association was observed mostly in low-density areas.
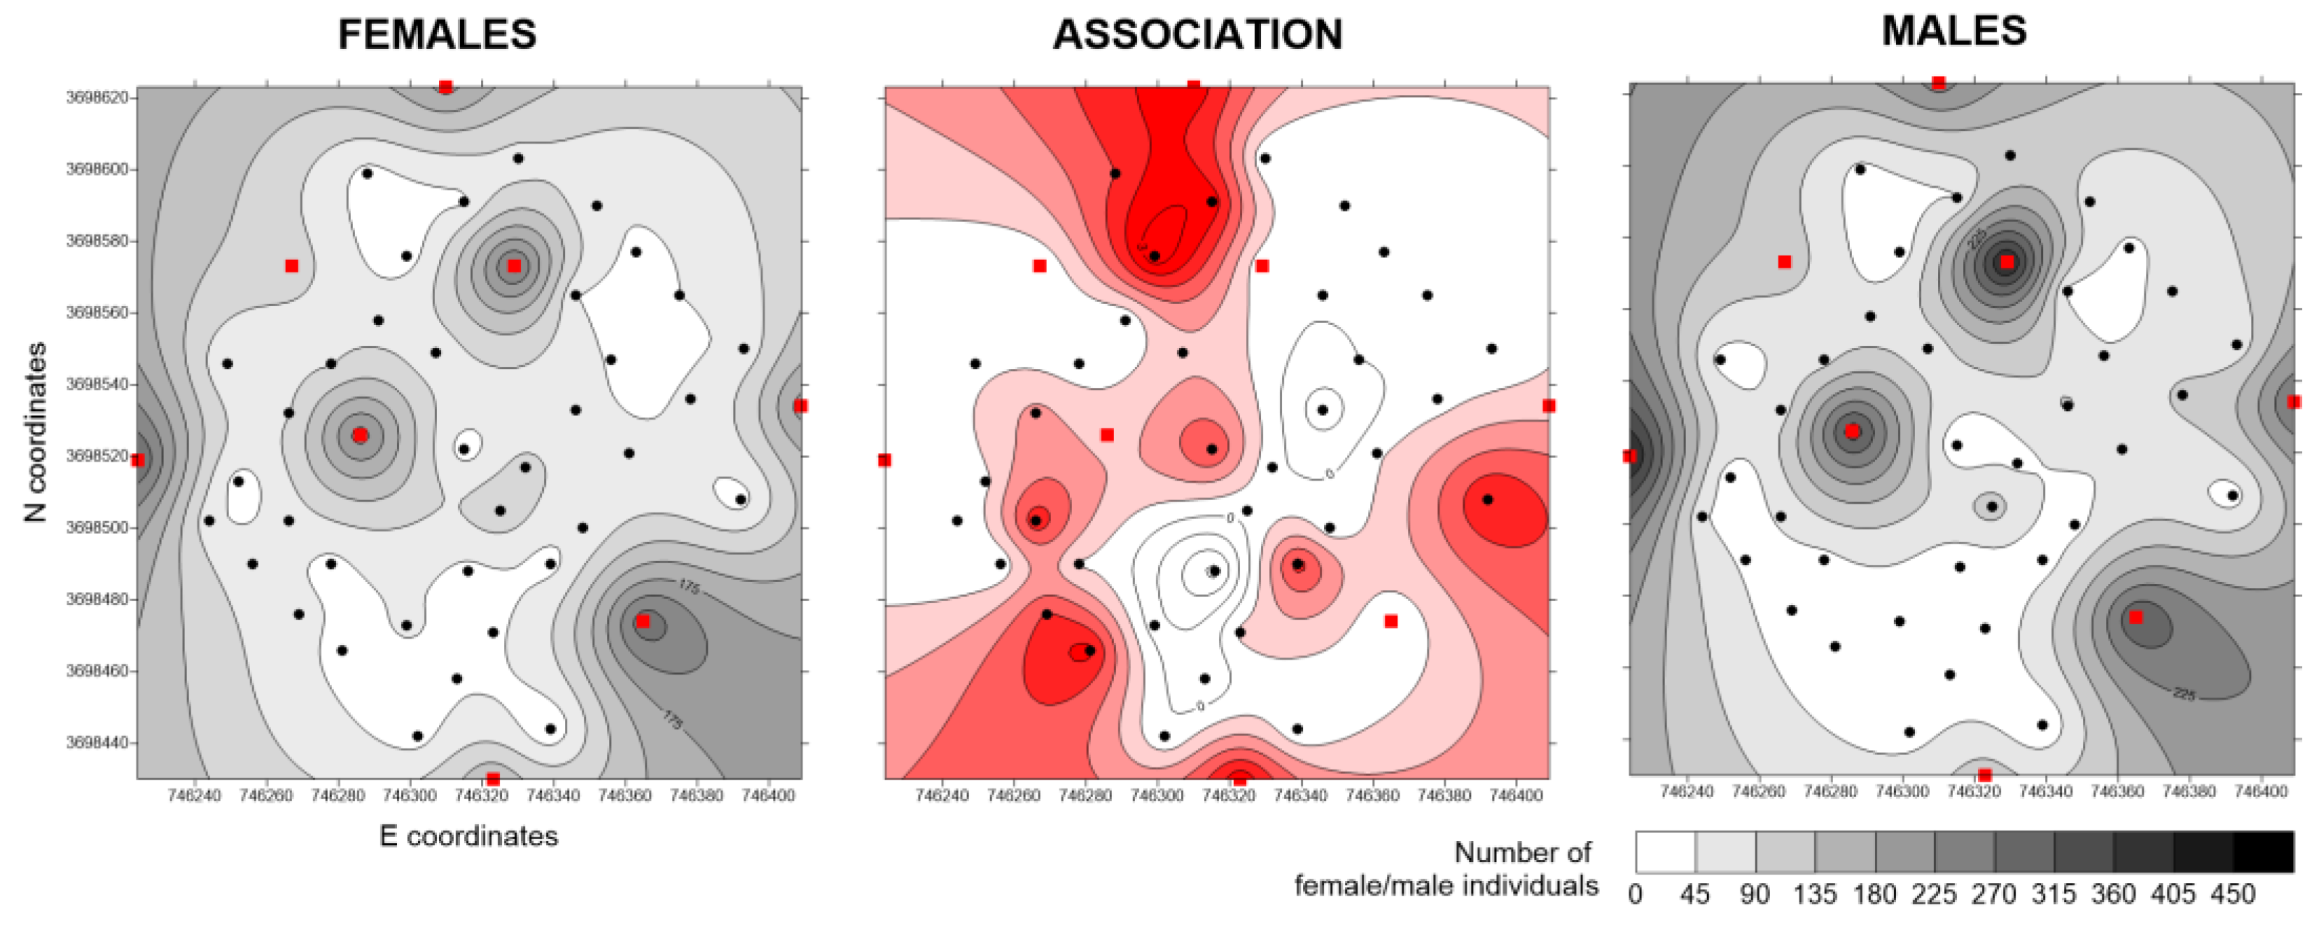
In Lebanon and Spain, population levels were high, with some male hot spots reaching 450 trapped individuals. In Lebanon, female and male distributions were strictly associated and each BT corresponded to a hot spot. No negative association was observed (
Figure 7).
In Spain, the areas with the highest concentrations of both sexes generally overlapped with the locations of baited traps (BTs), confirming their effectiveness as attraction hot spots in the field. However, in some peripheral regions, negative associations were observed in low-density areas, which may indicate a degree of spatial segregation between males and females under conditions of low population presence (
Figure 8).
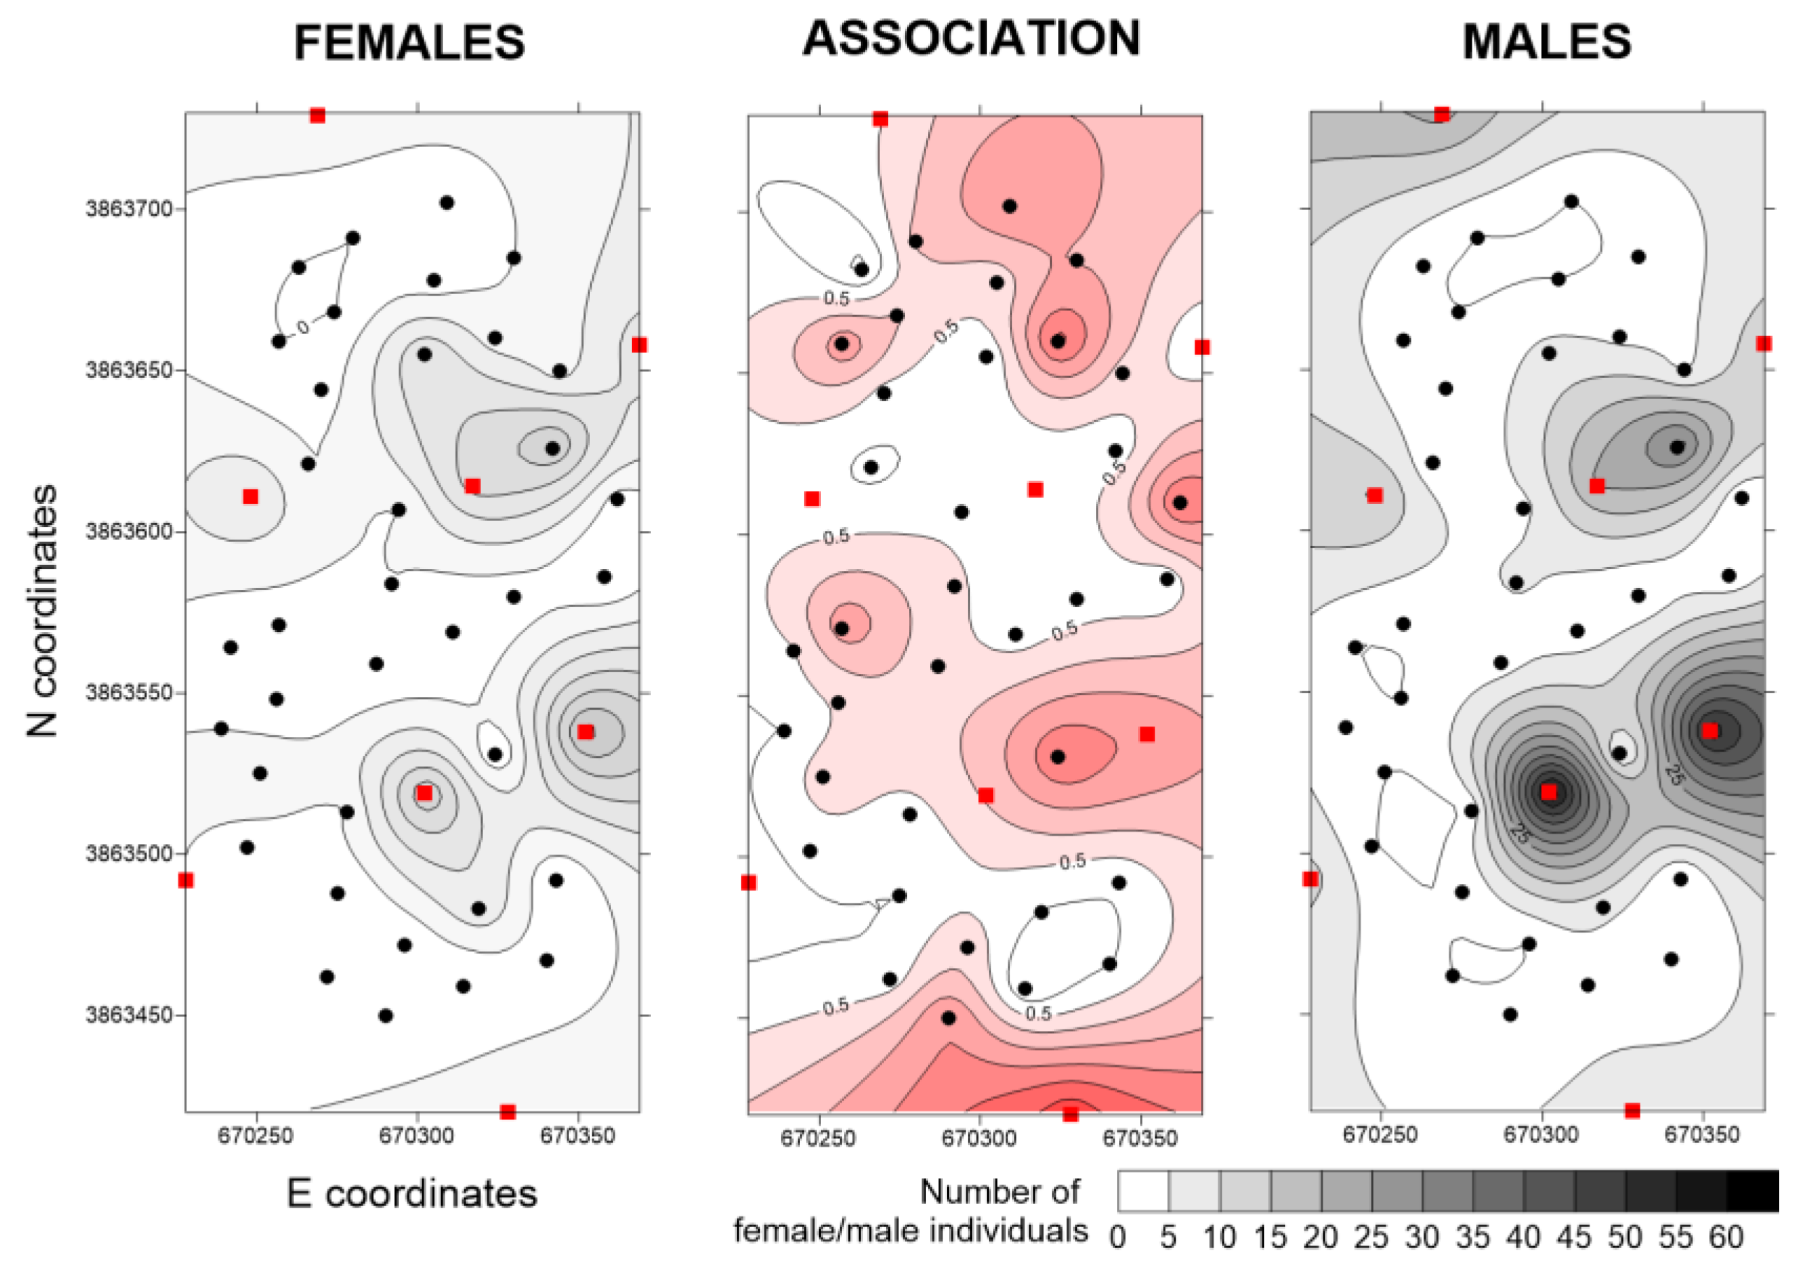
In Tunisia, the hot spots of the two sexes’ distribution overlapped, being located in both BTs and UTs. Areas of positive spatial association were greatly extended, whereas no negative association was observed (
Figure 9).
The fruit damages carried out at later times showed in all cases a progressive increase, except in Tunisia, where in the last two samplings, it was not detected. Spain showed the highest level of infestation, with an increase from 2.2% to 28.3% at the first and last sampling, respectively. In Lebanon, the infestation level increased from 1.3% in the August sampling to 6.7% in the November sampling. In Greece, Italy and Tunisia, the active infestation was lower, with values always below 2% (
Table 4). Fruit load was at the lowest level in Spain and Greece, whereas it was around 60% at the other sites (
Table 4).
4. Discussion
Our experiment was designed to highlight what happens to the part of the population that is not caught by the baited traps that are set according to the indications provided for routinely monitoring activity. We focused our experiment on the critical period of the year when infestation can be a disaster for olive production and wet traps with trophic attractants, such as McPhail traps, are shown to be less efficient in the monitoring of flies [
15]. Some differences among countries are related to the length of the period covered by the experiment, spanning from 40 days in Greece and Tunisia to 90 days in Lebanon, and are mainly related to the different levels of the sampled population, which influenced the presence of adults in the field at different periods of time.
The yellow sticky panels, which we used in our experiment, have been previously employed as monitoring traps in several countries [
11,
23,
24] and as smart devices [
18,
25]. When activated with ammonium carbonate, they provided similar catch levels that were found in recent comparison tests with McPhail traps, which have long been considered the reference trap for
B. oleae [
26]; however, when not activated, the performance was significantly worse than McPhail traps [
15] due to short-range attraction.
Yellow sticky panels have been selected in our experiment because they can be used with or without an attractant substance. In this second case (UT), only visual cues acted in attracting flies, shortening the range of attractivity by sampling flies almost only to the tree they are applied to [
27], making it possible to deploy a denser grid of UTs in between BTs. From this point of view, although the density of UTs was high, interference was minimal, because we respected a distance of at least 20 m. In addition, visual traps are not affected by temperature and humidity and attract both sexes, resulting in a more accurate sampling of the host tree population [
27].
In our experiment, the few BTs that were used turned out to be aggregation hot spots in the maps, as was to be expected, considering the greater attractivity of BTs compared to UTs.
Our results clearly showed that BT and UT adult and female captures per sampling date were found to be correlated for Spain and Lebanon but not in the cases of Greece, Italy and Tunisia. These consistent results indicate that when the population has been established and new adults emerge within the grove due to the larval population, such as in Spain and Lebanon, then more similar numbers in BTs and UTs are recorded; however, without damage, i.e., in Italy, Greece or Tunisia, the adults that enter the grove or are flying in the grove are actively looking for food and may be more attracted to the BTs. So, the records of the baited traps may not provide an estimation of the population changes in the field during the period where there is no fruit damage, but they provide a good estimation of the field population changes in the period where there is increased damage. This is also observable from the great difference in the September peak in Spain (first phase, almost no damage) and the high similarity in October, likely due to a generation completion (established phase). In a previous work, Varikou et al. [
15], comparing captures in McPhail traps with flies sampled from a canopy of olive trees, reported that catches in traps were correlated with flies dropped from the tree canopy in July–August, but no relationship was found in September, when a significant drop of the population levels was recorded. Damage levels could be influenced also by the olive cultivar’s susceptibility to
B. oleae [
28]. In our case, the cultivar groups in different countries were different and can represent an additional source of variability that we did not consider. Therefore, we must consider our comparisons across different sites with caution because the different cultivar’s susceptibilities could influence the proposed dynamics from a quantitative point of view, particularly the number of adults that enter the grove to actively look for food and the amount of fruit damage.
In general, catches in traps can be influenced by factors dependent on the type of attractant device used or on environmental factors such as humidity and temperature, which affect the evaporation of attractants. Furthermore, only some of the individuals respond to the attractive stimuli, depending on the physiological stage of the individual and the phenological phase of the plant. For example, McPhail traps baited with protein hydrolysate lures tend to overestimate early season olive fruit fly populations and the proportion of gravid females present [
14]. In our experiments, it was also observed that BTs clearly overestimate pest numbers in the field not only in the early season but also in periods without an established population. Therefore, trap catches in these periods should be considered with caution in decision-making processes.
It was reported that male flies are not very attracted to traps baited with pheromones during spring and early summer, when olives are not hostable [
29]. However, at the time we ran the experiments, mainly in summer and autumn, male and female distributions were almost always spatially associated, except in situations of very low catches with random spatial patterns and when the male and female temporal dynamics were very similar within the same category of trap. In the Tunisia case, when the survey was anticipated to take place in June–July, males responded much better to BTs than UTs, suggesting that the type of device and attractant used are not exposed to seasonal variations in attractiveness.
Although monitoring with traps is considered fundamental and can provide useful indications, it is affected by various limitations that suggest that the data collected in the field should always be evaluated with caution. Furthermore, while traps offer valuable insights into population presence, establishing a direct correlation between trap catches and pest population levels in olive groves remains challenging. According to our results, this correlation was found to be significant only when fruit damage occurred, whereas BT catches overestimate the population levels in the other cases. This result indicates that the interpretation of the trap data may be less valuable in summer or other periods without established populations. Therefore, economic thresholds that combine adult captures with estimates of active infestation may yield better results than taking either aspect individually. Taking this into account in the efforts to obtain more accurate predictions of both the field population level and the severity of damage would enhance the reliability of damage forecasts and support timely decision-making [
13].
The ability to more accurately depict population dynamics in the field through monitoring, one of the pillars of integrated pest management (IPM), would allow for improved pest management, optimised intervention thresholds and a reduced reliance on chemical treatments [
30]. The obtained field data suggested that BTs at a density of 2/ha provide a realistic estimate of the population in the field in the cases of established populations. However, in the periods without population establishment, it is likely that a denser monitoring trap network would be required to obtain a reliable estimation of the field population. In this case, the need to combine a trap survey with a fruit infestation assessment is also made clear. Consequently, setting economic thresholds based only on adult catches may give rise to reliability problems; however, considering population establishment as an additional factor in interpreting trap catches may increase accuracy in estimating the part of the population that is not caught by the traps.


 ,
, 


