Article

Preparation of Nitrogen-Rich Tar by Co-Pyrolysis and Analysis of Nitrogen-Containing Compounds in Pyrolysis Products

1
College of Chemistry and Chemical Engineering, Xi’an University of Science and Technology, Xi’an 710054, China
2
Changqing Industrial Group Co., Ltd., Xi’an 710016, China
3
College of Safety and Engineering, Xi’an University of Science and Technology, Xi’an 710054, China
*
Author to whom correspondence should be addressed.
These authors contributed equally to this work.
Appl. Sci. 2025, 15(11), 6284; https://doi.org/10.3390/app15116284
Submission received: 28 April 2025 / Revised: 1 June 2025 / Accepted: 2 June 2025 / Published: 3 June 2025

Abstract

:
In this study, we use coal as a carbon source from Zhangjiamao and doped with different nitrogen sources for co-pyrolysis. Nitrogen-rich tar was successfully prepared, and the content and variety were also increased. From the elemental analysis, the nitrogen content of all the tars was significantly enhanced, among which the nitrogen content of the tars after co-pyrolysis with melamine was enhanced by 5.21%, and the nitrogen content of coke was enhanced by 10.87%. According to the GC/MS results, it was found that the nitrogen compounds in the tar after full pyrolysis were richer and more abundant than those in Py-GC/MS. For the free radical reaction, the reaction process is extremely rapid, and the 15N substitution product after isotope labeling was successfully captured by adding 15NH4Cl for isotope labeling, which can be more intuitively and accurately illustrated from the m/z change. Among them, 26 nitrogen-containing compounds were screened out, which accounted for 66.28% of the content, and they were categorized. It was found that the five-membered nitrogen heterocycles were the most abundant, accounting for 34.88%. In addition, five other nitrogen-containing compounds containing different functional groups and the tar from the co-pyrolysis of tar-rich coal were also analyzed by GC/MS, among which the tar from melamine had the highest content of nitrogen-containing compounds, with 70.48%. Finally, the functional groups of nitrogen-containing compounds were further analyzed by XPS and FTIR, and the results were consistent with those of GC/MS analysis. In this paper, nitrogen-rich tar was prepared by co-pyrolysis of tar-rich coal and nitrogen compounds. This achievement provides a valuable reference for the high-value utilization of coal tar.

1. Introduction

Coal is the second-largest energy source in the world, accounting for more than 60% of China’s energy consumption [1]. Tar-rich coal is recognized as a special coal resource with a tar yield (Tar,d) of 7~12% [2], which is 1–4 times higher than the tar yield of conventional coal. Low-temperature pyrolysis of tar-rich coal is likewise characterized by relatively mild pyrolysis process conditions, low production costs, and a wide range of coal species adaptability as a way of efficient and clean conversion of coal [3]. Coal tar, as one of the products of pyrolysis, has a diverse and complex composition [4,5,6], in which nitrogen heterocyclic compounds have a very important role [7]. Improving the content of nitrogen-containing compounds in tar is one of the effective ways to realize the clean and high-value utilization of coal. Moreover, it is also an important bridgehead for guaranteeing national energy security and realizing an organic dual-carbon strategy [8].
Nitrogen in coal is derived from plant and microbial proteins, and these proteins and their hydrolysis products are converted into different types of nitrogen-containing compounds through a series of chemical reactions [9], which are mainly present as pyridine nitrogen (N-6) [10,11], pyrrole nitrogen (N-5) [12,13], quaternary nitrogen (N-Q), and nitrogen oxide (N-O) [14,15]. For tars produced by co-pyrolysis of coal and nitrogen-rich feedstocks, the yield and variety of nitrogen-containing compounds in the tars can be improved [16]. Chagas [17] also studied the pyrolysis pattern of algae and found that the highest yields of nitrogen compounds were found at 650 °C. In addition, inorganic nitrogenous compounds can also be used as nitrogen-rich raw materials. Ma [18] et al. used low-temperature pyrolysis for nitrogen doping of biomass under an ammonia atmosphere, which resulted in a significant increase in nitrogen content from 0.03% to 7.59%. Xu’s group [19], after pyrolyzing coal under an ammonia atmosphere, found that when the temperature is higher, the conversion of N-5 to N-6 is faster. With the development of quantum chemistry, Wang et al. [20] also simulated the co-pyrolysis of coal with NH3 using reactive force field molecular dynamics (ReaxFF MD), and the experimental results showed that OH and other H-containing groups generated during the pyrolysis of coal have significant synergistic effects, promoting the decomposition and oxidation of NH3. However, the distribution of nitrogen-containing compounds in the nitrogen-rich tar produced by the co-pyrolysis of coal with nitrogen-containing compounds has rarely been reported.
The GC/MS analyzer combines the separation capability of chromatography with the qualitative strengths of mass spectrometry to characterize multi-component mixtures in a relatively short period of time [21,22,23]. The combination of pyrolysis technology with GC/MS takes advantage of strong specificity, low sample usage [21], fast analysis speed, high sensitivity, and information density, which enables accurate qualitative and quantitative analysis of the products. Wu [24] et al. used GC/MS to analyze the alkaline fractions in low-temperature coal tar and detected 57 nitrogen-containing compounds. However, the integration of the isotope tracer method with GC/MS provides a more precise visualization of the structural transformations of compounds in coal tar, as evidenced by the changes in m/z. Hu et al. used isotopes to demonstrate that a series of activated free radicals promoting the formation of coal tar were generated during the combination of coal pyrolysis and the reforming of methane [25] and ethane [26]. For 15N, Kuroki [27] et al. prepared precursors for N-doped carbon catalysts using 15N-labeled polypyrrole, which suggests that it is feasible to introduce 15N into the pyrolysis process. This allows the labeling of nitrogen-containing compounds in the reaction pathway and provides assistance in the generation of nitrogen-containing products during the co-pyrolysis process [28,29]. For nitrogen-doped tar, not only can it increase the number and variety of nitrogen-containing compounds in the tar, but also promote the high-value utilization of the tar, which will be one of the focuses of this paper.
Since the aim of this paper is to prepare nitrogen-rich tar, tar-rich coal with high tar yield was selected and allowed to be co-pyrolyzed with different types of nitrogen-containing functional group solid compounds. The effects of amino, amide, and nitro groups on nitrogen-containing compounds in nitrogen-rich tar are mainly investigated. Respectively, they are the most common nitrogen-containing compound solid ammonium chloride, the compound melamine with a relatively high nitrogen content, the aromatic compound polyaniline containing an amino group, the polyamide containing an amide group, the amide compound chitin with a number of side-chain structures, and the compound 5-nitrouracil, which contains both nitro and an amide group. Elemental analysis was first used to explore the changes in the nitrogen content of the six nitrogen-rich tar and char samples. In addition, the six resulting types of coal tar were analyzed by GC/MS, and changes in the content of nitrogen-containing compounds were deduced from the mass spectrometry data. In addition, 15NH4Cl and tar-rich coal were co-pyrolyzed, after which the types and contents of nitrogen-containing compounds in nitrogen-rich tar were further analyzed by combining GC/MS with an isotope labeling method. Finally, the distribution of nitrogen in the products was analyzed by X-ray photoelectron spectroscopy (XPS) to verify the accuracy of the above experimental findings.

2. Materials and Methods

2.1. Materials

The tar-rich coals used in this experiment were all extracted from the Zhangjiamao mining area, Shenmu City, Yulin City, Shaanxi Province, China. By calculating the tar produced in the pyrolysis process, it was concluded that the tar yield of this mining area was 10.9%, which was in line with the typical characteristics of tar-rich coal. The above coal samples were crushed and sieved to obtain samples with a particle size of less than 200 mesh. NH4Cl, melamine, chitin, polyaniline and polyamide were purchased from Shanghai McLean Biochemistry and Technology Co., Ltd. (Shanghai, China) with a purity of 99% in all cases, 5-Nitrouracil was purchased from Shanghai Aladdin Biochemical Technology Co., Ltd. (Shanghai, China) with a purity of 97%, and 15NH4Cl was purchased from Qingdao Tenglong Microwave Science and Technology Co., Ltd. (Qingdao, China) with a purity of 98% and an abundance of 99%.

2.2. Pyrolysis Processes

The co-pyrolysis process of coal and nitrogen-containing compounds was pyrolyzed in a small thermal cracking reactor constructed in-house. The quartz tube reactor in the experimental setup had an outer diameter of 10 mm and a free height of 400 mm. Before the experiment, 0.1 g of coal and 0.3 g of NH4Cl or 15NH4Cl were weighed in a stainless steel tube with a cap (70 mm long, 5 mm outer diameter, 4 mm inner diameter). Quartz wool was then placed at each end, the experimental setup was connected, and the heating program was initiated. The pyrolysis system contains a thermocouple built into an electrically heated furnace, and the temperature control system (TCS) monitors and regulates the temperature of the reaction process in real time. The carrier gas (N2) is injected into the reactor at a rate of 20 mL/min, and the flow rate is controlled by a flow meter so that the reactor is always inert and able to pass airflow. The temperatures were set at 300 °C, 400 °C, 500 °C, 600 °C, 700 °C and 800 °C, respectively, for the pyrolysis experiments. When the pyrolysis product slowly flows to the lower part of the quartz tube, the coal tar starts to liquefy due to the lower temperature and the unliquefied coal tar flows into the 1,4-Dioxane at the bottom to collect the product, and then the 1,4-Dioxane is dried and then tested afterward, and the pyrolysis device schematic diagram is shown in Figure 1.

2.3. GC/MS Detection

Agilent 7890A/5975C Gas Chromatography-Mass Spectrometry (GC/MS) was used for analysis and detection, and the schematic diagram of GC/MS is shown in Figure 2. The pyrolysis products were fed into the GC/MS system for detection, and then the pyrolysis products entered the chromatographic column HP-5MS (30 m × 0.25 mm × 0.25 μm) with high purity He as the carrier gas, and the shunt ratio was 10:1, and the chromatographic column chamber was initially set at 80 °C and held for 1 min, and then increased to 150 °C with 10 °C/min and held for 4 min, and finally increased to 310 °C with 4 °C/min and held for 10 min, and the running time was 60 min. The temperature was set at 80 °C and held for 1 min, then increased to 150 °C at 10 °C/min and held for 4 min, and finally increased to 310 °C at 4 °C/min and held for 10 min, with a total running time of 60 min; under the MS signal, the m/z scanning ranges were from 30 to 500 in the TIC mode, and from −0.3 to +0.3 in the SIM mode. The pyrolysis products were identified by GC/MS identification and were searched according to the NIST 2014 spectral library. All reactions were performed at least three times and reproduced within 95%.

2.4. Elemental Analysis

Coal samples were crushed and sieved to obtain samples with a particle size less than 200 mesh, and elemental analysis and detection were carried out on raw coal, raw coal alone pyrolysis, solids after co-pyrolysis of raw coal and NH4Cl, and tar, respectively, with Elementar Vario EL III as the instrument model.

2.5. X-Ray Photoelectron Spectroscopy (XPS)

Thermo SCIENTIFIC ESCALAB 250Xi X-ray photoelectron spectroscopy was used to detect raw coal, raw coal alone pyrolysis, and solids after co-pyrolysis of raw coal and NH4Cl, respectively, with a monochromatic Al target (Al Ka source), hυ = 1486.68 eV, and 150 W. XPS Peak fitting method was used, and spectra were outputted as .dat file output.

2.6. FTIR Analysis

The structure and functional groups of the co-pyrolysis tar were analyzed using Nicolet iN10 and iZ10 FTIR spectrometers from Thermo Fisher Scientific, Waltham, MA, USA. The infrared measurement conditions were 100 μm, a scan time of 2 min, a resolution of 0.4 cm−1, and a scanning range of 400–4000 cm−1, which were produced by KBr compression.

3. Results

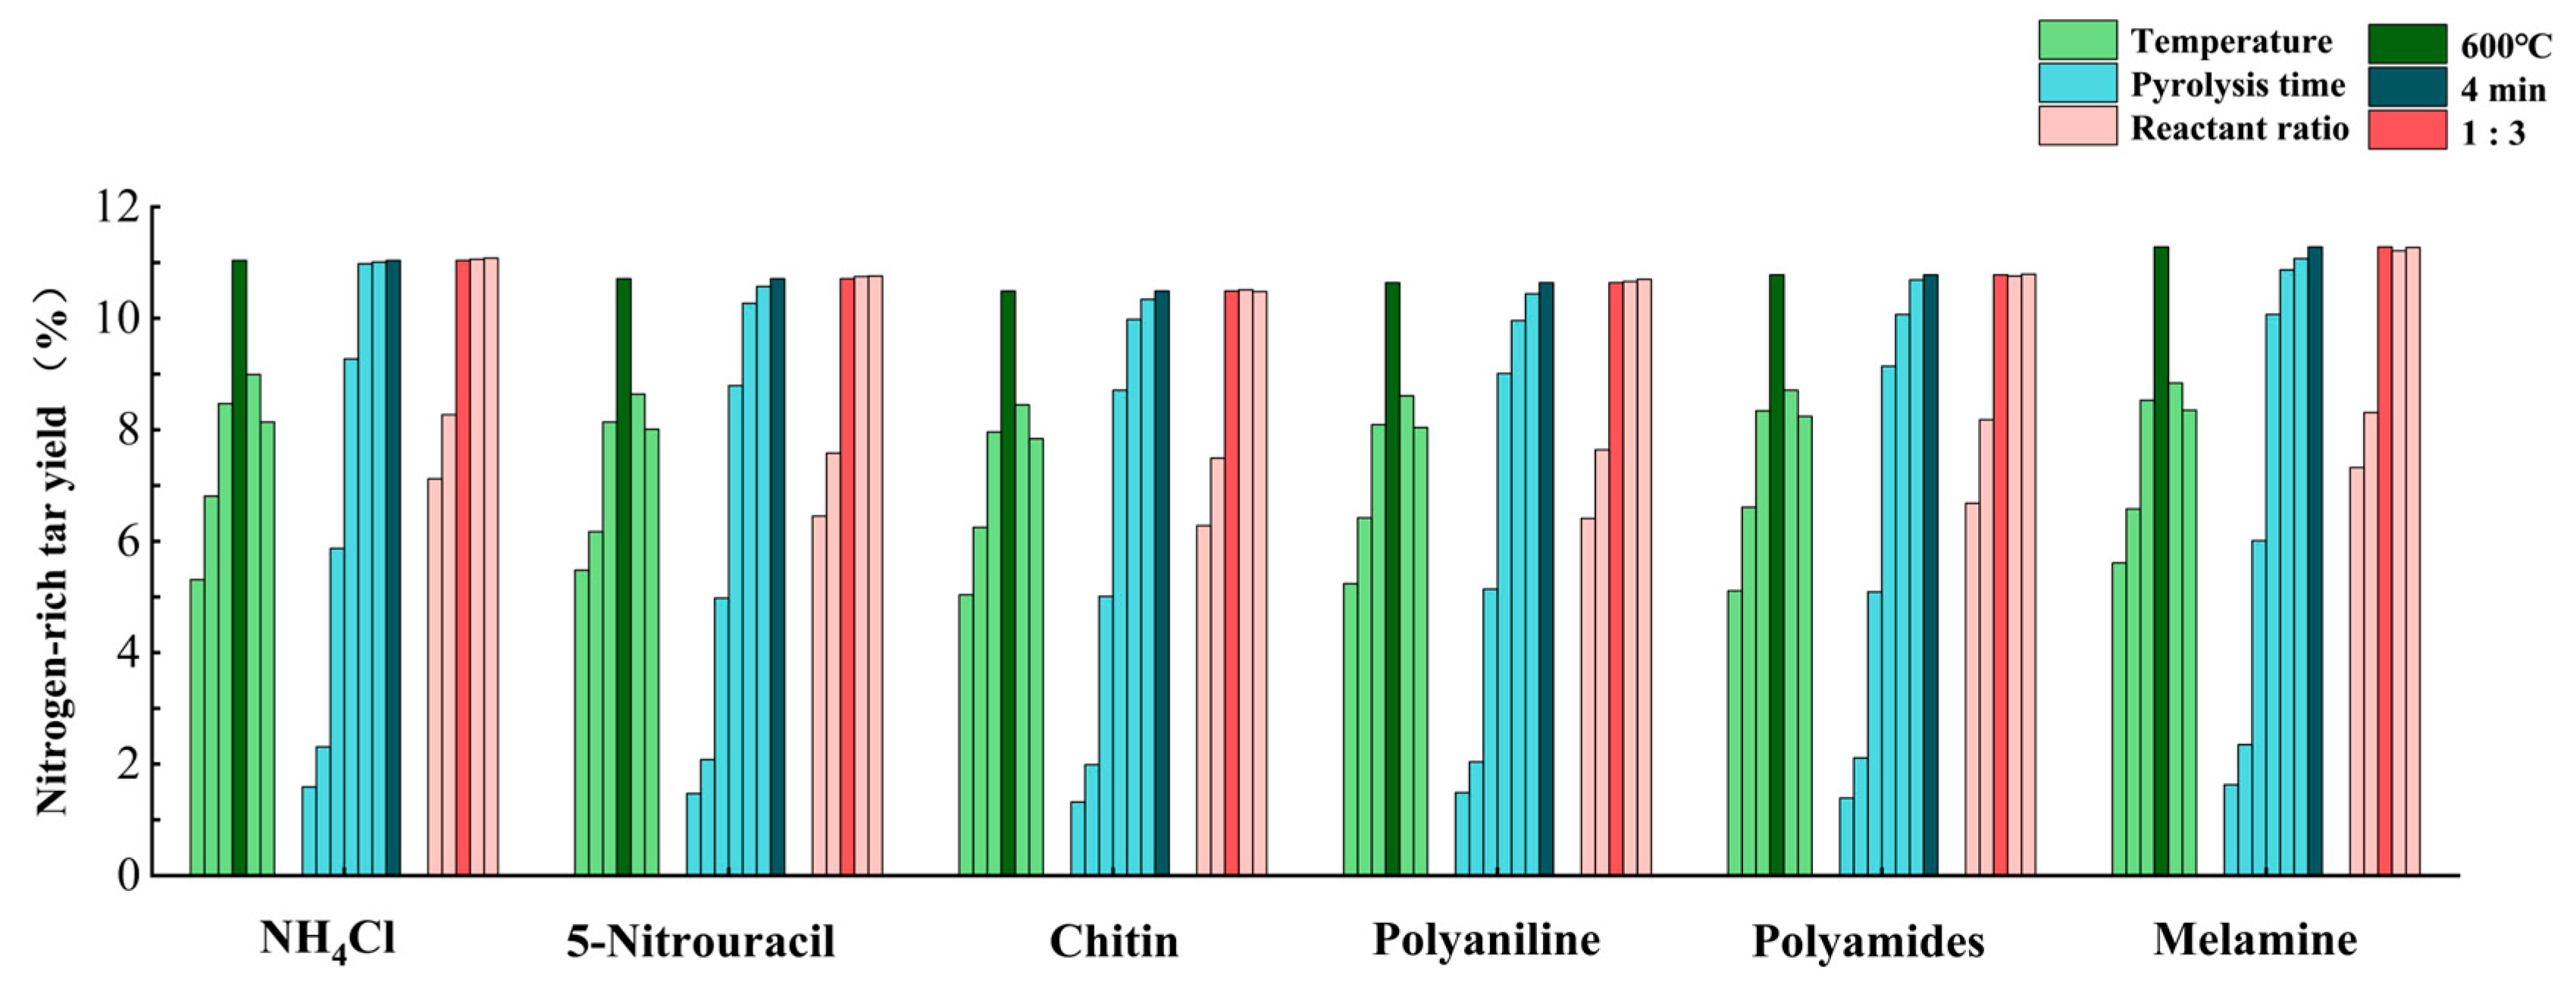
Prior to the analysis, the yields of tars produced by the co-pyrolysis of nitrogen-containing compounds and tar-rich coal at different temperatures were explored, as shown in the blue part of Figure 2. At temperatures below 600 °C, the yields of all six nitrogen-rich tars increased with increasing temperatures, especially between 450 and 600 °C, where the yields of nitrogen-rich tars had a significant increase. When the temperature exceeded 600 °C, the yield of nitrogen-rich tar also decreased, mainly because too high a temperature would lead to the secondary cracking reaction, resulting in a decrease in the yield of nitrogen-rich tar. Therefore, the subsequent co-pyrolysis experiments were carried out at 600 °C.
This was explored as the pyrolysis experiments were carried out on an indigenously constructed pyrolysis oven with a different pyrolysis time than the fixed bed reactor, as shown in the green part of Figure 2. When the co-pyrolysis was carried out at 600 °C and the pyrolysis time was lower than 15 s, the tar yield was at a low level, and it increased more slowly. As the pyrolysis time increased to 60 s, the tar yield increased rapidly; as the pyrolysis time continued to increase, although the tar yield increased, the growth rate became very slow until it stabilized, so the subsequent experiments chose the pyrolysis time to be 4 min.
In addition, the ratio between the reactants is also very important in the pyrolysis process. In this paper, tar-rich coal: nitrogenous compounds = 1:1, 1:2, 1:3, 1:4, 1:5 was investigated, as shown in the pink part of Figure 2. It was found that when the ratio of nitrogen-containing compounds gradually increased, the content of nitrogen-containing compounds in nitrogen-enriched tar also increased, and the increase became very slow when the ratio was 1:3, so the subsequent experiments were carried out by using oil-enriched coal: nitrogen-containing compounds = 1:3. It is worth noting that the types of nitrogen-containing compounds in the three groups of nitrogen-enriched tars are almost the same, indicating that under the conditions of this paper, increasing the ratio of nitrogen-containing compounds can only increase the content but not change the types.

3.1. Elemental Analysis of Char and Tar

After co-pyrolysis of six nitrogen-containing compounds and tar-rich coal at 600 °C, respectively, nitrogen-rich tar and corresponding coke were produced, and the results are shown in Table 1. Pyrolysis without the introduction of nitrogen-containing compounds had a small effect on the mass distribution of elemental N, which is related to the thermal resistance of the original nitrogen contained in the coal [30]. When the nitrogen-containing compounds were added, there was a significant increase in the elemental N content of all six coke types. In the case of polyaniline and polyamide, a part of the N content in the coke after pyrolysis was still attributed to the reactants themselves. For melamine, 11.61% of the coke and 7.04% of the tar contained elemental N, which was the largest proportion among the six nitrogen-containing compounds. The reason for this is that melamine itself can react to form melam, melem, and melone during pyrolysis [31], which contain a large amount of elemental N and are insoluble in 1,4-Dioxane, so the coke contains the largest amount of nitrogen. NH3 is released at each step in the conversion of melamine into melam, melem, and melone, and it was found in previous studies that NH3 increases the content of elemental N in the products. During pyrolysis, NH3 reacts with coal to generate a series of oxidized nitrogen forms (N-O), but in the case of tar, both reduced and oxidized states of N are present. At high temperatures, NH4Cl will decompose into NH3 and HCl, and the main source of N is similar to melamine, both being derived from NH3. However, the amount of released NH3 is reduced compared to melamine, so the content of N in tar was slightly lower as well, reaching 6.49%.

3.2. GC/MS Analysis

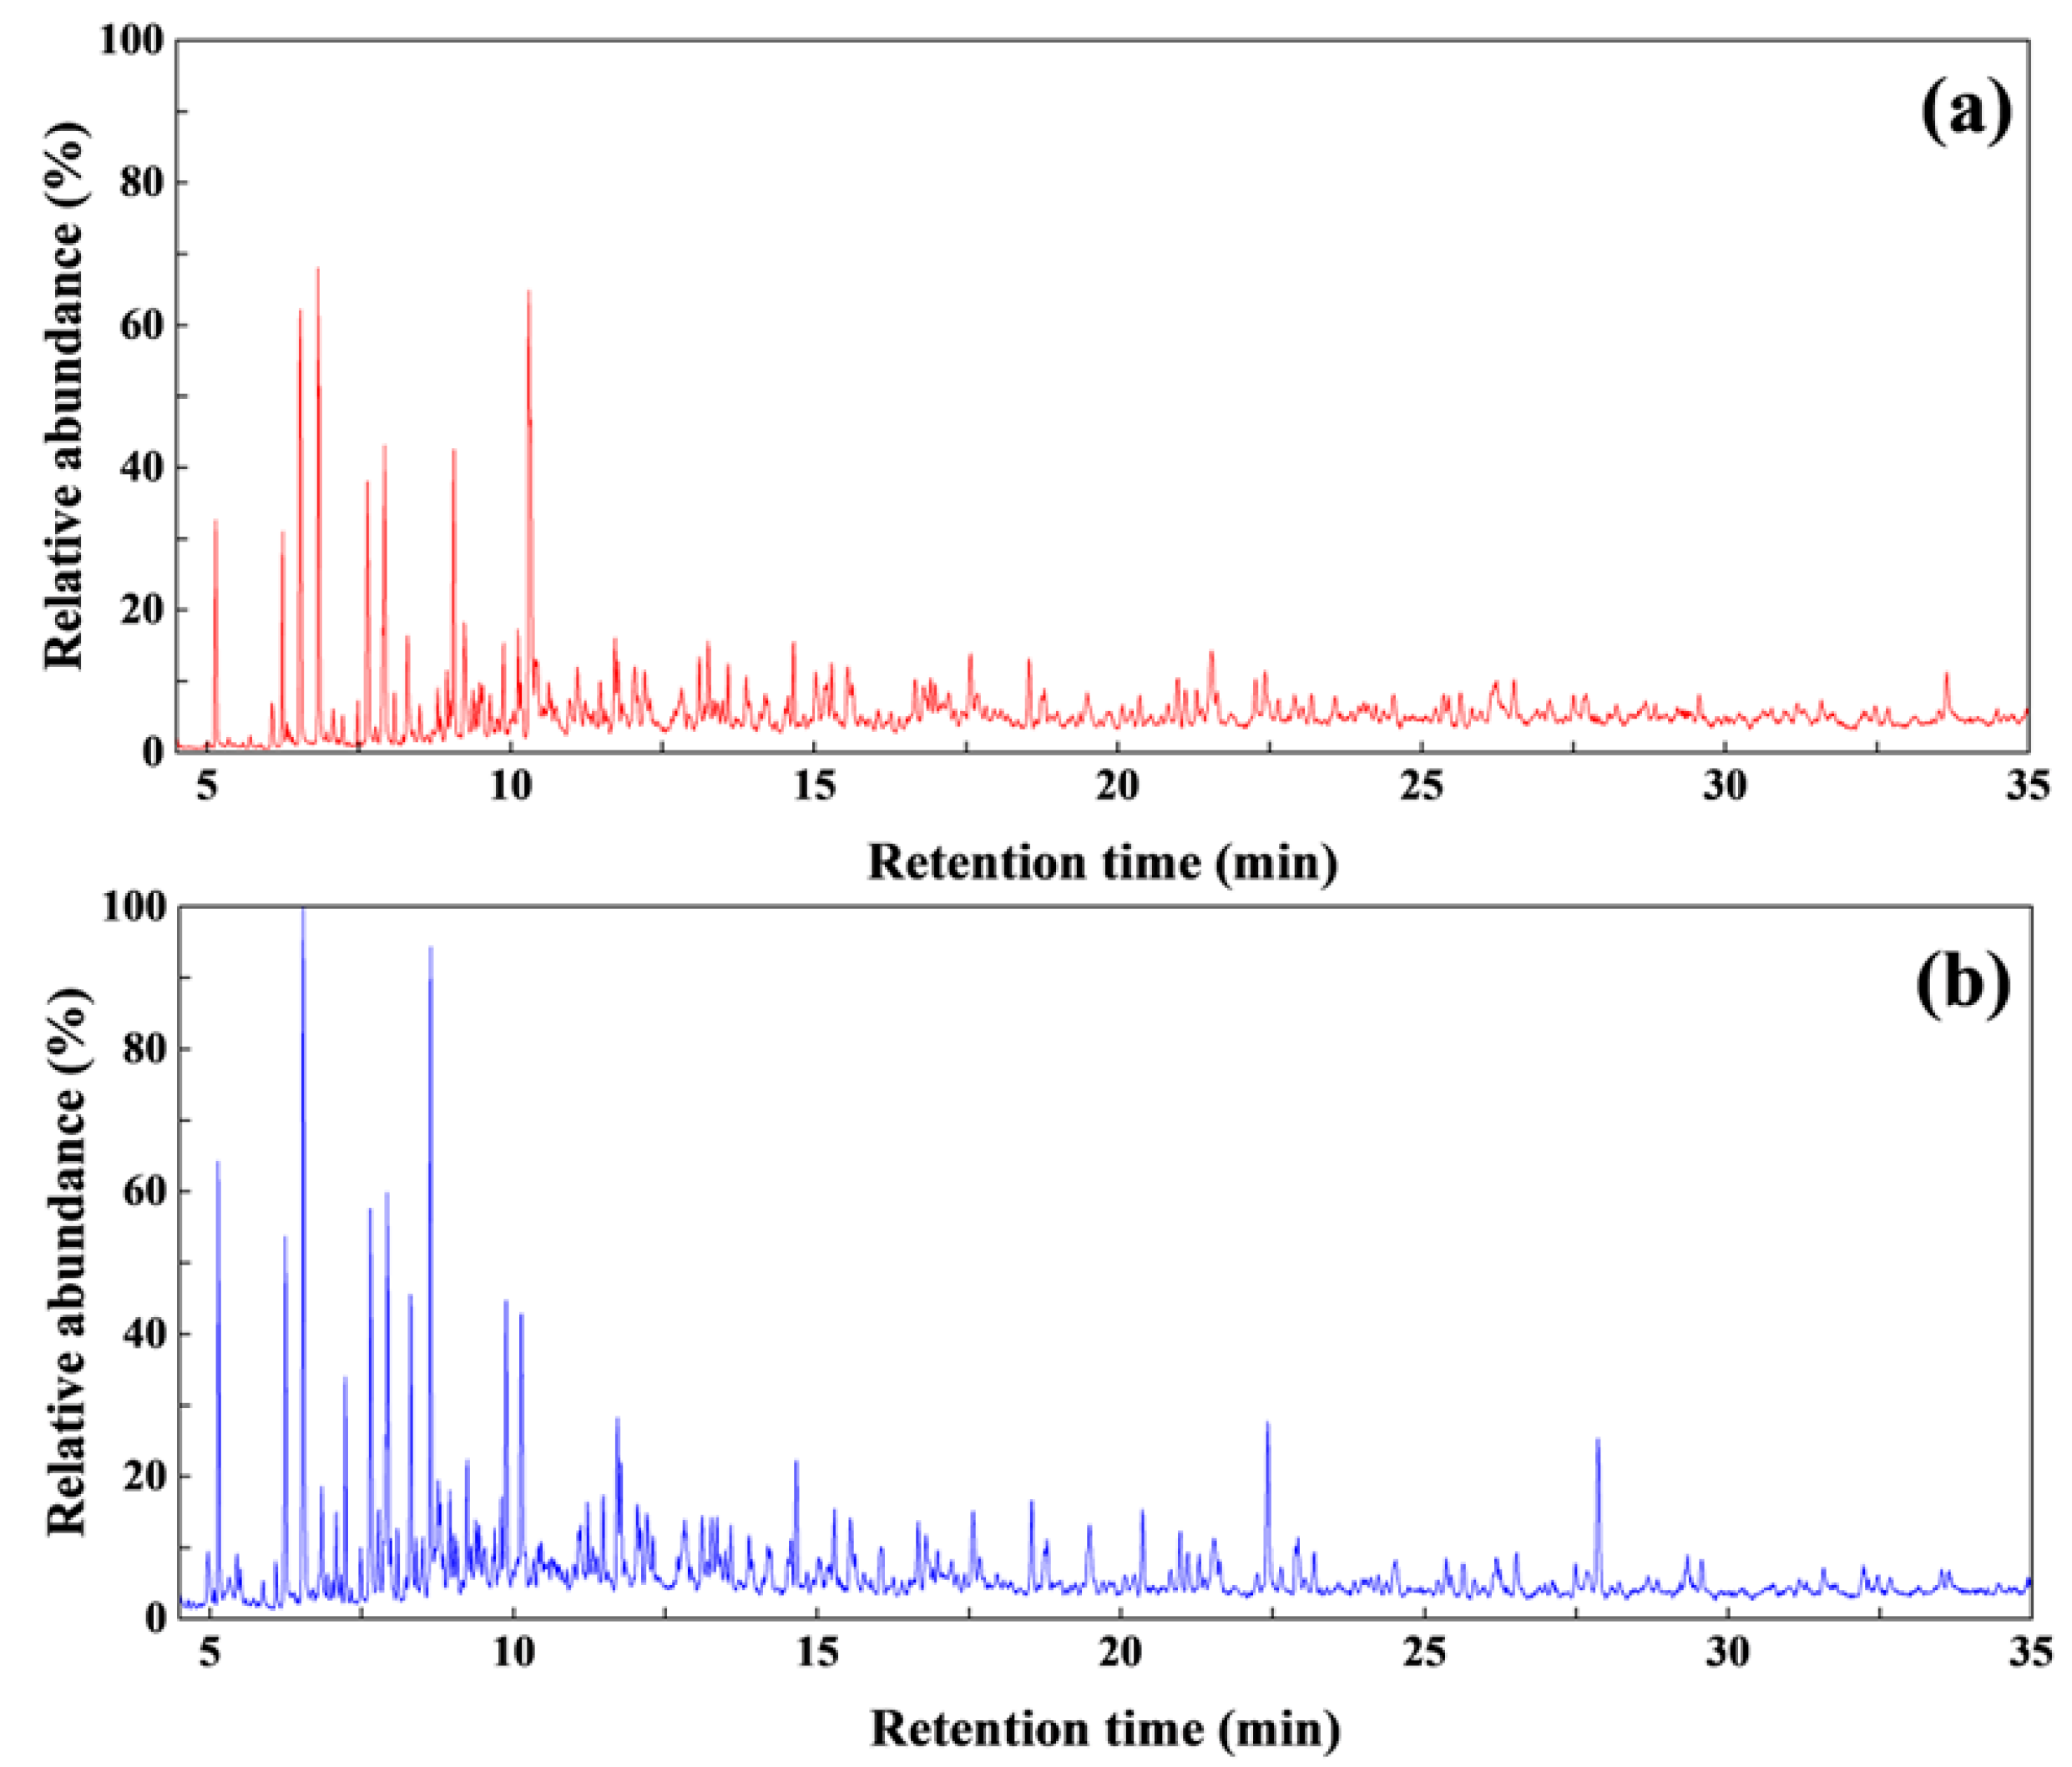
Firstly, the tar-rich coal was analyzed by Py-GC/MS, as shown in Figure 3a. The relative quantification of the peaks of the target compounds in the resulting TIC plots was calculated using Equation (1).
R t % = S t S
where Rt (%) indicates the relative content of the target compound, St indicates the peak area of the target compound in the TIC diagram, and S indicates the sum of all effective target compounds in the TIC diagram, after the peak areas of impurities, interfering peaks, and residual peaks of the chromatographic column removed.
The relative contents of various compounds in coal tar were calculated according to Equation (1), as shown in Table 2. The content of aliphatic hydrocarbons is about 11%; the content of aromatic hydrocarbons is about 60%; the content of phenols is about 11%; and the nitrogen-containing compounds are about 6%.
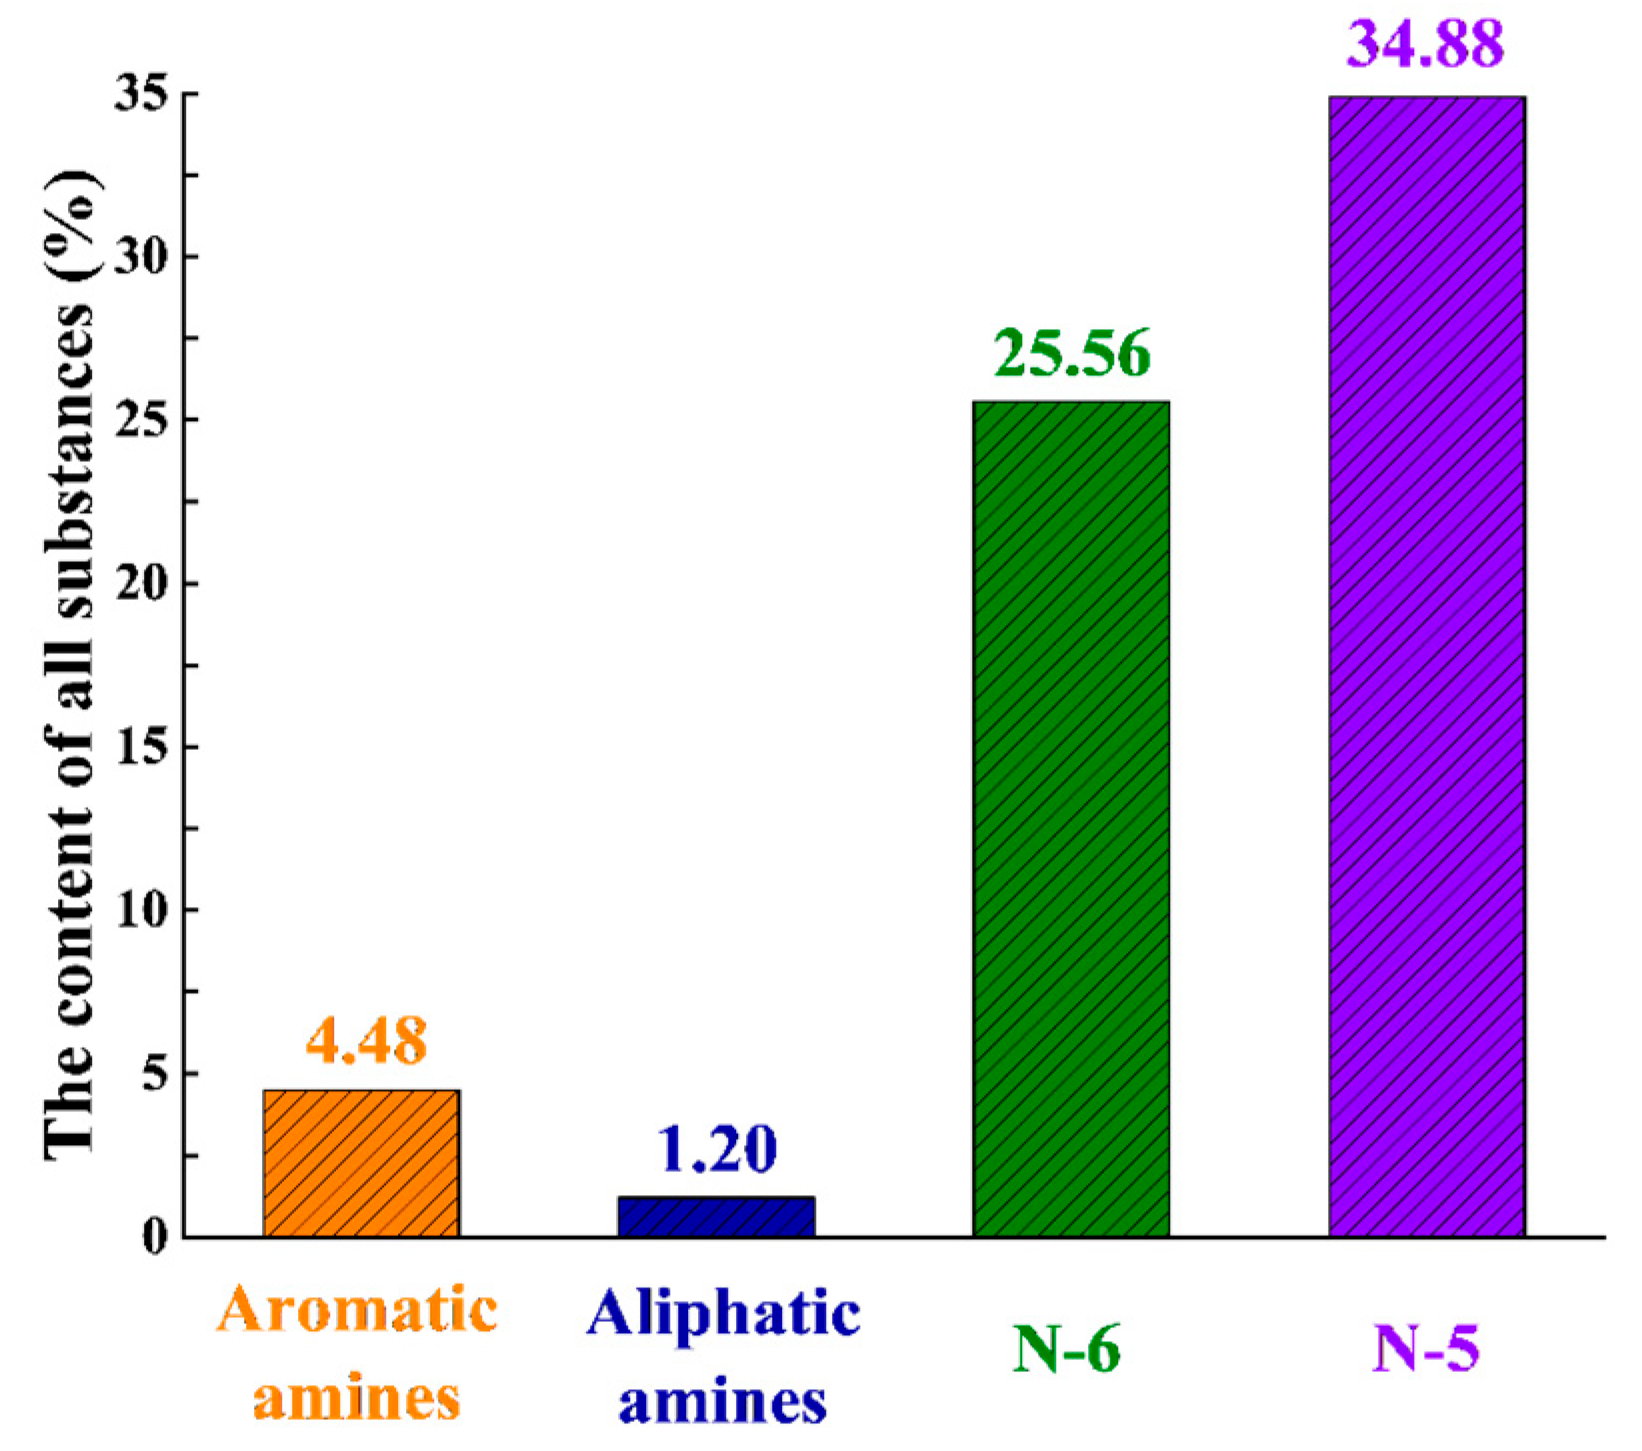
It is well known that the tar from tar-rich coal has a low content of nitrogen-containing compounds, so we prepared nitrogen-rich tar by co-pyrolysis of tar-rich coal and nitrogen-containing compounds. Since Py-GC/MS mainly analyzes solids and liquids, NH4Cl, which is widely available, inexpensive, green, and clean, was used as the nitrogen source. At the same time, 15NH4Cl was used to label the nitrogen atoms, and the nitrogen-containing compounds in the tar would have characteristic signals in the mass spectra, further identifying the nitrogen-containing compounds therein as shown in Figure 4a,b. After that, co-pyrolysis was carried out using the same temperature first, and then the collected tar was subjected to GC/MS, with the results shown in Figure 4c,d. From Figure 3, it can be seen that the TIC plots after isotope labeling have the same trend as the unlabeled TIC plots, indicating that the isotope labeling is more complete. This also proves that it is completely feasible to utilize the products obtained by the isotope labeling method during the co-pyrolysis of coal and NH4Cl. Comparison of m/z shows that the nitrogen-containing compounds obtained using the pyrolyzer are not only more diverse than those obtained by Py-GC/MS, but also have significantly higher contents. We analyzed the labeled TIC plots and found that all of the effective compounds in them were concentrated within 4–20 min, and the corresponding changes in m/z values of 26 compounds were analyzed in this range. Based on this, it can be preliminarily judged that 26 nitrogen-containing compounds were produced in the tar from the co-pyrolysis of tar-rich coal with NH4Cl. By comparing the retention times of all product peaks in Figure 4c,d, it was found that the 15N isotope had almost no effect on the retention times of the labeled products. The relative content of several compounds was re-calculated using Equation (1), and the value was found to be very close to the species of compounds previously screened in the NIST 14 database. As shown in Table 3, the results indicated that this method of comparison through the NIST database has a certain degree of credibility. Among them, nitrogen-containing compounds accounted for 66.28% of all the products. The probable names, retention times, and relative abundances of 26 nitrogen-containing compounds in the NIST 14 database are shown in Table 4. The classification of these 26 nitrogen-containing compounds was analyzed by GC/MS, as shown in Figure 5. The products had the highest content of five-membered nitrogen heterocycles, which accounted for 34.88% of the total. This was consistent with the XPS analysis of coal tar, but the result was only 1.20% for aliphatic amines. Amino radicals are more likely to combine with more reactive aromatic radicals than aliphatic alkane breakage radicals. The high content of five- and six-membered nitrogen heterocycles is partly due to the combination of fragmented chain radicals generated by the breakage of short-chain alkanes with one or more amino radicals, resulting in the cyclization of five- and six-membered nitrogen heterocycles. Another reason is that the oxygen atoms in the original five- and six-membered heterocycle structure of coal were replaced by nitrogen atoms to form five- and six-membered nitrogen heterocycles. Aromatic amines are mainly derived from aromatic compounds in coal with ether bonds and other easy-to-break carbon-oxygen bonds. When the carbon-oxygen bond is broken, the amino radicals in the fracture can be fully reacted, thus generating a number of aromatic amines. Although there are few phenolic compounds in coal (e.g., phenol, α-naphthol, β-naphthol, etc.), the p-electrons of the phenolic oxygen atom and benzene ring form a conjugated state that increases the barrier to nitrogen exchange, which is the reason that residual phenolics were detected among the products.
In addition, the coal tar from the co-pyrolysis of tar-rich coal with different nitrogen-containing compounds was separately examined by GC/MS, and also compared with the standard samples in the NIST 14 database, and after screening the compounds of each species, the results were calculated using Equation (1). As shown in Table 5, these nitrogen-containing compounds contain different nitrogen-containing functional groups such as amide, nitro, and cyano groups. When nitrogen-containing compounds were added during pyrolysis, the relative contents of aliphatic alkanes were reduced in all cases. Aliphatic alkanes in coal tar are mainly long-chain molecules with side chains, mainly because these aliphatic alkanes break into many short-chain alkane radicals at high temperatures and react with other free radicals to form new compounds. Similarly, the content of aromatic hydrocarbons also decreased to different degrees with each of the six nitrogen-containing compounds. The TIC diagrams of the six pyrolysis products were analyzed for peaks of each aromatic hydrocarbon, and it was found that the decrease in the relative content was mainly due to the increase in the content of nitrogen-containing compounds, which led to an increase in the total area of the peaks of the effective compounds. In addition, a minor contributor was also the exchange of free radicals with the hydrogens on the different aromatic rings. However, the relative content of aromatic hydrocarbons in the polyaniline group was significantly higher than with the other nitrogen-containing compounds, reaching 25.26%. The reason is that more benzene ring radicals are generated during the pyrolysis of polyaniline than other nitrogenous compounds, resulting in a higher relative content of aromatic hydrocarbons among the products. The relative content of phenolics decreased when NH4Cl, polyaniline, and melamine were added for the same reason that the content of aromatic hydrocarbons decreased. By contrast, the relative content of phenolics increased when 5-nitrouracil, chitin, and polyamide were added. A comparison of the structures of the six nitrogen-containing compounds shows that there is no oxygen-containing group per se in NH4Cl, polyaniline, and melamine, explaining their negligible effect on the phenolic content. By contrast, 5-nitro uracil, chitin, and polyamide have oxygen-containing groups, whereas 5-nitro uracil contains hydroxyl groups. However, these hydroxyl groups are attached to the pyrimidine ring, and their stability is much higher compared to chitin and polyamide, so the relative content of phenolics was not as high as with the latter two. Chitin not only contains hydroxyl groups, but it also has ether bonds in its structure. These oxygen-containing groups can produce free hydroxyl radicals at high temperatures, so the relative phenolic content was the highest, reaching 20.26%. In the case of polyamides, a large number of amide groups are generated during pyrolysis. Previously, He et al. [32] found that when using cinnamic acid and its derivatives for co-pyrolysis with NH4Cl, the carboxyl group of cinnamic acid reacts with the amino radical produced by the decomposition of NH4Cl to form amide at lower temperatures, while a part of the amides will be dehydrated to form cyanide as the temperature is increased further. Another part of the amide groups generated by polyamide pyrolysis produces hydroxyl radicals due to dehydration, which is also a reason for the increase in the relative content of phenolics. Corresponding to the phenolics are other compounds, the most important of which were oxygen-containing compounds, and the above three nitrogen-containing compounds generated in the pyrolysis process of the oxygen-containing groups after the reaction to generate other oxygen-containing compounds, as shown in Table 2. Chitin produced more oxygen-containing groups, so the relative content of other compounds was also higher, reaching 31.76%.
The main focus of this study is on nitrogen-containing compounds. For all six nitrogenous compounds, the relative content of nitrogenous compounds in the co-pyrolysis tar increased to a large extent. In the case of chitin and polyamide, the nitrogen is derived from the amide structure, which is easily dehydrated to generate cyano groups, the main class of nitrogen-containing compounds in both cases. For polyaniline, the nitrogen-containing compounds in the pyrolysis product were mainly aniline and its derivatives, accounting for 85% of all nitrogen-containing compounds. For 5-nitrouracil, the nitrogen is derived from the pyrimidine ring and nitro group, both of which are relatively stable. After analyzing its tar, it was found that it contained many compounds with a pyrimidine ring as the base structure and not many new nitrogen-containing groups were generated. According to previous studies and the pyrolysis patterns of NH4Cl and melamine, both can produce ammonia gas during pyrolysis, which in turn generates amino radicals. Many researchers have also carried out studies with coal and ammonia, which showed that many kinds of nitrogen-containing compounds can be produced by this combination. According to the GC/MS analysis, it was found that the relative content of nitrogenous compounds in both groups was relatively high, and the relative content of nitrogenous compounds in the tar after the co-pyrolysis of tar-rich coal with melamine even reached 70.48%. After analyzing the structure, pyrolysis pattern, and GC/MS data of these six nitrogenous compounds, it was found that although the highest relative content of nitrogenous compounds was produced by the addition of melamine, the product distribution of nitrogenous compounds in the tar was affected by the fact that melamine itself could react to form melam, melem, and melone during the pyrolysis process [21]. The products of NH4Cl at high temperatures are NH3 and HCl. Compared with melamine, the nitrogen-containing compounds in the resulting tar were more abundant, and the relative content was also higher, and had less influence on the product distribution of nitrogen-containing compounds in the tar. Therefore, in the subsequent analysis, the specific types of nitrogen-containing compounds were further analyzed by using the co-pyrolysis of tar-rich coal with NH4Cl.

3.3. XPS Analysis

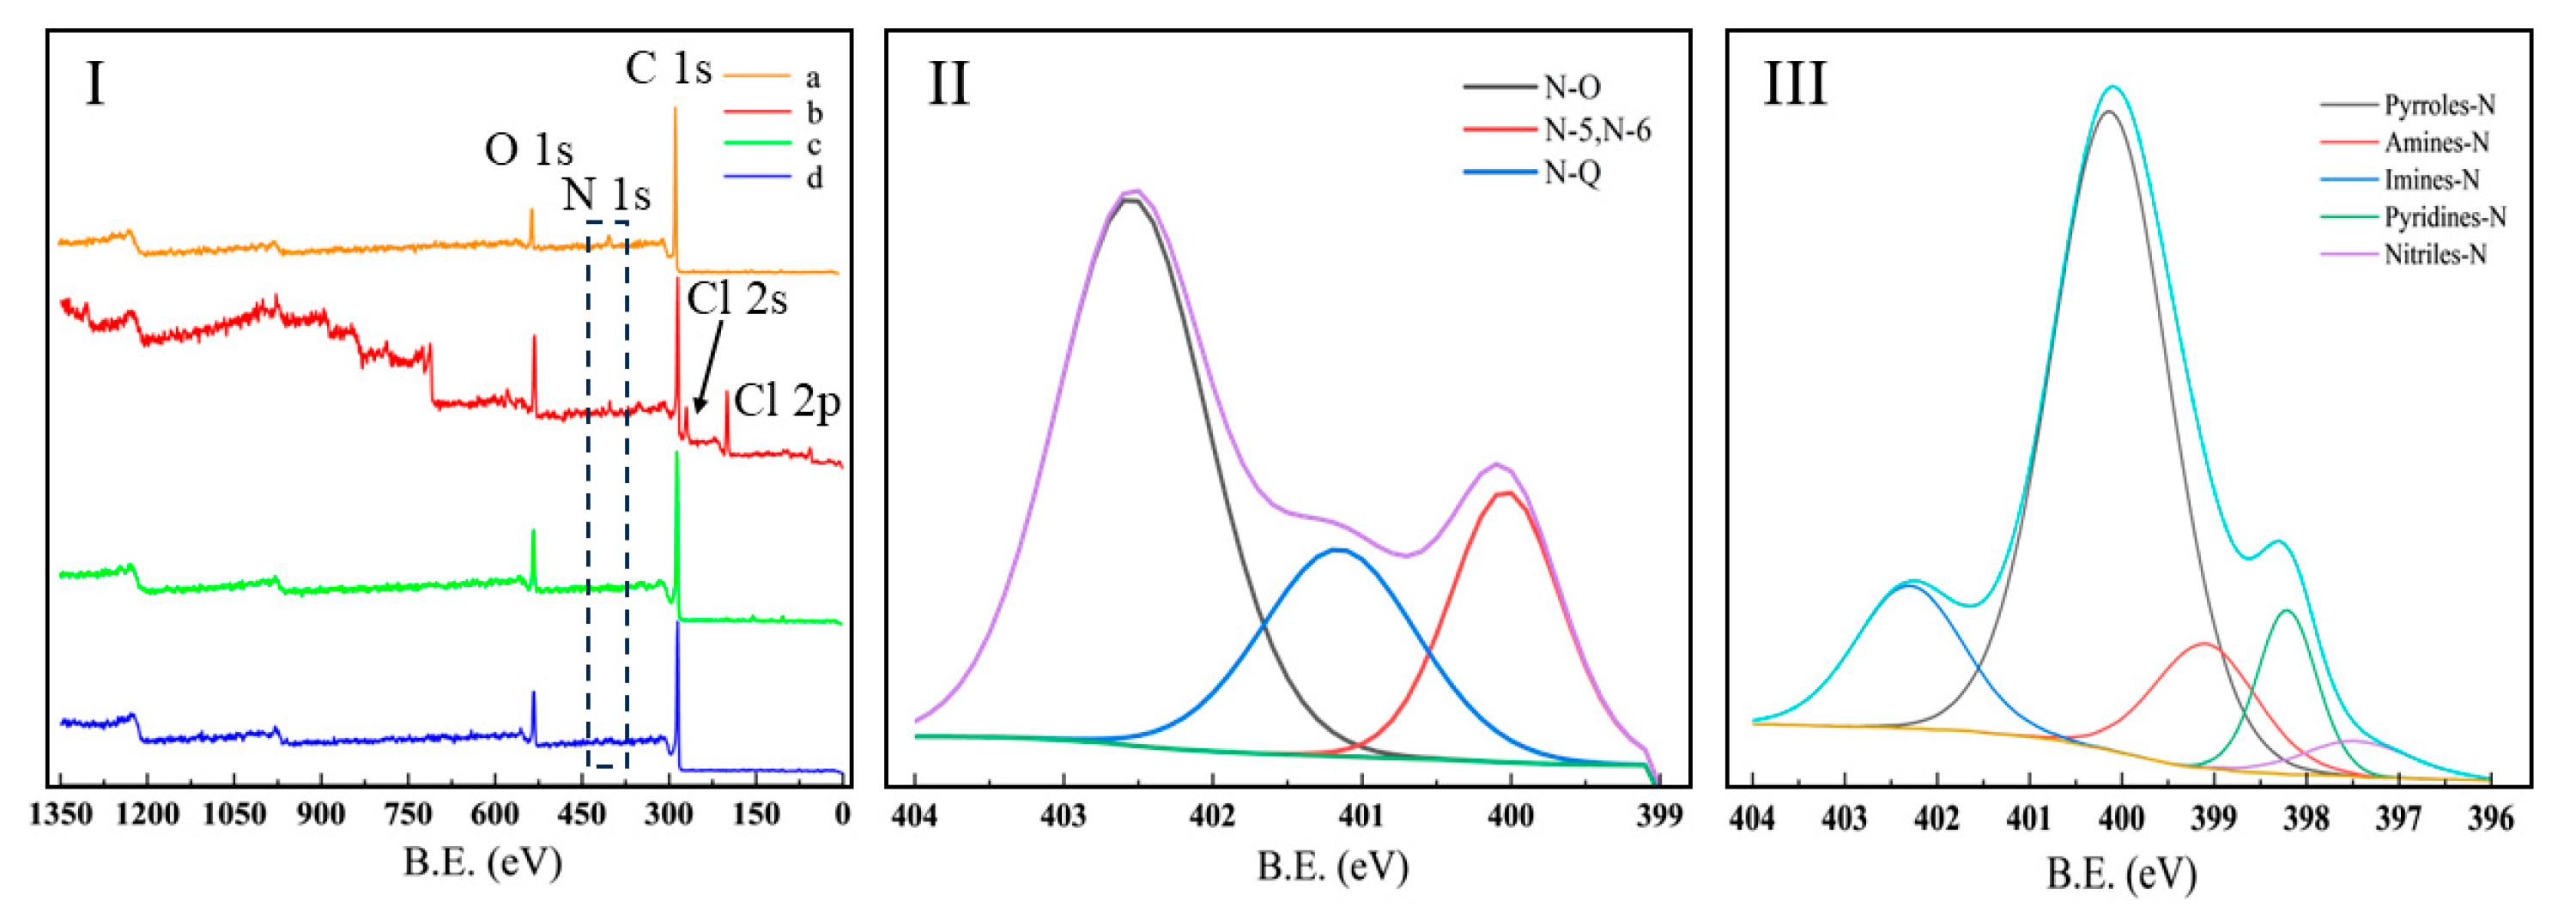
Accordingly, XPS analysis was performed on the semi-coke and tar from the co-pyrolysis of tar-rich coal with NH4Cl for secondary validation. The XPS plots of tar-rich coal, semi-coke from the pyrolysis of tar-rich coal alone, as well as the semi-coke and tar from the co-pyrolysis of tar-rich coal with NH4Cl, are shown in Figure 6. As shown in Figure 6I, the spectral trends were basically the same for c and d, indicating that the elemental content did not change much. The c group had a higher content of C 1s than the d group, and the ionic current intensity of O 1s was lower than that of the d, which suggests that the elemental content of C increased while that of O decreased after pyrolysis. This change is related to the volatilization of water from the coal in the pyrolysis process. However, in the coke generated by the co-pyrolysis of tar-rich coal with NH4Cl (Figure 6I b), there was a peak in the range of 399–404 eV, which was determined to be the N 1s peak after comparison. There were two more distinct peaks around 175 eV with higher ion current intensity than the N 1s peak, which were identified as Cl 2s and Cl 2p peaks by comparison. The possible reason is that the final pyrolysis product is mixed with NH3 and HCl at lower temperatures, which are then re-reacted to generate NH4Cl. In addition, it is also possible that the Cl radical reacts not only with nitrogen-containing compounds but also with other non-nitrogen compounds during the reaction process. The peaks of N 1s were fitted as shown in Figure 6II. It was found that N-O was more abundant in the coke after co-pyrolysis. A possible reason may be that a large number of OH radicals were generated during coal dehydration, which promoted the oxidation of the amino groups produced in the co-pyrolysis system to generate N-O. Similarly, the presence of N-Q was partially attributed to the regenerated NH4Cl mixed with coke produced by pyrolysis. As shown in Figure 7, the color of the pyrolysis product when combined with NH4Cl changed from black to gray, which also proves that part of the N-Q is derived from NH4Cl. In the corresponding coke fraction (shown in Figure 6I a), there was a similar N 1s peak in the range of 399–404 eV. After fitting the N 1s peak as shown in Figure 6III, it was found that the tar mainly contained pyrrole-N, amine-N, imine-N, pyridine-N, and nitrile-N, with pyrroles being the main nitrogen-containing compounds, which was in agreement with the GC/MS results.

3.4. FTIR Analysis of Nitrogen-Rich Tar

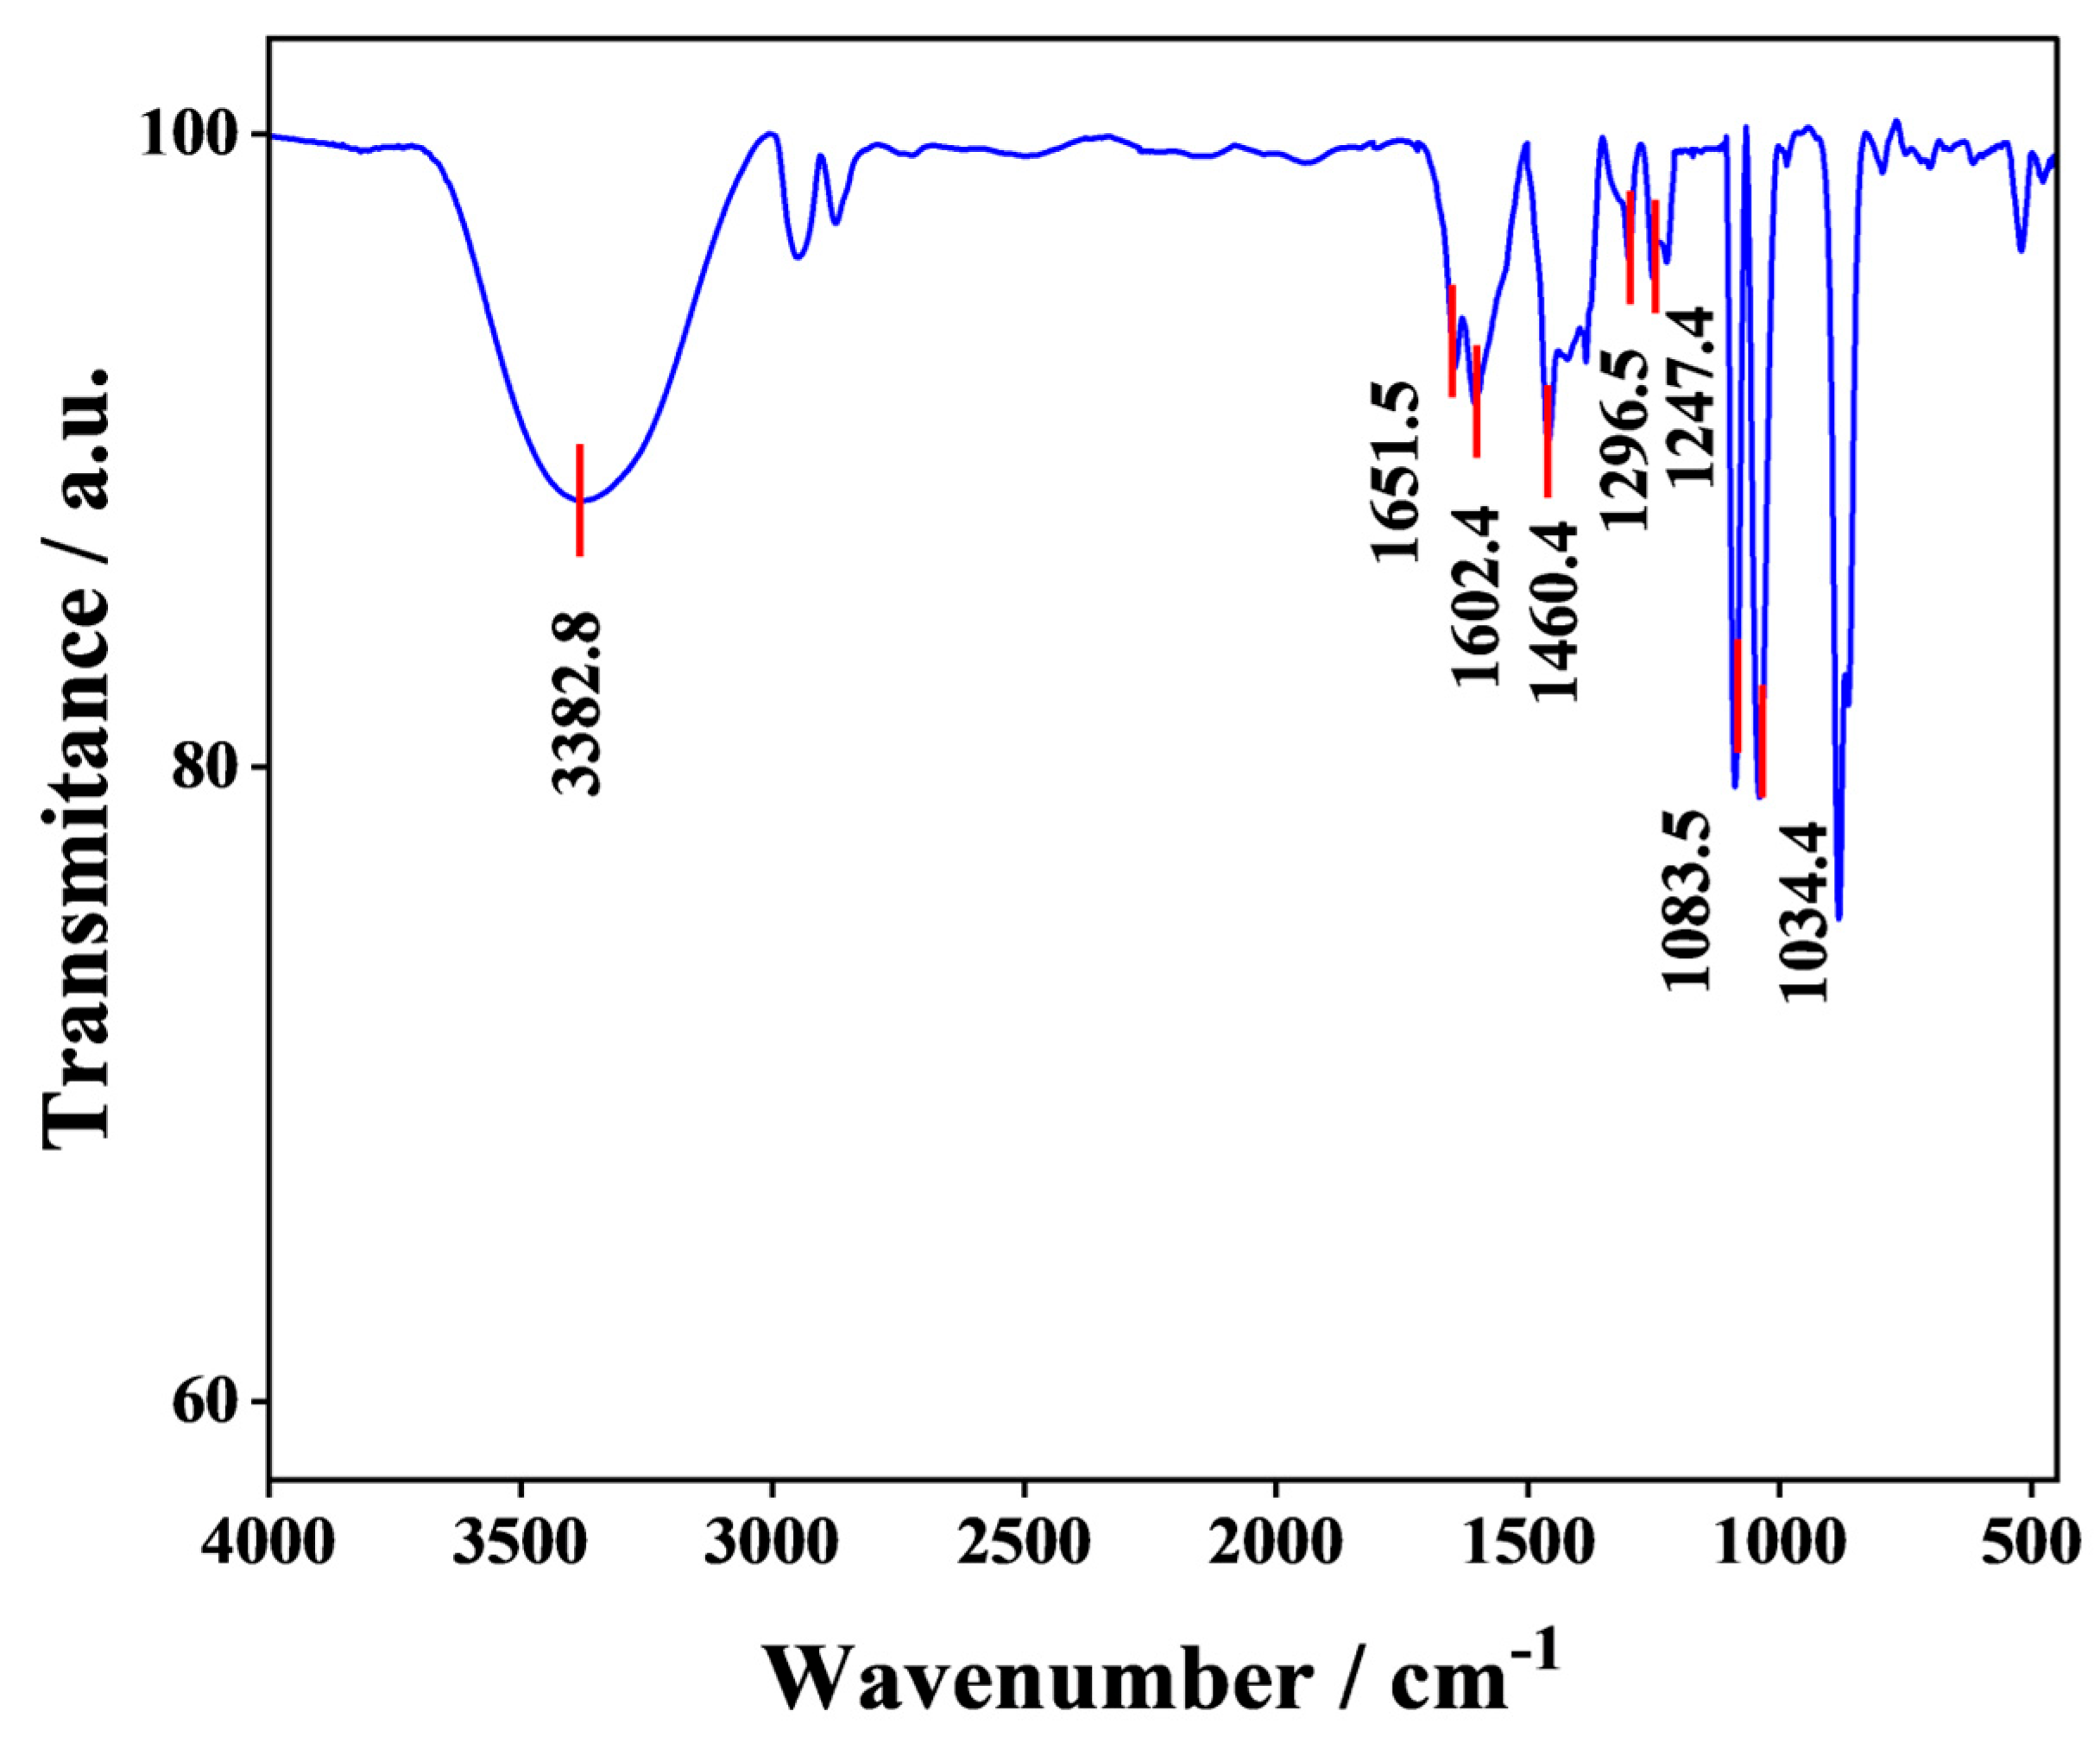
In addition, the tar produced by co-pyrolysis was analyzed by FTIR spectroscopy. Figure 8 shows the infrared spectrum of the tar from the co-pyrolysis of tar-rich coal and ammonium chloride. From the figure, N-H stretching vibration (3300–3600 cm−1), N-H plane bending vibration (1580–1650 cm−1), aliphatic amine C-N stretching vibration (1200–1250 cm−1), and aromatic amine C-N stretching vibration (1300–1350 cm−1) can be seen, which suggests that aliphatic amine and aromatic amine compounds are contained in it. Skeletal vibrations of the piperidine ring usually occur between 1450 and 1500 cm−1, which also proves the presence of piperidines in it. The observation of aromatic C=C stretching vibrations and C=C and C=N bond conjugation vibrations (1650–1680 cm−1) indicated that these may be due to the backbone vibrations of nitrogen-containing aromatic heterocycles such as the pyrrole ring and pyridine ring. In addition, there were two strong absorption peaks near 1050 cm−1, and the C-O stretching vibration absorption peaks in the dioxane ring were in this range, which may be due to the fact that the dioxane solvent was not completely removed during the concentration of the product. All the above analyses were consistent with the results of GC/MS and XPS, which further verified the accuracy of the experiments.

4. Conclusions

In this paper, tar-rich coal was used as the carbon source, which has low cost and wide availability. By co-pyrolysis with different nitrogen-containing compounds, nitrogen-rich tar was successfully prepared. In the experimental setup of this paper, the best effect was achieved when the temperature was 600 °C, the pyrolysis time was 4 min, and the ratio was tar-rich coal: nitrogen-containing compounds = 1:3. When no nitrogen-containing compounds were introduced into the coal pyrolysis, there was almost no effect on the original N elemental morphology distribution in the coal, and when nitrogen-containing compounds were added, the N elemental content in all six products was significantly increased, among which the N elemental content in the melamine coke and tar was increased by 14.69 times and 2.85 times. After that, the main components in the high-nitrogen tar were analyzed, which provided some help for the high-value utilization of coal tar. From the experimental results, only under the condition of sufficient pyrolysis time, the nitrogen-containing compounds were the most abundant and had the highest content. The GC/MS analysis of the tars co-pyrolyzed with six kinds of nitrogen-containing compounds and tar-rich coal revealed that the contents of nitrogen-containing compounds in the tars of NH4Cl and melamine were all over 60%, and the rest of the several kinds of tars were also significantly increased. The nitrogen-containing compounds in the tar were also labeled using 15NH4Cl to further determine the types and contents in the co-pyrolysis tar of NH4Cl and tar-rich coal, and 26 nitrogen-containing compounds were screened out accounting for 66.28% of the total, among which the content of the five-membered nitrogen heterocyclic ring was the highest, which could be up to 34.88%. Furthermore, by using XPS analysis, it was found that the content of pyrro-N in the tar was the highest. Finally, FTIR analysis was used to discover the absorption peaks of aromatic amines, fatty amines, nitrogen heterocycles, etc. These results are all consistent with the GC/MS analysis, further mutually verifying the accuracy of the experiment. In the subsequent studies, more methods will be used to further analyze the structure of different nitrogenous compounds in high-nitrogen tar. At the same time, the conclusions of this paper will be applied to the co-pyrolysis of coal and nitrogenous wastes to observe the changes in the content and structure of nitrogenous compounds therein. In addition, the semi-coke produced from the co-pyrolysis of coal and nitrogenous compounds will also be further analyzed, which will provide a certain reference value for the high-value utilization of coal tar and the application of char in other industries.

Author Contributions

Conceptualization, F.C., G.L. and A.Z.; methodology, P.C. and J.S.; validation, G.L. and P.C.; investigation, J.S. and Q.W.; resources, B.B. and A.Z.; data curation, X.H. and J.H.; writing—original draft preparation, P.C. and J.H.; writing—review and editing, F.C., B.B. and G.L.; supervision, Q.W.; project administration, F.C.; funding acquisition, X.H., Q.W. and A.Z. All authors have read and agreed to the published version of the manuscript.

Funding

This research was funded by the National Natural Science Fundamental Project (No. 32202164, 52174208, U24A20552), Shaanxi Natural Science Foundation (2021JQ556), China Postdoctoral Science Foundation (No. 2020M673610XB), Scientific Research Program Funded by Shaanxi Provincial Education Department (No. 21JK0772), Xi’an Science and Technology Plan Project (No. 23NYGG-0068) for the financial support.

Institutional Review Board Statement

Not applicable.

Informed Consent Statement

Not applicable.

Data Availability Statement

The original contributions presented in the study are included in the article, further inquiries can be directed to the corresponding author.

Conflicts of Interest

Authors Jie Shao, Baoping Bai and Jie Hu were employed by the company Changqing Industrial Group Co., Ltd. The remaining authors declare that the research was conducted in the absence of any commercial or financial relationships that could be construed as a potential conflict of interest.

References

  1. Hou, J.; Ma, Y.; Li, S.; Shi, J.; He, L.; Li, J. Transformation of sulfur and nitrogen during Shenmu coal pyrolysis. Fuel 2018, 231, 134–144. [Google Scholar] [CrossRef]
  2. Han, D.; Yang, Q. China Coalfield Geology; China Coal Industry Publishing House: Beijing, China, 1979. [Google Scholar]
  3. Zhang, L.; Han, Z.; Shu, H.; Jia, Y.; Kuang, W.; Sun, Z. Basic characteristics of low-temperature pyrolysis of tar-rich coal in northern Shaanxi. Coal Eng. 2022, 54, 124–128. [Google Scholar]
  4. Zhao, N.; Liu, D.; Du, H.; Wang, C.; Wen, F.; Shi, N. Investigation on Component Separation and Structure Characterization of Medium-Low Temperature Coal Tar. Appl. Sci. 2019, 9, 4335. [Google Scholar] [CrossRef]
  5. Lu, Z.; Zhang, H.; Zhang, Y.; Ding, L.; Liu, X.; Wang, C.; Han, Z.; Jia, X.; Xu, G. Pyrolysis of coal and biomass in a fixed bed with internals to produce volatiles with respectively enriched light and heavy fractions. Fuel 2025, 397, 135365. [Google Scholar] [CrossRef]
  6. Ordabaeva, A.; Muldakhmetov, Z.; Meiramov, M.; Kim, S.; Sagintaeva, Z. Production of Pitch from Coal Tar of the Coke Chemical Production “Qarmet”. Molecules 2025, 30, 1441. [Google Scholar] [CrossRef]
  7. Correia, C.; Silva, A.; Silva, V. The Role of Flow Chemistry on the Synthesis of Pyrazoles, Pyrazolines and Pyrazole-Fused Scaffolds. Molecules 2025, 30, 1582. [Google Scholar] [CrossRef]
  8. Ren, X.; Feng, X.; Cao, J.; Tang, W.; Wang, Z.; Yang, Z.; Zhao, J.-P.; Zhang, L.-Y.; Wang, Y.-J.; Zhao, X.-Y. Catalytic Conversion of Coal and Biomass Volatiles: A Review. Energy Fuels 2020, 34, 10307–10363. [Google Scholar] [CrossRef]
  9. Roser, B.P.; Korsch, R.J. Provenance signatures of sandstone-mudstone suites determined using discriminant function analysis of major-element data. Chem. Geol. 1988, 67, 119–139. [Google Scholar] [CrossRef]
  10. Liu, Q.; Meng, W.; Qiu, Y.; Chen, L.; Song, Z.; Qi, Z. Multilevel screening and mechanism analysis of ionic liquids for separating pyridine from coal pyrolysis model oil. Sep. Purif. Technol. 2025, 362, 131856. [Google Scholar] [CrossRef]
  11. Wu, L.; Wei, Z.; Li, W.; Jin, K.; Zheng, Z.; Wang, D.; Wang, Q.-P.; Hou, Y.-T.; Ye, C.-Y.; Cheng, X.-Y.; et al. Experimental and kinetic study on the co-oxidation of pyridine and ammonia as a model compound of coal-ammonia co-firing. Combust. Flame 2025, 277, 114211. [Google Scholar] [CrossRef]
  12. Chen, X.; Zuo, P.; Min, R.; Zhang, G.; Zhao, S. Macromolecular pore model construction and theoretical study of Inner Mongolia Long-flame coal. Colloids Surf. A Physicochem. Eng. Asp. 2025, 717, 136772. [Google Scholar] [CrossRef]
  13. Meng, F.; Liu, Y.; Shi, K.; Zhou, J.; Yan, F.; Wang, J. Structural Characteristics of the Yunnan Deashed Lignite and Construction of the Macromolecular Structure Model. ACS Omega 2024, 9, 33594–33605. [Google Scholar] [CrossRef] [PubMed]
  14. Liu, C.; Hong, D.; Zhao, W.; Zheng, F.; Lyu, W.; Lu, J. Transformation simulation of N-containing functional groups in coal pyrolysis and combustion processes by using ReaxFF. Chem. Eng. Sci. 2024, 287, 119709. [Google Scholar] [CrossRef]
  15. Zhao, K.; Tao, S.; Yan, L.; Li, P.; Zhao, Y.; Li, X.; Wang, M.; Wang, J.; Chang, L.; Bao, W. Experimental and simulated analysis for nitrogen migration behavior during coal rapid pyrolysis under Ar/CO2 atmospheres using a free-fall reactor. J. Anal. Appl. Pyrolysis 2025, 186, 106982. [Google Scholar] [CrossRef]
  16. Wang, Z.; Meng, X.; Yang, J.; Chen, M.; Leng, L.; Li, H.; Zhan, H. Co-combustion of brewery spent grain and coal: Optimization strategies and synergistic effects. Energy 2025, 327, 136494. [Google Scholar] [CrossRef]
  17. Paula, S.; Chagas, B.; Pereira, M.; Rangel, A.; Sassi, C.; Borba, L.; Santos, E.S.; Asevedo, E.A.; Camara, F.R.A.; Araujo, R.M. Pyrolysis-GCMS of Spirulina platensis: Evaluation of biomasses cultivated under autotrophic and mixotrophic conditions. PLoS ONE 2022, 17, e0276317. [Google Scholar] [CrossRef]
  18. Ma, Z.; Zhang, Y.; Li, C.; Yang, Y.; Zhang, W.; Zhao, C.; Wang, S. N-doping of biomass by ammonia (NH3) torrefaction pretreatment for the production of renewable N-containing chemicals by fast pyrolysis. Bioresour. Technol. 2019, 292, 122034. [Google Scholar] [CrossRef]
  19. Zhu, H.; Cheng, M.; Xu, J.; Chen, S.; Niu, F.; Yu, D. Nitrogen migration and transformation from ammonia to char during ammonia-coal/char co-pyrolysis. Int. J. Hydrogen Energy 2024, 49, 137–148. [Google Scholar] [CrossRef]
  20. Hong, D.; Yuan, L.; Wang, C.; Wang, H. Insight into the Competitive and Synergistic Effects during Coal/NH3 Cofiring via Reactive Molecular Dynamics Simulations. Energy Fuels 2023, 37, 3071–3082. [Google Scholar] [CrossRef]
  21. Wang, X.; Zhu, Z.; Zhao, J. Subcritical Extraction of Coal Tar Slag and Analysis of Extracts and Raffinates. Appl. Sci. 2025, 15, 2694. [Google Scholar] [CrossRef]
  22. Wang, X.; Zhu, Z.; Li, X. Analysis of the Organic Chemical Fractions of Three Coal Extracts. Appl. Sci. 2024, 14, 8933. [Google Scholar] [CrossRef]
  23. Muñoz-Castells, R.; Sánchez-Suárez, F.; Moreno, J.; Alvarez-Gil, J.; Moreno-García, J. The Effects of Flocculant Yeast or Spontaneous Fermentation Strategies Supplemented with an Organic Nitrogen-Rich Additive on the Volatilome and Organoleptic Profile of Wines from a Neutral Grape Variety. Appl. Sci. 2025, 15, 4196. [Google Scholar] [CrossRef]
  24. Li, Q.; Song, X.; Cao, X.; Wang, H.; Zhang, J.; Wang, S. Interaction between surfactants and hydrophobic associative polymers for oilfield applications. J. Petrochem. Univ. 2013, 26, 52–56. [Google Scholar]
  25. Wang, M.; Jin, L.; Zhao, H.; Yang, X.; Li, Y.; Hu, H.; Bai, Z. In-situ catalytic upgrading of coal pyrolysis tar over activated carbon supported nickel in CO2 reforming of methane. Fuel 2019, 250, 203–210. [Google Scholar] [CrossRef]
  26. Wu, Y.; Li, Y.; Jin, L.; Hu, H. Integrated Process of Coal Pyrolysis with Steam Reforming of Ethane for Improving the Tar Yield. Energy Fuels 2019, 32, 12268–12276. [Google Scholar] [CrossRef]
  27. Kuroki, S.; Nabae, Y.; Chokai, M.; Kakimoto, M.; Miyata, S. Oxygen reduction activity of pyrolyzed polypyrroles studied by 15N solid-state NMR and XPS with principal component analysis. Carbon 2012, 50, 153–162. [Google Scholar] [CrossRef]
  28. Tan, Z.; Ye, Z.; Zhang, L.; Huang, Q. Application of the 15N tracer method to study the effect of pyrolysis temperature and atmosphere on the distribution of biochar nitrogen in the biomass-biochar-plant system. Sci. Total Environ. 2018, 622, 79–87. [Google Scholar] [CrossRef]
  29. Ye, Z.; Liu, L.; Tan, Z.; Zhang, L.; Huang, Q. Effects of pyrolysis conditions on migration and distribution of biochar nitrogen in the soil-plant-atmosphere system. Sci. Total Environ. 2020, 723, 138006. [Google Scholar] [CrossRef]
  30. Pietrzak, R. XPS study and physico-chemical properties of nitrogen-enriched microporous activated carbon from high volatile bituminous coal. Fuel 2009, 88, 1871–1877. [Google Scholar] [CrossRef]
  31. May, H. Pyrolysis of melamine. J. Appl. Chem. 1959, 9, 340–344. [Google Scholar] [CrossRef]
  32. He, Y.; Chen, F.; Han, X.; Zhang, N. Conversion of methyl cinnamic acid into nitrogenous compounds during pyrolysis revealed using 15N isotopic labeling. J. Anal. Appl. Pyrolysis 2024, 178, 106408. [Google Scholar] [CrossRef]
Figure 1. Schematic diagram of the pyrolysis unit.
Applsci 15 06284 g001
Figure 2. Nitrogen-rich tar yields obtained by co-pyrolysis of tar-rich coal and six nitrogen-containing compounds at different temperatures, different pyrolysis times, and different reactant ratios (tar-rich coal: nitrogen-containing compounds). (The green part is the pyrolysis time of 4 min, the ratio of 1:3, and the temperature of 300–800 °C; the blue part is the temperature of 600 °C, the ratio of 1:3, and the pyrolysis time of 5–240 s; the pink part is the temperature of 600 °C, the pyrolysis time of 4 min, and the ratio of 1:1–1:5).
Applsci 15 06284 g002
Figure 3. TIC plots of coal tar ((a): TIC plot obtained using Py-GC/MS. (b): Tar obtained by pyrolysis furnace and TIC plot obtained by GC/MS).
Applsci 15 06284 g003
Figure 4. TIC plots of co-pyrolysis of tar-rich coal with NH4Cl and 15NH4Cl, respectively ((a): TIC plot of co-pyrolysis of tar-rich coal with NH4Cl obtained by Py-GC/MS). (b): TIC plot of co-pyrolysis of tar-rich coal and 15NH4Cl obtained by Py-GC/MS. (c): The tar-rich coal and NH4Cl tar were obtained by pyrolysis furnace, and then the TIC plot was obtained by GC/MS. (d): The tar-rich coal and NH4Cl tar were obtained by pyrolysis furnace, and then the TIC plot was obtained by GC/MS).
Applsci 15 06284 g004
Figure 5. Nitrogen-containing compounds by type as a percentage of total compounds.
Applsci 15 06284 g005
Figure 6. (I) shows the XPS results of four substances (a: tar co-pyrolyzed by tar-rich coal and NH4Cl; b: co-pyrolyzed by tar-rich coal and NH4Cl; c: co-pyrolyzed by tar-rich coal alone, and d is tar-rich coal); (II): the N 1s peak of the b-fit in (I); (III): the N 1s peak of the a-fit in (I).
Applsci 15 06284 g006
Figure 7. Colors of the three solids.
Applsci 15 06284 g007
Figure 8. FTIR spectra of the co-pyrolysis of tar-rich coal and NH4Cl.
Applsci 15 06284 g008
Table 1. Elemental analysis of tar and coke from co-pyrolysis of six nitrogen-containing compounds and tar-rich coal.
SampleN Analysis (wt %)
CharTar
Rich-oil coal0.77-
Rich-oil coal pyrolysis0.741.83
Rich-oil coal and NH4Cl
co-pyrolysis
2.386.49
Rich-oil coal and 5-nitrouracil
co-pyrolysis
2.195.16
Rich-oil coal and chitin
co-pyrolysis
2.464.06
Rich-oil coal and polyaniline
co-pyrolysis
5.746.03
Rich-oil coal and polyamides
co-pyrolysis
4.655.77
Rich-oil coal and melamine
co-pyrolysis
11.617.04
Table 2. Relative contents of various compounds in coal tar pyrolyzed from tar-rich coal.
Type of CompoundMethodAliphatic AlkaneAromatic AlkanePhenolNitrogen CompoundOthers
Rt (%)Py-GC/MS11.4760.2110.965.8511.51
GC/MS17.9750.1812.846.9812.03
Table 3. Comparison of the relative contents of various compounds in NH4Cl and tar from the co-pyrolysis of tar-rich coal (by direct comparison with the NIST 14 database and by isotopic labeling).
Rt (%)
Aliphatic AlkaneAromatic HydrocarbonPhenolNitrogen CompoundOther Compounds
By NIST4.4112.487.7665.1910.16
By isotopic labeling4.5212.487.7666.288.96
Table 4. Retention time, relative abundance, and relative content of 26 possible nitrogen-containing compounds.
Most Likely Nitrogenous CompoundsRetention TimeRelative Abundance aRelative Content b
3-(tert-butyl)-1-methyl-1H-pyrrole4.90123.142.57
2,4,6-trimethylpyridine5.3434.410.59
2,2,5,5-Tetramethyl-4-ethyl-3-imidazoline-1-oxyl5.56493.9011.70
3-hydroxy-2,5-dimethylisonicotinaldehyde6.8108.360.97
4-methylbenzonitrile6.8701.280.81
2-methyl-5-(prop-1-en-2-yl)pyridine7.0912.720.33
2,2,6,6-tetramethylpiperidin-4-one7.211100.0010.97
4-hydroxy-1,6-dimethylpyridin-2(1H)-one7.56328.643.00
5-β,8-β-Epoxy-3,5,8,8a-tetrahydro-1H-2-benzopyran7.9641.780.13
3,5-Dimethylbenzaldehyde thiocarbamoylhydrazone8.4971.870.19
3-methylcyclohex-2-en-1-one O-methyl oxime8.7382.390.42
4-((isopropylimino)methyl)-N,N-dimethylaniline9.1802.360.20
2,2,6,6-tetramethylpiperidin-4-one O-acetyl oxime9.4519.101.24
5-(piperidin-1-yl)furan-2-carbaldehyde9.69211.681.26
3-Ethyl-5,6,7,8-tetrahydroquinoline9.9732.610.24
7-[2,2-dimethoxy-1-propyl]-pyrrolizin-1-one10.0744.060.38
4-(2,6,6-Trimethyl-cyclohex-1-enyl)-but-3-en-2-one oxime11.0985.481.04
2-Acetyldecahydroisoquinoline-3-carbonitril11.9721.950.10
8-ethyl-2-methyl-4-quinolinol12.5341.910.14
12-Azabicyclo [9.2.2]pentadeca-1(14),11(15)-dien-13-one12.93612.132.47
6,7,8,9-Tetrahydro-5-methylisothiazolo [5,4-c]isoquinolin-1(2H)-one13.0664.821.14
1-[3-(3,3-Dimethyl-but-1-ynyl)-2,2-dimethyl-cyclopropyl]-piperazine13.1875.231.66
9-Amino-1,8-Dimethyl-3,6-diazahomoadamantane13.6396.371.12
2-[2-(1-piperidyl)ethyl]-2,4-benzoxazin-1-one16.67216.682.74
2-Methyl-a-Pyrrolidinopropiophenone18.4596.631.38
6,7-dichloro-5-[(1-ethylpyrrolidin-2-yl)methylamino]-1,3-dimethyl- pyrido [2,3-d]pyrimidine-2,4(1H,3H)-dione19.64596.9218.30
a Relative abundance was calculated from abundance ratios using the highest abundance as 100%; b calculated from Equation (1).
Table 5. Relative contents of various compounds in coal tar co-pyrolyzed with tar-rich coal and 6 nitrogenous compounds.
Nitrogen CompoundRt (%)
Aliphatic AlkaneAromatic HydrocarbonPhenolNitrogen CompoundOthers
NH4Cl4.4112.487.7665.1910.16
5-Nitrouracil4.829.2113.2641.7330.98
chitin5.2811.7420.2630.9631.76
polyaniline5.0225.267.4354.218.08
polyamides5.1311.0815.6531.8536.29
melamine4.3212.346.9870.485.88
Disclaimer/Publisher’s Note: The statements, opinions and data contained in all publications are solely those of the individual author(s) and contributor(s) and not of MDPI and/or the editor(s). MDPI and/or the editor(s) disclaim responsibility for any injury to people or property resulting from any ideas, methods, instructions or products referred to in the content.