1. Introduction
As coal mining operations continuously extend to deeper strata, rockburst disasters have become increasingly frequent, presenting a key risk to mine security [
1,
2]. Thick and hard roofs, due to their strong integrity and resistance to collapse, tend to form large-span suspended structures during mining. Under stress concentration or structural failure, these roofs can suddenly release large amounts of stored energy, triggering rockburst events that severely endanger mining operations [
3,
4,
5,
6].
The Hulusu Coal Mine in the Inner Mongolia Autonomous Region is taken as a representative case; the 2-1 coal seam is buried over 600 m deep and even overlain by a 20–30 m thick hard sandstone layer within the upper 100 m, which is intact and difficult to collapse. This leads to the frequent formation of suspended roofs and abnormal stress concentrations, creating typical conditions conducive to rockburst occurrence. Therefore, targeted research into prevention technologies for rockburst induced by tough and thick roofs is highly important in engineering.
In recent years, extensive studies have been conducted domestically and internationally on rockburst control under thick hard roofs. For instance, Mu Zonglong et al. [
7] explored roof weakening by blasting at the Jisan Coal Mine and proposed control strategies to release roof elastic energy through numerical simulations and field experiments. ZHANG et al. [
8,
9,
10] developed mechanical models to reveal the mechanisms of rockburst under thick hard roof conditions. Cheng Lixing et al. [
11] investigated hydraulic fracturing as a method to reduce roof integrity and surrounding rock stress. Lv Runsheng et al. [
12] proposed ground well acid fracturing techniques for pressure relief in overlying thick hard strata. Zheng Kaige et al. [
13,
14,
15] combined physical similarity modeling with mechanical analysis to establish identification methods for rockburst-prone zones in complex thick-roof systems. Pan Junfeng et al. [
16,
17,
18,
19] introduced combined surface and underground deep directional hydraulic fracturing methods, broadening the application range of rockburst prevention techniques. Despite these advances, significant scientific and technical challenges remain in the field of mine blasting for rockburst control. Traditional blasting-based techniques often rely heavily on empirical experience, lacking systematic theoretical frameworks that link geological conditions, mechanical responses, and fracturing outcomes.
While current studies mostly focus on pressure relief in key layers or thick roofs within the main working faces, challenges remain in the implementation and parameter optimization of pressure relief above return airways. These challenges arise from limited working space and difficulties in controlling drilling angles. This study addresses the instability mechanism of rockburst under hard roof conditions in deep roadways and proposes a hydraulic fracturing-based pressure relief technique suitable for thick, hard overburden above return airways. Field validation was conducted in the 21,103 roadway of Hulusu Coal Mine. By designing pressure relief schemes with varying borehole inclinations and using FLAC3D numerical simulations, the influence of pressure relief upon the displacement and stress fields of surrounding rocks was construed to measure the optimum parameter combination under local geological conditions. Multisource monitoring—such as pressure variation in fracturing boreholes, water flow diffusion, and acoustic emission from roof fracturing—was used to assess the relief effect. The study achieved effective energy release and structural stabilization, providing a feasible technical path and theoretical basis for rockburst prevention in similar geological settings.
2. Analysis of Rockburst Manifestation Characteristics
2.1. Engineering Geologic Setting
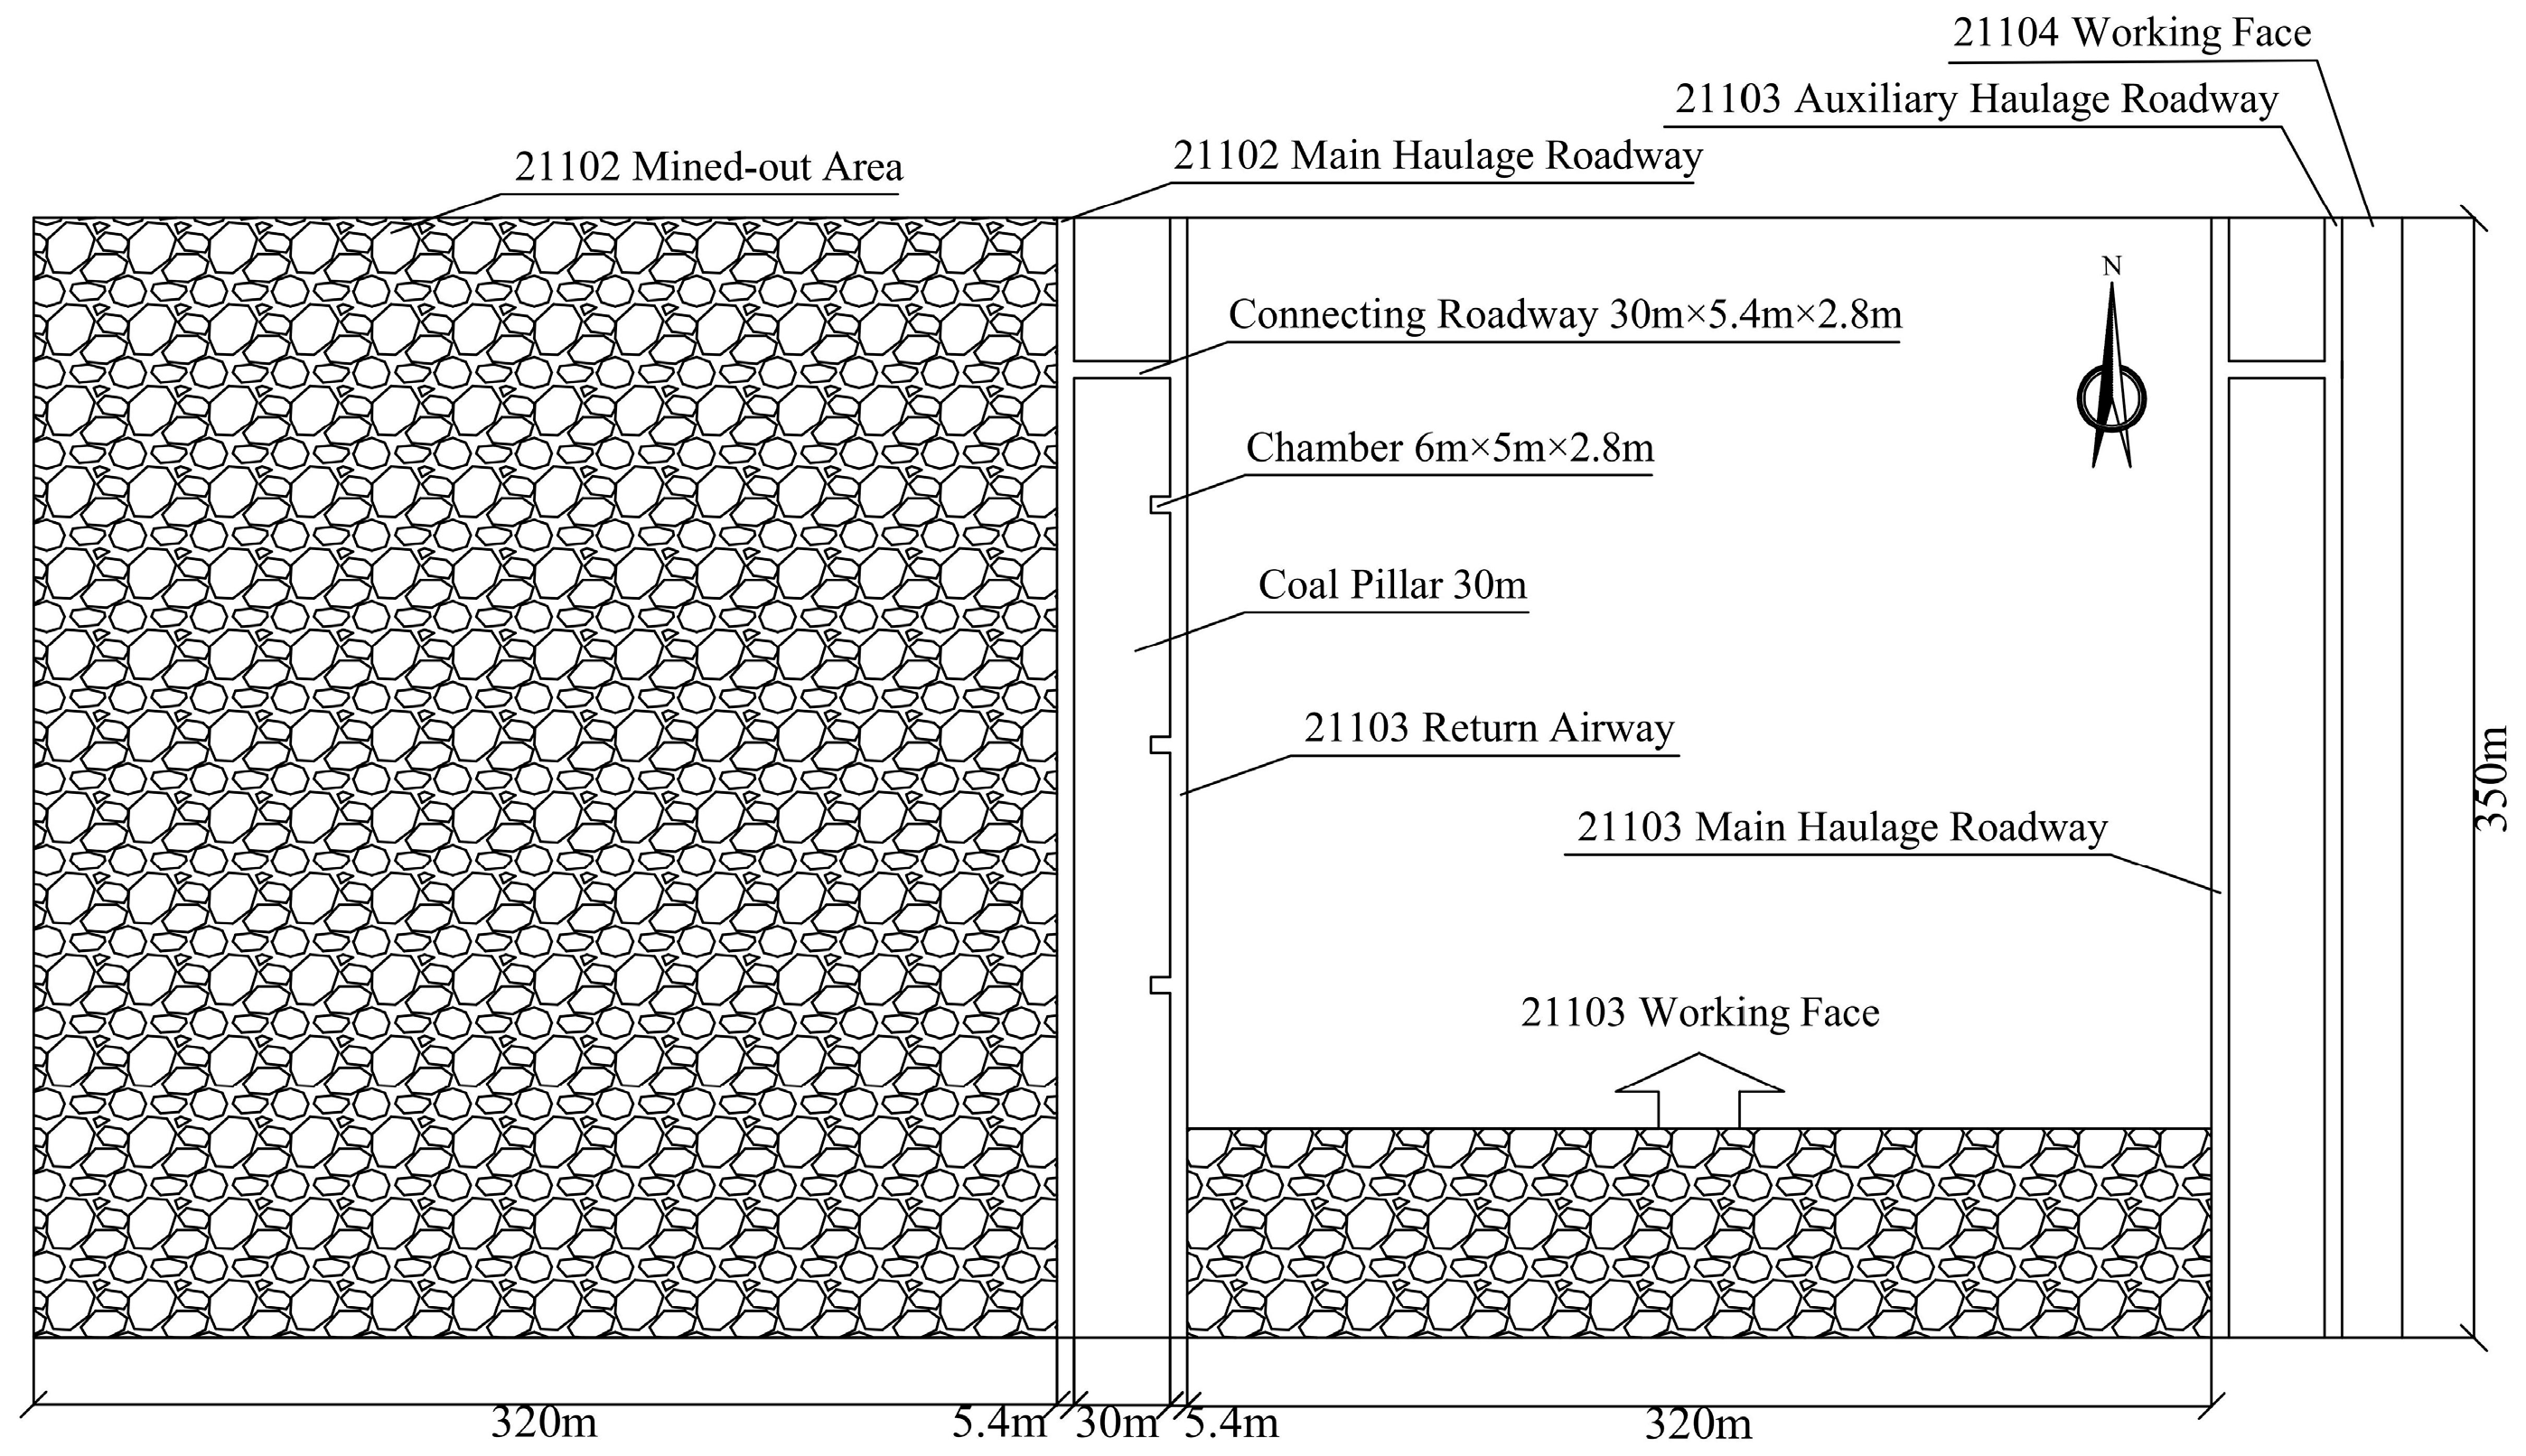
The 21,103 fully mechanized coal mining face at Hulusu Coal Mine is 4637 m high, with a dip length of 320 m and an effective mining length of 4150 m. The thickness of the mean coal seam reaches 2.54 m. The average dip angle of the No. 2-1 coal seam (CS) reaches 3°. The mining operation adopts a fully mechanized one-cut full-height extraction method.
Figure 1 indicated the spatial relationship of the No. 2-1 CS working faces at Hulusu Coal Mine. The left side of the 21,103 operating face adjoins the previously mined-out 21,102 goaf, while the right-side borders the yet-to-be-mined 21,104 working face. The strike direction of the 21,103 face is consistent with the advancing direction, and the dip direction is perpendicular to it. Based on borehole exploration, the stratigraphic section of the No. 2-1 CS was plotted in
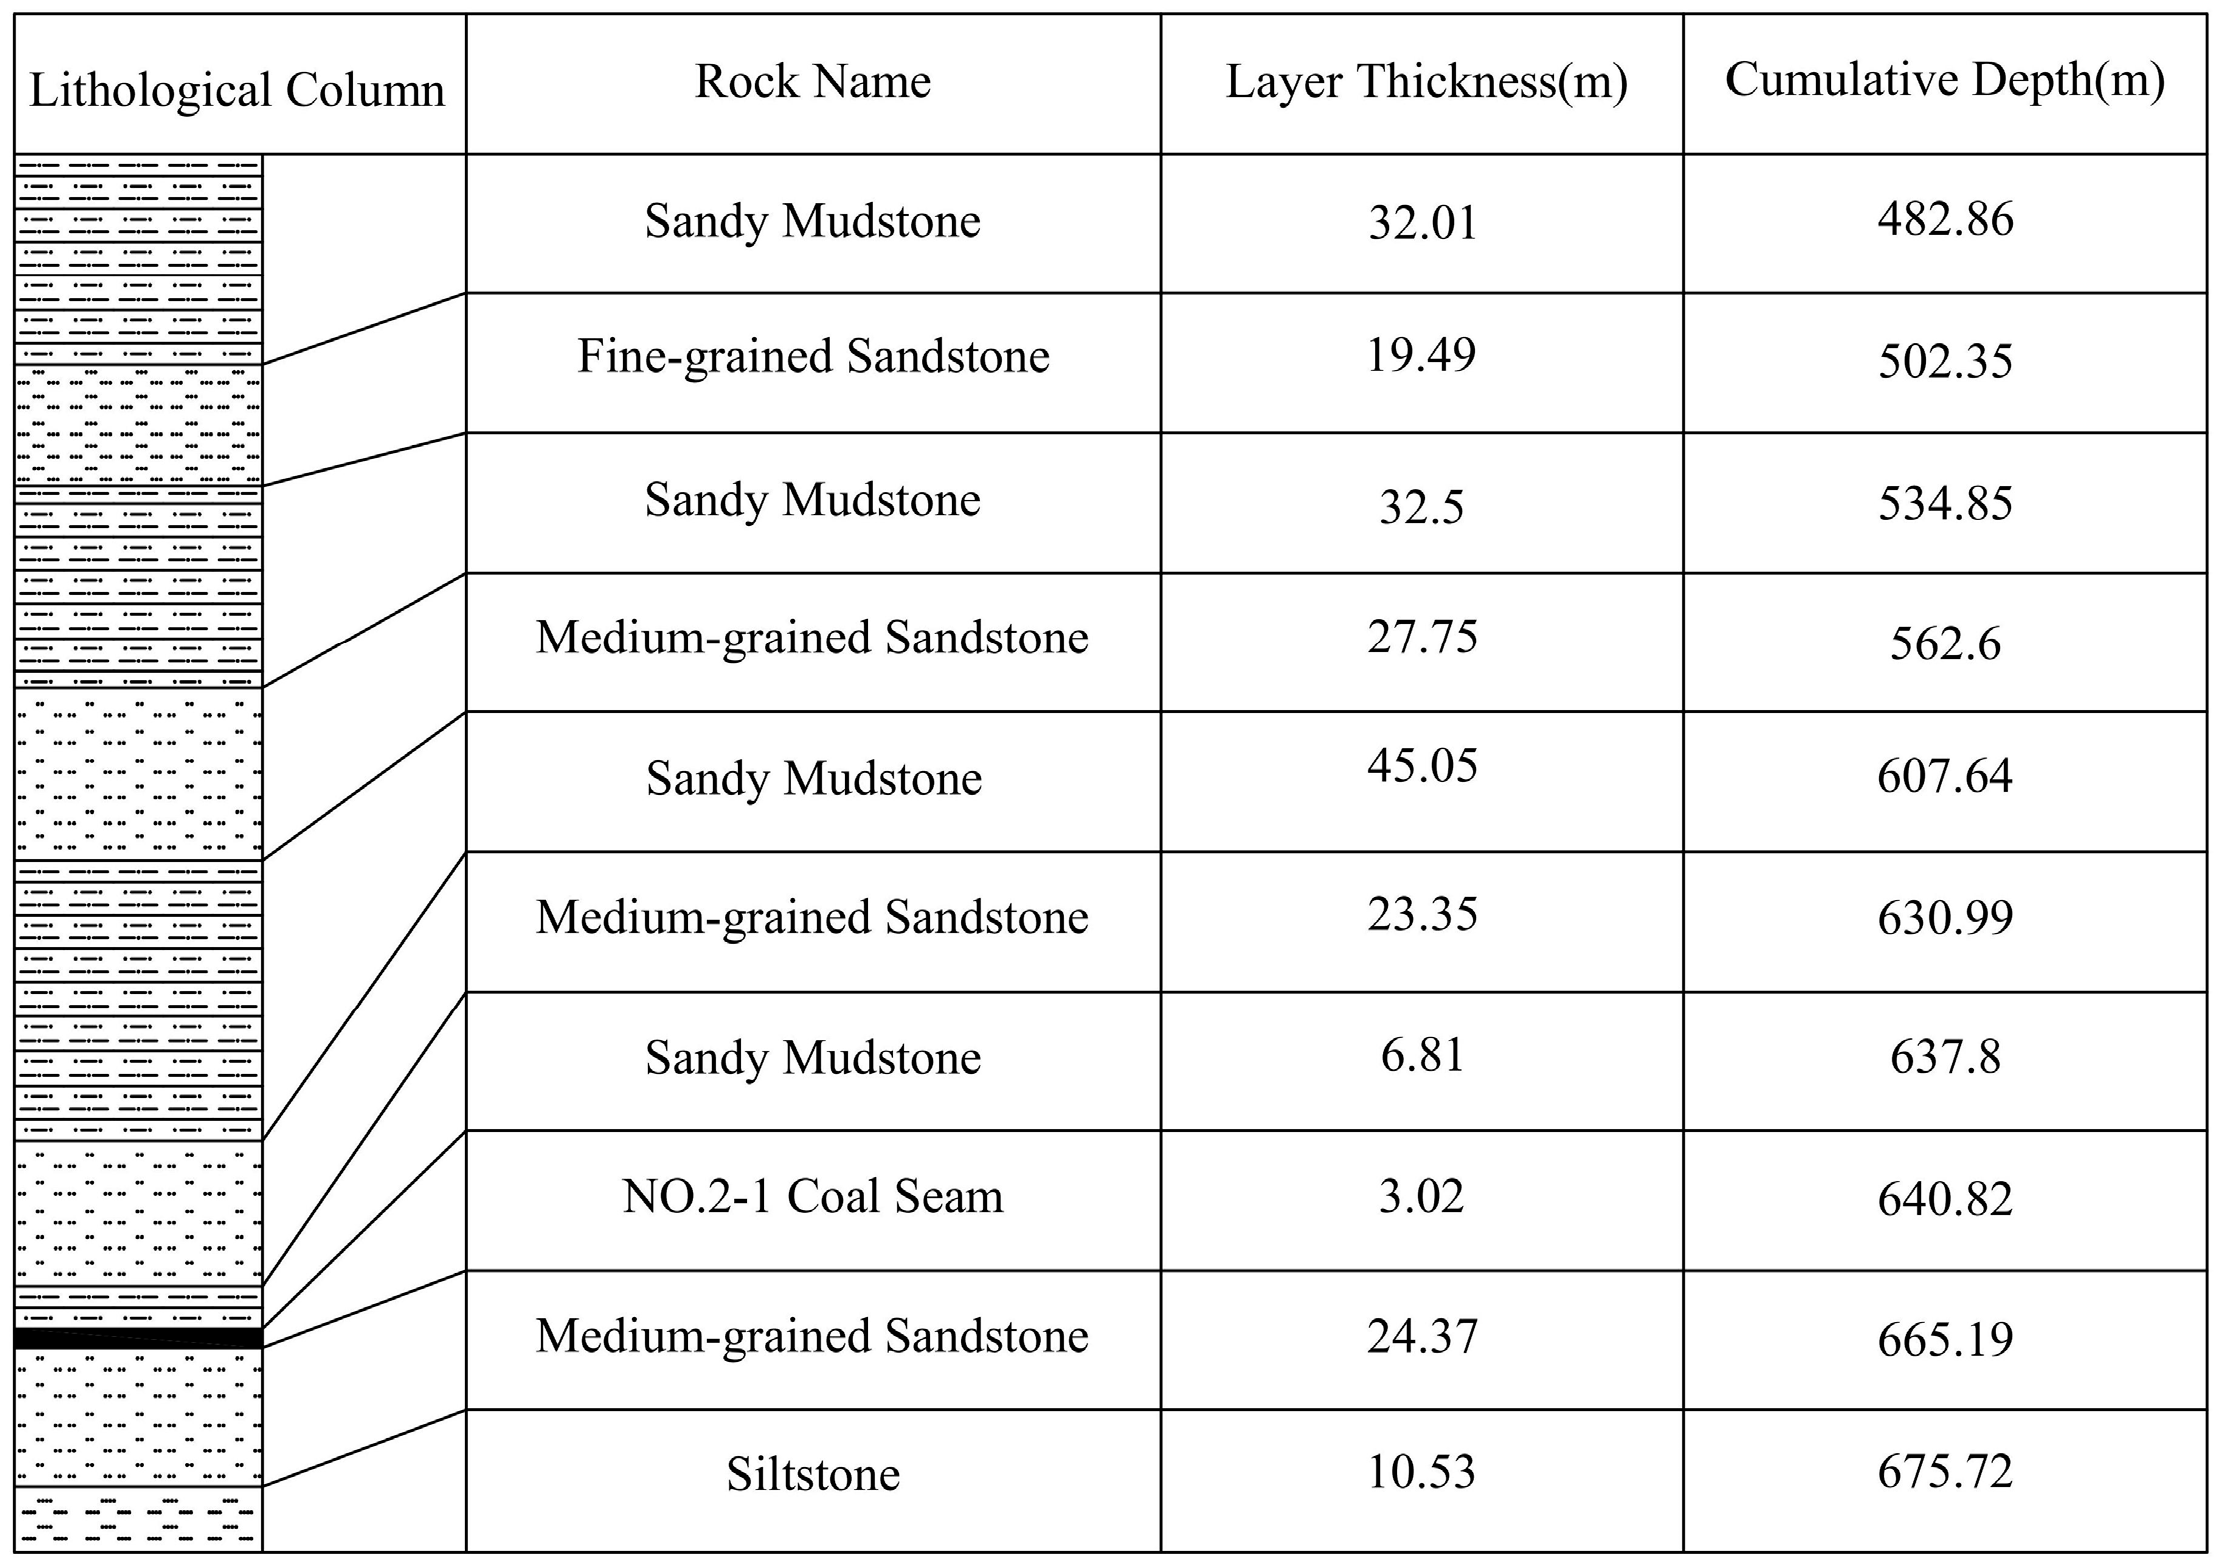
Figure 2. The coal seam lies at a depth of over 600 m, with the overlying strata mainly composed of thick-bedded sandstone and thick-bedded sandy mudstone. These geological features make the 21,103 working face representative of deep coal seams with hard and thick sandstone roofs, which are commonly encountered in western China’s deep mining districts.
2.2. Microseismic Characteristics Analysis
Microseismic events are typically characterized by low energy release (in the order of joules to kilojoules), high frequency, and strong sensitivity to stress changes in surrounding rock masses. Their occurrence often precedes larger-scale dynamic failures such as rockbursts, thus serving as important precursors for early warning. In deep mining environments, especially under thick and hard roofs, the spatial clustering and temporal evolution of microseismic activity can reflect localized stress concentration, crack initiation, and gradual energy accumulation in the rock mass.
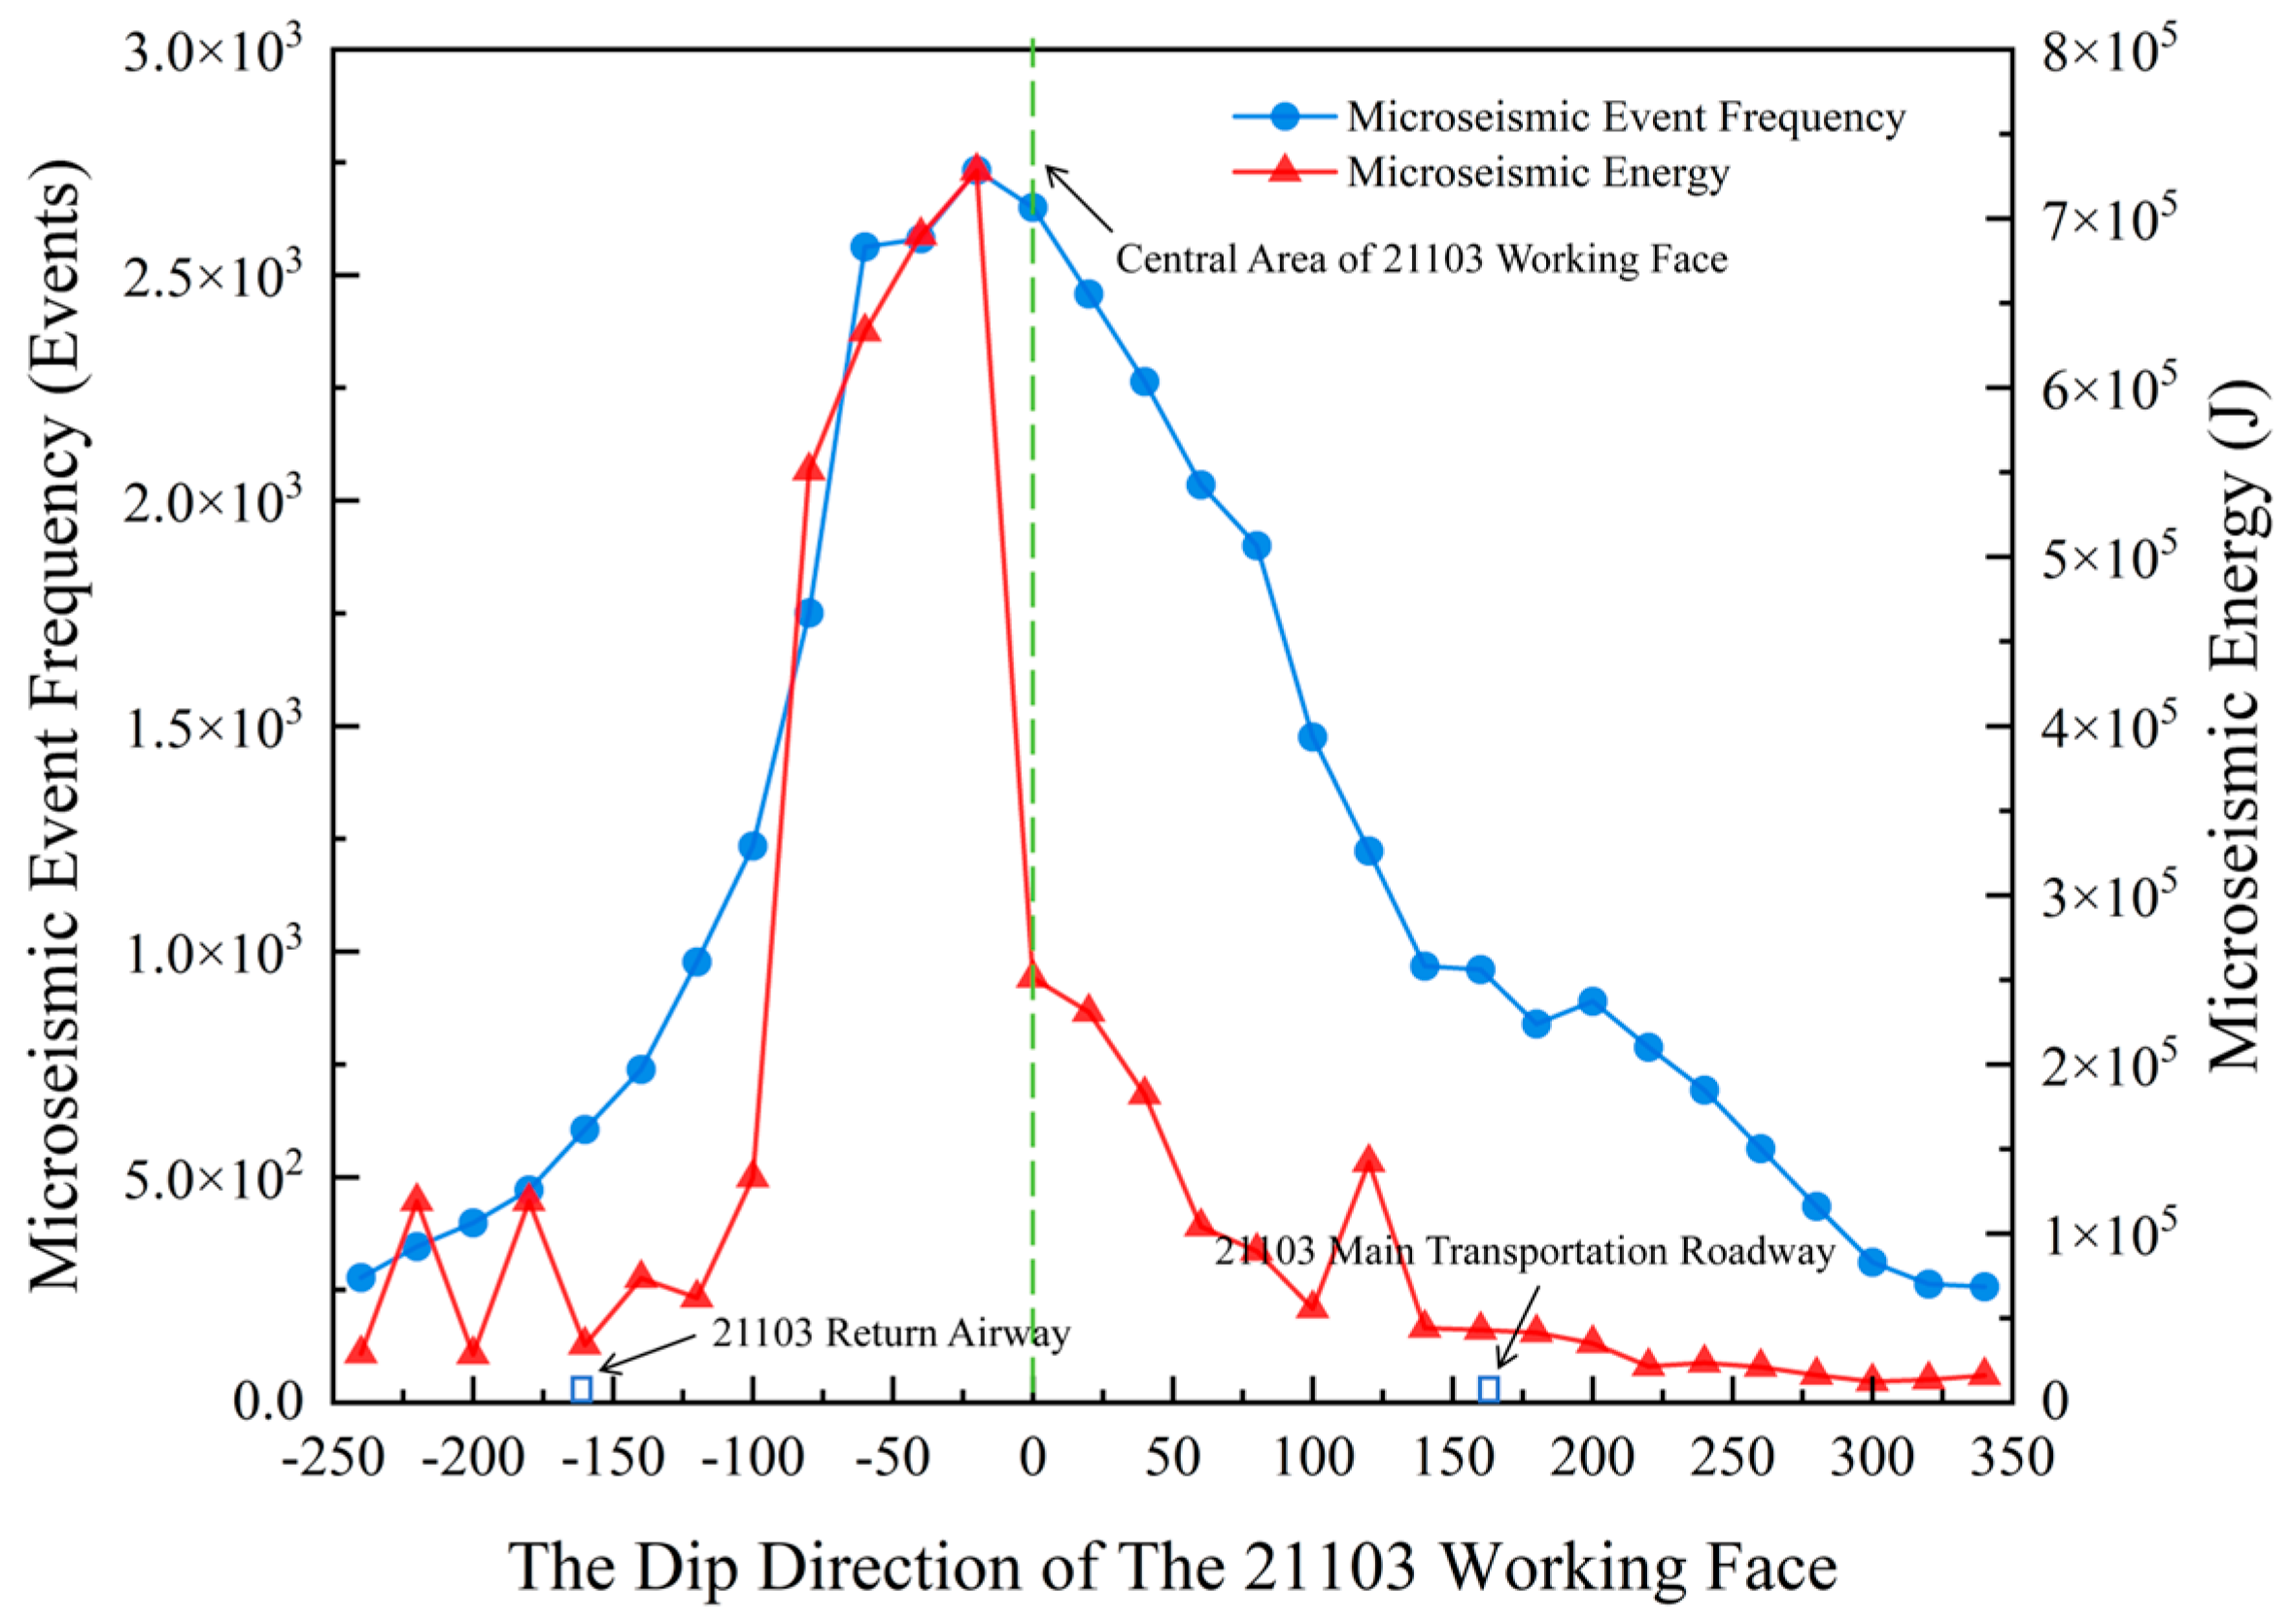
To investigate the distribution characteristics and spatiotemporal evolution of rockbursts in the 21,103 working face, continuous monitoring and data analysis were conducted using a microseismic monitoring system during the face’s operation. The spatial distribution of microseismic event frequencies and energies along the dip and strike directions were plotted, as shown in
Figure 3 and
Figure 4, separately.
In
Figure 3, microseismic events along the dip direction are primarily concentrated between the 21,103 return airway and the adjacent 21,102 goaf. Particularly within the range of approximately 60 m west of the return airway (close to the 21,102 goaf) to 100 m eastward inside the 21,103 working face, the frequency and energy of microseismic events significantly rise, with average values much higher than those in other areas. Over 70% of all monitored events are located in this zone. A noticeable rise in microseismic frequency and energy near the 21,102 goaf indicates the strong influence of the unstable roof structure in the old goaf and the associated stress transfer effects. The “21,103 return airway” region is a high-incidence area of microseismic activity and thus represents a critical zone for rockburst prevention and control. The frequent microseismic activity in this area reflects localized stress concentration and structural instability in the surrounding rock, necessitating enhanced support and monitoring to mitigate potential rockburst hazards.
In
Figure 4, most microseismic events and their associated energy are concentrated within a zone extending from 50 m behind the working face to 300 m ahead. Approximately 80% of microseismic events and over 90% of the total microseismic energy are located within this region, indicating that the active zone of roof movement is mainly situated in front of the operating face. This front region is the principal zone for stress release and rock failure, and thus constitutes the primary region for rockburst hazard control.
In contrast, regions located more than 50 m behind the working face are less affected by mining-induced disturbance and have developed relatively stable goaf structures. Microseismic activity in these zones is significantly reduced, with only sporadic events observed. Some high-energy microseismic events may occur during the compaction of the goaf or due to the sudden failure of overhanging roof structures near the coal pillars, likely caused by stress redistribution in the surrounding rock.
Additionally, approximately 10% of the microseismic events within the 50 m behind the face are associated with immediate roof collapse, rock fragmentation, and basic roof fracturing. In comparison, within the 300 m in front of the operating face, the strata are more prone to crack propagation, rupture, and intense energy release under mining-induced disturbance, making this area the primary danger zone for rockburst disasters. Therefore, it is essential to implement targeted rockburst prevention and mitigation measures in this critical region.
3. Study on the Accumulation Law of Elastic Energy in Deep Hard Roofs and the Mechanism of Impact Instability
When the operating face develops, the initial stress state of coals and surrounding rocks is disturbed, forming a new stress distribution structure. Particularly in the conditions of tough and thick roofs, on account of the high strength, delayed fracture, and strong integrity of the roof strata, large-scale overhanging zones are likely to form under mining disturbances, thereby accumulating substantial elastic energy. The sudden release of this energy can easily trigger severe rockburst disasters.
According to the findings of the former Soviet scholar Avilshin [
20], the elastic energy stored in a coal seam system can be divided into three components: elastic energy from roof bending (
Uw), volumetric deformation (
Uv), and shear deformation (
Uf) [
21]. The total elastic energy aggregated in the CS system can be denoted by Equation (1):
3.1. Theoretical Analysis of Roof Bending Elastic Energy
The roof’s bending elastic energy mainly originates from the bending and subsidence of the hard roof that overhangs the goaf area. The calculation formula is expressed as Equation (2):
In this equation, M signifies the hard roof’s bending moment, and the subscript (φ) denotes the rotation angle on account of the rock layer’s bending and subsidence.
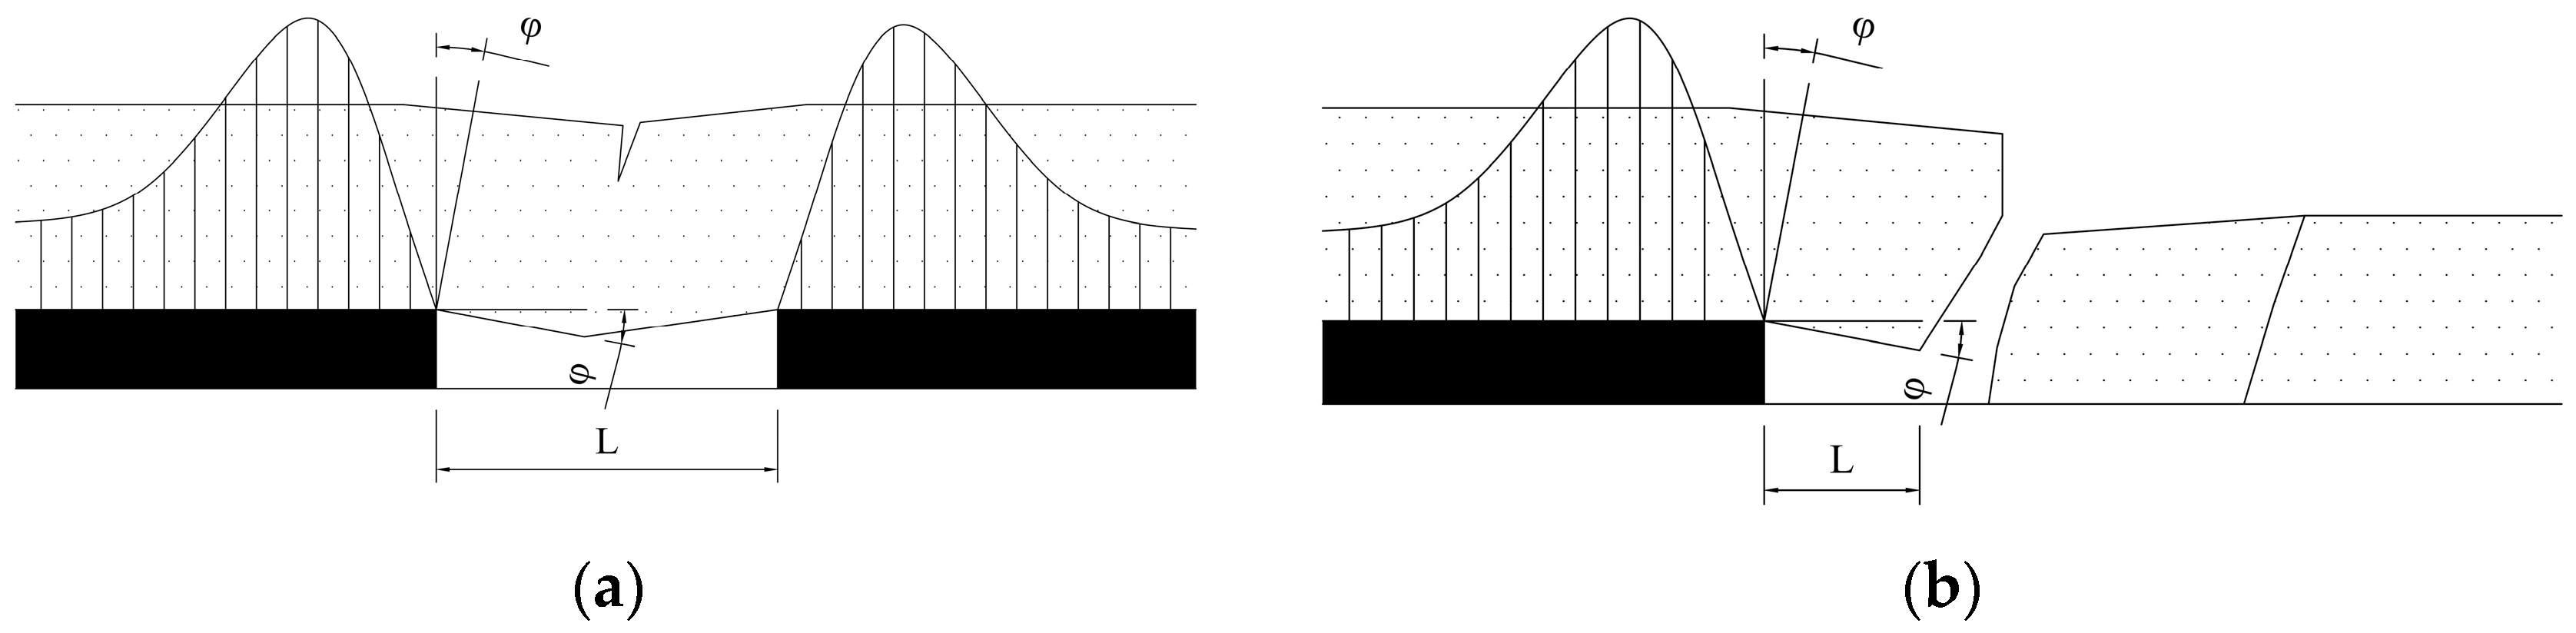
The values of the bending moment and rotation angle can be determined according to different collapse modes. Taking the cases of initial collapse and periodic collapse of the roof as examples, the calculation models for the bending elastic energy under different collapse forms are shown in
Figure 5.
According to the model in
Figure 5a, during the original collapse stage, the roof can be approximated as a simply supported beam under a uniform load with fixed ends. The bending moment and rotation angle are given by Equations (3) and (4), respectively. From the model in
Figure 5b, during the periodic collapse stage, due to the change in the roof span and boundary conditions, the roof can be approximated as a cantilever beam under a uniform load. The corresponding bending moment and rotation angle are expressed by Equations (5) and (6) [
22]. In the equations,
q is the equivalent unit load derived from the roof weight and the overlying strata;
J is the inertia moment of the roof; and
L is the roof’s overhanging length.
3.2. Theoretical Analysis of Volumetric and Shear Elastic Energy
As the mining depth increases, the in situ stress in the coal seam increases accordingly, making the coal and rock mass more prone to accumulating large amounts of elastic energy. Under current mining technology, coal seams with strong burst potential typically have a critical depth for rockburst occurrence.
Based on elastic theory, under triaxial stress conditions without mining influence, the stresses in the coal body can be expressed by Equations (7)–(9). In these equations,
σx denotes vertical stress, and
σy,
σz represent horizontal stresses in two perpendicular directions;
μ is Poisson’s ratio;
γ represents the rock’s unit weight; and
H stands for the depth of mining.
Therefore, the volumetric elastic energy and shear elastic energy can be calculated by Equations (10) and (11), respectively. Here,
E stands for the rock’s elastic modulus.
3.3. Mechanism of Impact Instability in Deep Hard Roofs
By combining the calculation theories for the roof bending elastic energy (EE) and volumetric and shear EE, the total EE during the initial and periodic roof collapse can be expressed by Equations (12) and (13), respectively:
From Equations (12) and (13), it is evident that the total elastic energy of the roof is in direct proportion to the roof’s mining depth and the overhanging length. If the mining is deeper or the overhang is longer, the EE will accumulate more in the roof.
In general, the thicker the rock stratum, the larger the possible overhanging length during rockburst formation. Hard and thick sandstone roofs are difficult to collapse, causing elastic energy to accumulate within the strata. As the working face advances, roof breakage or collapse is prone to induce rockbursts.
Considering the actual mining conditions of the 2-1 CS in the Hulusu Coal Mine—characterized by great depth and thick coal seams—the coal seam is highly susceptible to rockburst, which aligns with the results obtained from microseismic monitoring.
4. Design and Numerical Simulation Analysis of Pressure Relief Scheme for Roof Roadway in Mining Face
4.1. Model Construction and Pressure Relief Scheme Design
FLAC3D (Fast Lagrangian Analysis of Continua in 3 Dimensions) is a finite-difference numerical modeling software widely used in geotechnical engineering for simulating the behavior of soil, rock, and structural support systems under various loading conditions. It is particularly suitable for analyzing nonlinear, plastic deformation and failure of rock masses. In this study, FLAC3D 5.0 was selected due to its robust ability to simulate complex stress redistributions and excavation-induced responses in underground mining environments.
To effectively mitigate the risk of rockburst from the hard roof’s caving during mining operations, the 21,103 operating face roadway of the Hulu Suyuan Coal Mine was chosen as a prototype. A three-dimensional numerical model was constructed using FLAC3D 5.0 with dimensions of 80 m (strike length), 20 m (dip width), and 45.18 m (vertical height). Based on field measurements, the buried depth of the operating face reached 640.82 m. The average rock density was 2500 kg/m
3, corresponding to an initial vertical stress of 16.02 MPa. The vertical stress signified the horizontal stress. The total number of elements in the model reached 576,000. The built-in Mohr–Coulomb constitutive model in FLAC3D was employed to simulate the nonlinear failure behavior of the rock mass. This study aims to investigate the impact of discrepant borehole inclination angles upon stress distribution in surrounding rocks, thus providing a theoretical basis for optimizing pressure relief parameters and guiding field implementation.
Figure 6 displays the model’s diagram.
In
Figure 2, the surrounding rock layers of the 21,103 working face roadway largely consist of medium-grained sandstone and sandy mudstone. According to the measured mechanical parameters of coal and rock strata, the parameters for each layer are calibrated as shown in
Table 1.
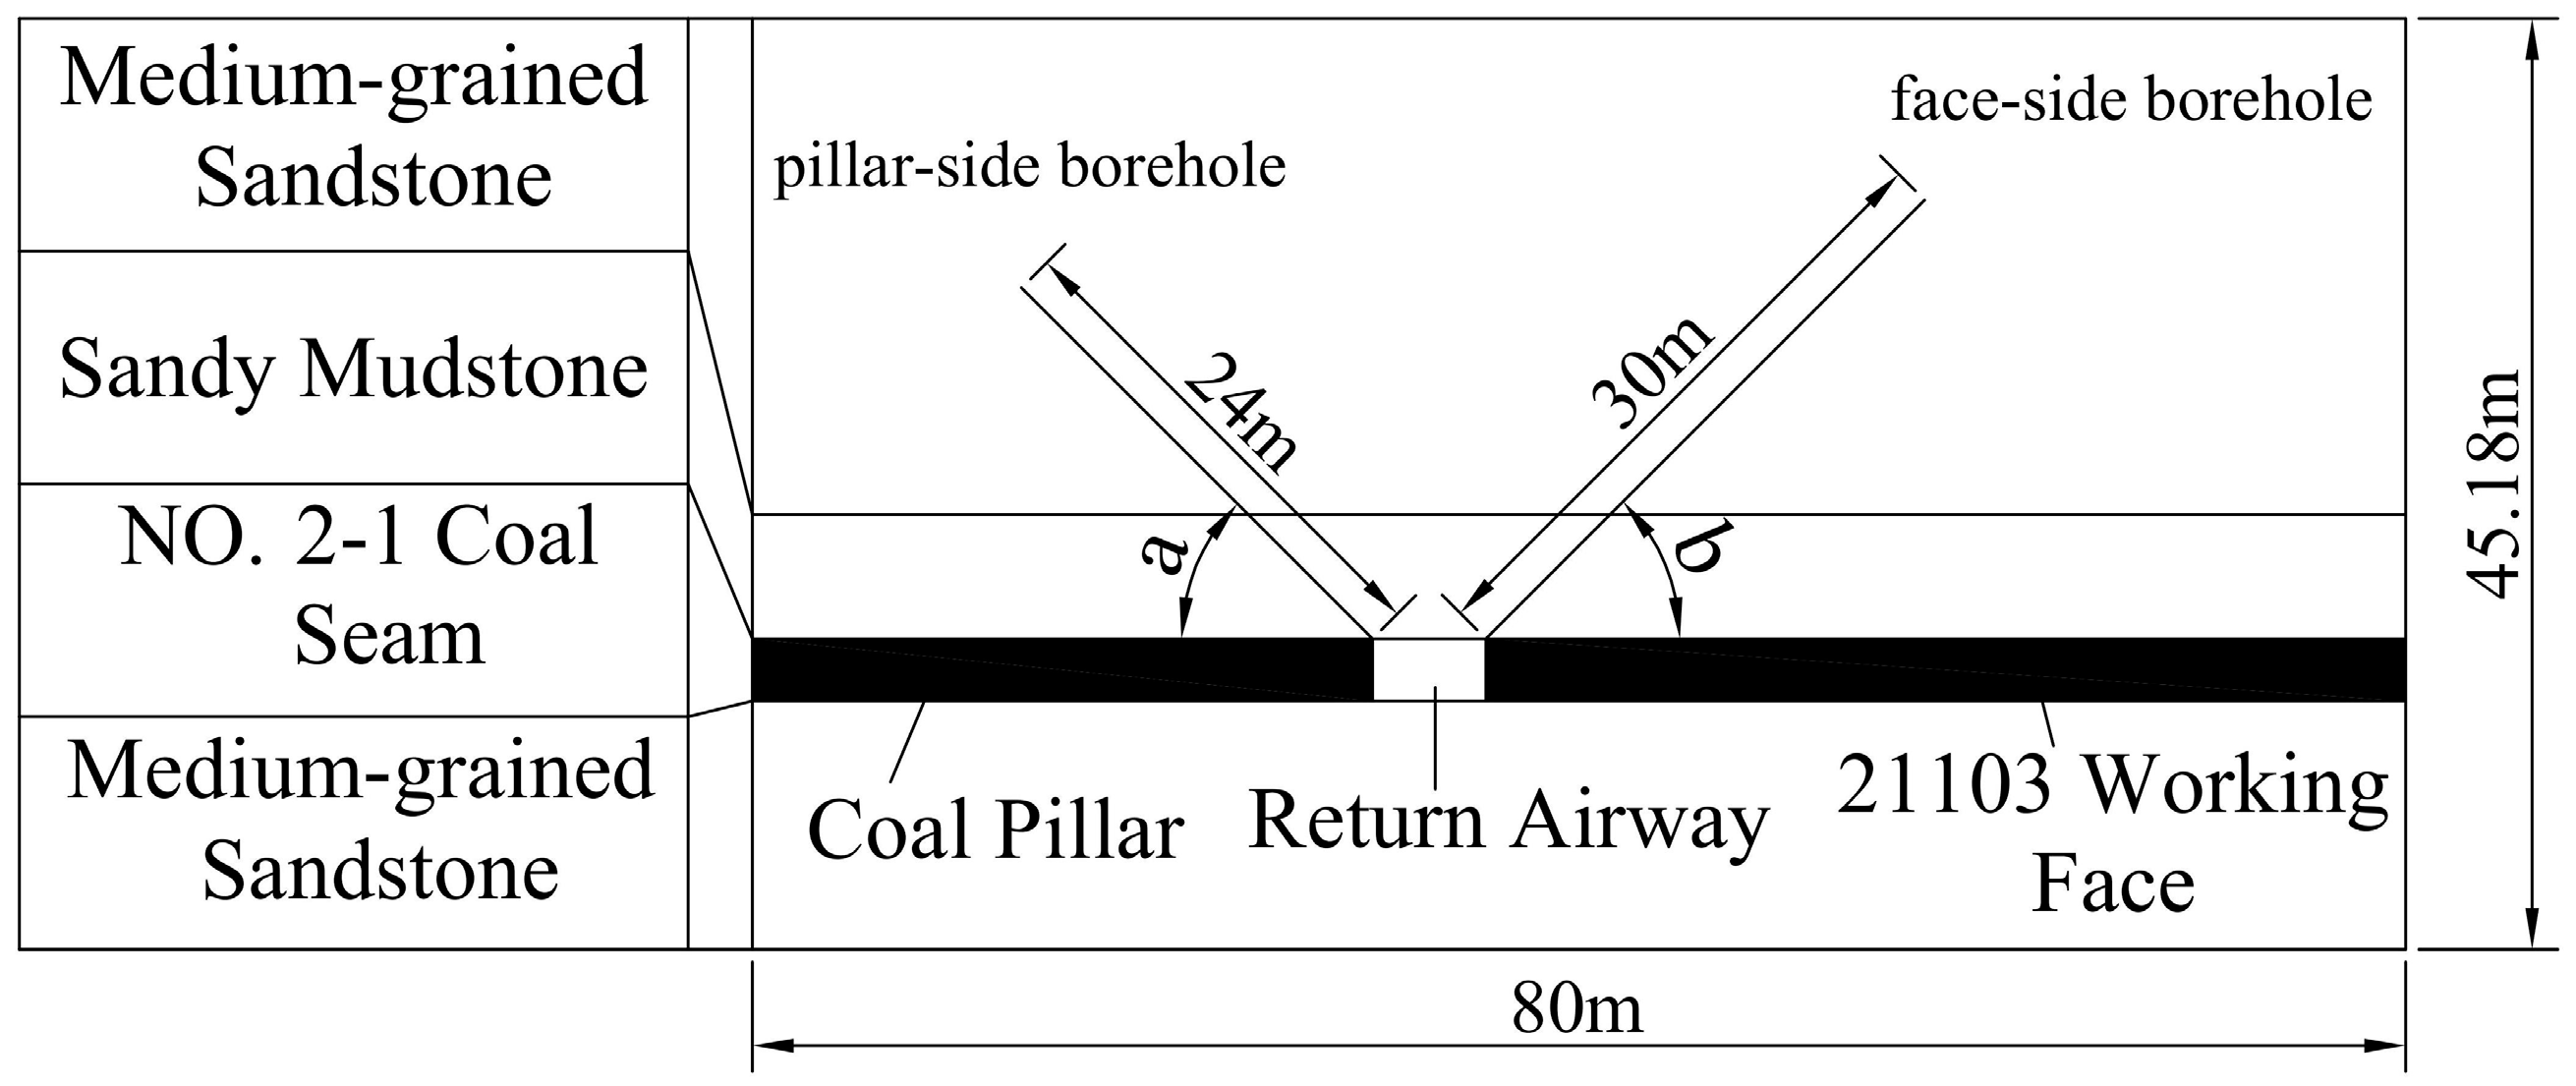
Based on laboratory physical simulation and ground pressure monitoring information, the roof’s caving height in the 21,103 operating face ranges from approximately 11.3 to 21.2 m. Therefore, hydraulic fracturing boreholes must penetrate the main bearing section of the hard roof. The vertical depth of boreholes on the coal pillar should exceed 11 m. On the working face side, it should exceed 20 m to reach more than two-thirds of the hard roof thickness.
Figure 7 and
Table 2 illuminate the hydraulic fracturing pressure relief model and the nine numerical simulation schemes, respectively.
4.2. Analysis of Rockburst Manifestation in Roadway Surrounding Rock
4.2.1. Stress Distribution Characteristics Under Different Schemes
To assess the impact of roof hydraulic fracturing on stress distribution among roadway-surrounding rocks, nine schemes with different borehole dip angles were simulated using FLAC3D.
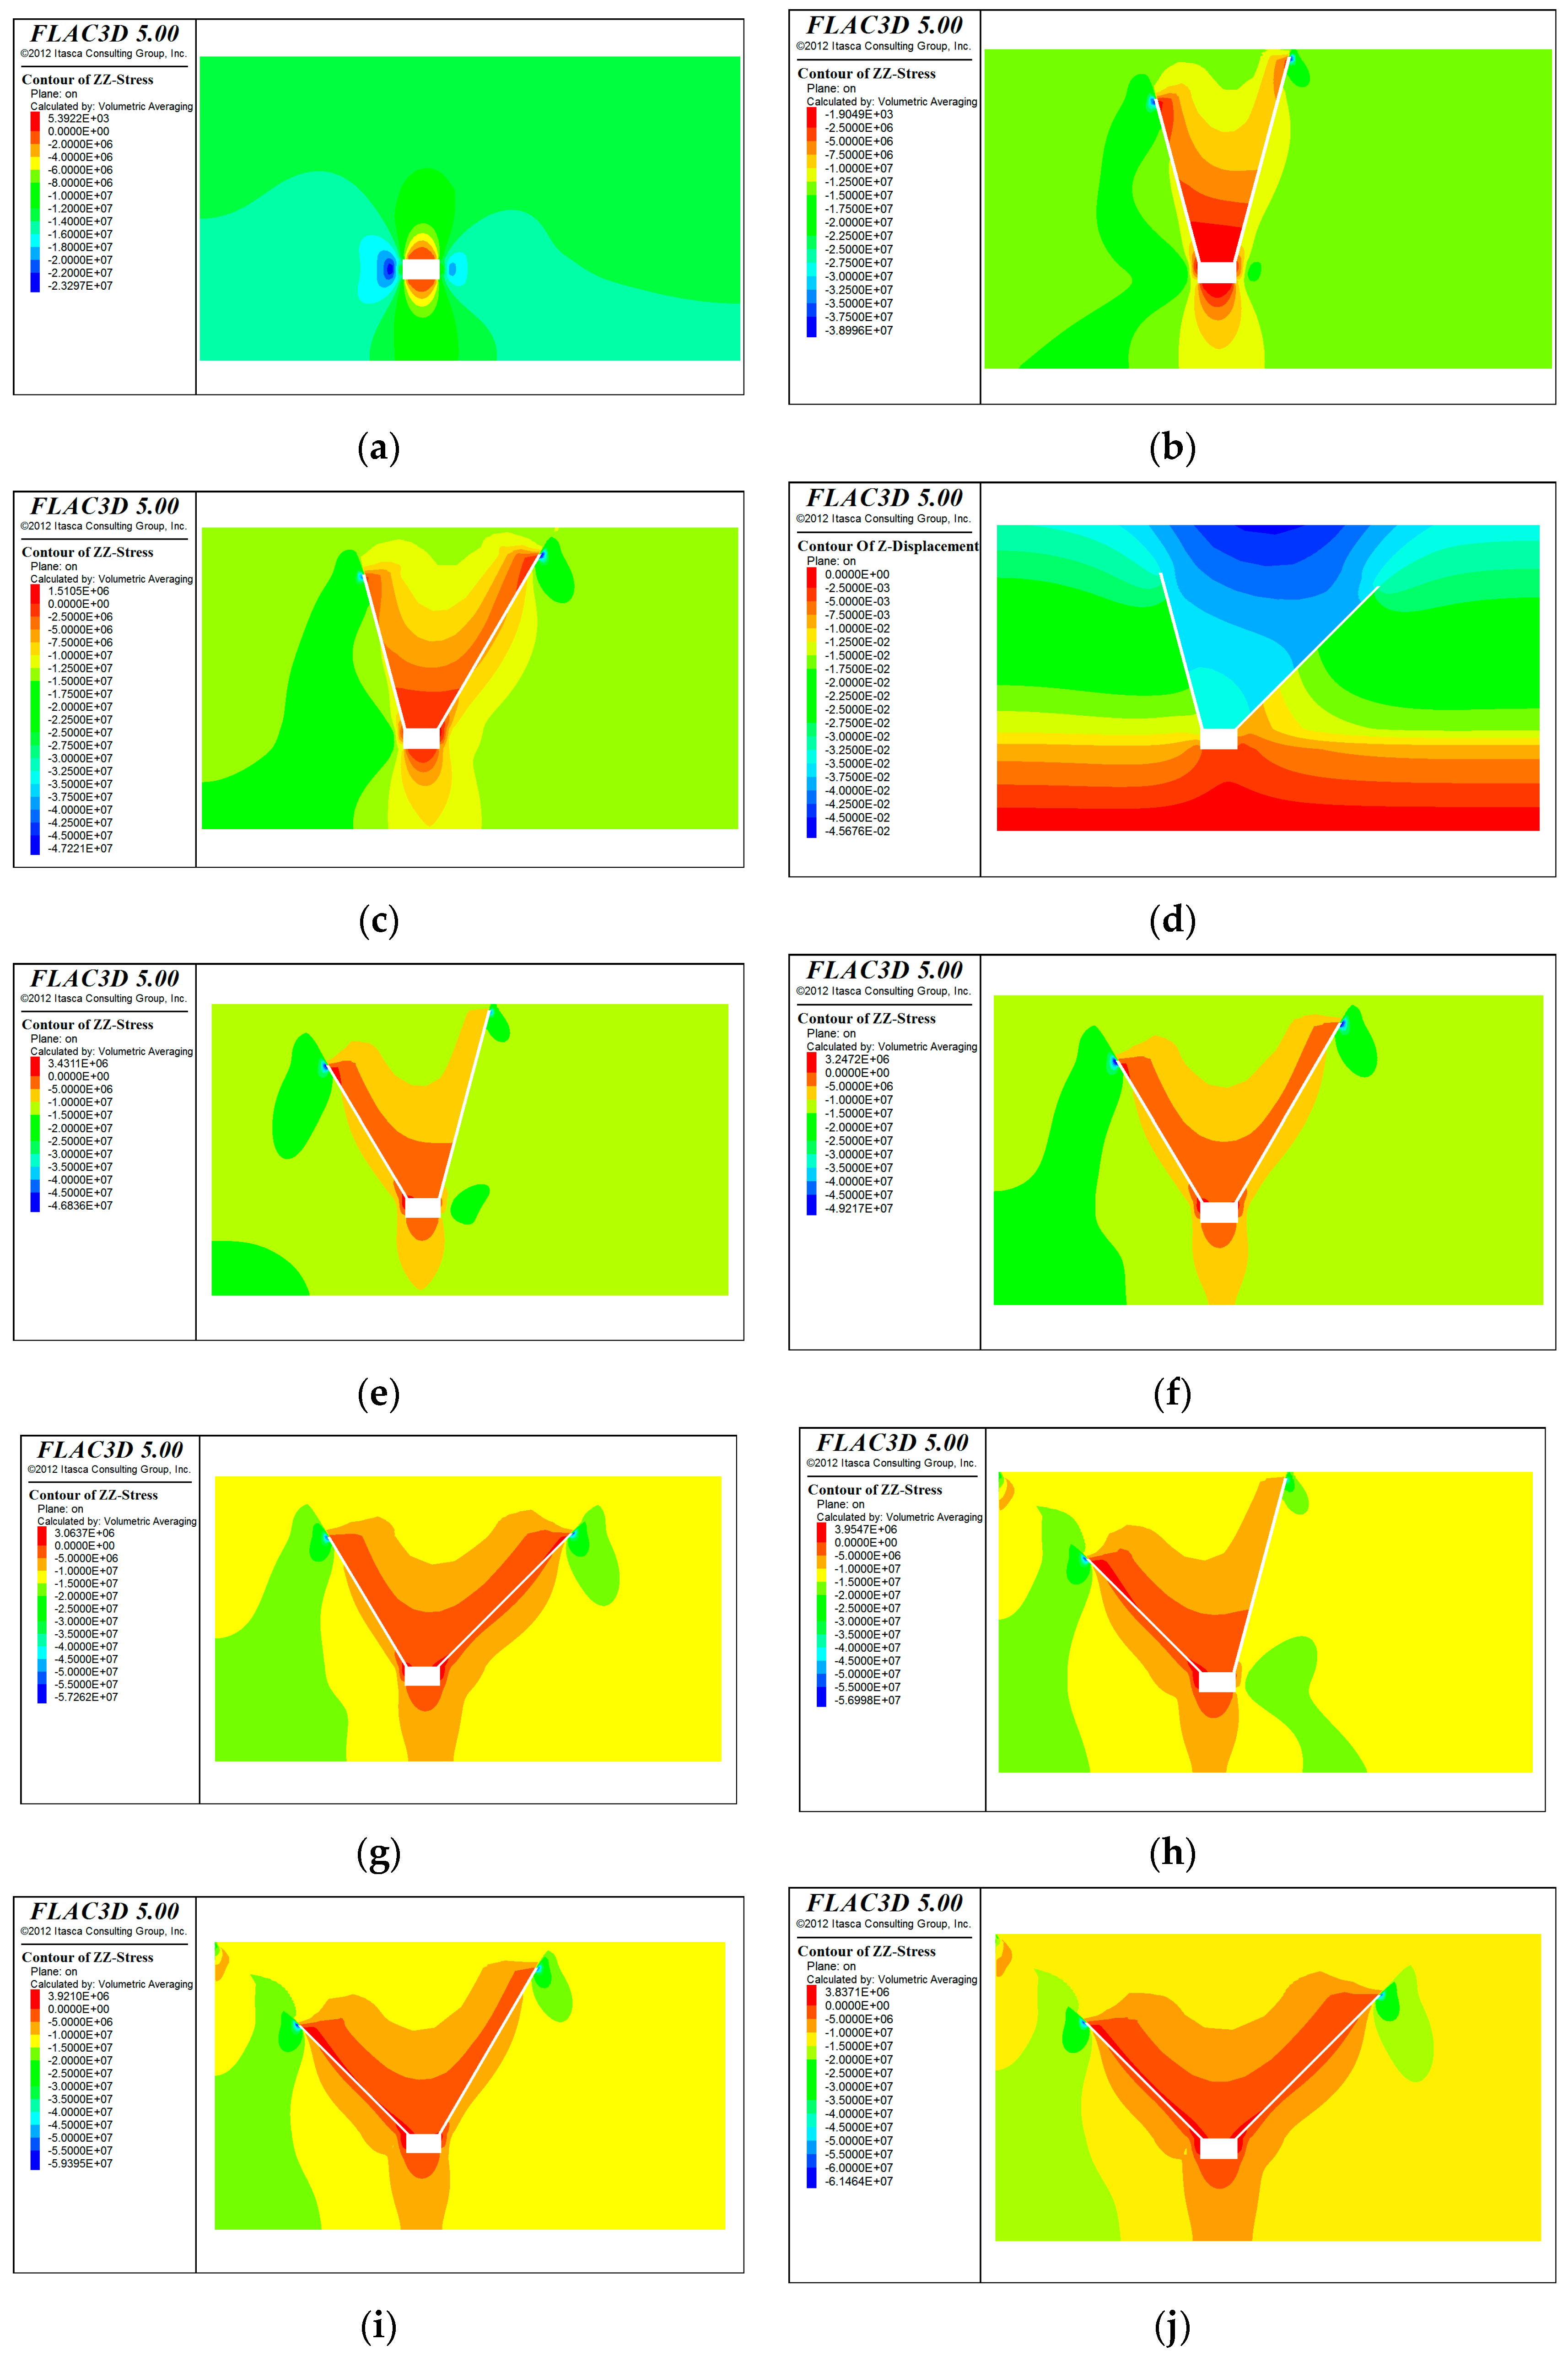
Figure 8 indicates the vertical stress contour maps in the xz-plane.
As seen in
Figure 8a, significant stress concentration occurs on the roadway’s two sides, particularly on the coal pillar, where the stress ranges between 19 and 23 MPa due to loading from the thick un-caved overburden of the adjacent 21,102 working face. In contrast, the face side exhibits a stress range of 13.8–18.9 MPa, indicating influence from the goaf and long-range stress transmission.
Figure 8b–j show the stress distributions for the nine schemes. All pressure relief configurations reduced stress concentration to varying degrees. Notably, Scheme 9 (borehole dip angle 45°) had the most pronounced effect, reducing the peak stress to 9.78 MPa (pillar side) and 8.07 MPa (face side), achieving a reduction exceeding 60%. This suggests that inclined boreholes effectively release the stress under roof self-weight conditions.
4.2.2. Displacement Field Evolution
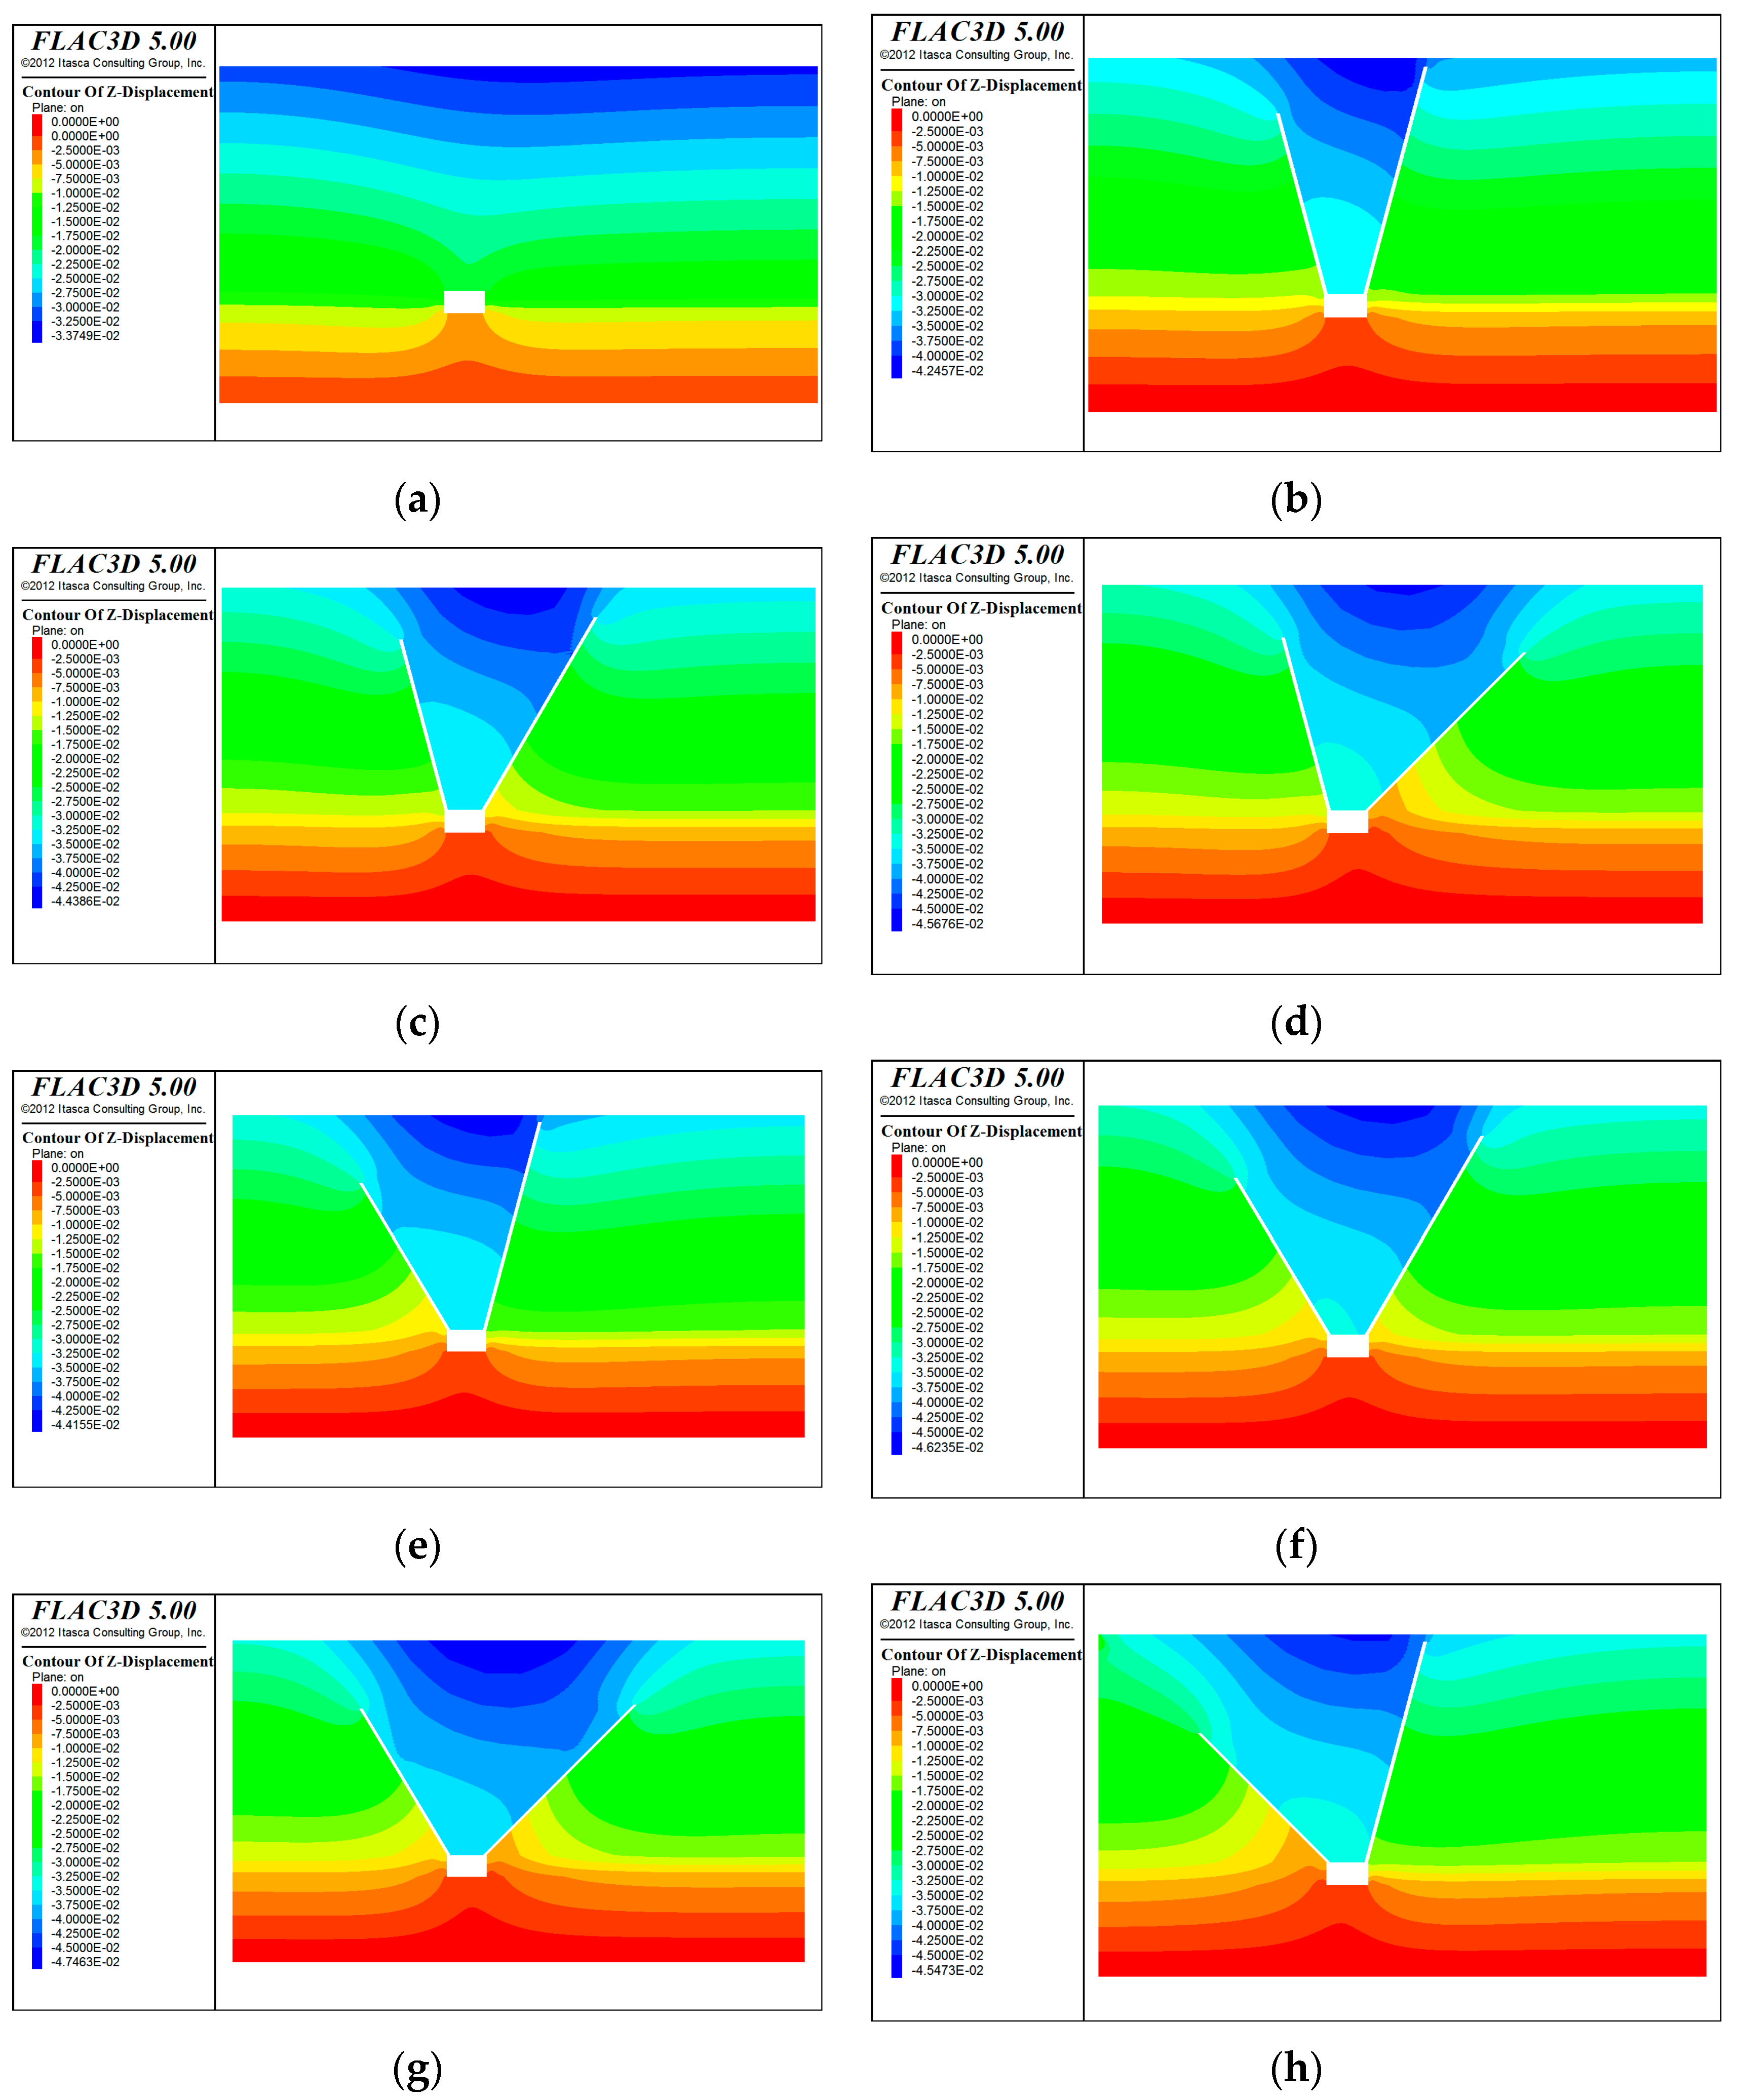
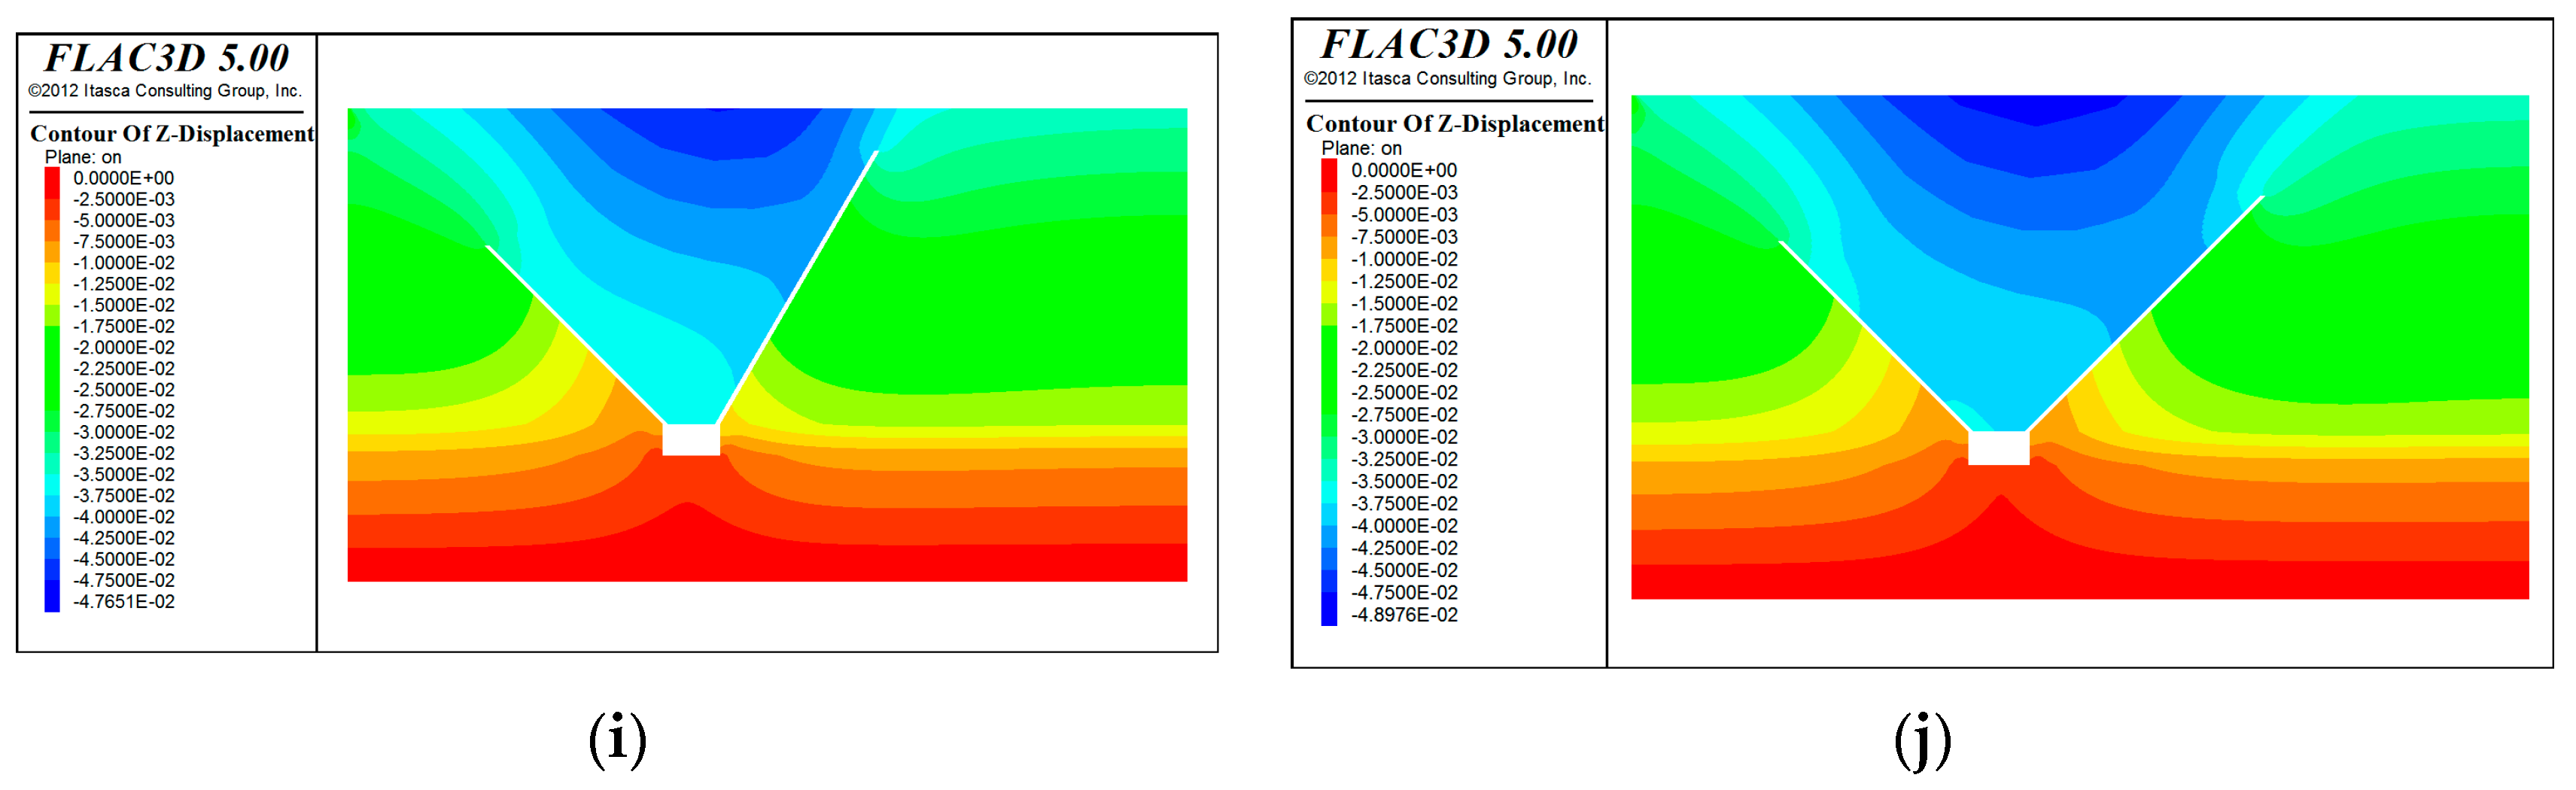
To evaluate roadway stability post-fracturing, the displacement fields under each scheme were analyzed and compared in
Figure 9.
Displacement was greatest at the roof and sidewalls in the unrelieved case. All pressure relief schemes significantly reduced deformation. Scheme 9 achieved the smallest roof subsidence—0.67 cm (pillar side) and 0.63 cm (face side)—demonstrating the best stabilization effect.
4.2.3. Plastic Zone Evolution Characteristics
To further examine plastic failure behavior, the plastic zone development in the xy-plane under different schemes was compared.
Figure 10 displays the outcomes.
As shown in
Figure 10a, without any pressure relief measures, the plastic failure areas on the roadway’s two sides are mainly distributed approximately 1.5 m to 2.0 m from the sidewalls, where initial shear failure of the surrounding rock has occurred. This indicates that under the influence of mining-induced stress, local regions have entered an intense plastic stage, showing a clear tendency toward instability. At this stage, internal stresses in the surrounding rock remain unreleased, which may lead to energy accumulation and further roadway damage.
From
Figure 10b–j, it is evident that after implementing hydraulic fracturing pressure relief measures, the extent and distribution of plastic zones in the surrounding rock change significantly, displaying varying degrees of expansion and evolution.
In Scheme 1, the plastic zone extended to a range of 3.5–5.5 m. Although the extent of failure increased, the distribution was uneven and the degree of fracture development remained weak. Scheme 2 exhibits further expansion of the plastic zone to 5.5–6.5 m, with improved fracture connectivity indicating enhanced pressure relief effectiveness. Schemes 3 and 4 both display plastic zones extending from 2.0 to 10.0 m, characterized by relatively continuous failure regions. This suggests that the hydraulic fractures had formed well-connected channels within the roof structure, thereby facilitating efficient stress release. In Scheme 5, the plastic failure zone was concentrated within the 2.5–8.5 m range, with a deeper concentration of damage likely due to an unfavorable fracture propagation direction that limited lateral pressure relief. Scheme 6 demonstrates the smallest plastic zone, confined to 4.0–4.5 m, indicating that fracture development paths were restricted and effective pressure relief channels could not be formed. Scheme 7 shows a plastic zone between 2.5 and 10.0 m, with a relatively balanced distribution. Scheme 8 produces the widest plastic zone, reaching 4.0–12.0 m. However, regions of intense failure were observed, raising concerns regarding potential structural instability. In contrast, Scheme 9 results in a concentrated plastic zone within the 8.5–12.5 m range, without the emergence of new high-intensity failure areas. This indicates that the fracture network had fully developed, stress had been adequately released, and the surrounding rock had reached a relatively stable state. These results suggest that Scheme 9 offers the most favorable plastic zone evolution, achieving effective stress dissipation while avoiding widespread plastic damage to the surrounding rock, thus providing strong pressure relief protection for both sides of the roadway.
4.3. Manifestation Law of Rockburst on Both Sides of the Roadway
4.3.1. Analysis of Vertical Stress Distribution on Both Sidewalls Under Different Schemes
Vertical stress distribution along the roadway’s strike direction was simulated for each scheme. The vertical stress curves for the coal pillar side and working face side under different schemes are shown in
Figure 11, and the peak vertical stresses are listed in
Table 3.
As illustrated in
Figure 11 and
Table 3, the peak vertical stress on the coal pillar and working face sides is 24.7 MPa and 20 MPa, respectively, under the no-relief condition. After applying hydraulic fracturing, the peak stresses on both sides are significantly reduced, indicating the efficacy of hydraulic pressure relief in undermining the concentrated roof load on the surrounding rock.
Among all schemes, Scheme 9 demonstrates the most substantial reduction in vertical stress, decreasing to 9.78 MPa on the coal pillar and 8.07 MPa on the operating face—reductions of 60.4% and 59.7%, respectively, compared to the no-relief state. Overall, a borehole inclination of 45° results in the best fracturing effect, suggesting that this angle is favorable for crack propagation along preferential planes, significantly alleviating stress concentration among surrounding rocks.
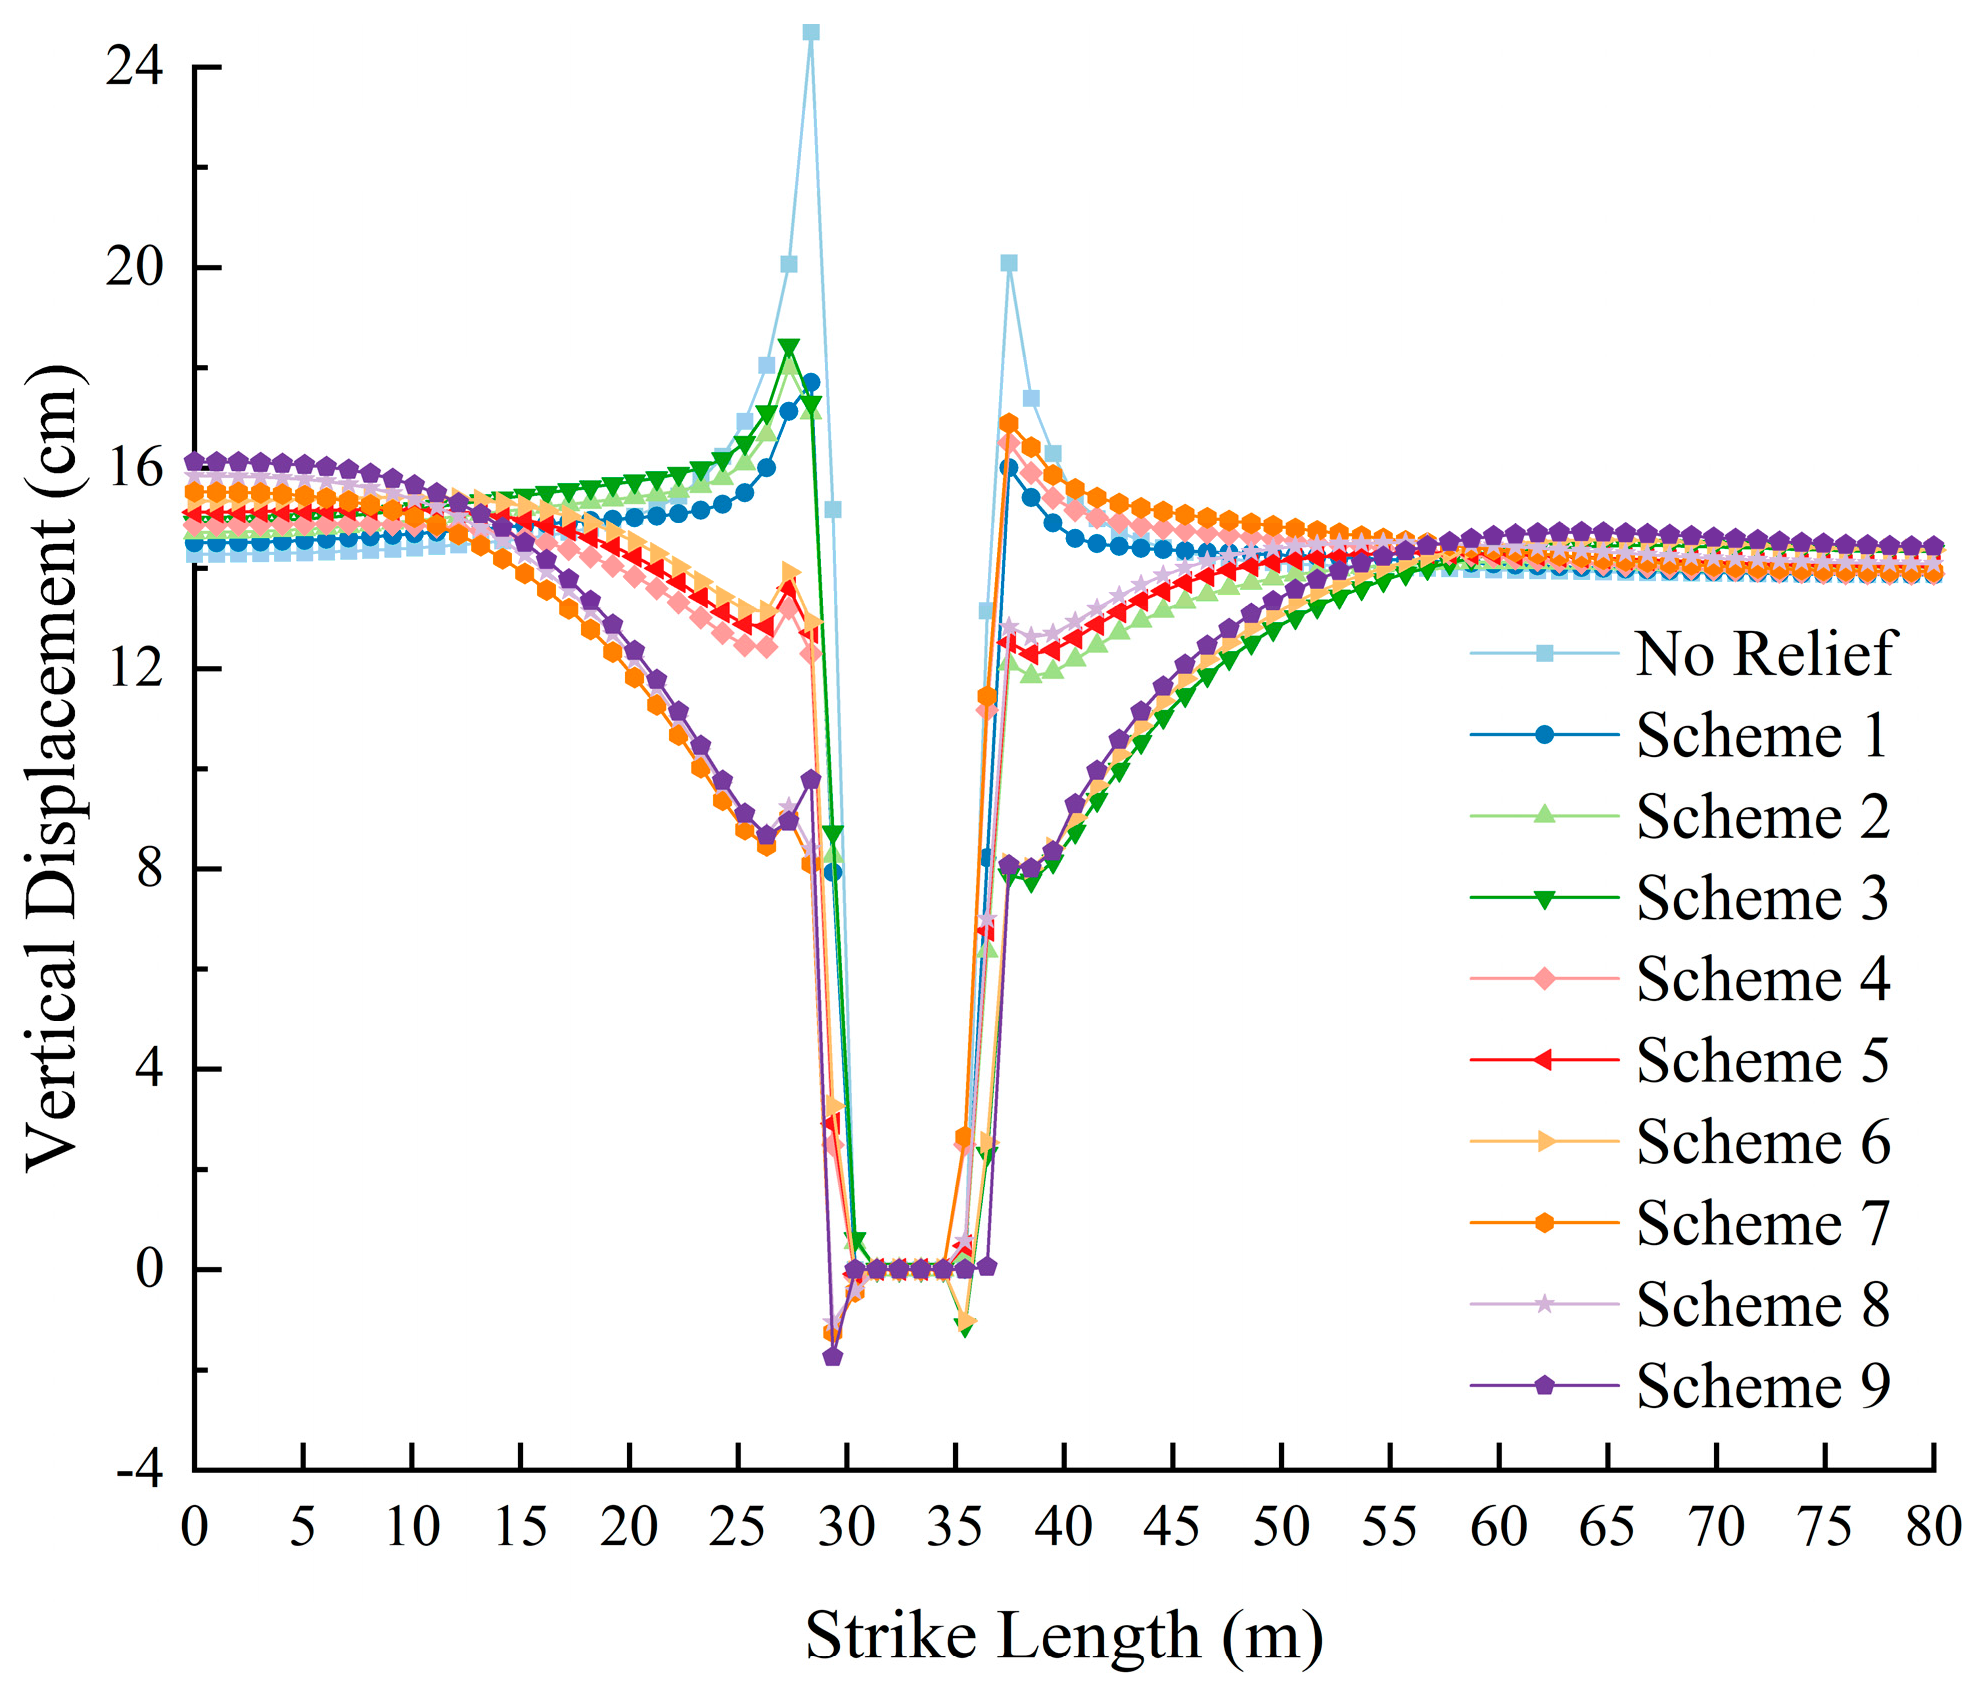
4.3.2. Analysis of Vertical Displacement Evolution of Both Sidewalls Under Different Schemes
Vertical displacement serves as a direct indicator of surrounding rock softening and pressure relief efficacy, and it is also an important metric for evaluating potential rockburst intensity. Simulated vertical displacement curves for both the coal pillar side and the working face side under various schemes are presented in
Figure 12, and the maximum subsidence values are summarized in
Table 4.
As shown in
Figure 12 and
Table 4, under the no-relief condition, the maximum subsidence on the coal pillar and the operating face reaches 1.14 cm and 1.18 cm, respectively, with a symmetric displacement pattern. After hydraulic fracturing, deformation is mitigated to varying degrees across schemes. Scheme 9 yields the lowest maximum subsidence values—0.67 cm and 0.63 cm—representing a reduction of approximately 44% relative to the initial state, which further validates the efficacy of hydraulic fracturing in redistributing the surrounding rock stress.
Combining the vertical stress distribution and displacement evolution characteristics, hydraulic fracturing of the roof effectively forms a decompression zone on both the coal pillar and working face sides, releasing stored bending elastic energy in the surrounding rock. Notably, the 45° borehole inclination facilitates crack propagation along bedding and structural weak planes, achieving optimal pressure relief pathways. This method not only reduces the concentration of high stress in the roadway’s surrounding rock but also offers a potential solution to issues posed by thick, hard, and difficult-to-collapse roofs, thereby holding significant engineering value for improving rockburst disaster prevention.
5. Study on the Pressure Relief and Control Effect of Roof Hydraulic Fracturing in Return Airways
To verify the pressure relief effectiveness and practical feasibility of Scheme 9 under actual engineering conditions, a field experiment of roof hydraulic fracturing was conducted in the 21,103 Return Airway of the 2-1 CS at the Hulusu Coal Mine. Through comprehensive monitoring and analysis of water pressure evolution, water flow distribution characteristics, and acoustic emissions from roof fracturing, the stress regulation and fracture connectivity performance of the fracturing scheme were systematically evaluated. The results provide both a theoretical basis and practical guidance for the pressure relief and control of hard, thick roof structures in similar deep return airways.
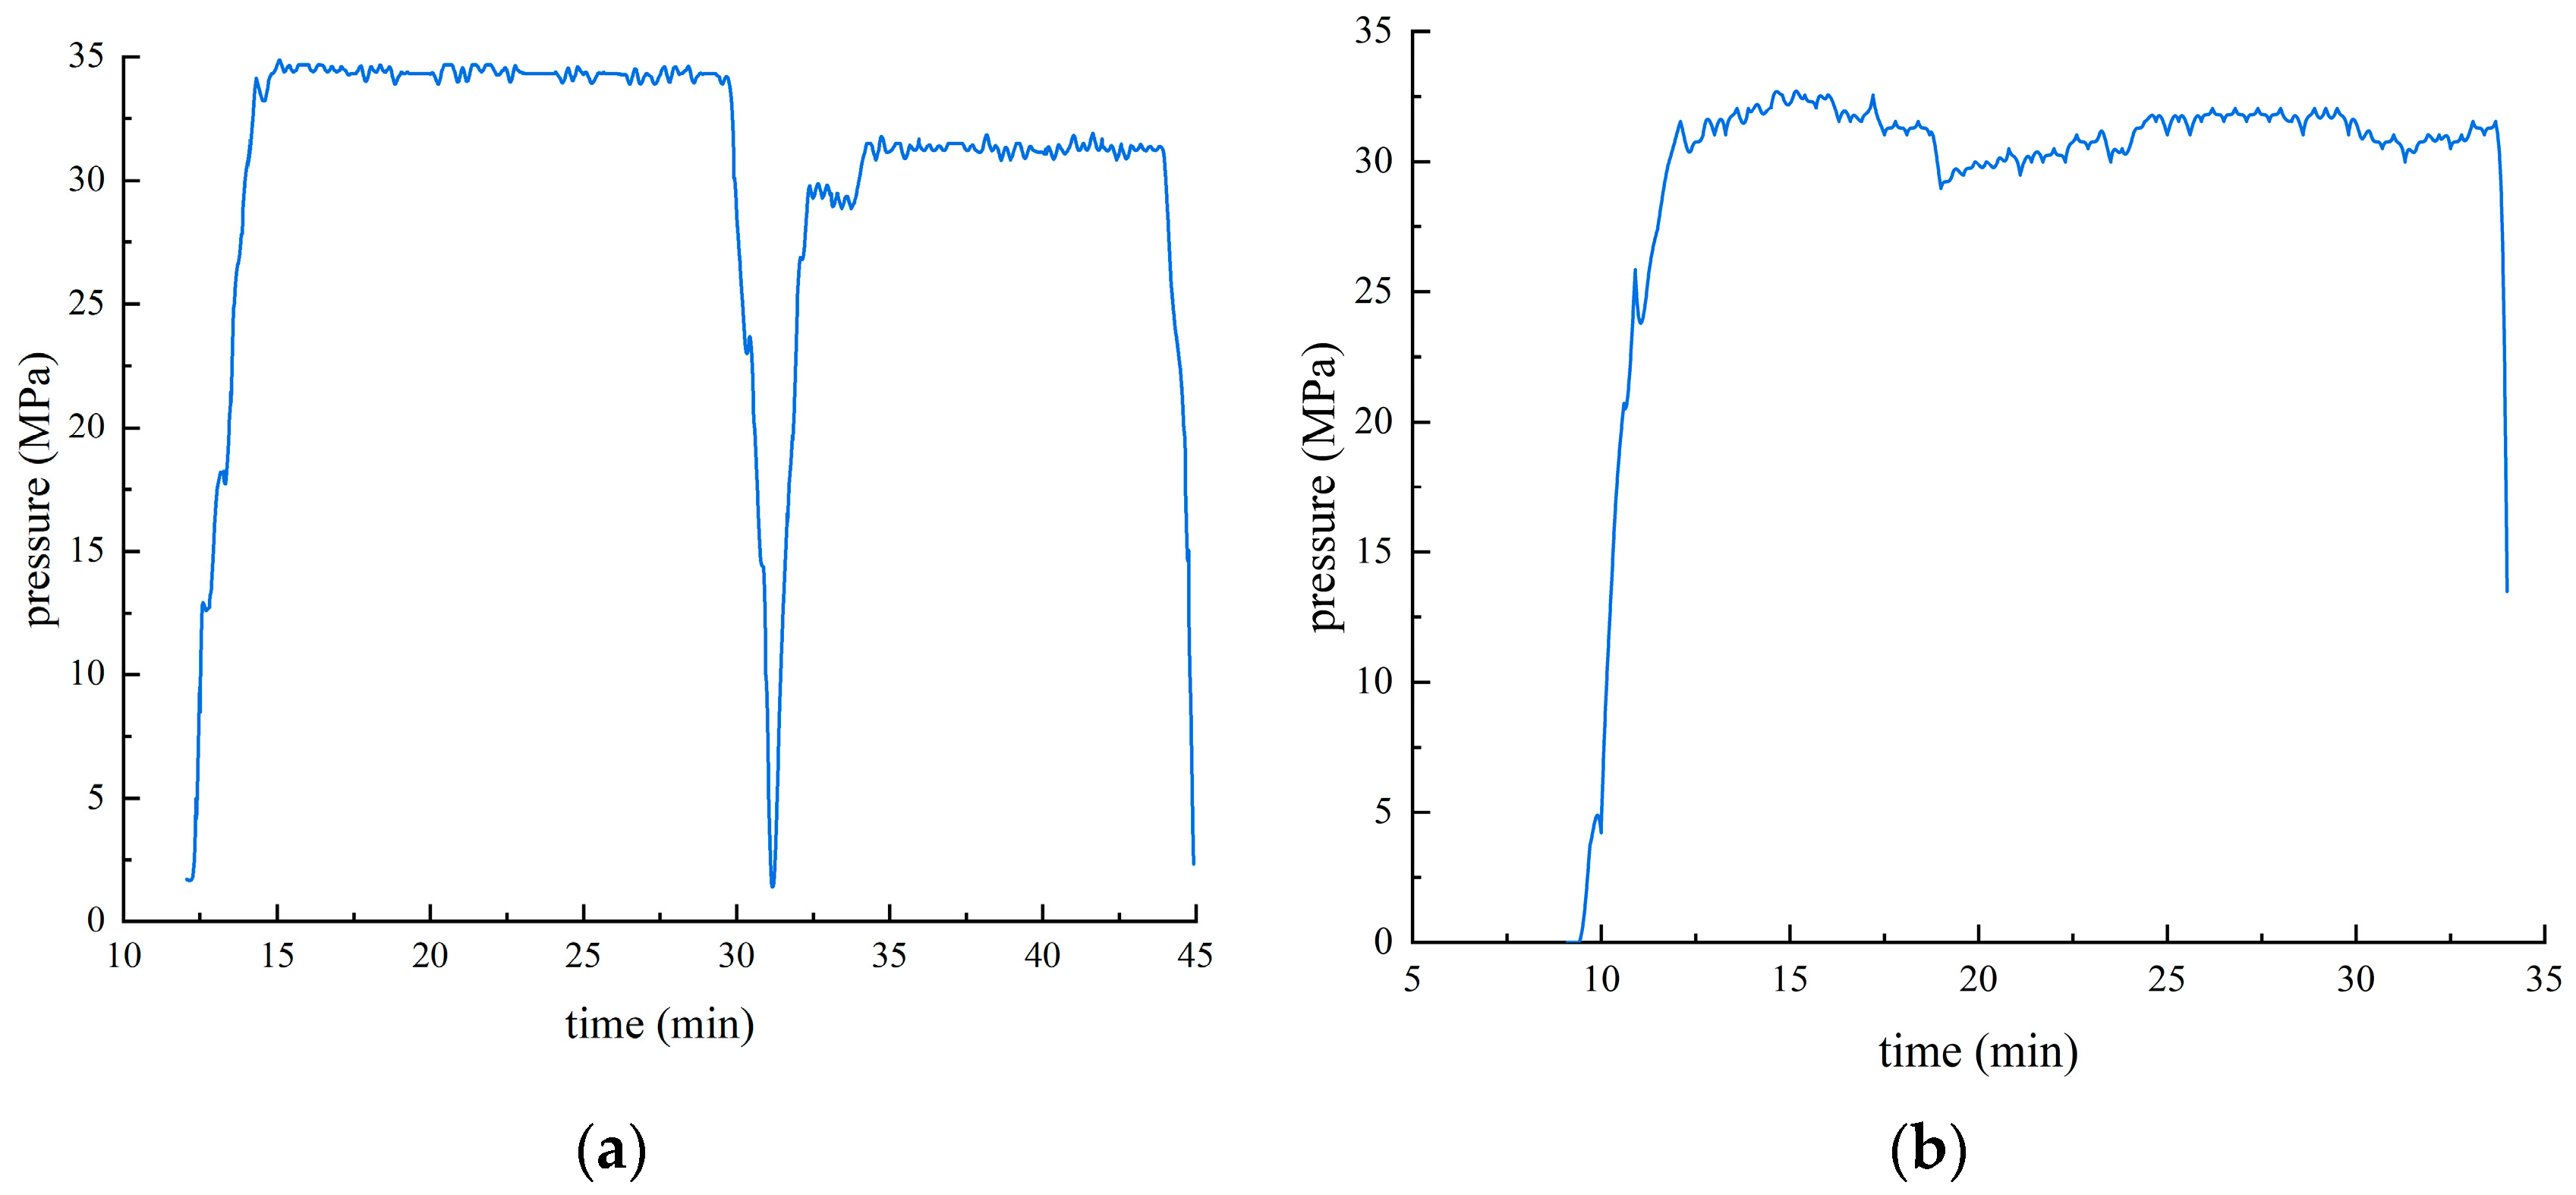
(1) Monitoring of Water Pressure Evolution
During the fracturing process, a specialized high-pressure recorder was used to monitor the pressure variation in the hydraulic fracturing boreholes along the roof of the 21,103 return airway. Data were recorded every 2 s. Borehole A (depth: 35 m) and Borehole B (depth: 15 m) were selected as representative cases. The pressure variation curves during the fracturing process are shown in
Figure 13.
As shown in
Figure 13a, the pressure in Borehole A exhibits a clear pattern of “pressurization–plateau–sudden drop”. In the initial pressurization phase, water pressure steadily increased, reaching a local peak at around 15 min. This was followed by a plateau phase, maintaining approximately 35 MPa for 15 min. Subsequently, the pressure dropped abruptly to about 2 MPa, indicating that the fracturing fluid broke through pre-existing fractures or bedding planes, resulting in sudden localized pressure release. Further pressurization led to gradual pressure recovery and an increase to 33 MPa, continuing until fractures connected with the surrounding free surface or adjacent boreholes, thereby establishing a fracture network.
Figure 13b presents the pressure curve of Borehole B, where water pressure rose rapidly and reached around 30 MPa at 12 min. It remained relatively stable, fluctuating slightly around 30 MPa over the next 22 min. This suggests that no violent rupture or pressure release occurred during the process, and the fractures extended in a controlled and stable manner, forming a continuous and effective water-conducting fracture network. Such behavior reflects the high structural integrity of the rock mass and the stable nature of the fracturing process, favorable for uniform stress release and energy dissipation.
(2) Monitoring of Water Flow Diffusion Range
The water outflow from Boreholes A and B, as well as surrounding anchor cable boreholes, was observed to assess the fracture propagation range induced by hydraulic fracturing. Results show that the fracture extension range from deep Borehole A was approximately 10–15 m, whereas the shallow Borehole B exhibited a broader range of 15–30 m. This indicates a stronger water-conducting capacity in shallow boreholes and demonstrates good connectivity and pressure-transmitting capability of the fracture network, further confirming the applicability and effectiveness of Scheme 9 in practical engineering scenarios.
(3) Monitoring of Acoustic Emissions from Roof Fracturing
During the hydraulic fracturing process, acoustic emissions from roof fracturing were automatically collected every 30 min using an acoustic fingerprint monitoring system. Monitoring results indicate that 10 to 26 roof fracture events were recorded every 30 min on average. This suggests that the flexural elastic energy accumulated in the roof was effectively released through the generated fractures, confirming the effectiveness of roof hydraulic fracturing as a pressure relief measure.
6. Conclusions
Based on the 21,103 operating face of the Hulusu Coal Mine, our research conducted a comprehensive investigation into the manifestation characteristics of rockburst, the instability mechanism of hard roof failure, energy accumulation behavior, the design and numerical validation of pressure relief schemes, and field engineering applications. The main findings and conclusions are as follows:
(1) Microseismic monitoring results revealed that microseismic events were primarily concentrated within 60 m to the west and 100 m to the east of the 21,103 Return Airway, as well as within 300 m ahead and 50 m in back of the operating face. These distributions indicate localized stress concentration and instability of the rock mass structure, emphasizing the need for enhanced support and anti-rockburst measures in these regions.
(2) A theoretical analytical framework for total elastic energy in the roof was established based on the modeling of the roof flexure, volumetric strain energy, and deformation energy. The study shows that as the rock’s mining depth and overhang length increase, the stored EE within the system rises sharply, serving as a major energy source for rockburst events. Therefore, the formation of a large overhanging roof structure behind the 21,103 working face tends to accumulate substantial elastic energy, posing a significant rockburst risk. This conclusion aligns well with the observed spatial distribution of microseismic energy, validating the applicability and scientific reliability of the theoretical model.
(3) Nine pressure relief schemes with varying borehole inclination angles were simulated using FLAC3D. The results indicate that the optimal configuration involved boreholes inclined at 45°, spaced 15 m apart, with a diameter of 65 mm. The boreholes extended 24 m above the coal pillar and 30 m above the working face. This scheme provided the best comprehensive stress regulation effect on the surrounding rock, successfully forming an effective pressure relief zone and enhancing the roof stability. Furthermore, the modeling approach established in this study offers theoretical guidance for developing pressure relief strategies in regions with diverse geological characteristics prone to cluster mine pressure.
(4) The efficacy of pressure relief technologies was verified through monitoring of water pressure variations, the fracture propagation range, and acoustic emissions from roof fracturing during field hydraulic fracturing experiments at the 21,103 roadway. The results demonstrate that the energy aggregated within the roof could be effectively liberated through the propagation of induced fractures, confirming that the pressure relief technique offers a significant mitigation effect against rockburst hazards in hard and thick sandstone roofs.
Author Contributions
Conceptualization, Z.W. and Y.L.; methodology, Z.W. and Z.S; software, Z.W.; validation, Y.L., Y.N. and P.Z.; formal analysis, Z.S.; investigation, Y.N.; resources, Y.L.; data curation, P.Z.; writing—original draft preparation, Y.N.; writing—review and editing, Z.S.; visualization, Y.N.; supervision, Z.W.; project administration, Y.L.; funding acquisition, Y.L. All authors have read and agreed to the published version of the manuscript.
Funding
This work was supported by the Scientific and Technological Key Project of “Revealing the List and Taking Command” in Heilongjiang Province (2021ZXJ02A03, 2021ZXJ02A04).
Institutional Review Board Statement
Not applicable.
Informed Consent Statement
Not applicable.
Data Availability Statement
Data are contained within the article.
Conflicts of Interest
The authors declare no conflicts of interest.
References
- Cao, A.; Dou, L.; Bai, X.; Liu, Y.; Yang, K.; Li, J.; Wang, C. Mechanism of Mine Earthquakes and Current Challenges in Prevention and Control in Chinese Coal Mines. J. China Coal Soc. 2023, 48, 1894–1918. [Google Scholar] [CrossRef]
- Dou, L.; Cao, A.; Yang, Y.; He, H.; Yang, Y.; Bai, X.; Gu, Q.; Li, S.; Fu, X.; Gu, Y.; et al. Characteristics of Breeding and Rupture of Mine Earthquakes and Stress Trigger Mechanism in Thick Overburden. Coal Geol. Explor. 2024, 52, 1–13. [Google Scholar] [CrossRef]
- Pan, Y.; Song, Y.; Liu, J. The Pattern, Transformation, and New Direction of Rockburst Prevention and Control in Chinese Coal Mines. Chin. J. Rock Mech. Eng. 2023, 42, 2081–2095. [Google Scholar] [CrossRef]
- Pan, J.; Xia, Y.; Wang, S.; Ma, W.; Zang, C.; Wang, B. Key Technical Problems and Development Direction of Rockburst Prevention and Control in Deep Coal Mines in China. J. China Coal Soc. 2024, 49, 1291–1302. [Google Scholar] [CrossRef]
- Wu, J.; Pan, J.; Feng, M.; Lu, C.; Gao, J.; Yan, Y.; Ma, H. Overburden Mining Response Characteristics under Different Roof Fracturing Degrees. J. China Coal Soc. 2024, 49, 4351–4364. [Google Scholar] [CrossRef]
- Zhu, S.; Zhang, X.; Jiang, F.; Ma, J.; Zhang, X.; Xia, K.; Wang, C.; Li, S.; Liu, J.; Zhu, Q.; et al. Mechanism and Application of Rockburst Prevention by Energy Release Modification of Coal Pillars under High-Stress Conditions in Deep Roadways. J. China Coal Soc. 2024, 49, 3711–3727. [Google Scholar] [CrossRef]
- Mu, Z.; Dou, L.; Zhang, G.; Zhang, S.; Li, Z.; Zhang, J. Research on the Prevention and Control of Rockburst Disasters Caused by Hard Roof. J. China Univ. Min. Technol. 2006, 6, 737–741. Available online: https://kns.cnki.net/kcms2/article/abstract?v=JSKsj9h_wsK_GPZUfAtTlTZZgIBbgnkIZbZy4yLsFe796vh1xVID75OwxcxiVHKj9TQ0C8nkc8dq8bQWvpn8eYEERiY9Z9ZFLmmTdhQ1WaIZlbxdig0pg-V21ukZmZDdVw5Uc8rjYu3oih5c0CroIzRsUsD552YvMSOMvsXVIEdfuNl_muEGJw==&uniplatform=NZKPT&language=CHS (accessed on 29 May 2025).
- Zhang, J.; Dong, X.; Bai, J.; Jia, L. The mechanism and prevention of rockburst induced by the instability of the composite hard-roof coal structure and roof fractures. Eng. Fract. Mech. 2024, 310, 110512. [Google Scholar] [CrossRef]
- Liu, W.; Zhao, Y.; Guo, J. Mechanism and Control of Rockburst in Adjacent Roadways under Thick Hard Roof Conditions in the Xinjie Mining Area. Coal Geol. Explor. 2024, 52, 153–165. [Google Scholar] [CrossRef]
- Dai, X.; Gao, R.; Gao, W.; Bai, D.; Huang, X. Exploring the Distribution Characteristics of High Static Load in the Island Working Face of Extra-Thick Coal Seams with Hard Roof: Addressing the Challenge of Rock Burst Risk. Appl. Sci. 2024, 14, 1961. [Google Scholar] [CrossRef]
- Cheng, L.; Zhang, Z.; Jiang, P.; Yang, J. Study and Application of Stress Field Response Mechanism Based on Hydraulic Fracturing of Roof. J. Min. Saf. Eng. 2023, 40, 722–729. [Google Scholar] [CrossRef]
- Lü, R.; Li, J.; Zhu, L.; Wang, C.; Quan, X.; Ni, X.; Wang, B.; Zhang, S. Study on Ground Well Acid Fracturing Pressure Relief and Rockburst Mitigation Technology under Thick Conglomerate Roof. Coal Sci. Technol. 2024, 1–9. Available online: https://kns.cnki.net/kcms2/article/abstract?v=JSKsj9h_wsIZvMXTpw_-FIT7IkkfV1eXnhLzyKhKcYhEu_RyVZHBO5HunyoAMk-U_2rF5suctTDOntBmCcwIVQmJ7ER1Gah3X2Mug-R2g9uMZxgTonhPhFi32X-U98CzIv69EbJsLnHEFPCkM0WmQ3zTYaririToIKy1IKIY_xAdL4Z4q8RCBw==&uniplatform=NZKPT&language=CHS (accessed on 29 May 2025).
- Zheng, K.; Yuan, L.; Zhang, P.; Wang, L. Induced Rockburst Mechanism and Prevention Model of Composite Key Layer with Thick Hard Roof. Coal Geol. Explor. 2024, 52, 14–24. [Google Scholar] [CrossRef]
- Fu, B.; Gao, M.; Tu, M.; Zhang, P. Composite Effect of Key Strata and Its Influence on Mine Pressure Manifestations. J. Min. Saf. Eng. 2016, 33, 220–225. [Google Scholar] [CrossRef]
- Lai, X.; Zhu, H.; Guo, Z.; Gu, H.; Li, X.; Zhao, Q.; Shan, P. Mechanism and Application of High-Level Key Stratum Dynamic Load under Valley Area of Shallow Coal Seam. J. Min. Saf. Eng. 2024, 41, 879–888. [Google Scholar] [CrossRef]
- Pan, J.; Ma, H.; He, H.; Yan, Y.; Ma, X.; Ma, W. Dynamic Response Law and Limitation of Rockburst Prevention Boreholes in Coal Seams. Coal Sci. Technol. 2024, 52, 137–149. [Google Scholar] [CrossRef]
- Wang, S.; Zhi, B.; Du, T.; Yang, G.; Lu, C.; Xia, Y. Surface Pre-Control Technology of Potential Rockburst Risk with Thick Hard Roof. Coal Sci. Technol. 2023, 51, 1–11. [Google Scholar] [CrossRef]
- Fan, J.; Dou, L.; He, H.; Du, T.; Zhang, S.; Gui, B.; Sun, X. Directional hydraulic fracturing to control hard-roof rockburst in coal mines. Int. J. Min. Sci. Technol. 2012, 22, 177–181. [Google Scholar] [CrossRef]
- Zhuang, J.; Mu, Z.; Cai, W.; He, H.; Hosking, L.; Jiao, B. Multistage hydraulic fracturing of a horizontal well for hard roof related coal burst control: Insights from numerical modelling to field application. Int. J. Min. Sci. Technol. 2024, 34, 1095–1114. [Google Scholar] [CrossRef]
- Avilshin. Rockburst. Coal Industry Press. 1959. Available online: https://jiuwenku.com/detail/431f7ee7a569a757/ (accessed on 29 May 2025).
- Qi, Q.; Dou, L. Rockburst Theory and Technology; China University of Mining and Technology Press: Xuzhou, China, 2008; Available online: https://baike.baidu.com/item/%E5%86%B2%E5%87%BB%E5%9C%B0%E5%8E%8B%E7%90%86%E8%AE%BA%E4%B8%8E%E6%8A%80%E6%9C%AF/6929050 (accessed on 29 May 2025).
- Li, B. Study on Induced Mechanism of Roadwayfloor Rock Burst Under Super-Thick Conglomerate Stratum. Henan Polytechnic University. 2014. Available online: https://kns.cnki.net/kcms2/article/abstract?v=HgkNOCd8VPjL2PGXxdQiNy9pAbeOi9wG6FlxEGsP1uUJm7wm_CTheYCrl5xgVJDQgz8QmfFqADxFQ92Q_Bp7TSif-WKZ5geMm_gU1D4sUMUIqZZDYbk6ZBlSYiCBuT8qvxtk0J98vg3b_MKvL0Gn3NOo-Vn3mgD-Fy1HGJmNyZ32fouQqlhMdgTlVON_QB0V&uniplatform=NZKPT&language=CHS (accessed on 29 May 2025).
Figure 1.
Schematic diagram of the spatial relationship between the working faces in the No. 2-1 CS of Hulusu Coal Mine.
Figure 1.
Schematic diagram of the spatial relationship between the working faces in the No. 2-1 CS of Hulusu Coal Mine.
Figure 2.
Borehole stratigraphic profile of the No. 2-1 coal seam in Hulusu Coal Mine.
Figure 2.
Borehole stratigraphic profile of the No. 2-1 coal seam in Hulusu Coal Mine.
Figure 3.
The frequency and energy distributions of microseismic events along the dip direction of the 21,103 operating face.
Figure 3.
The frequency and energy distributions of microseismic events along the dip direction of the 21,103 operating face.
Figure 4.
The frequency and energy distributions of microseismic events along the strike direction of the 21,103 working face.
Figure 4.
The frequency and energy distributions of microseismic events along the strike direction of the 21,103 working face.
Figure 5.
Bending elastic energy calculation models under different collapse modes: (a) Initial collapse; (b) Periodic collapse.
Figure 5.
Bending elastic energy calculation models under different collapse modes: (a) Initial collapse; (b) Periodic collapse.
Figure 6.
Numerical model of roof hydraulic fracturing pressure relief.
Figure 6.
Numerical model of roof hydraulic fracturing pressure relief.
Figure 7.
Roof hydraulic fracturing pressure relief model.
Figure 7.
Roof hydraulic fracturing pressure relief model.
Figure 8.
Schematic diagram of numerical simulation for roof hydraulic fracturing pressure relief: (a) No pressure relief; (b) Scheme 1; (c) Scheme 2; (d) Scheme 3; (e) Scheme 4; (f) Scheme 5; (g) Scheme 6; (h) Scheme 7; (i) Scheme 8; (j) Scheme 9.
Figure 8.
Schematic diagram of numerical simulation for roof hydraulic fracturing pressure relief: (a) No pressure relief; (b) Scheme 1; (c) Scheme 2; (d) Scheme 3; (e) Scheme 4; (f) Scheme 5; (g) Scheme 6; (h) Scheme 7; (i) Scheme 8; (j) Scheme 9.
Figure 9.
Displacement field evolution in the xz-plane under different pressure relief schemes: (a) No pressure relief; (b) Scheme 1; (c) Scheme 2; (d) Scheme 3; (e) Scheme 4; (f) Scheme 5; (g) Scheme 6; (h) Scheme 7; (i) Scheme 8; (j) Scheme 9.
Figure 9.
Displacement field evolution in the xz-plane under different pressure relief schemes: (a) No pressure relief; (b) Scheme 1; (c) Scheme 2; (d) Scheme 3; (e) Scheme 4; (f) Scheme 5; (g) Scheme 6; (h) Scheme 7; (i) Scheme 8; (j) Scheme 9.
Figure 10.
Evolution of plastic zones in the xy-plane under different hydraulic fracturing schemes: (a) No pressure relief; (b) Scheme 1; (c) Scheme 2; (d) Scheme 3; (e) Scheme 4; (f) Scheme 5; (g) Scheme 6; (h) Scheme 7; (i) Scheme 8; (j) Scheme 9.
Figure 10.
Evolution of plastic zones in the xy-plane under different hydraulic fracturing schemes: (a) No pressure relief; (b) Scheme 1; (c) Scheme 2; (d) Scheme 3; (e) Scheme 4; (f) Scheme 5; (g) Scheme 6; (h) Scheme 7; (i) Scheme 8; (j) Scheme 9.
Figure 11.
The surrounding rock’s vertical stress distribution on the roadway’s two sides after hydraulic fracturing pressure relief among roofs.
Figure 11.
The surrounding rock’s vertical stress distribution on the roadway’s two sides after hydraulic fracturing pressure relief among roofs.
Figure 12.
The surrounding rock’s vertical displacement distribution on the roadway’s two sides after hydraulic fracturing pressure relief in the roof.
Figure 12.
The surrounding rock’s vertical displacement distribution on the roadway’s two sides after hydraulic fracturing pressure relief in the roof.
Figure 13.
Water pressure monitoring curves during the hydraulic fracturing process: (a) Pressure variation in Borehole A; (b) Pressure variation in Borehole B.
Figure 13.
Water pressure monitoring curves during the hydraulic fracturing process: (a) Pressure variation in Borehole A; (b) Pressure variation in Borehole B.
Table 1.
Mechanical parameters of numerical model.
Table 1.
Mechanical parameters of numerical model.
| Rock Type | Thickness (m) | Density (kg/m3) | Bulk Modulus (GPa) | Shear Modulus (GPa) | Cohesion (MPa) | Friction Angle (°) | Tensile Strength (MPa) |
|---|
| Medium-grained Sandstone | 23.35 | 2.42 × 10³ | 11.53 | 7.94 | 11.3 | 35 | 10.23 |
| Sandy Mudstone | 6.81 | 2.59 × 10³ | 4.43 | 3.60 | 3.5 | 33 | 4.24 |
| No. 2-1 coal seam | 3.02 | 1.26 × 10³ | 1.17 | 0.88 | 2.3 | 40 | 1.19 |
| Medium-grained Sandstone | 12 | 2.386 × 10³ | 10.85 | 7.47 | 10.8 | 35 | 9.89 |
Table 2.
Mechanical parameters of numerical model.
Table 2.
Mechanical parameters of numerical model.
| Scheme Type | ID | Position | Spacing (m) | Diameter (mm) | Inclination Angle (°) | Borehole Length (m) |
|---|
|
Scheme 1
| pillar-side borehole | Return Airway | 15 | 65 | a = 75 | 24 |
| face-side borehole | Return Airway | 15 | 65 | b = 75 | 30 |
|
Scheme 2
| pillar-side borehole | Return Airway | 15 | 65 | a = 75 | 24 |
| face-side borehole | Return Airway | 15 | 65 | b = 60 | 30 |
|
Scheme 3
| pillar-side borehole | Return Airway | 15 | 65 | a = 75 | 24 |
| face-side borehole | Return Airway | 15 | 65 | b = 45 | 30 |
|
Scheme 4
| pillar-side borehole | Return Airway | 15 | 65 | a = 60 | 24 |
| face-side borehole | Return Airway | 15 | 65 | b = 75 | 30 |
|
Scheme 5
| pillar-side borehole | Return Airway | 15 | 65 | a = 60 | 24 |
| face-side borehole | Return Airway | 15 | 65 | b = 60 | 30 |
|
Scheme 6
| pillar-side borehole | Return Airway | 15 | 65 | a = 60 | 24 |
| face-side borehole | Return Airway | 15 | 65 | b = 45 | 30 |
|
Scheme 7
| pillar-side borehole | Return Airway | 15 | 65 | a = 45 | 24 |
| face-side borehole | Return Airway | 15 | 65 | b = 75 | 30 |
|
Scheme 8
| pillar-side borehole | Return Airway | 15 | 65 | a = 45 | 24 |
| face-side borehole | Return Airway | 15 | 65 | b = 60 | 30 |
|
Scheme 9
| pillar-side borehole | Return Airway | 15 | 65 | a = 45 | 24 |
| face-side borehole | Return Airway | 15 | 65 | b = 45 | 30 |
Table 3.
Peak vertical stress on the roadway’s two sides following hydraulic fracturing pressure relief.
Table 3.
Peak vertical stress on the roadway’s two sides following hydraulic fracturing pressure relief.
| Scheme | Peak Stress on Coal Pillar Side (MPa) | Peak Stress on Working Face Side (MPa) |
|---|
| No Relief | 24.7 | 20 |
|
Scheme 1
| 17.7 | 16 |
|
Scheme 2
| 18 | 12.09 |
|
Scheme 3
| 18.4 | 7.87 |
|
Scheme 4
| 13.2 | 16.5 |
|
Scheme 5
| 13.6 | 12.5 |
|
Scheme 6
| 13.9 | 8.07 |
|
Scheme 7
| 9.38 | 16.8 |
|
Scheme 8
| 9.23 | 12.8 |
|
Scheme 9
| 9.78 | 8.07 |
Table 4.
Maximum subsidence on the roadway’s two sides following hydraulic fracturing pressure relief in the roof.
Table 4.
Maximum subsidence on the roadway’s two sides following hydraulic fracturing pressure relief in the roof.
| Scheme | Max Subsidence on Coal Pillar Side (cm) | Max Subsidence on Working Face Side (cm) |
|---|
| No Relief | 1.14 | 1.18 |
|
Scheme 1
| 0.98 | 0.96 |
|
Scheme 2
| 1.01 | 0.79 |
|
Scheme 3
| 1.03 | 0.61 |
|
Scheme 4
| 0.81 | 0.99 |
|
Scheme 5
| 0.83 | 0.81 |
|
Scheme 6
| 0.84 | 0.62 |
|
Scheme 7
| 0.65 | 1.02 |
|
Scheme 8
| 0.66 | 0.82 |
|
Scheme 9
| 0.67 | 0.63 |
| Disclaimer/Publisher’s Note: The statements, opinions and data contained in all publications are solely those of the individual author(s) and contributor(s) and not of MDPI and/or the editor(s). MDPI and/or the editor(s) disclaim responsibility for any injury to people or property resulting from any ideas, methods, instructions or products referred to in the content. |
© 2025 by the authors. Licensee MDPI, Basel, Switzerland. This article is an open access article distributed under the terms and conditions of the Creative Commons Attribution (CC BY) license (https://creativecommons.org/licenses/by/4.0/).


