Abstract
Isokinetic dynamometry is considered the gold standard for assessing muscle strength ratios, whereas tensiomyography (TMG) has emerged as a promising tool for rapid assessment of involuntary muscle contractility. However, the validity of TMG-derived ratios for evaluating muscle balance around the knee remains unclear. The aim of this study was to examine the associations between various TMG-derived ratios of knee muscles and isokinetic torque ratios. Time- and amplitude-related TMG parameters, along with peak isokinetic torques at 60°/s, 180°/s, and 240°/s, were assessed in a sample of 30 healthy young adults of both genders. Conventional and functional torque ratios were linearly correlated with TMG ratios. Most correlations were not statistically significant and ranged from very weak to moderate (r = –0.251 to 0.124; p > 0.05). Only weak to moderate negative correlations between functional isokinetic knee muscle ratios and TMG ratios of contraction time and delay time were statistically significant (r = –0.366 to –0.468; p < 0.05), suggesting some meaningful relationships between the two assessment methods. Given the generally low strength of these associations, we conclude that TMG ratios should not be used as a direct substitute for isokinetic torque ratios. Due to the methodological limitations of this study, further research is needed to evaluate the functional validity of TMG-derived ratios.
1. Introduction
Muscle performance changes with musculoskeletal injuries or neuromuscular diseases. Therefore, measurements of muscle strength, power, and endurance are crucial for monitoring recovery and evaluating treatment programmes [1]. Similarly, inadequate muscle performance and muscle imbalance are important risk factors for sports injuries [2].
Muscle contraction can be voluntary, which starts in the higher brain centres, or involuntary, induced by a reflex or electrical stimulation [3]. Isokinetic dynamometry is the gold standard for measuring muscle strength and power [4], but its inaccessibility often limits its use. Tensiomyography (TMG) is a non-invasive, cost-effective assessment method of the contractile properties of skeletal muscles [5]. It records time (Tc), delay (Td) and relaxation (Tr) of contraction and transverse muscle displacement (Dm) during electrically induced muscle twitch [6]. TMG parameters, such as maximum Dm and Tc, are associated with muscle stiffness and the rate of force generation [7]. Due to its practicality and affordability, TMG is increasingly being used to analyse muscle performance in athletes and for functional diagnostics in injured athletes. However, the functional validity of TMG parameters for the assessment of voluntary muscle contraction remains unclear.
Research shows that certain TMG parameters correlate with athletic performance. In cyclists, Dm and other parameters are mainly related to muscle strength [8], while in football players, they are related to both power and speed in jumps and sprints [9]. However, not all studies have confirmed statistically significant associations. Valenzuela et al. [10] studied female rugby players and found a negative correlation between performance on a cycle ergometer and Dm, Vc and Td of the vastus lateralis, but no significant relationship with the rectus femoris or vastus medialis.
Only a few studies have investigated the relationship between TMG and isokinetic torque, with mixed results. Toskić et al. [11] reported positive correlations between knee flexor strength (60°/s) and the Vc of the vastus lateralis and semitendinosus, and between extensor strength and the Vc of the rectus femoris and the Tc of the vastus medialis. Later, they found a negative correlation between a lower Dm of the biceps femoris and greater flexor and extensor strength in women [12], with stronger associations in inactive individuals than in elite athletes. In another study, the strongest correlations were observed in individuals with low strength, which decreased with increasing strength. In the biceps femoris and rectus femoris, an increase in strength was associated with Tc and Dm [13]. These results suggest that TMG may assist in the assessment of contractile properties of muscles, but its relationship to isokinetic measurements remains unclear. In addition to muscle strength, isokinetic dynamometry is commonly used to assess various muscle ratios, including the ratios between flexors and extensors of the knee joint. These ratios are critical for assessing muscular balance and joint stability. An imbalance between the flexors and extensors has been shown to increase the risk of joint injury [14]. Previous studies have shown the importance of both the conventional ratio of maximum concentric torques between flexors and extensors and the functional ratio, calculated as the ratio between the maximum eccentric torque of the knee flexors and the maximum concentric torque of the knee extensors. The latter has become increasingly important for a more accurate prediction of injury risk [15,16]. The balance between knee flexors and extensors plays a crucial role in the success of rehabilitation and joint function [17].
Therefore, the aim of this study was to investigate the relationship between conventional and functional isokinetic ratios of knee flexion and extension torques measured at different angular velocities and ratios derived from time- and amplitude-based TMG parameters of the major knee muscles (rectus femoris, vastus medialis, vastus lateralis, biceps femoris and semitendinosus). We aimed to determine whether TMG-derived ratios can be used as a direct substitute for isokinetic measurements in the assessment of knee muscle balance.
2. Materials and Methods
The measurements were carried out in the physiotherapy laboratory of the Faculty of Health Sciences at the University of Ljubljana. All subjects received detailed verbal and written information and gave their signed consent for voluntary participation. The study protocol was approved by the National Medical Ethics Committee of the Republic of Slovenia (No. 0120-382/2020-3) and was conducted in accordance with the Declaration of Helsinki and Ovid Convention. The experiments conducted in this study are in accordance with the applicable laws of the Republic of Slovenia and the EU.
2.1. Sample Size Estimation
The minimum required sample size was estimated based on a statistical power level of 0.80 for bivariate linear regression and Pearson product–moment correlation analyses between isokinetic peak torque ratios and TMG parameter ratios of knee extensor and flexor muscles. Assuming at least a moderate correlation (r ≥ 0.50), the minimum estimated sample size was 29 participants.
2.2. Study Sample
The subjects were selected according to the principle of ad hoc sampling. Participants were recruited from among university students through informal invitations and personal contacts. The study included 30 healthy individuals—15 males and 15 females—aged between 20 and 31 years, all of whom had no history of knee joint injuries, neuromuscular disorders, or lower limb surgeries, and who voluntarily agreed to participate. Individuals who were active athletes or engaged in recreational sports more than three times per week were excluded. All measurements were conducted on the dominant lower limb, which was determined based on limb preference for tasks requiring dexterity, such as kicking a ball.
2.3. Study Protocol and Measurements
First, the subjects’ basic demographic data and other important physical activity data were collected, and possible exclusion factors were checked. This was followed by a standardised ten-minute warm-up consisting of five minutes of low-intensity stepping exercise and thigh muscle stretching. After the warm-up, the mechanical properties of the involuntary contractions of the anterior and posterior thigh muscles were recorded using the TMG system (TMG-S1, Ljubljana, Slovenia). Five thigh muscles were examined, namely the rectus femoris, the vastus medialis and the vastus lateralis on the front of the thigh and the biceps femoris and semitendinosus on the back of the thigh. The measurements of the quadriceps heads were performed at a knee flexion of 30°, and those of the hamstrings at a knee flexion of 5°. A mechanical sensor was positioned perpendicularly to the skin over the belly of each muscle. For the rectus femoris, the sensor was placed at the midpoint of the line connecting the anterior inferior iliac spine and the base of the patella. For the vastus medialis, it was positioned at the midpoint of the line between the base of the patella and the muscle’s innervation point. For the vastus lateralis, the sensor was placed at two-thirds of the distance from the anterior superior iliac spine to the lateral border of the patella. For the biceps femoris, placement was at the midpoint of the line connecting the ischial tuberosity and the lateral epicondyle of the tibia. For the semitendinosus, the sensor was positioned midway between the medial tibial condyle and the ischial tuberosity. Two self-adhesive surface electrodes (5 × 5 cm, UltraStim X, Axelgaard Manufacturing Co. Ltd., Lystrup, Denmark) were affixed 2.5 cm distal and proximal to the measurement site. A rectangular monopolar electrical pulse of 1 ms duration was then applied to induce a muscle twitch. The output current was between 25 and 100 mA. We gradually increased the current upwards from 25 mA in 15 mA increments until the maximum Dm of each muscle was reached. The displacement-time curve of the maximal mechanical muscle response to the electrical twitch was decomposed to obtain Dm, Td, Tc and Ts, which were used for further analysis. Dm was defined as the peak amplitude in the curve. Td was defined as the time between the electrical stimulus and the displacement of the sensor to 10% of Dm. Tc was the time from 10% to 90% of Dm was reached. All electrode and sensor placements were performed by the same trained investigator to minimise inter-rater variability.
The muscle strength of the test subjects was then tested using an isokinetic dynamometer (Humac NORM, CSMI, Stoughton, MA, USA). A gravity correction was used for all measurements. The subjects were tested in a seated position, with the chest and pelvis fixed to the chair of the isokinetic dynamometer with safety belts to prevent involuntary synergistic movements of other body parts. The concentric muscle torques of the knee extensors and flexors were measured from 0° to 90° knee flexion. To avoid mechanical overloading of the patellofemoral joint during the eccentric torque test, the range of motion was reduced to 10–90° knee flexion.
Before starting the measurements, subjects were familiarised with the protocol by performing either 8 concentric or 5 eccentric contractions at a submaximal intensity at each of the measured joint velocities. Due to the faster fatigue of the muscle, we opted for a lower number of test contractions before the eccentric tests. The maximum concentric torque of the extensor and flexor muscles of the knee of the dominant leg was measured at all three angular velocities (60°/s, 180°/s and 240°/s), followed by the measurements of the maximum eccentric torques. The concentric tests were performed before the eccentric tests, as it has been shown that maximal eccentric contractions reduce concentric torque, while the opposite effect was not found [18]. There was a 20-min rest period during the concentric and eccentric tests. During all tests, the subjects received intensive verbal stimulation.
2.4. Data Processing and Statistical Analysis
The conventional concentric (FLC/EXTC) and functional (FLE/EXTC) ratios of the peak isokinetic torques were calculated from the gravity-corrected values and compared with a series of different ratios of the TMG parameters (Td, Tc, Ts and Dm). To calculate the latter, the values of a particular TMG parameter measured at the flexor muscles were divided by the values of the same parameter measured at the knee extensors. For the cumulative TMG parameters of the knee extensors and flexors (e.g., TcFL/TcEXT), we calculated the mean value of the TMG parameter across all muscles in the group; the mean value of the rectus femoris, vastus medialis and vastus lateralis muscles for the extensors and the mean value of the biceps femoris and semitendinosus muscles for the flexors. Separately, we also calculated the associations between the TMG parameters for the biceps femoris and the average of all quadriceps muscle heads (e.g., TcBF/TcEXT). In addition, a standard ratio between hamstrings and quadriceps of the knee muscles (H/QF TMG) calculated by the data acquisition and analysis software TMG-OK 3.0 of the Tensiomyography System (TMG-S1, Ljubljana, Slovenia) was used for comparison.
All data were presented with mean values and their standard deviations (SD). Normality of the data distribution was analysed using the Shapiro–Wilk test, and parametric statistical analysis was considered appropriate. We tested the differences in the mean values of the dynamometric parameters between the three joint angular velocities using a one-way ANOVA for repeated measures. To analyse the relationship between the isokinetic torque ratios and the ratios of the TMG parameters, we performed a bivariate linear regression calculation and calculated Pearson’s correlation coefficients (r). We used Microsoft Excel 2019 for data management and SPSS (version 27.0, IBM Corp., Armonk, NY, USA) for statistical analysis. The limit of statistical significance for all analyses was set at p < 0.05.
3. Results
The study sample consisted of 30 subjects of both genders (15 men and 15 women), aged 20 to 31 years, who completed the entire study protocol. The average age was 22.4 (3.0) years, body weight 68.4 (9.8) kg, body height 174.9 (8.8) cm and body mass index 22.3 (1.9) kg/m2.
3.1. Isokinetic Measurements
Differences in the mean values of peak concentric and eccentric isokinetic muscle torques and their respective ratios across various joint angular velocities were analysed using repeated measures ANOVA. Table 1 shows the results of the isokinetic peak torques measured at knee angular velocities of 60°/s, 180°/s and 240°/s. The mean concentric and eccentric peak torques of the flexors and extensors decreased with increasing angular velocity of motion (p ≤ 0.006).

Table 1.
Average values (SO) of the maximum concentric and eccentric torques of the knee flexors and extensors at three angular velocities (60°/s, 180°/s, 240°/s).
The conventional (FLC/EXTC) and functional (FLE/EXTC) ratios of peak torques increased with increasing angular velocity of knee motion (p ≤ 0.002). The details are shown in Table 2.
Table 2.
Average values (SO) of the conventional and functional torque ratio FL/EXT at three angular velocities (60°/s, 180°/s, 240°/s).
3.2. Tensiomyography
Differences in the mean TMG parameters between knee extensors and flexors were analysed using paired t-tests. The results indicate that the extensor muscles respond more rapidly to electrical twitch stimulation than the flexor muscles. The mean delay time (Td) was 22.7 (1.0) ms for the extensors and 24.1 (2.3) ms for the flexors (p = 0.001). Additionally, the extensors exhibited a shorter contraction time (Tc), averaging 26.0 (2.5) ms, compared to 36.5 (8.1) ms for the flexors (p < 0.001). The sustain time (Ts) was significantly longer in the flexors, with a mean of 178.5 (26.7) ms, versus 131.5 (32.7) ms in the extensors (p < 0.001). Furthermore, the extensors demonstrated a greater maximum radial displacement (Dm), with a mean of 8.1 (1.7) mm, compared to 7.2 (2.5) mm in the flexors (p = 0.042). Detailed mean TMG parameter values by individual muscle and muscle group are presented in Table 3.
Table 3.
Mean values (SD) of the TMG parameters for the rectus femoris, vastus medialis, vastus lateralis, biceps femoris and semitendinosus muscles, as well as calculated mean values for the entire muscle group of the knee flexors and extensors.
The ratios of the knee flexors and extensors of the dominant leg calculated from TMG parameters are shown in Table 4.
Table 4.
Mean values (SD) of the ratios calculated from the TMG parameters.
3.3. Associations Between Isokinetic Torque Ratios and Ratios of TMG Parameters
3.3.1. Correlation Between the Conventional Ratio of Maximum Torques and the Ratios Calculated from the TMG Parameters
Bivariate linear regression analysis of the association between various isokinetic peak torque ratios and ratios of TMG parameters was made, and Pearson’s correlation coefficients were calculated. There was a moderate negative statistically significant correlation (p = 0.03) between TdFL/TdEXT and the conventional knee muscle torque at 60°/s. Other ratios calculated from the TMG parameters did not show a linear relationship with the conventional isokinetic torque ratios. The details of the correlation analysis can be found in Table 5.
Table 5.
Values of Pearson’s correlation coefficients (r) between the conventional isokinetic torque ratio (FLC/EXTC) at three angular velocities (60°/s, 180°/s, 240°/s) and the ratios calculated from the TMG parameters.
3.3.2. Correlation Between the Functional Torque Ratio of the Knee Muscles and the Ratios Calculated from the TMG Parameters for Time and Amplitude
Analysis of the association between the functional knee torque ratio and the TMG ratios calculated from the time and amplitude parameters (Table 6) showed that there was a moderately negative relationship between the TcFL/TcEXT ratio and the functional knee muscle torque ratio at 180°/s (r = −0.465; p = 0.01), between the TcBF/TcEXT ratio and the functional knee muscle torque at 180°/s (r = −0.468; p = 0.01), between TcBF/TcEXT and the functional isokinetic ratio at 240°/s (r = −0.408; p = 0.03) and a weak negative association between the TcFL/TcEXT ratio and the functional isokinetic ratio at 240°/s (r = −0.366; p = 0.05) (Figure 1). A weak positive correlation was also observed between the H/QF TMG and the functional isokinetic ratio of the knee muscles measured at 240°/s (r = 0.381; p = 0.04). No other statistically significant correlations were found.
Table 6.
Values of the correlation coefficients (r) between the functional ratio (FLE/EXTC) at three angular velocities (60°/s, 180°/s, 240°/s) and the ratios calculated from the time and amplitude related TMG parameters.
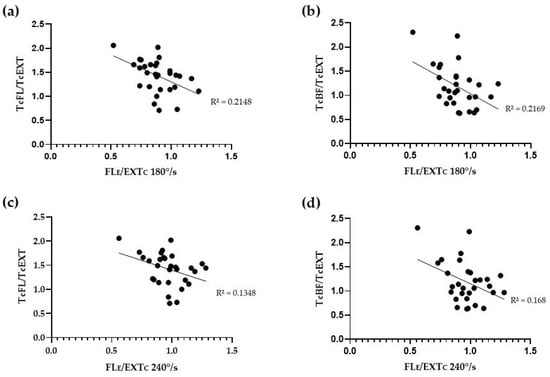
Figure 1.
Correlation between the functional torque ratio of the knee muscles (FLE/EXTC) and the ratios calculated from the TMG parameter contraction time (Tc). (a) Correlation between FLE/EXTC at 180°/s and TcFL/TcEXT; (b) Correlation between FLE/EXTC at 180°/s and TcBF/TcEXT; (c) Correlation between FLE/EXTC at 240°/s and TcFL/TcEXT; (d) Correlation between FLE/EXTC at 240°/s and TcBF/TcEXT. The lines represent linear regression models, and the R2 values indicate the proportion of variance explained.
4. Discussion
This is the first study on the functional validity of the knee flexor-to-extensor ratios measured by tensiomyography (TMG). We investigated the correlations between conventional and functional isokinetic torque ratios and the ratios of time and amplitude TMG parameters of the same muscle groups. In general, the correlations between the isokinetic torque ratios and the TMG ratios were low and not significant. Nevertheless, some TMG ratios, especially those calculated from the contraction time (Tc), were weakly to moderately correlated with the isokinetic torque ratios. A negative correlation was found between the functional isokinetic torque ratio measured at 180°/s and 240°/s and the TcFL/TcEXT and TcBF/TcEXT ratios measured by TMG. In addition, a negative correlation was found between the conventional isokinetic ratio of the knee muscles at 60°/s and TdFL/TdEXT. In contrast, a positive correlation was found between the functional isokinetic ratio measured at 240°/s and the default H/QF TMG ratio. However, we found no significant correlations between the ratios calculated from the TMG amplitude of muscle transverse displacement and any of the isokinetic torque ratios.
TMG measurements have been shown to be valid and useful for the non-invasive assessment of muscle fibre composition, muscle tone, adaptation of muscle contractility to exercise, the degree of peripheral fatigue, the effects of muscle injury and the speed of its recovery, and the assessment of lateral muscle (a)symmetries [19]. However, the relationship between the TMG parameters and the standard indices of isokinetic dynamometry, i.e., the functional validity of TMG, is still poorly understood. The series of articles by Toskić et al. [11,12,13] has shown some weak to moderate correlations between the basic parameters of the two measurement methods. Based on these results, we hypothesised that there must also be an important relationship between the isokinetic flexor-to-extensor torque ratios and their counterpart ratios calculated from the TMG parameters. However, the results of our experiment did not confirm these assumptions.
As for the conventional (concentric) isokinetic torque ratios, the only statistically significant correlation was found with the TdFL/TdEXT ratio (r = −0.397; p = 0.03). This finding suggests that individuals with a lower flexor to extensor muscle twitch latency ratio to electrical stimulation have a higher flexor-to-extensor muscle peak concentric torque ratio, which has been shown to be associated with a lower risk of knee joint injury [20]. Loturco et al. [21] used a similar methodological approach to investigate the relationships between muscle asymmetries measured with an isokinetic dynamometer, vertical jump height and various TMG parameters. In contrast to our results, they found a moderately positive correlation between Td and maximal knee flexor torque measured at 300°/s (r = 0.53; p < 0.05), but no correlation at 60°/s (r = 0.10; p > 0.05) [21]. However, a direct physiological comparison of these associations with our results is not possible, as the ratio between flexor and extensor was not measured in the subjects. The effect of muscle contraction velocity (joint angular velocity) on peak torque and Td is most likely not the same as the effect on flexor-extensor ratio. This needs to be investigated in the future.
Of all the TMG ratios measured in our subjects, the closest associations with the isokinetic ratios were observed for the values calculated from Tc, which is basically an index of the rate of force development during muscle twitch. A longer contraction time (Tc) indicates slower force development and is often associated with a greater proportion of type I muscle fibres. However, this relationship is not exclusive and may be influenced by various other factors, including differences in muscle architecture, fatigue, and neural control mechanisms [22]. The recruitment pattern of muscle fibres is multifactorial, depending on the type, intensity, and duration of activity. During low-intensity contractions, type I fibres are predominantly activated, whereas increasing contraction intensity and duration progressively recruit type II fibres [22]. Therefore, Tc values should be interpreted with caution and not regarded as a definitive indicator of fibre type distribution. Individuals with a higher proportion of type II fibres are therefore able to generate higher peak torques at higher angular velocities during isokinetic tests [23]. Considering that the relationship between the ratio of TcFL/TcEXT and TcBF/TcEXT and the functional isokinetic ratio was significant at medium (180°/s) and high (240°/s) but not at low (60°/s) angular velocities, it appears that Tc is predominantly a function of fast muscle fibres, which are only activated to any significant extent at angular velocities of 180°/s or more [24]. A significant correlation between several basic isokinetic parameters and Tc was also found in other studies. Toskić et al. [11] found a positive correlation between knee extensor strength at 60°/s and the Tc of the vastus medialis muscle (r = 0.41; p ˂ 0.05). In another study, Toskić et al. [12] investigated the concurrent and predictive validity of isokinetic dynamometry and TMG in men and women with different physical performance levels. They divided the subjects into three groups according to their training status, namely, physically inactive, physically active and elite athletes. Correlations were first calculated for the gender-specific subgroups only and then for the gender-specific and physically active subgroups. They found that there was a negative correlation between the maximum torque of the knee extensors at 60°/s and the Tc of the rectus femoris muscle in elite athletes of both genders. In physically inactive women, they found a negative correlation between the maximum torque of the knee extensors at 180°/s and the Tc of the rectus femoris muscle (r = −0.541; p < 0.05). In the same group, moderate negative correlations were also found between the maximum torque of the knee extensors at 60°/s (r = −0.514; p < 0.05) and 180°/s (r = −0.544; p < 0.05) and the Tc of the biceps femoris muscle [12]. In contrast, when comparing their results by gender alone, no statistically significant correlations were found between isokinetic measurements and any of the TMG time variables. In the next study with subjects of different muscle strength [13], the authors showed negative correlations between Tc of the biceps femoris muscle and knee extensor strength at 60°/s and 180°/s, as well as knee flexor strength at 60°/s and 180°/s in the low muscle strength group but not in the high muscle strength group. Thus, the trend of association between the flexor-to-extensor ratios calculated from the isokinetic peak torques and the TMG parameter Tc found in our study partially agrees with these results of Toskić et al. [12,13]. It is important to emphasise, however, that the statistically significant correlations we observed were only low to moderate in magnitude, with isokinetic ratios accounting for merely 13–21% of the variability in TMG ratios. Therefore, the physiological and clinical relevance of these associations is likely to be limited. However, we found no significant relationship between the TMG ratios of the transverse displacement amplitude (Dm) of the knee muscles and their concentric and functional isokinetic torque ratios. This does not confirm the results of Toskić et al. [11], who reported significant positive correlations between knee flexor strength at 60°/s and the Dm of the vastus medialis muscle (r = 0.47). Toskić et al. [12] also found statistically significant but negative correlations between the Dm of the biceps femoris muscle and the maximum torque of the flexors and extensors at 60°/s and 180°/s in women, but only for the knee extensors at 180°/s in men. All correlations between Dm and the isokinetic torques of a given muscle were statistically significant but weak (r = −0.289 to −0.390). In their later study [13], a significant negative correlation was also found between the Dm of the biceps femoris muscle and the strength of the knee extensors at 60 and 180°/s in the group of individuals with intermediate muscle strength.
The fact that our initial hypotheses, which were based on previous associations between TMG and isokinetic dynamometric measurements [11,12,13], were not unequivocally confirmed by the experimental results may be attributed to several factors. Firstly, minor variations in electrode placement and skinfold thickness may influence the pattern of muscle fibre recruitment across individuals during electrical stimulation, potentially affecting Dm values. Nevertheless, the inter-rater reliability of the Dm parameter has been reported as good (r = 0.86) [25]. In our study, we further enhanced this reliability by ensuring that all TMG measurements were conducted by a single rater. Therefore, we believe that electrode placement did not constitute a source of error in our results. To further enhance the reliability of future measurements, it is recommended that skinfold thickness be precisely measured and documented. Secondly, although Dm and Tc are considered the most reliable TMG parameters [26] and therefore the best candidates for association with the isokinetic parameters, they may have the methodological disadvantage that they are linked, i.e., the higher the Dm, the longer the Tc. Therefore, the calculation of the contraction velocity (Vc), which is independent of the maximal amplitude of the muscle [19], might be better suited to detect correlations with the isokinetic parameters. Thirdly, the difference in the type of muscle contraction used for TMG and isokinetic dynamometry may also have influenced the magnitude of associations observed between the two. This is because the isokinetic measurements are performed with voluntary dynamic concentric-eccentric muscle contractions at a constant speed of movement, whereas TMG measures contractile properties of the muscle during a brief isometric muscle contraction [27]. Therefore, it may be that the associations of TMG ratios are better when compared to the torque ratios of maximal voluntary isometric contraction (MVIC). However, because TMG measures the response of an involuntary muscle to a short-duration electrical stimulus (twitch) that does not mimic the complex intermuscular coordination required for isokinetic torque testing, it is unlikely that the associations would improve substantially. Another important limitation of our methodology is the small sample size and, consequently, the relatively low power of the statistical tests used to detect associations. Moreover, the observed correlations between TMG and isokinetic parameters were weak to moderate; thus, their physiological significance should be interpreted with caution. Interpreting contraction time (Tc) as a direct indicator of muscle fibre type composition may be overly simplistic, as Tc is also affected by factors such as neuromuscular coordination, fatigue, and subcutaneous tissue thickness. Additionally, we acknowledge that potential confounding variables, such as gender, BMI, and physical activity level, were not controlled for in our study. Future research employing samples matched for these variables may yield deeper insights into the relationship between muscle contractile characteristics as measured by TMG and isokinetic dynamometry. Finally, we recommend that subsequent studies more clearly differentiate between the technical limitations of measurement methodologies (e.g., inter-operator variability, electrode placement, and measurement sensitivity) and the inherent biological variability within the sample (e.g., individual differences in muscle architecture and activation patterns).
5. Conclusions
The aim of this study was to evaluate whether the ratio of knee flexor and extensor muscles, assessed through various TMG parameters, could serve as a substitute for standard dynamometric measurements of isokinetic peak torque ratios. Most observed correlations were weak and not statistically significant. The only significant, albeit weak to moderate, negative correlations were found between the functional isokinetic knee muscle ratios and TMG-derived contraction time and delay time ratios, indicating some noteworthy inverse relationships between the two assessment methods. There was a weak trend toward stronger associations between TMG ratios derived from temporal parameters and isokinetic torque ratios at higher angular velocities (≥180°/s). Nevertheless, these statistically significant correlations accounted for only 13–21% of the variability in TMG ratios, implying limited physiological and clinical relevance. Given the overall low strength of these associations, we conclude that TMG ratios should not be considered a direct substitute for isokinetic torque ratios in assessing muscular imbalances of the knee muscle groups. Further research with larger sample sizes is necessary to substantiate or challenge these findings. Despite methodological limitations, this experimental study represents a valuable contribution to the ongoing investigation of the relationship between the contractile properties of involuntary muscle contractions measured by TMG and voluntary activation capacity assessed through isokinetic dynamometry.
Author Contributions
Conceptualization, A.K. and D.W.; methodology, A.K., D.W. and A.H.; software, A.K., D.W. and A.H.; validation, A.K., D.W. and A.H.; formal analysis, A.K., D.W. and A.H.; investigation, A.K., D.W. and A.H.; resources, A.K., D.W. and A.H.; data curation, A.K., D.W. and A.H.; writing—original draft preparation, D.W. and A.K.; writing—review and editing, A.K., D.W. and A.H.; visualization, A.K.; supervision, A.K. All authors have read and agreed to the published version of the manuscript.
Funding
This research was supported by grants from the Slovenian Research Agency (Research program P3-0043) and the University Medical Centre Ljubljana institutional research funding grants (20190041 and 20200063).
Institutional Review Board Statement
The study protocol was approved by the National Medical Ethics Committee of the Republic of Slovenia (No: 0120-382/2020-3) and was conducted in accordance with the Declaration of Helsinki and Ovid Convention. The experiments conducted in this study are in accordance with the applicable laws of the Republic of Slovenia and the EU.
Informed Consent Statement
All subjects received detailed verbal and written information and agreed to participate voluntarily with their signature.
Data Availability Statement
The data presented in this study are available on reasonable request from the corresponding author.
Conflicts of Interest
The authors declare no conflicts of interest.
Abbreviations
The following abbreviations are used in this manuscript:
| Dm | amplitude of the transverse displacement of the muscle belly |
| DmBF/DmEXT | the ratio of the amplitude of the transverse displacement of the muscle belly between the value of the biceps femoris muscle and the mean value of the knee extensors |
| DmFL/DmEXT | the ratio of the amplitude of the transverse displacement of the muscle belly between the mean value of the flexors and the mean value of the extensors of the knee |
| FL/EXT | ratio of the maximum torques between the flexors and extensors of the knee |
| FLE/EXTC | the functional ratio between the maximum eccentric torque of the flexors and the maximum concentric torque of the extensors of the knee |
| FLC/EXTC | conventional ratio of the maximum concentric torque of the knee flexors and extensors |
| H/QF | hamstrings to quadriceps femoris ratio preinstalled in the TMG software |
| Tc | time of muscle contraction |
| TcBF/TcEXT | the ratio of the contraction time of the muscle belly between the value of the biceps femoris muscle and the mean value of the knee extensors |
| TcFL/TcEXT | the ratio of the contraction time of the muscle belly between the mean value of the flexors and the mean value of the extensors of the knee |
| Td | delay time of muscle contraction |
| TdBF/TdEXT | ratio of the delay time of muscle contraction between the value of the biceps femoris muscle and the mean value of the knee extensor muscle |
| TdFL/TdEXT | the ratio of the delay time of muscle contraction between the mean value of the flexors and the mean value of the knee extensors |
| Tr | half-time of muscle relaxation |
| Ts | sustain time of muscle contraction |
| TsBF/TsEXT | the ratio of the muscle contraction holding time between the value of the biceps femoris muscle and the mean value of the knee extensors |
| TsFL/TsEXT | the ratio of the muscle contraction dwell time between the mean value of the flexors and the mean value of the knee extensors |
| Vc | muscle contraction velocity |
References
- Osternig, L. Isokinetic Dynamometry Implications for Muscle. Exerc. Sport Sci. Rev. 1986, 14, 45–80. [Google Scholar] [CrossRef] [PubMed]
- Murphy, D.F.; Connolly, D.A.J.; Beynnon, B.D. Risk Factors for Lower Extremity Injury: A Review of the Literature. Br. J. Sports Med. 2003, 37, 13–29. [Google Scholar] [CrossRef] [PubMed]
- Orizio, C.; Cogliati, M.; Bissolotti, L.; Diemont, B.; Gobbo, M.; Celichowski, J. The Age Related Slow and Fast Contributions to the Overall Changes in Tibialis Anterior Contractile Features Disclosed by Maximal Single Twitch Scan. Arch. Gerontol. Geriatr. 2016, 66, 1–6. [Google Scholar] [CrossRef] [PubMed]
- Cometti, G.; Maffiuletti, N.A.; Pousson, M.; Chatard, J.C.; Maffulli, N. Isokinetic Strength and Anaerobic Power of Elite, Subelite and Amateur French Soccer Players. Int. J. Sports Med. 2001, 22, 45–51. [Google Scholar] [CrossRef]
- Šimunič, B. Between-Day Reliability of a Method for Non-Invasive Estimation of Muscle Composition. J. Electromyogr. Kinesiol. 2012, 22, 527–530. [Google Scholar] [CrossRef]
- Koren, K.; Šimunič, B.; Rejc, E.; Lazzer, S.; Pišot, R. Differences between Skeletal Muscle Contractile Parameters Estimated from Transversal Tensiomyographic and Longitudinal Torque Twitch Response. Kines 2015, 47, 19–26. [Google Scholar]
- Pišot, R.; Narici, M.V.; Šimunič, B.; De Boer, M.; Seynnes, O.; Jurdana, M.; Mekjavić, I.B. Whole Muscle Contractile Parameters and Thickness Loss during 35-Day Bed Rest. Eur. J. Appl. Physiol. Occup. Physiol. 2008, 104, 409–414. [Google Scholar] [CrossRef]
- García-García, O. The Relationship between Parameters of Tensiomyography and Potential Performance Indicators in Professional Cyclists. Rev. Int. Med. Cienc. Act. Fis. 2013, 13, 771–781. [Google Scholar]
- Gil, S.; Loturco, I.; Tricoli, V.; Ugrinowitsch, C.; Kobal, R.; Cavinato, C.; Abad, C.; Roschel, H.; Gil, S.; Loturco, I. Tensiomyography Parameters and Jumping and Sprinting Performance in Brazilian Elite Soccer Players. Sport. Biomech. 2015, 14, 340–351. [Google Scholar] [CrossRef]
- Valenzuela, P.L.; Montalvo, Z.; Torrontegi, E.; Calle-herrero, J.D.E.L.A.; Maffiuletti, N.A.; Villa, P.D.E.L.A. Relationship between Skeletal Muscle Contractile Properties and Power Production Capacity in Female Olympic Rugby Players. Eur. J. Sport Sci. 2018, 18, 677–684. [Google Scholar] [CrossRef]
- Toskić, L.; Dopsaj, M.M.; Koropanovski, N.; Studies, P. Measured with Isokinetic and Tmg Methods: Pilot Study. Relations between neuromuscular contractile properties of leg muscles measured with isokinetic and tmg methods: Pilot study. In Proceedings of the XVIII Scientific Conference »Fis Communications 2015« in Physical Education, Sport ande Recreation and III International Scientific Conference, Niš, Serbia, 18–20 October 2015. [Google Scholar]
- Toskić, L.; Dopsaj, M.; Stanković, V.; Marković, M. Concurrent and Predictive Validity of Isokinetic Dynamometry and Tensiomyography in Differently Trained Women and Men. Isokinet. Exerc. Sci. 2019, 27, 31–39. [Google Scholar] [CrossRef]
- Toskić, L.; Marković, M.; Stanković, V. Relationship between Isokinetic Dynamometry and Tensiomyograpfy in Individuals with Different Muscle Power Manifestation. Serbian J. Sport. Sci. 2020, 11, 69–74. [Google Scholar]
- Morris, A.; Lussier, L.; Bell, G.; Dooley, J. Hamstring/Quadriceps Strength Ratios in Collegiate Middle-Distance and Distance Runners. Phys. Sportsmed. 1983, 11, 71–77. [Google Scholar] [CrossRef] [PubMed]
- Aagaard, P.; Simonsen, E.B.; Trolle, M.; Bangsbo, J.; Klausen, K. Isokinetic Hamstring/Quadriceps Strength Ratio: Influence from Joint Angular Velocity, Gravity Correction and Contraction Mode. Acta Physiol. Scand. 1995, 154, 421–427. [Google Scholar] [CrossRef]
- Dvir, Z.; Eger, G.; Halperin, N.; Shklar, A. Thigh Muscle Activity and Anterior Cruciate Ligament Insufficiency. Clin. Biomech. 1989, 4, 87–91. [Google Scholar] [CrossRef]
- Yamamoto, T. Relationship between Hamstring Strains and Leg Muscle Strength. A Follow-up Study of Collegiate Track and Field Athletes. J Sport. Med Phys Fitness. 1993, 33, 194–199. [Google Scholar]
- Colliander, E.B.; Tesch, P.A. Bilateral Eccentric and Concentric Torque of Quadriceps and Hamstring Muscles in Females and Males. Eur. J. Appl. Physiol. Occup. Physiol. 1989, 59, 227–232. [Google Scholar] [CrossRef]
- Macgregor, L.J.; Hunter, A.M.; Orizio, C.; Fairweather, M.M.; Ditroilo, M. Assessment of Skeletal Muscle Contractile Properties by Radial Displacement: The Case for Tensiomyography. Sport. Med. 2018, 48, 1607–1620. [Google Scholar] [CrossRef]
- Cheung, R.; Smith, A.; Wong, D. H:Q Ratios and Bilateral Leg Strength in College Field and Court Sports Players. J. Hum. Kinet. 2012, 33, 63–71. [Google Scholar] [CrossRef]
- Loturco, I.; Pereira, L.A.; Kobal, R.; Abad, C.C.C.; Komatsu, W.; Cunha, R.; Arliani, G.; Ejnisman, B.; Pochini, A.D.C.; Nakamura, F.Y. Functional Screening Tests: Interrelationships and Ability to Predict Vertical Jump Performance. Int. J. Sports Med. 2018, 39, 189–197. [Google Scholar] [CrossRef]
- Gaines, J.M.; Talbot, L.A. Isokinetic Strength Testing in Research and Practice. Biomed Res. Int. 1999, 1, 57–64. [Google Scholar] [CrossRef]
- Gregor, R.J.; Edgerton, V.R.; Perrine, J.J.; Campion, D.S.; DeBus, C. Torque-Velocity Relationships and Muscle Fiber Composition in Elite Female Athletes. J. Appl. Physiol. Respir. Environ. Exerc. Physiol. 1979, 47, 388–392. [Google Scholar] [CrossRef] [PubMed]
- Barnes, W.S. The Relationship of Motor-Unit Activation to Isokinetic Muscular Contraction at Different Contractile Velocities. Phys. Ther. 1980, 60, 1152–1157. [Google Scholar] [CrossRef] [PubMed][Green Version]
- Tous-Fajardo, J.; Moras, G.; Rodríguez-Jiménez, S.; Usach, R.; Doutres, D.M.; Maffiuletti, N.A. Inter-Rater Reliability of Muscle Contractile Property Measurements Using Non-Invasive Tensiomyography. J. Electromyogr. Kinesiol. 2010, 20, 761–766. [Google Scholar] [CrossRef]
- Martín-Rodríguez, S.; Loturco, I.; Hunter, A.M.; Rodríguez-Ruiz, D.; Munguia-Izquierdo, D. Reliability and Measurement Error of Tensiomyography to Assess Mechanical Muscle Function: A Systematic Review. J. Strength Cond. Res. 2017, 31, 3524–3536. [Google Scholar] [CrossRef]
- García-García, O.; Cuba-Dorado, A.; Álvarez-Yates, T.; Carballo-López, J.; Iglesias-Caamaño, M. Clinical Utility of Tensiomyography for Muscle Function Analysis in Athletes. Open Access J. Sport. Med. 2019, 10, 49–69. [Google Scholar] [CrossRef] [PubMed]
Disclaimer/Publisher’s Note: The statements, opinions and data contained in all publications are solely those of the individual author(s) and contributor(s) and not of MDPI and/or the editor(s). MDPI and/or the editor(s) disclaim responsibility for any injury to people or property resulting from any ideas, methods, instructions or products referred to in the content. |
© 2025 by the authors. Licensee MDPI, Basel, Switzerland. This article is an open access article distributed under the terms and conditions of the Creative Commons Attribution (CC BY) license (https://creativecommons.org/licenses/by/4.0/).