1. Introduction
In sports science research and field-based performance testing, concepts of validity and reliability are fundamental to evaluating the quality of measurement tools [
1]. Validity refers to the degree to which an instrument measures what it is intended to measure, encompassing subcategories such as concurrent validity (comparison with a gold standard), construct validity (theoretical consistency) and criterion validity (correlation with a criterion measure) [
1,
2,
3]. Reliability, on the other hand, concerns the consistency and repeatability of a measurement across time and conditions. It includes intra-rater reliability (consistency of measurements by the same evaluator), inter-rater reliability (consistency across different evaluators) and test–retest reliability (stability of results across repeated trials) [
1,
2,
3]. In method comparison studies, Bland and Altman (1986) highlighted the limitations of correlation coefficients for assessing agreement among measurement tools, proposing instead a graphical method (Bland–Altman plot) and complementary calculations that more accurately evaluate how closely two methods agree, rather than simply how strongly they are associated [
4,
5]. Thus, establishing both validity and reliability is essential when introducing or adopting performance assessment tools in both research and applied sports settings, particularly when evaluating explosive actions such as vertical jumping [
6].
A substantial amount of research has either investigated the accuracy and reliability of different wearable devices (including MyJump) on jump performance or used them for jumping ability evaluation [
7,
8,
9,
10,
11,
12,
13,
14,
15,
16,
17,
18,
19,
20,
21,
22,
23,
24,
25,
26]. A survey of the recent literature indicates that Davor et al. [
7] examined the validity and reliability of the MyJump 3 app and Enode Sensor against a force plate to measure vertical jump height in professional male basketball players. Their findings demonstrated that both tools showed excellent reliability (ICC ≥ 0.91) and strong agreement with force plate measurements, although both slightly overestimated jump height. However, it is important to note that force plates serve as gold standards for capturing jump height and other kinetic variables, such as force and power, which are particularly useful for detailed biomechanical analysis. Notably, the MyJump 3 app demonstrated closer agreement and stronger predictive validity (R
2 = 0.973) than the Enode Sensor, further supporting its use as a practical and cost-effective alternative for field-based performance monitoring; however, the authors emphasize the need for further research to explore its effectiveness across more diverse populations and real-world conditions [
7].
Medeiros et al. [
11] assessed the validity and reliability of the MyJump 2 app for evaluating countermovement jump (CMJ) performance on sand surfaces in elite female beach volleyball players. The app demonstrated strong agreement with force platform measurements for jump height and flight time (ICC = 0.85), with Bland–Altman analysis showing narrow limits of agreement. However, peak power showed only moderate agreement (ICC = 0.64), indicating that while the app is valid for assessing jump height and flight time on sand, caution is warranted when interpreting power metrics.
A recent advancement in mobile-based assessment tools is the updated version of MyJump 2, the MyJump Lab app, which incorporates artificial intelligence to estimate vertical jump metrics such as height, force, velocity and power. Balsalobre-Fernández and Varela-Olalla [
10] demonstrated that the app exhibits high validity and reliability compared to force platforms (r > 0.91; α > 0.93; CV < 6%) under both loaded and unloaded countermovement jump (CMJ) conditions, highlighting the app’s practical potential as a cost-effective alternative for comprehensive jump performance analysis in field settings.
The study by Abrahin et al. [
8] confirmed the excellent validity and reliability of the MyJump 2 application for assessing squat jump (SJ) and countermovement jump (CMJ) height performance in both junior and adult athletes, showing near-perfect correlations (r = 0.99) with an infrared platform. These findings support the app’s applicability across different age groups in sports performance testing. Similarly, Stojiljković et al. [
9] demonstrated that the MyJump 2 app is a valid and reliable instrument for assessing drop jump performance and interlimb asymmetry in young female basketball players, with nearly perfect correlations (r = 0.98–0.99) and excellent inter-device reliability (ICC = 0.99). These results could reinforce the app’s utility for performance monitoring in youth athletic populations.
While the use of the MyJump 2 application for assessing jump performance has been explored in previous research, the present study offers a meaningful contribution by extending this evaluation to a broader age spectrum of soccer players, encompassing both adolescent and junior athletes under the age of 18. Importantly, few studies to date have included mixed samples of adult and youth athletes. As such, this study provides valuable insights into the accuracy and consistency of MyJump 2 across different stages of athletic development.
Thus, the aim of this study was to examine the validity and reliability of countermovement jump (CMJ) and squat jump (SJ) performance measurements obtained using the MyJump 2 smartphone application in comparison with the Chronojump system. Both squat jump (SJ) and countermovement jump (CMJ) were included to capture distinct neuromuscular characteristics. While CMJ involves the utilization of the stretch-shortening cycle and reflects elastic energy contributions, SJ isolates concentric muscle action, providing complementary insight into lower-limb power output. Evaluating both jump types enables a more comprehensive assessment of the application’s measurement accuracy across different motor strategies, as commonly applied in sports performance testing. Moreover, this investigation focused on youth soccer players (U14–U19), a developmentally dynamic population undergoing neuromuscular maturation and movement variability, where validating such applications is crucial to support reliable performance monitoring, longitudinal development and early talent identification. The objectives of this study were to assess the agreement between CMJ and SJ values recorded by MyJump 2 and Chronojump, determine the intra-session reliability of MyJump 2 across repeated trials for both jump types and evaluate its practicality and validity for monitoring jump performance in soccer players of different age groups.
2. Materials and Methods
2.1. Participants
A total of 21 male soccer players were randomly selected from different age groups (U14 to U19) within an elite competitive soccer team. The mean age was 16.6 years (95% CI: 15.7–17.4), with a standard deviation of 1.87 years. The mean height of the participants was 1.77 m (95% CI: 1.73–1.80), and their mean body mass was 69.4 kg (95% CI: 65.0–73.8), with a standard deviation of 9.65 kg. The mean body mass index (BMI) was 22.2 kg/m2 (95% CI: 21.3–23.2), and the mean body fat percentage (%) was 11.5% (95% CI: 10.7–12.3).
To be eligible for participation, inclusion criteria required participants to (a) have prior experience with countermovement jump (CMJ) and squat jump (SJ) testing and (b) have no lower extremity injuries in the past six months. Respectively, individuals who had undergone lower limb surgeries or experienced significant injuries in the past year were not included in the present study. To reduce the potential influence of fatigue, all participants were instructed to avoid strenuous physical activity for at least 48 h prior to the testing session.
The investigation was approved by the institutional review board and was conducted in accordance with the Declaration of Helsinki. Informed consent was obtained from all participants prior to the commencement of the study. For participants aged 18 years and older, written consent was provided directly by the athletes, while for those under the age of 18, consent was obtained from their parents or legal guardians.
2.2. Data Collection and Analysis Procedures
This study employed a cross-sectional observational design to compare jump height measurements obtained from Chronojump and MyJump during countermovement jump (CMJ) and squat jump (SJ) assessments. All data collection took place in a controlled laboratory environment, ensuring consistent testing conditions. The testing session was conducted between 09:00 and 11:00 on a stable and level indoor surface, with consistent artificial lighting and an ambient temperature maintained at 21 ± 2 °C and ~40% humidity.
Upon arrival at the laboratory, participants underwent anthropometric measurements. A standardized 10 min warm-up protocol was implemented, beginning with 6 min of cycling on a Monark 839 ergometer (Varberg, Sweden) at a steady intensity of 100 Watts. This was followed by approximately 4 min of dynamic exercises.
Participants were instructed on the proper execution of the CMJ and SJ tests. Given that prior jump testing experience was an inclusion criterion, all athletes were familiar with the testing protocol. Participants performed the jumps wearing their own athletic footwear, as no standardized shoes were imposed. Additionally, a familiarization session was conducted prior to testing to ensure participants were comfortable with the specific measurement tools (Chronojump and MyJump 2). During the session, both tools were used simultaneously to record jump performance, ensuring consistency across the measurements. The CMJ test required participants to stand with their hands on their hips, perform a rapid countermovement and then jump as high as possible. The SJ test followed a similar setup, but participants started from a static squat position without a countermovement.
Each participant completed three maximal effort jumps per test (CMJ and SJ), with a 2 min rest interval between attempts to minimize the effects of fatigue, in accordance with previous research [
7,
21]. The highest jump from each test was selected for statistical analysis. The order of testing was fixed, with all participants performing the countermovement jump (CMJ) followed by the squat jump (SJ).
Jump heights were recorded simultaneously using Chronojump and MyJump to enable a direct comparison between the two systems. For intra-rater reliability assessment, the jump videos were analyzed on the day of measurement and reanalyzed using the MyJump app seven days later by the same researcher [
27], who was blinded to the original data during reanalysis to assess consistency across repeated measurements and minimize potential bias.
2.3. Research Tools
2.3.1. Chronojump
The Chronojump electronic leap mat (Chronojump, Boscosystem, Barcelona, Spain) was used in this study to measure jump height during countermovement jump (CMJ) and squat jump (SJ) assessments. Chronojump is an open-source contact mat system widely utilized for vertical jump performance testing, providing an accessible and cost-effective alternative to proprietary force platforms. According to Pueo et al. [
28], the Chronojump system exhibits high reliability and validity compared to proprietary jump measurement devices (almost perfect agreement (ICC = 0.999–1.000). Furthermore, Chronojump–Boscosystem has been shown to provide moderate to high reliability for countermovement jump (CMJ) assessments, with intraclass correlation coefficients (ICCs) ranging from 0.86 to 0.93, confirming its suitability for measuring lower-limb power in athletic populations [
29].
2.3.2. MyJump 2 App
The MyJump 2 application, compatible with both iOS and Android platforms, enables the assessment of jump performance through video-based analysis. It calculates jump height by determining flight time captured via the smartphone camera. Users record vertical jumps, and the app analyzes the footage to extract performance-related metrics. It supports various jump modalities, including countermovement jump (CMJ), squat jump (SJ), and drop jump (DJ). For the purposes of this study, the application was operated on an iPhone 15 Pro with 240 Hz video recording capability. The device was mounted on a tripod 30 cm above the ground and placed 1.5 m away from the participant, as per manufacturer guidelines, resulting in an estimated viewing angle of 11.5°, as established in previous studies [
12,
30]. This configuration was consistently maintained across all participants and trials using fixed tripod placement and floor markings to ensure standardized recording conditions throughout the data collection process.
2.4. Statistical Analysis
A priori power analysis was conducted using G*Power (version 3.1.9.7) to determine the required sample size, ensuring adequate statistical power for detecting meaningful differences [
31,
32]. Two separate analyses were performed: one for validity assessment using correlation analysis and another for reliability assessment using repeated measures ANOVA. The results indicated that a minimum of 8 participants was required for the validity analysis, while at least 15 participants were necessary for the reliability assessment to achieve sufficient statistical power. However, it was agreed to include a sample size exceeding the minimum requirement of 15 participants in order to enhance the precision of estimates between MyJump 2 and Chronojump for both countermovement jump (CMJ) and squat jump (SJ) assessments in soccer players across different age groups.
All statistical analyses were conducted using IBM SPSS Statistics (version 29 for Windows), Jamovi (version 2.6.23.0 for Windows) and R (version 4.4) [
33,
34,
35]. Agreement and reliability analyses were performed using the SimplyAgree package [
36], while additional statistical procedures and model diagnostics were supported by the car package for applied regression [
37] and the emmeans package for estimating marginal means [
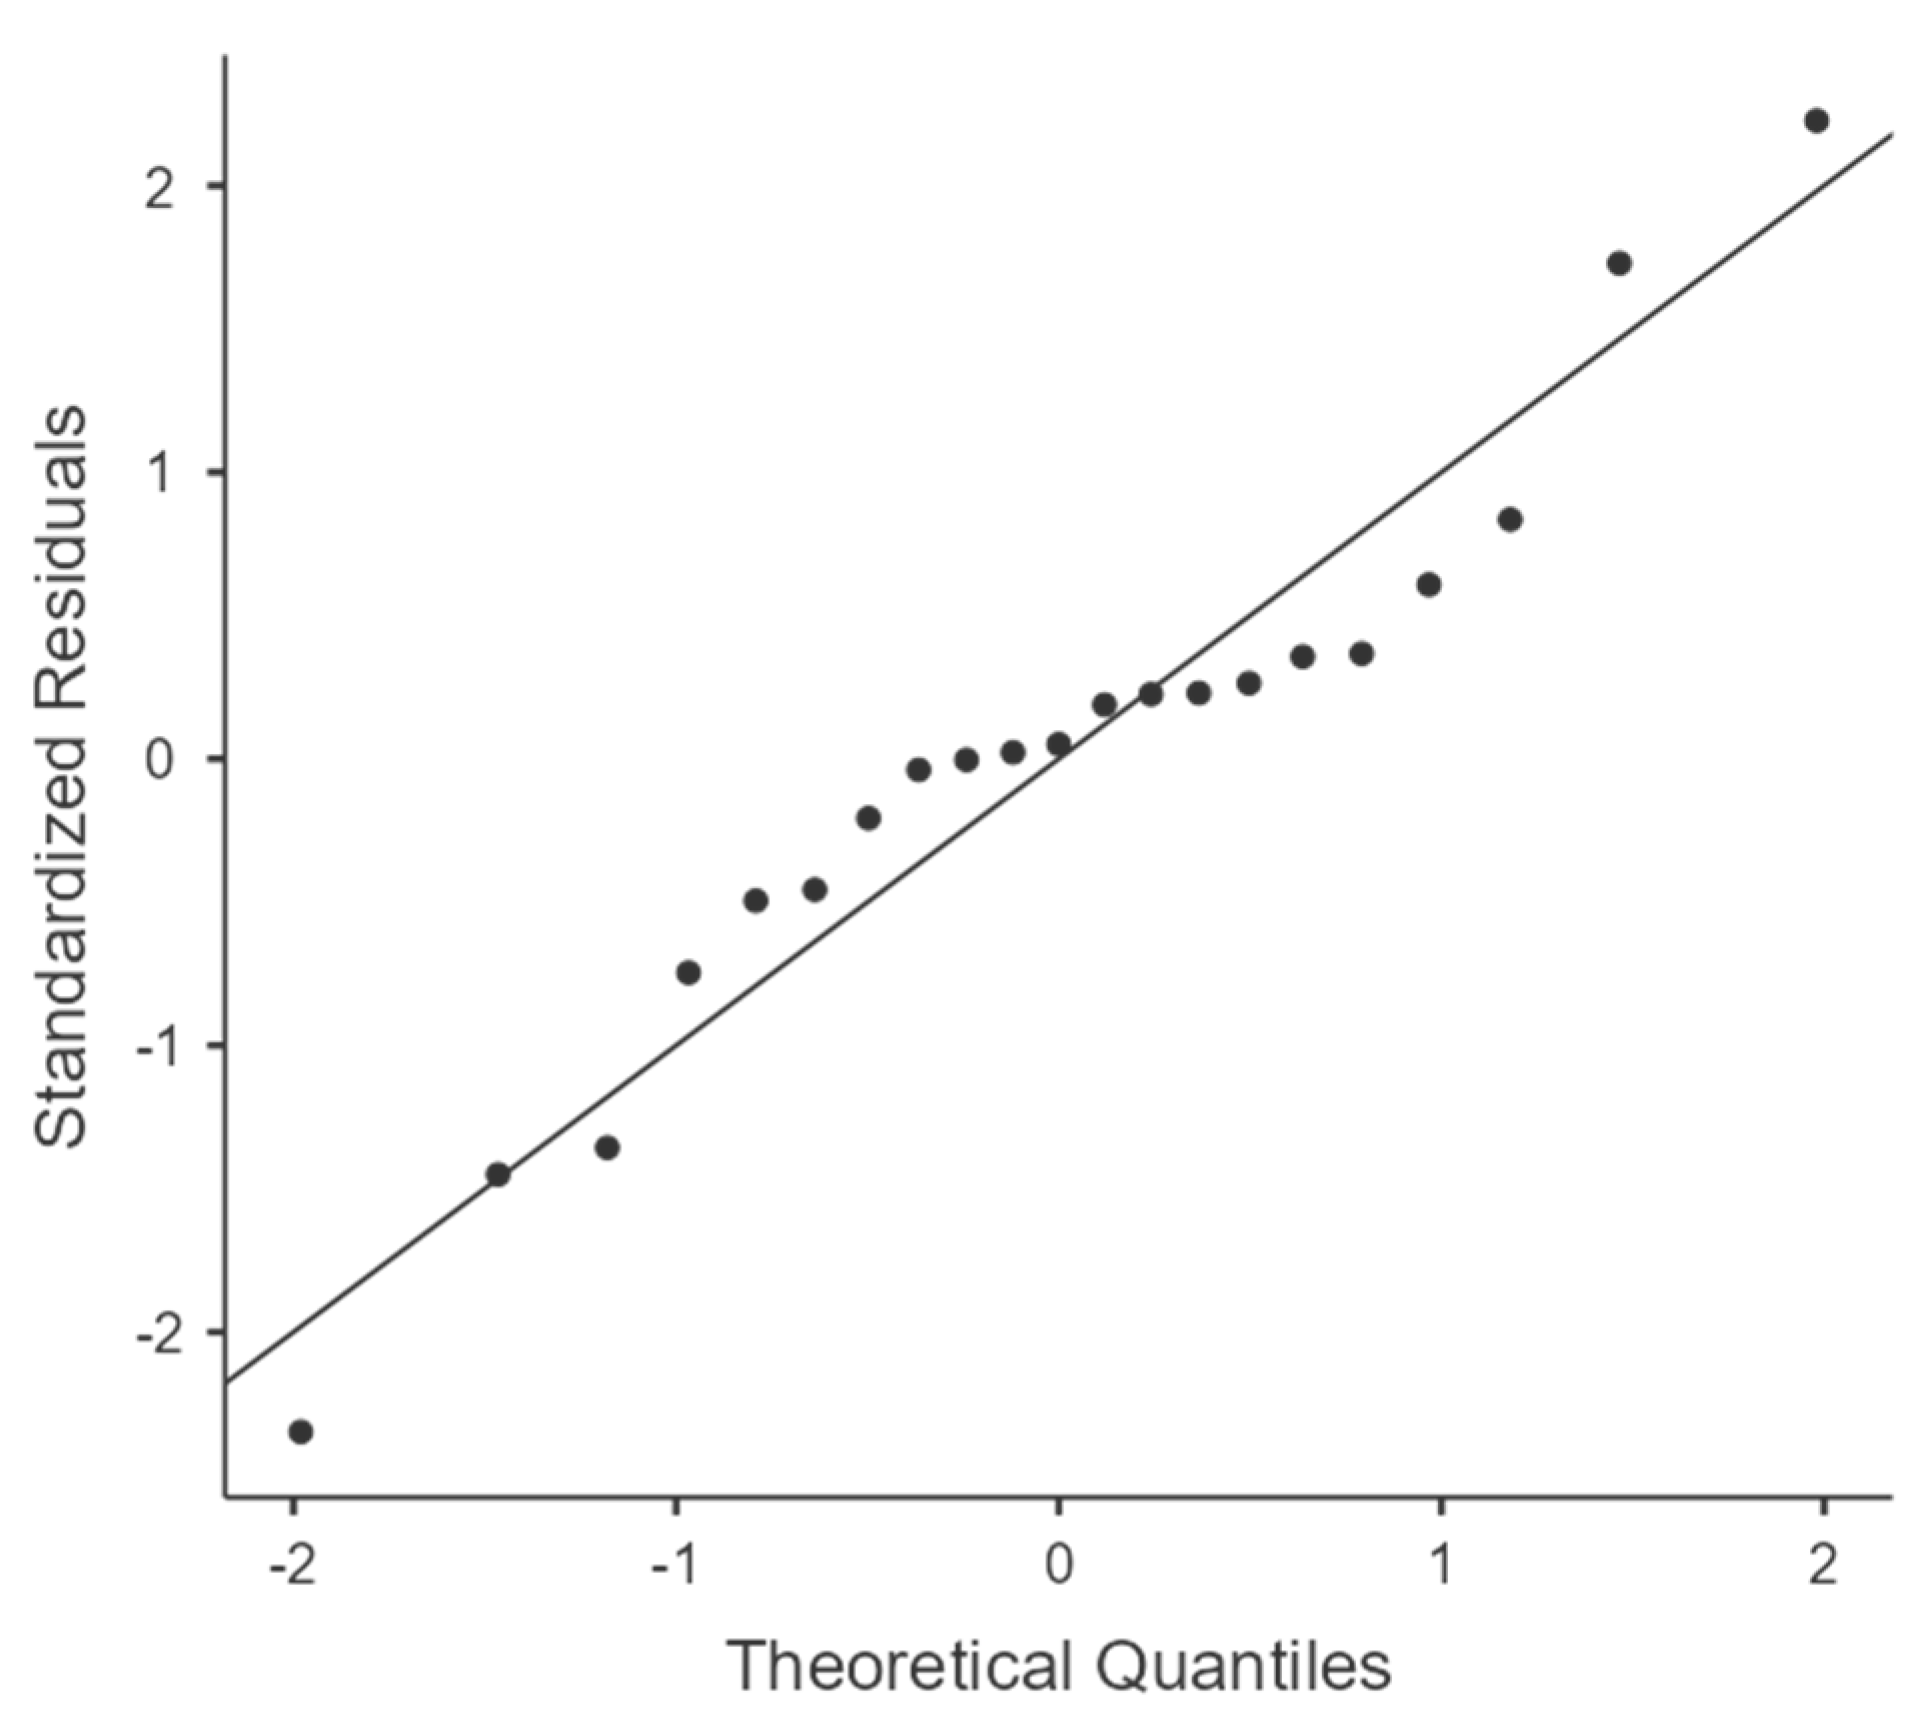
38]. Descriptive statistics, including mean and standard deviation (SD), were calculated for countermovement jump (CMJ) and squat jump (SJ) performance, as measured by Chronojump and MyJump. Normality was assessed using the Shapiro–Wilk test, which confirmed that all variables followed a normal distribution (
p > 0.05).
To evaluate the validity of MyJump in comparison to Chronojump, Bland–Altman analysis was performed to assess the systematic bias and 95% limit of agreement (LoA). The mean bias between the two methods was computed, along with confidence intervals (CIs) for the LoA, to determine the extent of agreement and possible measurement discrepancies. Additionally, the association between MyJump and Chronojump measurements was analyzed using Pearson’s correlation coefficient (r) and Spearman’s rho (ρ) to assess both linear and rank-order relationships. Moreover, a linear regression model was applied to examine the predictive validity of MyJump against Chronojump measurements.
To determine the reliability of MyJump measurements, test–retest reliability was assessed by comparing MyJump test and retest values. Intraclass correlation coefficients (ICCs) were computed to evaluate absolute and average agreement across trials. Specifically, one-way and two-way random models (ICC1, ICC2) were used for absolute agreement, while the two-way fixed model (ICC3) assessed consistency. Average agreement across repeated trials was estimated using ICC1k, ICC2k and ICC3k. Further, measurement variability was quantified using the coefficient of variation (CV%), standard error of measurement (SEM), standard error of the estimate (SEE), minimum detectable change (MDC)—calculated using the mathematical formula MDC = 1.96 × √2 × SEM—and standard error of prediction (SEP). A Bland–Altman analysis was also conducted to assess agreement between the MyJump test and retest measurements, providing mean bias, 95% LoA and confidence interval (CI) to evaluate systematic differences and test–retest consistency.
The intraclass correlation coefficients (ICCs) for both validity and intra-rater reliability [
39] values ranging from 0.90 to 1.00 were considered very high correlations, those between 0.70 and 0.89 indicated a high correlation, values within 0.50 to 0.69 reflected a moderate correlation, ICCs between 0.26 and 0.49 were classified as low correlations and values from 0.00 to 0.25 suggested minimal to no correlation. Statistical significance was set at
p < 0.05.
3. Results
3.1. Validity
The descriptive statistics for countermovement jump (CMJ) and squat jump (SJ) performances assessed via Chronojump and MyJump are presented in
Table 1. The mean CMJ height recorded using Chronojump was 36.1 ± 4.93 cm, whereas MyJump produced slightly higher values (37.1 ± 4.94 cm). A similar pattern was observed in the SJ test, where Chronojump measured a mean height of 34.6 ± 2.90 cm, while MyJump yielded 35.6 ± 3.01 cm.
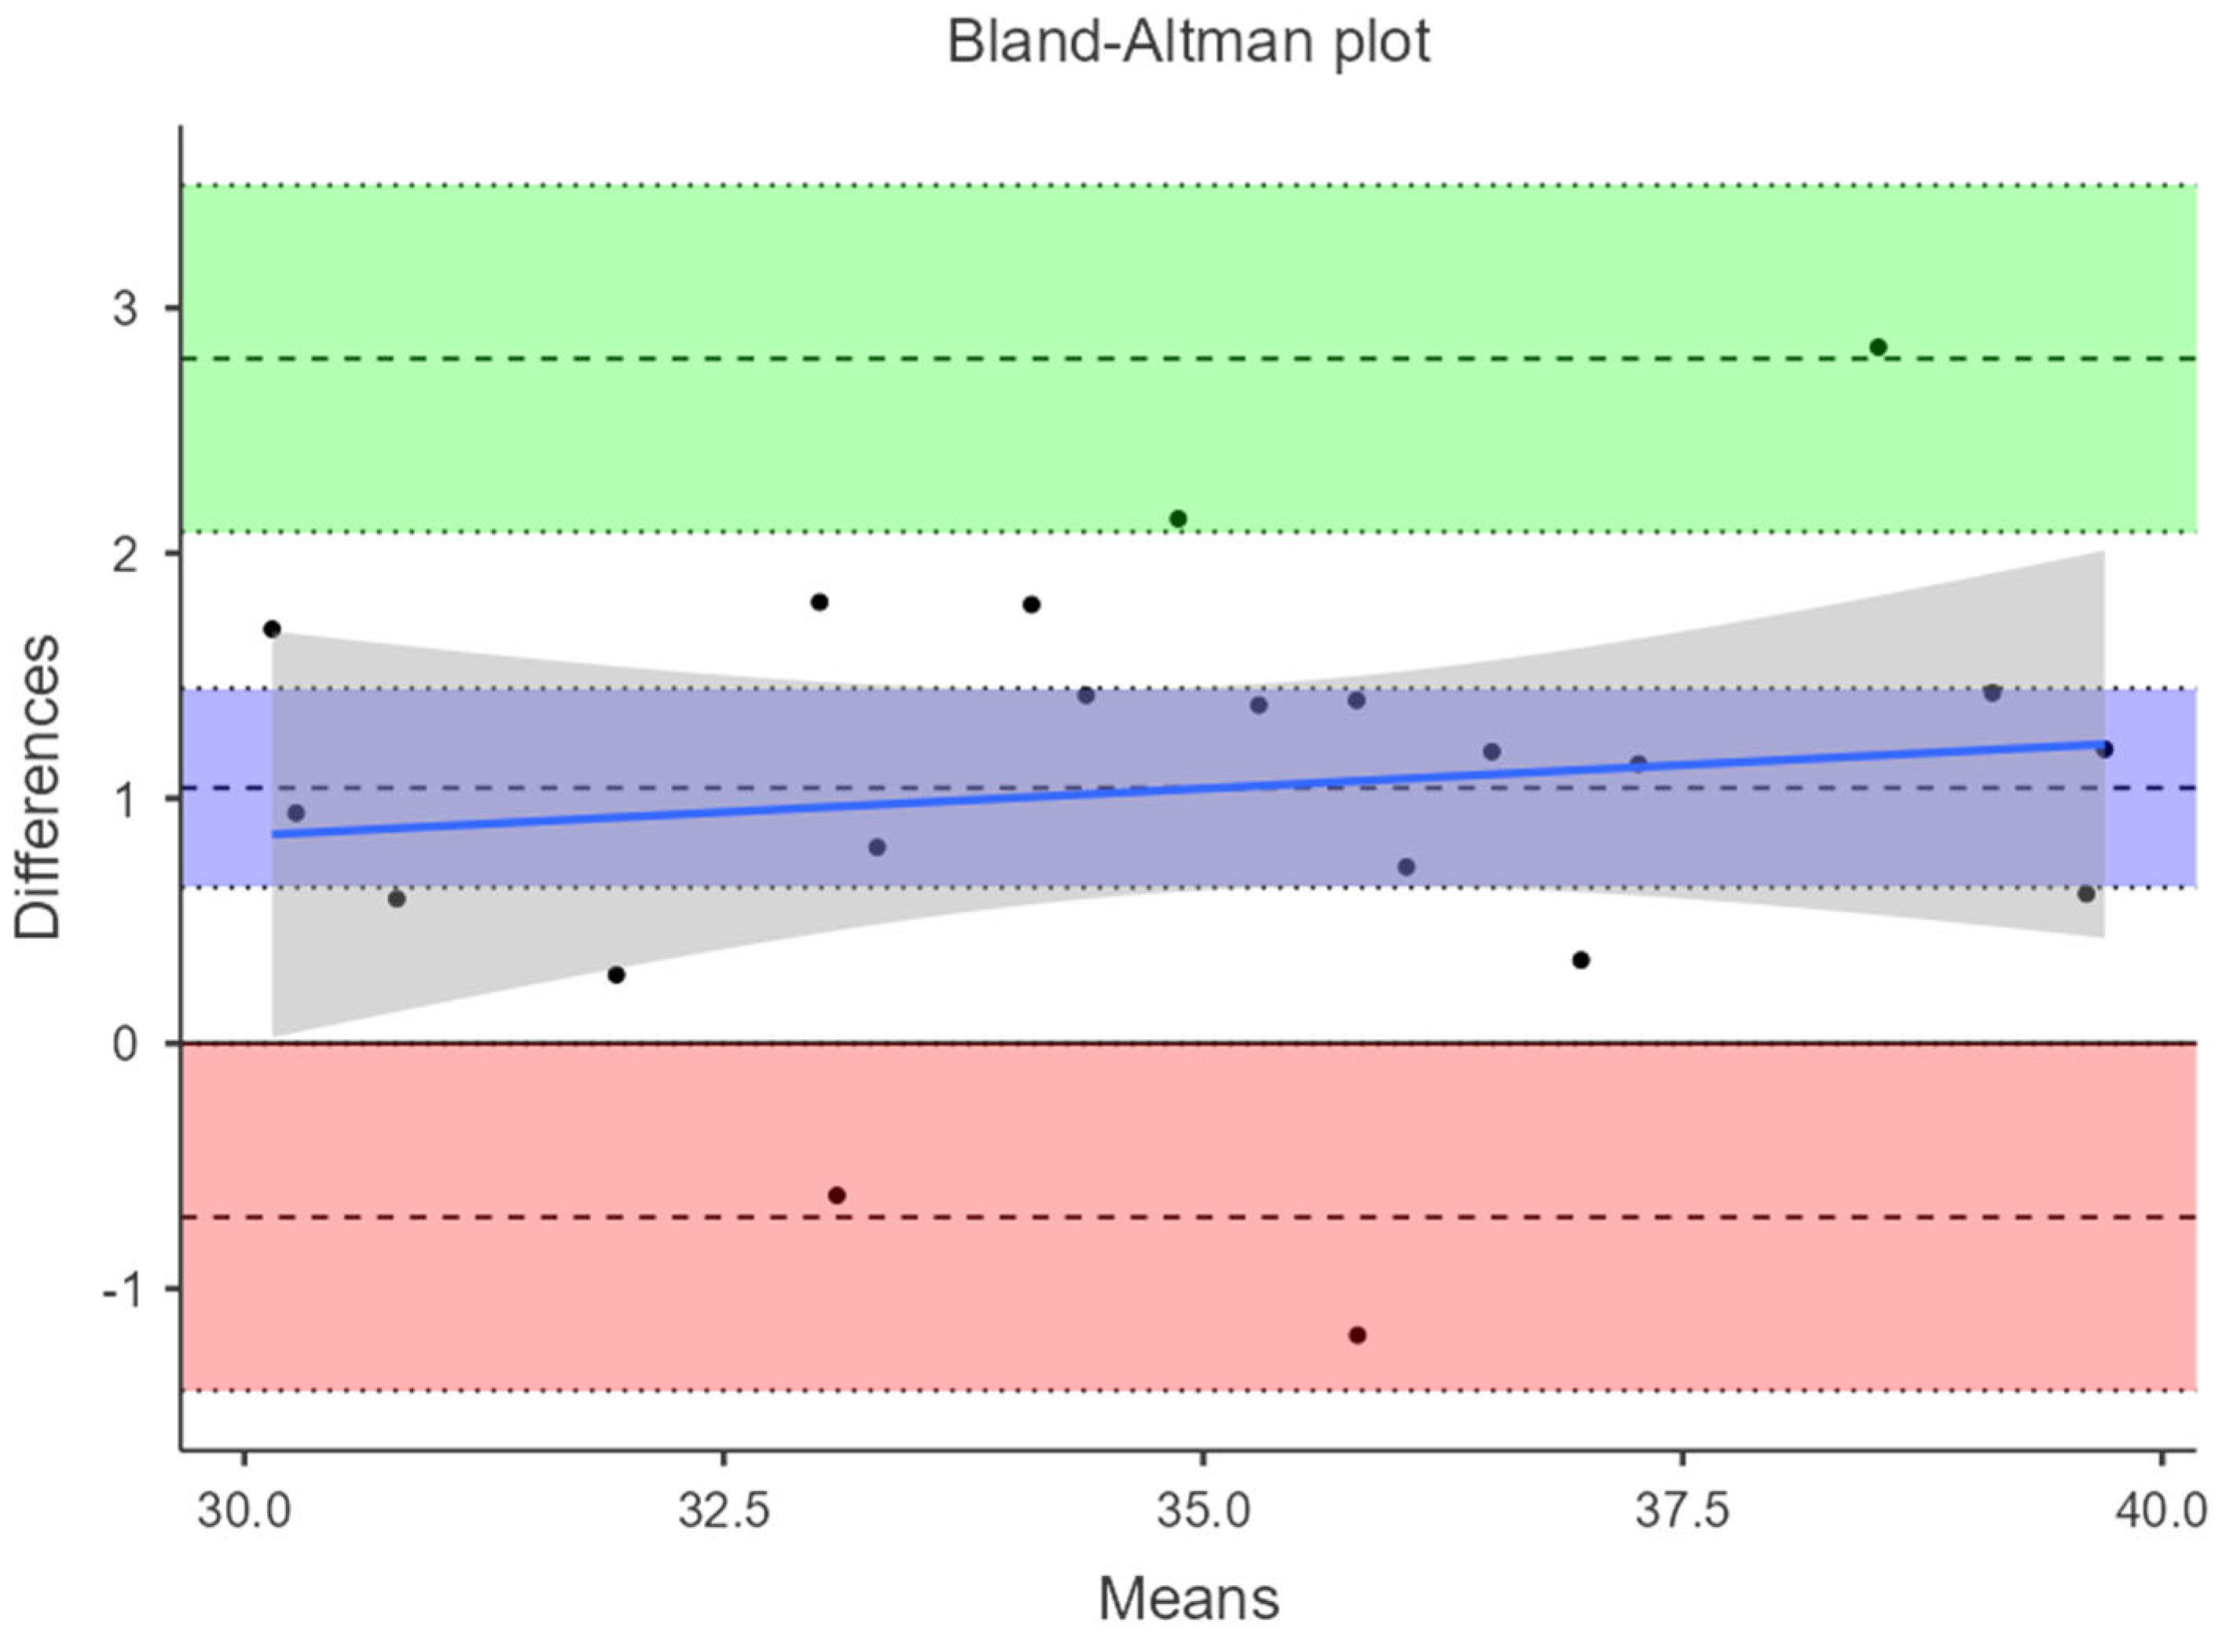
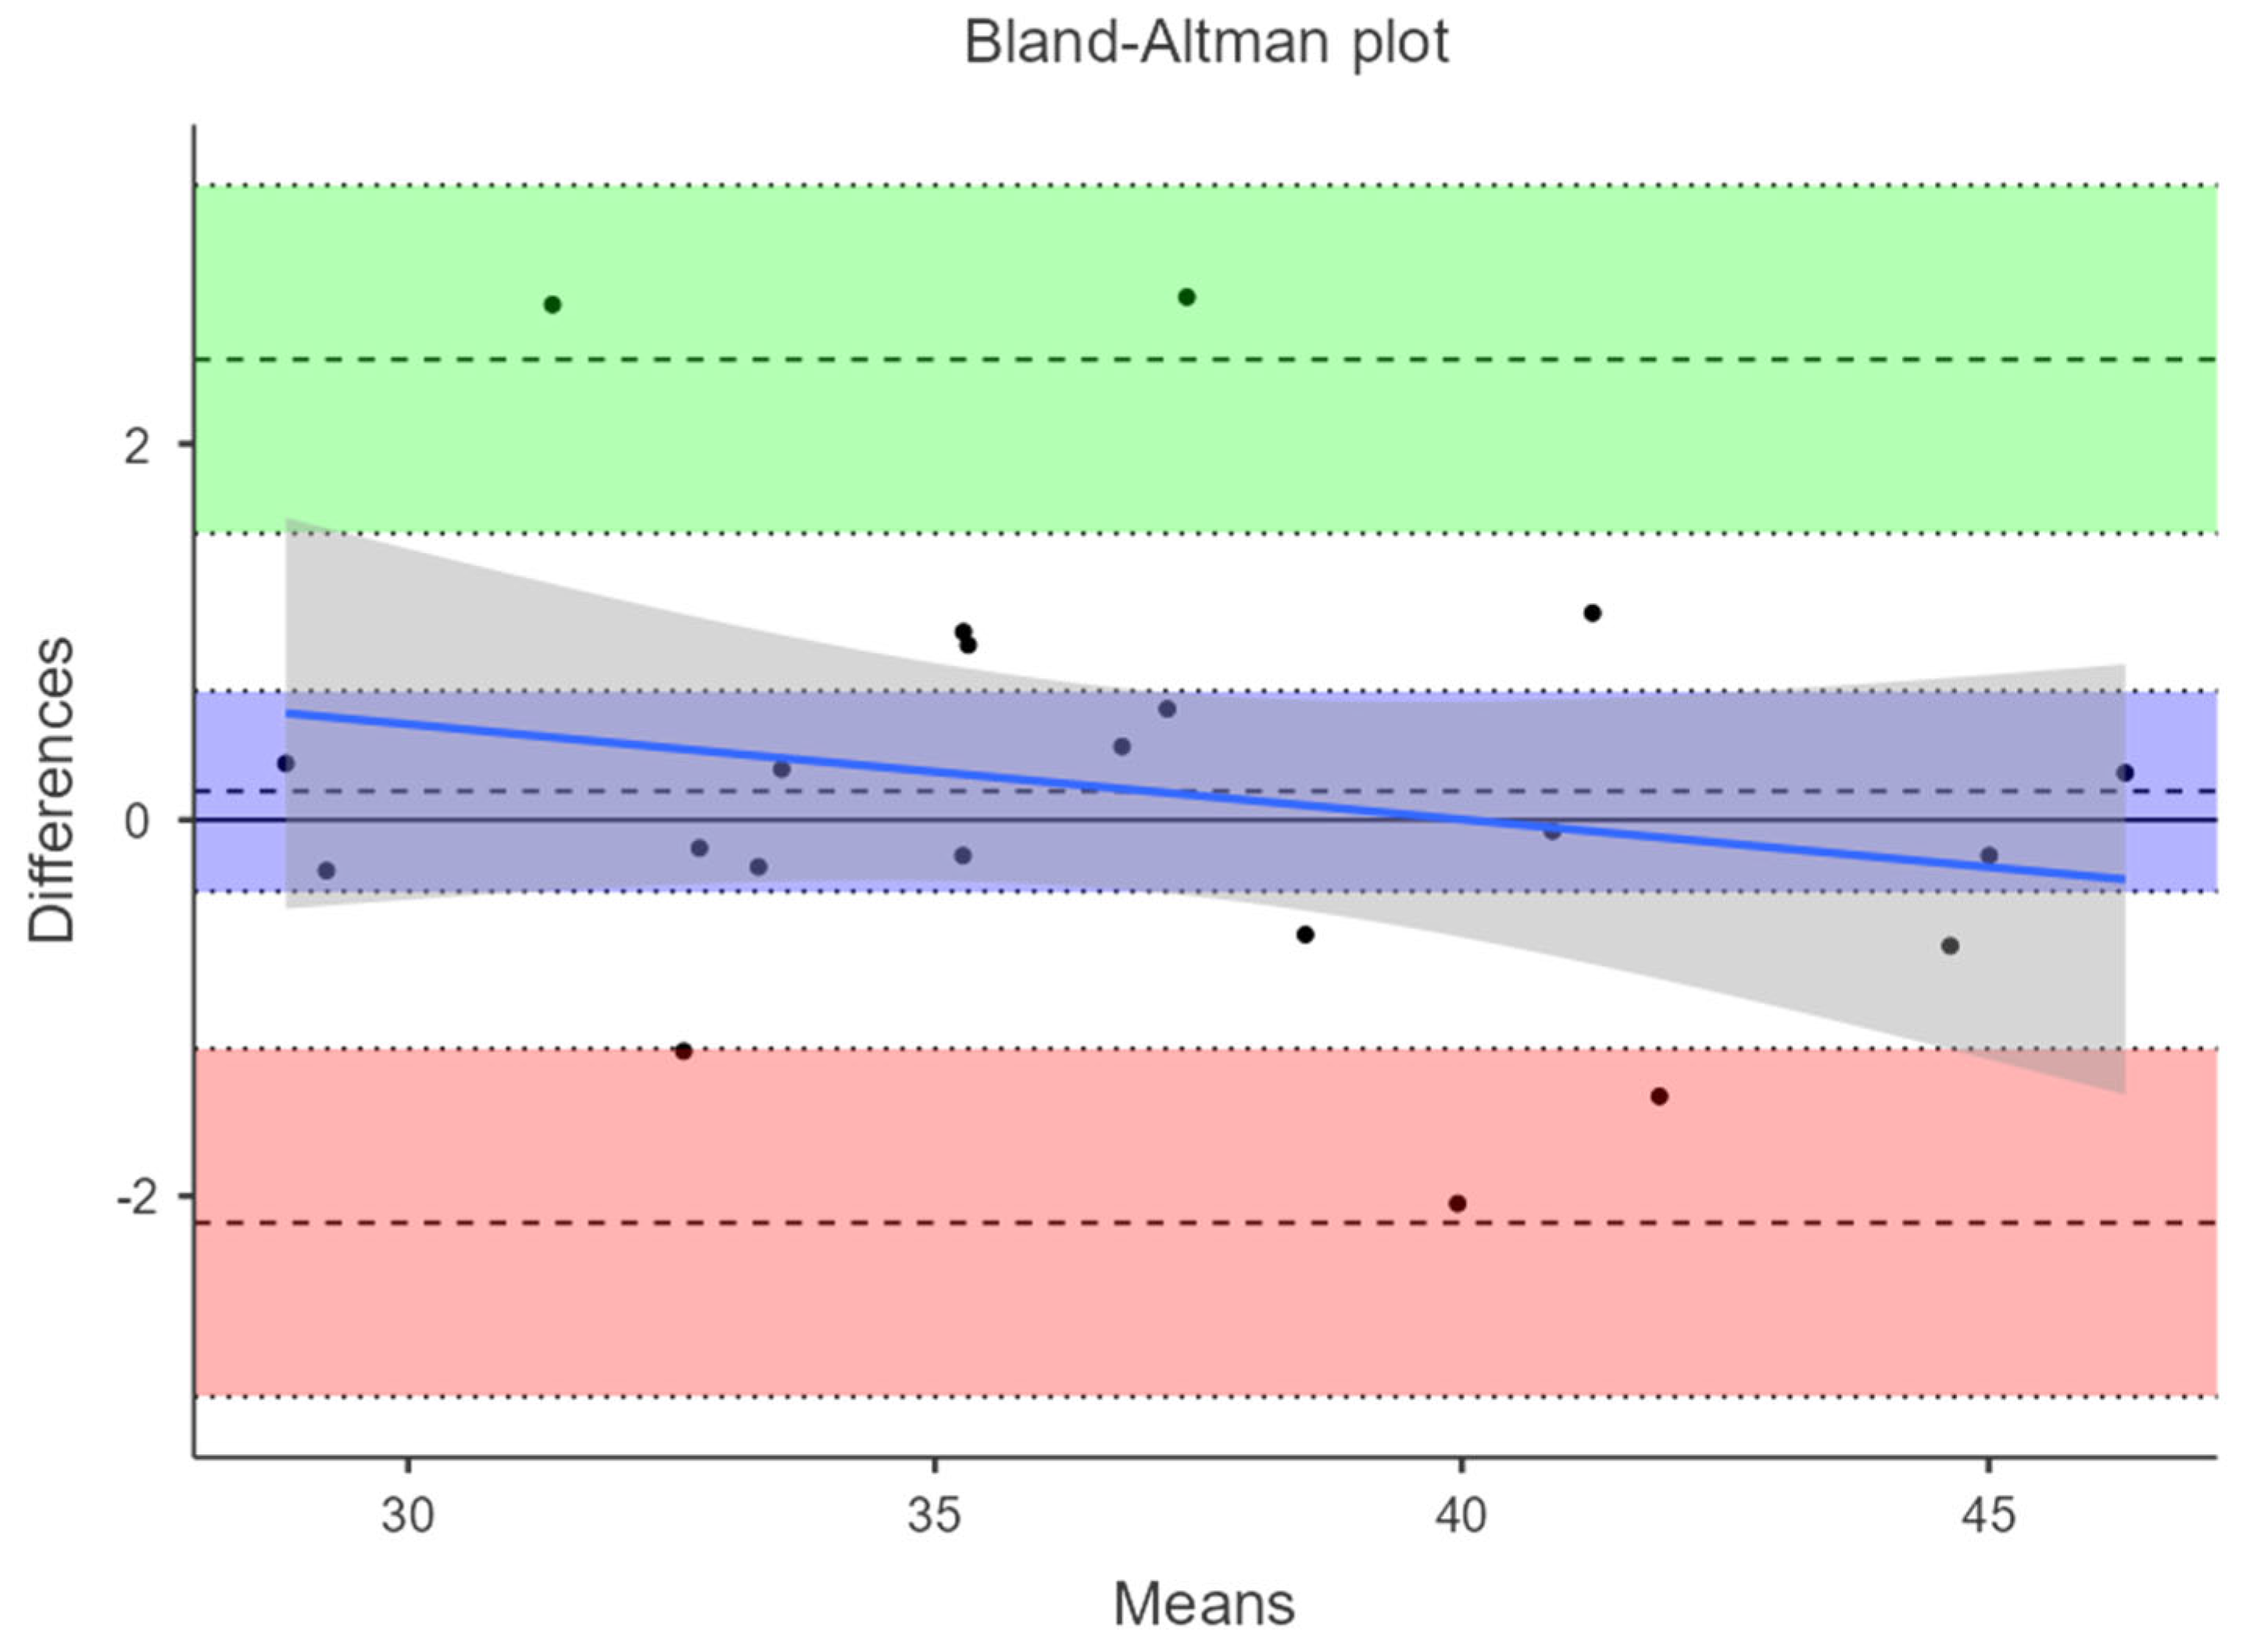
To evaluate the agreement between MyJump and Chronojump in measuring CMJ height, a Bland–Altman analysis was conducted. The results (
Table 2,
Figure 1) indicated a mean bias of +0.943 cm (95% CI: 0.409 to 1.476 cm), suggesting that MyJump systematically overestimates CMJ height compared to Chronojump. The 95% limits of agreement (LoA) were −1.354 cm to +3.240 cm, with confidence intervals ranging from −2.281 to −0.428 cm for the lower limit and 2.313 to 4.167 cm for the upper limit. These results suggest that despite minor individual deviations, MyJump and Chronojump demonstrated strong agreement in jump height estimation within an acceptable range.
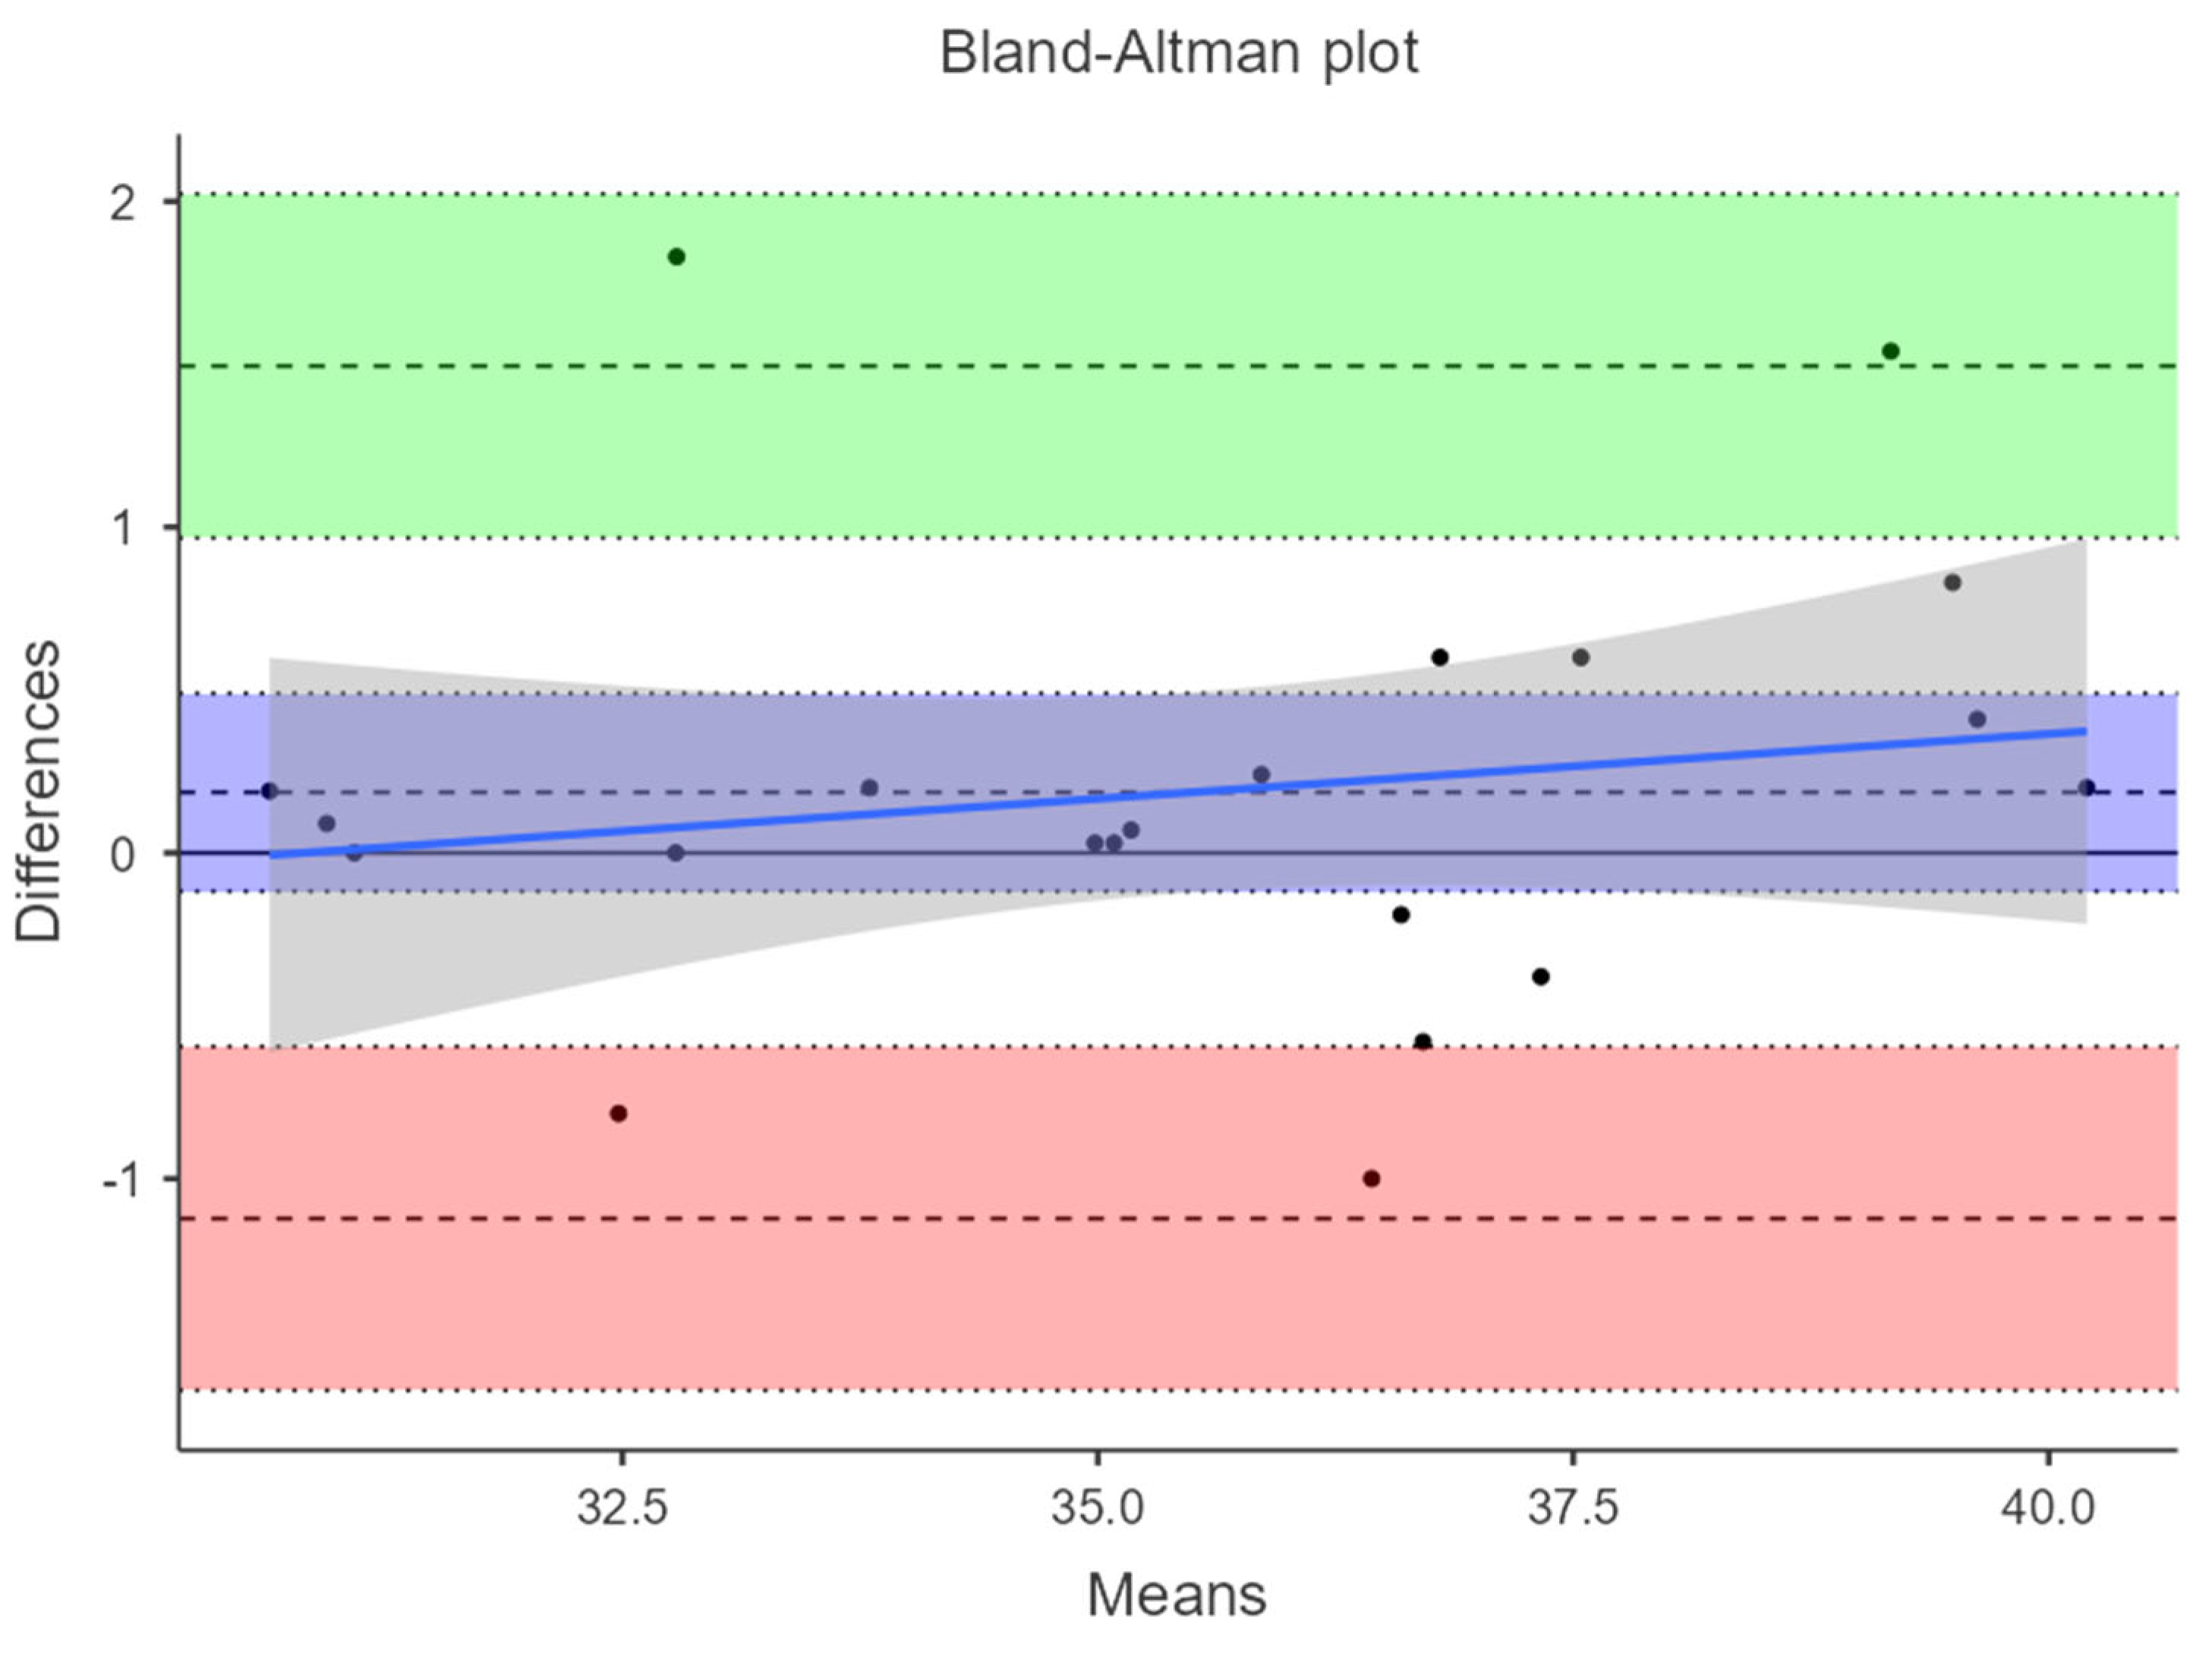
Regarding the squat jump (SJ) height, the agreement between MyJump and Chronojump was assessed using Bland–Altman analysis (
Table 3,
Figure 2). The results indicated a mean bias of +1.042 cm (95% CI: 0.636 to 1.449 cm), suggesting that MyJump systematically also overestimates SJ height compared to Chronojump (
Table 3,
Figure 2). The 95% limits of agreement (LoA) ranged from −0.709 cm to +2.794 cm, with confidence intervals spanning −1.415 to −0.002 cm for the lower limit and 2.087 to 3.499 cm for the upper limit. These findings could suggest that while individual measurements exhibited some variation, the two methods demonstrated strong overall agreement, with differences mostly within an acceptable range.
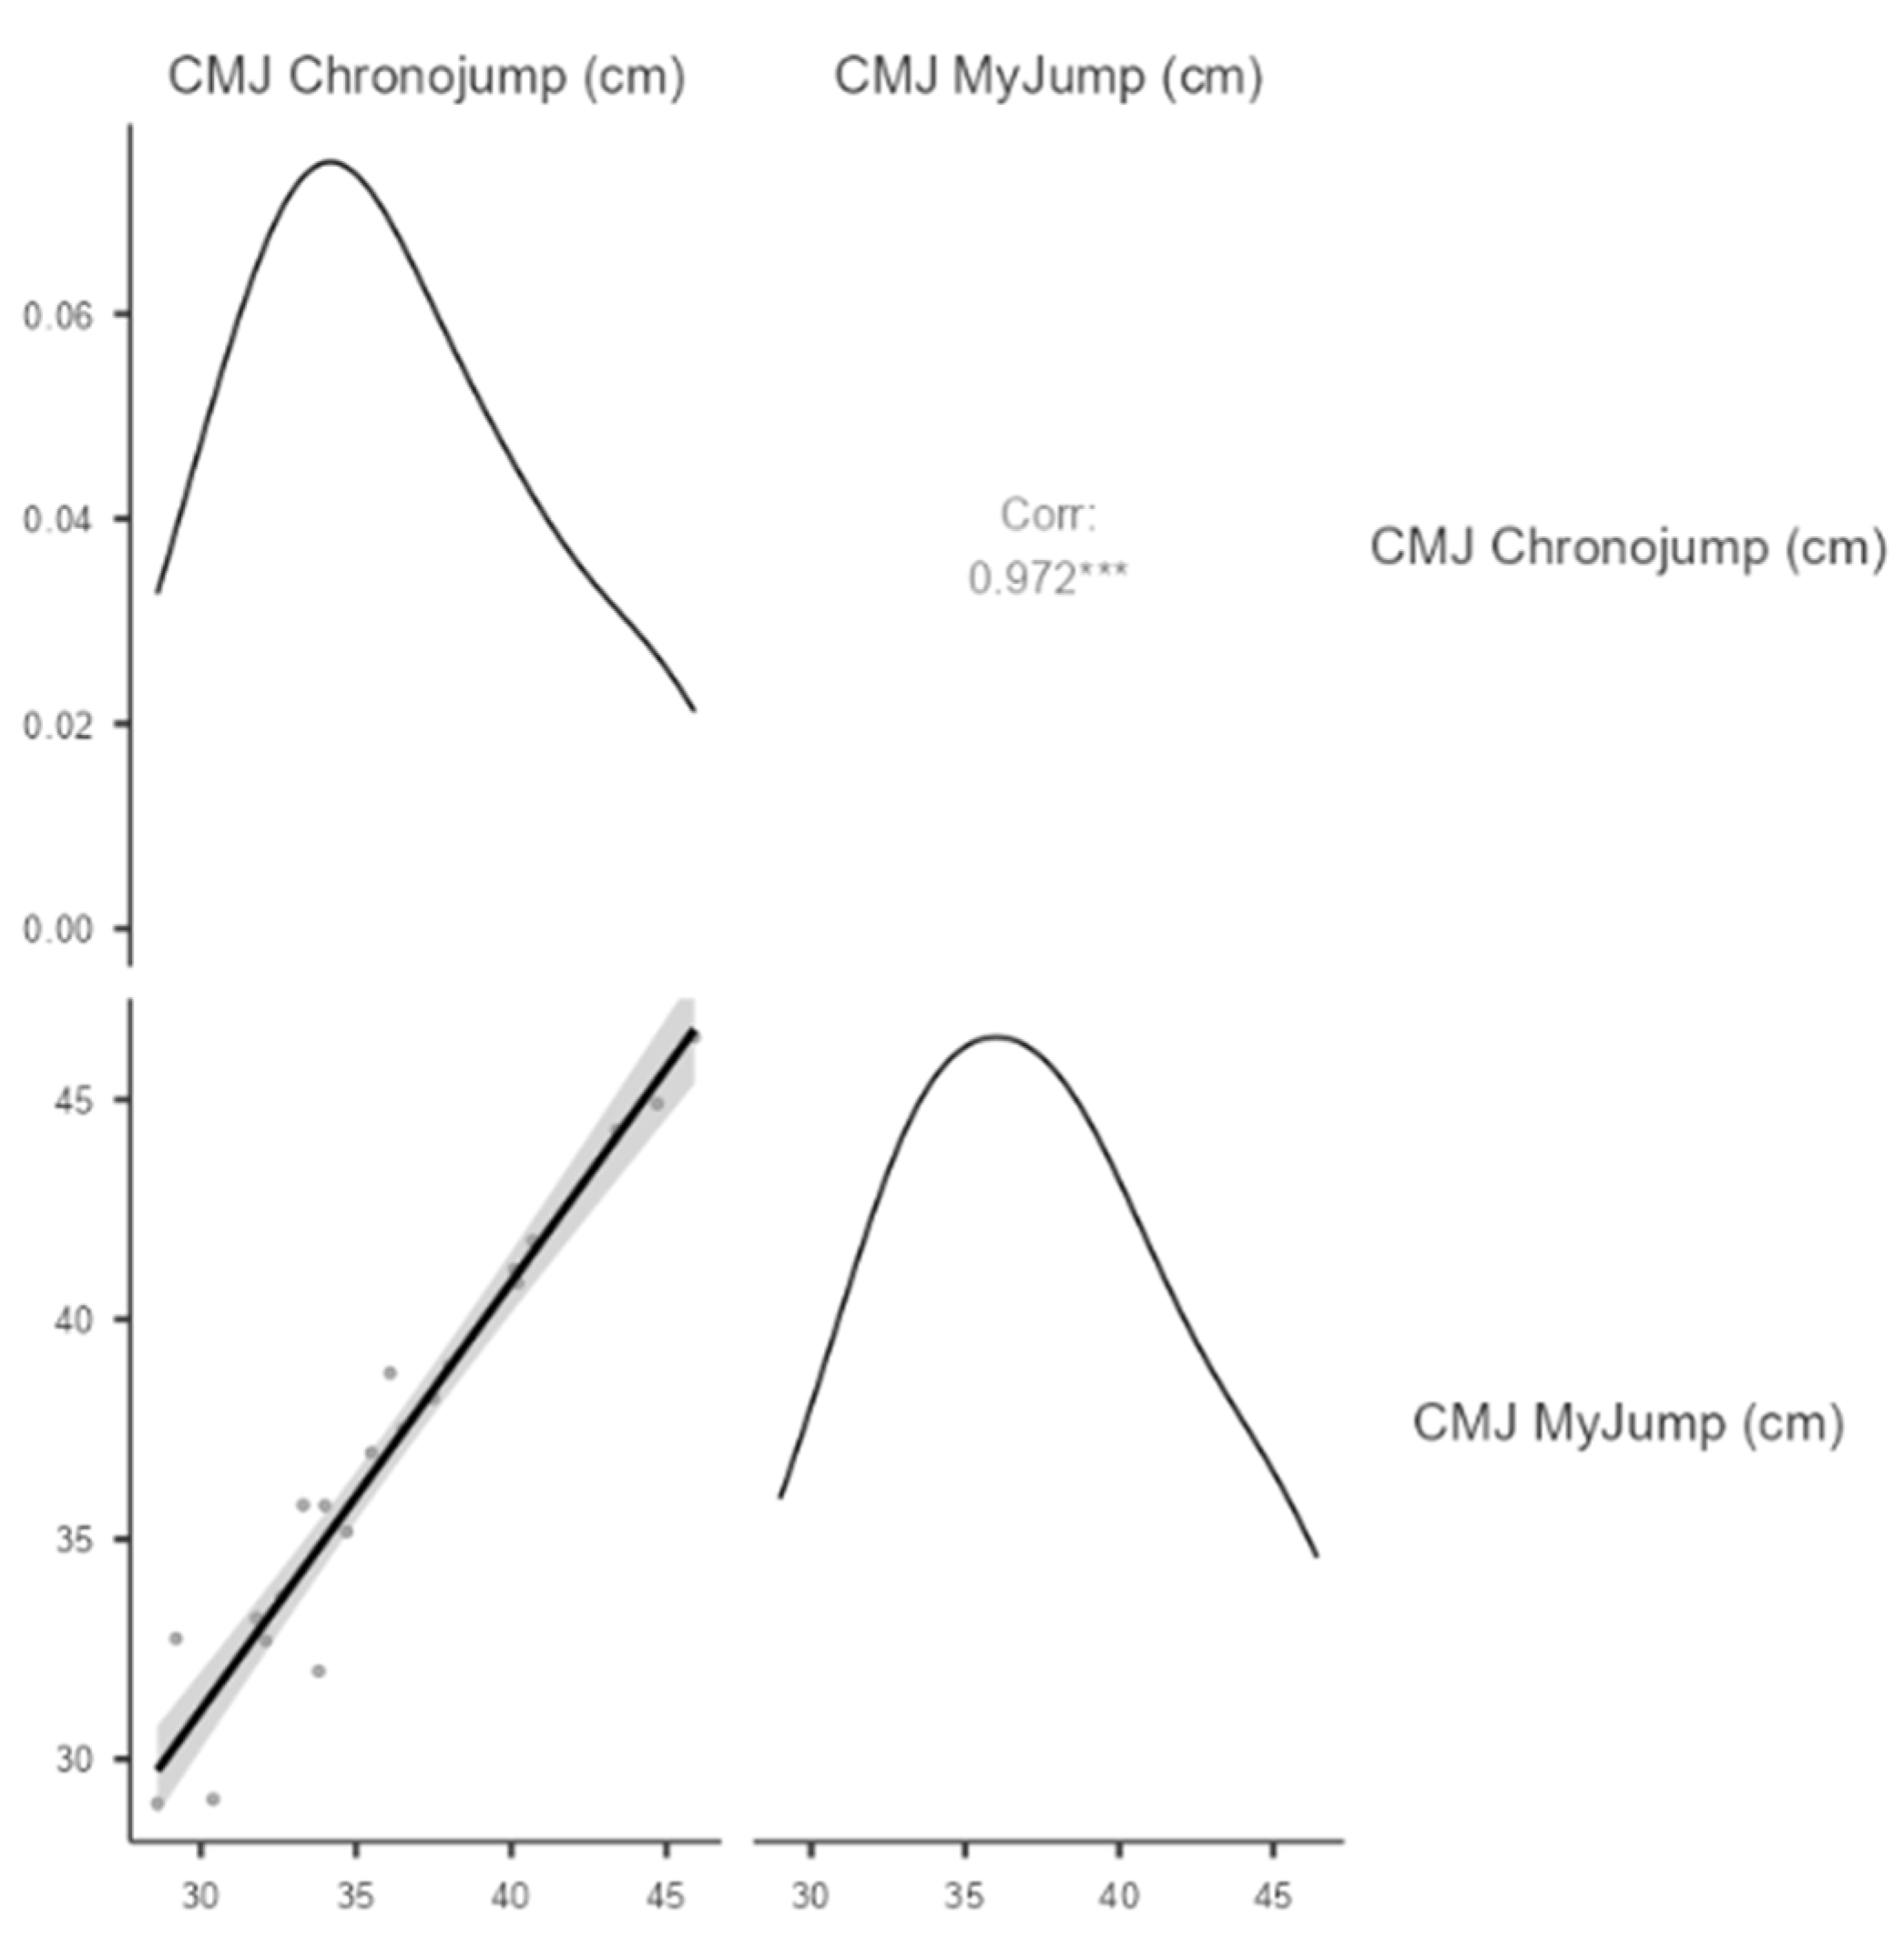
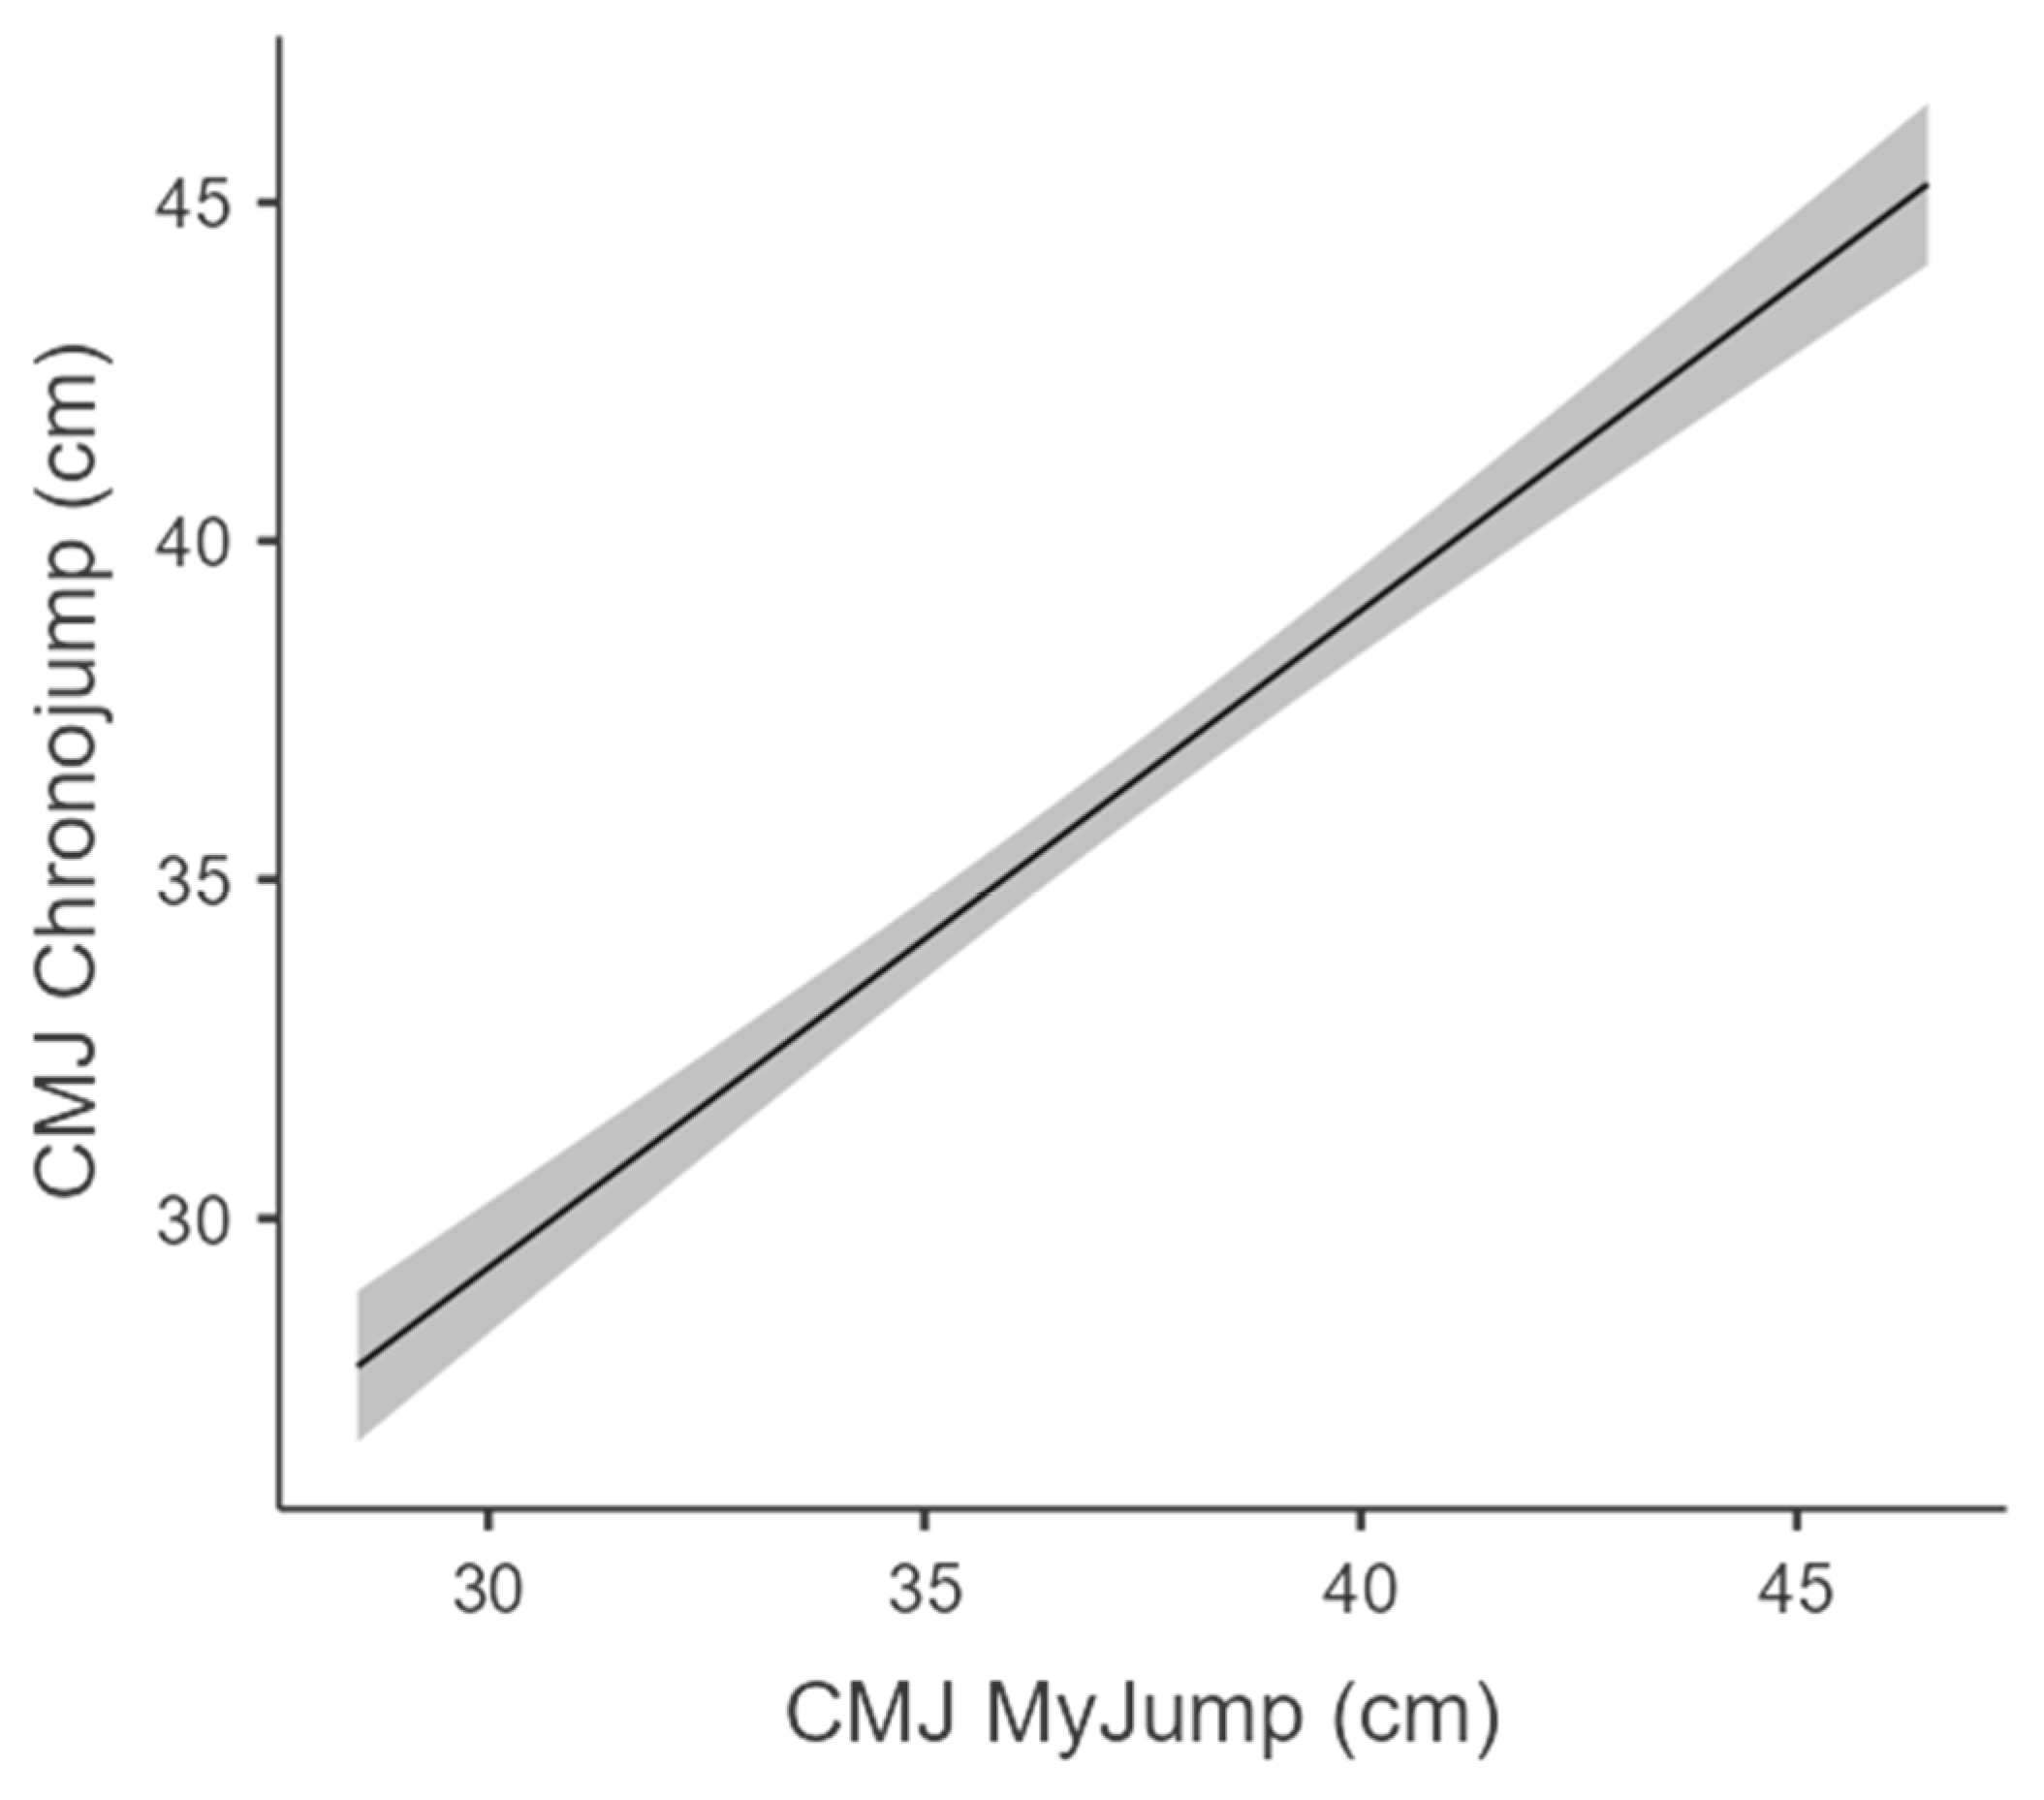
To further evaluate the association between MyJump and Chronojump for CMJ height measurements, a Pearson correlation analysis was conducted (
Table 4 and
Figure 3). The results indicated a strong positive correlation (r = 0.972,
p < 0.001), suggesting that MyJump measurements closely align with those obtained from Chronojump, where 95% confidence interval (CI) ranged from 0.930 to 0.989. Additionally, Spearman’s rho (ρ = 0.960,
p < 0.001) confirmed this strong association, indicating that the rank order of jump heights is preserved across both measurement methods. The correlation plot (
Figure 3) illustrated a near-perfect linear trend between the two devices. The narrow confidence band around the regression line further suggests high measurement consistency between MyJump and Chronojump.
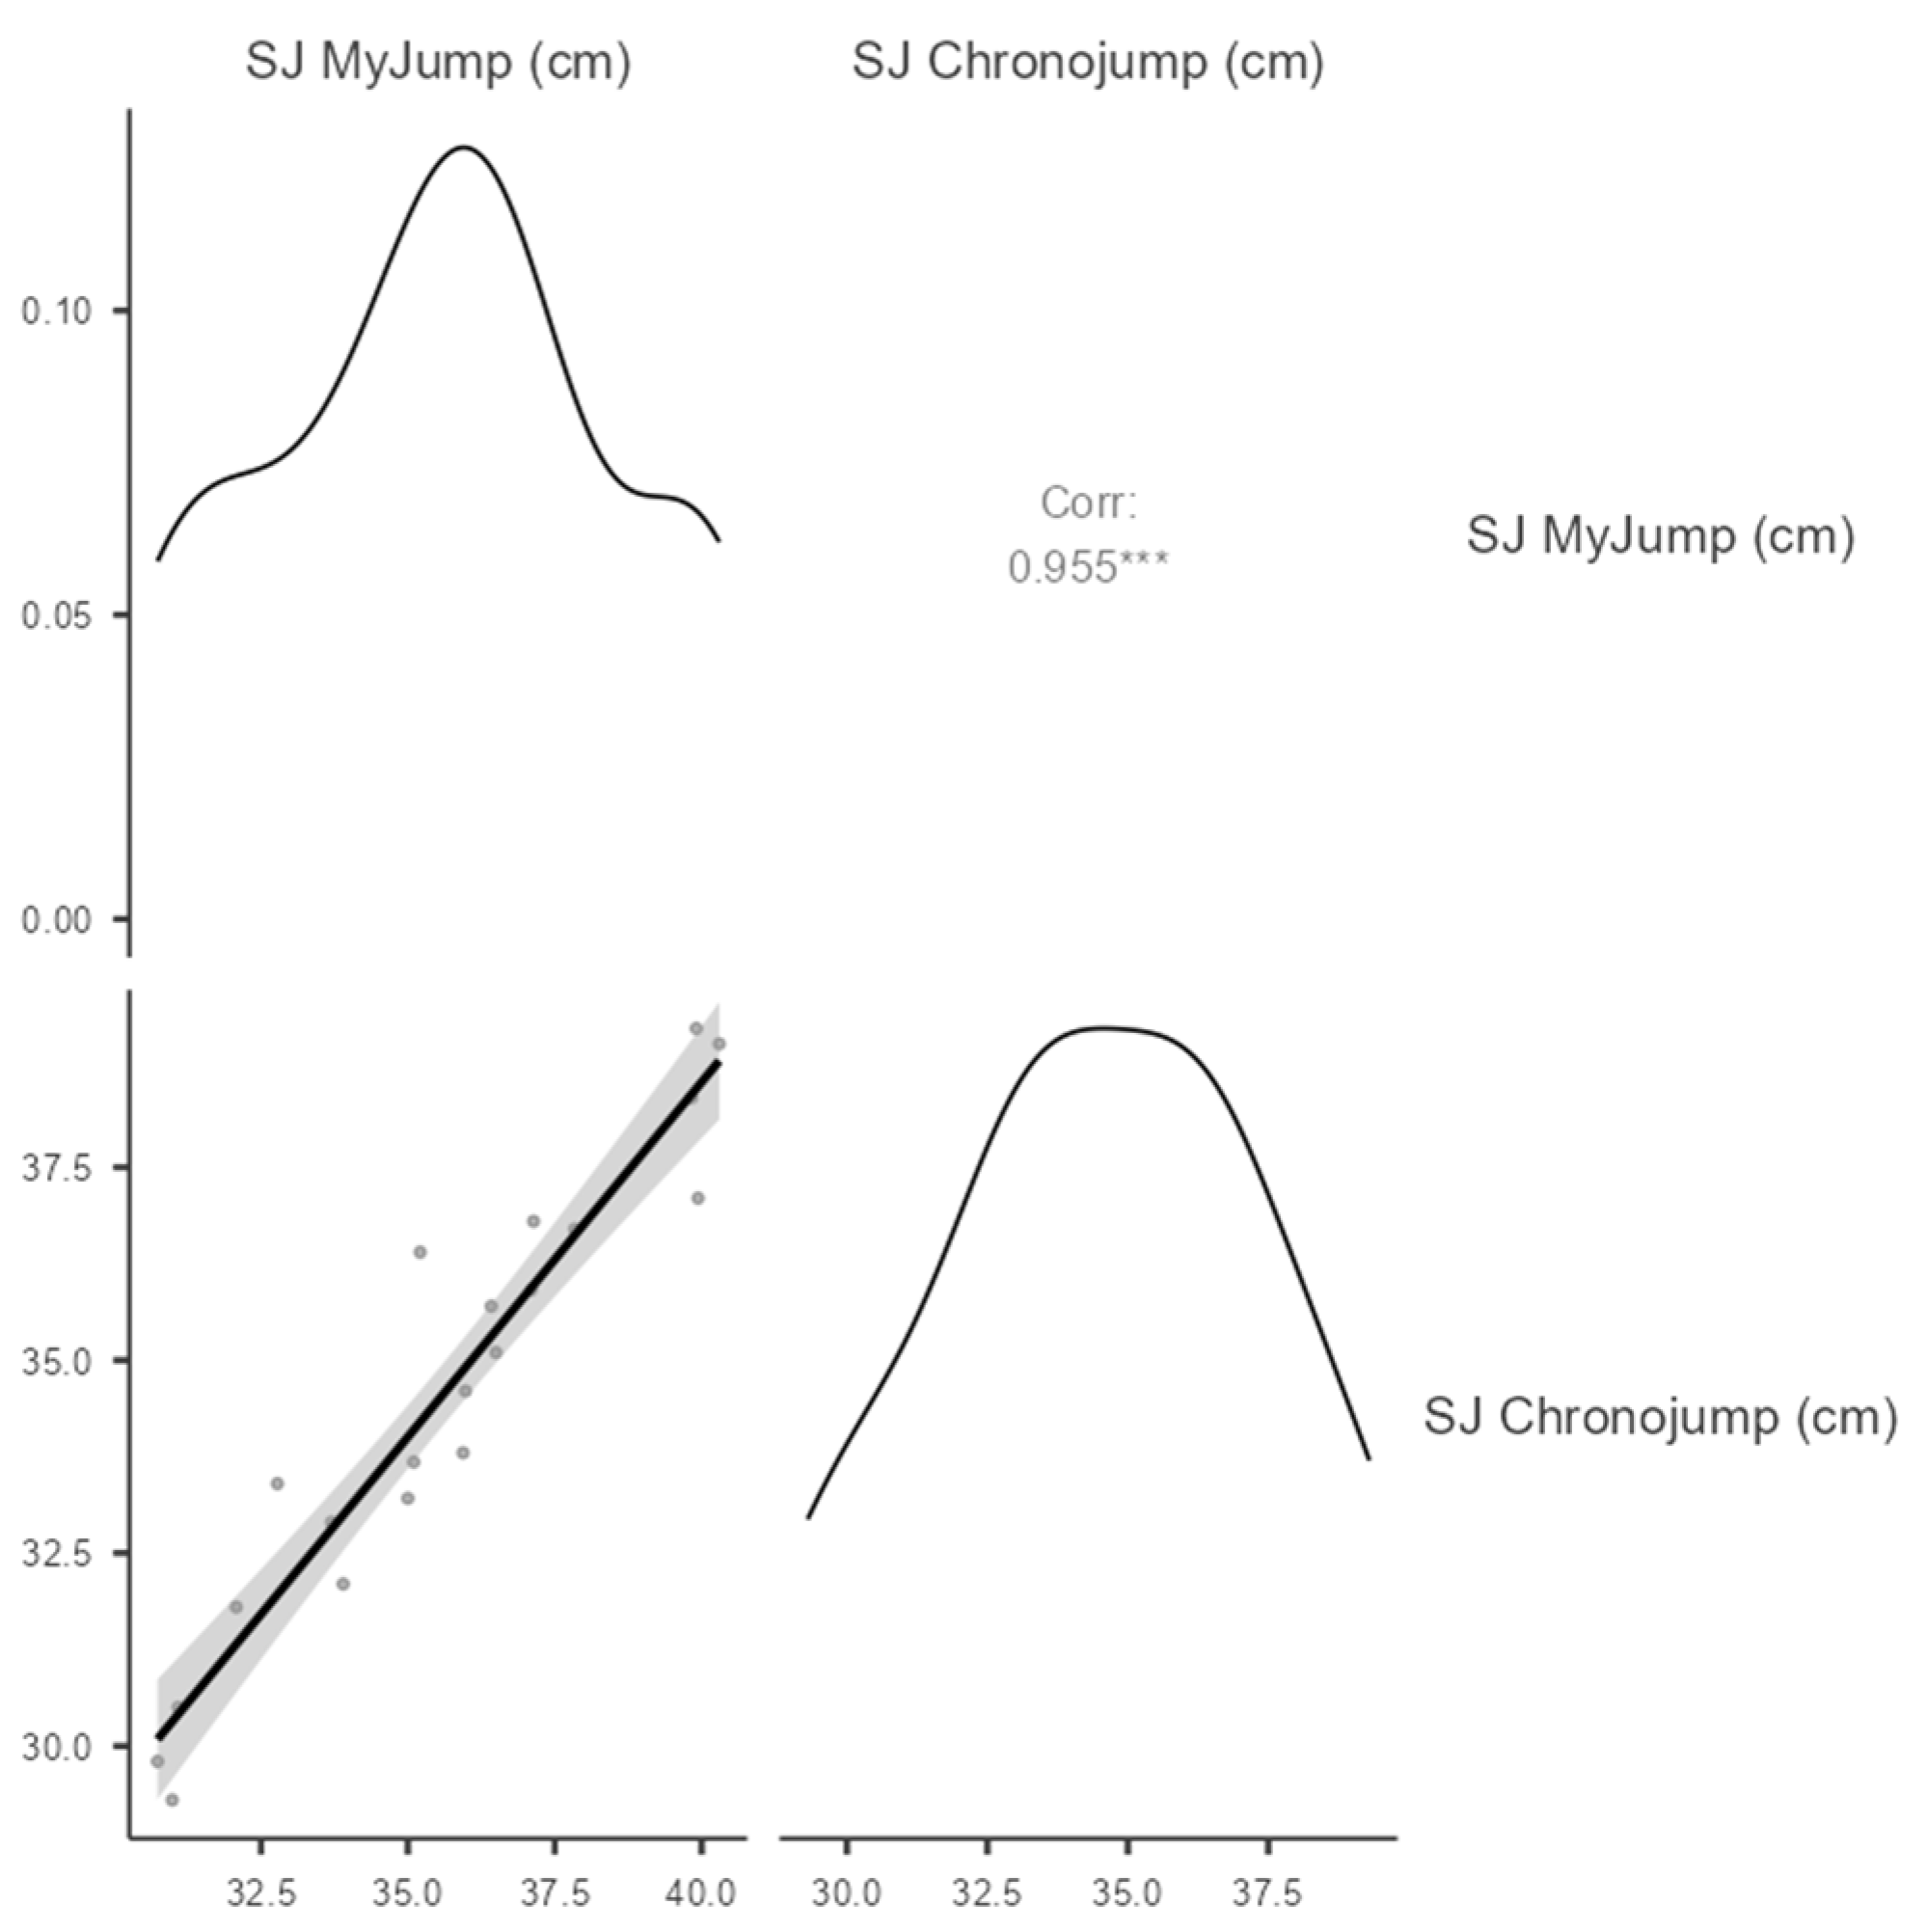
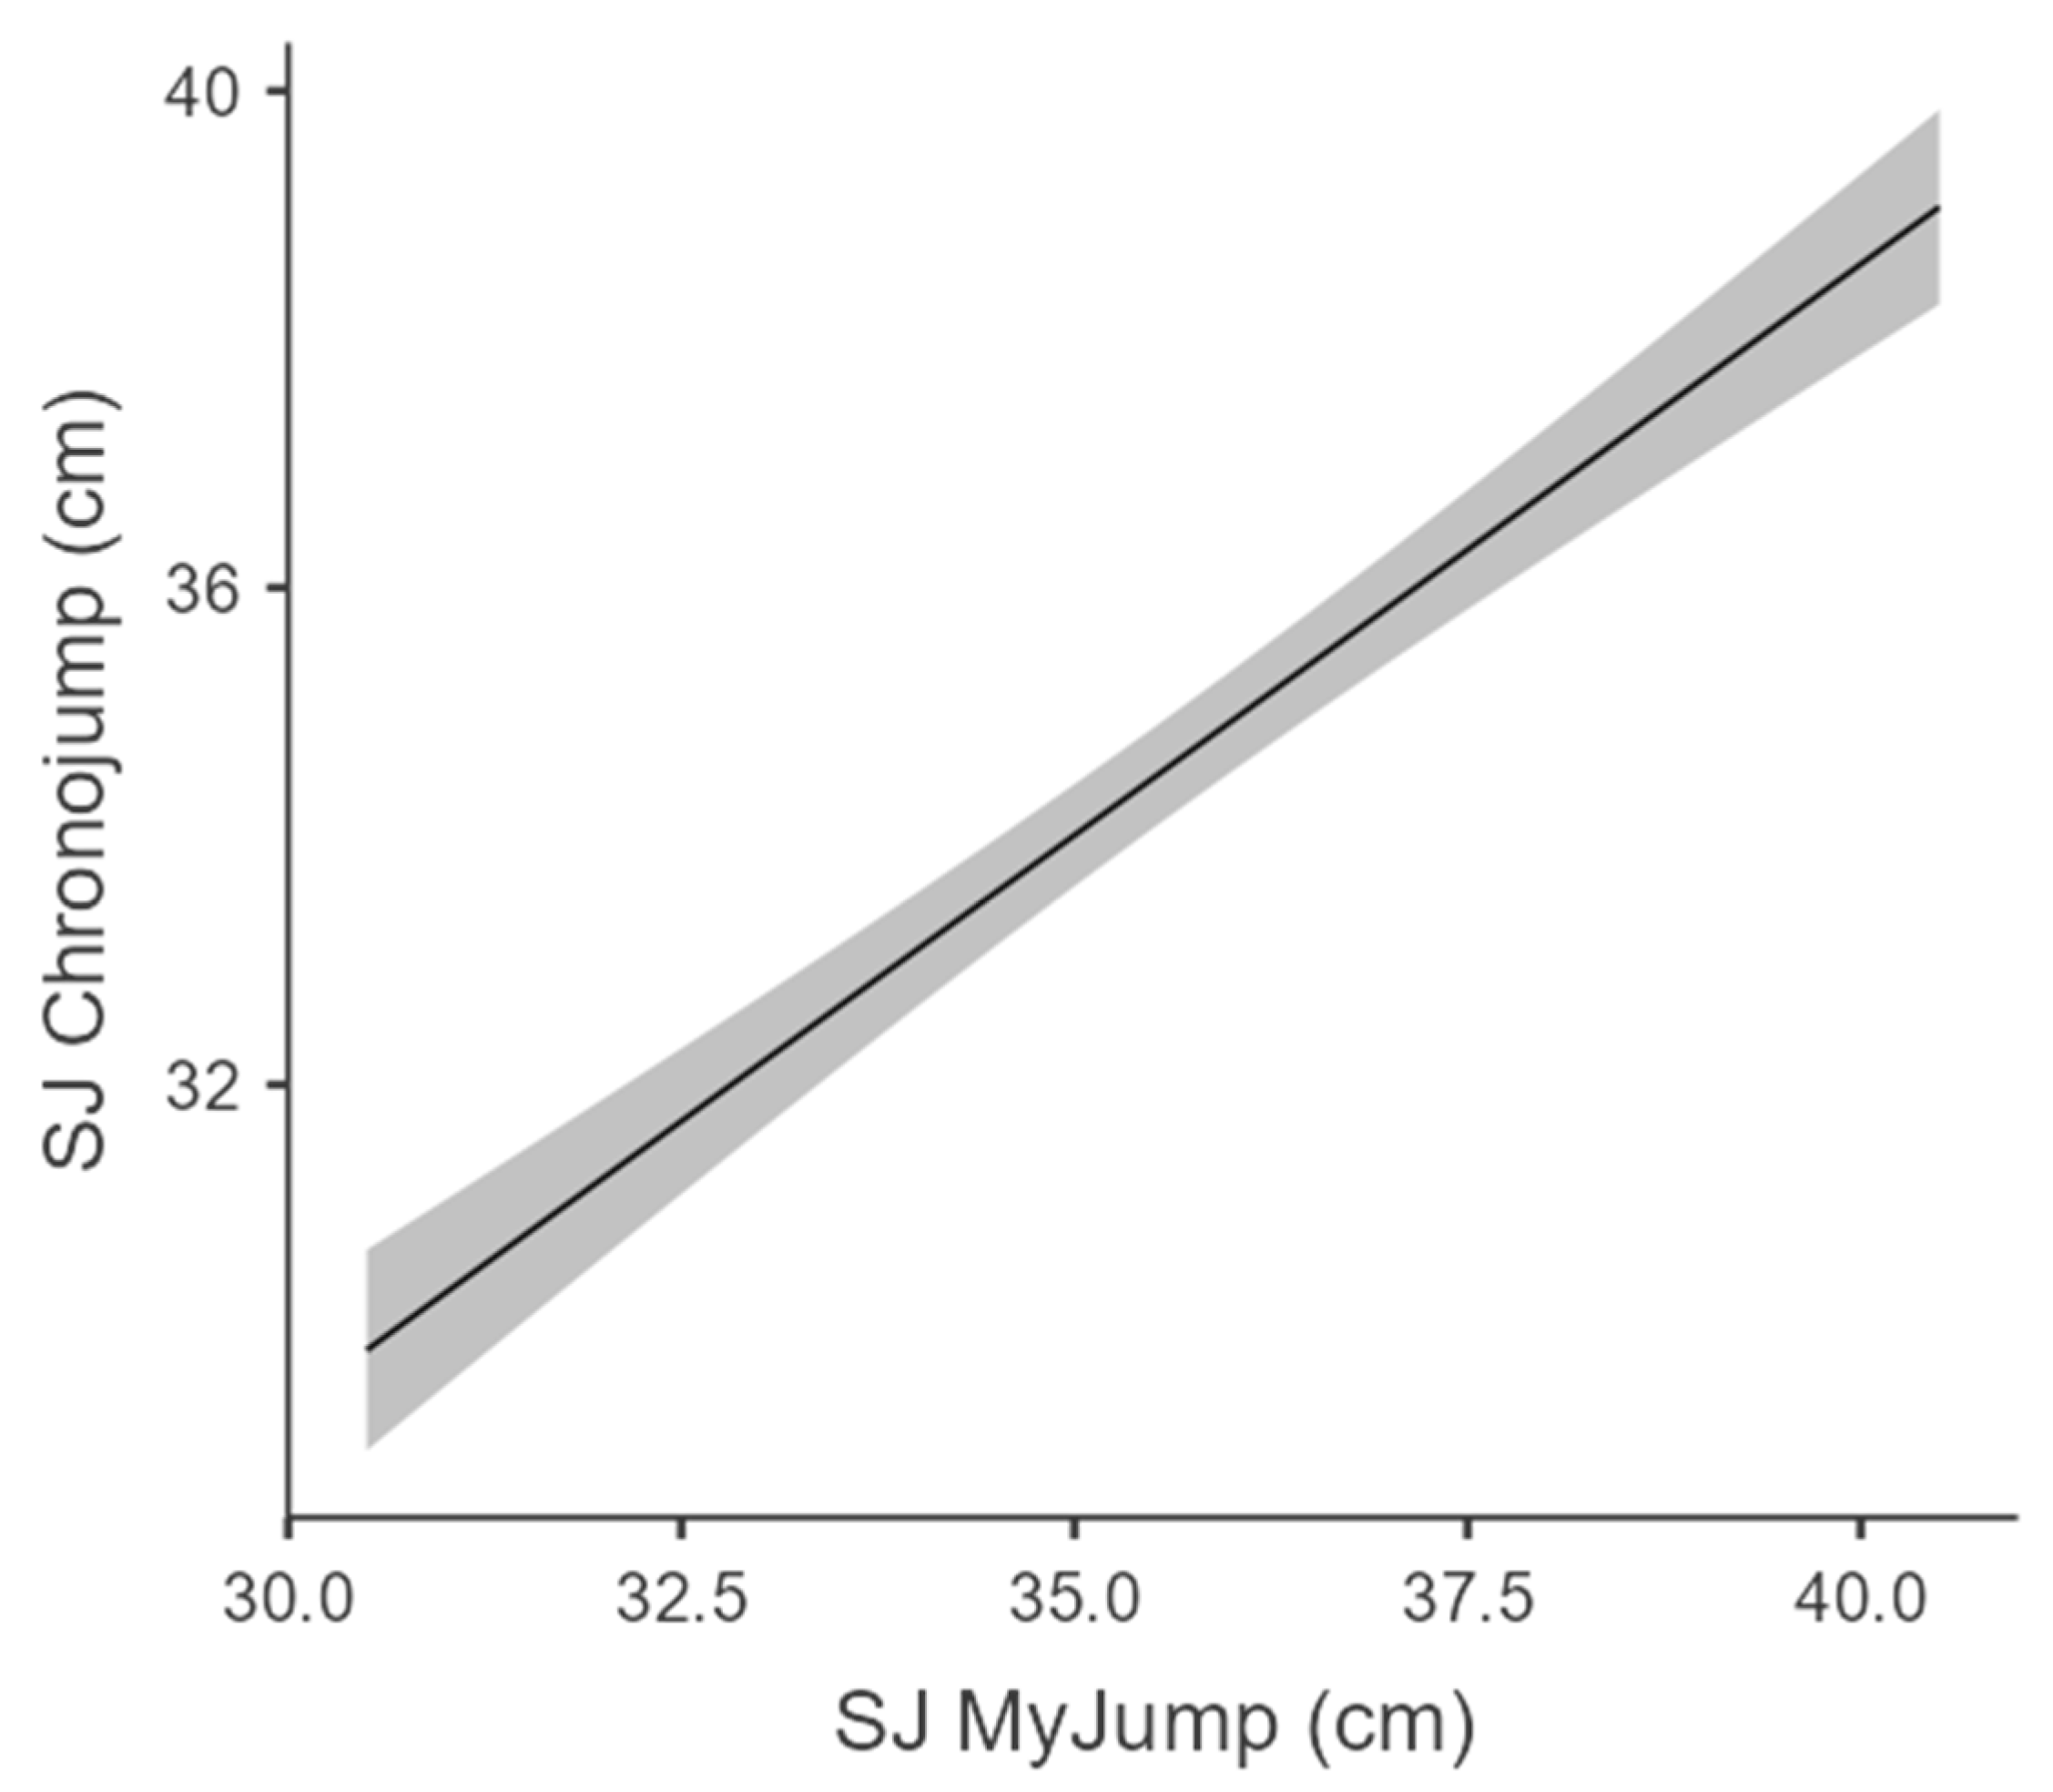
To assess the relationship between squat jump (SJ) height measurements obtained using MyJump and Chronojump, a Pearson correlation analysis was also conducted (
Table 5 and
Figure 4). The results indicated a strong positive correlation (r = 0.955,
p < 0.001), suggesting that MyJump provided highly comparable SJ height values to Chronojump, with a 95% confidence interval of 0.891–0.982. Additionally, Spearman’s rho (ρ = 0.961,
p < 0.001) confirmed this strong relationship across both measurement tools. The scatter plot with regression fit (
Figure 4) visually represented the correlation between MyJump and Chronojump for SJ. The tight clustering of data points along the regression line and the narrow confidence band indicated minimal variability and high measurement consistency between the two systems. The near-perfect correlation indicated that MyJump is a reliable alternative for measuring SJ performance.
The results of the linear regression analysis conducted to assess the predictive relationship between CMJ height measurements obtained using MyJump and Chronojump indicated an excellent model fit (R = 0.972, R
2 = 0.944,
p < 0.001 | ANOVA F-value = 323,
p < 0.001), suggesting that MyJump explained 94.4% of the variance in Chronojump measurements (
Table 6,
Figure 5 and
Figure 6).
The slope coefficient (β = 0.970, p < 0.001) suggested that for every 1 cm increase in MyJump CMJ height, the Chronojump measurement increases by 0.970 cm, indicating an almost perfect linear agreement between the two methods. The 95% confidence interval (CI: 0.857–1.08) further confirmed the stability of this estimate. The estimated marginal means (EMM) for the countermovement jump (CMJ) measurements obtained via MyJump indicate a mean jump height of 36.1 cm (95% CI: 35.6–36.7 cm). The estimated marginal mean for one standard deviation below the mean was 31.4 cm (95% CI: 30.6–32.1 cm), while one standard deviation above the mean was 40.9 cm (95% CI: 40.2–41.7 cm), demonstrating a consistent distribution of jump heights across participants.
These results indicated that MyJump served as a highly accurate alternative to Chronojump for CMJ measurement, with minimal systematic bias and near-perfect predictability. The strong correlation, minimal residual error and excellent model fit suggested that MyJump could be reliably used for assessments of CMJ performance with a high degree of confidence.
A linear regression analysis was also performed to assess the predictive relationship between squat jump (SJ) height measurements from MyJump and Chronojump (
Table 7,
Figure 7 and
Figure 8). The model demonstrated excellent fit with R = 0.955, R
2 = 0.912,
p < 0.001, indicating that 91.2% of the variance in Chronojump SJ measurements was explained by MyJump (ANOVA F-value = 197,
p < 0.001).
The slope coefficient (β = 0.920, p < 0.001) suggested that for every 1 cm increase in MyJump SJ height, the Chronojump measurement increases by 0.920 cm, demonstrating a strong predictive relationship between the two methods. The 95% confidence interval (CI: 0.783–1.060) further reinforces the reliability of this estimate.
The estimated marginal mean (EMM) for squat jump (SJ) heights obtained through MyJump provided further insight into the distribution of performance among participants. The average jump height recorded was 34.6 cm (95% CI: 34.1–35.0 cm). A one standard deviation decrease from the mean corresponded to an estimated marginal mean of 31.8 cm (95% CI: 31.2–32.4 cm), whereas a one standard deviation increase resulted in an estimated marginal mean of 37.3 cm (95% CI: 36.7–37.9 cm).
These findings indicated that MyJump provides a highly accurate estimate of SJ height compared to Chronojump, with only a minor systematic overestimation observed in the Bland–Altman analysis. Given the strong correlation, minimal residual error and excellent model fit, MyJump could be a valid and reliable tool for SJ assessments.
3.2. Reliability
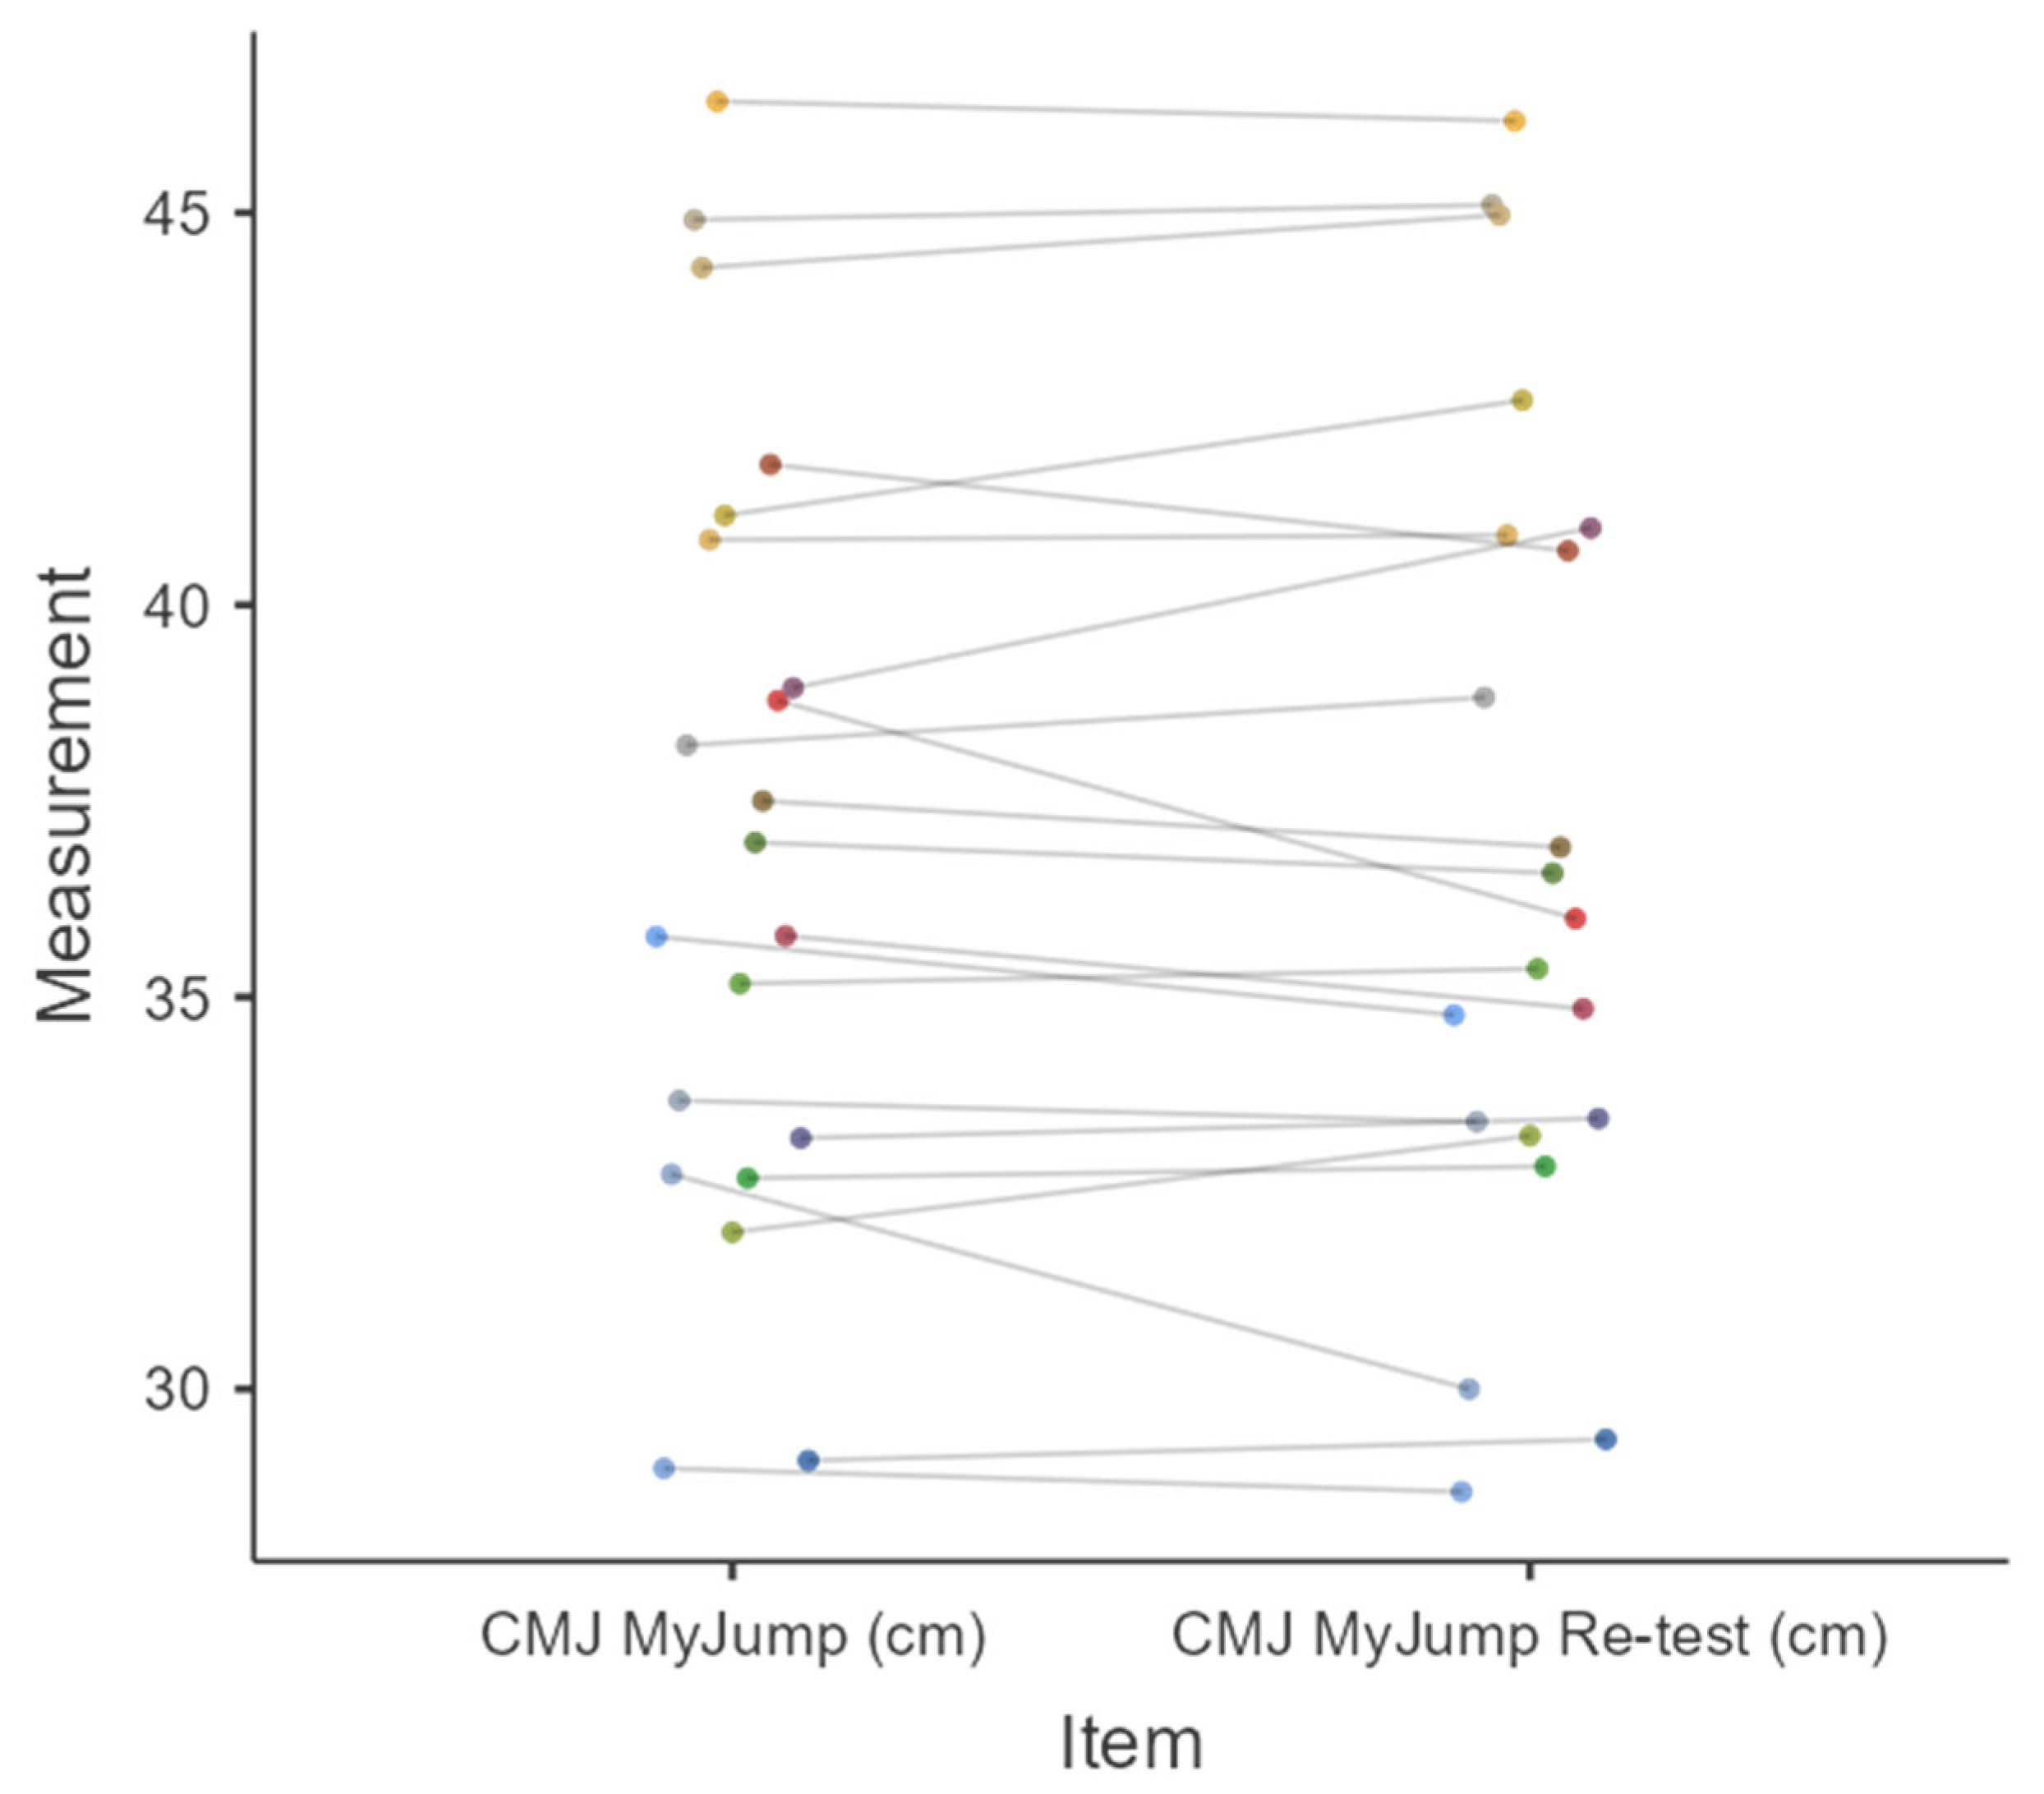
The reliability of the CMJ MyJump measurements was assessed using the intraclass correlation coefficient (ICC) and measures of variability. The coefficient of variation (CV%) was calculated at 2.2%, indicating low measurement variability. Additionally, the standard error of measurement (SEM) was 0.8154, while the standard error of the estimate (SEE) and the standard error of prediction (SEP) were 1.1385 and 1.6208, respectively. Moreover, for the CMJ, the minimum detectable change (MDC) was determined to assess the smallest within-subject change that can be interpreted as a true performance difference, exceeding the threshold of measurement error. Based on the standard error of measurement (SEM = 0.8154 cm), the MDC was calculated as 2.26 cm, indicating the minimum change required to be considered real and not attributable to measurement variability.
The ICC values confirmed the high reliability of the MyJump application for CMJ measurements (
Table 8 and
Figure 9). The one-way random model for absolute agreement (ICC1) yielded an ICC of 0.974 (95% CI: 0.946–0.988). The two-way random model for absolute agreement (ICC2) produced an identical ICC of 0.974 (95% CI: 0.946–0.988), suggesting strong reliability across trials. Furthermore, the two-way fixed model for consistency (ICC3) also reported an ICC of 0.974 (95% CI: 0.946–0.988).
When analyzing average agreement, the one-way random model (ICC1k) and the two-way random model (ICC2k) produced ICC values of 0.987 (95% CI: 0.973–0.994), while the two-way fixed model (ICC3k) returned a nearly identical value of 0.987 (95% CI: 0.972–0.994). These findings indicated excellent intra-rater reliability, suggesting that the MyJump application provided consistent and repeatable CMJ measurements across trials, and the low SEM and SEE values reinforced the precision of the measurements, demonstrating that systematic error was minimal.
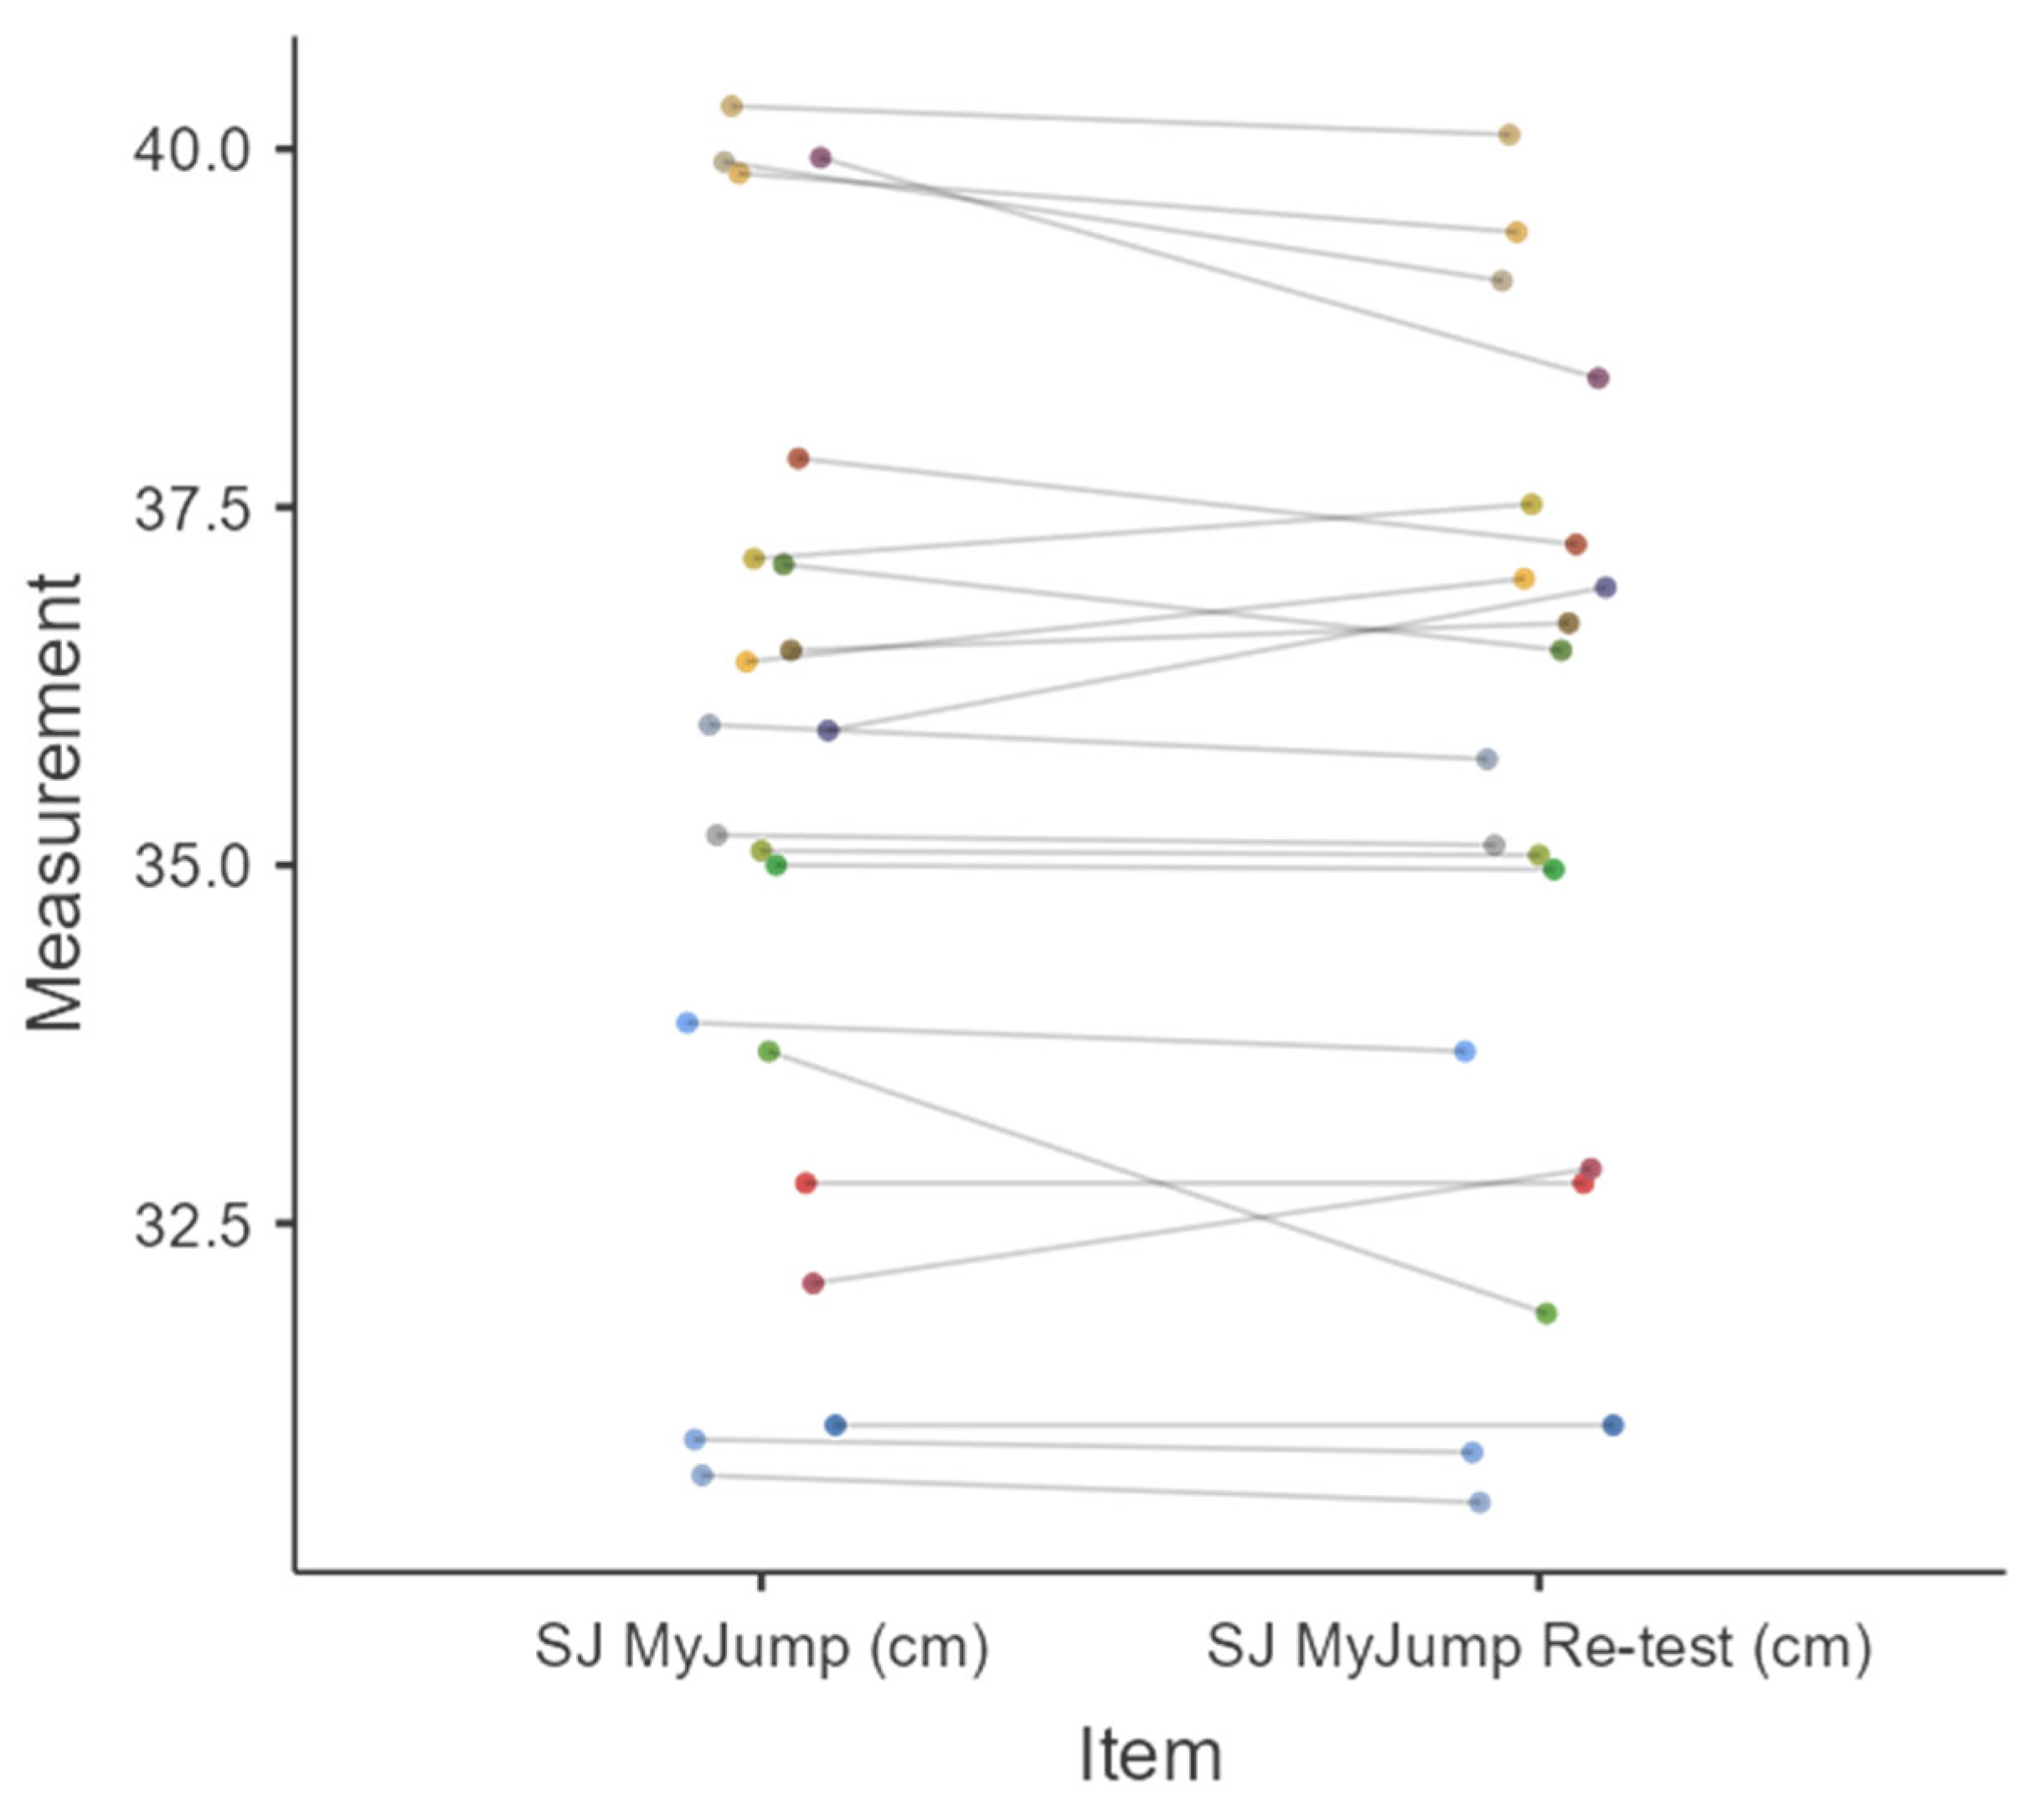
The reliability of the SJ MyJump measurements was also assessed using intraclass correlation coefficients (ICCs) and measures of variability. The coefficient of variation (CV%) was 1.33%, indicating low measurement variability. Additionally, the standard error of measurement (SEM) was 0.4721, while the standard error of the estimate (SEE) and the standard error of prediction (SEP) were 0.6594 and 0.9386, respectively. For the SJ, the MDC was computed as 1.31 cm, indicating the minimum change required in squat jump performance to be considered meaningful beyond inherent variability.
The ICC values confirmed the high reliability of the MyJump application for SJ measurements (
Table 9 and
Figure 10). The one-way random model for absolute agreement (ICC1) yielded an ICC of 0.974 (95% CI: 0.946–0.987), indicating strong consistency between test and retest values. Similarly, the two-way random model for absolute agreement (ICC2) and the two-way fixed model for consistency (ICC3) both reported ICC values of 0.974 (95% CI: 0.946–0.988), reinforcing the reliability of the MyJump system.
When analyzing average agreement, the one-way random model (ICC1k) and the two-way random model (ICC2k) both produced ICC values of 0.987 (95% CI: 0.972–0.994), while the two-way fixed model (ICC3k) returned a nearly identical value of 0.987 (95% CI: 0.973–0.994), further confirming the high precision of the measurements. These findings indicated excellent intra-rater reliability, suggesting that the MyJump application provides consistent and repeatable squat jump measurements across trials and the low SEM and SEE values further highlight the precision of the MyJump system, demonstrating that systematic error was minimal.
Lastly, the Bland–Altman analysis was conducted to assess the level of agreement between the CMJ MyJump test and retest measurements. The mean bias was 0.153 cm (95% CI: −0.380 to 0.686 cm), indicating a negligible systematic difference between the two measurement sessions (
Table 10 and
Figure 11). The limit of agreement (LoA) ranged from −2.142 cm (lower LoA; 95% CI: −3.068 to −1.216 cm) to 2.449 cm (upper LoA; 95% CI: 1.523 to 3.375 cm). These results indicated that while some variation exists, the magnitude of discrepancies remains small, supporting the reliability of the MyJump application in consecutive CMJ assessments. Overall, the Bland–Altman analysis indicated strong agreement between test and retest measures, reinforcing the repeatability and consistency of MyJump for assessing CMJ height. The narrow confidence intervals and minimal bias further suggest that the observed differences are within an acceptable measurement error range for practical applications.
The Bland–Altman analysis was also conducted to evaluate the agreement between the squat jump (SJ) MyJump test and retest measurements. The mean bias was 0.186 cm (95% CI: −0.118 to 0.490 cm), indicating minimal systematic difference between the two measurement sessions (
Table 10 and
Figure 12). The limit of agreement (LoA) extended from −1.122 cm (lower LoA; 95% CI: −1.650 to −0.595 cm) to 1.495 cm (upper LoA; 95% CI: 0.967 to 2.023 cm). These results demonstrate that measurement variation remains within an acceptable range, supporting the consistency and reliability of the MyJump application for squat jump assessments. Overall, the Bland–Altman analysis suggested strong agreement between test and retest measures, reinforcing the repeatability and precision of MyJump in assessing SJ height. The narrow confidence intervals and minimal bias further indicate once again that measurement discrepancies are negligible and within expected variability limits for practical applications.
4. Discussion
The primary aim of this study was to examine the validity and intra-session reliability of the MyJump 2 smartphone application for assessing countermovement jump (CMJ) and squat jump (SJ) performance in a sample of youth soccer players using the Chronojump system as the reference. Overall, the findings support the use of MyJump 2 as a valid and reliable alternative for measuring vertical jump height in both CMJ and SJ protocols across a mixed-age athletic population, including adolescent and junior players. The Bland–Altman analyses revealed small systematic biases, with MyJump 2 slightly overestimating jump height in both CMJ (+0.943 cm) and SJ (+1.042 cm) compared to Chronojump. Despite these differences, the limit of agreement remained within a practically acceptable range, aligning with prior validation research [
7,
11], where small positive biases were also reported. The narrow confidence intervals around the bias estimates further reinforce the consistency and robustness of these differences, indicating that MyJump 2 systematically overestimates performance by approximately 1 cm. These findings are further contextualized by the calculation of the MDC, which provides a critical threshold for distinguishing genuine performance changes from measurement error. For CMJ, the MDC was calculated at 2.26 cm, and for SJ, it was 1.31 cm, suggesting that any observed changes in jump performance exceeding these thresholds can be interpreted as real and not attributable to inherent measurement variability. This has important implications for practitioners seeking to monitor neuromuscular adaptations in youth athletes, as it delineates the minimum change required for meaningful interpretation when using the MyJump 2 application in field settings. Coaches and practitioners should, nonetheless, be aware of this systematic difference when interpreting absolute values or comparing data across different measurement systems.
Correlation analyses further supported the validity of MyJump 2, with Pearson’s r values of 0.972 for CMJ and 0.955 for SJ, both statistically significant and accompanied by similarly high Spearman’s rho values. These results are in line with previous studies validating MyJump 2 against gold-standard systems such as force platforms and infrared devices [
8,
9], confirming the strong linear association and rank-order consistency of MyJump-derived measurements. Moreover, regression analyses demonstrated excellent predictive accuracy, with MyJump accounting for 94.4% (CMJ) and 91.2% (SJ) of the variance in Chronojump-derived values. These findings are particularly relevant for practitioners seeking reliable field-based tools without the cost or logistical demands of traditional force platforms. Several studies have reinforced the validity and reliability of the MyJump 2 application across various athletic populations and conditions. For example, in a cohort of judo athletes, Soares et al. [
40] reported a strong correlation (
r = 0.97) and minimal bias between MyJump 2 and Chronojump, indicating its utility beyond soccer contexts. Similarly, Balsalobre-Fernández et al. [
12] found almost perfect agreement between MyJump and force platforms for CMJ assessment (ICC = 0.997). However, it is important to note that while force plates perform as gold standards for capturing jump height, as well as other kinetic variables such as force and power, MyJump focuses primarily on jump height assessment. Complementing these findings, additional research has shown that MyJump 2 demonstrates very large correlations with OptoJump as well, for both CMJ and SJ (
r = 0.97) [
17], and that frame rates at or above 240 Hz are sufficient to ensure accuracy in video-based jump height estimations [
18]. Moreover, studies validating MyJump Lab, a newer version of the app, confirmed its near-perfect correlation with force plates (
r = 0.968) and high intra-session reliability (SEM = 0.43 cm, CV = 1.23%) [
19]. Finally, Dias et al. [
20] reported strong concurrent validity and inter-rater reliability (ICC > 0.9) for both CMJ and SJ measurements, further confirming the application’s suitability for both research and applied sports science contexts.
In this context, it is worth noting that vertical jump assessments have also been used to evaluate inter-limb asymmetries in athletes [
13,
21], given the sport’s fundamentally unilateral movement patterns that often favor one dominant limb. Such asymmetries have been associated with reduced athletic performance and elevated injury risk, especially in youth soccer populations [
41]. Previous studies have demonstrated significant relationships between jump asymmetry and performance in sprinting [
42], change of direction ability [
43] and overall fitness metrics [
44,
45,
46], underscoring the importance of reliable jump-based asymmetry assessments in long-term athletic development. Furthermore, research has shown that plyometric training can be effectively adapted for preadolescent soccer athletes [
47,
48,
49,
50], highlighting the need for accessible tools like MyJump 2 to monitor adaptations and asymmetries across maturational stages. Although the present study focused on bilateral CMJ and SJ measurements, future research should consider the application of MyJump 2 in single-leg jump tests to assess functional asymmetries and contribute to targeted interventions in youth soccer development programs.
Reliability analyses further confirmed the intra-rater consistency of MyJump 2. ICC values for both CMJ and SJ ranged from 0.974 to 0.987 across absolute and average agreement models, exceeding the commonly accepted threshold (ICC > 0.90) for excellent reliability [
39]. These findings align with previous research demonstrating the strong test–retest reliability of MyJump 2 and its earlier studies [
8,
10]. Notably, the coefficient of variation (CV) for CMJ (2.2%) and SJ (1.33%) was low, and the SEM and SEE values remained minimal, further supporting the tool’s precision and practical utility in repeated performance monitoring. The consistency observed between the test and retest sessions, as evidenced by Bland–Altman analyses, strengthens the argument for MyJump’s suitability in both research and applied contexts. For CMJ, the test–retest bias was only 0.153 cm, while for SJ, it was 0.186 cm. The limits of agreement for both jumps were narrow and symmetrical, reflecting stable performance measurement across time.
A key strength of this study lies in its inclusion of a mixed-age sample, encompassing adolescents and junior soccer players under 18. However, the study focused on younger athletes, with the mean age being 16.6 years (95% CI: 15.7–17.4), with a standard deviation of 1.87 years. Future studies could expand the age range to include young adults for a more comprehensive analysis. Previous validation research has typically focused on homogenous age groups—either adults [
7] or youth athletes [
9,
11]—limiting the generalizability of findings across developmental stages. By addressing this gap, the present study contributes important evidence supporting the applicability of MyJump 2 across a broader range of maturational levels. This is particularly valuable in talent development systems, where continuous, accessible monitoring is essential for load management and performance progression.
Although several prior studies have validated the MyJump applications, the present study advances the field by including a broader and more diverse youth sample spanning five competitive age groups (U14–U19). This age range allows for a more comprehensive examination of the tool’s applicability across different stages of athletic development, which has been underrepresented in earlier research. Additionally, the simultaneous assessment of both countermovement jump (CMJ) and squat jump (SJ) performance further distinguishes this study, as previous investigations often focused on a single jump type. Together, these elements enhance the ecological validity of the findings and provide more generalizable evidence supporting the practical use of MyJump 2 in youth sport contexts. Despite the encouraging findings, several limitations warrant consideration. First, although Chronojump is a widely validated system, it is not the ultimate gold standard (i.e., force plate). Future research could replicate this design using force plates as a reference to further confirm the generalizability of these findings. Second, the study was conducted in a controlled indoor laboratory environment, which may not fully reflect the conditions encountered in field-based sports settings. Future investigations should also aim to replicate these results under more ecologically valid circumstances and assess inter-rater reliability among different evaluators to further establish the robustness of the application. Furthermore, one methodological limitation of the present study is the absence of inter-rater reliability assessment. While intra-rater reliability was examined using repeated measurements by the same evaluator, the robustness of the MyJump 2 application, when used by different evaluators, remains unexplored in the present study. This limits the generalizability of the findings to situations involving multiple testers with varying levels of experience. Future research should consider including inter-rater comparisons to further establish the consistency of the application across users. Lastly, the findings of this study confirm that MyJump 2 is a valid, reliable and practical tool for assessing CMJ and SJ performance in youth soccer players across developmental stages. MyJump 2 offers significant potential for use in applied sport and educational settings due to its portability, affordability and ease of use. Strength and conditioning coaches can employ the app for routine monitoring of explosive performance during training cycles, facilitating timely adjustments to individualized programs. Physical educators and youth development coaches can implement the application as part of performance profiling or to track maturation-related changes in motor performance and serve as a valuable screening and monitoring instrument. Its strong agreement with Chronojump, high test–retest reliability and minimal measurement error support its integration into sport science and coaching practices as a cost-effective solution for longitudinal monitoring of neuromuscular performance. Future research could further extend the current findings by assessing the performance of the MyJump application in female athletes and across various sports, validating its accuracy against gold-standard force platforms rather than only electronic contact mats in larger and more diverse populations, examining long-term test–retest reliability and day-to-day variability under field conditions and exploring its potential utility for monitoring inter-limb asymmetries and fatigue in youth athletic settings.


 ,
, 


