1. Introduction
Additive manufacturing (AM) has become one of the most important methods for functional components due to its ability to produce complex geometries with high precision by combining materials layer by layer. Especially in metal-based AM, developments over the last decade have elevated the quality and reliability of the technology to a level suitable for creating fully functional final products rather than just prototypes. Topology optimization, used to take full advantage of AM’s design freedom, is considered a switch that expands the manufacturability limits [
1,
2,
3].
Topology optimization is an advanced structural design method that can obtain the optimal structural configuration through the best material distribution under certain boundary conditions [
4,
5,
6]. Using additive manufacturing technology enables unique and innovative designs in various industries that cannot be achieved with conventional manufacturing [
7,
8,
9]. To take full advantage of both topology optimization and AM, it is first necessary to integrate design constraints into topology optimization [
10].
Support structures are required to prevent the overhangs from collapsing in the AM process, and supports usually have to be removed after manufacturing. Support structures used during manufacturing increase material consumption, post-processing time, and difficulties [
11,
12]. Therefore, it has been reported that support structures are the most prominent problem limiting manufacturability in AM [
13]. Therefore, one of the most prominent typical AM constraints for topology optimization is the overhang constraint [
14].
An extensive body of research has been dedicated to minimizing additional supports in the additive manufacturing process. This has been achieved by incorporating the overhang constraint into the topology optimization process, leading to the proposal of optimized designs that eliminate the need for any support structures [
15]. Consequently, manufactured structures have evolved to be integral components of the design rather than just supports. The critical overhang angle of the Ti-6Al-4V part, fabricated using Selective Laser Melting (SLM), was empirically determined, with successful production realized at angles of 20° or greater [
16]. Through numerous SLM-based experiments, Thomas further validated 45° as the critical overhang angle [
17].
Additionally, the research conducted by Zou et al. delved into topology optimization for additive manufacturing, considering the self-supporting constraint within the Solid Isotropic Material with Penalization (SIMP) framework [
18]. In an effort to minimize the volume of additional supports, Morgan et al. employed the optimal build direction within their optimization approach [
19]. To further reduce supports, Hu et al. proposed a direction-based shape optimization approach [
20]. A pivotal area of current research is the integration of overhang constraints into topology optimization to maintain self-supporting structures [
21]. Johnson and Gaynor used this method to construct self-supporting structures [
22]. In a similar study, Langelaar proposed a self-supporting AM filtering procedure that could be integrated into topology optimization, focusing on generation [
15,
23]. This layer-based filtering concept introduced by Langelaar has seen extensive application and examination in the academic literature [
24,
25,
26,
27]. An approach combining geometric and mechanical constraints has been developed to effectively utilize self-supporting structures [
28]. Complementing this, Guo et al. introduced two effective strategies based on the Moving Morphable Components (MMC) and Moving Morphable Voids (MMV) frameworks, respectively [
29].
In light of these investigations, topology optimization designs for AM have gained considerable significance in engineering applications and academic research in recent years. Despite this progress, a notable deficiency lies in the absence of an assessment of reliability criteria essential for the direct utilization of designs achieved through topology optimization in AM. A substantial gap exists in the current literature for enhancing computational efficiency and stability in topology optimization, particularly where uncertain parameters in designs are considered [
30]. The process of ascertaining the optimal material distribution within the design via topology optimization is further complicated by the uncertainties introduced through the manufacturing processes [
31].
In structural designs, inherent uncertainties often encompass design variables such as material parameters (e.g., modulus of elasticity, yield strength) and applied force [
32]. However, deterministic topology optimization fails to account for the uncertainties of these random variables in the solution phase. Considering these structural uncertainties within deterministic problems leads to the derivation of more dependable designs. As a result, Reliability-Based Topology Optimization (RBTO) has emerged as a new strand of optimization [
33,
34]. RBTO aims to account for uncertainties in applied loads and other random variables during the solution process [
35,
36,
37,
38]. Employing the RBTO model, distinct topologies are procured depending on the targeted reliability levels, differing from those acquired via deterministic topology optimization. The resulting topologies offer a better volume/reliability ratio than deterministic approaches [
39].
To the best of the authors’ knowledge, no existing studies in the literature simultaneously incorporate additive manufacturing (AM) constraints into reliability-based topology optimization (RBTO) problems. Integrating AM parameters into the topology optimization process is common practice, but considering reliability criteria alongside these constraints is essential for developing more robust and manufacturable designs. In this research, the build direction parameter used in additive manufacturing is solved by adapting it to a deterministic and RBTO algorithm. The comparison focuses on the topological attributes and compliance of the intended blueprint, to be produced under four varying direction parameters. The application of the solution was realized on structures such as the Messerschmitt–Bolkow–Blohm (MBB) beam, cantilever beam, and L-shape beam using 88 lines of MATLAB TO code [
40]. In deriving the solution, we conducted a comparative evaluation of sensitivity and density filters. As a part of our optimization methodology, we employed MATLAB R2023b Optimization Toolbox’s interior-point algorithm to update the design variables. In addressing the RBTO problem for the examples considered in this research, both the Method of Moving Asymptotes (MMA) and Optimality Criteria (OC) were examined, providing a comparative analysis of the results.
2. Materials and Method
2.1. Deterministic Topology Optimization
In this study, the focus is on the minimum compliance topology optimization algorithm, as illustrated in Equation (1). The objective here is to discover the material distribution (represented by
) throughout the design space that results in maximum stiffness while adhering to a specific volume constraint.
The vector represents the design variables within the minimum compliance topology optimization algorithm. The stiffness matrix, displacement vector, and force vector are denoted by , and respectively. refers to the number of elements that discretize the design area while and are the displacement of an element and elemental stiffness matrix, respectively. The material volume and the design area volume are represented by and , with as a pre-determined upper limit in the volume fraction. is the minimum relative density used to prevent singularity in the model. When , it signifies that the corresponding element within the structure is considered empty, meaning it does not contribute to the physical attributes of the design.
The design domain is discretized using square-shaped finite elements, adhering to a fundamentally density-based topology optimization methodology. A revised version of the Solid Isotropic Material with Penalization (SIMP) method is employed, allowing for the implementation of filters within the optimization process.
Here,
represents the stiffness of the solid elements while
is the density value attributed to the void regions to prevent the stiffness matrix from becoming singular. Additionally,
is a penalization factor, usually set to 3, used to ensure definitive black-and-white solutions. A significant advantage of the modified SIMP method is its ability to allow for the straightforward application of additional filters [
40].
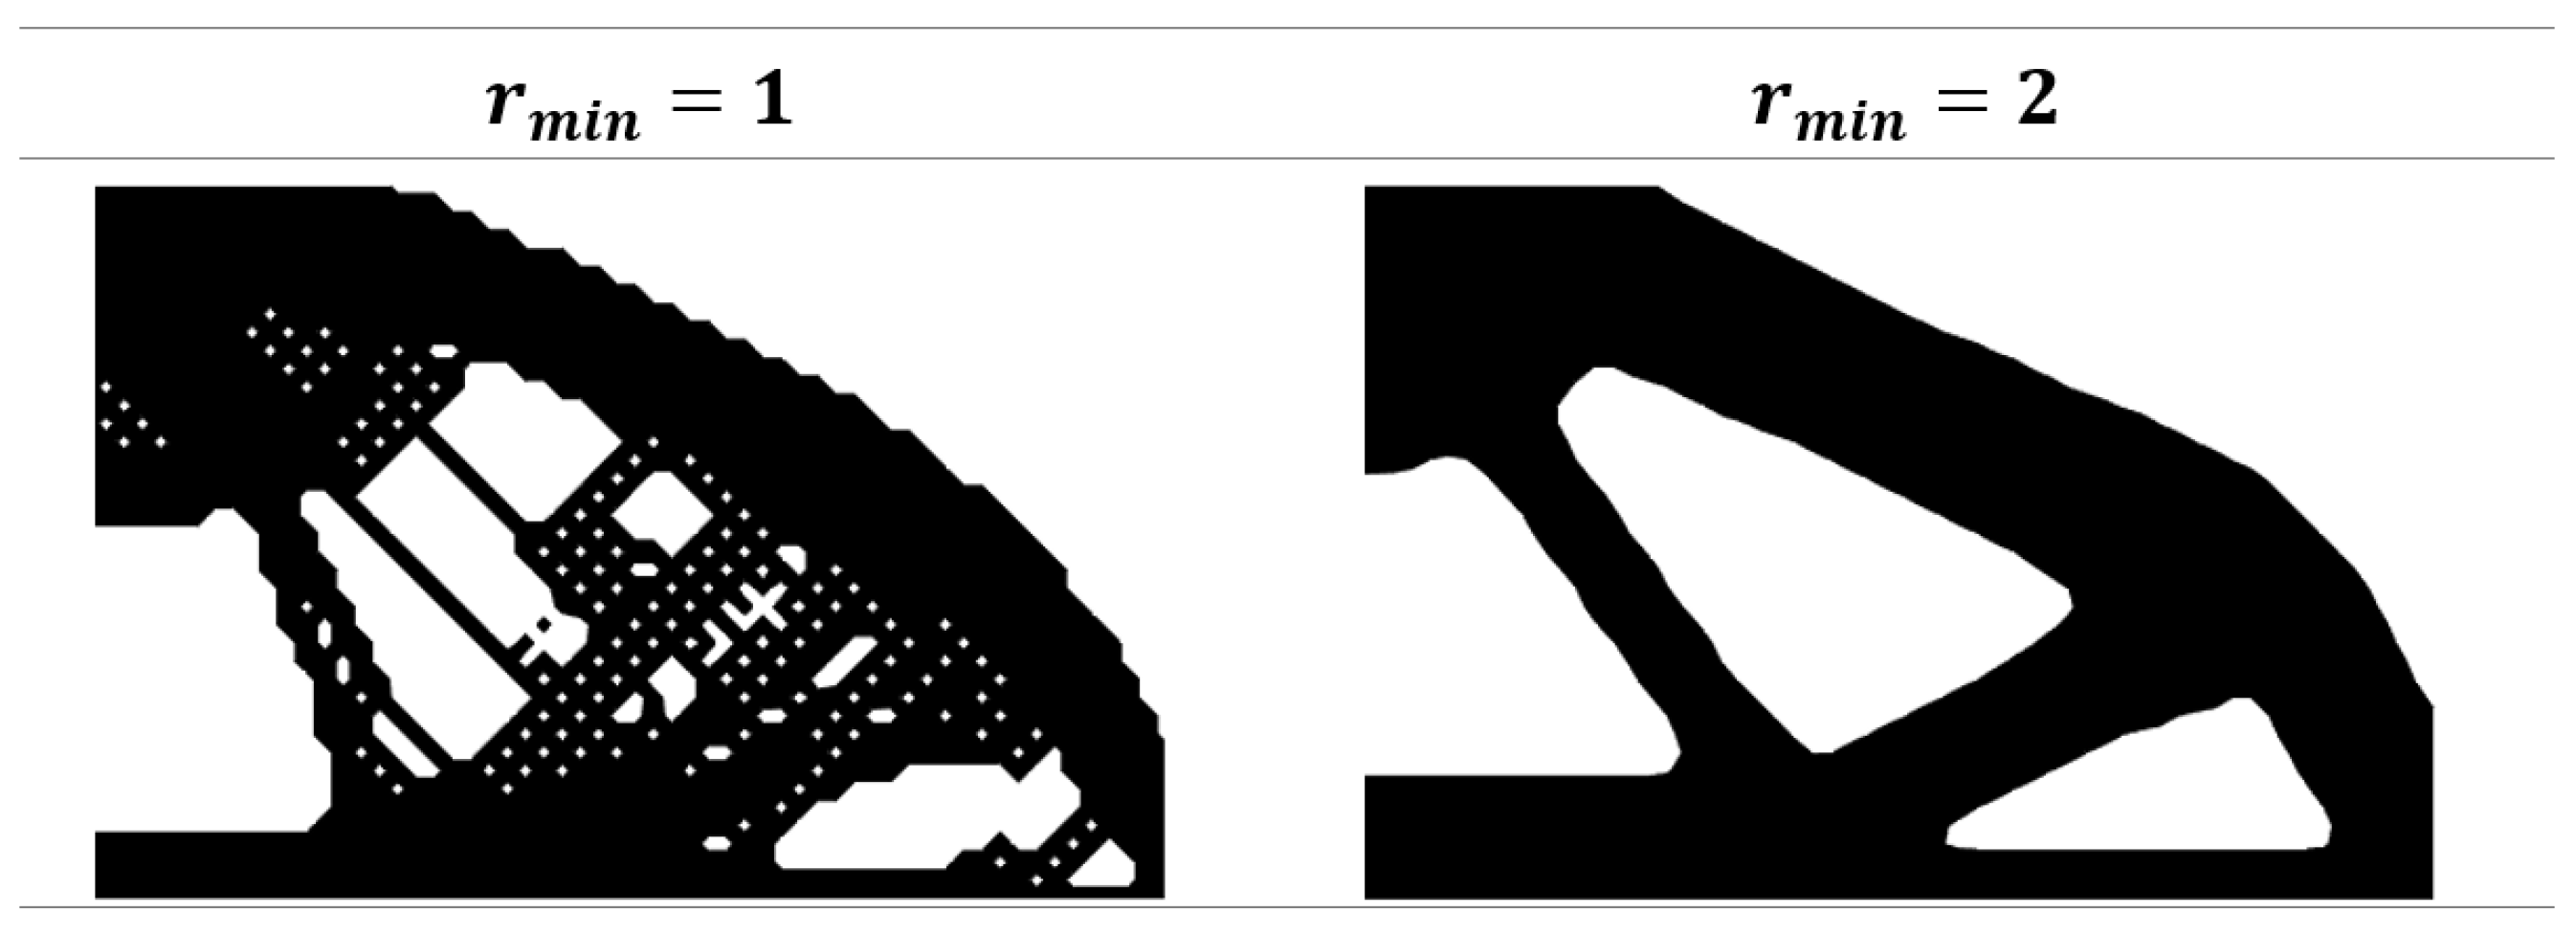
Certain filters must be employed to address the topology optimization problem and prevent the creation of checkerboard patterns, as seen in
Figure 1. To establish areas of medium density, a smooth transition between solid and empty regions is required, facilitating a more controlled and desired material distribution.
A prevalent technique for achieving this is the application of a filter radius (
) to the sensitivities or densities. The specific sensitivity filter utilized in the topology optimization (TO) problem is detailed as follows [
40]:
Here, the term
is a small positive number, and
is a weighting factor defined as follows:
In the classical SIMP approach, the density variables cannot be zero, and the
term is not required. The density filter used for TO problems is given as follows:
The filtered densities, referred to as
, are known as physical densities. Therefore, the filtered density field
should always be presented instead of the original density field
as a solution to the optimization problem. In the case of applying the density filter,
is replaced by
. The sensitivities with respect to the design variables
are obtained using the chain rule as follows:
where
stands for either the objective function or the volume of material. When aiming to design cost-effective and reliable structures, reducing the structural weight in areas that are not essential becomes critical. This must be executed with careful consideration of variability and randomness in the optimization strategies. The following section will explore the particular reliability criteria that must be assessed to achieve this goal.
2.2. Reliability Evaluation
Within the scope of topology optimization designs, the reliability criteria incorporate the uncertainties associated with random variables. This methodology is embedded within the optimization process to identify a dependable and ideal configuration for a structure in a specified area. In conducting a reliability analysis, a normalized vector of the random variable (
) and a reliability index (
) are introduced [
41]. Although the design variable
does not appear explicitly in Equation (7), it influences the structural response and performance functions used in the reliability analysis, thereby indirectly affecting the value of
through the limit-state function. When dealing with a normal distribution, the expressions for
and
are defined as follows:
where
is the
’th random variable with a mean value of
and a standard deviation
. The vector (
) represents the standard normal transformation of random variables, which are implicitly dependent on design variables through the reliability analysis process. Therefore, an RBTO (Reliability-Based Topology Optimization) problem, formulated by integrating the reliability analysis into the topology optimization problem, can be described as follows:
Here,
and
represent the system’s reliability index and target reliability index, respectively, and
represents random variables described in the standard normal space. In the expression found in Equation (8), there are two nested optimization loops. For every value that the design variables assume in the solution phase of the outer loop, the value of the reliability index described in the inner loop is computed. In the RBTO problem, where the outer loop is directed towards a minimum compliance goal and constrained by reliability, the inner loop is characterized as a reliability problem. Within the inner loop, the failure region is denoted as
, while the limit state function is expressed as
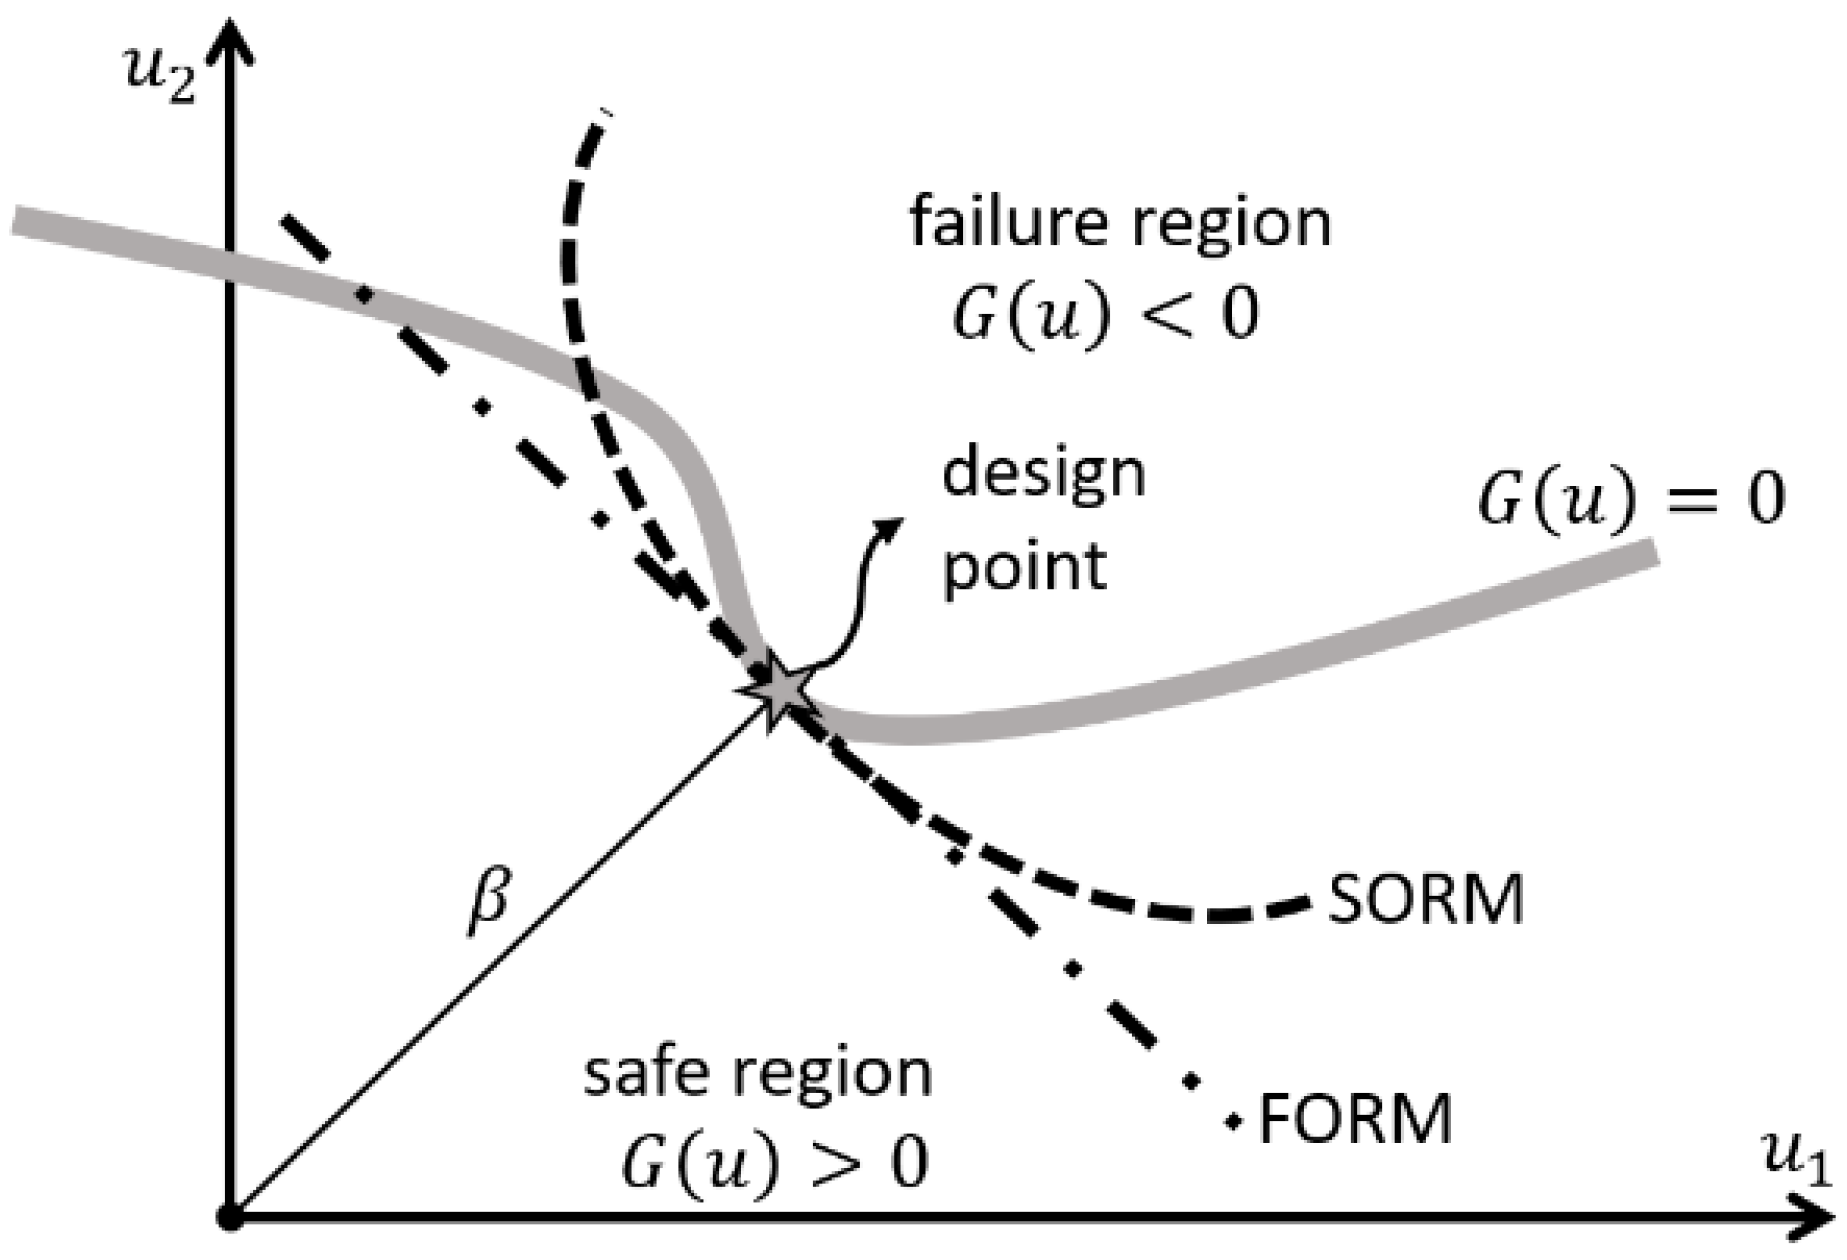
. The probability of failure, as defined in this context, is given as follows:
Here,
shows the combined probability density function of random variables. Therefore, to solve the integral given in Equation (9), analytical methods such as the First- and Second-Order Reliability Method (FORM and SORM) shown in
Figure 2 [
42] or simulation-based methods such as Monte Carlo can be considered [
43].
The Reliability Index Approach (RIA) and the Performance Measurement Approach (PMA) are the two prevalent methods for evaluating reliability using FORM. In RIA, the calculation of the reliability index involves solving a minimization problem in the variable space
, being the vector of standard normal variables. Conversely, PMA aims to identify a probabilistic measure of performance by approaching the problem as an inverse reliability problem. The PMA method has found widespread application in reliability assessment [
44,
45]. The equation employed in the inner loop for the TO solution, making use of PMA, is articulated in Equation (10) for scenarios where displacement is taken into account:
Here, represents the design variables of the standard normal distribution, is the maximum displacement value, and is the allowable displacement value. The following section will explain how the AM filter is adapted to the RBTO problem described here.
2.3. AM Filter Concept
In Additive Manufacturing (AM) methods like Selective Laser Melting (SLM) or Electron Beam Melting (EBM), one of the constraints involves maintaining a minimum threshold angle for the incline of a surface facing downward (referred to as an overhang) in relation to the baseplate. When this standard is fulfilled for a specific part direction, it is understood that the part is self-supporting in that direction [
23]. This widely recognized constraint in Additive Manufacturing has been extensively studied in various processes. The critical angle that is often cited approximates 45 degrees [
46,
47,
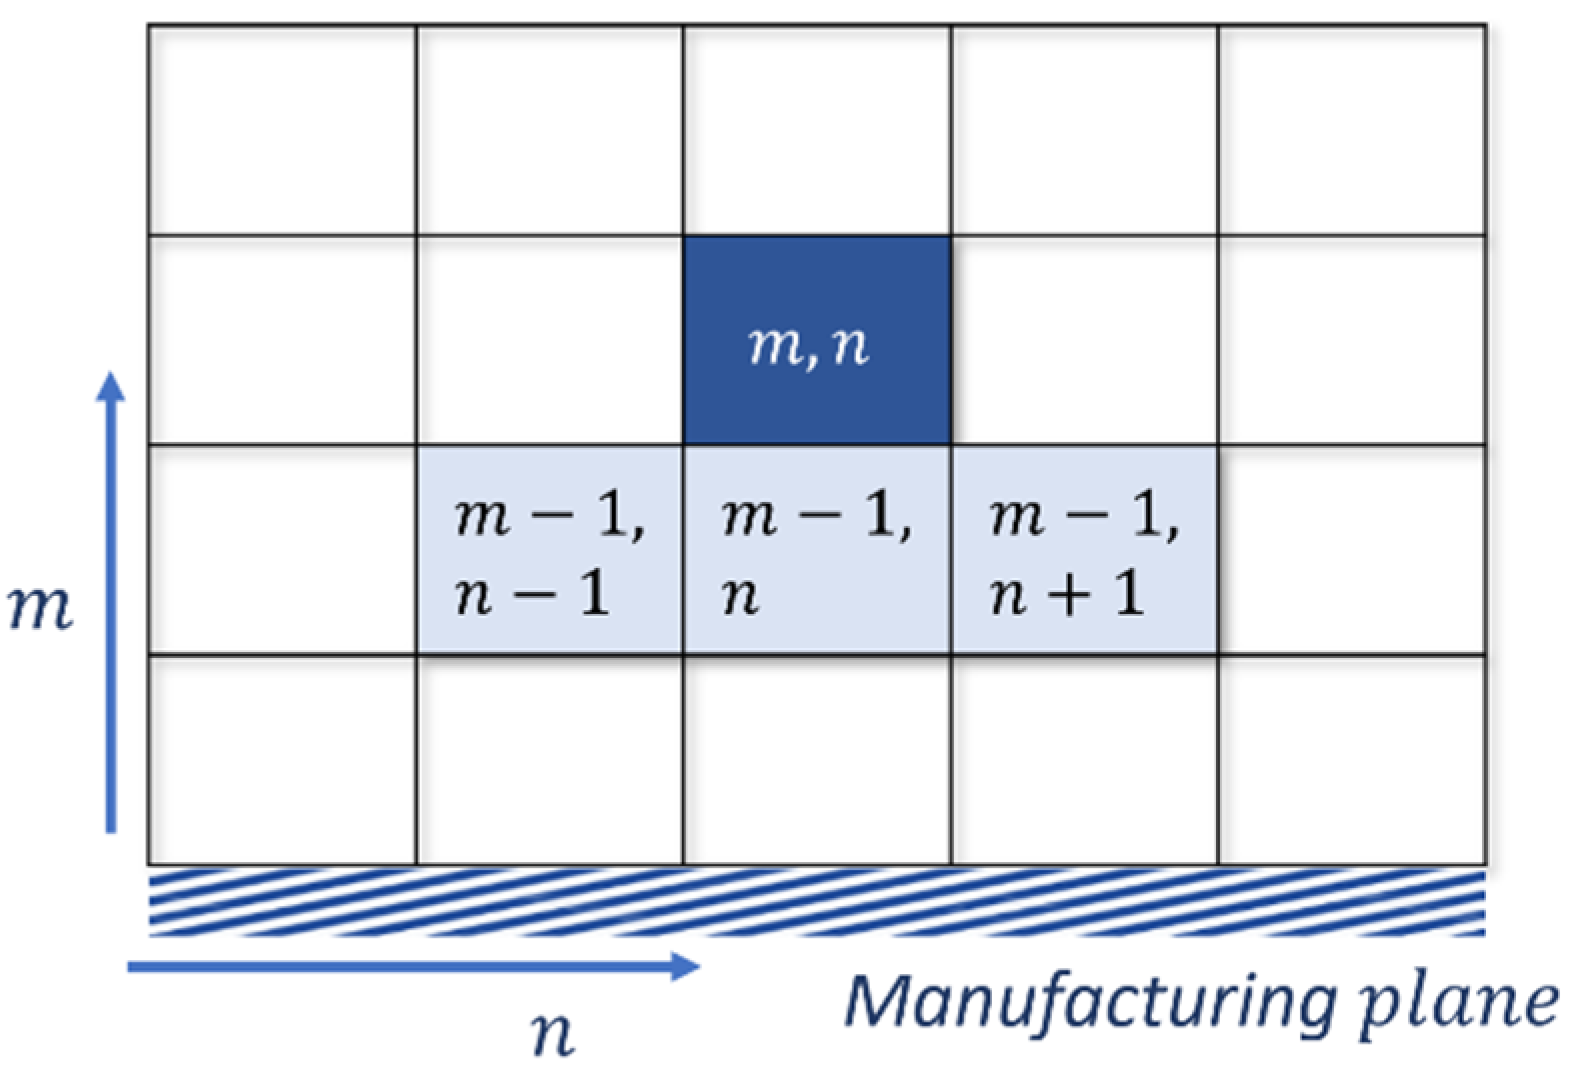
48]. If a piece possesses areas with overhang angles falling beneath this critical degree in the chosen manufacturing orientation, it will not be self-supporting and cannot be printed in its current form. The support region in this context refers to the three-square elements in the layer underneath, depicted in
Figure 3.
In the present study, the filter recommended by [
15], tailored to suit the requirements of the AM process, was utilized in the topology optimization of two-dimensional structures. According to this method, an element in a specific location must be sufficiently supported by the elements on its underlying layer to be printable. The supporting region is designated to include the element directly beneath or the immediate neighboring elements. The mathematical expression for the AM filter in the 2D scenario is provided as follows:
Here,
and
denote the vertical and horizontal location of the element,
shows the printed density of the element at a given location, and
shows the density of element (
). Derivatives are taken using
and
smooth approximations for precision calculation in the optimization process. The mentioned approaches are expressed below:
Here, the and parameters control the accuracy and smoothness of the approximations. The exact minimum and maximum operators for and are obtained, but the smoothness is lost. In this study, was chosen as the default value.
In this study, reliability analysis was adapted to the existing topology optimization approach and an AM constraint was added to consider the orientation of the printed part. Langelaar’s suggested AM filter is incorporated into the renowned 88-line topology optimization code created by Andreassen et al. [
15,
40]. By default, this code employs the OC optimizer. Within this procedure, an inner loop continually evaluates the volume constraint, meaning the AM filter is invoked several times, subsequently increasing computational time. As a result, modifications were made to the codes in alignment with the MMA [
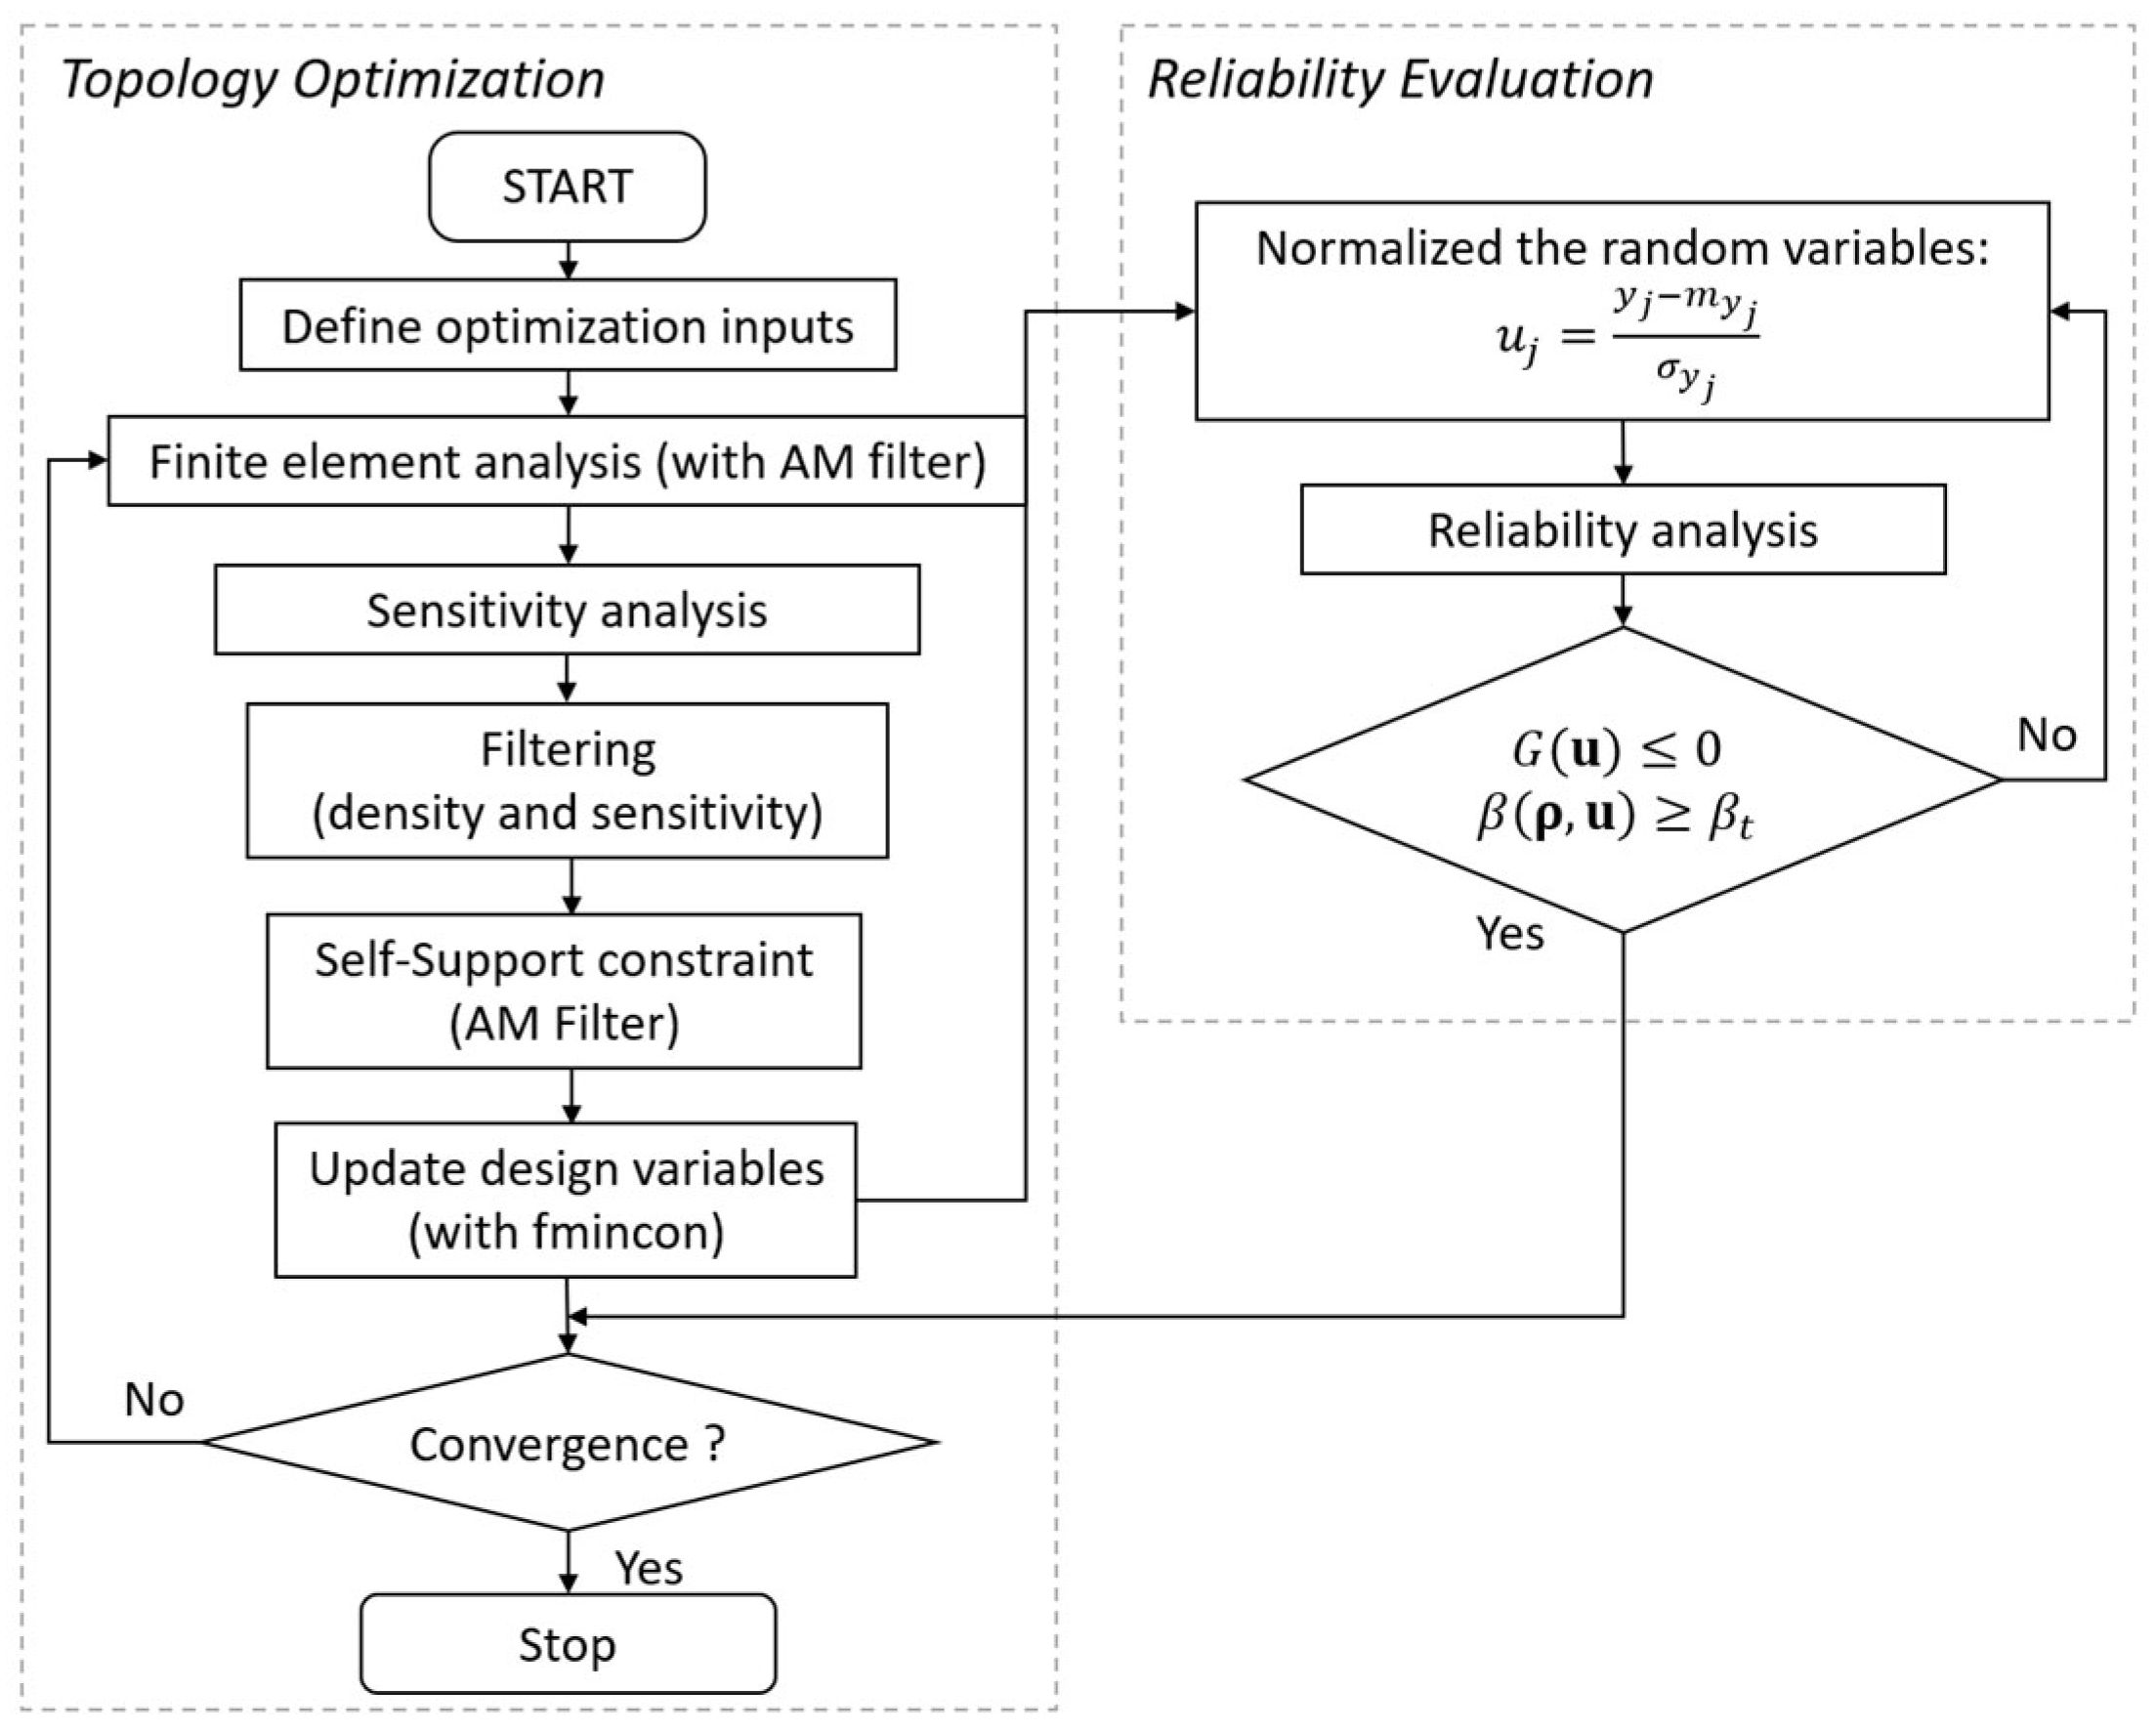
49] and the interior-point method. We compared the Optimality Criterion (OC), Method of Moving Asymptotes (MMA), and interior-point methods during the design iteration process. This assessment of the AM filter played a key role in shaping our final conclusions. The modification of the AM filter to fit the RBTO problem is depicted in Equation (13):
In this formulation,
is the primary design variable. The printed density field
is a dependent quantity derived via the AM filter from
. The flow chart that outlines the formulation represented by Equation (13) is provided in
Figure 4.
The interior-point method in MATLAB is a general-purpose primal-dual algorithm based on barrier functions and typically utilizes second-order derivative information when available. In contrast, MMA is a first-order, approximation-based method specifically developed for large-scale structural optimization problems. It constructs separable convex subproblems with moving asymptotes to guide the search direction. While MMA shares some conceptual similarities with interior-point approaches (e.g., staying within bounds), its algorithmic structure and convergence properties are distinct. In this study, MMA was implemented directly within the topology optimization loop, while the interior-point method was used through MATLAB’s built-in solver.
2.4. Sensitivity Analysis with AM Filter
In density-based topology optimization, the design variable typically represents the material distribution across the design domain. The compliance is minimized subject to volume and other constraints. When applying an additive manufacturing (AM) filter, the physical (or printable) density used in FE analysis and sensitivity computations is a nonlinear transformation of , implemented to satisfy manufacturability constraints (e.g., overhang constraints).
2.4.1. Standard Chain Rule for Sensitivity Analysis
The compliance objective function is given by
Its sensitivity with respect to the design variable
is calculated using the chain rule:
Here, is the filtered density using the AM filter, is the local compliance derivative with respect to , and accounts for the AM filtering effect.
2.4.2. AM Filter Behavior
We use the AM filter proposed by [
23], which applies a directional filtering process. For a build direction (e.g., ‘W’), the printable density field
is computed via layer-wise maximum and minimum smoothing, using parameters
,
, and a base density
.
The upward recurrence relation for filtered density is
2.4.3. Derivative of the AM Filter
To propagate sensitivities through the AM filter, the partial derivatives of the smoothing functions used in the filter (specifically the smooth minimum and smooth maximum operations) must be computed analytically. The derivative of the smooth minimum function
with respect to
is
Similarly, its derivative with respect to
is
These partial derivatives are used recursively to backpropagate the sensitivities from to over each layer of the mesh, starting from the build plate upward.
2.4.4. Total Sensitivity with Filtering
represents either the objective function or a constraint function. The complete sensitivity of
with respect to the design variable
, considering the effect of the AM filter, is expressed using the chain rule as
In the implementation, the second term is computed by the AM filter function and applied to the raw sensitivity data provided by the structural solver.
3. Results and Discussion
In the present research, a minimization of linear elastic compliance was conducted under a volume constraint, utilizing the SIMP material interpolation technique [
1,
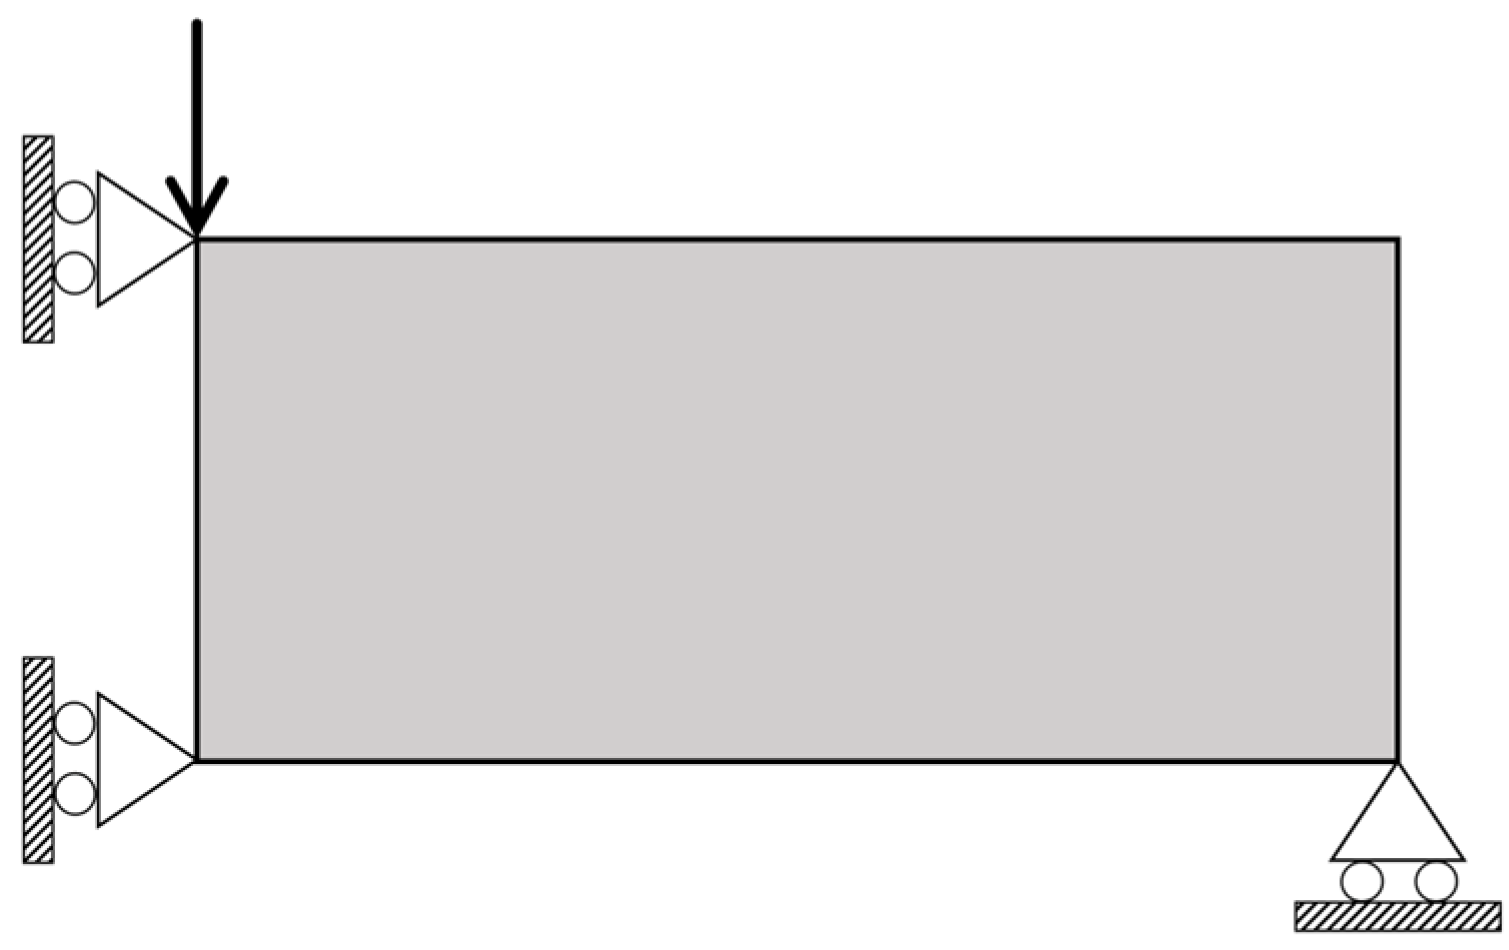
50]. The investigation considered the Messerschmitt–Bölkow–Blohm (MBB) symmetrical beam, as depicted in
Figure 5, and employed material properties of Young’s modulus
GPa and Poisson’s ratio
.
The optimization process was conducted across four varying table layouts (west ‘W’, east ‘E’, north ‘N’, south ‘S’), utilizing the 88-line TO code. Within the topology optimization, a penalty factor value of was applied to diminish the influence of medium-density (gray-colored) elements. The assumptions included a radius filter of , a volumetric ratio , and a target reliability index .
Two different filters were employed and compared within this study, namely the sensitivity filter and the density filter, both serving to mitigate checkerboard patterns. The example solutions treated the force expression in the beam as a stochastic variable, following a normal distribution with a mean of 100 and a standard deviation of 10. A constraint was set on the beam’s allowable displacement value at 0.04, in alignment with reference [
51]. However, this threshold is used as a target within the RBTO reliability formulation rather than as a strict deterministic bound. As such, minor exceedances are permitted based on the selected reliability index.
Simultaneously, a comparative assessment was performed between the Optimality Criterion (OC) and the Method of Moving Asymptotes (MMA) methodologies, both used to update the design variables. All example solutions were executed on a computer system equipped with an Intel Core i7-6700 CPU operating at 3.41 GHz and possessing 16GB of RAM.
3.1. MBB Beam
For the MBB beam, design areas measuring 30 × 20 and 90 × 60 were employed, as illustrated in
Figure 5. Across all evaluated scenarios, the iteration count was limited to a maximum of 300. The results clearly demonstrated that different build directions led to the emergence of distinct topologies. Most significantly, all the resulting designs were in full compliance with the Additive Manufacturing constraint, a factor that takes into consideration the specific direction of construction.
In this study, a thorough comparison was made by initially presenting deterministic Topology Optimization (TO) solutions, as shown in
Figure 6. The subsequent analyses included both sensitivity (ft = 1) and density filter (ft = 2). The deterministic solutions were then compared with those in
Figure 6, involving the Optimality Criterion (OC), Method of Moving Asymptotes (MMA), and interior-point methods. It was observed that the design updated via the interior-point method converged more rapidly than those employing MMA and OC when the sensitivity filter was used. Despite these differences in convergence, both approaches led to topologically similar results.
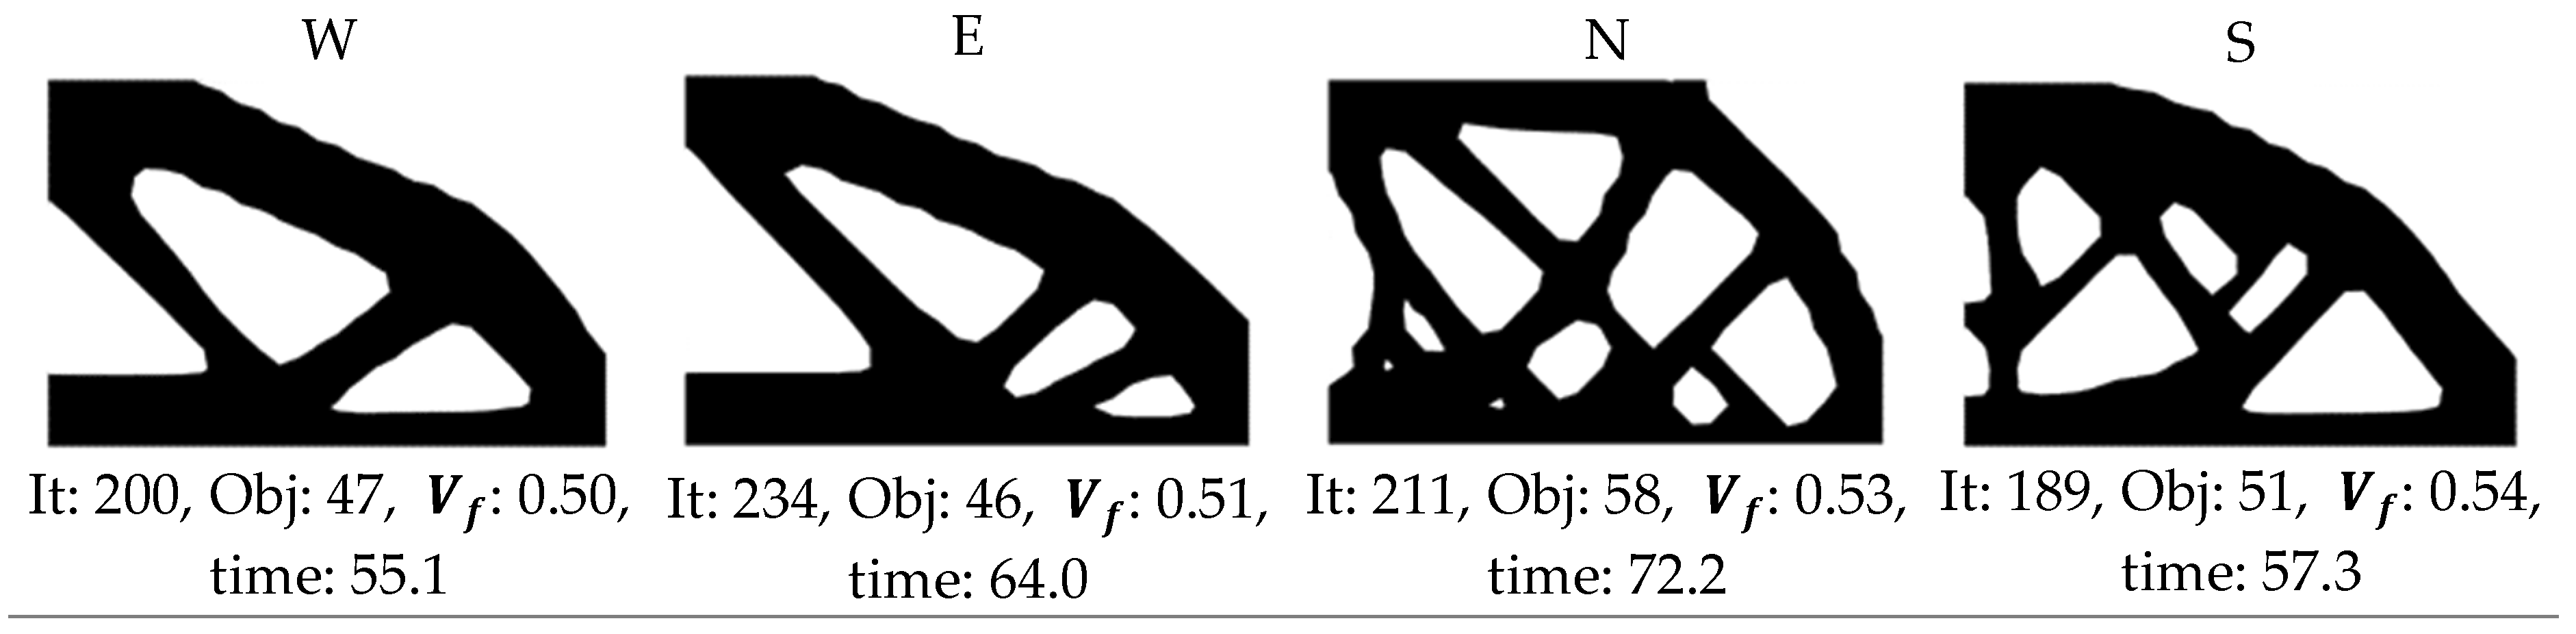
Figure 7 illustrates the deterministic Topology Optimization (DTO) outcomes, achieved in four unique manufacturing directions (W, E, N, S), for the MBB beam with the Additive Manufacturing (AM) filter applied in this research. Consequently, a distribution was achieved that eliminates the necessity for a support structure in the manufacturing direction. Owing to the stability of the results when using the sensitivity filter (ft = 1) in conjunction with the interior-point algorithm, compared to the density filter, subsequent solutions were conducted with the sensitivity filter.
The west direction is preferable, achieving the required compliance without hindering performance. The north and south orientations require additional material to maintain the structure, thereby improving fit. Slight modifications in the east and west designs lead to minor increases in compliance. Without the utilization of an AM filter, the reference design (as shown in
Figure 6) cannot be printed in any of the considered directions without the aid of a support structure.
Figure 8 reveals the results of both RBTO and RBTO with the AM filter. Highlighted by blue lines on the optimal figures, the additive manufacturing table represents the AM filter, which was assessed for the ‘W’ direction for minimal compliance, in line with prior findings. Additionally, the optimal topologies that were identified were fabricated using a 3D printer (Creality Ender-6, Shenzhen, China).
The regions where the overhang angle exceeds the 45° threshold are marked with red lines, indicating areas that would require support structures if printed without applying the AM constraint.
Based on the results presented, the AM-RBTO/W algorithm consistently excels in structural design by achieving lower values for the objective function. Specifically, in the case of a 30 × 20 structure size, the AM-RBTO/W algorithm not only yields a lower objective function value but also provides a solution more rapidly compared to the RBTO algorithm. Even for the 90 × 60 structure size, where the objective function values were identical, the AM-RBTO/W algorithm retained a benefit by reaching the solution in less time. In a comparison of 3D printing durations, the algorithm incorporating the AM filter finished 13 min quicker.
These outcomes collectively illustrate the effectiveness of the optimization in balancing material consumption against structural performance. A reduced objective function value signifies improved structural performance, whereas an increased volume fraction corresponds to a greater utilization of material.
3.2. Cantilever Beam
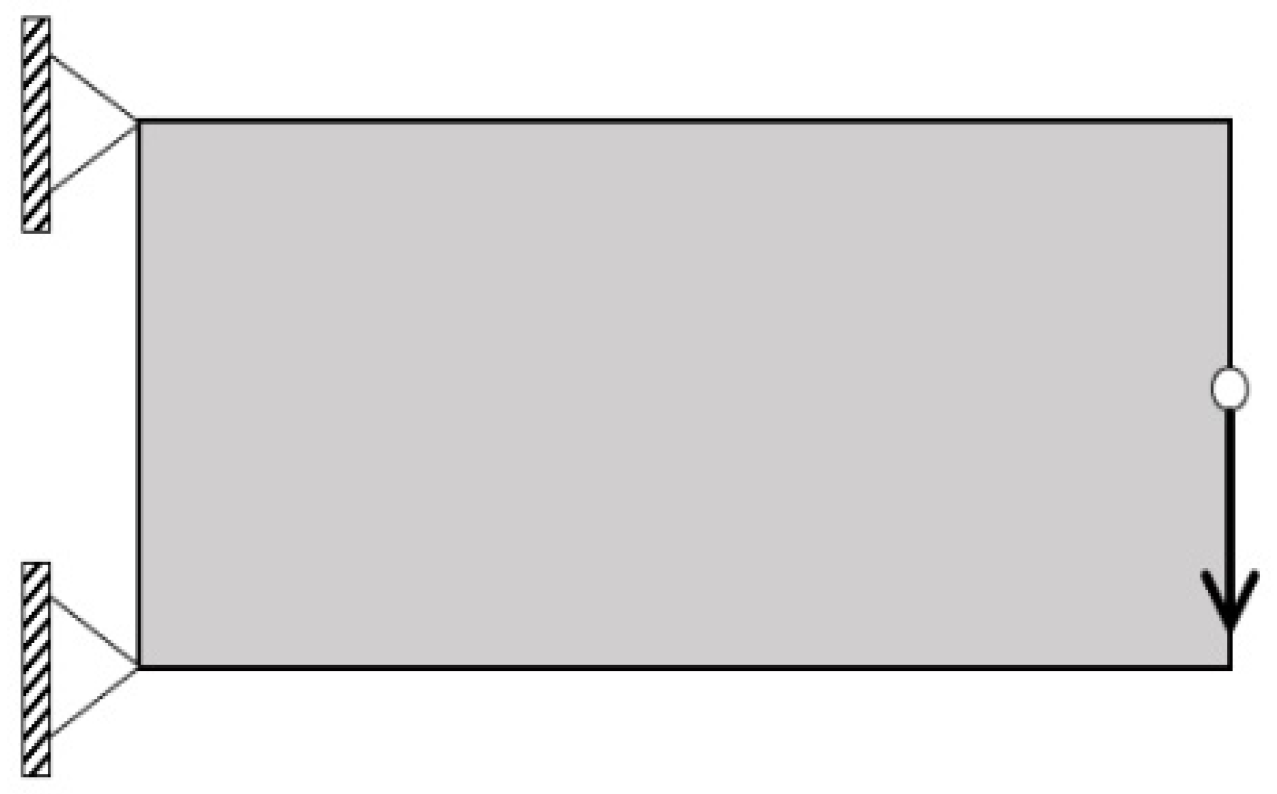
For the cantilever beam depicted in
Figure 9, design areas of 30 × 20 and 90 × 60 were employed, akin to the previous example. A maximum of 300 iterations were set for all cases. In this solution, only the sensitivity filter was employed, as it consistently delivered stable results. The penalty factor was set at 3, the minimum radius (
) at 1.2, the volume ratio at 0.5, and the target beta value at 3.
Figure 10 presents the results obtained from DTO, RBTO, and RBTO with the AM filter. The optimal solutions with dimensions of 90 × 60 were produced using a 3D printer and scrutinized. In alignment with the previous example, the west direction was chosen as the printing orientation.
In the given example concerning the cantilever beam problem, a comparative analysis was conducted across various optimization algorithms and structure sizes. Specifically, DTO, RBTO, and AM filter with RBTO algorithms were evaluated with respect to iteration counts, objective function values, volume fractions, and solution durations for two distinct structure sizes. From the examination of the results, it was discerned that the AM-RBTO/W algorithm achieved the most favorable objective function value, thereby rendering the best structural performance with a volume fraction of 52%. While the DTO algorithm yielded quicker results compared to RBTO, the RBTO algorithm demanded the most time to converge, averaging 15.6 s. Furthermore, the implementation of the AM filter, which eliminated the need for support structures, facilitated a reduction in printing time, diminishing it to as low as 21 min.
Upon inspection of the geometric structures derived from the solution, it was observed that alterations in material distributions occurred when the mesh size was increased. This phenomenon, known as mesh dependency, remained unaffected when the AM filter was employed.
3.3. L-Shape Beam
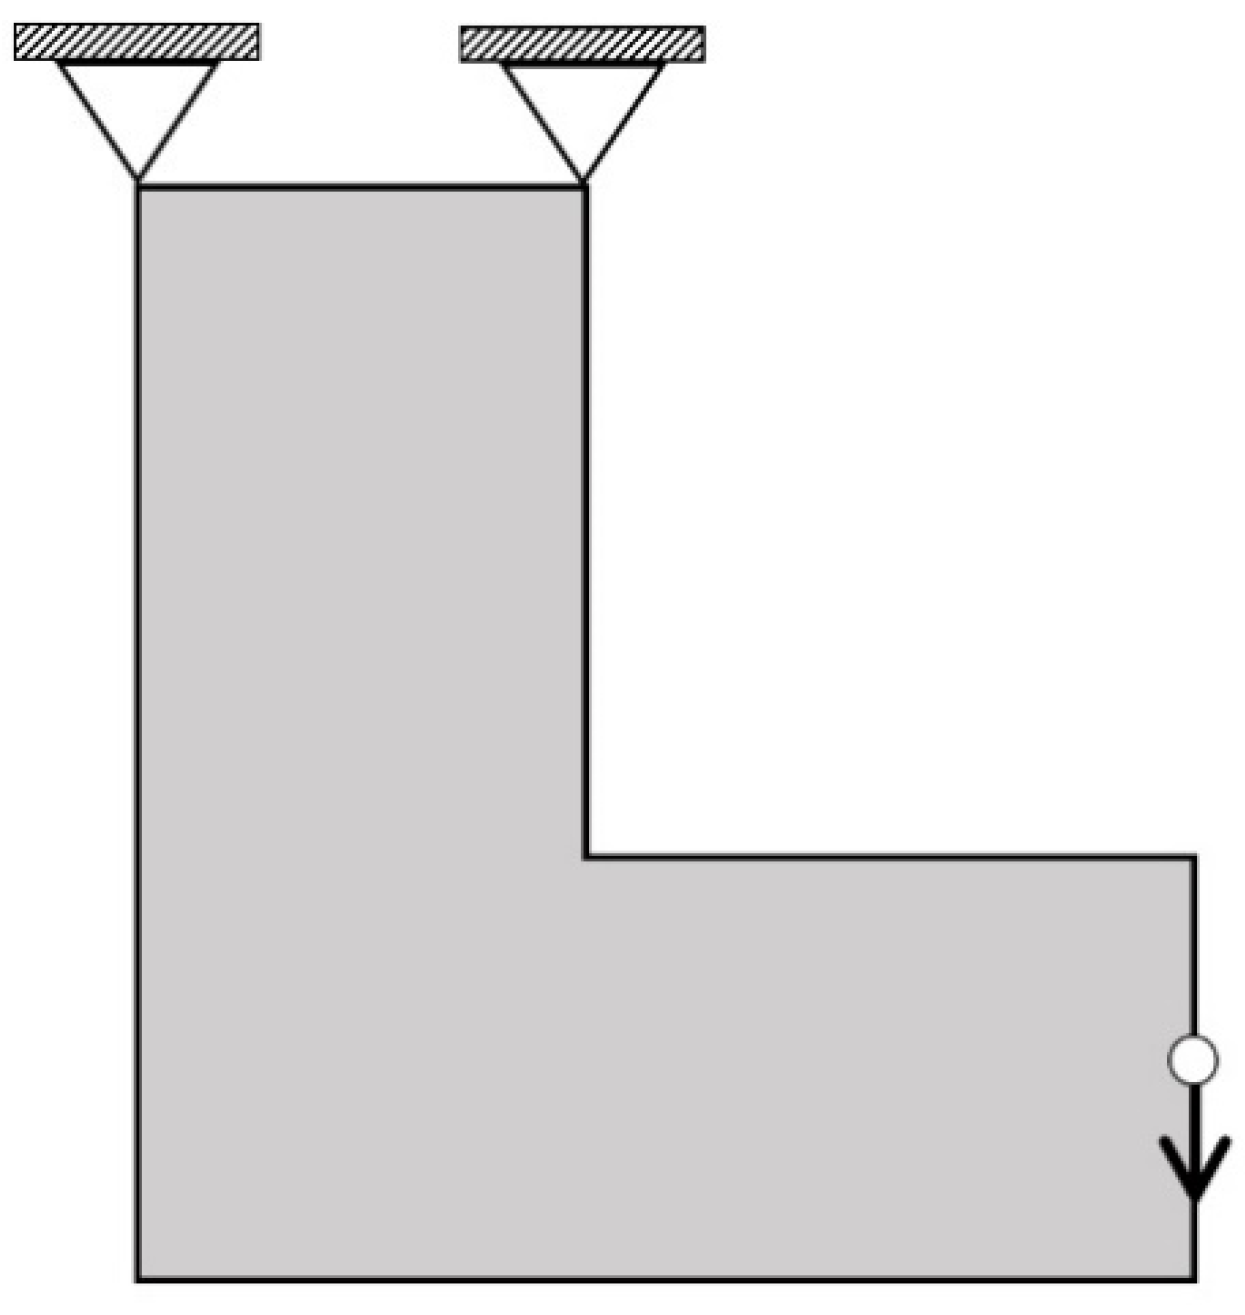
In the analysis of the L-shape beam illustrated in
Figure 11, design areas of 40 × 40 and 120 × 120 were utilized. A limit of 300 iterations was established for all scenarios to ensure consistency in comparison. Within this solution, the sensitivity filter was applied, aligning with the methodological framework used in previous examples. These settings facilitated the optimization process, ensuring a comprehensive assessment and alignment with the problem’s constraints and goals.
The optimization results for the L-shape beam are illustrated in
Figure 12. Similarly to previous examples, the optimized structures were subsequently 3D printed. Unlike other cases, the upper right quarter square was made passive in this optimization by employing a square design area with dimensions of 40 × 40 and 120 × 120 specifically for the L-shape beam. During the application of the AM filter, the optimization process was conducted with particular consideration for the south (S) direction.
Figure 12 examines three distinct algorithms (DTO, RBTO, and AM-RBTO/S) across two varying sizes (40 × 40 and 120 × 120). In the case of the 120 × 120 size, the RBTO algorithm demonstrates the greatest solution time and number of iterations, whereas the other sizes and algorithms exhibit comparable iteration counts and times. This example also reveals the inclusion of time and support structure cost when the AM filter is omitted in the 3D printing of optimal designs. Generally, variations are noticeable among the different sizes and algorithms, and the displacement values stemming from these variations are detailed in
Table 1.
A review of the displacement results in
Table 1 reveals that the solutions derived from RBTO are less than those from deterministic solutions. Calculated displacement refers to the maximum nodal displacement magnitude obtained via finite element analysis after optimization. Introducing the additive manufacturing filter to deterministic problems has led to an increase in displacements under the influence of applied loads. Similarly, when the results are analyzed by integrating the additive manufacturing filter with reliability-based analysis, there is no substantial alteration observed in comparison to RBTO.


