Article

Comparative Analysis of Lab-Data-Driven Models for International Friction Index Prediction in High Friction Surface Treatment (HFST)

Department of Civil, Architectural, and Environmental Engineering, Missouri University of Science and Technology, Rolla, MO 65409, USA
*
Author to whom correspondence should be addressed.
Appl. Sci. 2025, 15(11), 6249; https://doi.org/10.3390/app15116249
Submission received: 21 April 2025 / Revised: 25 May 2025 / Accepted: 30 May 2025 / Published: 2 June 2025

Abstract

High Friction Surface Treatments (HFSTs) are often utilized as a spot treatment to enhance selected areas with high friction demand rather than extended pavement sections and are helpful in increasing skid resistance and minimizing road accidents. A laboratory design approach was created to assess the fundamental ideas behind the international friction index (IFI) concept and update the present IFI model parameters for HFST applications based on test findings to gain a better understanding of HFST performance. Two aggregate types in three sizes were tested under controlled polishing cycles. Friction and texture were measured using the Dynamic Friction Tester (DFT) and Circular Track Meter (CTM). Three physics-informed empirical models, including logarithmic, power law, and polynomial models, were selected to better represent texture effects, nonlinear scaling, and complex interactions between COF and MPD. Results show that friction performance varies with aggregate type, gradation, and polishing, and that traditional IFI parameters may not fully capture HFST behavior. Model refinements are suggested to better represent HFST surface characteristics with the lowest testing Root Mean Squared Error (RMSE) (0.049) and the highest predictive accuracy R2 (0.821); the logarithmic model was found to be the best. Sensitivity analysis revealed that IFI predictions are more sensitive to COF (ΔIFI: 14.3–17.7%) than MPD (ΔIFI: 1.5–6.0%) across all models. These results demonstrate how these models can improve HFST design and performance assessment while providing useful information for enhancing road safety. This process is a useful tool for evaluating HFST friction resistance in a lab setting since it calculates HFST skid resistance using results measured in the lab.

1. Introduction

Although a number of elements frequently contribute to traffic accidents, the interaction between tires and asphalt surfaces is a critical safety criterion. Surface texture, which influences surface drainage and skid resistance, is intimately related to this interaction. Maintaining adequate friction between a vehicle’s tires and the road depends on skid resistance, which is the force created when a tire stops spinning and slides down the pavement surface. A key component of road safety is skid resistance, particularly in regions where cars require more friction, including intersections, horizontal curves, and other crucial spots, or when the road surface is wet. According to studies, surface treatments can be a useful way to improve skid resistance in areas that need more friction. A spot pavement surfacing treatment called High Friction Surface Treatment (HFST) is used in places where there is a high need for friction, including curves and other crash-prone regions. It has been shown that this technique greatly improves skid resistance and lowers collision rates [1,2,3].
The everyday counts program of the Federal Highway Administration (FHWA) states that HFST entails applying premium aggregates to high-crash zones that are currently or may become such in the future. The goal of this application is to quickly and dramatically lower certain collision types, as well as the associated injuries and fatalities. In order to help drivers maintain more control in both dry and wet driving situations, HFST helps restore or sustain pavement friction [4].
Several techniques for determining skid resistance have been tested and proven in earlier research. Skid resistance measurement techniques can be classified as direct or indirect depending on the testing objectives. The assessment of pavement textures, including macro and micro textures, is the main objective of indirect measurement techniques. Direct measurement techniques, on the other hand, assess skid resistance by measuring frictional characteristics like the tested vehicles’ deceleration, braking distance, and coefficient of friction between the tires and pavement. Aside from that, skid resistance is measured using both lab and field tests. Different sliding pavement friction measurement techniques are used in lab settings. Because of its affordability, portability, and simplicity of use, the British Pendulum Tester (BPT) is utilized extensively. Nevertheless, there are some significant shortcomings with the BPT: (1) Data fluctuation is frequent, especially when testing coarse pavements; (2) the testing mechanism is very different from actual tire-pavement contact conditions, so the results are not sufficient to describe the true frictional behaviors of pavements [5,6,7,8,9,10].
Data collection on the frictional behaviors of tires and pavement is made simpler by the Dynamic Friction Tester (DFT), which can assess the frictional characteristics of pavement at various speeds, including high speeds, unlike the low-speed sliding contact measured by the BPT. The DFT may be used to perform pavement friction studies in a lab setting or in the field. Additionally, the DFT is commonly used in combination with other laser-based testing methods or pavement texture measurement instruments such as the Circular Track Meter (CTM) to evaluate pavement skid resistance. Nonetheless, the DFT’s accuracy in estimating the in situ frictional coefficient may be lowered due to notable discrepancies between the DFT and real tire–pavement frictional behaviors. The tire’s impact on the pavement is largely disregarded because it is reduced to a rubber pad. For example, while slip ratio greatly affects tire–pavement friction during tire braking, the DFT is unable to fully assess its impact on pavement. Furthermore, in real-world scenarios, the pavement’s changing response under various slip ratios is not captured [11,12,13,14,15]. Compared to sliding measurements like those performed with the BPT and the DFT, field testing is a more precise technique to capture the real frictional properties of pavements. Field testing has the advantage of being able to capture ongoing, in situ data, which can result in a more comprehensive assessment of pavement friction. A thorough set of experiments was carried out by the Permanent International Association of Road Congresses (PIARC) with the goal of contrasting different techniques for measuring texture and friction. The International Friction Index (IFI) is a standardized and harmonized index that was developed by researchers based on a set of empirical relationships they established from the data gathered during the 1992 trials [16]. This model, which is now widely known as the PIARC model, combined side-force, fixed-slip, and locked-wheel friction techniques with macrotexture measurements. By adding these elements, the model was able to take into consideration the well-established effects of surface texture and speed on pavement friction. Several investigations have examined the fundamental ideas behind the IFI, paying special attention to how the speed constant (Sp) functions in IFI computations. Although the Sp parameter is typically associated with the macrotexture properties of pavement surfaces in the literature currently in publication, some research indicates that when the relationship is examined in a device-specific context, stronger correlations between Sp and Mean Profile Depth (MPD) appear. A common limitation of the standard ASTM-based IFI methodology is the slip speed dependency that is frequently seen in device calibration. In some cases, it has been demonstrated that altering the Sp parameter can significantly reduce this dependency [17,18]. Moreover, the IFI model assumptions do not hold for treatments like HFST, which often maintain constant friction across slip speeds. This limits the usefulness of the speed parameter (Sp), particularly on surfaces with high macrotexture. The IFI model, as defined in ASTM E1960-07, is also validated within a narrow range of MPD and DFT values, making it less reliable for HFST applications [19,20,21,22]. There is a need to optimize or reformulate IFI using updated models that can better capture nonlinear relationships between texture and friction and also for the higher range of MPD. Numerous studies have investigated various aspects of HFST, including materials and their properties, friction performance of different aggregates, safety evaluations, benefit–cost (BC) ratios, and issues associated with HFST implementation [23,24]. Despite these efforts, some critical problems remain, particularly the need to understand the skid resistance of this surface treatment. The main objectives of this study are to:
1. Develop and evaluate alternative models for predicting IFI from laboratory measurements of COF and MPD on HFST surfaces to address the limitation of the standard IFI methodology.
2. Identify the most accurate model through performance metrics.
3. Assess the sensitivity of IFI predictions to COF and MPD.
These objectives provide a useful laboratory assessment of HFST friction resistance that is made possible by the results, which are essential for well-informed material selection and design optimization.

2. Materials and Methods
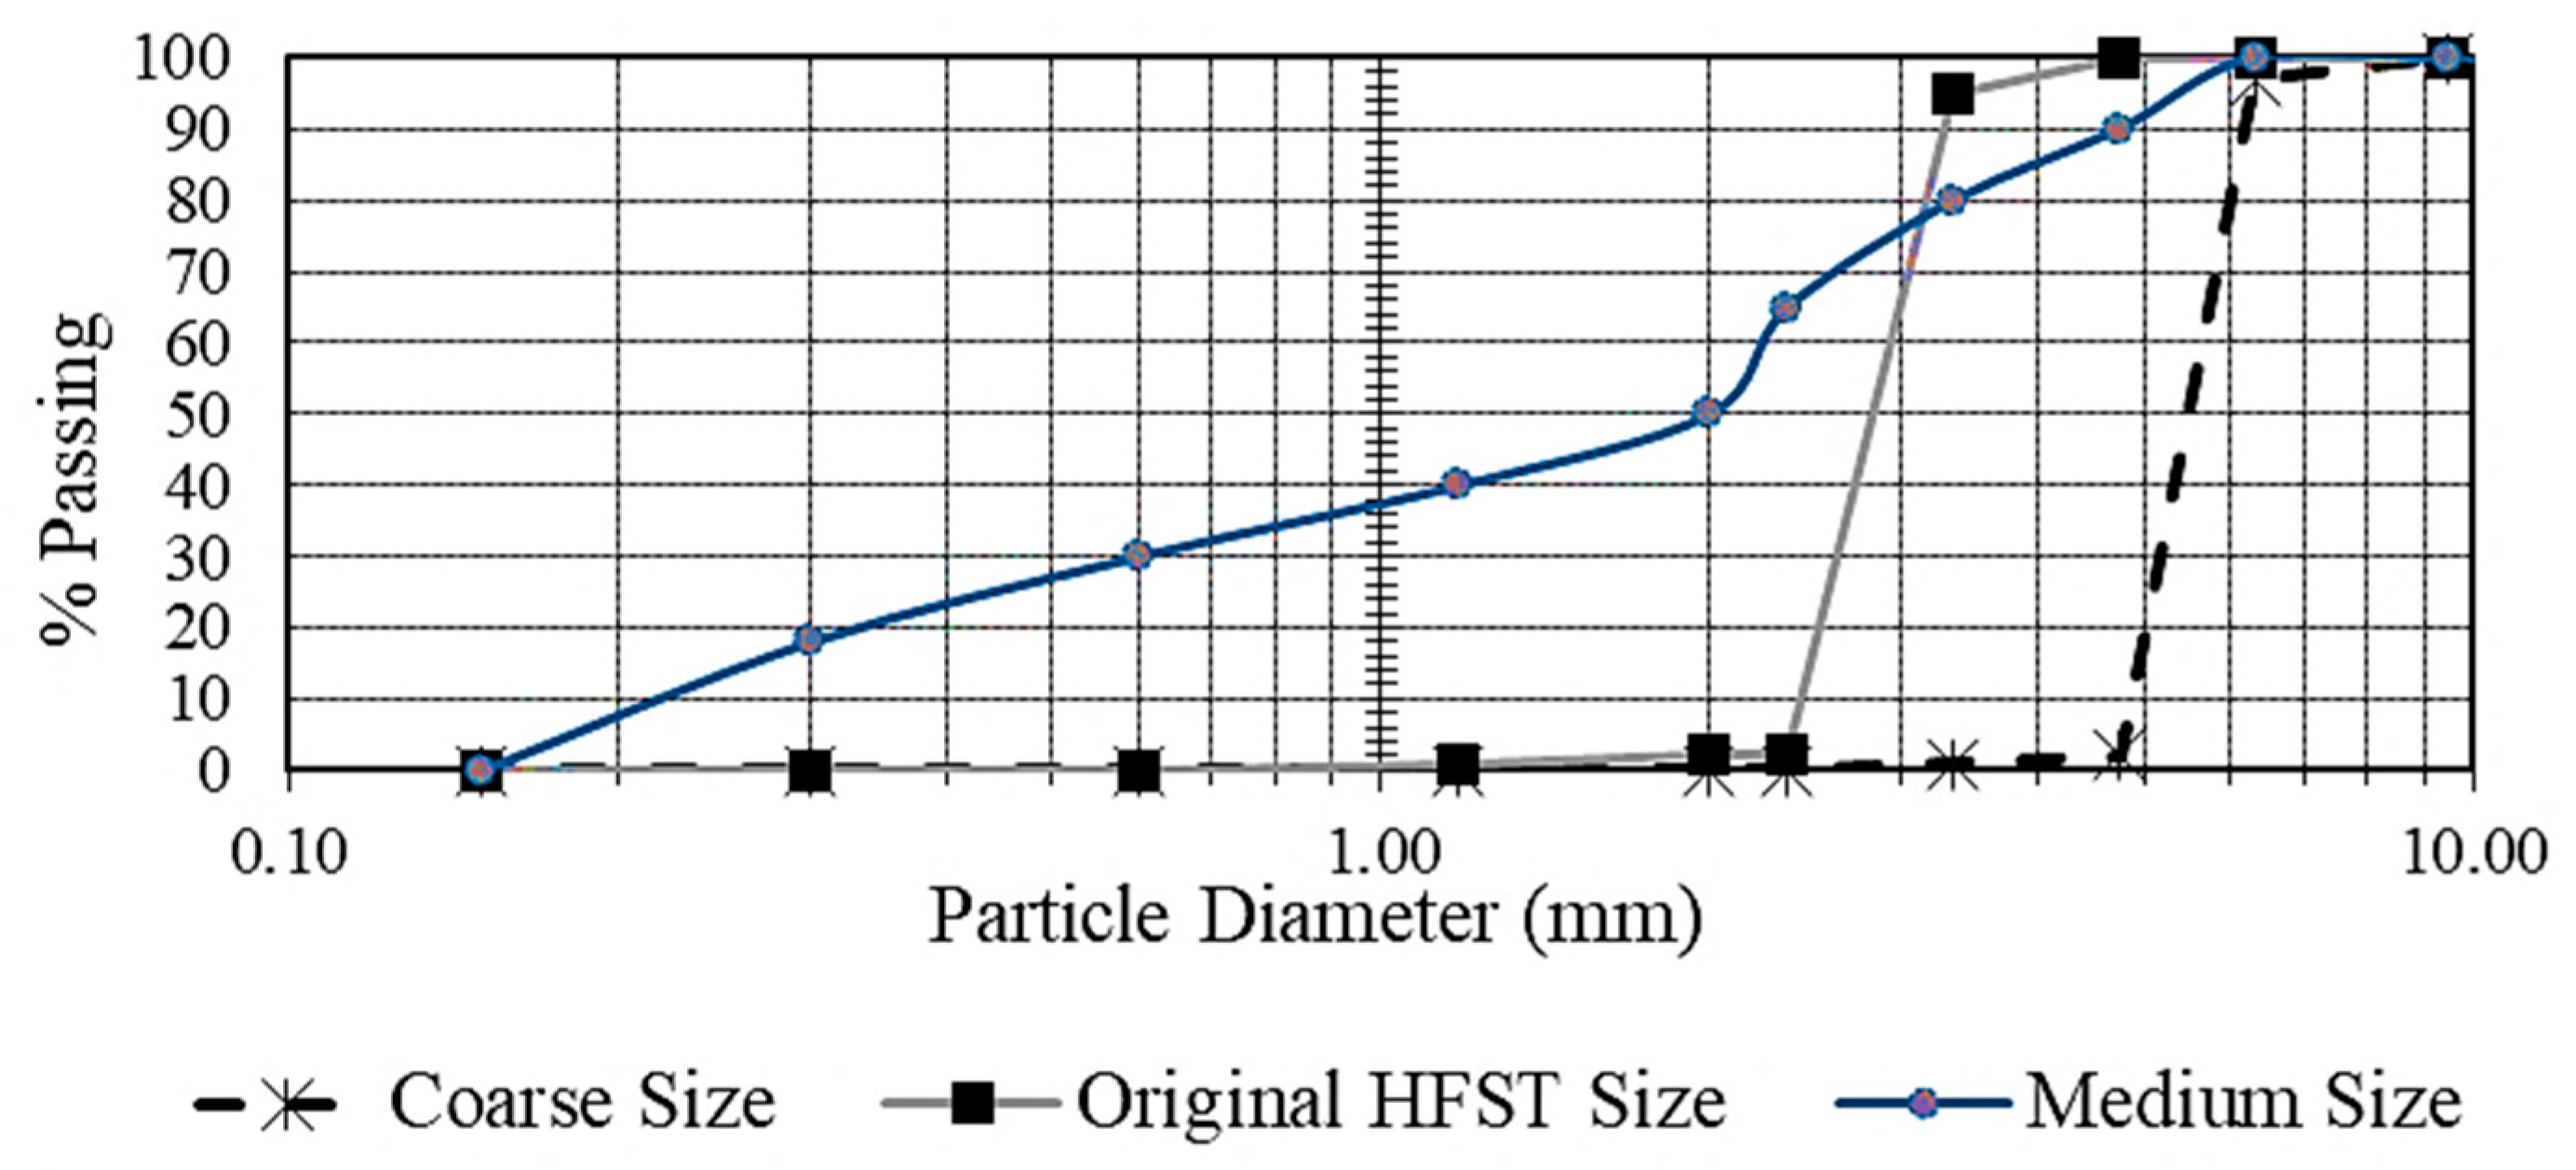
2.1. Aggregate

This study focused on two types of aggregates for HFST, each with three different sizes. The aggregates were composed of Calcined Bauxite (CB) and Rhyolite (Rhy). Notably, all aggregate gradations were confirmed, with one representing the standard gradation commonly used in HFST applications in the United States, known as “HFST original size”. The other gradation, coarser than the standard, was labeled “coarse size”, and the gradation between the original HFST and coarse size was referred to as “medium size”. As mentioned in the introduction, variations in macro-texture, which are influenced by different aggregate gradations, have a direct impact on total skid resistance. While Figure 1 and Figure 2 display specific aggregate types and their gradation profiles, Table 1 lists the essential attributes of the aggregates employed. Because of its remarkable hardness, potent abrasive properties, and long-lasting frictional performance, refractory-grade calcined bauxite (CB) satisfies AASHTO MP 41 requirements. According to the Missouri Geological Survey [25,26], Rhy is a very fine-grained, solid rock that is renowned for its durability in pavement applications and resilience to weathering.

2.2. Binder

The two-component Epoxy Resin binder employed in this study is suitable for manual and mechanical applications. The supplier proposes a mixed temperature of 15 to 35 °C, with the two components blended in a volumetric ratio of 1:1. The epoxy resin binder takes between 2.5 and 6 h to cure, depending on the outside temperature. Table 2 shows the test results for the selected Epoxy Resin binder’s physical properties, as provided by the manufacturer. The table also includes the AASHTO MP 41-22 (2022) specifications for epoxy resin binders utilized for use with HFST in addition to these results.

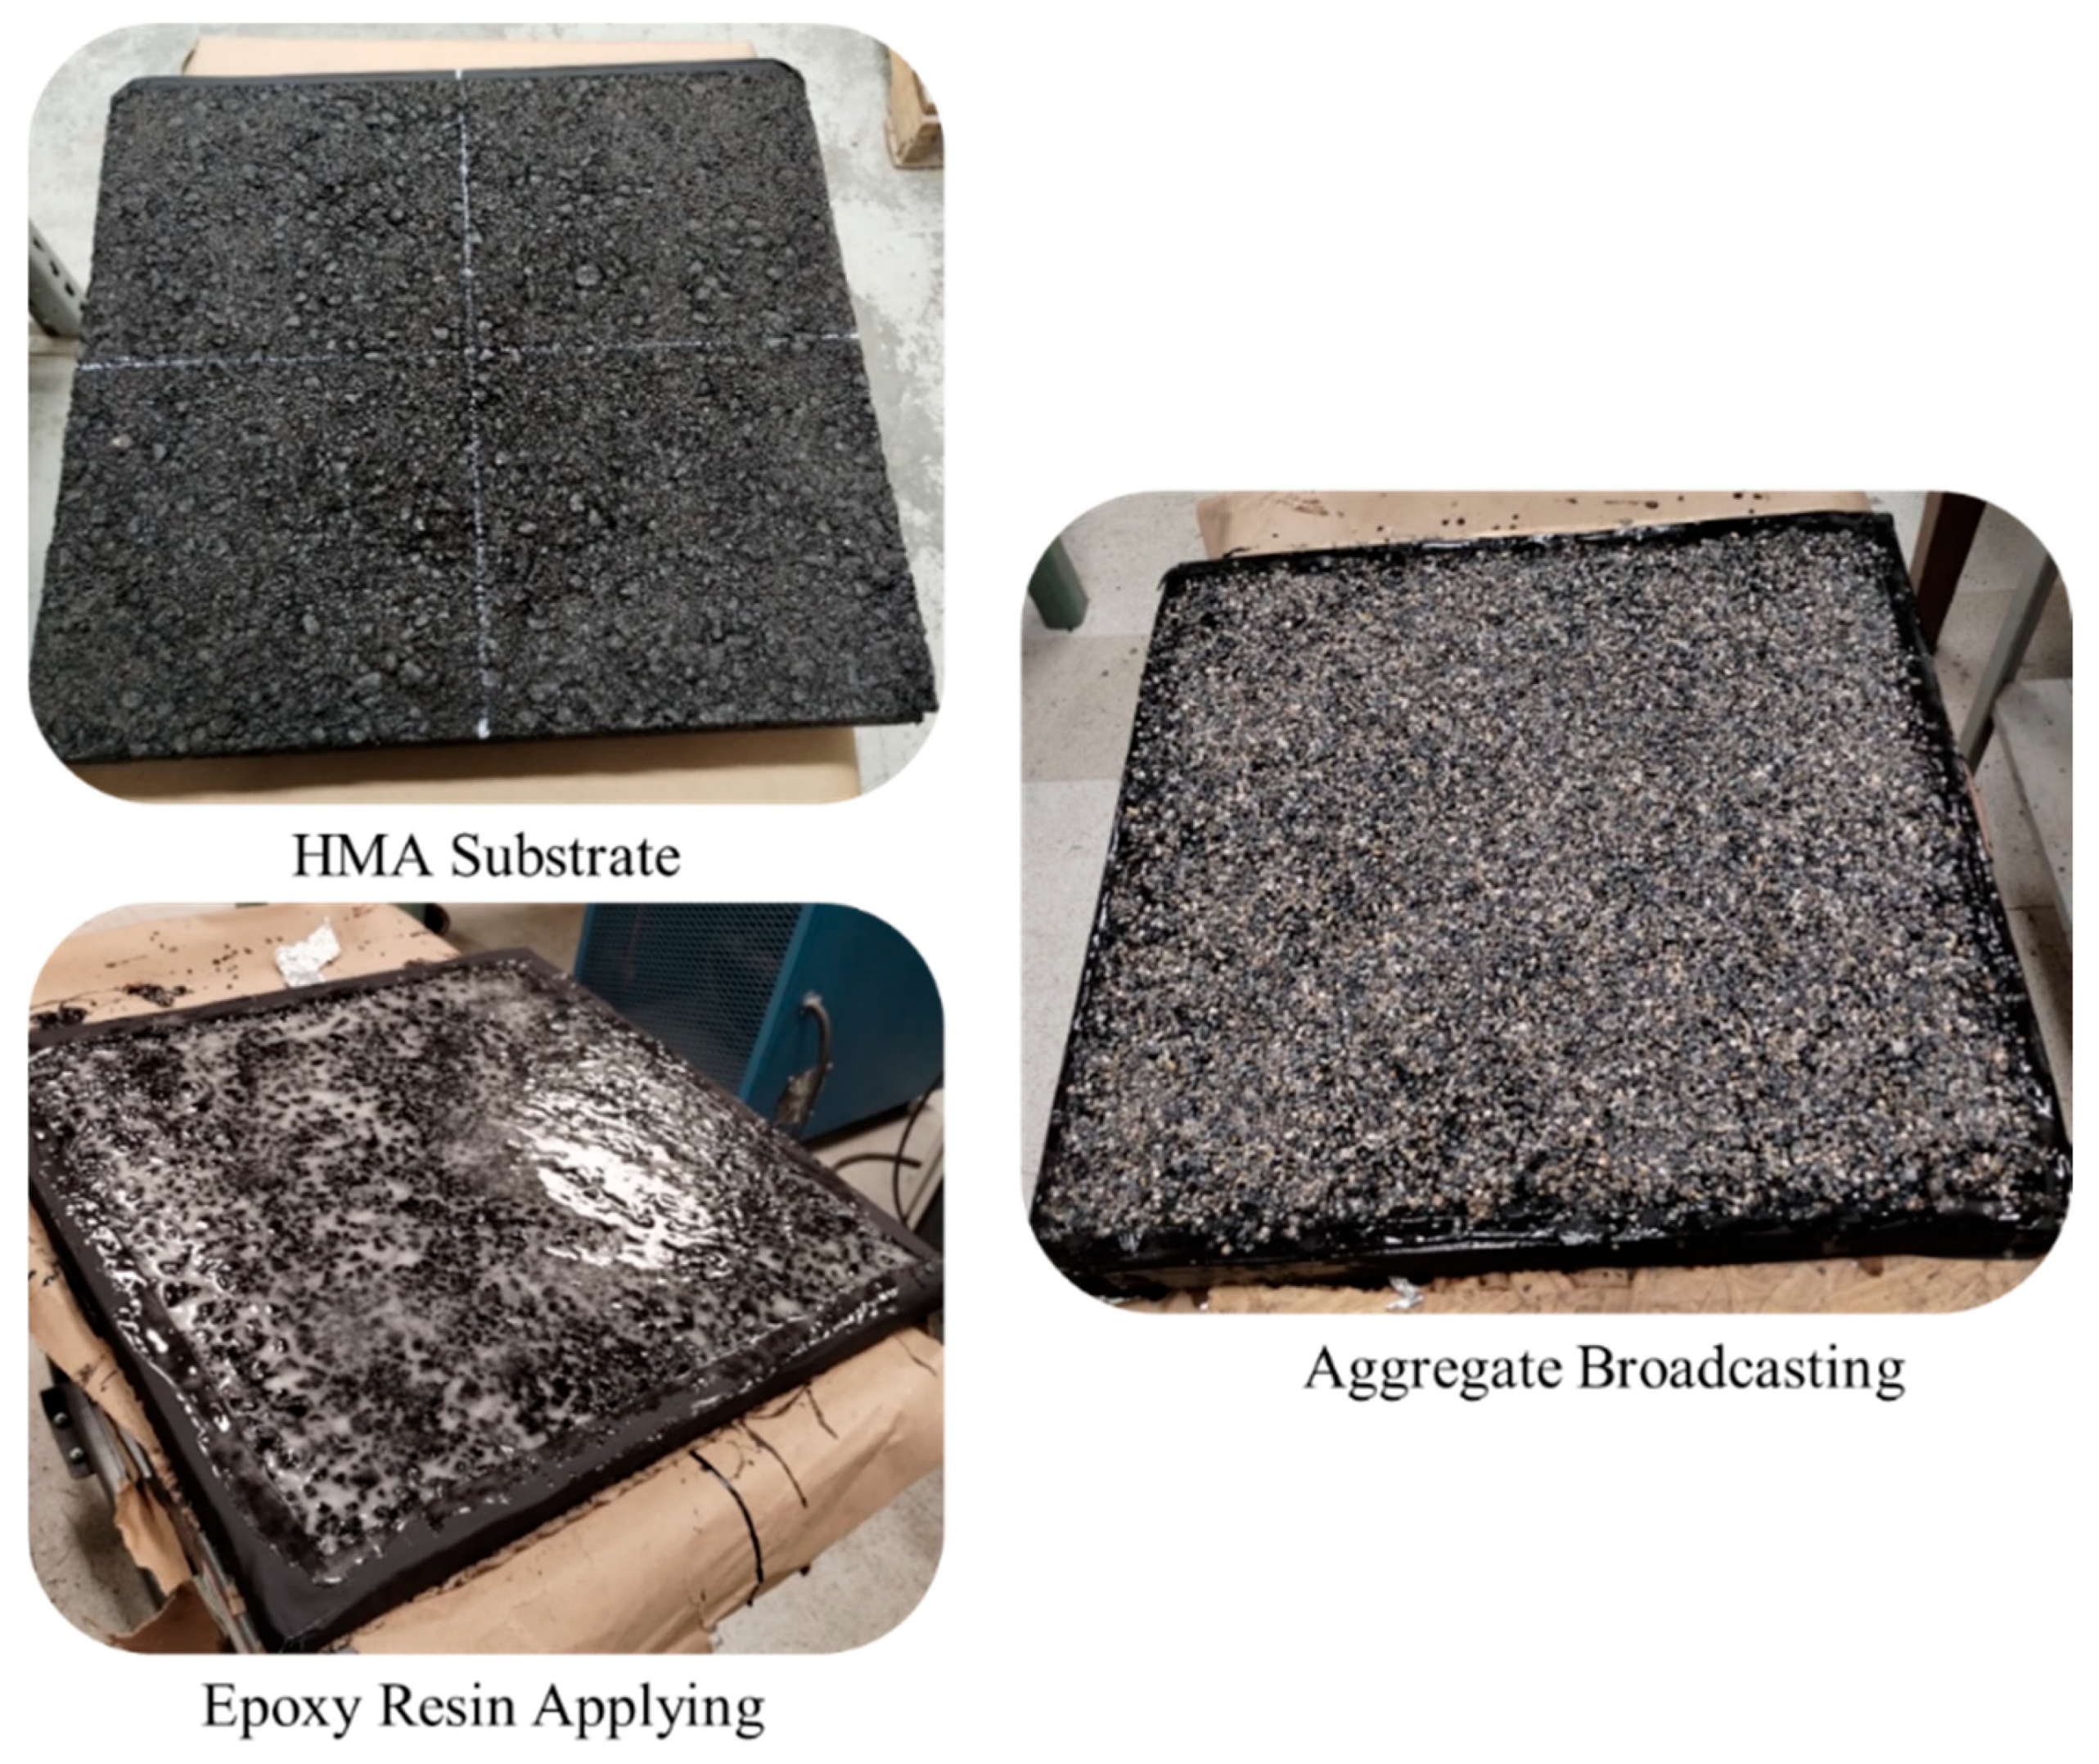
2.3. Preparing High Friction Surface Treatment Slabs

To ensure uniformity and consistency in slab preparation, the hot mix asphalt (HMA) substrate was produced using a loose asphalt mixture. Approximately 22.7–24.9 kg (50–55 pounds) of loose asphalt material was preheated to 160 °C. After lining the base of the steel compaction mold with thermal-resistant paper, the heated mixture was evenly placed into the mold. A metal cover plate was positioned over the top, and a second sheet of thermal paper was applied to prevent adhesion. The assembly was then compacted using a plate compactor for approximately 10 min to achieve the desired slab density. To minimize the risk of distortion or damage, the compacted slab was allowed to cool within the mold under ambient conditions overnight. The following day, the mold was disassembled, and the prepared HMA slab was extracted for use in the HFST sample fabrication [23].
For surface preparation, the HMA slabs were first cleaned with pressurized air to remove dust and contaminants. The epoxy resin binder was mixed according to the manufacturer’s recommended ratio of resin to curing agent, using either manual stirring or a Jiffy mixer, depending on the sample size. The mixing duration was typically 3–5 min to ensure proper homogeneity. The blended binder was then applied to the slab surface using a notched neoprene squeegee to achieve uniform coverage. While a typical wet film thickness of (40–45 mils) was targeted, binder application was adjusted to meet the required final thickness of (50–65 mils), corresponding to a coverage rate of approximately 0.61–0.78 m2 per liter (25–32 ft2/gal) [27]. After the HFST had cured, the surface of each slab was rubbed with a wooden board to dislodge loosely bound particles. Figure 3 shows the procedure for HFST slab preparation.

2.4. Performance Tests for Frictional Properties

To evaluate the frictional characteristics of HFST samples, a number of experiments were conducted. In order to ascertain how the surface texture and friction characteristics of HFST slabs changed during fast polishing, these performance tests were essential. These tests comprised the CTM and the DFT, which were utilized in conjunction with the Three-Wheel Polishing Device (TWPD) of the National Center for Asphalt Technology (NCAT) (Auburn, AL, USA). While the TWPD simulated vehicle traffic polishing to evaluate how the surface texture evolved over time, the DFT evaluated the HFST surface’s frictional qualities, giving information regarding the friction coefficient at various speeds. The CTM assessed the macrotexture of the HFST surface, providing information on how the surface MPD changed under accelerated polishing conditions. All experiments were carried out in controlled laboratory conditions to guarantee statistical validity and reliable measurements. Randomized replicate DFT and CTM measurements were executed on the surface of each slab. This methodology reduced localized texture or wear impacts and offered enough replication for evaluating friction and texture. Figure 4 illustrates the performance testing equipment employed in this research [28,29,30].

2.4.1. Accelerated Three-Wheel Polishing Device

The NCAT developed the Three-Wheel Polishing Device, depicted in Figure 4, to replicate the effects of traffic-polishing on the surface friction properties of asphalt mixtures. This machine’s purpose was to polish a circular-shaped patch on the surface of a lab-made testing slab that measured 50 by 50 cm (20 in.) with a mean diameter of 280 mm (11.2 in). The tires should be 2.80/2.50–4 in size, with a tread depth of at least 2 mm (0.1 in.) and a pressure of 240 ± 34 kPa (35 ± 5 psi). To replicate wet polishing conditions in the field and washing the debris, water was sprayed continuously while slab polishing was being completed [31].

2.4.2. Dynamic Friction Test (DFT)

The DFT was a rotating disk with three rubber pads that could rotate at a speed of up to 100 km/h. When the disk reached the desired speed, it was lowered onto the pavement surface, and the coefficient of friction (COF) was determined as the rotating disk’s speed gradually decreased. The friction measurements were conducted in wet circumstances, and the results were calculated using the average of the two repetitions. Using the TWPD, COF was measured at 0 cycles (beginning), 30,000 cycles, 70,000 cycles, and 140,000 cycles (final) during the polishing process. The analysis in this study employed COF at 20, 40, and 50 km/h [32].

2.4.3. Circular Track Meter (CTM)

The MPD was measured at a fixed location using the CTM in accordance with ASTM E2157 (2019) standards [33]. The MPD represented the average depth of the pavement surface texture. An 89.2 cm circle was profiled, dividing it into eight segments. The MPD was computed for each segment, and the average of these eight values was reported as the MPD for that particular location. After each predefined polishing interval, the slab was removed and dried. The surface texture was then measured with CTM.

2.5. Prediction of IFI for Skid-Resistance Analysis

As mentioned before, the pavement surface’s microtexture and macrotexture have a major impact on the friction or skid resistance it offers. A standardized friction number suggested by the International Friction Index (IFI) is used to measure the combined effect of different surface textures [16]. In order to compare texture and friction measures, the World Road Association (Permanent International Association of Road Congresses) conducted a number of tests. The IFI, the international standard for evaluating pavement surface friction, was created as a result of these efforts (ASTM E1960-07) [18]. The IFI consists of two key components: F (60) and Sp. The index is denoted and reported as IFI (F (60), Sp), and it is a mathematical model that describes the friction coefficient in terms of slip speed and macrotexture. To compute the IFI speed number (Sp) and friction number (F60), the following Equations (1)–(3) were used, as outlined in ASTM E 1960:
Sp = a + (b × TX)
Sp is the IFI speed number.
a and b are calibration constants that depend on the method used to measure macrotexture for this research, and using MPD measured according to ASTM E1960, a = 14.2 and b = 89.7.
TX is the macrotexture measurement in millimeters (mm), which in this study conducted by CTM.
FR (60) = FR(S) × exp[(S − 60)/Sp]
FR (60) is the adjusted friction value at a slip speed of 60 km/h, FR(S) is the friction value at the selected slip speed, and S is the selected slip speed in km/h.
These equations enable a comprehensive assessment of the pavement’s frictional properties, incorporating the effects of both microtexture and macrotexture.
F (60) = A + B × FR (60) + C × TX
F (60) is the IFI friction number, which is derived from the correlation.
A, B, and C are calibration constants dependent on the friction measuring device used.
TX is the macrotexture measurement in millimeters (mm).
According to PIARC findings, ASTM E1960-07 recommends utilizing the DFT reading at 20 km/h in conjunction with measurements from the CTM as the standard instruments for calibrating the IFI. Using these devices, Sp and the friction at 60 km/h, F (60), are determined based on Equations (4) and (5):
Sp = 14.2 + 89.7MPD
F (60) = 0.081 + 0.732 × DFT20 × exp[(−40)/Sp]
The foundation of the IFI concept is the notion that the friction of a pavement is dependent on the texture properties of the surface, such as microtexture and macrotexture, as well as the slip speed at which measurements are made. However, it might not be appropriate to apply Equation (2) to ribbed pavements or certain surface treatments. Regardless of the measured slip speed, these surfaces often retain constant friction levels, with friction values essentially staying constant throughout a range of slip speeds. In these situations, the parameter (Sp) loses significance since the slip speed (S) in Equation (2) does not take into consideration changes in friction measurements [34,35]. According to ASTM E1960-07, the IFI concept is validated for pavements with profile depths of 0.25 ≤ MPD ≤ 1.5 and friction values of 0.30 ≤ DFT20 ≤ 0.90. This illustrates how sensitive the Sp parameter is to high levels of macrotexture, exposing a major drawback in the application of the IFI principle for surface treatments. The IFI should be optimized utilizing Sp values or modified in accordance with the MPD of various surfaces in order to increase its accuracy and usefulness across a range of pavement textures.

2.5.1. Model Development and Evaluation

To address the limitations inherent in the standard IFI model, three physics-informed empirical modifications were developed to estimate IFI using DFT at 20 km/h, which in this study considered the COF and MPD as primary inputs. These models retain the fundamental structure of the ASTM E1960 framework, while a controlled Gaussian noise was systematically added to simulate realistic measurement variability observed in lab conditions for introducing mechanistically justified nonlinearities to better capture the texture–friction relationships observed in high-friction surface treatments [17,35].

2.5.2. Logarithmic Model

The logarithmic model reformulates the speed number (Sp) to account for diminishing returns in texture effectiveness at greater macrotexture depths. Its functional form (Equation (6)) introduces a logarithmic transformation of the MPD term that asymptotically limits texture depths.
F   ( 60 ) = a + b   ×   COF   ×   e x p 40 c + d × ln 1 + M P D

2.5.3. Power Model

The power law model incorporates a more flexible representation of texture effects through the expression (Equation (7)); the exponent e can capture the sublinear relationship between texture depth and speed constant.
F   ( 60 ) = a + b   ×   COF   ×   e x p 40 c + d × M P D e

2.5.4. Polynomial Model

This model was developed to consider the more complex interactions between the MPD and COF. This formulation (Equation (8)) includes quadratic terms to capture threshold behaviors for this kind of treatment, along with a cross-term that quantifies binder–aggregate interactions.
F (60) = a + b × COF + c × MPD + d × COF2 + e × MPD2 + f × COF × MPD

2.5.5. Parameter Estimation

The Levenberg–Marquardt (LM) optimization procedure is used to estimate the parameters for each model. This technique combines the advantages of least-squares and gradient descent methods, making it particularly useful for fitting nonlinear models to data [36]. During optimization, certain restrictions, imposed on each model, include parameter bounds based on model principles, including positive coefficients for friction-texture relationships, exponential decay parameters within realistic ranges (1–100), and convergence criteria of 10,000 maximum iterations. Initial parameter values were set based on reasonable bounds, preventing physically unrealistic solutions.

2.5.6. Models’ Validation

Model validation followed a rigorous 80-20 train–test split to ensure representative sampling. The dataset was randomly partitioned using a fixed random state to ensure both reproducibility and unbiased sampling. For the evaluation of the accuracy and effectiveness of these models, four widely used performance metrics—RMSE and the R2 score—were employed. These metrics provided valuable insights into the models’ ability to capture underlying patterns in the data. The Root Mean Squared Error (RMSE) represents the square root of this average squared error, thereby providing a sense of prediction deviation relative to actual values. Additionally, the R2 score served as an important statistical indicator of the proportion of variance in the dependent variable explained by the model’s independent variables. All models were evaluated using a 1000-iteration permutation test that was used to evaluate whether model fits could have occurred by chance. All models returned to a p-value of 0.001, showing statistically significant predictive relationships [37,38].
For each model, 95% bootstrapped confidence intervals were calculated for all fitted parameters. While primary coefficients showed interpretable bounds (e.g., θ1 ≈ 0.01005 for the logarithmic model), some nonlinear parameters, especially in the power law and logarithmic models, exhibited wider confidence intervals. This is typical for nonlinear optimization involving interdependent variables. Furthermore, to evaluate assumptions of residual behavior, Shapiro–Wilk tests showed no significant deviation from normality (e.g., p = 0.6440 for the logarithmic model). Breusch–Pagan tests revealed no significant heteroscedasticity. Residual values also confirm homoscedastic and approximately symmetric residuals across predicted values [39,40].

3. Results and Discussion

The performance of HFST samples with various aggregates of varied sizes was assessed by carefully examining the experimental test data. The process for predicting the IFI of HFST was evaluated using several tests. Among these studies were accelerated friction tests using the DFT to determine the COF and the CTM to quantify MPD. Following polishing, the samples’ overall performance, including their friction coefficient and mean profile depth, was evaluated to ascertain how well they maintained skid resistance.

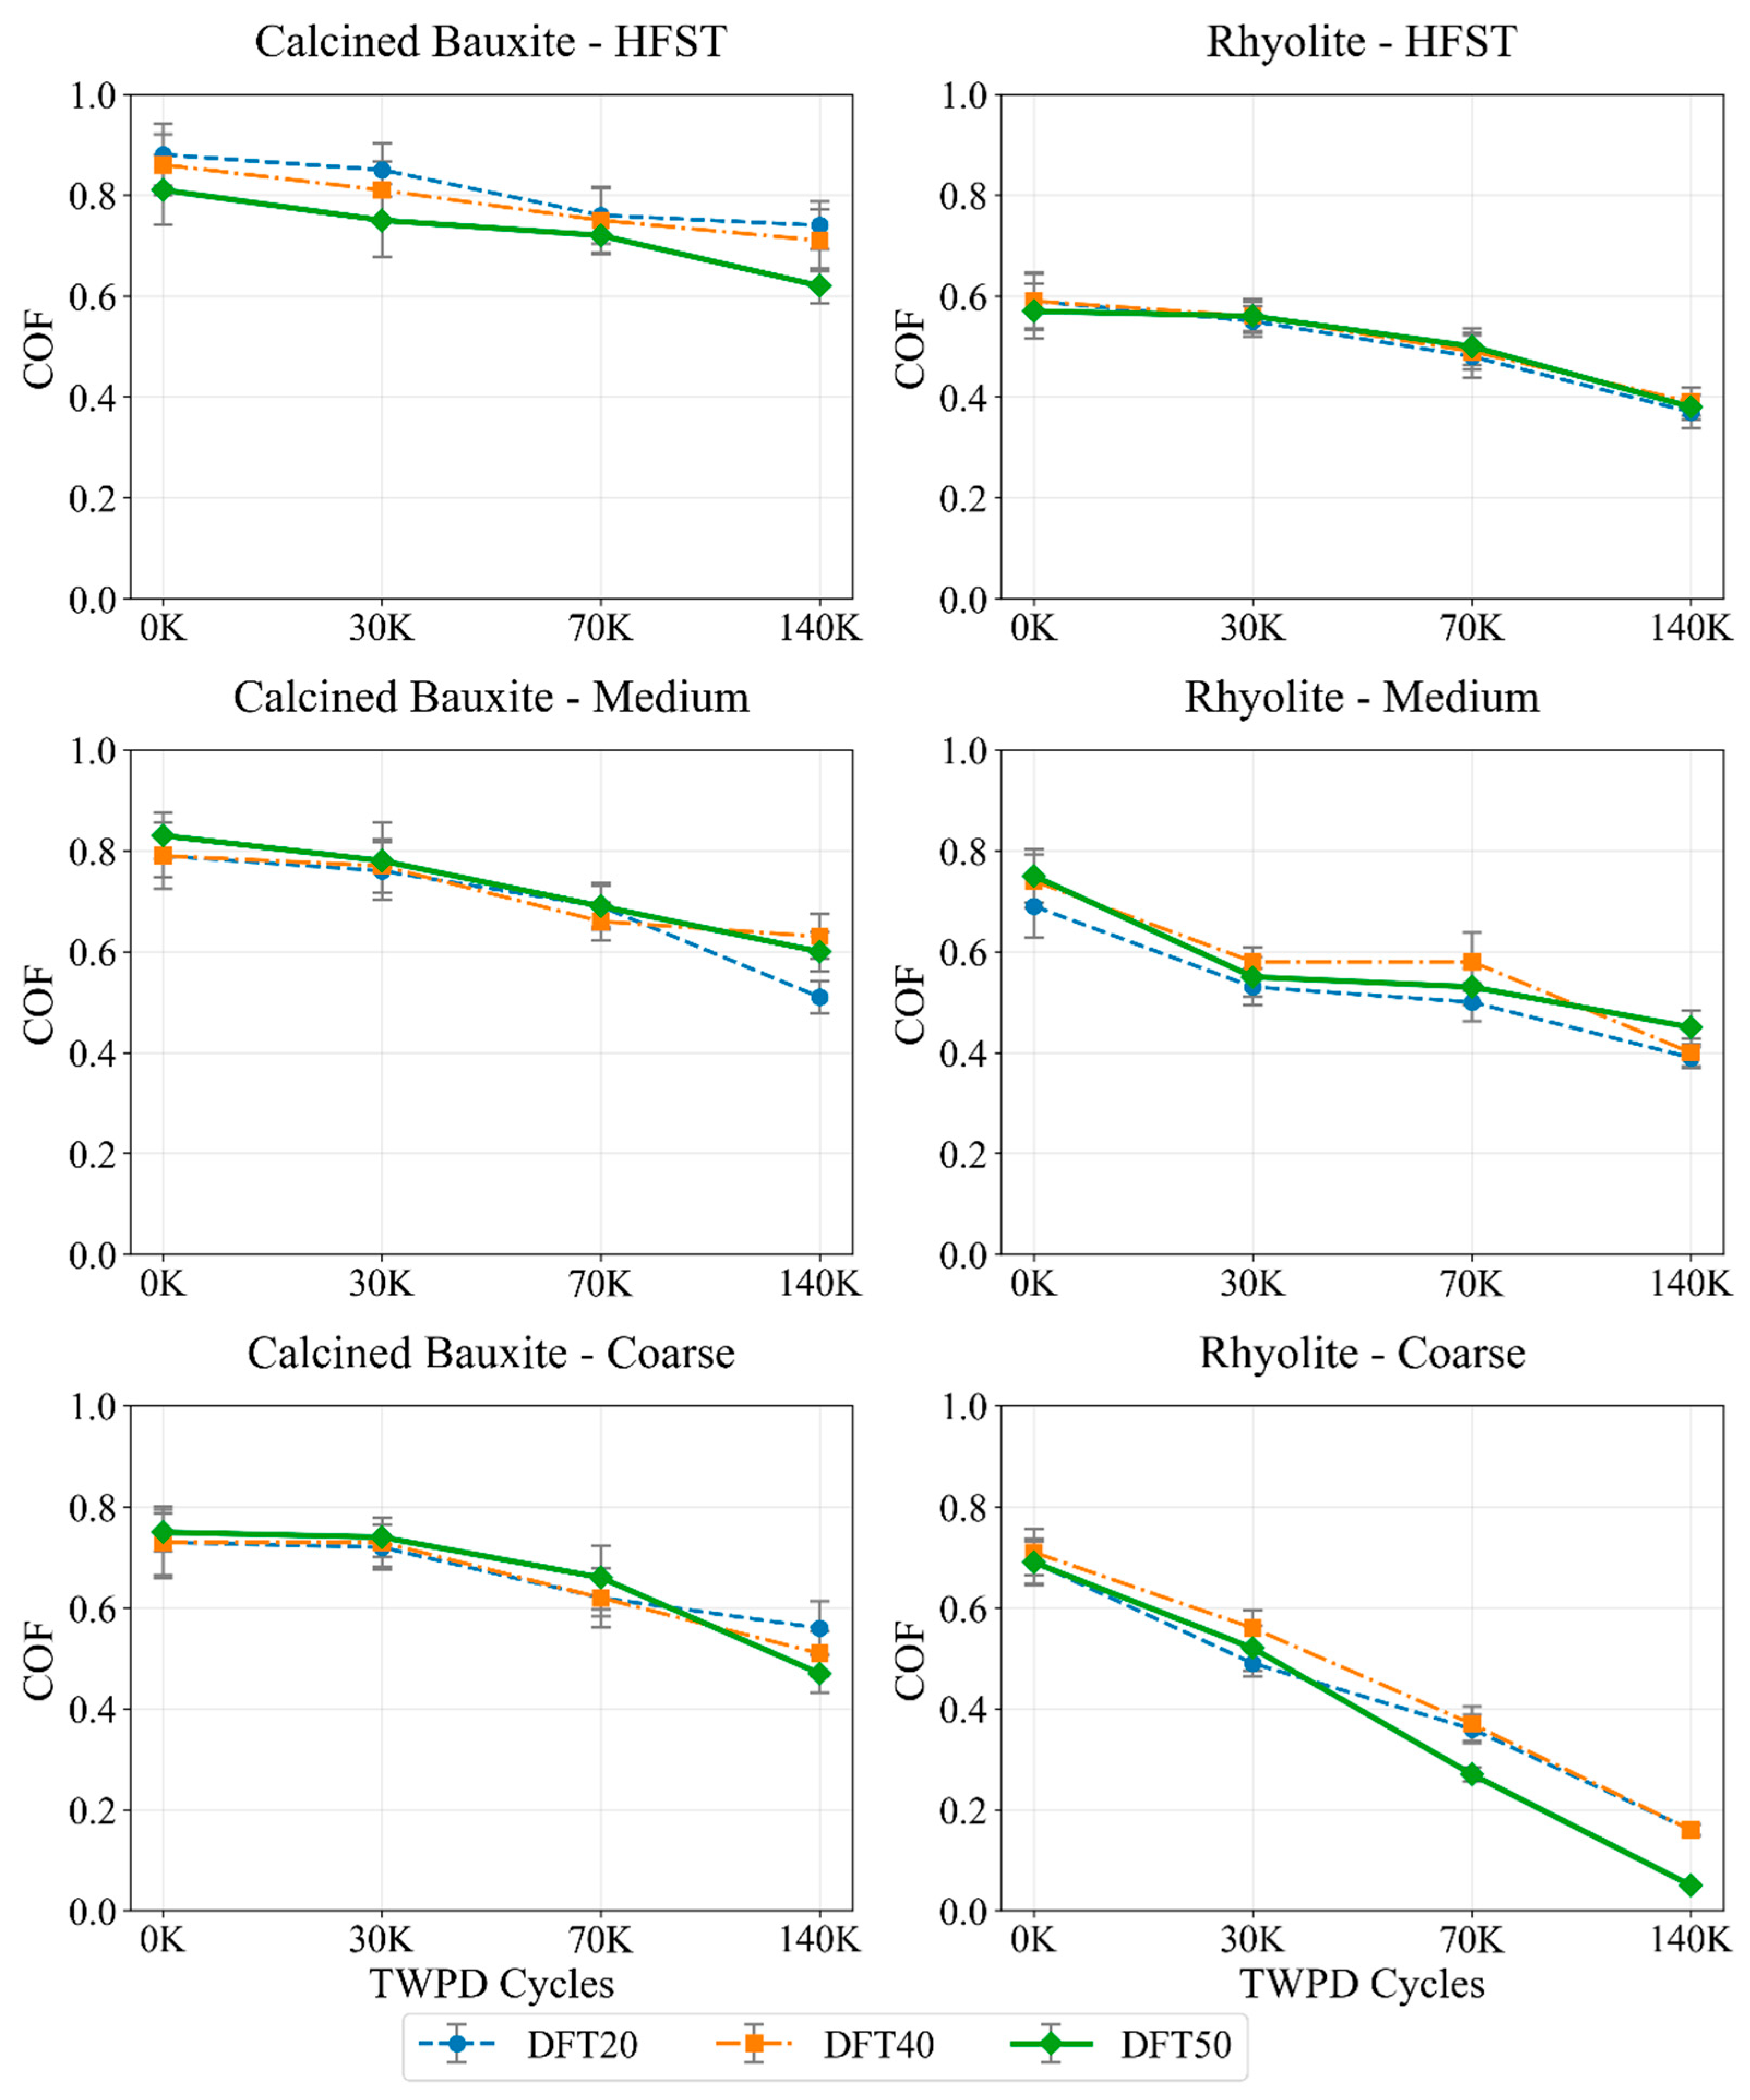
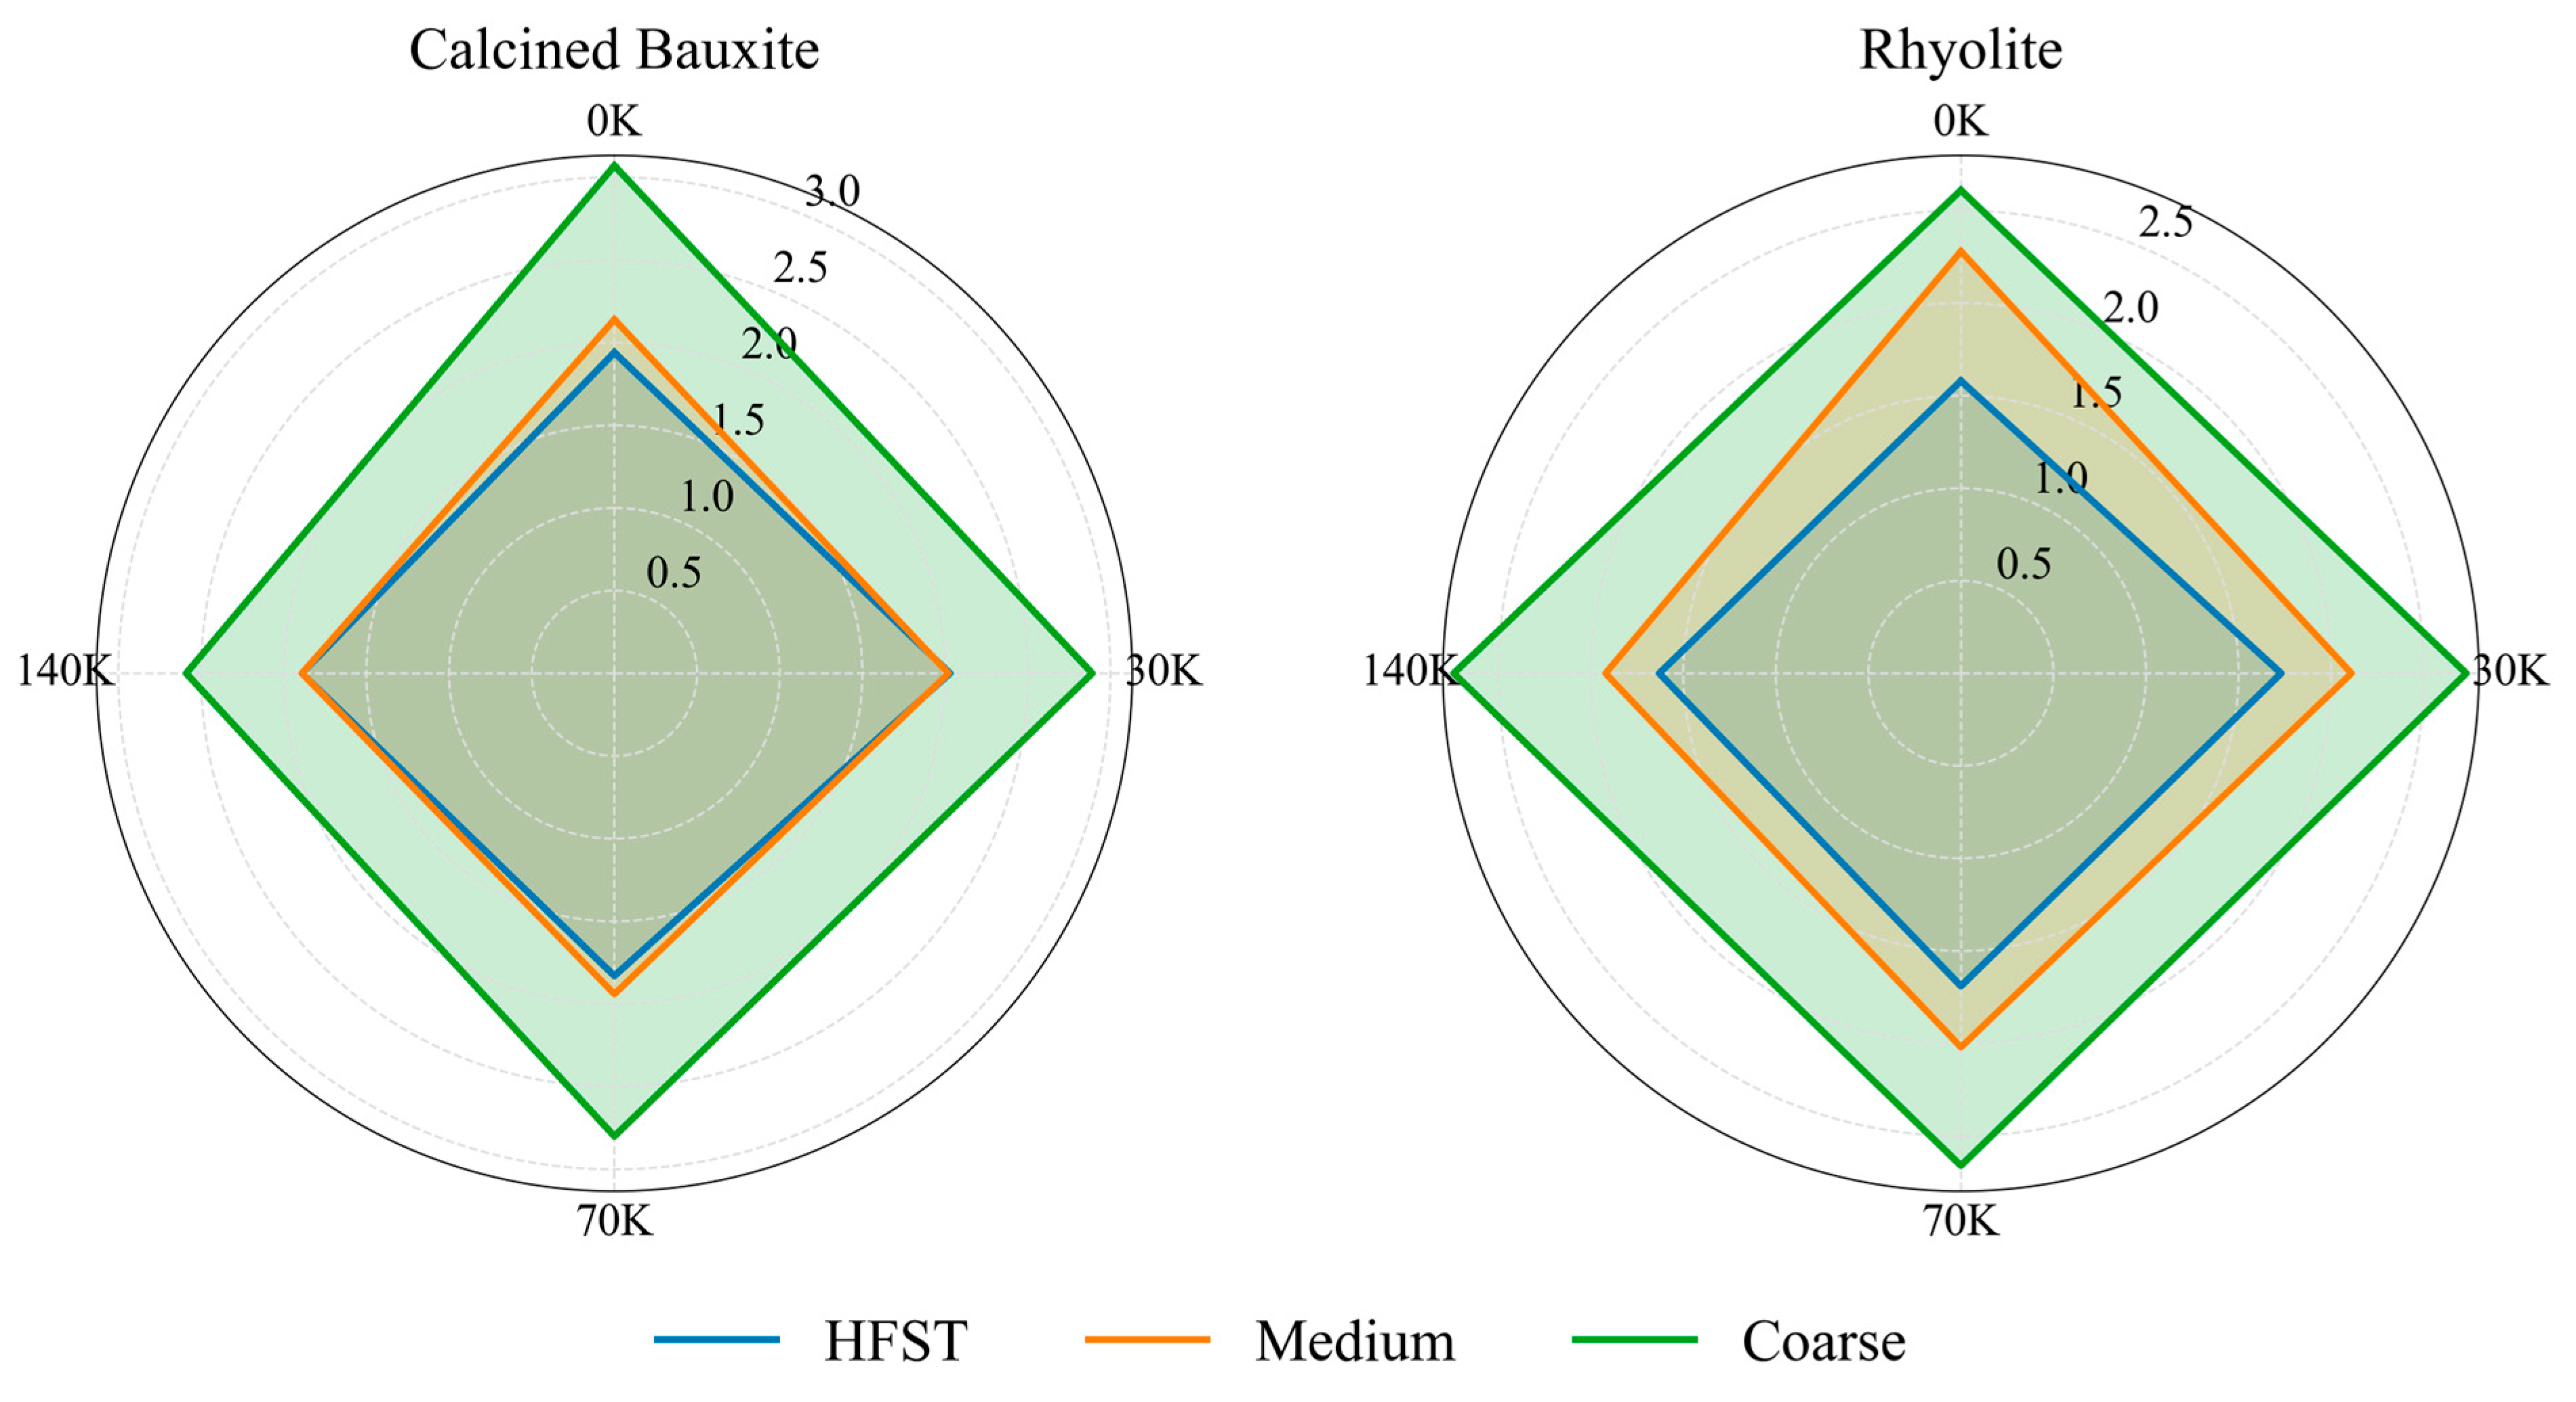
3.1. Relationship Between Sliding Speed and Polishing Cycles

Figure 5 depicts the variation in COF at different slipping speeds for various aggregates and sizes. This suggests that the DFT results and COF values are sensitive to a variety of factors. CB had consistently higher COF values for all three sizes, both before and after polishing. Rhy, on the other hand, had lower COF levels. While CB retained comparatively greater friction over time, Rhy, especially the coarse size, showed a considerable drop in COF when the polishing cycle was raised to 140,000 cycles. This implies that CB is superior at maintaining frictional properties, but Rhy may lose friction more quickly with prolonged polishing. The test findings show that CB’s strong polishing resistance and rough surface microtexture are directly responsible for this observation.
The change in MPD for different aggregates and sizes during different polishing cycles in the Three-Wheel Polishing Device is shown in Figure 6. Both aggregates, in different sizes, showed some texture reduction between the initial values and the measurements after 140 K polishing cycles. During the first 30 K cycles of polishing, some samples showed a slight increase and then a decrease, which can be attributed to aggregate particles that are loosely bound and particles with angular but weak structures being worn by the mechanical polishing force of the TWPD tires. Rhy coarse size showed a slight increase in MPD during polishing, which can be attributed to the changing surface texture and angularity of this aggregate during exposure to the polishing process. Between 70 K and 140 K cycles in the TWPD, the surface of most samples became more stable.

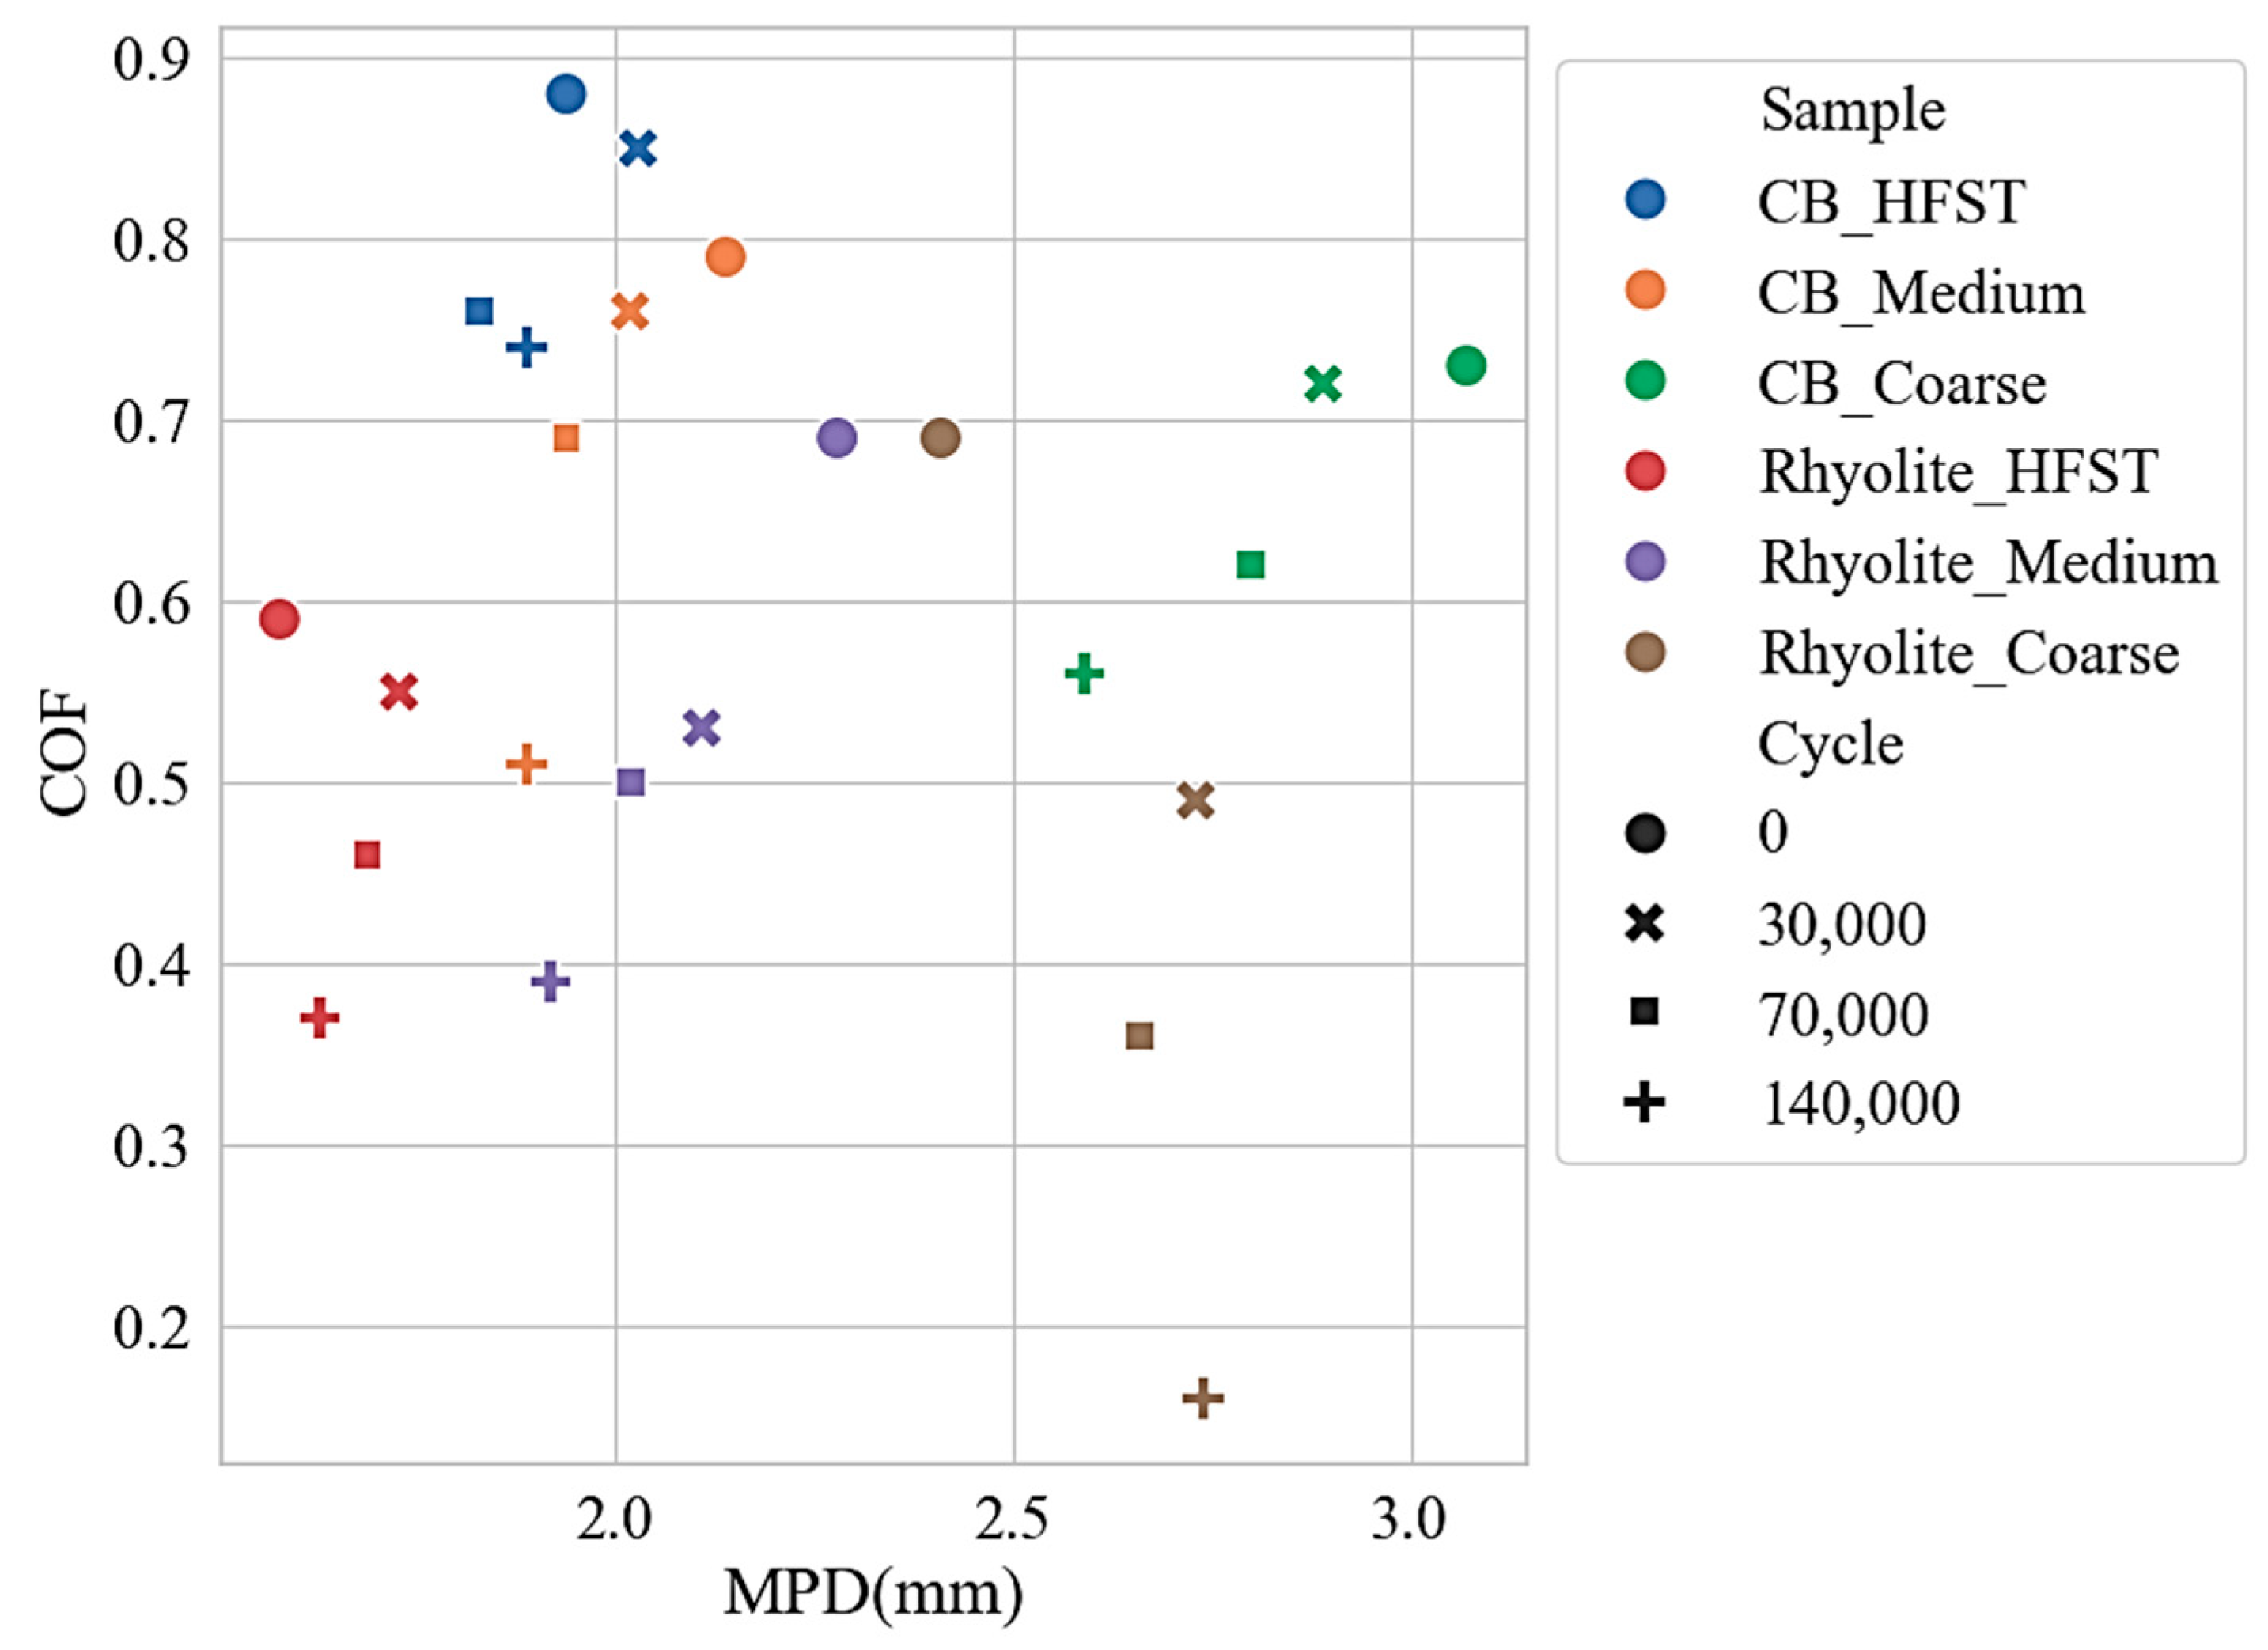
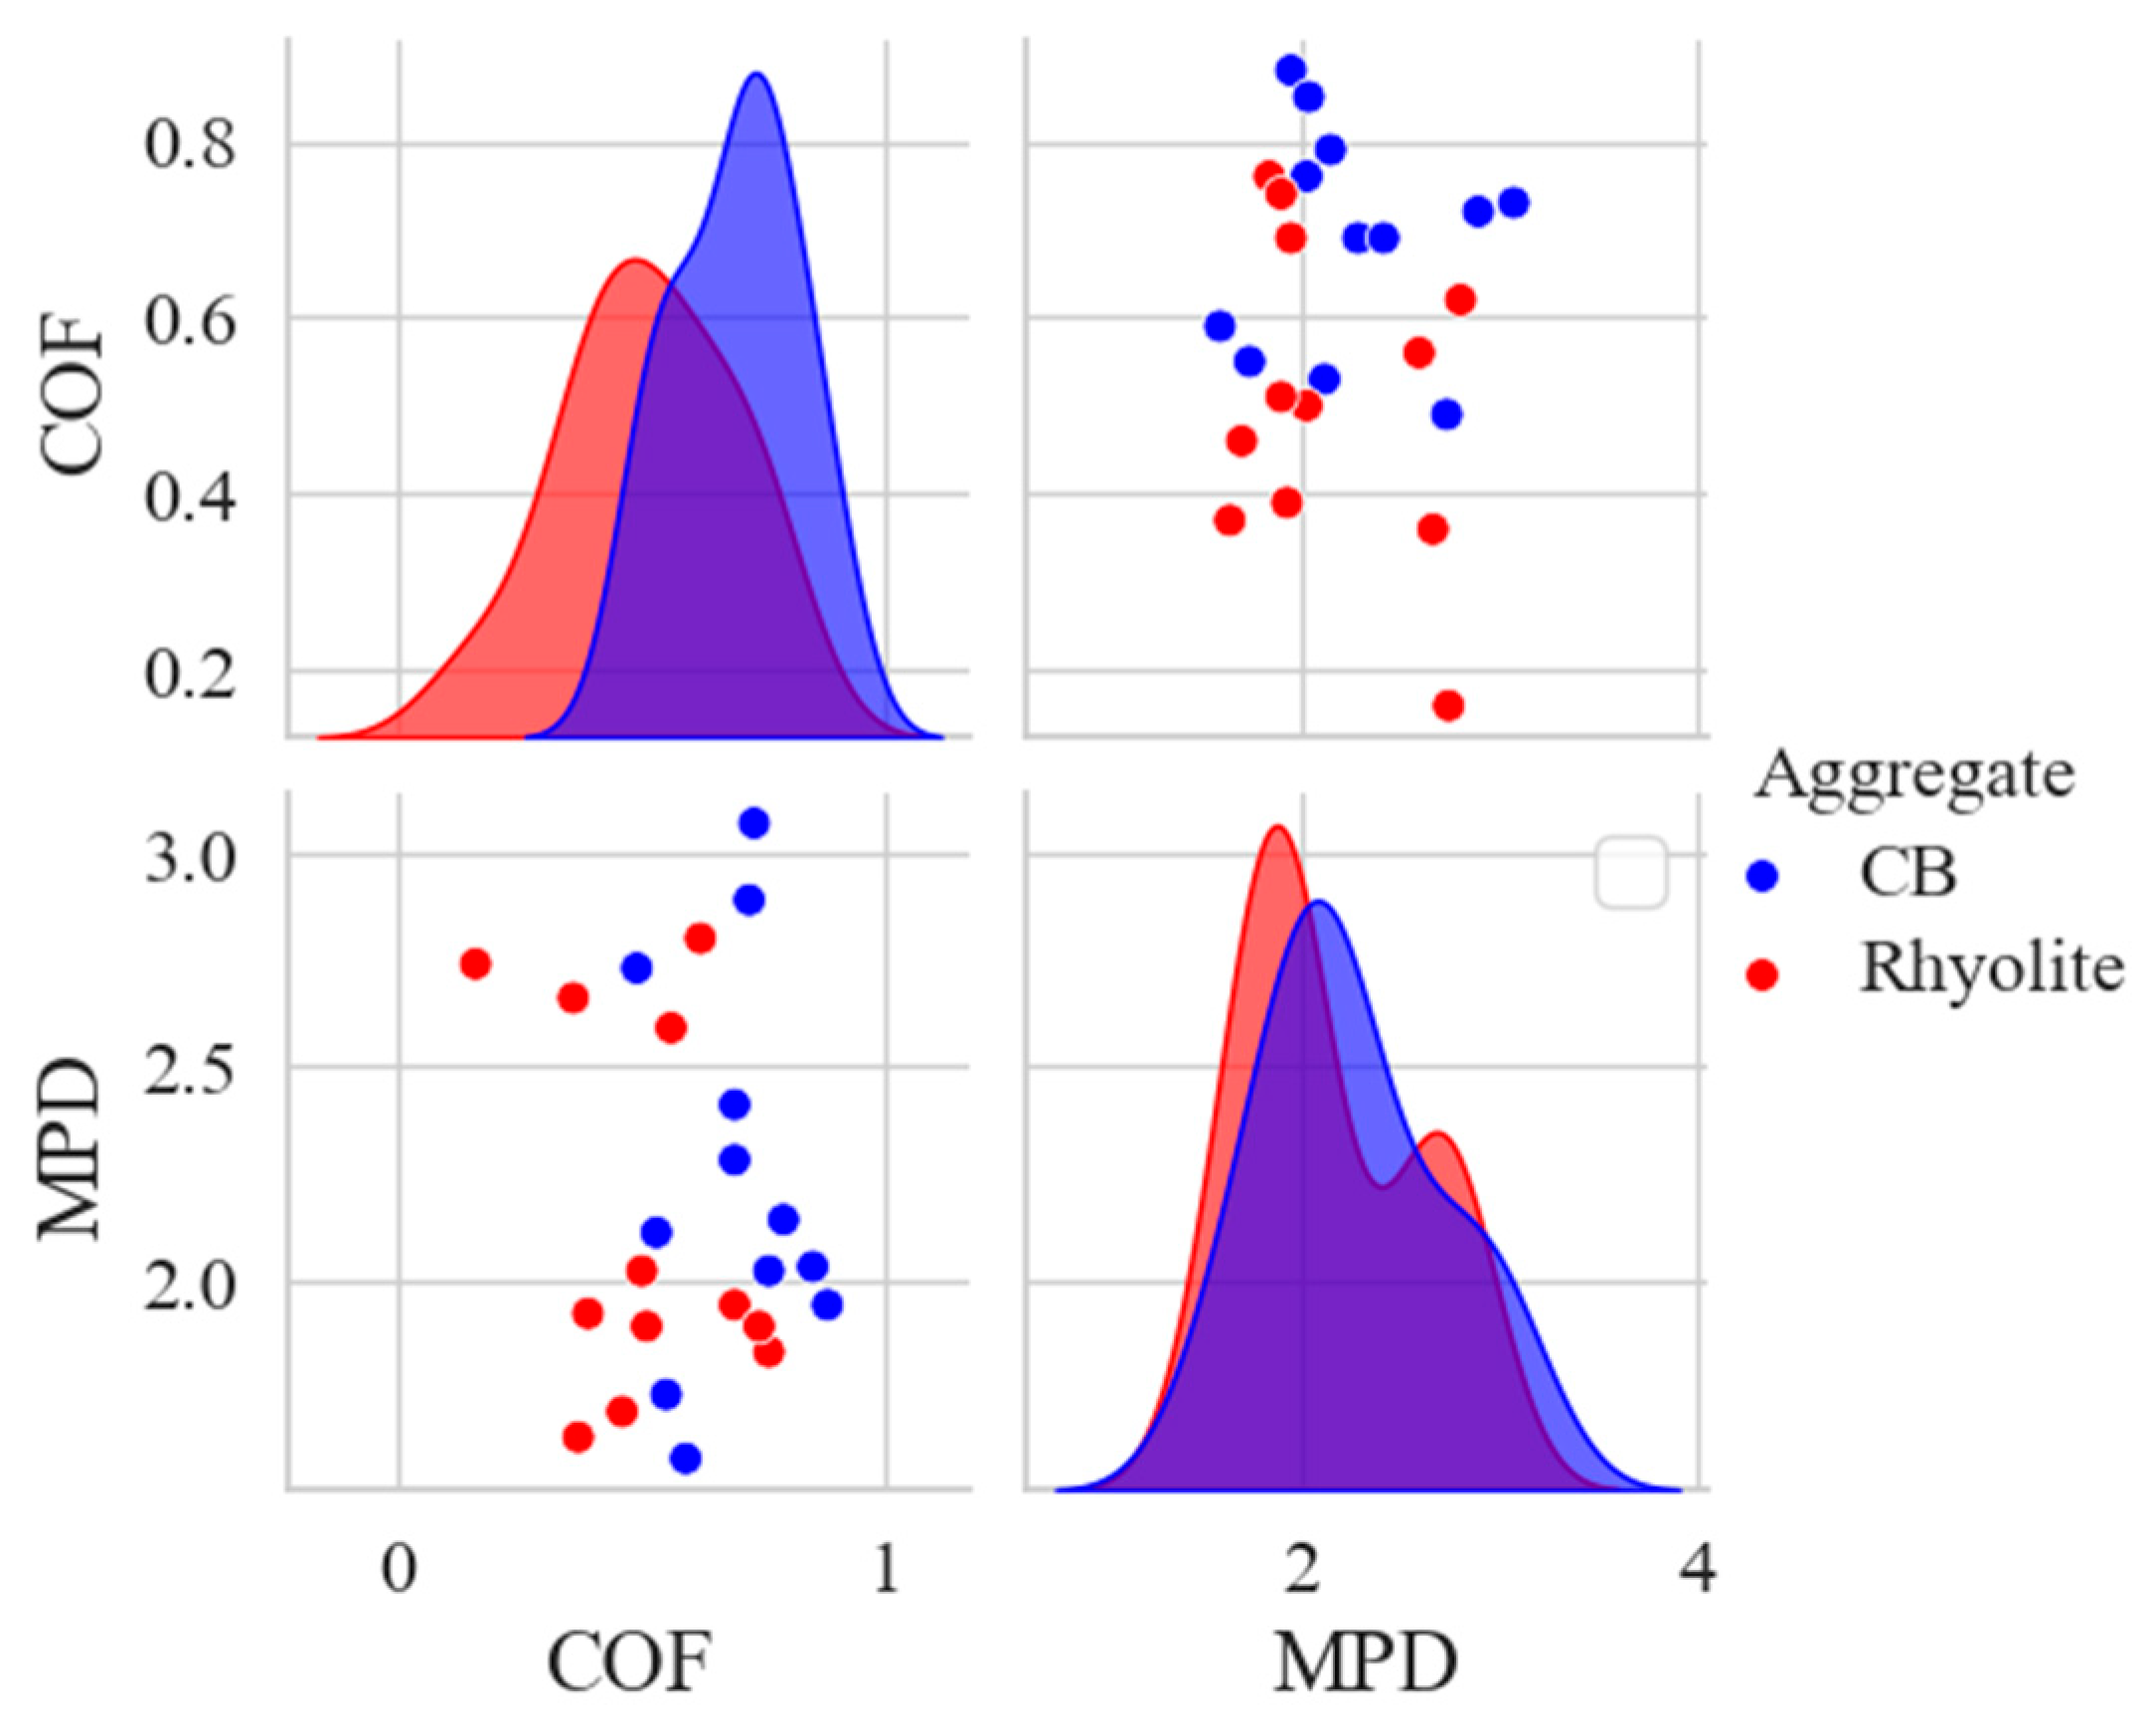
3.2. Data Preparation

To optimize the IFI and predict the frictional properties of HFST samples, microtexture and macrotexture measurements were obtained using DFT and CTM devices for various aggregates with different gradations. Figure 7 presents the multivariate scatter plot of the collected data from DFT and CTM tests on all samples with different aggregates and sizes. To make it easy to identify variable distributions, facilitate the creation of precise prediction models, and visually depict connections between values, data visualization is essential. Across all aggregate sizes, CB consistently showed the highest COF in comparison to Rhy, as seen by the multivariable scatter plot and pair plot. This pattern demonstrates CB’s better frictional performance in HFST. The Pearson correlation coefficient was calculated as r = −0.071 with a p-value of 0.7406, indicating a very weak and statistically insignificant linear relationship between these two variables in the dataset. This suggests that COF and MPD may contribute independently to the IFI and supports the rationale for including both variables in multivariate nonlinear modeling.
Because of its unique morphological characteristics, such as texture, angularity, and particle shape, CB HFST showed the greatest COF among the various sizes. These features improve surface roughness and interlock, which improves skid resistance. According to earlier research, CB’s microtexture and macrotexture are closely related to its exceptional performance and are essential for maintaining high friction levels even after lengthy polishing cycles. The pair plot of the data gathered from the DFT and CTM tests on all samples with various aggregation sizes and types is shown in Figure 8.
The distribution of each parameter is shown by the diagonal components, and CB has a tendency toward higher COF values, suggesting superior frictional performance in comparison to Rhyolite. The Outlier analysis was conducted using interquartile range (IQR)-based filtering for COF and MPD across polishing cycles. The analysis revealed zero potential outliers.
The scatter plots in the lower left and upper right corners do not show a strong linear correlation between COF and MPD, emphasizing that higher texture depth does not necessarily equate to higher friction.

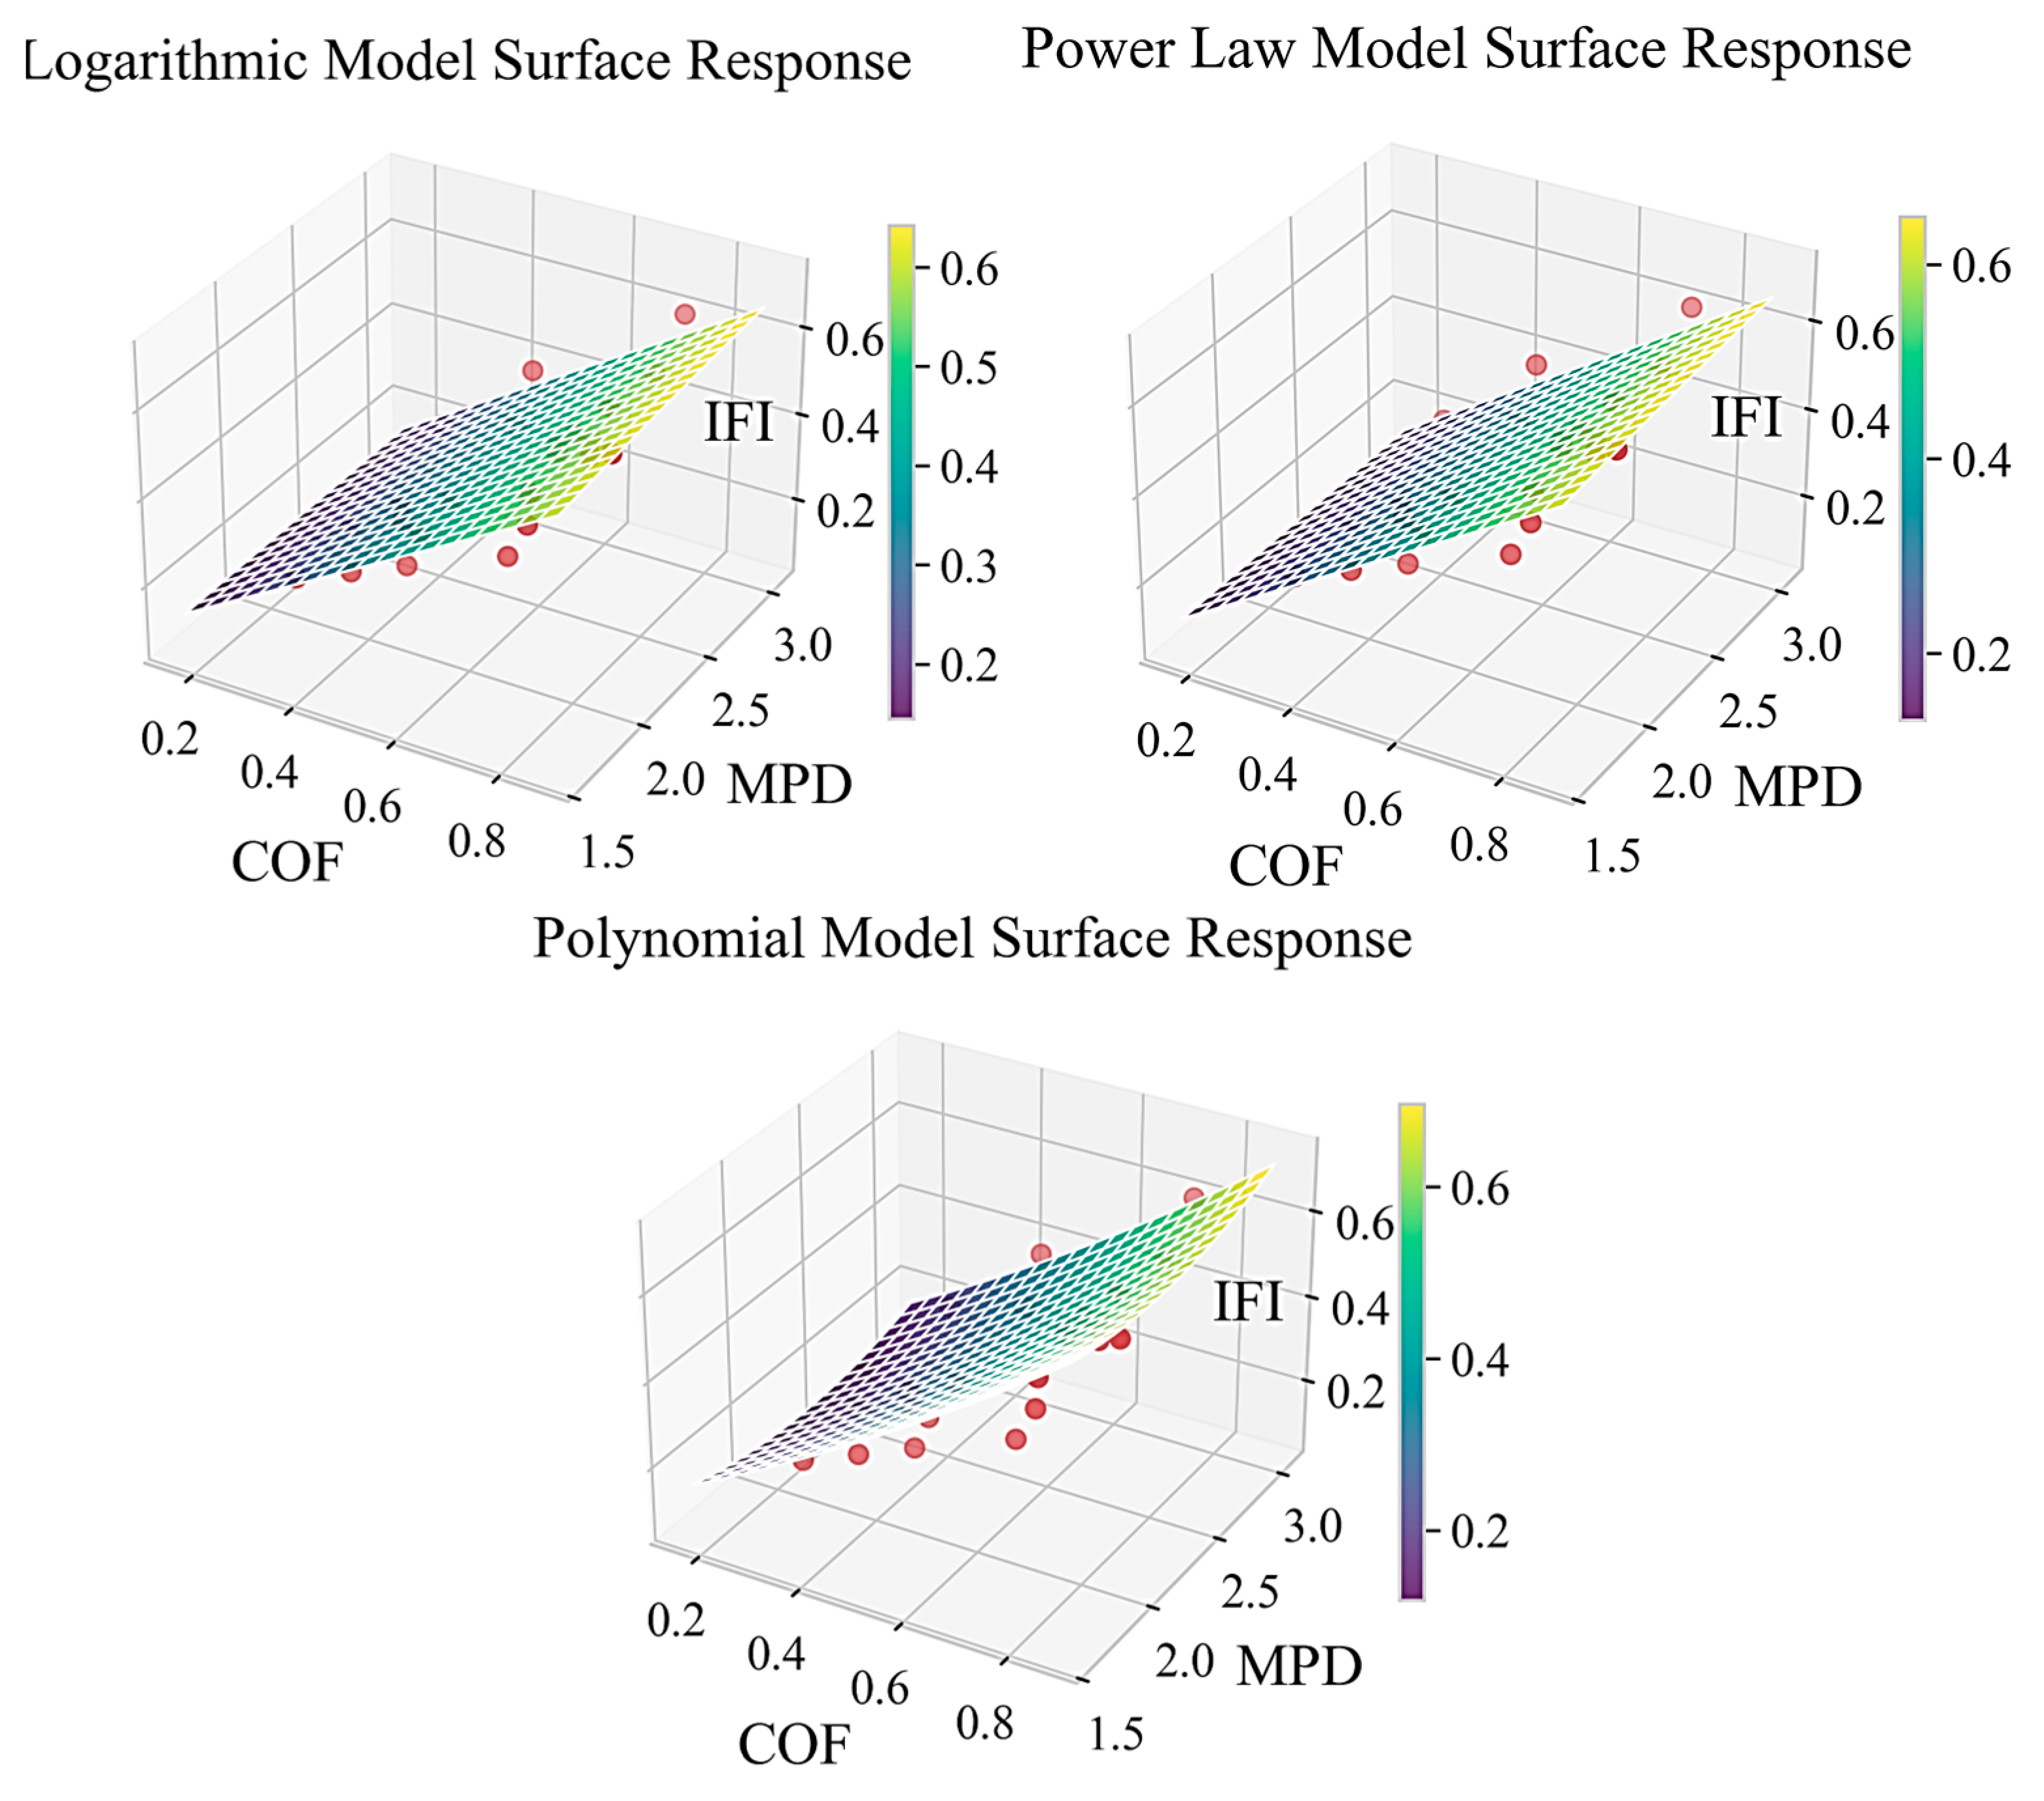
3.3. Model Performance and Comparative Analysis

The IFI was predicted by three models that used the COF and MPD as input variables. Overall, the logarithmic model performed the best, with the lowest testing RMSE (0.049) and the greatest testing R2 (0.821). The four parameters of this model’s simplicity improve interpretability and lower the possibility of overfitting. The power law model performed nearly as well as the logarithmic model (testing R2 = 0.813) and the testing RMSE (0.050). The polynomial model showed slightly better training performance (R2 = 0.776), but its testing metrics were marginally lower (testing R2 = 0.802). The ability of each model to capture the IFI values from experimental measurements throughout training and testing datasets is demonstrated by Figure 9, which shows the actual vs. predicted values for each model. With little departure from the parity line (y = x), each model exhibits good predictive power and high accuracy during both the training and testing stages. The original IFI model defined by PIARC (ASTM E1960) achieved a test R2 of 0.7940 and RMSE of 0.0534. These results demonstrate that the proposed models better capture the nonlinear relationship between texture (MPD) and friction (COF), particularly in HFST contexts with extended MPD ranges.
The Surface Response Plots for various models are shown in Figure 10, which shows the relationship between the target response, IFI, and two independent variables, COF and MPD. The IFI value’s reaction to changes in COF and MPD is depicted by the colored surface. The experimental data points are represented by red dots, which show how well the modeled surface matches the measured data. It is found that IFI rises when COF and MPD rise across all models. The sensitivity of IFI to variations in friction is reflected in the gradient or steepness of the surface along the COF axis; steeper slopes suggest a stronger impact. Likewise, the effect of macrotexture depth on the IFI is shown by the tilt along the MPD axis [41].
Table 3 presents the coefficients and corresponding equations for each evaluated model. Among them, the logarithmic model emerges as the most suitable for HFST applications. This model demonstrates the highest level of reliability, with performance metrics indicating strong agreement between predicted and observed values (R2 Test = 0.821, R2 Train = 0.760, RMSE = 0.049). The clear physical meaning of its coefficients further supports its applicability in practical scenarios.

Model Sensitivity Analysis

A local derivative-based sensitivity analysis was used, in which partial derivatives of the IFI with respect to the input variables, specifically the COF and MPD, were calculated. This strategy enabled a precise measurement of how minor changes in input values propagate across each model. This was performed by perturbing COF and MPD by ±20% and determining the resulting IFI (ΔIFI). Each model’s biggest percentage change in IFI was extracted and used as a sensitivity metric. Across all three models, the projected IFI is often more sensitive to changes in the COF than to MPD, according to the sensitivity analysis findings, which are shown in Table 4. A 20% variance in COF resulted in a change in IFI (ΔIFI) that varied from 14.3% to 17.7%, but a similar level of variation in MPD produced a significantly lower ΔIFI that ranged from 1.5% to 6.0%. The polynomial model was the most sensitive of the three models to both COF (17.7%) and MPD (6.0%), indicating that changes in input parameters within the tested range had a greater impact on the model’s output. This increased sensitivity is due in part to the model’s use of squared and interaction components, which can exaggerate output variation, particularly outside of the calibration range. On the other hand, the logarithmic and power law models showed comparable and comparatively lower sensitivity levels (~14–15%), suggesting increased stability and maybe more reliable performance in the presence of input variability [42,43,44,45,46].

4. Conclusions

A proven technique for enhancing road safety is the use of High Friction Surface Treatments (HFSTs), which increase pavement friction, especially in high-risk locations like curves and intersections. For efficient design and performance tracking, the skid resistance of various treatments must be quantified. A standardized metric for assessing pavement friction based on surface texture characteristics and friction measurements is the IFI, as specified by ASTM E1960. The IFI procedure, on the other hand, is predicated on the idea that pavement friction changes substantially with slip speed during testing, with distinct components, representing the contributions of microtexture and macrotexture, respectively, accounting for friction at low and high speeds. For many typical pavements, this approach works well, but it might not be sufficient to describe the friction behavior of other surface types. Friction levels in HFST and certain ribbed pavements are often less susceptible to changes in slip speed since they stay mostly constant throughout a range of slip speeds. This study aims to evaluate alternative data-driven models for predicting the IFI in HFST using laboratory-measured COF and MPD.
The DFT result demonstrated sensitivity to a variety of factors. CB consistently had higher COF values across all sizes, both before and after polishing. Rhy had lower COF values, implying that it may lose friction more quickly with extended polishing than CB, which retains frictional properties better. Both aggregates, of varying sizes, demonstrated texture reduction between initial values and measurements after 140K polishing cycles. During the first 30K cycles, some samples’ textures increased slightly before decreasing. This behavior can be attributed to the wear of loosely bound particles and angular but weak particles caused by the TWPD tires’ mechanical polishing force.
All three models performed well in fitting experimental data, with R2 values ranging from 0.80 to 0.82 on the testing dataset. The logarithmic model had the highest R2 (0.821) and a low RMSE (0.049), indicating high capability in the experimental range. The power law model had an R2 of 0.813 and an RMSE of 0.050, whereas the polynomial model had an R2 of 0.802 and an RMSE of 0.052. The surface response plots revealed varying degrees of curvature, implying different sensitivities to the COF and MPD parameters.
According to the sensitivity analysis, with ΔIFI ranging from 14.3% to 17.7% for a ±20% change in COF compared to 1.5% to 6.0% for MPD, anticipated IFI values are more impacted by COF than MPD. While the logarithmic and power law models had lower and more consistent sensitivity (~14–15%), the polynomial model was the most sensitive to both inputs.
The findings enable a relevant laboratory evaluation of HFST friction resistance, which is required for informed material selection and design optimization. By giving a validated method for determining IFI using laboratory measures. The presented models (especially logarithmic) provide an indispensable instrument for predicting IFI of HFSTs using field-measurable input parameters (COF at 20 km/h and MPD). Future work will incorporate field validation on in-service HFST sites employing DFT + CTM testing to compare lab-predicted IFI to field performance recommendations.

Author Contributions

Conceptualization, A.R. and M.A.; methodology, A.R. and M.A.; software, A.R.; validation, A.R. and M.A.; formal analysis, A.R.; investigation, A.R.; resources, M.A.; data curation, A.R. and M.A.; writing—original draft preparation, A.R.; writing—review and editing, M.A.; visualization, A.R.; supervision, M.A. All authors have read and agreed to the published version of the manuscript.

Funding

This research was partially funded by: Missouri University of Science and Technology (Missouri S&T), the Missouri Asphalt Pavement Association (MAPA) endowment fund, and the Missouri Department of Transportation (MoDOT) under Project number TR202206.

Institutional Review Board Statement

Not applicable.

Informed Consent Statement

Not applicable.

Data Availability Statement

The data used in this study are available from the authors upon reasonable request.

Acknowledgments

The authors wish to extend their sincere gratitude to the Missouri University of Science and Technology for their invaluable support and assistance throughout this research.

Conflicts of Interest

The authors declare no conflicts of interest.

References

  1. Roshan, A.; Abdelrahman, M. Friction Enhancements to Asphalt Pavement Surfaces; Report No. cmr 24-015; Missouri Department of Transportation, Construction and Materials Division: Jefferson City, MO, USA, 2024. Available online: https://rosap.ntl.bts.gov/view/dot/77701 (accessed on 15 April 2025).
  2. de León Izeppi, E.; Flintsch, G.W.; McGhee, K.K. Field Performance of High Friction Surfaces; Virginia Center for Transportation Innovation and Research: Blacksburg, VA, USA, 2010. [Google Scholar]
  3. Merritt, D.K.; Lyon, C.; Persaud, B. Evaluation of Pavement Safety Performance; United States Federal Highway Administration: Austin, TX, USA, 2015. [Google Scholar]
  4. Federal Highway Administration (FHWA). EveryDay Counts Program (EDC-2) Innovation. 2020. Available online: https://www.fhwa.dot.gov/innovation/everydaycounts/edc-2.cfm (accessed on 15 April 2025).
  5. Roshan, A.; Abdelrahman, M. Evaluating Friction Characteristics of High Friction Surface Treatment Application Under Varied Polishing and Slippery Conditions. Transp. Res. Rec. 2024, 2679, 1847–1860. [Google Scholar] [CrossRef]
  6. Li, S.; Hu, J.; Tan, Y.; Xiao, S.; Han, M.; Li, S.; Li, J.; Wang, W. A review of non-contact approach for pavement skid resistance evaluation based on texture. Tribol. Int. 2024; 8, 109737. [Google Scholar]
  7. Roshan, A.; Abdelrahman, M. Influence of Aggregate Properties on Skid Resistance of Pavement Surface Treatments. Coatings 2024, 14, 1037. [Google Scholar] [CrossRef]
  8. Athiappan, K.; Kandasamy, A.; Mohamed, M.J.; Parthiban, P.; Balasubramanian, S. Prediction modeling of skid resistance and texture depth on flexible pavement for urban roads. Mater. Today Proc. 2022, 52, 923–929. [Google Scholar] [CrossRef]
  9. Kanafi, M.M.; Tuononen, A.J. Application of Three-Dimensional Printing to Pavement Texture Effects on Rubber Friction. Road Mater. Pavement Des. 2017, 18, 865–881. [Google Scholar] [CrossRef]
  10. Roshan, A.; Abdelrahman, M. Developing an effective approach to assess pavement condition for high friction surface treatment (HFST) installation. Acta Polytech. 2024, 64, 571–581. [Google Scholar] [CrossRef]
  11. Chen, C.; Gu, F.; Heitzman, M.; Powell, B.; Kowalski, K. Influences of Alternative Friction Aggregates on Texture and Friction Characteristics of High Friction Surface Treatment. Constr. Build. Mater. 2022, 314, 125643. [Google Scholar] [CrossRef]
  12. Ueckermann, A.; Wang, D.; Oeser, M.; Steinauer, B. Calculation of Skid Resistance from Texture Measurements. J. Traffic Transp. Eng. (Eng. Ed.) 2015, 2, 3–16. [Google Scholar] [CrossRef]
  13. Zhu, S.; Ji, X.; Yuan, H.; Li, H.; Xu, X. Long-term skid resistance and prediction model of asphalt pavement by accelerated pavement testing. Constr. Build. Mater. 2023, 375, 131004. [Google Scholar] [CrossRef]
  14. Plati, C.; Pomoni, M.; Stergiou, T. Development of a Mean Profile Depth to Mean Texture Depth Shift Factor for Asphalt Pavements. Transp. Res. Rec. 2017, 2641, 156–163. [Google Scholar] [CrossRef]
  15. Roshan, A.; Abdelrahman, M. Improving aggregate abrasion resistance prediction via Micro-Deval test using ensemble machine learning techniques. Eng. J. 2024, 28, 15–24. [Google Scholar] [CrossRef]
  16. Wambold, J.C.; Antle, C.E.; Henry, J.J.; Rado, Z. International PIARC Experiment to Compare and Harmonize Texture and Skid Resistance Measurements; PIARC: Paris, France, 1995; p. 346. [Google Scholar]
  17. Fuentes, L.G.; Gunaratne, M. Evaluation of the Speed Constant and Its Effect on the Calibration of Friction-Measuring Devices. Transp. Res. Rec. 2010, 2155, 134–144. [Google Scholar] [CrossRef]
  18. ASTM E1960-07; Standard Practice for Calculating International Friction Index of a Pavement Surface, Annual Book of ASTM Standards. ASTM International: West Conshohocken, PA, USA, 2011.
  19. D’Apuzzo, M.; Evangelisti, A.; Nicolosi, V. An exploratory step for a general unified approach to labelling of road surface and tyre wet friction. Accid. Anal. Prev. 2020, 138, 105462. [Google Scholar] [CrossRef] [PubMed]
  20. Rajaei, S.; Chatti, K.; Dargazany, R. A Review: Pavement Surface Micro-Texture and Its Contribution to Surface Friction. In Proceedings of the Transportation Research Board 96th Annual Meeting; Transportation Research Board, Washington, DC, USA, 8–12 January 2017. [Google Scholar]
  21. Pereira, P.A.; Pais, J.C.; Trichês, G.; Fontes, L.P. Skid resistance and texture of compacted asphalt mixes evaluated from the IFI in laboratory preparation. In Proceedings of the 4th Eurasphalt and Eurobitume Congress, Copenhagen, Denmark, 21–23 May 2008; 2008; pp. 1–14. [Google Scholar]
  22. Wilson, B.; Saca, M. High Friction Surface Treatment (HFST) Synthesis for Florida Pavements; FHWA/FL-21/BE923 Final Report; Texas A&M Transportation Institute: College Station, TX, USA, 2021. [Google Scholar]
  23. High Friction Surface Treatment Site Selection and Installation Guide; FHWA-SA-21-093; FHWA: Washington, DC, USA, 2024.
  24. Roshan, A.; Abdelrahman, M.; Ragab, M. Performance Evaluation of Highly Modified Asphalt-Based Binders in High Friction Surface Treatment: Comparative Study with Epoxy-Based System. Buildings 2025, 15, 1425. [Google Scholar] [CrossRef]
  25. AASHTO MP41-22; Standard Specification for High Friction Surface Treatment for Asphalt and Concrete Pavements Using Calcined Bauxite. American Association of State Highway and Transportation Officials (AASHTO): Washington, DC, USA, 2022. Available online: https://dnr.mo.gov/document-search/rhyolite-pub2927/pub2927 (accessed on 15 November 2023).
  26. Missouri Geological Survey, Geological Survey Program. Rhyolite—PUB2927; Missouri Department of Natural Resources: Rolla, MO, USA, 2020. [Google Scholar]
  27. NJSP-15-13B; High Friction Surface Treatment. Standard Specifications. Missouri Department of Transportation: Jefferson City, MO, USA, 2015.
  28. Pranav, C.; Tsai, Y.C. High Friction Surface Treatment Deterioration Analysis and Characteristics Study. Transp. Res. Rec. 2021, 2675, 370–384. [Google Scholar] [CrossRef]
  29. Wei, F.; Xing, M.; Li, S.; Shan, J.; Guan, B. Physical and Mechanical Properties of Epoxy–Bauxite Mortar of High-Friction Surface Treatment. J. Mater. Civ. Eng. 2020, 32, 04020146. [Google Scholar] [CrossRef]
  30. Roshan, A.; Abdelrahman, M. Performance and Economic Evaluation of Asphalt-Based High Friction Surface Treatment (HFST) Applications. Appl. Sci. 2025, 15, 873. [Google Scholar] [CrossRef]
  31. Heitzman, M.; Turner, P.; Greer, M. High Friction Surface Treatment Alternative Aggregates Study; NCAT Report; National Center for Asphalt Technology, Auburn University: Auburn, AL, USA, 2015. [Google Scholar]
  32. ASTM E1911-19; Standard Test Method for Measuring Paved Surface Frictional Properties Using the Dynamic Friction Tester. ASTM International: West Conshohocken, PA, USA, 2019.
  33. ASTM E2157-15; Standard Test Method for Measuring Pavement Macrotexture Properties Using the Circular Track Meter. ASTM International: West Conshohocken, PA, USA, 2019.
  34. Sezen, H.; Fisco, N. Evaluation and comparison of surface macrotexture and friction measurement methods. J. Civ. Eng. Manag. 2013, 19, 387–399. [Google Scholar] [CrossRef]
  35. Fuentes, L.G.; Gunaratne, M.; de León Izeppi, E.; Flintsch, G.W.; Martinez, G. Determination of Pavement Macrotexture Limit for Use in International Friction Index Model. Transp. Res. Rec. 2012, 2306, 138–143. [Google Scholar] [CrossRef]
  36. Paji, M.K.; Gordan, B.; Bedon, C.; Faridmehr, I.; Valerievich, K.; Hwang, H.J. Artificial Neural Network Levenberg–Marquardt Based Algorithm for Compressive Strength Estimation of Concrete Mixed with Magnetic Salty Water. Eng. Sci. 2023, 23, 878. [Google Scholar] [CrossRef]
  37. Polushkina-Merchanskaya, O.; Armstrong, M.D.; Gómez-Llorente, C.; Ferrer, P.; Fernandez-Gonzalez, S.; Perez-Cruz, M.; Gómez-Roig, M.D.; Camacho, J. Considerations for missing data, outliers and transformations in permutation testing for ANOVA with multivariate responses. Chemom. Intell. Lab. Syst. 2025, 258, 105320. [Google Scholar] [CrossRef]
  38. Amini, K.; Rostami, F.; Caristi, G. An efficient Levenberg–Marquardt method with a new LM parameter for systems of nonlinear equations. Optimization 2018, 67, 637–650. [Google Scholar] [CrossRef]
  39. Khan, M.A.; Farooq, F.; Javed, M.F.; Zafar, A.; Ostrowski, K.A.; Aslam, F.; Malazdrewicz, S.; Maślak, M. Simulation of Depth of Wear of Eco-Friendly Concrete Using Machine Learning Based Computational Approaches. Materials 2021, 15, 58. [Google Scholar] [CrossRef]
  40. Aghaee, K.; Roshan, A. Predicting Time to Cracking of Concrete Composites Subjected to Restrained Shrinkage: A Review with Insights from Statistical Analysis and Ensemble Machine Learning Approaches. J. Build. Eng. 2024, 110856. [Google Scholar] [CrossRef]
  41. Shinde, S.N.; Christa, S.; Grover, R.K.; Pasha, N.; Harinder, D.; Nakkeeran, G.; Alaneme, G.U. Optimization of waste plastic fiber concrete with recycled coarse aggregate using RSM and ANN. Sci. Rep. 2025, 15, 7798. [Google Scholar] [CrossRef] [PubMed]
  42. Jumabekova, A.; Berger, J.; Foucquier, A. An Efficient Sensitivity Analysis for Energy Performance of Building Envelope: A Continuous Derivative Based Approach. Build. Simul. 2021, 14, 909–930. [Google Scholar] [CrossRef]
  43. Tsvetkova, O.; Ouarda, T.B. A Review of Sensitivity Analysis Practices in Wind Resource Assessment. Energy Convers. Manag. 2021, 238, 114112. [Google Scholar] [CrossRef]
  44. Zhao, J.; Wang, H. Machine learning based pavement performance prediction for data-driven decision of asphalt pavement overlay. Struct. Infrastruct. Eng. 2025, 21, 940–955. [Google Scholar] [CrossRef]
  45. Clemmensen, A.; Wang, H. Airfield pavement performance prediction using clustered Markov chain models. Road Mater. Pavement Des. 2025, 26, 658–678. [Google Scholar] [CrossRef]
  46. Radwan, M.M.; Zahran, E.M.; Dawoud, O.; Abunada, Z.; Mousa, A. Comparative Analysis of Asphalt Pavement Condition Prediction Models. Sustainability 2025, 17, 109. [Google Scholar] [CrossRef]
Figure 1. Selected aggregate samples.
Applsci 15 06249 g001
Figure 2. Aggregate size distributions.
Applsci 15 06249 g002
Figure 3. HFST sample fabrication procedure.
Applsci 15 06249 g003
Figure 4. Friction property performance testing.
Applsci 15 06249 g004
Figure 5. Influence of aggregate type and size on COF at varying speeds.
Applsci 15 06249 g005
Figure 6. MPD variation across polishing cycles for different aggregate types and sizes.
Applsci 15 06249 g006
Figure 7. Scatter plot matrix of key surface and friction parameters.
Applsci 15 06249 g007
Figure 8. Pair plot of DFT and CTM test data.
Applsci 15 06249 g008
Figure 9. Actual vs. predicted data points for different models.
Applsci 15 06249 g009
Figure 10. Surface response plots for different models.
Applsci 15 06249 g010
Table 1. Aggregate properties.
PropertiesCBRhy
Bulk specific gravity3.252.57
Water absorption (%)1.51.7
LAA value (%)Grade DD
MDA value (%)16.01
15 min
2.45
15.11
15 min
2.6
Uncompacted void content (UVC)45%43%
Note: LAA = Los Angeles Abrasion; MDA = Micro-Deval Abrasion.
Table 2. Properties of epoxy resin binder.
PropertyTest ResultAASHTO Requirement
Gel time (min)1010
Ultimate tensile strength (MPa)2217.2–34.4
Compressive strength, 3 h (MPa)43.56.9 (minimum)
Adhesive strength, 24 h (MPa)51.7 (minimum)
Water absorption, 24 h (%)0.11 (maximum)
Table 3. The coefficients and corresponding equations for each model.
ModelEquationCoefficients
LogarithmicF (60) = a + b × COF ×   e x p 40 c + d × ln 1 + M P D a = 0.0257, b = 1, c = 50, d = 50
Power lawF (60) = a + b × COF ×   e x p 40 c + d × M P D e a = 0.0056, b = 1, c = 50, d = 50, e = 0.5017
PolynomialF (60) = a + b × COF + c × MPD + d × COF2 + e × MPD2 + f × COF × MPDa = 0.4970, b = 0.50, c = −0.4145, d = 0.1856, e = 0.0883, f = −0.0294
Table 4. Maximum relative change in IFI (ΔIFI) for ±20% variation in COF and MPD.
ModelCOF (Max ΔIFI, %)MPD (Max ΔIFI, %)
Logarithmic14.31.8
Power law14.71.5
Polynomial17.76.0
Disclaimer/Publisher’s Note: The statements, opinions and data contained in all publications are solely those of the individual author(s) and contributor(s) and not of MDPI and/or the editor(s). MDPI and/or the editor(s) disclaim responsibility for any injury to people or property resulting from any ideas, methods, instructions or products referred to in the content.

