Article

ReAcc_MF: Multimodal Fusion Model with Resource-Accuracy Co-Optimization for Screening Blasting-Induced Pulmonary Nodules in Occupational Health

1
School of Artificial Intelligence, Jianghan University, Wuhan 430056, China
2
College of Life Science and Technology, University of Electronic Science and Technology of China, Chengdu 610051, China
3
State Key Laboratory of Precision Blasting, Jianghan University, Wuhan 430056, China
*
Author to whom correspondence should be addressed.
Appl. Sci. 2025, 15(11), 6224; https://doi.org/10.3390/app15116224
Submission received: 24 April 2025 / Revised: 23 May 2025 / Accepted: 28 May 2025 / Published: 31 May 2025

Abstract

Occupational health monitoring in demolition environments requires precise detection of blast-dust-induced pulmonary pathologies. However, it is often hindered by challenges such as contaminated imaging biomarkers, limited access to medical resources in mining areas, and opaque AI-based diagnostic models. This study presents a novel computational framework that combines industrial-grade robustness with clinical interpretability for the diagnosis of pulmonary nodules. We propose a hybrid framework that integrates morphological purification techniques (multi-step filling and convex hull operations) with multi-dimensional features fusion (radiomics + lightweight deep features). To enhance computational efficiency and interpretability, we design a soft voting ensemble classifier, eliminating the need for complex deep learning architectures. On the LIDC-IDRI dataset, our model achieved an AUC of 0.99 and an accuracy of 0.97 using standard clinical-grade hardware, outperforming state-of-the-art (SOTA) methods while requiring fewer computational resources. Ablation studies, feature weight maps, and normalized mutual information heatmaps confirm the robustness and interpretability of the model, while uncertainty quantification metrics such as the Brier score and Expected Calibration Error (ECE) better validate the model’s clinical applicability and prediction stability. This approach effectively achieves resource-accuracy co-optimization, maintaining low computational costs, and is highly suitable for resource-constrained clinical environments. The modular design of our framework also facilitates extensions to other medical imaging domains without the need for high-end infrastructure.

1. Introduction

Occupational lung diseases, particularly among blasting workers, are increasingly linked to particulate exposure and blast wave effects. According to data from the Occupational Safety and Health Administration (OSHA) [1], prolonged occupational exposure to respirable crystalline silica (RCS) among miners has been documented to reach intensity levels 4—2400 times higher than general industrial permissible exposure limits (PELs). Epidemiological analyses [2] reveal a significantly increased detection rate of pulmonary nodules in dust-exposed populations (including miners) compared to the general population. Moreover, mortality rates in miners with concurrent tuberculosis infection are significantly higher compared to general patients presenting with tuberculosis alone. Early detection of benign/malignant pulmonary nodules in this population is critical but hindered by limited access to expert radiologists and underdeveloped healthcare infrastructure in remote mining areas, highlighting an urgent need for automated diagnostic tools. Existing AI tools, however, struggle with noise from irregular lesion morphologies caused by heterogeneous dust deposition patterns.
Radiomics-based classification methods are suitable for small-scale datasets and are interpretable and operational, as precision medicine often relies on quantitative data. However, most extracted features, such as tumor shape, intensity, and texture, are manually designed. These shallow, low-dimensional features may fail to capture the full heterogeneity of medical images, limiting the accuracy and robustness of nodule prediction [3]. In contrast, deep learning models automatically extract high-dimensional features but require large datasets and time-consuming expert annotations. Moreover, the interpretability of end-to-end models remains a significant challenge.
As model structures become increasingly complex, this study pioneers an occupational health-oriented, transparent, and resource-efficient analytics paradigm for dust-related pulmonary screening. We propose an interpretable and lightweight ensemble learning model leveraging multi-dimensional features, with three domain-specific advancements:
  • Morphological Purification: Unlike conventional methods that extract ROIs based on labeled coordinates, which may include noise such as small blood vessels or spicules caused by explosive residue deposition and intermittent dust clouds, we employ a more systematic preprocessing workflow. This includes morphological operations, multiple fillings, convex hull calculations, label consensus merging, and random rotations, ensuring the extraction of cleaner and more representative ROIs.
  • Interpretability by Design: We integrate clinical annotated features, radiomics features, and deep features into an interpretable ensemble model. Feature weight maps and normalized mutual information heatmaps ensure the transparency of model decisions, providing actionable insights for clinicians.
  • Resource-Accuracy Co-Optimization: By shifting computational burdens from hardware-dependent deep architectures to precision-enhanced preprocessing, our approach achieves SOTA accuracy using only clinical-grade equipment. This makes it deployable in resource-constrained settings without sacrificing diagnostic rigor.
This paper is organized as follows: Section 2 provides a comprehensive discussion on the development of prediction techniques for diseases such as pulmonary nodules, summarizing the value of various methods and their existing limitations. In Section 2.2, we focus on the challenges associated with medical imaging of patients in specialized industries, the shortcomings in handling image data in most related studies, and the difficulties in applying these techniques in resource-constrained environments. In Section 3, we propose an applicable framework that covers the entire process from data preprocessing and multi-dimensional feature extraction to auxiliary diagnosis, effectively addressing some of the issues discussed in the related work. Section 4 details the processing flow of our proposed technique, presents the related results, and validates and interprets key issues. Finally, in Section 5, we emphasize the practical application value of the project, provide a critical self-assessment, and outline directions for future improvements.

2. Related Work

2.1. Pulmonary Nodule Prediction

Radiomics has been a cornerstone in tumor diagnosis, staging, treatment efficacy evaluation, and prognosis prediction for nearly two decades [4,5,6]. Specifically, CT-based radiomics models have shown promising diagnostic performance in predicting malignant lung nodules. For instance, Shi et al. [7] demonstrated that these models effectively predict malignancy through radiomics analysis of CT images. Similarly, Naik et al. [8] extracted radiomics features from CT images of patients with pulmonary nodules. Using hierarchical clustering for feature selection, they developed a prediction model that combined support vector machines (SVMs) with LASSO, achieving an accuracy of 84.6%. This further underscores the potential of traditional machine learning models for medical image classification and prediction. Tang et al. [9] also integrated radiomics features with clinical annotated features to improve predictive accuracy, reaching 93.6%. This approach significantly outperforms traditional methods that rely solely on clinical annotated or radiomics features.
While radiomics features are effective in quantifying shallow image information and offer good interpretability, the study by Li et al. [10] demonstrates that these features also have notable limitations. These include insufficient ability to capture global image context and relatively weak noise filtering, which can affect prediction accuracy.
Deep learning techniques have addressed many of the limitations of traditional detection methods, leading to significant advancements in the medical field, especially in disease detection, recognition, and image classification. One of the key innovations is the application of Convolutional Neural Networks (CNNs), and the study [11] by Dutande, P. et al. demonstrates that they significantly improve the model’s prediction performance. As an effective feature extractor, CNNs are capable of capturing high-dimensional global features from images, enabling end-to-end learning. Research [12] has shown that features automatically extracted by deep neural networks often outperform manually designed features. For example, Sun et al. [13] constructed a nine-layer CNN and compared the automatically extracted features with traditional handcrafted ones. Their results showed no significant difference, demonstrating the effectiveness of CNNs in deep feature extraction. Similarly, Paul et al. [14] applied CNNs to develop radiomics models for CT images of 498 pulmonary nodule patients, achieving an accuracy of 89.5%. However, the CNN architectures in both studies were relatively shallow, suggesting that their classification performance could be further improved.
Simonyan et al. [15] validated through “Very Deep Convolutional Networks” that deeper CNNs can capture more comprehensive semantic information from images, thereby enhancing performance. For instance, Al-Huseiny et al. [16] deepened their network by using a 22-layer GoogleNet to diagnose benign and malignant nodules, achieving an accuracy of 94.38%. While increasing the depth of the network allows for more detailed feature extraction, excessively deep networks can introduce challenges such as gradient vanishing, gradient explosion, and overfitting. To mitigate these issues, He et al. [17] introduced the residual network (ResNet), which incorporates shortcut connections to prevent gradient-related problems during training. The success of ResNet has led to its widespread use in medical imaging. In a comparative study [18] conducted in 2022, ResNet-50 outperformed other CNN models. As a result, many recent studies [19,20,21,22] now employ ResNet-50 or its variations as feature extractors, further demonstrating its effectiveness in the field.
In current studies, radiology or CNNs are commonly used to extract nodule features from CT images of lung nodules. These features are then processed by traditional machine learning models or optimized for metastasis-based prediction. However, a major challenge with deep learning algorithms is their “black-box” nature, which limits the interpretability of the deep features they extract. Traditional classification methods, which categorize features as “good” or “bad”, offer some advantages in interpretability. These methods can be useful for further analysis of classification models, but their performance often falls short in terms of prediction accuracy. Moreover, traditional machine learning methods are heavily dependent on manually extracted features, which can restrict their generalization ability.
To overcome these limitations, recent algorithms have integrated multi-dimensional features to enhance model performance and stability, taking advantage of the interpretability of handcrafted and radiomics features, along with the powerful feature extraction capabilities of deep learning. These integrated approaches, which combine multiple classification models, have shown significant improvements in prediction performance. For instance, Xiao et al. [23,24] significantly improved the accuracy of object detection by introducing multi-dimensional features, Xiang [25] significantly improved diagnostic accuracy by extracting and fusing multi-dimensional features for processing multimodal medical images, Li et al. [26] reviewed various information fusion techniques based on deep learning for medical image classification and provided a comprehensive analysis, concluding that these methods have become powerful tools for improving medical image classification. Zhou et al. [27] summarized various deep learning models from the perspective of medical image fusion and explored the applications of deep learning in the field of medical image fusion. Despite these advancements, challenges persist in fully merging the interpretability of traditional methods with the power of deep learning, particularly when dealing with complex and heterogeneous data. This study aims to further improve prediction performance by exploring the fusion of deep features, radiomics features, and clinical annotated features. Combining these various dimensions of information should enhance both the interpretability and predictive power of the model.

2.2. Resource-Accuracy Co-Optimization in Occupational Health

Qiao et al. [28] and Ranjan et al. [29] both emphasized in their studies that diagnosing diseases such as pulmonary nodules in resource-limited environments, particularly in harsh settings like mining areas, is challenging due to the extremely limited access to high-quality medical data and computational resources. Medical imaging from mining sites often presents additional challenges, such as significant image artifacts (e.g., noise, shadowing) caused by dust and environmental factors, which can obscure the true characteristics of pulmonary nodules. Most engineering research methods [19,20,21,22,25] directly apply labeled coordinates to segment the region of interest (ROI) without considering the unique imaging characteristics of patients in these environments. This oversight can lead to inaccurate detection, as the models fail to account for the specific noise and distortion patterns inherent in these images.
On the other hand, resource-accuracy co-optimization focuses on balancing computational efficiency and diagnostic accuracy in environments with limited resources. Transfer learning plays a critical role in this process. Models pre-trained on large, high-quality datasets (such as ImageNet) can be fine-tuned to adapt to smaller, domain-specific datasets, significantly reducing the need for extensive labeled data and computational power. For example, research by Nobrega et al. [30] demonstrated that a DenseNet model pre-trained on ImageNet, combined with an SVM classifier, achieved 88.41% accuracy and 93.19% AUC for pulmonary nodule detection in resource-limited environments. Similarly, Muñoz-Rodenas et al. [31] demonstrated that using ResNet50 for heat treatment classification in low-carbon steels outperformed traditional methods, highlighting the potential of transfer learning for complex, heterogeneous datasets. This illustrates how transfer learning can address the scarcity of data while maintaining model performance.
Model ensemble methods further contribute to this optimization by combining multiple models, leveraging their complementary strengths to enhance diagnostic accuracy. Mahajan et al. [32] reviewed 45 studies and emphasized the effectiveness of integrated methods for disease prediction. These methods are particularly useful when individual models face limitations due to data scarcity or image quality issues. Therefore, the computational demands of ensemble methods can be alleviated by using lightweight models or reducing the number of models in the ensemble, thereby maintaining a balance between resource usage and performance.
Combining morphological purification with resource-accuracy co-optimization through transfer learning and model ensembles offers a promising solution for resource-limited environments. This hybrid approach reduces dependence on large datasets while improving both the robustness and generalizability of disease detection systems, making it particularly suitable for medical diagnostics in areas with limited infrastructure, such as mining sites, where medical equipment and skilled personnel are scarce.

3. Methods

The algorithmic process of this study is illustrated in Figure 1 and consists of three main components: The first component involves clinical annotations and radiomics features being extracted. Next, the lung parenchyma is segmented, and annotation coordinates are merged to identify the ROI. After data augmentation, a pre-trained model is fine-tuned through transfer learning to extract deep features. The second component involves selecting and merging features from multiple levels. Three feature groups are filtered using various statistical methods and dimensionality reduction techniques, followed by the removal of dimensional variances to create multi-dimensional features. The third component focuses on prediction evaluation, interpretability validation, and uncertainty quantification. For the final prediction task, XGBoost [33], GBM [34], and RF [35] classifiers are used, with the final classification result obtained through ensemble learning. The advantages of the algorithm are validated through nine evaluation metrics and comparison with the latest algorithms from the past three years. The performance of deep features in prediction is evaluated through feature weight maps, while the association between radiomics features and deep features is validated using normalized mutual information heatmaps. This preliminary analysis suggests that deep features have a certain level of interpretability. Furthermore, to better quantify the model’s prediction uncertainty and performance on the minority class, we introduce the Brier score, Expected Calibration Error (ECE), P-R curves, plot calibration curves, and DCA curves with 95% confidence intervals.

3.1. Data Preprocessing

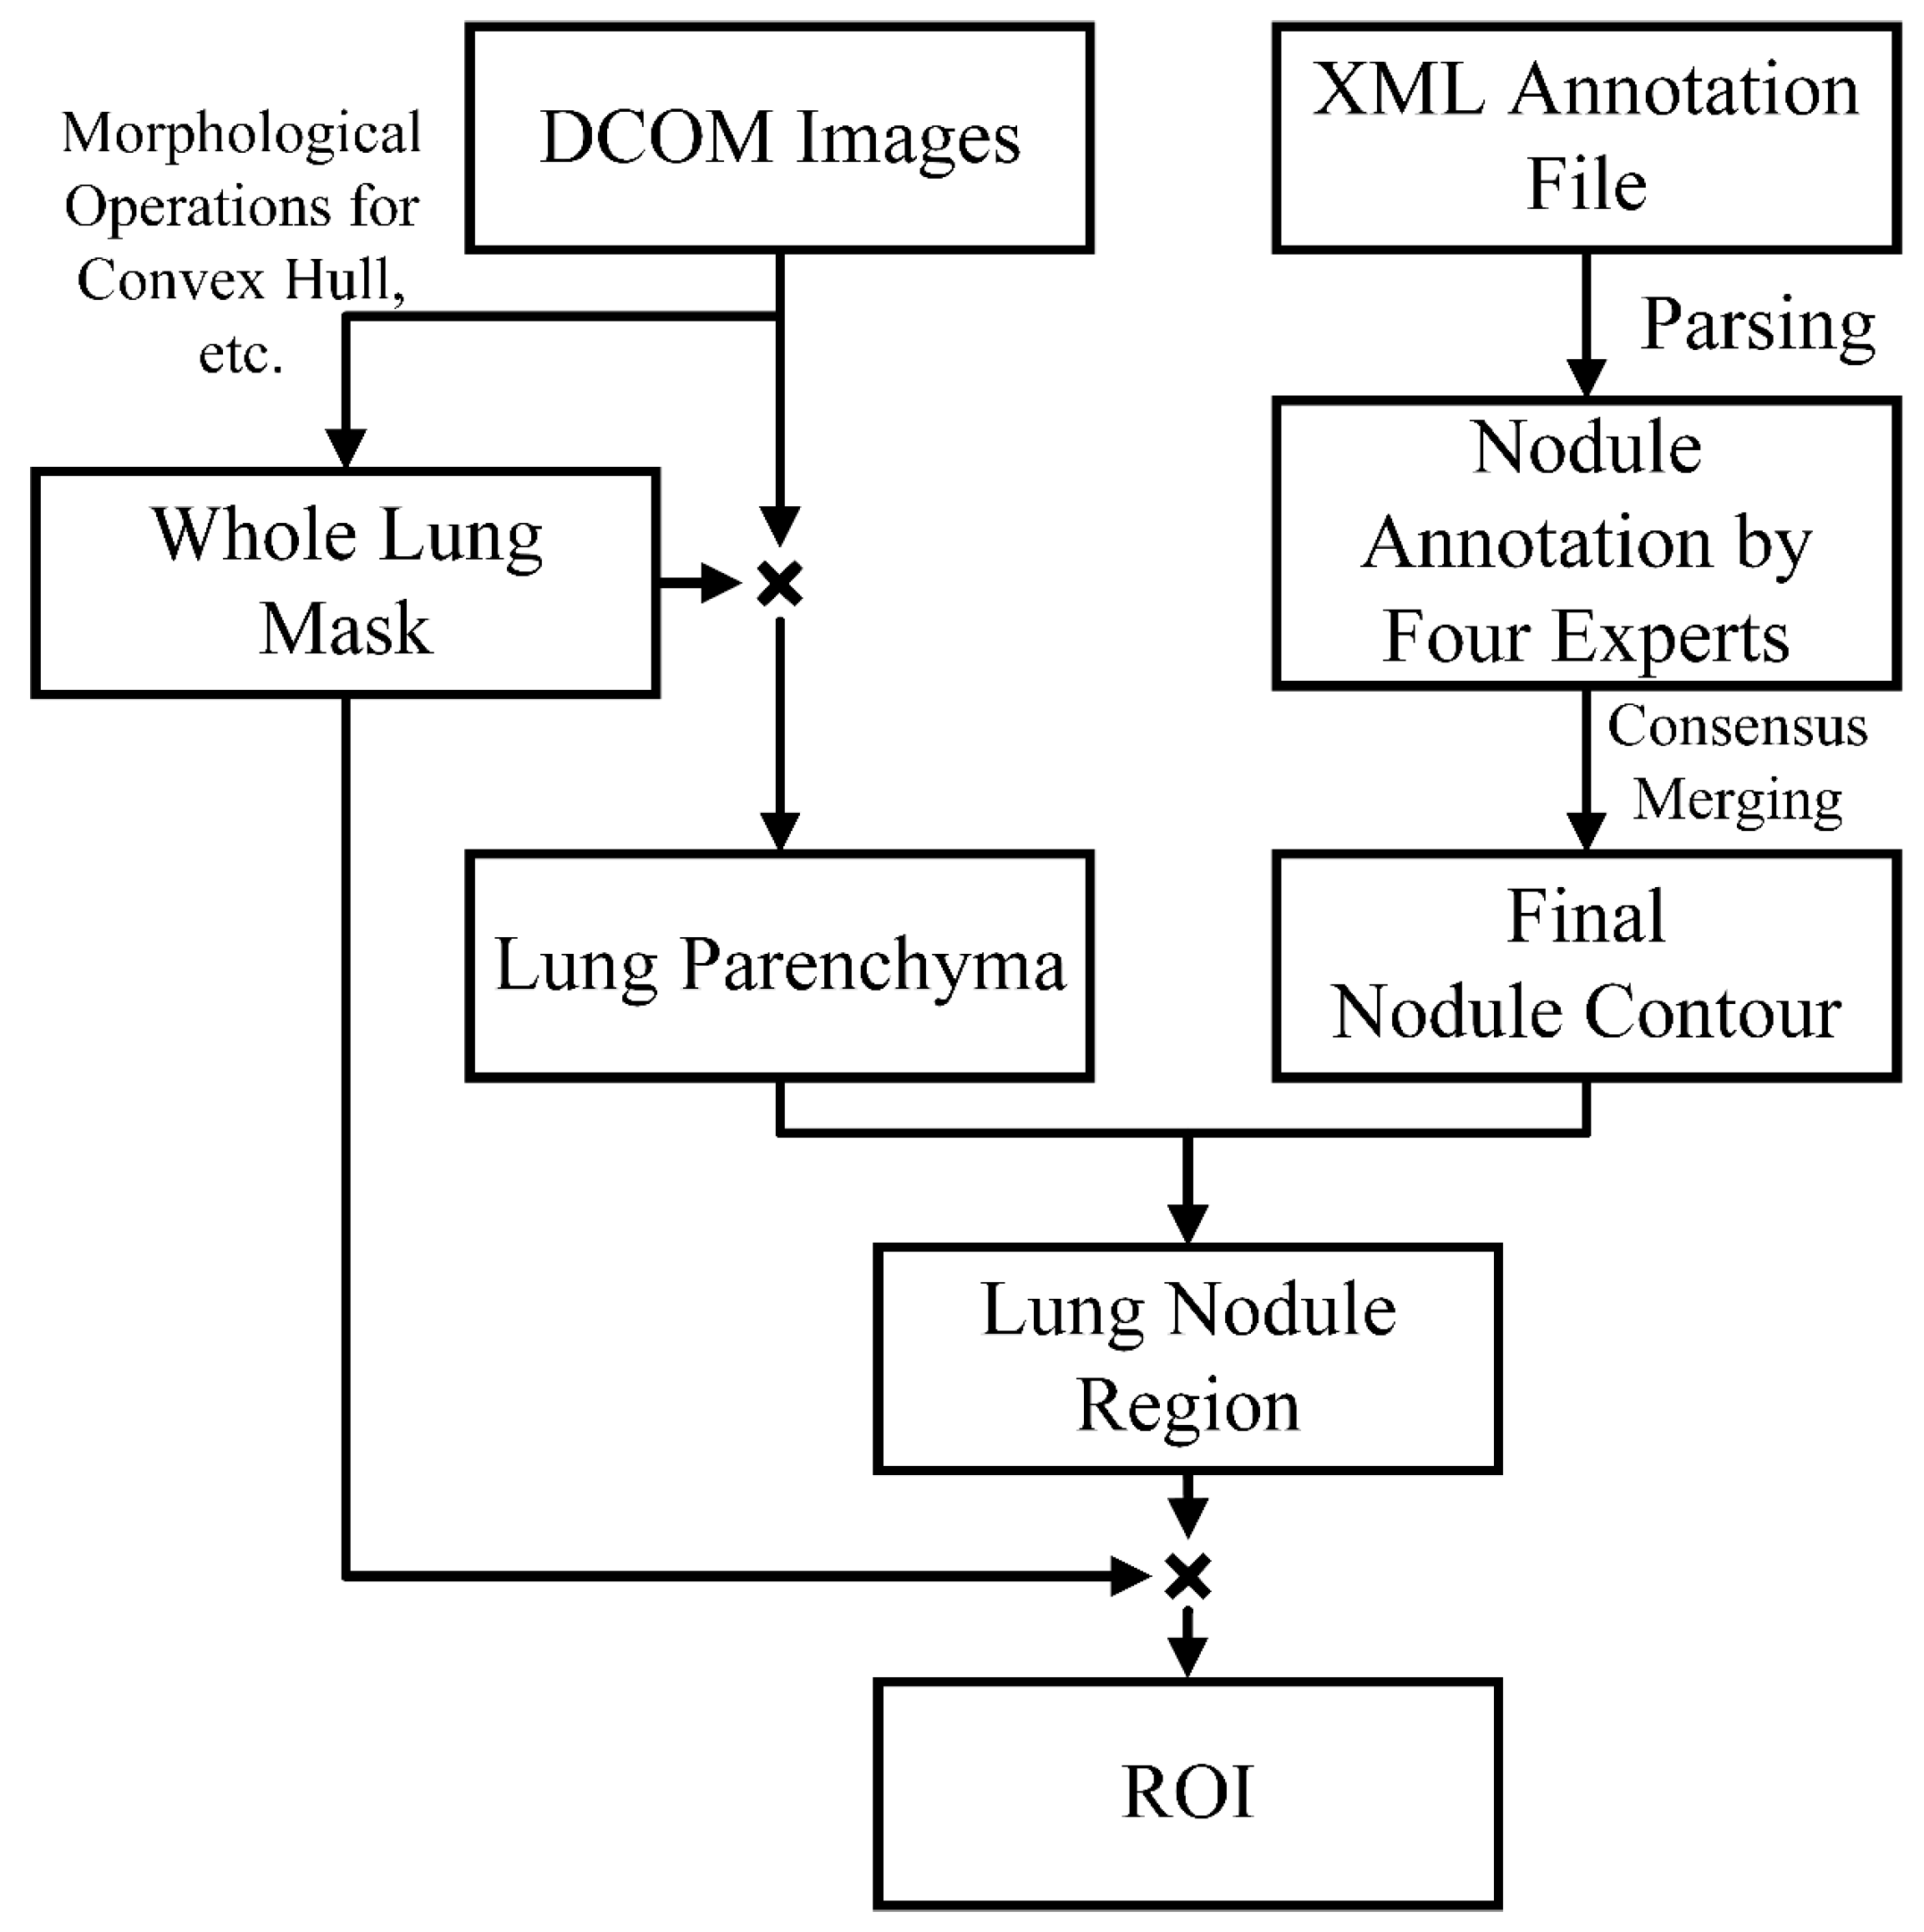
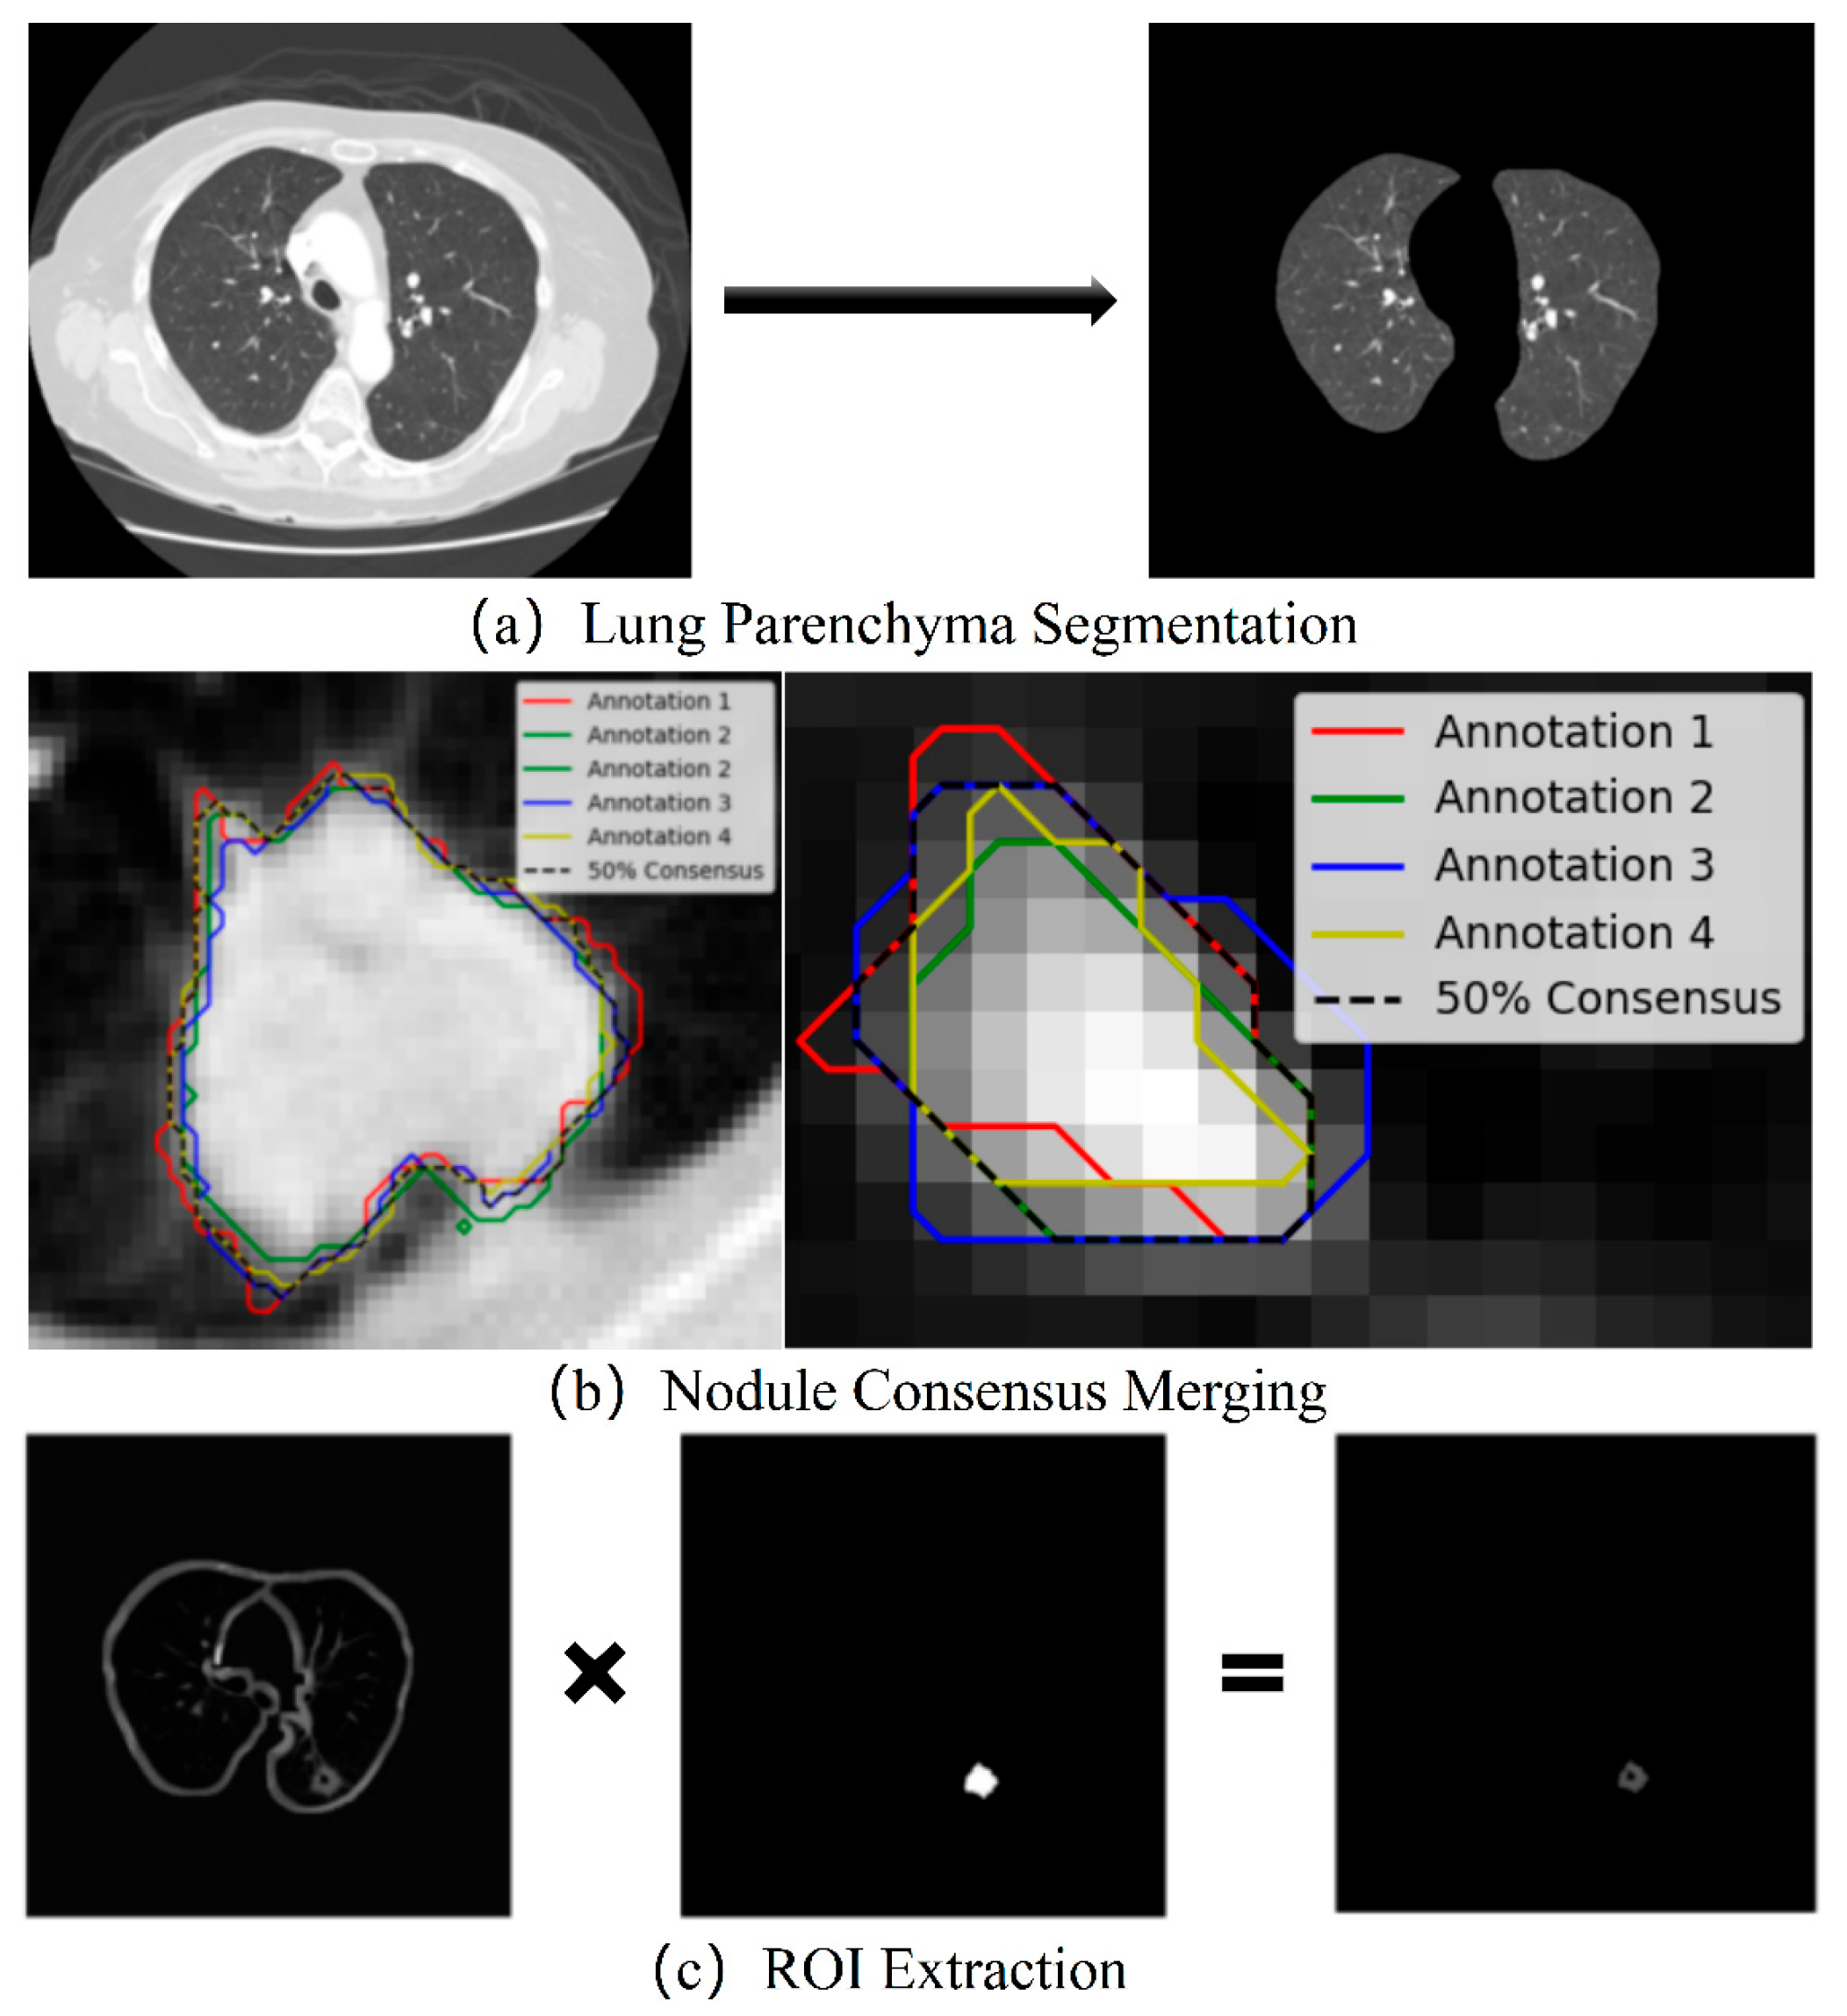
Before extracting meaningful features, raw data must undergo preprocessing to isolate the ROI for optimal model performance. Many studies segment the ROI from unprocessed images using either annotation coordinates or basic morphological techniques. However, medical images often contain significant disruptions, such as small blood vessels, bronchi, and peripheral distortions, which can severely affect model accuracy. To address this, our approach employs a series of processing steps to remove image noise, followed by precise segmentation and isolation of the ROI. The procedural flow is illustrated in Figure 2.
(1)
Lung Parenchyma Segmentation
To minimize computational complexity, the data is first converted to grayscale and normalized. Otsu’s thresholding method is then applied to binarize the grayscale images. A combined strategy, utilizing morphological opening and area thresholding, is employed to remove noise. The internal cavities within the lung parenchyma are filled twice consecutively to address partially filled or discontinuous regions, resulting in a precise lung parenchyma mask. Next, the left and right lungs are separated through opening operations and pixel value labeling. Several operations are applied to each lung, including mask inversion, morphological opening, inversion, image binarization, hole filling, erosion, and convex hull extraction (the smallest convex polygon). These steps help eliminate interference from small blood vessels, bronchi, and nodule artifacts while smoothing the lung parenchyma boundaries and restoring any missing regions. Finally, the left and right lung masks are merged and binarized to create a complete lung mask. This mask is then multiplied by the original grayscale image to obtain the segmented lung parenchyma, as shown in Figure 3a.
(2)
Consensus Merging of Label Coordinates
The scan data for each patient is first retrieved using their patient ID and then converted into volumetric data, representing the medical image as a three-dimensional matrix. The contour coordinates of the lung nodules, annotated by four experts as bounding polygons, are then extracted. A consensus merging process is applied at a 50% agreement level, as shown in Figure 3b. This approach combines the manually annotated regions from the four experts, effectively reducing errors caused by individual biases. The resulting merged nodule contours are used to segment the lung parenchyma image, generating the nodule region image.
(3)
ROI Extraction and Data Augmentation
The ROI is obtained by multiplying the grayscale lung mask image with the binary image of the nodule region from the same slice, as shown in Figure 3c. This process removes interfering elements, yielding a clean and representative lung parenchyma image. To further augment the dataset, random rotations at varying angles are applied to the ROI, ensuring that each data point is viewed from multiple orientations. This augmentation step helps mitigate incidental errors, resulting in a robust final preprocessed dataset.

3.2. Multi-Dimensional Feature Extraction

(1)
Clinical Annotated Features
Each instance in the LIDC-IDRI dataset [36] is accompanied by an XML annotation file, which includes seven key features: subtlety, calcification, sphericity, margin, lobulation, spiculation, and texture. These annotations provide critical information about the nodule’s characteristics.
(2)
Radiomics Features
Radiomics features are extracted from the CT images of the lungs, yielding a total of 669 features. These include a range of data types: first-order statistical features, two-dimensional shape features, texture features, and wavelet features. These features are predefined by specifically designed formulas and are also referred to as “handcrafted” features.
(3)
Deep Features
To balance computational efficiency with performance, pre-trained ResNet-50 and AlexNet models (both trained on the ImageNet dataset) were selected as feature extractors. These models were fine-tuned to extract 1000 deep features specifically tailored for binary classification tasks. Localized training enabled efficient transfer learning, ensuring minimal performance loss. These deep features capture complex patterns unique to different types of nodules, providing detailed and rich image data. They are especially effective at highlighting subtle morphological differences in the nodules, which are crucial for accurate classification. This will be further demonstrated in the following sections.

3.3. Feature Selection and Fusion

To identify the most representative and significant features, the following procedures were carried out:
(1)
Radiomics Feature Selection: First, a homogeneity of variance test (Levene’s test) was performed to assess whether features with homogeneous variances could impact the accuracy of subsequent statistical analyses. Next, T-tests (Student’s t-test) and Welch’s t-test were applied to eliminate features with non-significant mean differences. Features were retained based on the following criteria: p-value (PL) > 0.05 and p-value (PT) < 0.05, or p-value (PL) ≤ 0.05 and p-value (PW) < 0.05. These selected features provided a solid foundation for subsequent tasks by ensuring clear distinctions. Finally, the Least Absolute Shrinkage and Selection Operator (LASSO) method was applied with 5-fold cross-validation to optimize the alpha parameter, resulting in the most representative and generalized radiomics features after “double filtering”.
(2)
Deep Feature Selection: To eliminate dimensionality effects, the deep features were first standardized. Principal Component Analysis (PCA) was then applied for dimensionality reduction, reducing the deep feature samples to the target dimensions while retaining the principal components.
Before feature fusion, it was necessary to address the scale differences between the various feature types: (1) For clinical annotated features, two treatments were applied: binarization (as shown in Table 1) and One-Hot encoding. (2) For radiomics features, normalization was performed. (3) For deep features, standardization had already been carried out. Two fusion methods were designed for subsequent modeling and comparison: deep features + binarized clinical annotated features + radiomics features and deep features + One-Hot encoded clinical annotated features + radiomics features.

3.4. Model Ensemble and Analysis

After feature engineering, three classifiers—XGBoost [33], GBM [34], and RF [35]—were used as base classifiers and combined using a soft voting ensemble mechanism (ME, model ensemble) for model integration and validation.
These classifiers were chosen due to their complementary strengths in handling high-dimensional medical imaging features. XGBoost and GBM are gradient boosting methods known for their strong predictive power and ability to model complex nonlinear relationships, while Random Forest offers robustness to overfitting and effective handling of noisy or imbalanced data. The soft voting strategy leverages predicted probabilities from each base classifier to better capture uncertainty and reduce bias inherent in individual models. This approach improves classification accuracy, particularly in boundary cases.

4. Experiment and Results

In this section, we will build the framework from the bottom up based on the structure presented above. In Section 4.1, we introduce the relevant software and hardware environment used in this experiment. Then, in Section 4.2, we provide a detailed description of the dataset division and discuss potential issues. Next, in Section 4.3, we introduce the evaluation metrics and visualization methods used in the experiment, explaining their specific applications. Finally, Section 4.4 presents the experimental results from various key parts, focusing on the model’s performance, effectiveness, and comparisons with other methods: Section 4.4.1 discusses the fine-tuning details of ResNet50 and AlexNet and presents the results of deep feature extraction and selection; Section 4.4.2 describes the results of radiomics feature extraction and their practical physical characterization properties; Section 4.4.3 lists the comprehensive evaluation performance of the proposed method on the test dataset and preliminarily validates the interpretability of the model. Furthermore, a further comparison is made with 15 state-of-the-art methods to highlight the superiority of the proposed method. In Section 4.4.4, ablation experiments are conducted to verify the effectiveness of each strategy, and various uncertainty quantification metrics are used to emphasize the clinical decision reliability of the proposed method.

4.1. Experimental Environment

The hardware platform used in this experiment is the NVIDIA GeForce RTX 3060 Laptop GPU, which provides an optimal balance of performance and efficiency for processing large medical datasets. Despite using a relatively modest GPU and limited computational resources, the models achieved excellent performance in terms of accuracy and generalization. The software development environment is PyCharm Community Edition 2023.3.4. The key libraries used, along with their version numbers, are listed in Table 2. This experiment demonstrates that with careful model design and efficient resource management, high-quality results can be obtained even when working with limited hardware, which is particularly valuable for applications in resource-constrained medical environments.

4.2. Dataset Division

The dataset comprises multiple CT image slices and XML-format annotation files for 1018 research instances, containing a total of 6532 annotated data points. This study focuses on the binary classification of benign and malignant lung nodules. Accordingly, the data labels were binarized based on malignancy levels: nodules with levels 1–2 were classified as benign (labeled as 0), while those with levels 4–5 were classified as malignant (labeled as 1). Nodules with a malignancy level of 3, indicating uncertainty, were excluded. The final dataset thus contained 6494 instances, as shown in Table 3. The data were split into training and testing sets at a 7:3 ratio based on experience. Notably, the malignant label data in Table 3 is significantly more numerous than the benign label data. However, we chose not to balance the dataset. This decision was driven by our goal to minimize false negatives in the final prediction model, thus preventing the misclassification of malignant cases as benign. While this approach ensures that the model is more suitable for practical medical diagnostic applications, it does have certain theoretical limitations, which we briefly discuss in the conclusion of the manuscript.

4.3. Evaluation Metrics

The experiments in this paper provide a comprehensive evaluation of the model’s performance using various fundamental assessment metrics and curves more suitable for evaluating medical classification models. The specific metrics are as follows:
(1)
Basic Evaluation Metrics: The basic evaluation metrics, including the AUC [37], accuracy (ACC) [38], specificity (SPE) [39], sensitivity (SEN) [38], positive predictive value (PPV) [39], negative predictive value (NPV) [39], and F1-score [38], were calculated based on the results from model validation. These metrics provide a comprehensive assessment of the model’s overall predictive performance.
(2)
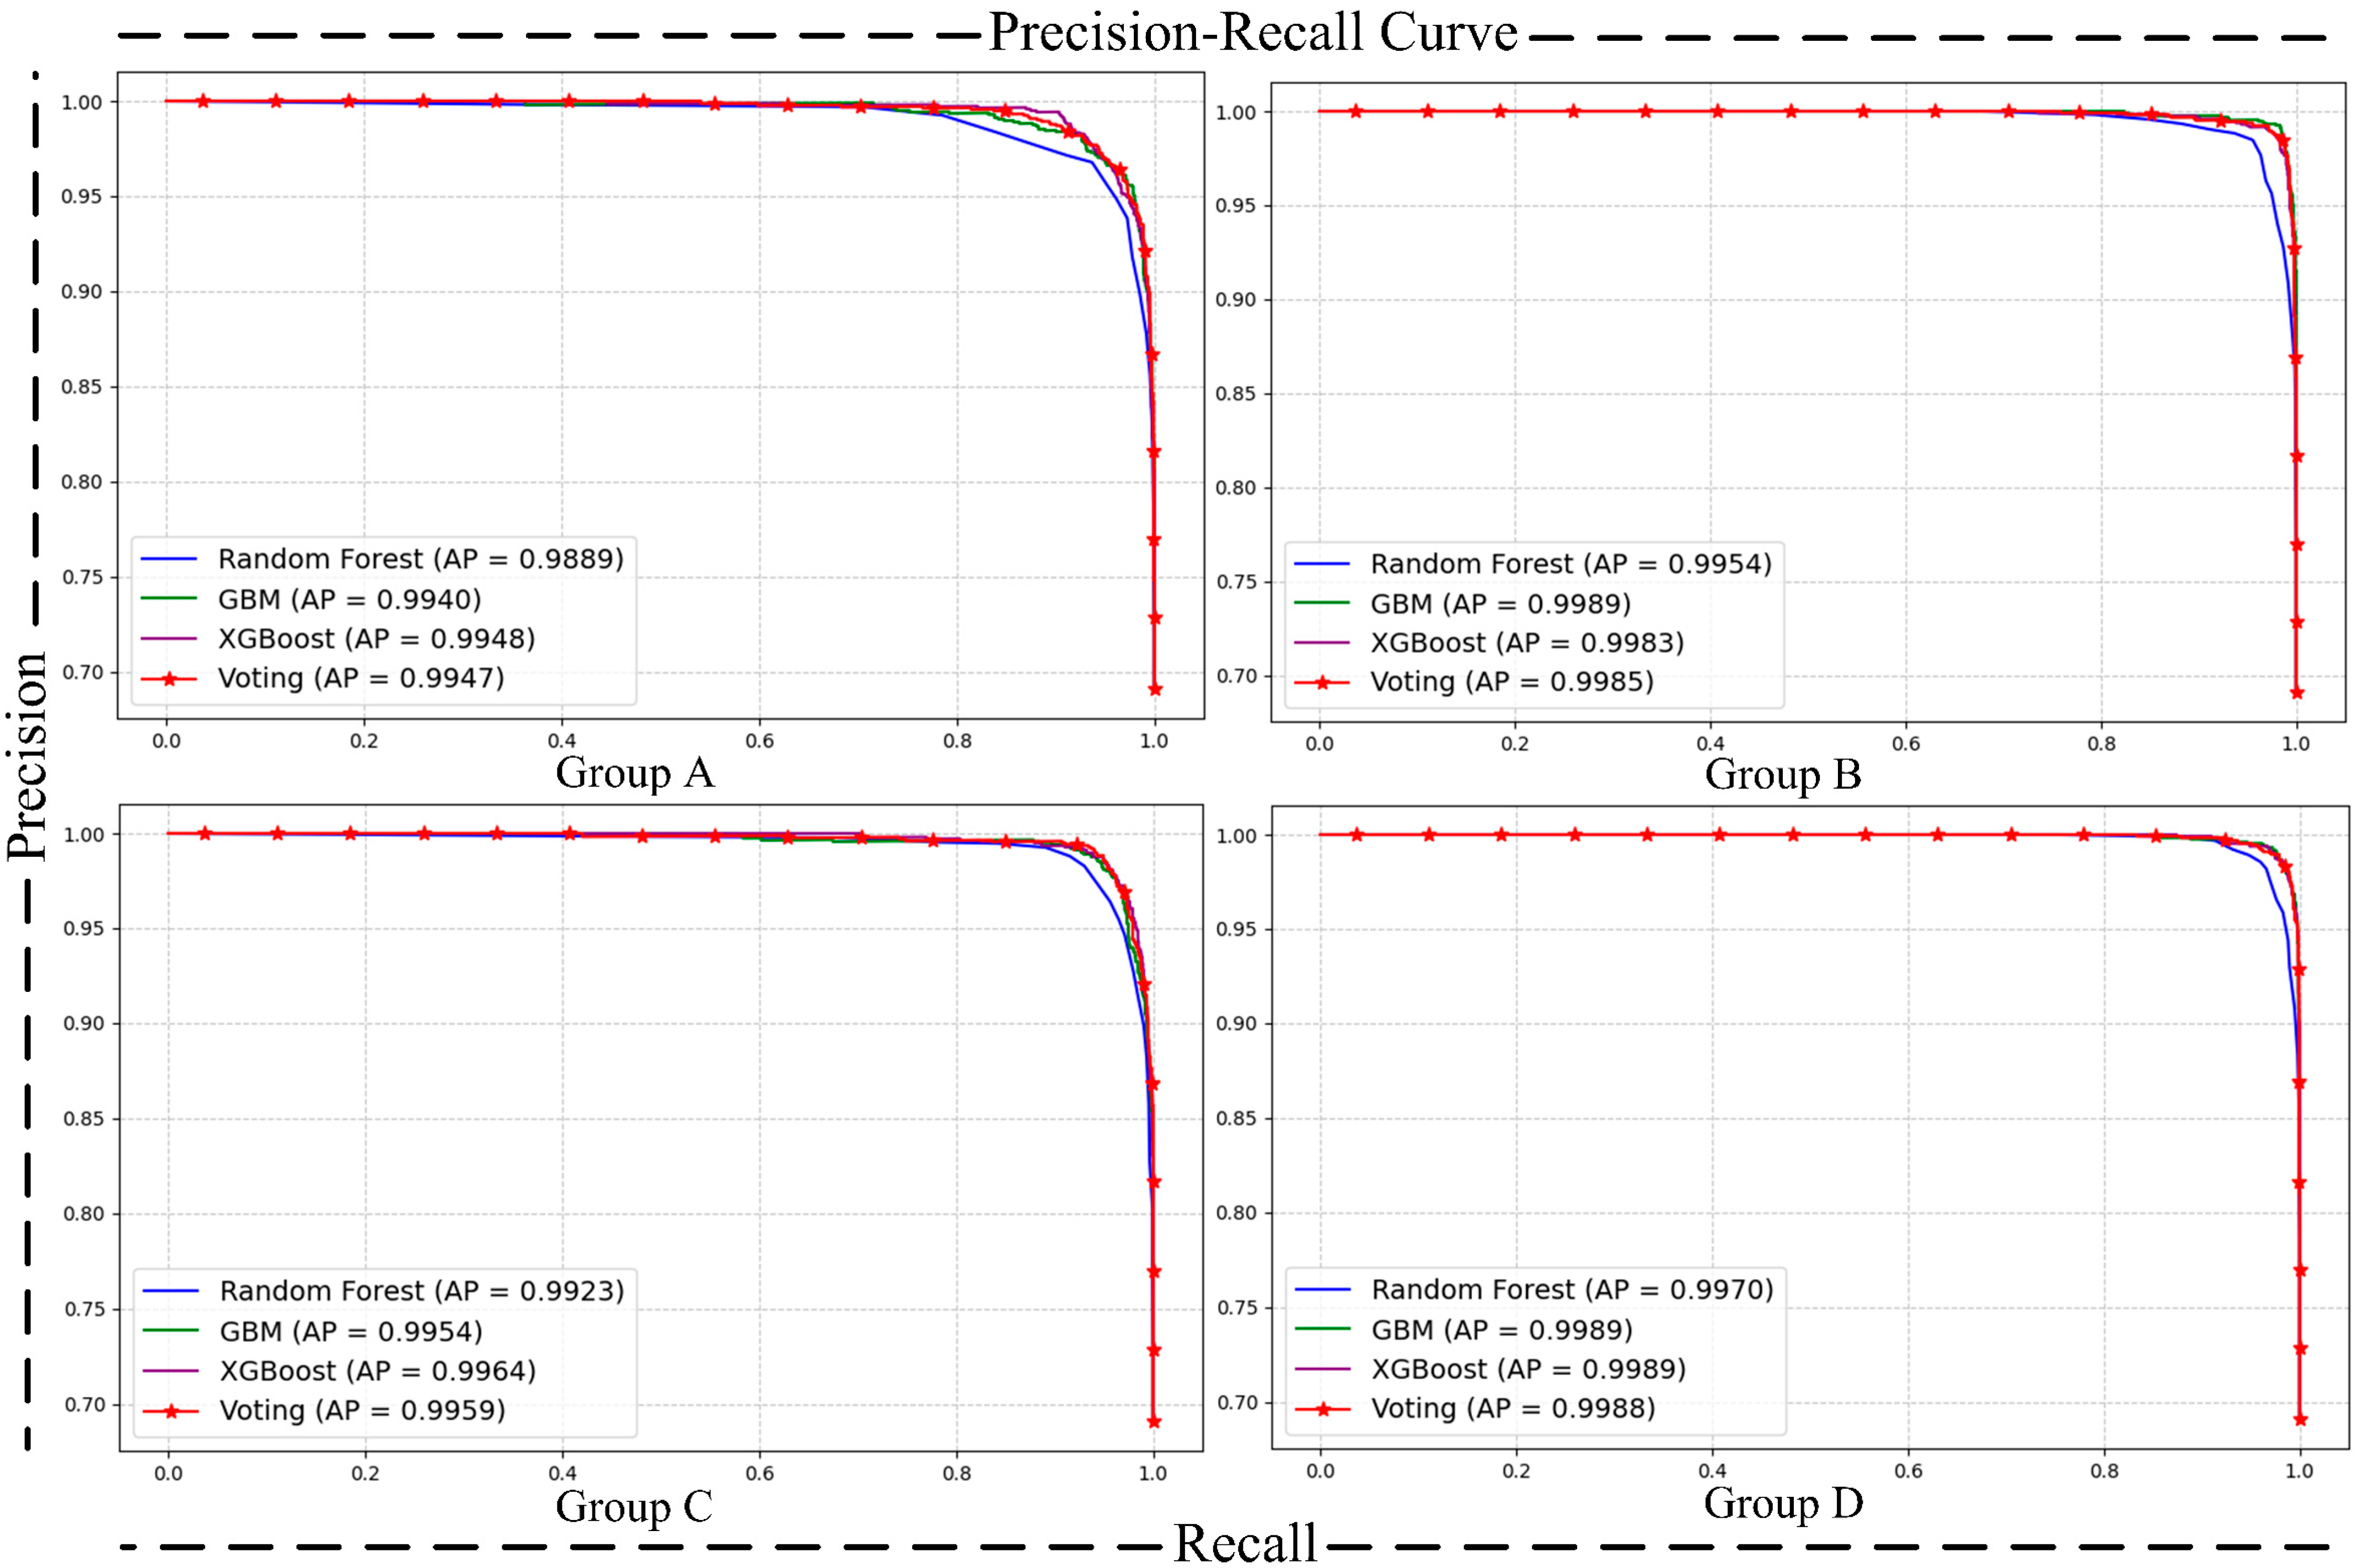
Matrix [38] and Precision–Recall (P-R) Curve [40]: The confusion matrix and P-R curve provide valuable insights into the model’s performance, especially in imbalanced class distributions. The confusion matrix breaks down the classification results into true positives, true negatives, false positives, and false negatives, allowing for the calculation of metrics like precision, recall, and F1-score, which highlight the model’s ability to correctly identify the positive class. The P-R curve evaluates the trade-off between precision and recall at different thresholds, providing a clearer view of the model’s performance in detecting minority (positive) cases. Together, these tools complement the limitations of basic metrics and ensure good performance of the model on the positive class.
(3)
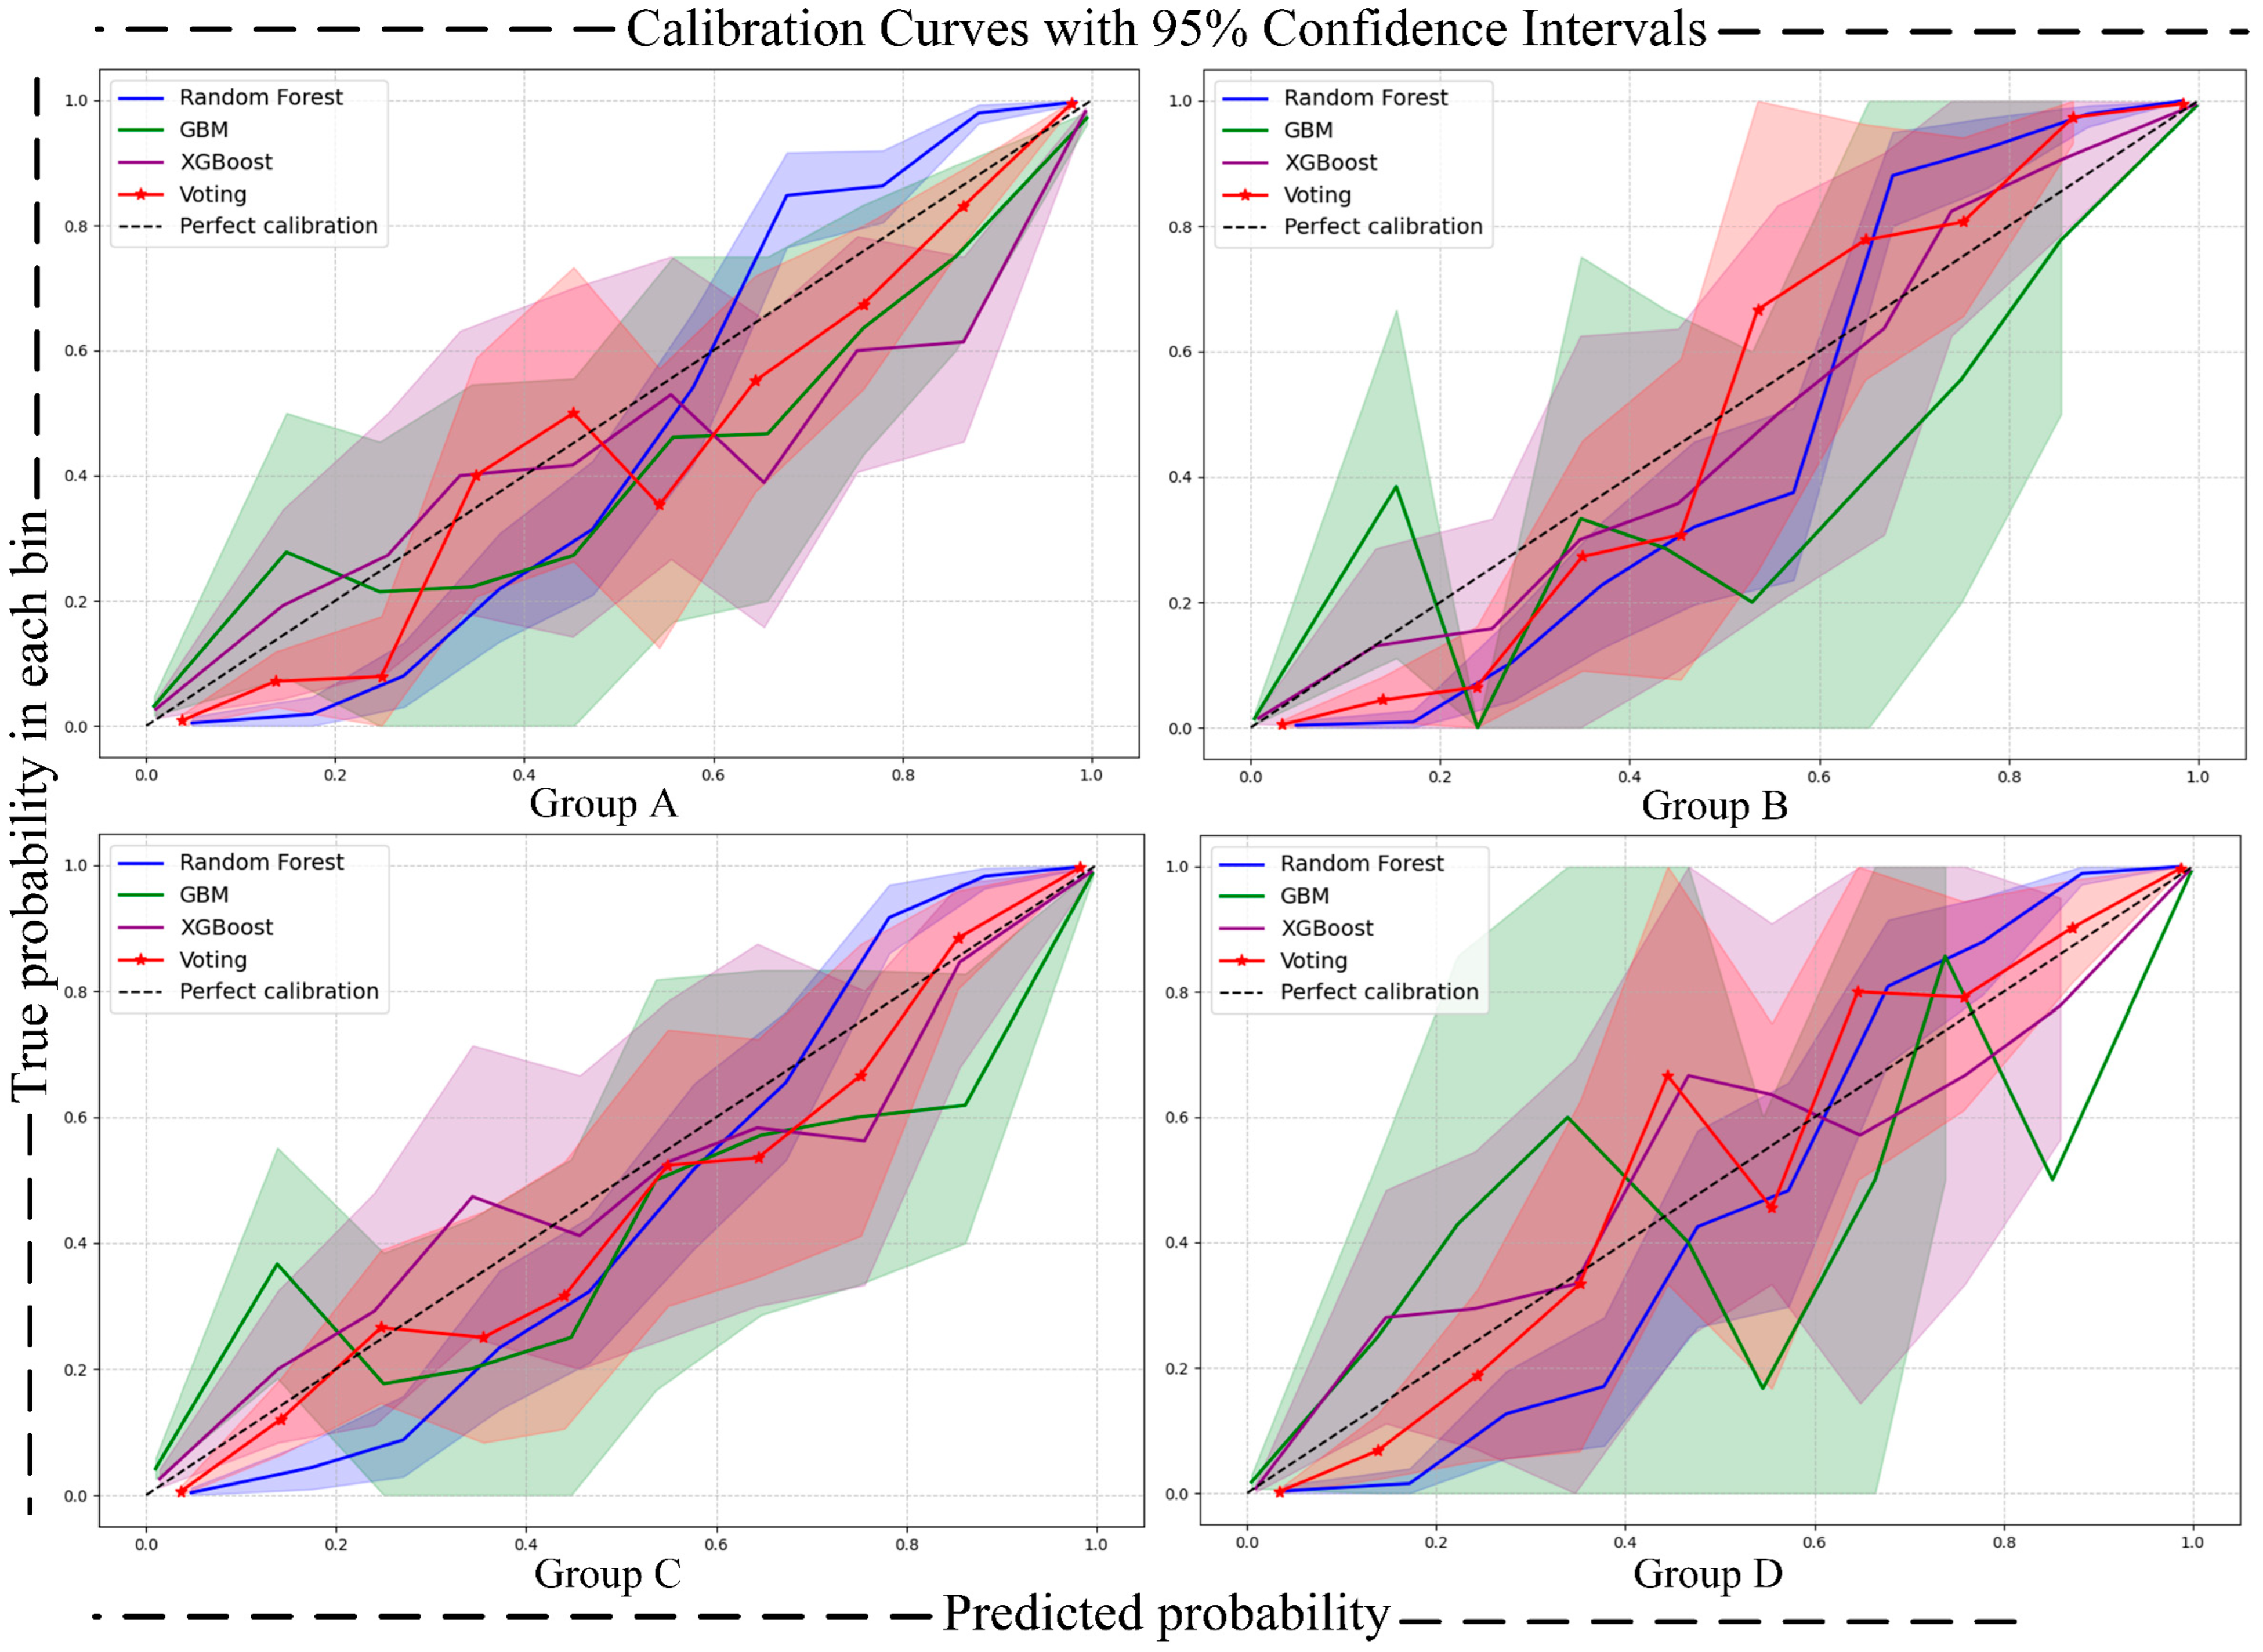
Calibration Curve [41]: The calibration curve is used to assess the alignment between the predicted probabilities and the actual occurrence probabilities of a classification model. In the calibration curve, the x-axis represents the predicted risk, while the y-axis represents the observed risk. By comparing the position of the calibration curve with the 45-degree diagonal line, the calibration performance of the model can be evaluated. This reflects the model’s accuracy in predicting the probability of an event occurring. To quantify uncertainty, we calculated 95% confidence intervals (CIs) for the calibration curves using the bootstrap method, which were then visualized as shaded areas around the calibration curves. This approach provides a comprehensive assessment of the model’s calibration performance and the uncertainty associated with predicted probabilities.
(4)
DCA Curve (Decision Curve Analysis) [42]: Decision Curve Analysis (DCA) is a method for evaluating the clinical utility of classification model predictions under various disease risk thresholds. The x-axis represents the threshold probability, and the y-axis represents the net benefit. DCA evaluates the utility of different models and disease risk thresholds, assisting in the selection of the most suitable classification model and the optimal threshold. The clinical utility of the model is typically assessed by calculating the area under the curve (net benefit) and comparing the DCA curves across different models. Similarly to the calibration curve, a similar approach was adopted in plotting the DCA curve to further quantify uncertainty, with the uncertainty also visualized as shaded areas around the DCA curve.
(5)
Brier Score [43] and Expected Calibration Error (ECE) [44]: To further quantify the uncertainty in model predictions, we introduce two key uncertainty quantification metrics: the Brier score and ECE. The Brier score measures the overall accuracy of probability forecasts by calculating the mean squared error (MSE) between predicted probabilities and actual outcomes, as shown in Formula (1): pi is the probability that the model predicts sample i as the positive class, oi is the actual label of sample i, and N is the total number of samples. The ECE quantifies the degree of miscalibration in the predicted probabilities by dividing them into several bins and calculating the difference between the average predicted probability and the actual positive rate within each bin. The overall error is then obtained by taking a weighted average, as shown in Formula (2): |Bm| is the number of the sample of the m-th probability interval, avgm (p) is the average predicted probability within this interval, and accm is the actual accuracy (proportion of positive cases) within this interval. The Brier score is complemented by a 95% confidence interval, which also quantifies the uncertainty of the model and is computed using bootstrap sampling. By combining these uncertainty metrics, we can more comprehensively assess the reliability of the model, ensuring better predictive performance and robustness in real-world scenarios.
B r i e r   s c o r e = 1 N i = 1 N p i o i 2
E C E = m = 1 M B m N a v g m p a c c m
(6)
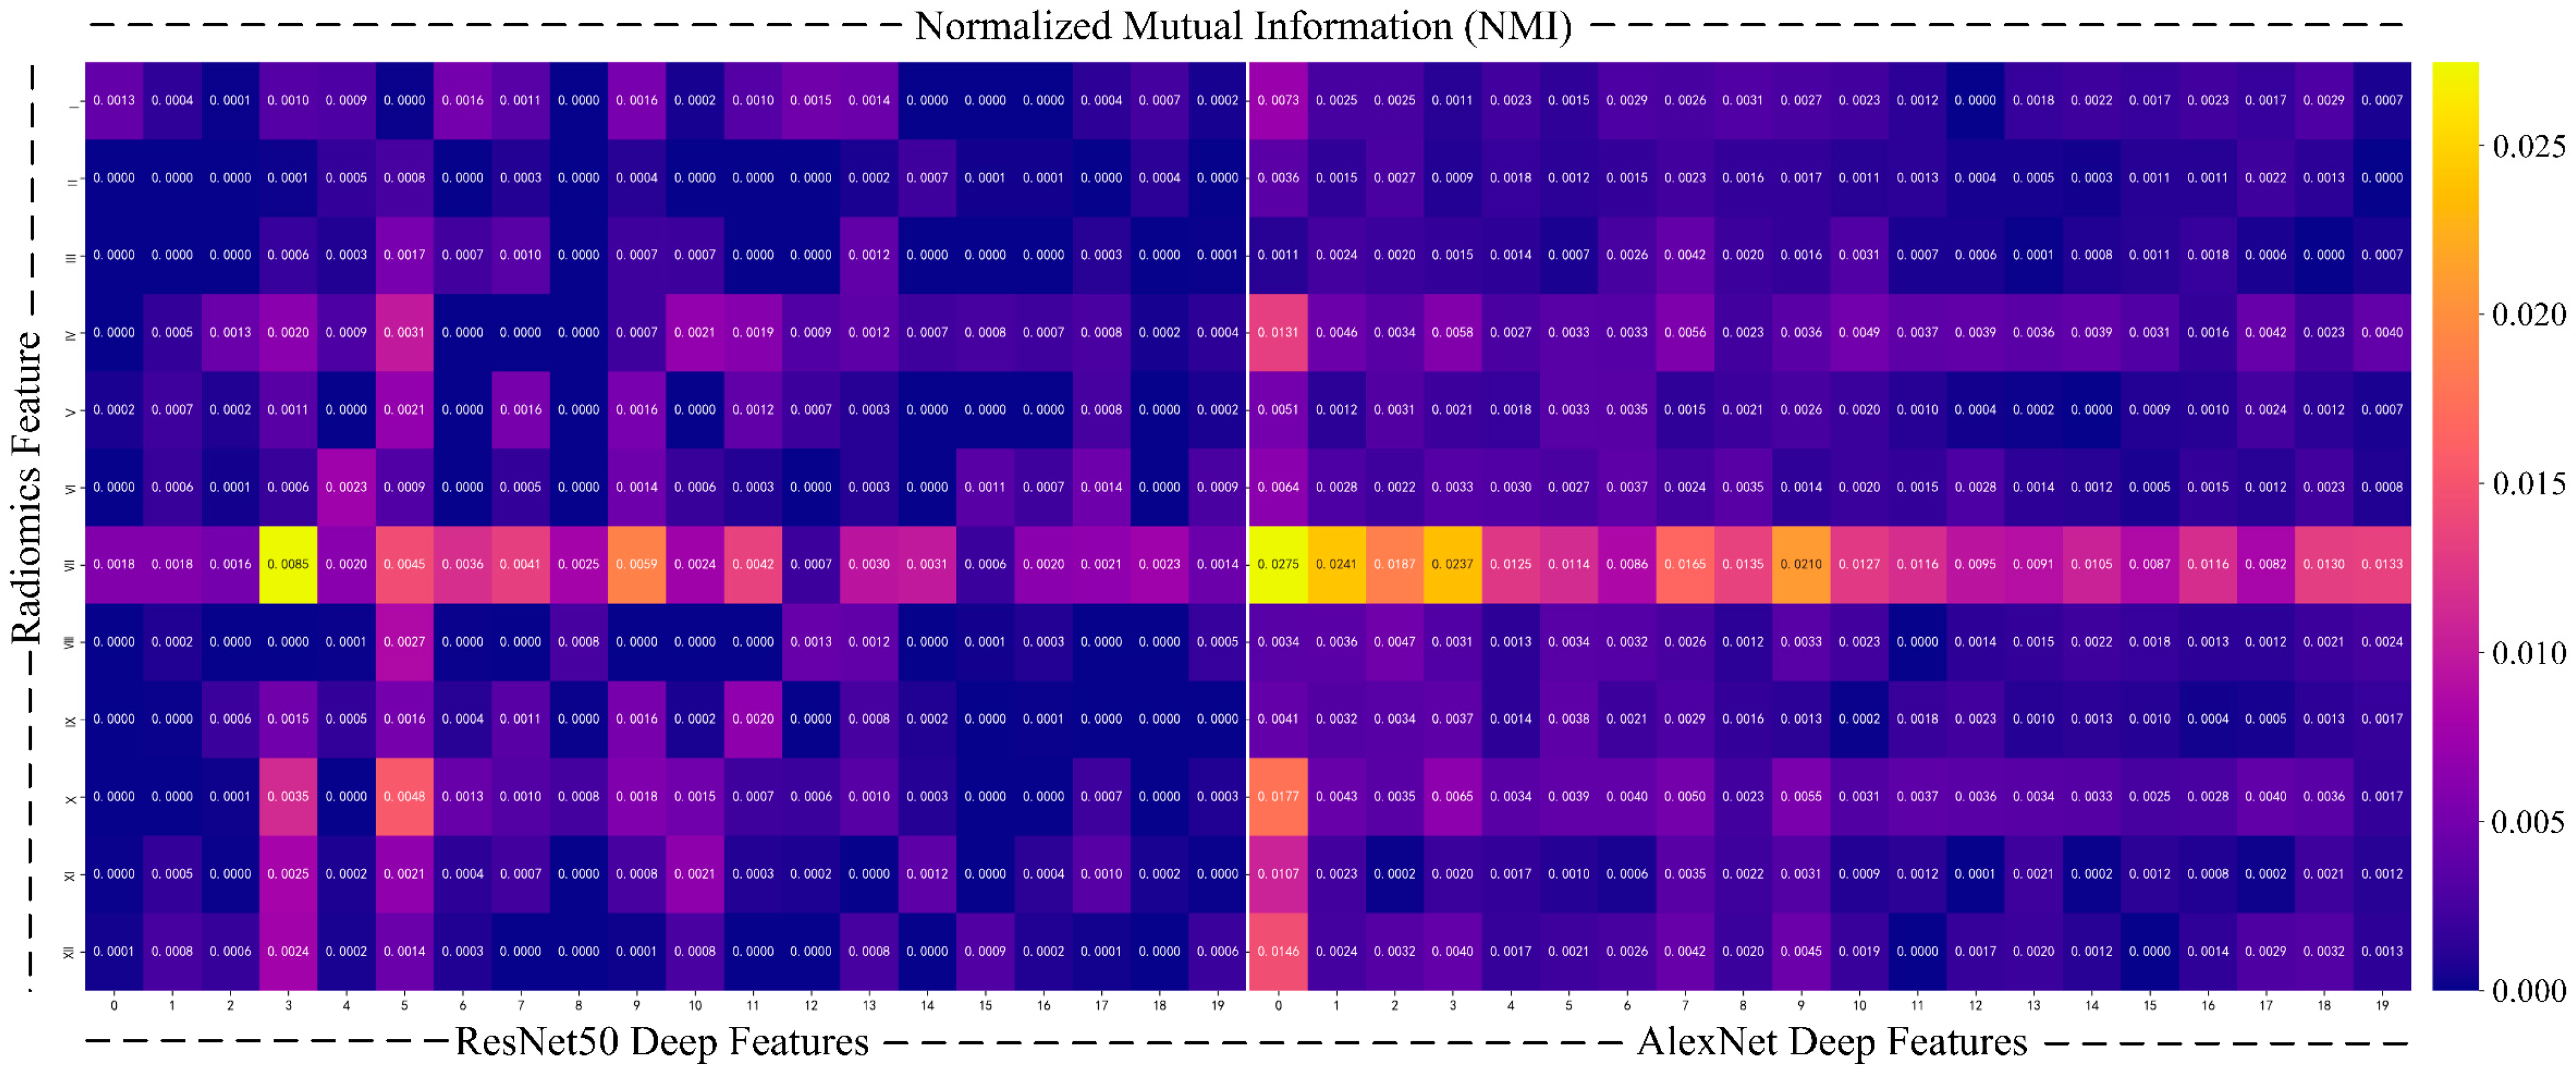
To further enhance the interpretability of the model, we use normalized mutual information (NMI) [45] to quantify the relationship between deep features and radiomics features. Mutual information is a commonly used metric to measure the amount of shared information between two variables, revealing their correlation, especially when the relationship between the two types of data is not explicitly clear. To avoid biases caused by differences in data scale and feature count, we chose NMI, which normalizes the mutual information values to a range of [0,1], ensuring a fair comparison between different feature sets.

4.4. Experiment Results and Analysis

4.4.1. Deep Feature Extraction Results

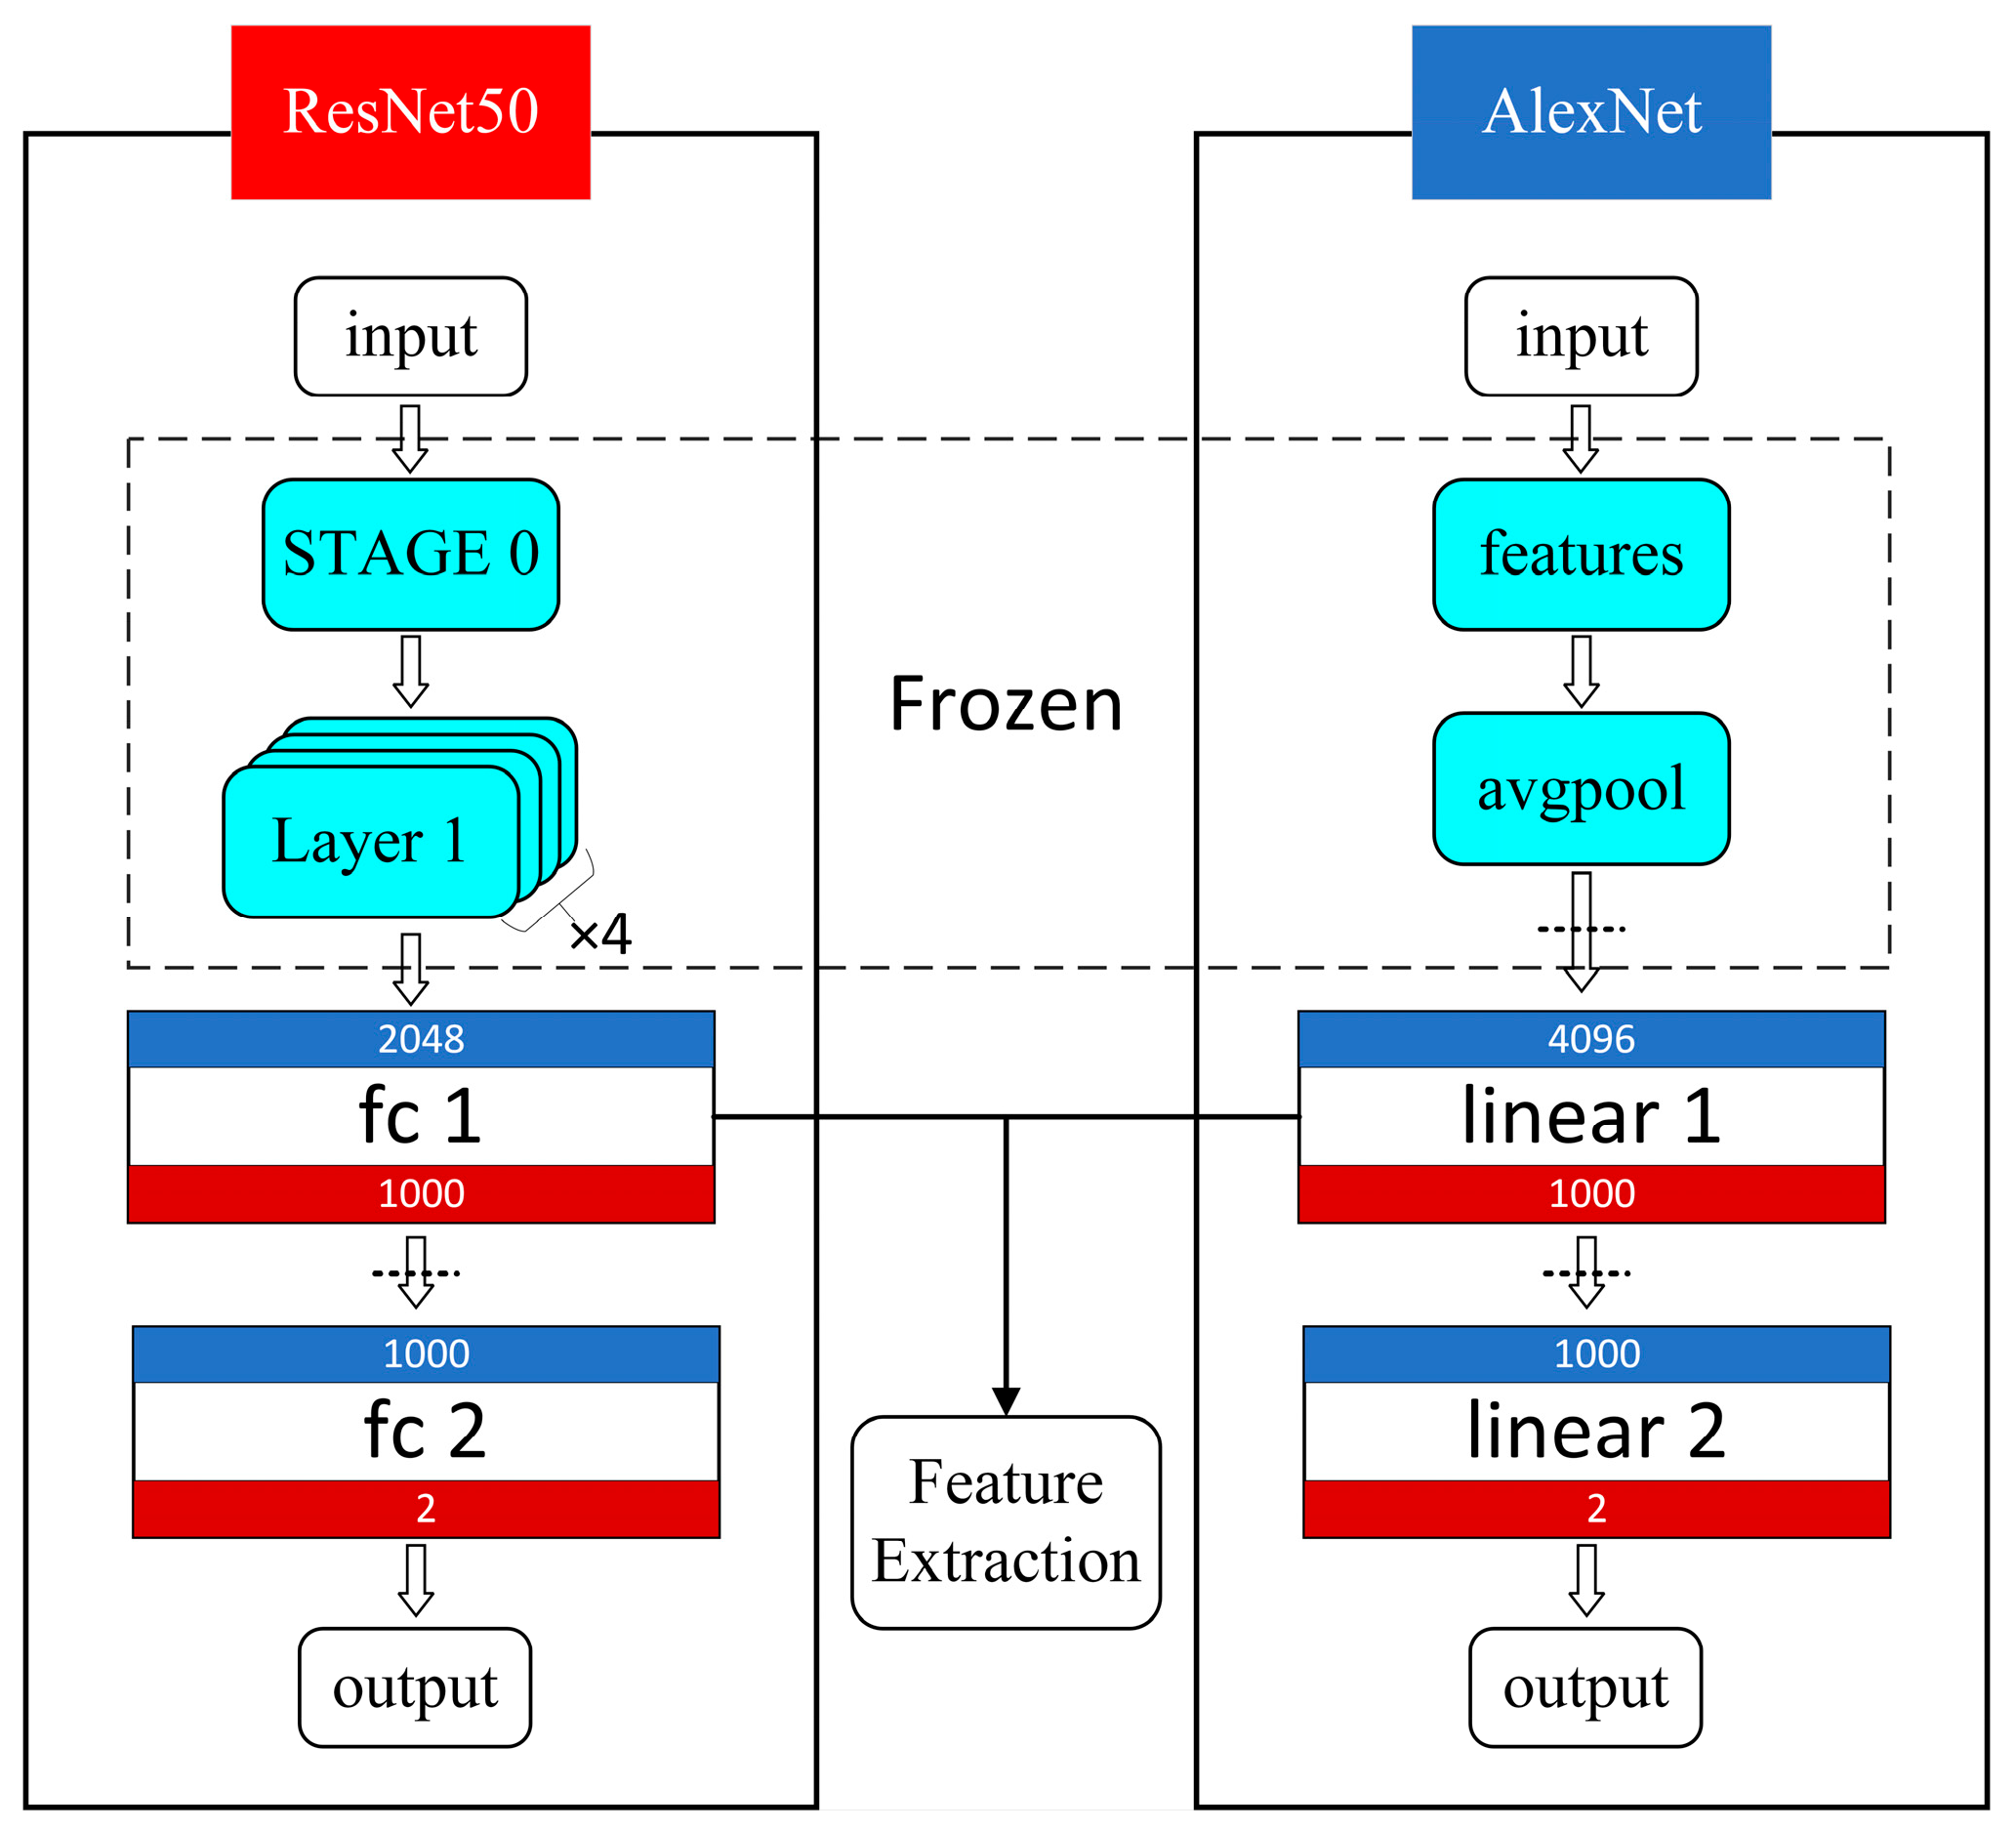
Our framework innovatively adapts classical architectures into an occupational health-oriented pipeline through three key enhancements. The fully connected layers of the pre-trained ResNet-50 and AlexNet models, originally trained on ImageNet, were modified to facilitate deep feature extraction, as shown in Figure 4. Specifically, the output nodes of the second-to-last layer were adjusted to 1000 to enable the extraction of deep features, while the output nodes of the final layer were set to 2 to match the requirements of the binary classification task. To implement transfer learning, the weights of the original network structure were frozen, and only the modified fully connected layers were locally trained. Through iterative optimization, the batch size was set to 32, with a total of 100 training epochs. The cross-entropy loss function was employed, and stochastic gradient descent (SGD) was used as the optimizer. As a result, 1000 deep features were extracted from each model.
These two sets of deep features were then standardized and subjected to dimensional reduction using Principal Component Analysis (PCA). The dimensional reduction retained 20 principal components, which were chosen based on the cumulative explained variance ratio. This process ensured that the selected components captured approximately 90% of the total variance, effectively preserving the most significant information from the original features while significantly reducing the model training burden. By using 20 principal components, we successfully reduced the feature dimension while retaining the most subtle and essential characteristics of the images, thereby improving both computational efficiency and the model’s generalization performance.

4.4.2. Radiomics Feature Selection Results

Among the 669 radiomics features, a t-test was first performed to remove redundant features, resulting in 574 features with homoscedasticity. Subsequently, using the Least Absolute Shrinkage and Selection Operator (LASSO) method with 5-fold cross-validation, the optimal alpha parameter was determined (α = 4.394 × 10⁻⁵). This procedure led to the identification of the top 12 most significant features. To facilitate description and interpretation, these selected features were numbered, with their corresponding indices, image characterization properties, and weight values provided in Table 4.
These 12 features, derived through various mathematical transformations and statistical methods, effectively capture the characteristics of lung nodules from multiple perspectives, including different frequency bands, spatial scales, and gray-level distributions. By introducing these features with descriptive characteristics, the interpretability of the proposed algorithm is significantly enhanced, as these features correspond to physical properties of lung nodules that have meaningful clinical significance.

4.4.3. Model Evaluation

In this experiment, clinical annotated feature encoding was performed using two methods: binarization and One-Hot encoding. The pre-trained networks used for transfer learning were ResNet-50 and AlexNet. For clarity and consistency, the experimental groups are defined in Table 5:
(1)
Prediction Metrics
The ACC, SPE, SEN, PPV, and NPV of the ensemble model were calculated on the test set to evaluate its predictive performance. The corresponding metrics are summarized in Table 6. The experimental results demonstrate that the ensemble model performed excellently across multiple evaluation metrics. Specifically, for Group B and Group D, the following results were achieved: AUC: 99.76% and 99.74%, respectively; ACC: 97.85% and 97.79%, respectively; SEN: 96.01% and 96.51%, respectively; SPE: 98.66% and 98.29%, respectively; PPV: 98.23% and 98.44%, respectively; NPV: 96.98% and 96.19%, respectively. These results preliminarily validate the effectiveness of the proposed method in enhancing both the stability and accuracy of the model’s predictions. In addition, the model’s uncertainty quantification metrics (Brier score and ECE) further validate its predictive reliability: the Brier scores for the four model groups remain stable around 0.03, which is an excellent score, indicating a small mean squared error between the predicted probabilities and actual outcomes. The ECE values range from 0.0562 to 0.0922, suggesting that the average deviation between the model’s predicted probabilities and the actual positive rate is within an acceptable range, demonstrating good calibration performance. These two metrics together show that the model maintains high predictive accuracy while offering reasonable uncertainty estimation, providing a robust probabilistic basis for decision-making in practical applications.
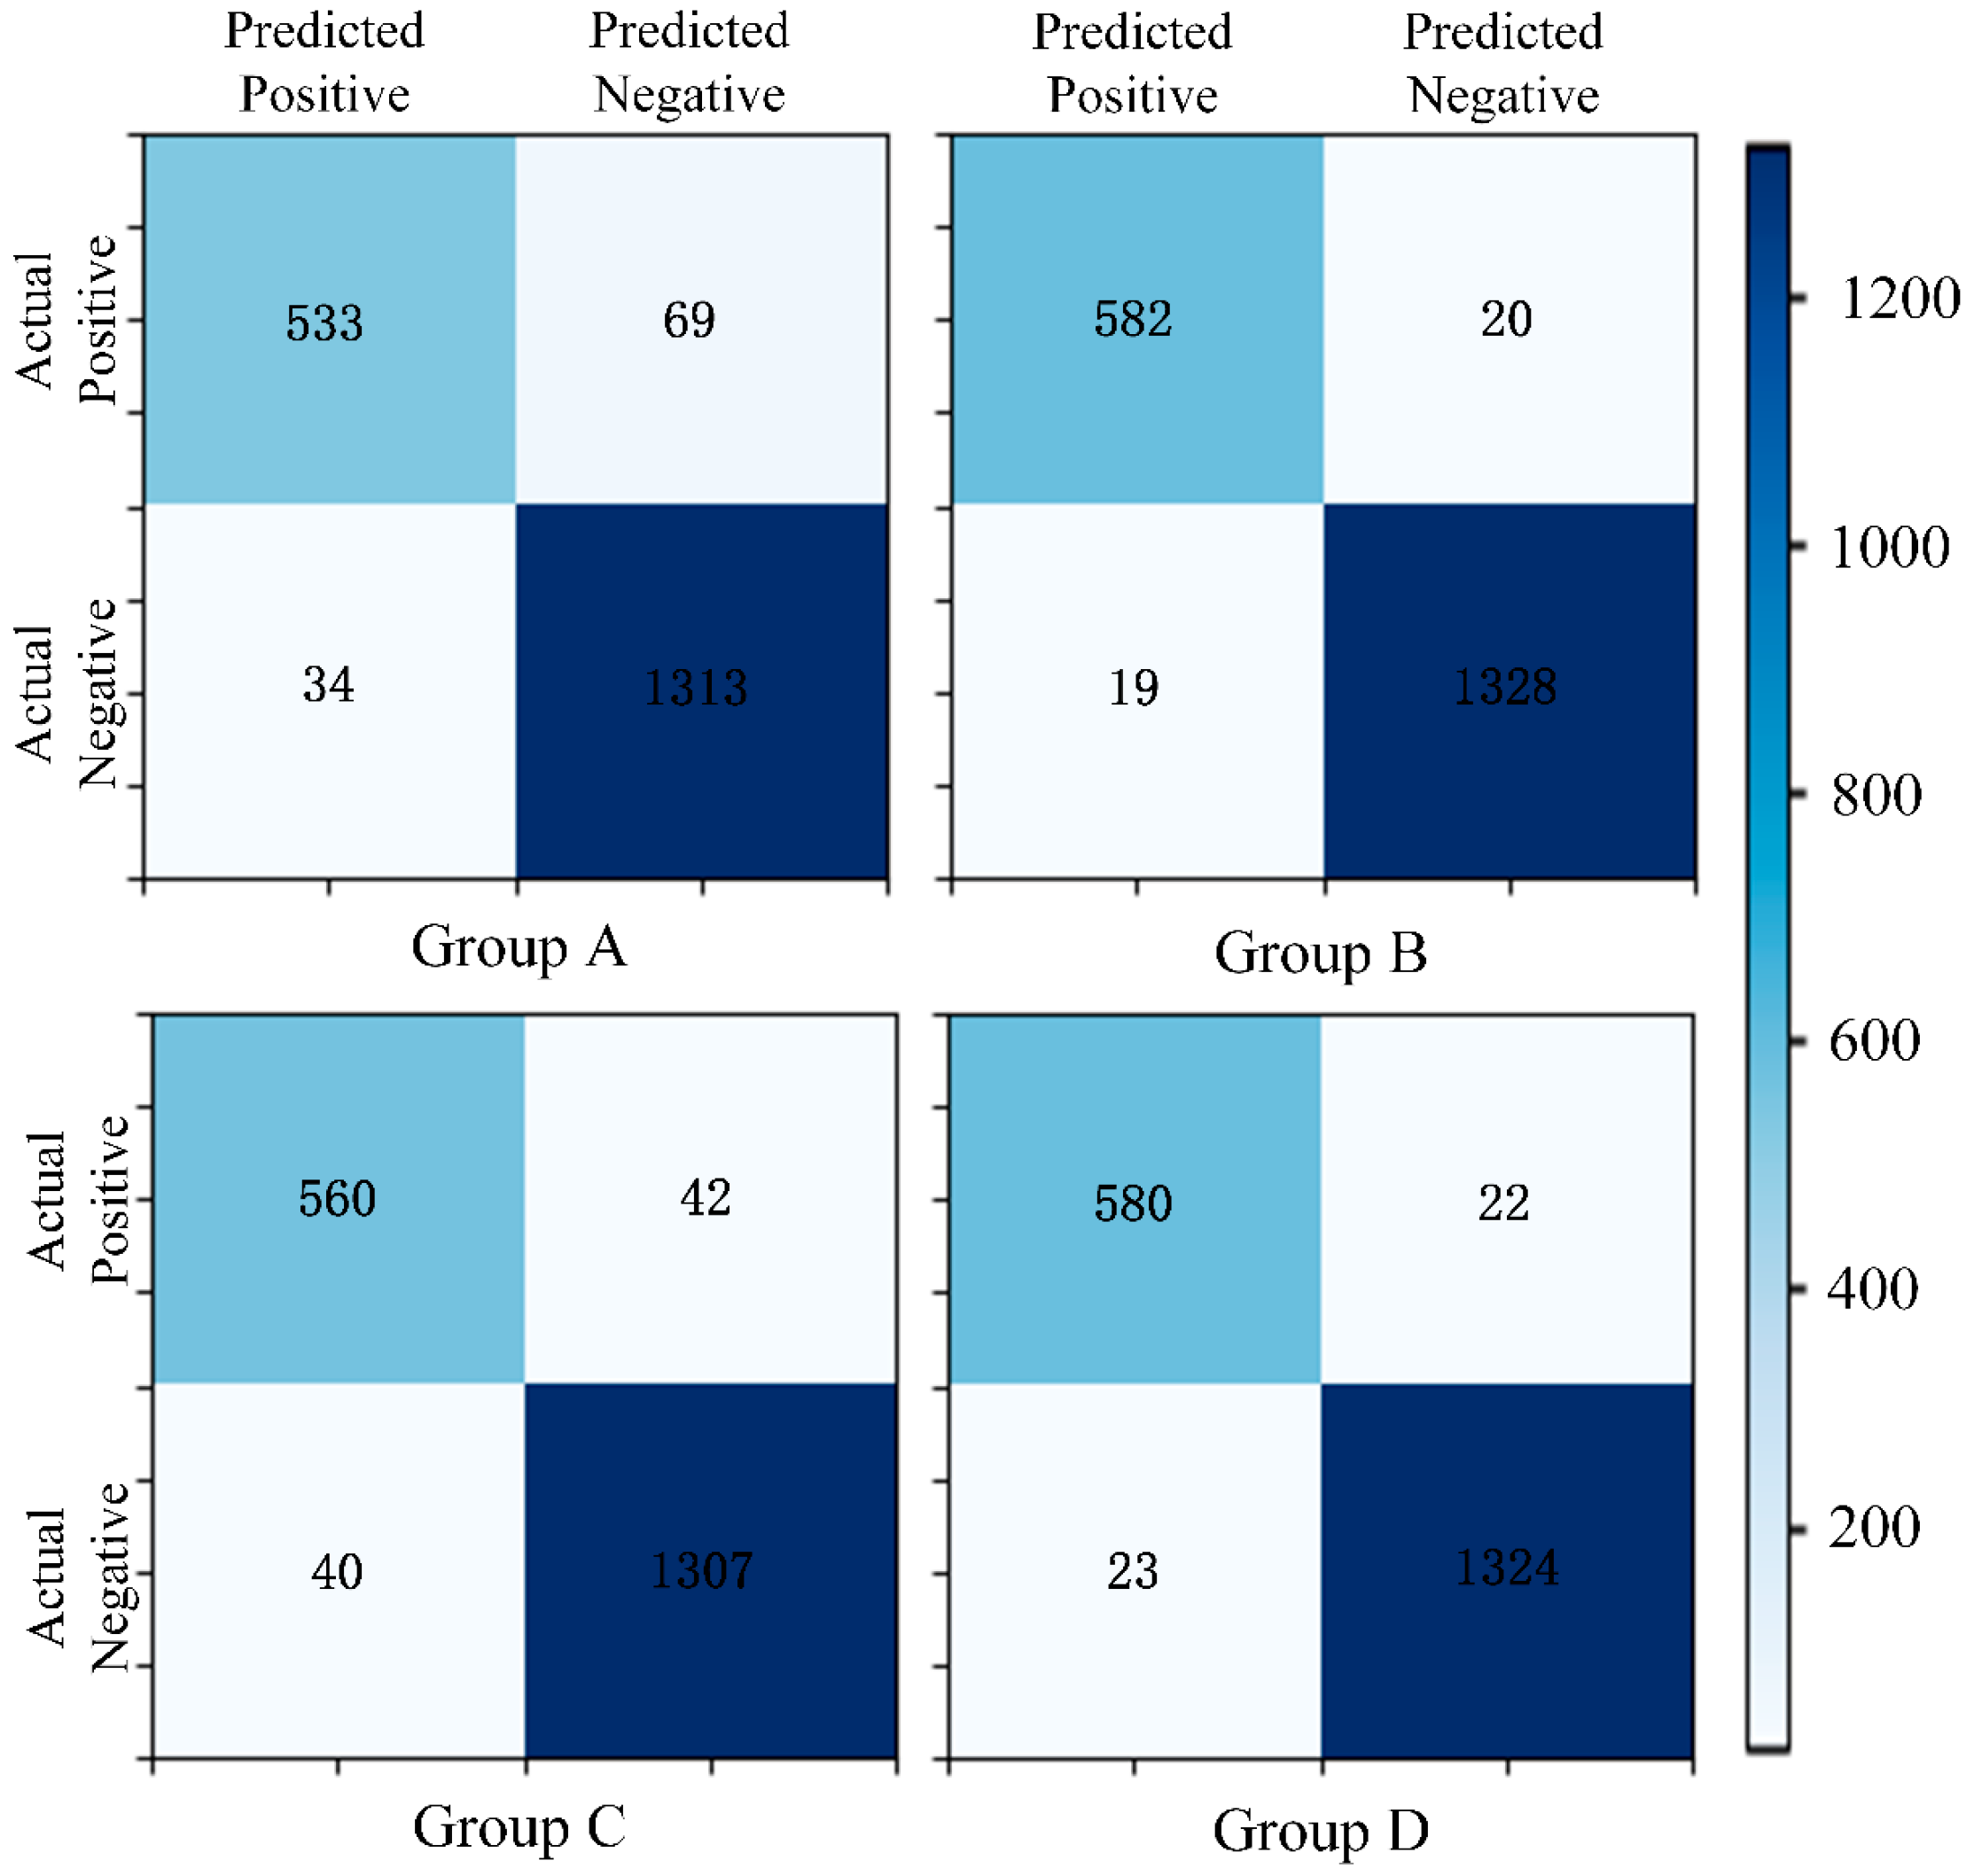
To provide a more comprehensive view of the model’s performance across each class, we present the confusion matrix, as shown in Figure 5. In this study, the dataset contains significantly more negative class samples than positive class samples, which results in relatively higher predicted values for the negative class in the confusion matrix (with darker colors in the TN region). Despite the model’s overall excellent performance and a high proportion of correct classifications, the higher number of negative class samples means the model has stronger identification capability for negative samples, which may lead to relatively weaker predictions for the positive class.
Due to the smaller number of positive class samples in the dataset, simple metrics like the AUC and ACC cannot fully capture the model’s performance on the positive class. Therefore, we further evaluate the model’s performance on the minority class (positive class) using the P-R curve, as shown in Figure 6. From the figure, it is evident that the four model groups (red curves with stars) perform exceptionally well in terms of the AP metric. In areas with low recall, the models maintain high precision, indicating that the model continues to perform well in identifying minority class samples.
(2)
Comparative Validation
The algorithm proposed in this paper was compared with state-of-the-art algorithms from relevant research conducted in the past three years, both domestically and internationally. A comparison of various performance metrics is shown in Table 7. As shown in the table, the proposed algorithm, with Group B and Group D metrics (ACC = 0.98, SPE = 0.96, SEN = 0.98), outperforms all the compared algorithms. This demonstrates the superiority of the multi-dimensional features fusion approach, which combines deep features, radiomics features, and One-Hot-encoded clinical annotated features. Although some comparative studies outperform this paper on a single metric, their ACC and SPE metrics are significantly inferior to the results of the model presented in this paper. In comparison to other mainstream algorithms from the past three years, the proposed method achieves a well-balanced performance across all evaluation metrics, with notably higher accuracy, thereby proving its competitive edge in overall performance.
(3)
Interpretability Validation
Some outstanding studies [60] have utilized visualization and comparison of the weights of features at different scales, using this strategy as an interpretability tool to clearly identify and validate the contribution of relevant features to the model’s predictions. Next, we will explore and validate the interpretability of deep features by plotting bar charts showing the weights of three types of features in the prediction process. The average feature weights from all individual classifiers were calculated to represent the feature weight for the ensemble model. To preserve the weight differences in the same feature across different classifiers, the standard deviation was computed to reflect any inconsistencies in how the classifiers evaluated that feature. This approach provided a more comprehensive view of feature importance within the ensemble model.
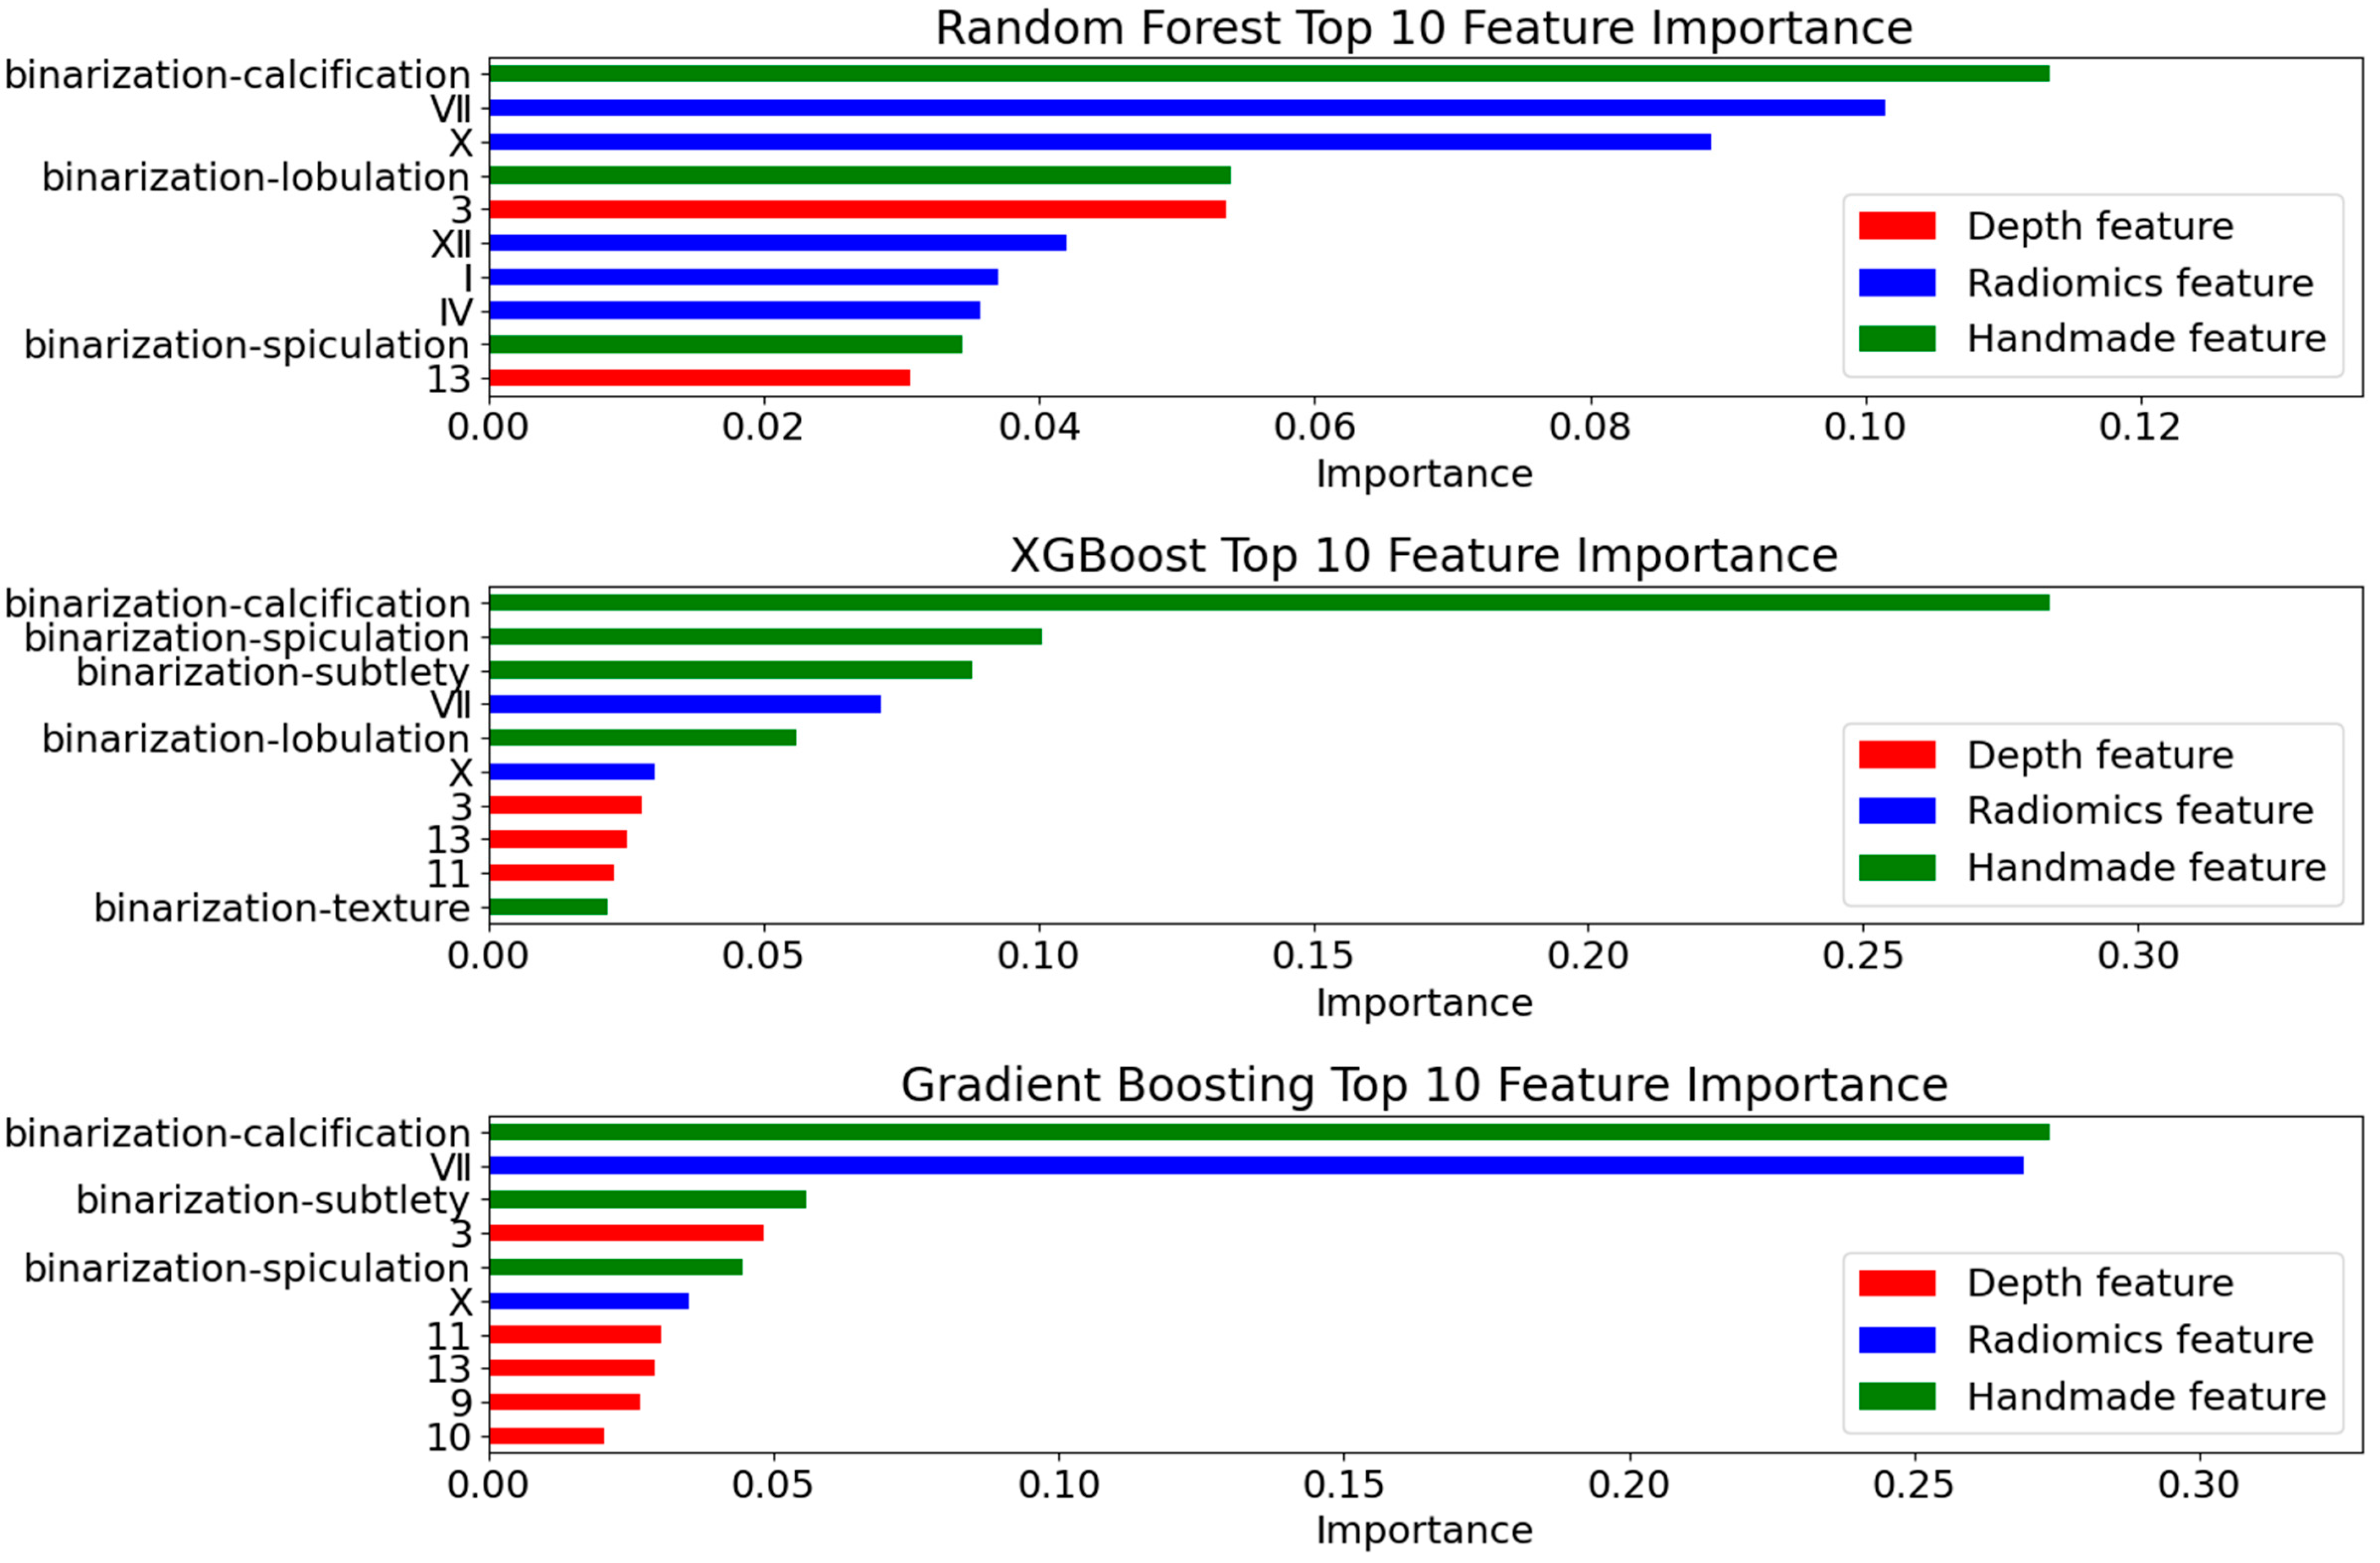
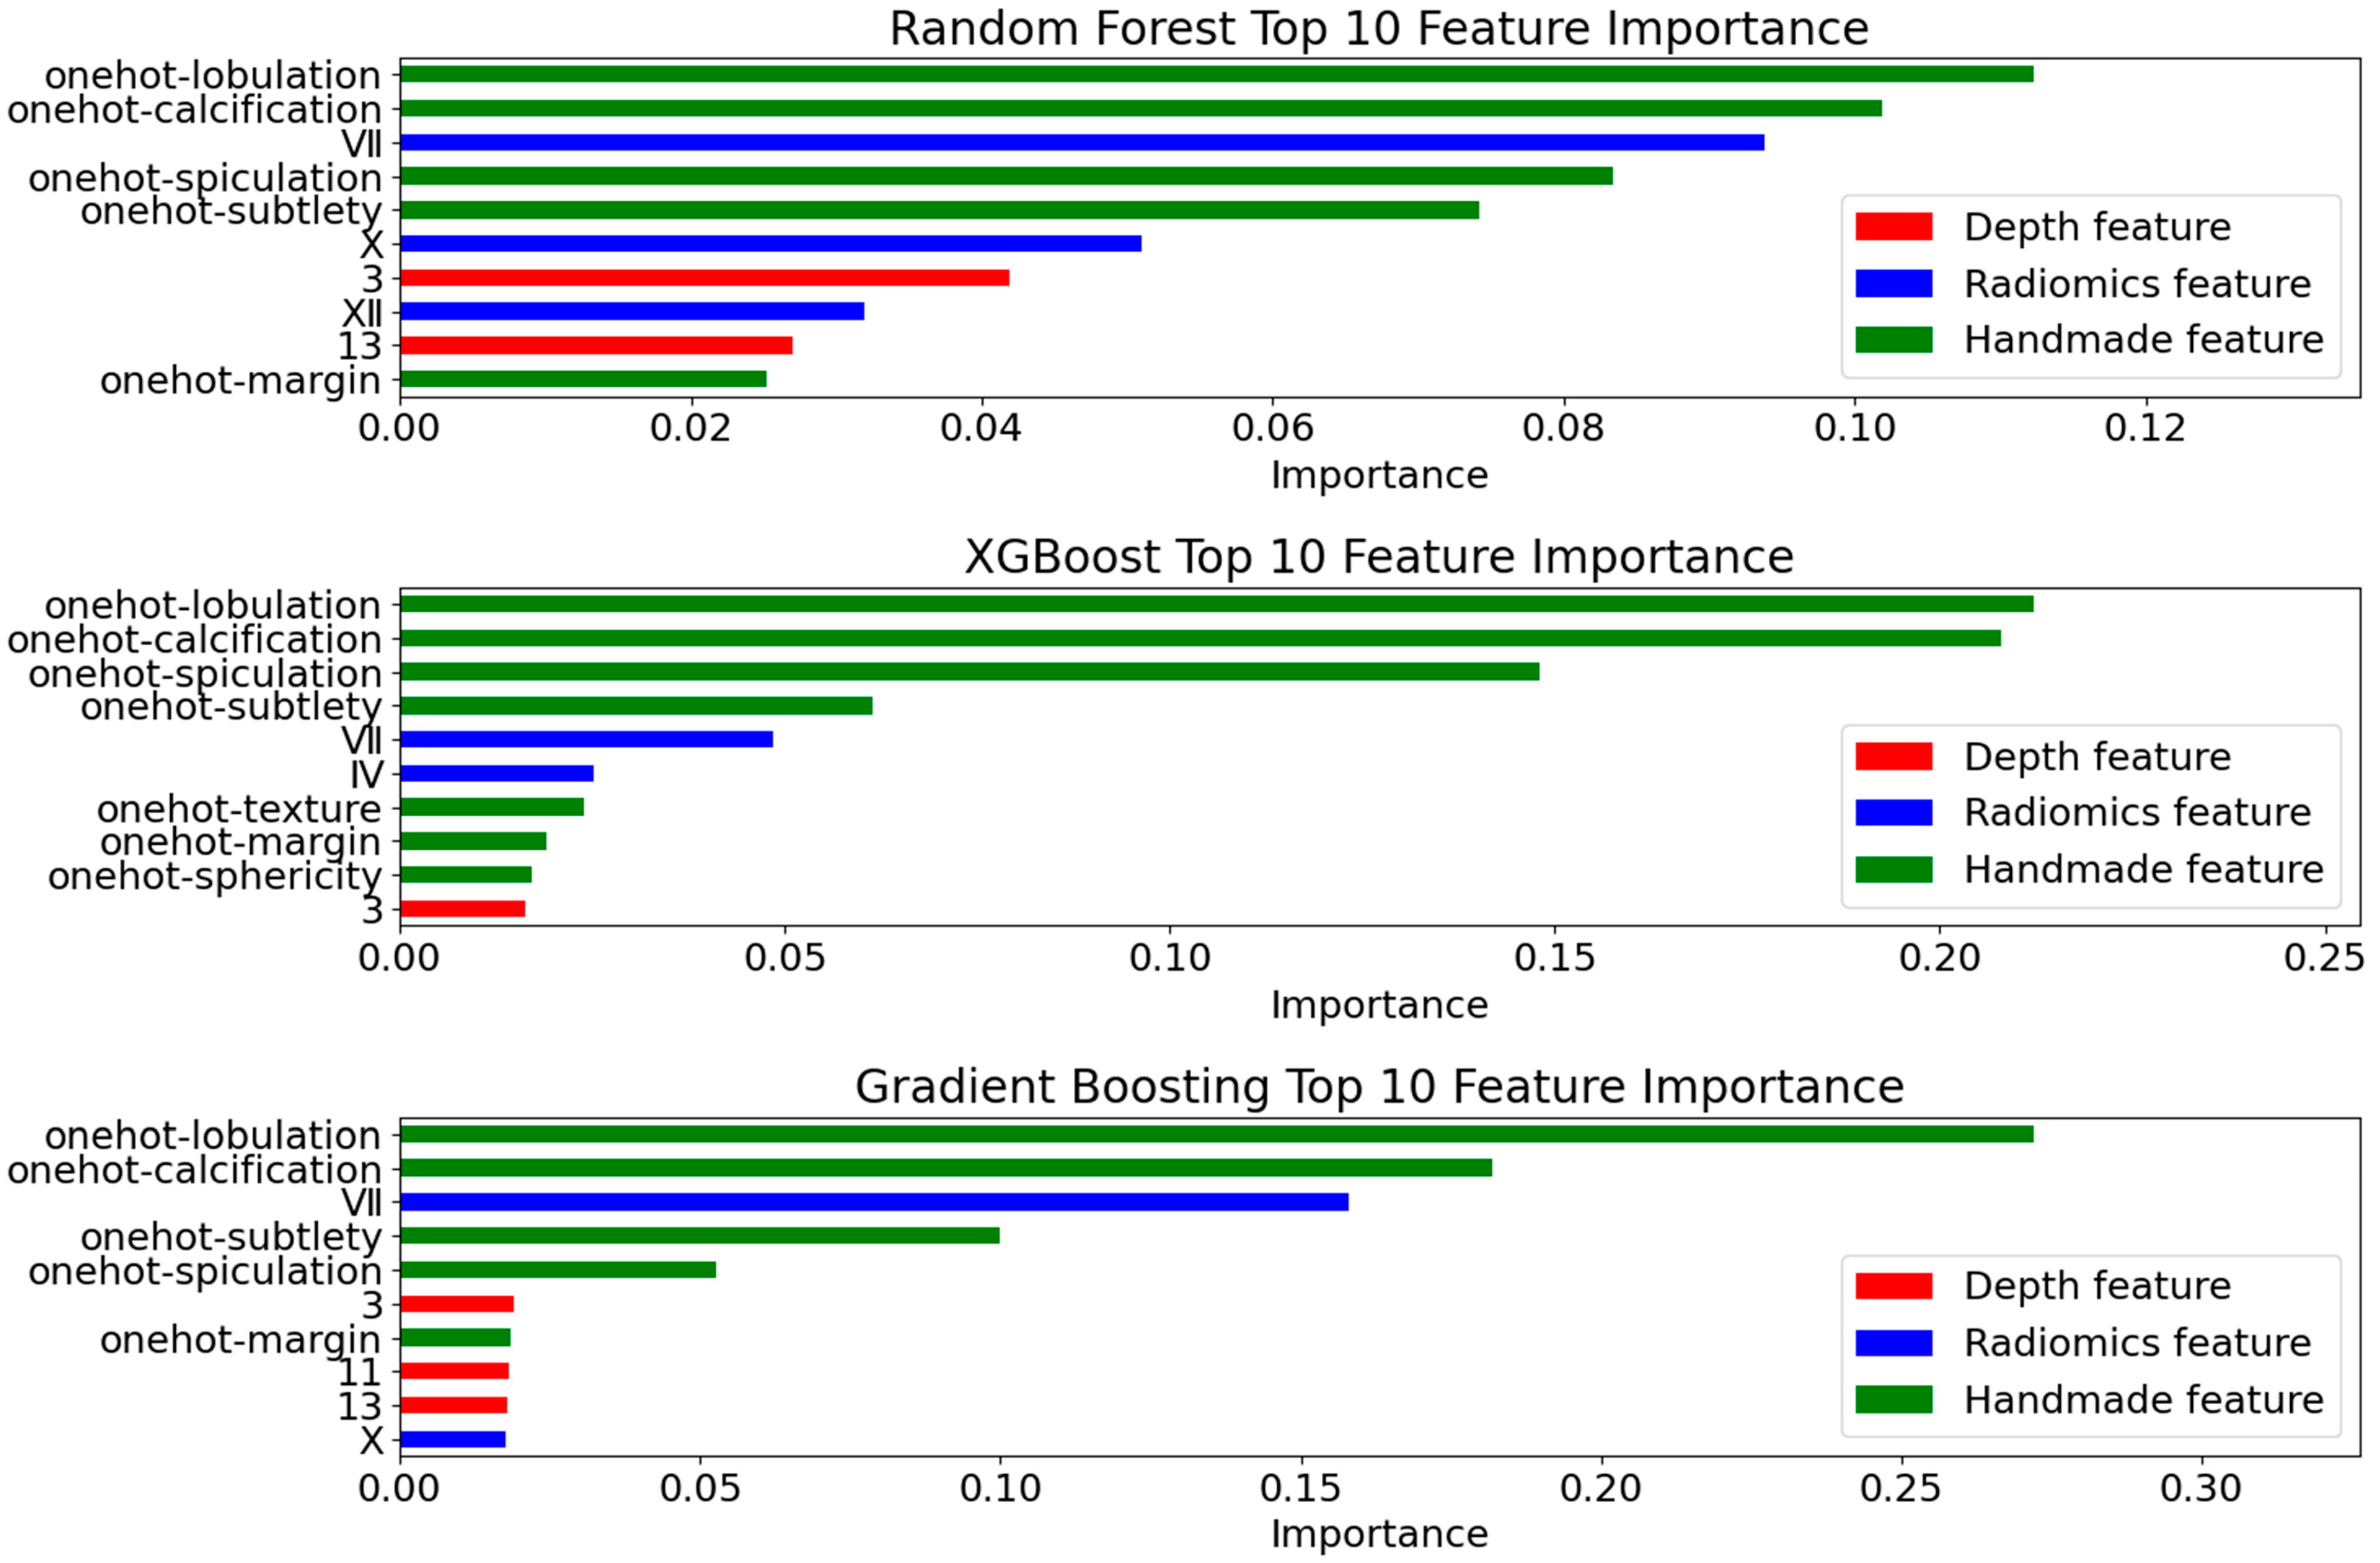
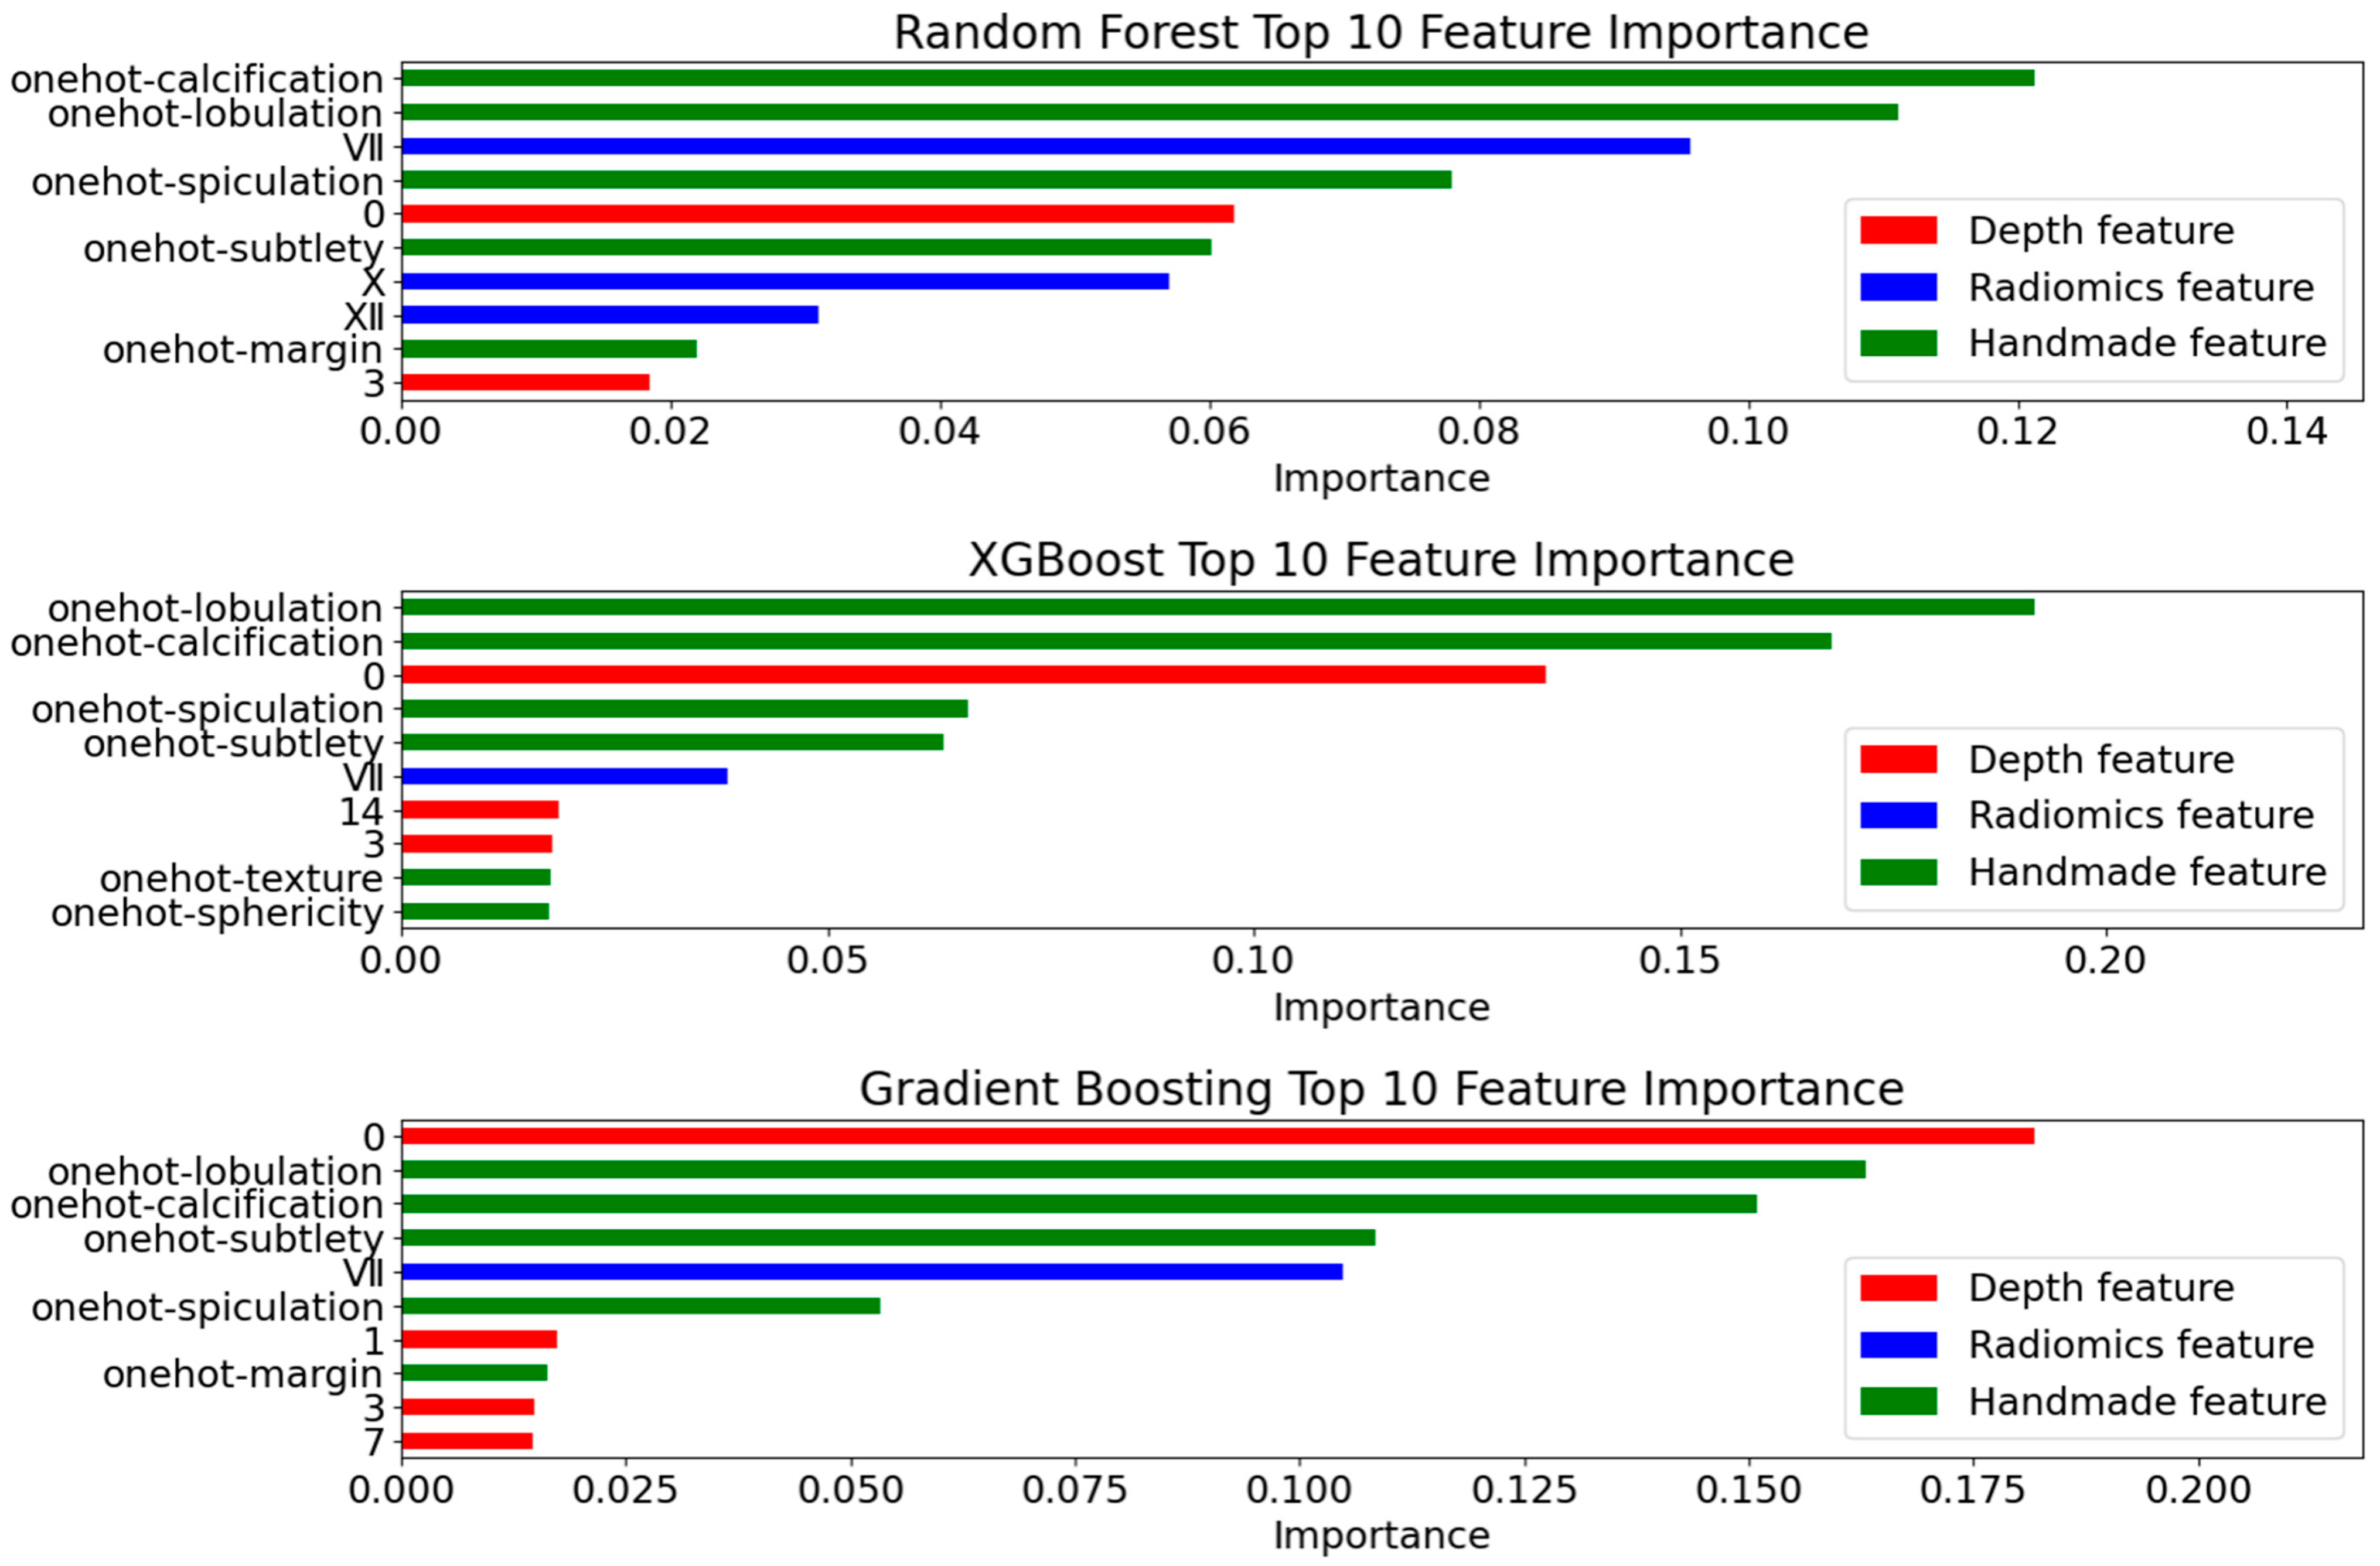
The feature weight plots for individual classifiers can be found in the Appendix A. The plots for the four ensemble models are shown in Figure 7, with the black line segments representing the standard deviation. After feature selection and fusion, a total of 39 features were retained (7 clinical annotated features, 12 radiomics features, and 20 deep features). Among the top 15 features across all four ensemble models, deep features consistently accounted for at least one-third of the features. In Groups C and D, deep features even ranked among the top three. This highlights the significant role that deep features play in the composite decision-making process of the model post-fusion. Further, in the individual classifier feature weight plots in Appendix A, deep features also consistently exhibit significant weight. These results confirm that deep features provide reliable and consistent information for classification. Their interpretability lies in the fact that these features capture patterns similar to those of “clinical features,” such as complex textures and abstract semantic information in the image data. These patterns contribute substantially to the classification performance across different model frameworks.
To further explore the correspondence between the deep feature extraction results and clinical indicators, and thereby enhance the interpretability of the model, we computed the NMI values for two sets of deep features and radiomics features, as shown in Figure 8. We found that the seventh radiomics feature (original_shape2D_MinorAxisLength) stands out with a significantly higher NMI value compared to the other features, suggesting that there is shared information between the deep features and those with actual physical characteristics. In addition, several other feature pairs also exhibit notable associations, indicating potential underlying relationships. This finding provides valuable insights for interpreting deep features and enhances the model’s interpretability.
It should be noted that as the number of features increases, the relationships between features become sparser and more complex, which means that even if certain features show statistically significant correlations, their mutual information values may still be relatively low. The normalization process ensures that this comparison is fair, and from the results, we can conclude that this relationship is not due to noise or random coincidence.

4.4.4. Ablation Experiment

An ablation experiment was conducted using Group B as an example to validate the effectiveness of multi-dimensional features and ensemble learning strategies. To minimize potential errors, the model that did not use the ensemble learning strategy was evaluated using Random Forest (RF).
As shown in Table 8, the first row presents the validation results when the model is trained using only the clinical annotated features. The second row shows the fusion of selected radiomics features with clinical annotated features. This feature fusion, which integrates information from different scales, resulted in a 1.64% improvement in the ACC and a 1.5% improvement in the SPE. The third row represents the fusion of deep features with clinical annotated features, but the performance was sub-optimal, with all three metrics exhibiting a decline. The fourth row shows the fusion of all three feature types (clinical annotated, radiomics, and deep features), resulting in a hybrid feature set. Although the validation metrics in this configuration were slightly inferior to those in the second row, the model performed well by considering features from all dimensions. Finally, the fifth row demonstrates the model trained using ensemble learning with multi-dimensional features. All evaluation metrics reached their optimal values in this case, indicating that the proposed algorithm significantly improved performance compared to conventional methods. The ACC improved by 1.65% or more, and the SPE improved by 1.49% or more.
Next, the evaluation metrics predicted by each individual classifier on the test set are presented to further validate the effectiveness of the model ensemble strategy, as shown in Table 9 and Table 10. The results demonstrate that, while the model ensemble does not achieve the optimal performance on each individual metric, the average performance across multiple metrics is significantly improved compared to the performance of the individual classifiers. Specifically, the evaluation metrics for each ensemble model are consistently higher than the average of the three individual classifiers, confirming the stability and effectiveness of the ensemble approach.
Finally, the calibration curves and DCA curves for the four groups of multi-dimensional feature models are shown in Figure 9 and Figure 10, respectively. As seen in the calibration curves, all four group curves gradually approach the black dashed line, representing perfect calibration, and then converge around it with some fluctuations. The results of the voting ensemble model (red with stars) are closer to the reference line, particularly in the predicted probability range of 0.4–0.8. Moreover, the curve of the ensemble model is relatively smoother, unlike some individual classifiers (such as GBM), which exhibit more noticeable fluctuations. This suggests that the ensemble model provides more stable calibration across different prediction probability levels, reflecting the actual situation more reliably and reducing calibration errors caused by fluctuations in predicted probabilities. Additionally, the 95% confidence interval for the voting ensemble model (red shaded area) is narrower compared to most individual classifiers and does not show extreme wide fluctuations. Although Random Forest performs better in this regard, it confirms the reliability and accuracy of the ensemble model’s predictions, offering a certain advantage in quantifying uncertainty and providing more reliable probability forecasts and uncertainty assessments for real-world applications.
In the DCA curves, by comparing the net benefit areas under the threshold range for each curve, the blue and green curves exhibit smaller areas, while the purple curve shows insufficient stability. In contrast, the voting ensemble model (red with stars) performs the best, maintaining higher net benefits at higher threshold probabilities and offering better decision support, indicating higher clinical practicality or decision-making value. Moreover, the net benefit uncertainty of the voting ensemble model at the corresponding thresholds is significantly smaller, showcasing superior performance in quantifying uncertainty and providing more stable and reliable support for real-world decision-making.

5. Conclusions

In this work, we propose ReAcc_MF, a multimodal fusion predictive model that addresses the issue of the high incidence of malignant pulmonary nodules among miners exposed to explosive engineering environments. The model balances computational efficiency, industrial-grade robustness, and clinical interpretability, with a focus on occupational health. To tackle the noise caused by various explosive residue deposits and intermittent dust clouds in medical images from the specific environment, we designed systematic preprocessing steps, including multiple fillings, convex hull calculations, and label consensus merging, ensuring cleaner and more representative ROI extraction. To increase the decision transparency and reliability of the model in real-world scenarios, we used lightweight pre-training models for feature extraction and meticulously fused deep features with radiomics features that have practical physical significance. These multi-dimensional fused features were then used in a voting-based ensemble model for classification.
In clinical-grade device scenarios, we validated that the method can be deployed in resource-limited environments, ensuring decision transparency without compromising diagnostic accuracy and reliability through comprehensive evaluation metrics, stepwise ablation experiments, interpretability validation, and uncertainty quantification. Beyond clinical diagnosis, this work also pioneers an AI-driven occupational health paradigm that can directly translate into social impact—enabling early detection of explosion-related lung pathology in industrial communities with limited resources and services.
Our future work will focus on the following directions: (1) The framework proposed in this study could benefit from external validation to further assess its robustness. To achieve this, we plan to collaborate with relevant hospitals and institutions to establish a diverse dataset, which will allow us to evaluate the method’s generalizability across different clinical environments. (2) Although addressing class imbalance has specific application value, this approach may limit the broader applicability of the model. Future research will focus on improving methods for handling class imbalance without compromising generalization capability. (3) Thanks to the simplicity and lightweight nature of ResNet50 and AlexNet architectures, our model offers certain advantages in terms of training data requirements, hardware resource dependencies, and decision transparency, enabling us to build a predictive framework with industrial-level applicability. However, more promising models, particularly those with better interpretability, remain to be explored. Some researchers [61,62,63] have already proposed effective solutions to this problem. Therefore, we will make targeted improvements in future work. Moreover, we will explore the multimodal integration of radiology, pathology, genomics, and clinical data to develop a more comprehensive predictive model.

Author Contributions

Conceptualization, Q.J.; Methodology, J.J.; Software, J.J.; Validation, J.J.; Formal analysis, J.Z. and J.F.; Investigation, J.F., Z.L., J.S. and M.Z.; Data curation, Q.J. and M.Z.; Resources, Z.L. and J.S.; Writing—Original Draft, J.J.; Writing—review and editing, Q.J.; Supervision, J.Z. and D.G.; Project administration, M.Z. and D.G. All authors have read and agreed to the published version of the manuscript.

Funding

This research was funded by the National Key Research and Development Program of China [Grant number 2021YFC31008], "111 Center" [Grant number D25004], Hubei Provincial Undergraduate Training Program for Innovation and Entrepreneurship [Grant number S202411072060], Undergraduate Research Fund of Jianghan University [Grant number 2024zd098], and Research Fund of Jianghan University [Grant number 2021yb052].

Institutional Review Board Statement

Not applicable.

Informed Consent Statement

Not applicable.

Data Availability Statement

The data that support the findings of this study are openly available at https://doi.org/10.7937/K9/TCIA.2015.LO9QL9SX.

Conflicts of Interest

The authors declare no conflicts of interest.

Appendix A

Figure A1. Graph of single model feature weights for Group A.
Applsci 15 06224 g0a1
Figure A2. Graph of single model feature weights for Group B.
Applsci 15 06224 g0a2
Figure A3. Graph of single model feature weights for Group C.
Applsci 15 06224 g0a3
Figure A4. Graph of single model feature weights for Group D.
Applsci 15 06224 g0a4

References

  1. Occupational Safety and Health Administration (OSHA). Occupational Exposure to Respirable Crystalline Silica. U.S. Department of Labor. Available online: https://www.osha.gov/silica (accessed on 17 April 2025).
  2. De, K.N.H.; Ambrosini, G.L.; William, M.A. Crystalline Silica Exposure and Major Health Effects in Western Australian Gold Miners. Ann. Occup. Hyg. 2002, 46, 1–3. [Google Scholar] [CrossRef]
  3. Chowdhary, C.L.; Acharjya, D.P. Segmentation and Feature Extraction in Medical Imaging: A Systematic Review. Procedia Comput. Sci. 2020, 167, 26–36. [Google Scholar] [CrossRef]
  4. Gillies, R.J.; Kinahan, P.E.; Hricak, H. Radiomics: Images Are More Than Pictures, They Are Data. Radiology 2013, 278, 563–577. [Google Scholar] [CrossRef] [PubMed]
  5. Conti, A.; Duggento, A.; Indovina, I.; Guerrisi, M.; Toschi, N. Radiomics in Breast Cancer Classification and Prediction. Semin. Cancer Biol. 2021, 68, 21–34. [Google Scholar] [CrossRef]
  6. Chetan, M.R.; Gleeson, F.V. Radiomics in Predicting Treatment Response in Non-Small-Cell Lung Cancer: Current Status, Challenges, and Future Perspectives. Eur. Radiol. 2020, 31, 1049–1058. [Google Scholar] [CrossRef]
  7. Shi, L.; Sheng, M.; Wei, L.Z.J. CT-Based Radiomics Predicts the Malignancy of Pulmonary Nodules: A Systematic Review and Meta-Analysis. Acad. Radiol. 2023, 30, 3064–3075. [Google Scholar] [CrossRef]
  8. Naik, R.K.V. Lung Nodule Classification on Computed Tomography Images Using FractalNet. Wirel. Pers. Commun. 2021, 119, 1209–1229. [Google Scholar] [CrossRef]
  9. Tang, N.; Zhang, R.; Wei, Z.; Chen, X.; Li, G.; Song, Q.; Yi, D.; Wu, Y. Improving the Performance of Lung Nodule Classification by Fusing Structured and Unstructured Data. Inf. Fusion 2022, 88, 161–174. [Google Scholar] [CrossRef]
  10. Li, S.; Hou, Z.; Liu, J.; Ren, W.; Wan, S.; Yan, J.; CC Centre; DT Hospital. Radiomics Analysis and Modeling Tools: A Review. Chin. J. Med. Phys. 2018, 35, 1043–1049. [Google Scholar] [CrossRef]
  11. Dutande, P.; Baid, U.; Talbar, S. LNCDS: A 2D-3D Cascaded CNN Approach for Lung Nodule Classification, Detection and Segmentation. Biomed. Signal Process. Control 2021, 67, 102527. [Google Scholar] [CrossRef]
  12. Hosny, A.; Parmar, C.; Quackenbush, J.; Schwartz, L.H.; Aerts, H.J.W.L. Artificial Intelligence in Radiology. Nat. Rev. Cancer 2018, 18, 500–510. [Google Scholar] [CrossRef] [PubMed]
  13. Sun, W.; Zheng, B.; Qian, W. Automatic Feature Learning Using Multichannel ROI Based on Deep Structure Algorithms for Computerized Lung Cancer Diagnosis. Comput. Biol. Med. 2017, 89, 530–539. [Google Scholar] [CrossRef] [PubMed]
  14. Paul, R.; Hall, L.; Goldgof, D.; Schabath, M.; Gillies, R. Predicting Nodule Malignancy Using a CNN Ensemble Approach. In Proceedings of the 2018 International Joint Conference on Neural Networks (IJCNN), Rio de Janeiro, Brazil, 8–13 July 2018; pp. 1–8. [Google Scholar] [CrossRef]
  15. Simonyan, K.; Zisserman, A. Very Deep Convolutional Networks for Large-Scale Image Recognition. arXiv 2014, arXiv:1409.1556. [Google Scholar] [CrossRef]
  16. Al-Huseiny, M.S.; Sajit, A.S. Transfer Learning with GoogleNet for Detection of Lung Cancer. Indones. J. Electr. Eng. Comput. Sci. 2021, 22, 1078–1086. [Google Scholar] [CrossRef]
  17. He, K.; Zhang, X.; Ren, S.; Sun, J. Deep Residual Learning for Image Recognition. In Proceedings of the IEEE Conference on Computer Vision and Pattern Recognition, Las Vegas, NV, USA, 27–30 June 2016; pp. 770–778. [Google Scholar] [CrossRef]
  18. Bruntha, P.M.; Dhanasekar, S.; Ahmed, L.J. Investigation of Deep Features in Lung Nodule Classification. In Proceedings of the 2022 6th International Conference on Devices, Circuits and Systems (ICDCS), Vellore, India, 18–20 March 2022; pp. 67–70. [Google Scholar]
  19. Dodia, S.; Basava, A.; Padukudru Anand, M. A Novel Receptive Field-Regularized V-Net and Nodule Classification Network for Lung Nodule Detection. Int. J. Imaging Syst. Technol. 2022, 32, 88–101. [Google Scholar] [CrossRef]
  20. Wu, R.; Huang, H. Multi-Scale Multi-View Model Based on Ensemble Attention for Benign-Malignant Lung Nodule Classification on Chest CT. In Proceedings of the 2022 15th International Congress on Image and Signal Processing, BioMedical Engineering and Informatics (CISP-BMEI), Chengdu, China, 16–18 December 2022; pp. 1–6. [Google Scholar]
  21. Liu, D.; Liu, F.; Tie, Y.; Qi, L.; Wang, F. Res-Trans Networks for Lung Nodule Classification. Int. J. Comput. Assist. Radiol. Surg. 2022, 17, 1059–1068. [Google Scholar] [CrossRef] [PubMed]
  22. Bruntha, P.M.; Pandian, S.I.A.; Anitha, J.; Abraham, S.S.; Kumar, S.N. A Novel Hybridized Feature Extraction Approach for Lung Nodule Classification Based on Transfer Learning Technique. J. Med. Phys. 2022, 47, 1–9. [Google Scholar] [CrossRef]
  23. Xiao, J.; Wang, S.; Zhou, J.; Tian, Z.; Zhang, H.; Wang, Y.-F. MIM: High-Definition Maps Incorporated Multi-View 3D Object Detection. IEEE Trans. Intell. Transp. Syst. 2025, 26, 2501–2511. [Google Scholar] [CrossRef]
  24. Xiao, J.; Guo, H.; Zhou, J.; Zhao, T.; Yu, Q.; Chen, Y.; Wang, Z. Tiny Object Detection with Context Enhancement and Feature Purification. Expert Syst. Appl. 2023, 211, 118665. [Google Scholar] [CrossRef]
  25. Xiang, Z. VSS-SpatioNet: A Multi-Scale Feature Fusion Network for Multimodal Image Integrations. Sci. Rep. 2025, 15, 9306. [Google Scholar] [CrossRef]
  26. Li, Y.; El Habib Daho, M.; Conze, P.; Zeghlache, R.; Le Boité, H.; Tadayoni, R.; Cochener, B.; Lamard, M.; Quellec, G. A Review of Deep Learning-Based Information Fusion Techniques for Multimodal Medical Image Classification. arXiv 2024, arXiv:2404.15022. [Google Scholar] [CrossRef] [PubMed]
  27. Zhou, T.; Cheng, Q.R.; Lu, H.L.; Li, Q.; Zhang, X.X.; Qiu, S. Deep learning methods for medical image fusion: A review. Comput. Biol. Med. 2023, 160, 106959. [Google Scholar] [CrossRef]
  28. Qiao, H.; Chen, Y.; Qian, C.; Guo, Y. Clinical Data Mining: Challenges, Opportunities, and Recommendations for Translational Applications. J. Transl. Med. 2024, 22, 185. [Google Scholar] [CrossRef]
  29. Ranjan, A.; Zhao, Y.; Sahu, H.B.; Misra, P. Opportunities and Challenges in Health Sensing for Extreme Industrial Environments: Perspectives from Underground Mines. IEEE Access 2019, 7, 139181–139195. [Google Scholar] [CrossRef]
  30. Nobrega, R.V.M.D.; Peixoto, S.A.; Silva, S.P.P.D.; Filho, P.P.R. Lung Nodule Classification via Deep Transfer Learning in CT Lung Images. In Proceedings of the 2018 IEEE 31st International Symposium on Computer-Based Medical Systems (CBMS), Aalborg, Denmark, 18–20 June 2018; pp. 1–6. [Google Scholar] [CrossRef]
  31. Muñoz-Rodenas, J.; García-Sevilla, F.; Coello-Sobrino, J.; Martínez-Martínez, A.; Miguel-Eguía, V. Effectiveness of Machine-Learning and Deep-Learning Strategies for the Classification of Heat Treatments Applied to Low-Carbon Steels Based on Microstructural Analysis. Appl. Sci. 2023, 13, 3479. [Google Scholar] [CrossRef]
  32. Mahajan, P.; Uddin, S.; Hajati, F.; Moni, M.A. Ensemble Learning for Disease Prediction: A Review. Healthcare 2023, 11, 1808. [Google Scholar] [CrossRef]
  33. Chen, T.; Guestrin, C. XGBoost: A Scalable Tree Boosting System. In Proceedings of the 22nd ACM SIGKDD International Conference on Knowledge Discovery and Data Mining, San Francisco, CA, USA, 13–17 August 2016; pp. 785–794. [Google Scholar]
  34. Friedman, J.H. Greedy Function Approximation: A Gradient Boosting Machine. Ann. Stat. 2001, 29, 1189–1232. [Google Scholar] [CrossRef]
  35. Breiman, L. Random Forests. Mach. Learn. 2001, 45, 5–32. [Google Scholar] [CrossRef]
  36. Armato, S.G., III; McLennan, G.; Bidaut, L.; McNitt-Gray, M.F.; Meyer, C.R.; Reeves, A.P.; Zhao, B.; Aberle, D.R.; Henschke, C.I.; Hoffman, E.A.; et al. Data From LIDC-IDRI (Version 4); The Cancer Imaging Archive: Frederick, MD, USA, 2015. [Google Scholar] [CrossRef]
  37. Bradley, A.P. The use of the area under the ROC curve in the evaluation of machine learning algorithms. Pattern Recogn. 1997, 30, 1145–1159. [Google Scholar] [CrossRef]
  38. Sokolova, M.; Lapalme, G. A Systematic Analysis of Performance Measures for Classification Tasks. Inf. Process. Manag. 2009, 45, 427–437. [Google Scholar] [CrossRef]
  39. Powers, D.M.W. Evaluation: From precision, recall and f-factor to roc, informedness, markedness & correlation. arXiv 2010. [Google Scholar] [CrossRef]
  40. Davis, J.; Goadrich, M. The relationship between Precision-Recall and ROC curves. In Proceedings of the 23rd International Conference on Machine Learning, Pittsburgh, PA, USA, 25–29 June 2006; pp. 233–240. [Google Scholar] [CrossRef]
  41. Niculescu-Mizil, A.; Caruana, R. Predicting good probabilities with supervised learning. In Proceedings of the 22nd International Conference (ICML 2005) on Machine Learning, Bonn, Germany, 7–11 August 2005. [Google Scholar]
  42. Vickers, A.J.; Elkin, E.B. Decision curve analysis: A novel method for evaluating prediction models. Med. Decis. Mak. 2006, 26, 565–574. [Google Scholar] [CrossRef]
  43. Brier, G.W. Verification of forecasts expressed in terms of probability. Mon. Weather Rev. 1950, 78, 1–3. [Google Scholar] [CrossRef]
  44. Guo, C.; Pleiss, G.; Yu, S.; Weinberger, K.Q. On calibration of modern neural networks. In Proceedings of the 34th International Conference on Machine Learning, Sydney, Australia, 6–11 August 2017. [Google Scholar] [CrossRef]
  45. Strehl, A.; Ghosh, J. Cluster ensembles—A knowledge reuse framework for combining multiple partitions. J. Mach. Learn. Res. 2002, 3, 583–617. [Google Scholar] [CrossRef]
  46. Halder, A.; Chatterjee, S.; Dey, D. Adaptive Morphology Aided 2-Pathway Convolutional Neural Network for Lung Nodule Classification. Biomed. Signal Process. Control 2022, 72, 103347. [Google Scholar] [CrossRef]
  47. Yang, J.; Zhu, D.; Shao, J.; Liu, X. A 3D Multi-Scale Cross-Fusion Network for Lung Nodule Classification. Comput. Eng. Appl. 2022, 58, 121–125. [Google Scholar] [CrossRef]
  48. Wu, K.; Peng, B.; Zhai, D. Multi-Granularity Dilated Transformer for Lung Nodule Classification via Local Focus Scheme. Appl. Sci. 2022, 13, 377. [Google Scholar] [CrossRef]
  49. Yin, Z.; Xia, K.; Wu, P. A Multimodal Feature Fusion Network for the Benign-Malignant Classification of Lung Nodules. Comput. Eng. Appl. 2023, 59, 228–236. [Google Scholar] [CrossRef]
  50. Halder, A.; Dey, D. Atrous Convolution Aided Integrated Framework for Lung Nodule Segmentation and Classification. Biomed. Signal Process. Control 2023, 82, 104527. [Google Scholar] [CrossRef]
  51. Wu, R.; Liang, C.; Li, Y.; Shi, X.; Zhang, J.; Huang, H. Self-Supervised Transfer Learning Framework Driven by Visual Attention for Benign–Malignant Lung Nodule Classification on Chest CT. Expert Syst. Appl. 2023, 215, 119339. [Google Scholar] [CrossRef]
  52. Balci, M.A.; Batrancea, L.M.; Akgüller, M.; Nichita, A. A Series-Based Deep Learning Approach to Lung Nodule Image Classification. Cancers 2023, 15, 843. [Google Scholar] [CrossRef] [PubMed]
  53. Qiao, J.; Fan, Y.; Zhang, M.; Fang, K.; Wang, Z. Ensemble Framework Based on Attributes and Deep Features for Benign-Malignant Classification of Lung Nodule. Biomed. Signal Process. Control 2023, 79, 104217. [Google Scholar] [CrossRef]
  54. Dhasny Lydia, M.; Prakash, M. An Improved Convolution Neural Network and Modified Regularized K-Means-Based Automatic Lung Nodule Detection and Classification. J. Digit. Imaging 2023, 36, 1431–1446. [Google Scholar] [CrossRef]
  55. Saihood, A.; Abdulhussien, W.R.; Alzubaid, L.; Manoufali, M.; Gu, Y. Fusion-Driven Semi-Supervised Learning-Based Lung Nodule Classification with Dual-Discriminator and Dual-Generator Generative Adversarial Network. BMC Med. Inform. Decis. Mak. 2024, 24, 403. [Google Scholar] [CrossRef] [PubMed]
  56. Saied, M.; Raafat, M.; Yehia, S.; Khalil, M.M. Efficient Pulmonary Nodules Classification Using Radiomics and Different Artificial Intelligence Strategies. Insights Imaging 2023, 14, 91. [Google Scholar] [CrossRef]
  57. Gautam, N.; Basu, A.; Sarkar, R. Lung Cancer Detection from Thoracic CT Scans Using an Ensemble of Deep Learning Models. Neural Comput. Appl. 2024, 36, 2459–2477. [Google Scholar] [CrossRef]
  58. Kumar, V.; Prabha, C.; Sharma, P.; Mittal, N.; Askar, S.S.; Abouhawwash, M. Unified Deep Learning Models for Enhanced Lung Cancer Prediction with ResNet-50–101 and EfficientNet-B3 Using DICOM Images. BMC Med. Imaging 2024, 24, 63. [Google Scholar] [CrossRef]
  59. Esha, J.F.; Islam, T.; Pranto, M.A.M.; Borno, A.S.; Faruqui, N.; Yousuf, M.A.; AI-Moisheer, A.S.; Alotaibi, N.; Alyami, S.A.; Moni, M.A. Multi-View Soft Attention-Based Model for the Classification of Lung Cancer-Associated Disabilities. Diagnostics 2024, 14, 2282. [Google Scholar] [CrossRef]
  60. Vanguri, R.S.; Luo, J.; Aukerman, A.T.; Egger, J.V.; Fong, C.J.; Horvat, N.; Pagano, A.; Araujo-Filho, J.d.A.B.; Geneslaw, L.; Rizvi, H.; et al. Multimodal Integration of Radiology, Pathology, and Genomics for Prediction of Response to PD-(L)1 Blockade in Patients with Non-Small Cell Lung Cancer. Nat. Cancer 2022, 3, 1151–1164. [Google Scholar] [CrossRef]
  61. Biswas, S.; Mostafiz, R.; Paul, B.K.; Uddin, K.M.M.; Hadi, M.A.; Khanom, F. DFU_XAI: A Deep Learning-Based Approach to Diabetic Foot Ulcer Detection Using Feature Explainability. Biomed. Mater. Devices 2024, 2, 2. [Google Scholar] [CrossRef]
  62. Wani, N.A.; Kumar, R.; Bedi, J. DeepXplainer: An Interpretable Deep Learning-Based Approach for Lung Cancer Detection Using Explainable Artificial Intelligence. Comput. Methods Programs Biomed. 2024, 243, 13. [Google Scholar] [CrossRef] [PubMed]
  63. Oumlaz, M.; Oumlaz, Y.; Oukaira, A.; Benelhaouare, A.Z.; Lakhssassi, A. Advancing Pulmonary Nodule Detection with ARSGNet: EfficientNet and Transformer Synergy. Electronics 2024, 13, 4369. [Google Scholar] [CrossRef]
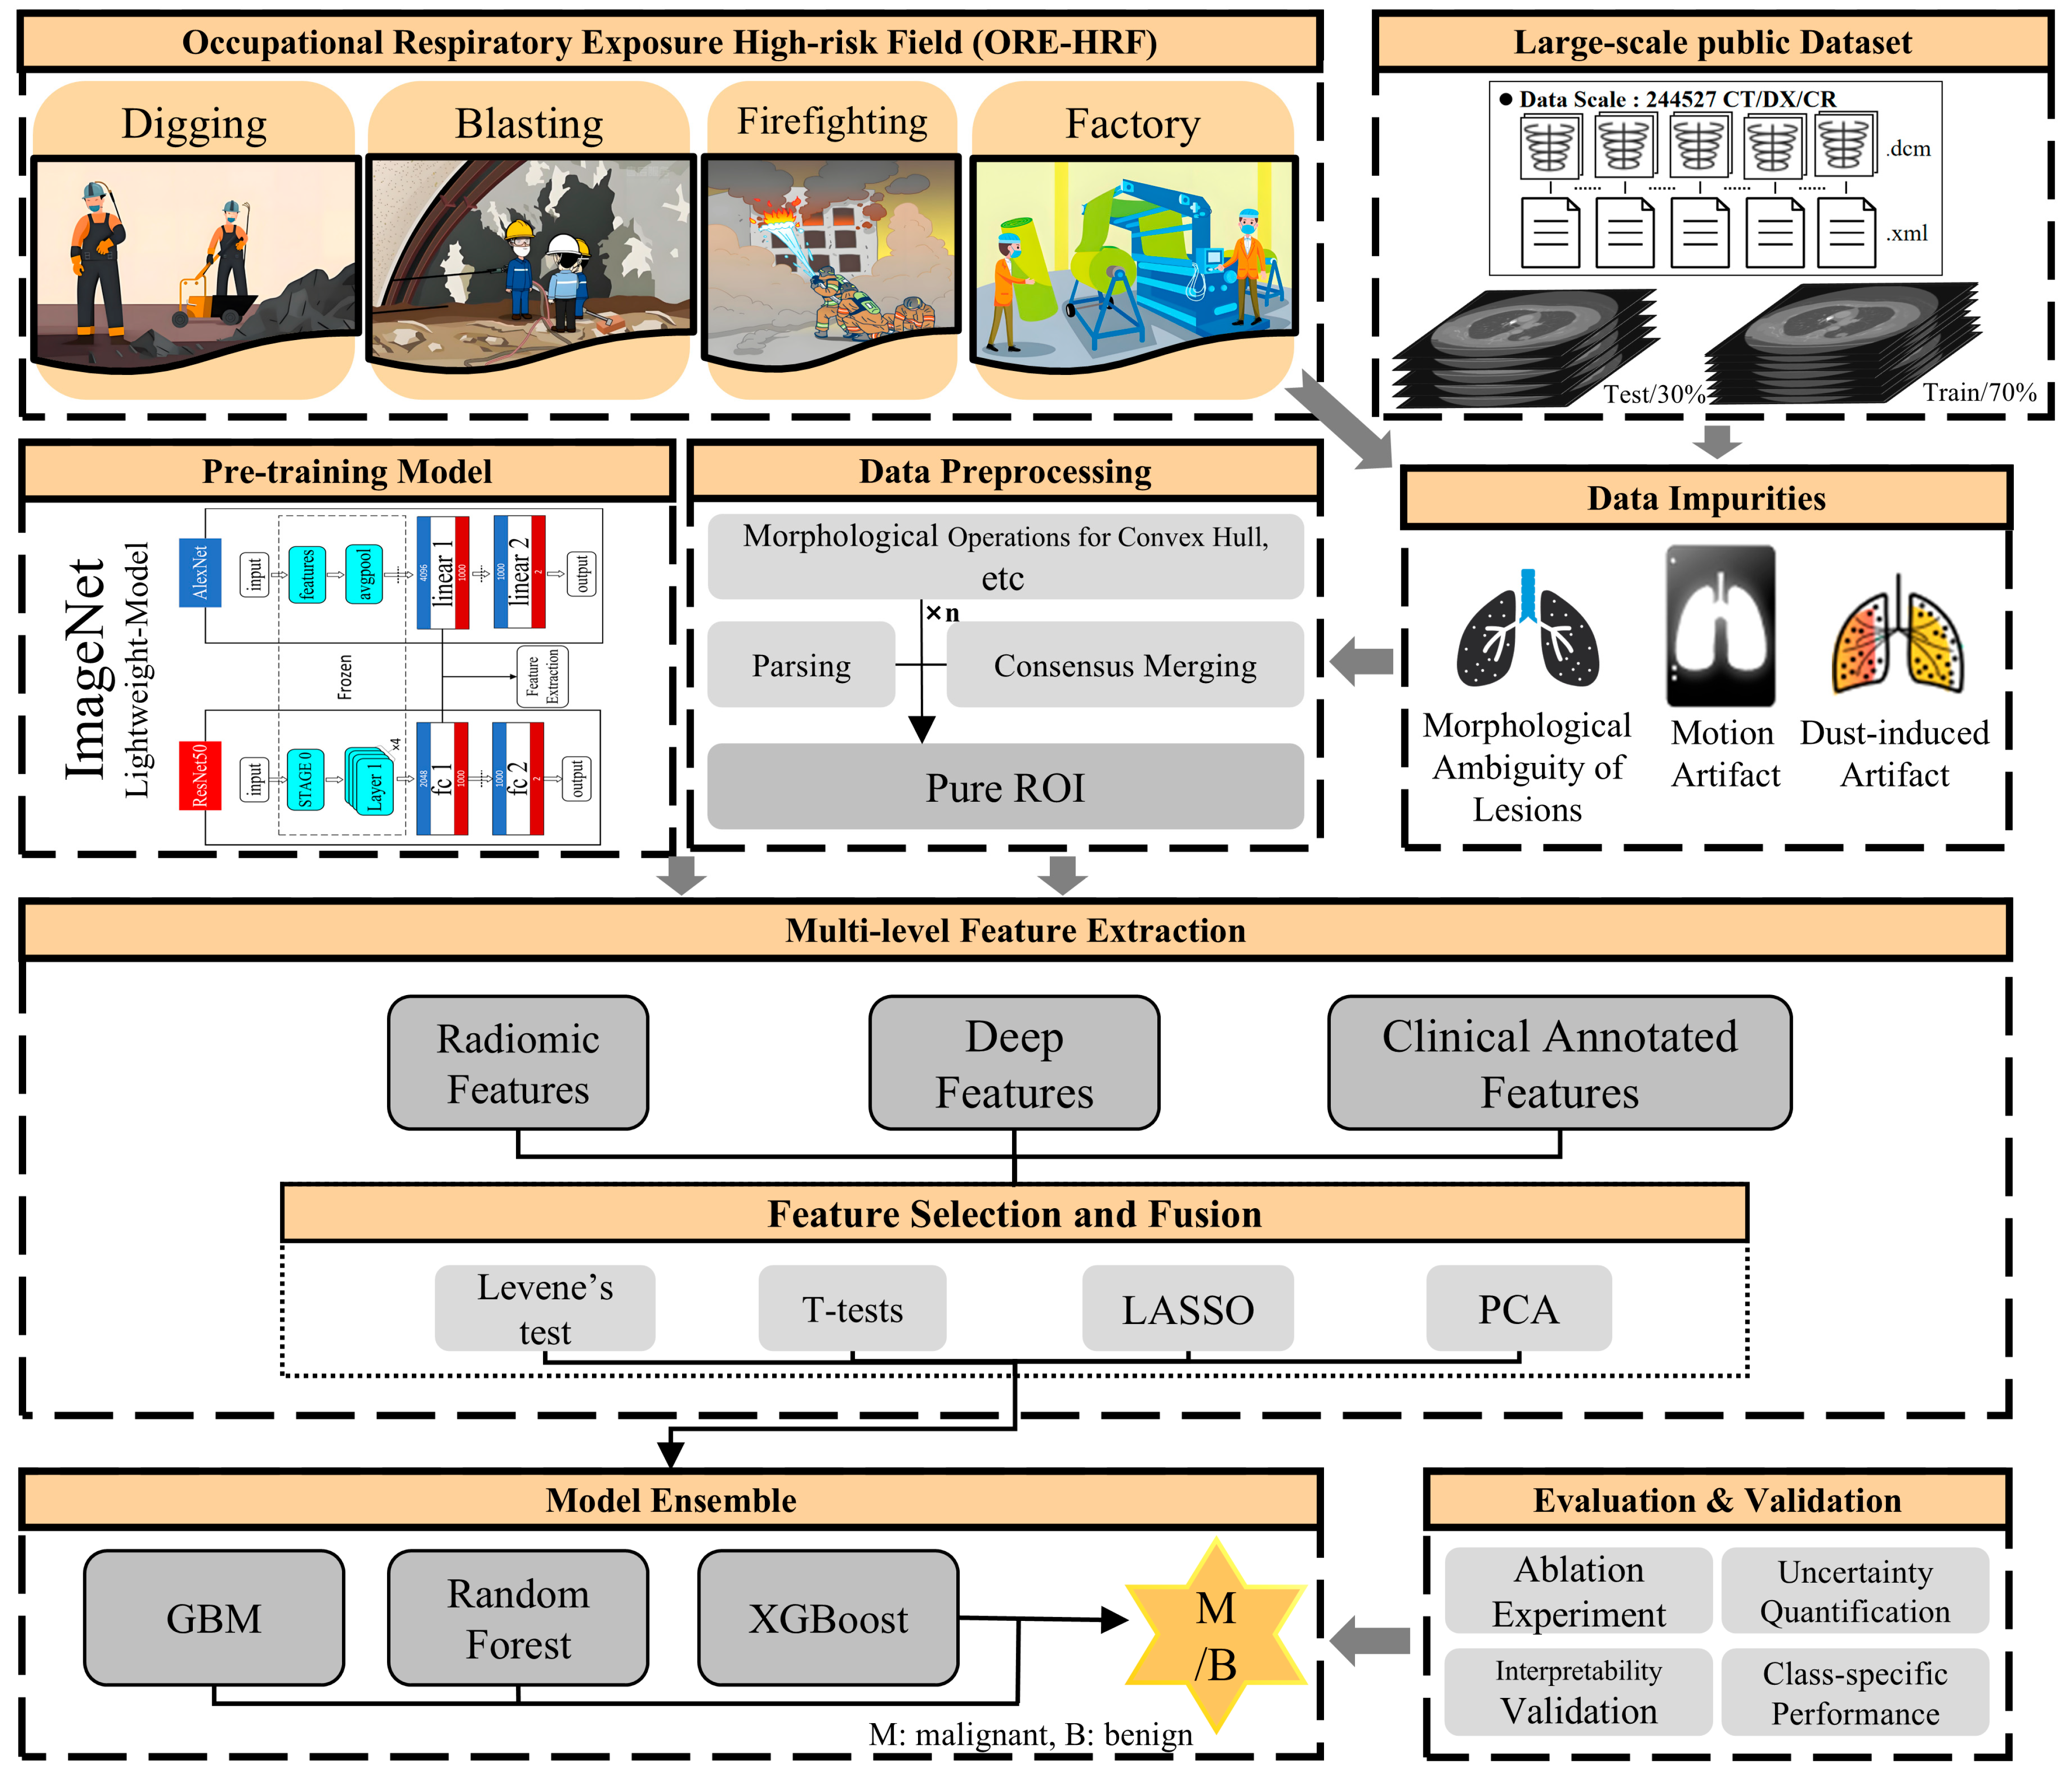
Figure 1. ReAcc_MF algorithm flowchart.
Applsci 15 06224 g001
Figure 2. Data preprocessing process. The symbol ‘×’ represents the element-wise multiplication operation.
Applsci 15 06224 g002
Figure 3. Data preprocessing. (a) LIDC-0037; (b) left: LIDC-0001; right: LIDC-1007; (c) LIDC-0001.
Applsci 15 06224 g003
Figure 4. Simplified fine-tuning model. The unmodified model layers are omitted with arrows marked with dashed lines.
Applsci 15 06224 g004
Figure 5. Confusion matrix.
Applsci 15 06224 g005
Figure 6. Precision–recall curve.
Applsci 15 06224 g006
Figure 7. Feature weight map of the integrated model ensemble.
Applsci 15 06224 g007
Figure 8. Normalized mutual information heatmap.
Applsci 15 06224 g008
Figure 9. Calibration curve.
Applsci 15 06224 g009
Figure 10. DCA curve.
Applsci 15 06224 g010
Table 1. Binary table of clinical annotated features.
LabelBenign (0)Malignant (1)
Features
Subtlety1, 23, 4, 5
Calcification1~56
Sphericity1, 2, 34, 5
Margin1, 23, 4, 5
Lobulation3, 4, 51, 2
Spiculation3, 4, 51, 2
Texture1, 2, 34, 5
Table 2. Experimental software environment.
Library NameVersion NumberLibrary NameVersion Number
python3.9.13pylint2.14.5
numpy1.24.4scikit-learn1.0.2
pandas2.2.2torch2.2.1+cu118
pylidc0.2.3tqdm4.64.1
Table 3. Data label binarization.
Malignancy Degree12345
BenignSuspected BenignUncertainSuspected MalignantMalignant
Quantity79012343825991871
Binarization00Discard11
Table 4. The meaning of radiomics characteristics.
NumFeature NameFeature CharacterizationWeight
Iwavelet-LL_glcm_Imc1Symmetry and Entropy
of Grayscale Distribution
0.0747
IIlog-sigma-5-mm-3D_glcm_InverseVarianceContrast and Grayscale
Uniformity of the Image
0.0586
IIIwavelet-LH_glcm_Imc1Symmetry and Entropy of
Grayscale Distribution
in the Horizontal Direction
0.0521
IVwavelet-LH_glrlm_RunEntropyComplexity and Information
Content of Grayscale Levels
in the Horizontal Direction
0.0441
Vlog-sigma-3-mm-3D_glcm_InverseVarianceContrast and Grayscale
Uniformity in Local Regions
0.0407
VIwavelet-HH_firstorder_InterquartileRangeExtremity of Grayscale Distribution
in High-Frequency Regions
0.0402
VIIoriginal_shape2D_MinorAxisLength2D Shape and Size of the Nodule0.0377
VIIIlog-sigma-5-mm-3D_glrlm_ LowGrayLevelRunEmphasisSignificance of Long Runs and Low-Gray-Level Regions0.0338
IXlog-sigma-5-mm-3D_glrlm_RunVarianceVariability of Run Lengths
of Grayscale Levels
0.0324
Xlog-sigma-5-mm-3D_glrlm_RunEntropyInformation Content and Complexity of Grayscale Levels0.0273
XIwavelet-LL_glcm_CorrelationCorrelation and Consistency of Grayscale Distribution0.0244
XIIoriginal_gldm_DependenceVarianceVariability and Complexity of Grayscale Dependence Relationships0.0238
Table 5. Settings of different feature—fusion approaches. "√" represents the fusion features of the corresponding group.
GroupClinical Annotated FeaturesRadiomics FeaturesDeep Features
BinarizationOne-HotResNet50AlexNet
A
B
C
D
Table 6. Prediction metrics of ensemble models.
GroupAUCACCBrier Score (95% CIs)ECESENSPEPPVNPV
A0.98850.9497(0.0330, 0.0446)0.07810.88540.97250.950.9452
B0.99760.9785(0.0151, 0.0232)0.09220.96010.98660.98230.9698
C0.99190.9579(0.0267, 0.0369)0.05620.93520.96810.9710.929
D0.99740.9779(0.0142, 0.0217)0.07260.96510.98290.98440.9619
Table 7. Performance comparison with mainstream algorithms.
Model StructureSource/YearEvaluation Metrics
(LIDC-IDRI)
ACCSPESEN
Structured Features
+ CNN + XGBoost [9]
Information Fusion/20220.940.940.93
CNN + Adaptive Morphology
+ Dual-path [46]
Biomedical Signal Processing and Control/20220.970.980.93
3D Multiscale Cross
Fusion Network [47]
Computer Engineering and Applications/20220.900.880.93
Multigranularity Transformer
+ LFS [48]
Applied Sciences/20220.960.960.98
Multimodal Feature
+ Fusion Network [49]
Computer Engineering and Applications/20230.930.950.91
Dilated Convolution
+ Multiscale [50]
Biomedical Signal Processing and Control/20230.950.960.95
Self-supervised Learning
+ Transfer Learning
+ Visual Attention [51]
Expert Systems with Applications/20230.920.930.91
U-Net + Radial Scan [52]Cancers/20230.92/0.92
LSTM + CNN
+ Multisemantic Features [53]
Biomedical Signal Processing and Control/20230.950.931.0
CNN+ATSO [54]Journal of Digital Imaging/20230.96/0.94
Radiomics + CNN [55] Insights Imaging/20230.900.940.90
Ensemble DLM [56]Neural Computing and Applications/20230.97/0.98
DDDG-GAN [57]BMC Med Inform Decis Mak/20240.93//
Fusion model [58]BMC Medical Imaging/20240.94/1
MVSA-CNN [59]Diagnostics(Basel)/20240.970.960.97
Group AOurs0.940.880.97
Group B0.980.960.98
Group C0.950.930.96
Group D0.980.960.98
Table 8. Ablation experiment of the algorithm in this paper on the dataset (Group B). "√" indicates that the relevant strategy is adopted.
Clinical Annotated
Features
Radiomics FeaturesDeep FeaturesEnsemble LearningAUCACCSPE
0.99080.94560.9302
0.99410.96200.9452
0.98070.93540.8804
0.99100.95280.9169
0.99760.97850.9601
Table 9. Verification results of Group A and Group B.
ResNet50AUCACCF1-scoreBrier ScoreECESPENPV
GroupAXGBoost0.98830.94560.91620.04070.08890.97250.9351
GBM0.98690.94560.92060.04080.10270.97700.9351
RF0.98010.93740.91340.05650.11110.96140.9110
ME0.98850.94970.91620.03850.07810.97250.9452
BXGBoost0.99630.97690.97090.01860.04720.98370.9634
GBM0.99660.97850.97020.01590.15230.98660.9698
RF0.9910.95280.94120.04100.13290.96880.9293
ME0.99760.97850.97020.01890.09220.98660.9698
Table 10. Verification results of Group C and Group D.
AlexNetAUCACCF1-scoreBrier ScoreECESPENPV
GroupCXGBoost0.99150.95840.95430.03100.05880.96730.9278
GBM0.99000.95640.94860.03550.11850.96880.9301
RF0.98590.94410.92320.04650.09650.96510.9199
ME0.99190.95790.95120.03160.05620.96810.9290
DXGBoost0.99760.97690.97420.01720.07380.98290.9619
GBM0.99770.97740.97090.01790.16780.98520.9666
RF0.99390.96200.95730.03360.10410.97030.9342
ME0.99740.97790.97030.01780.07260.98290.9619
Disclaimer/Publisher’s Note: The statements, opinions and data contained in all publications are solely those of the individual author(s) and contributor(s) and not of MDPI and/or the editor(s). MDPI and/or the editor(s) disclaim responsibility for any injury to people or property resulting from any ideas, methods, instructions or products referred to in the content.