
Study on Roof Ventilation and Optimized Layout of Photovoltaics for Semi-Outdoor Main Transformer Rooms in Substations


Abstract
Featured Application
Abstract
1. Introduction
2. Materials and Methods
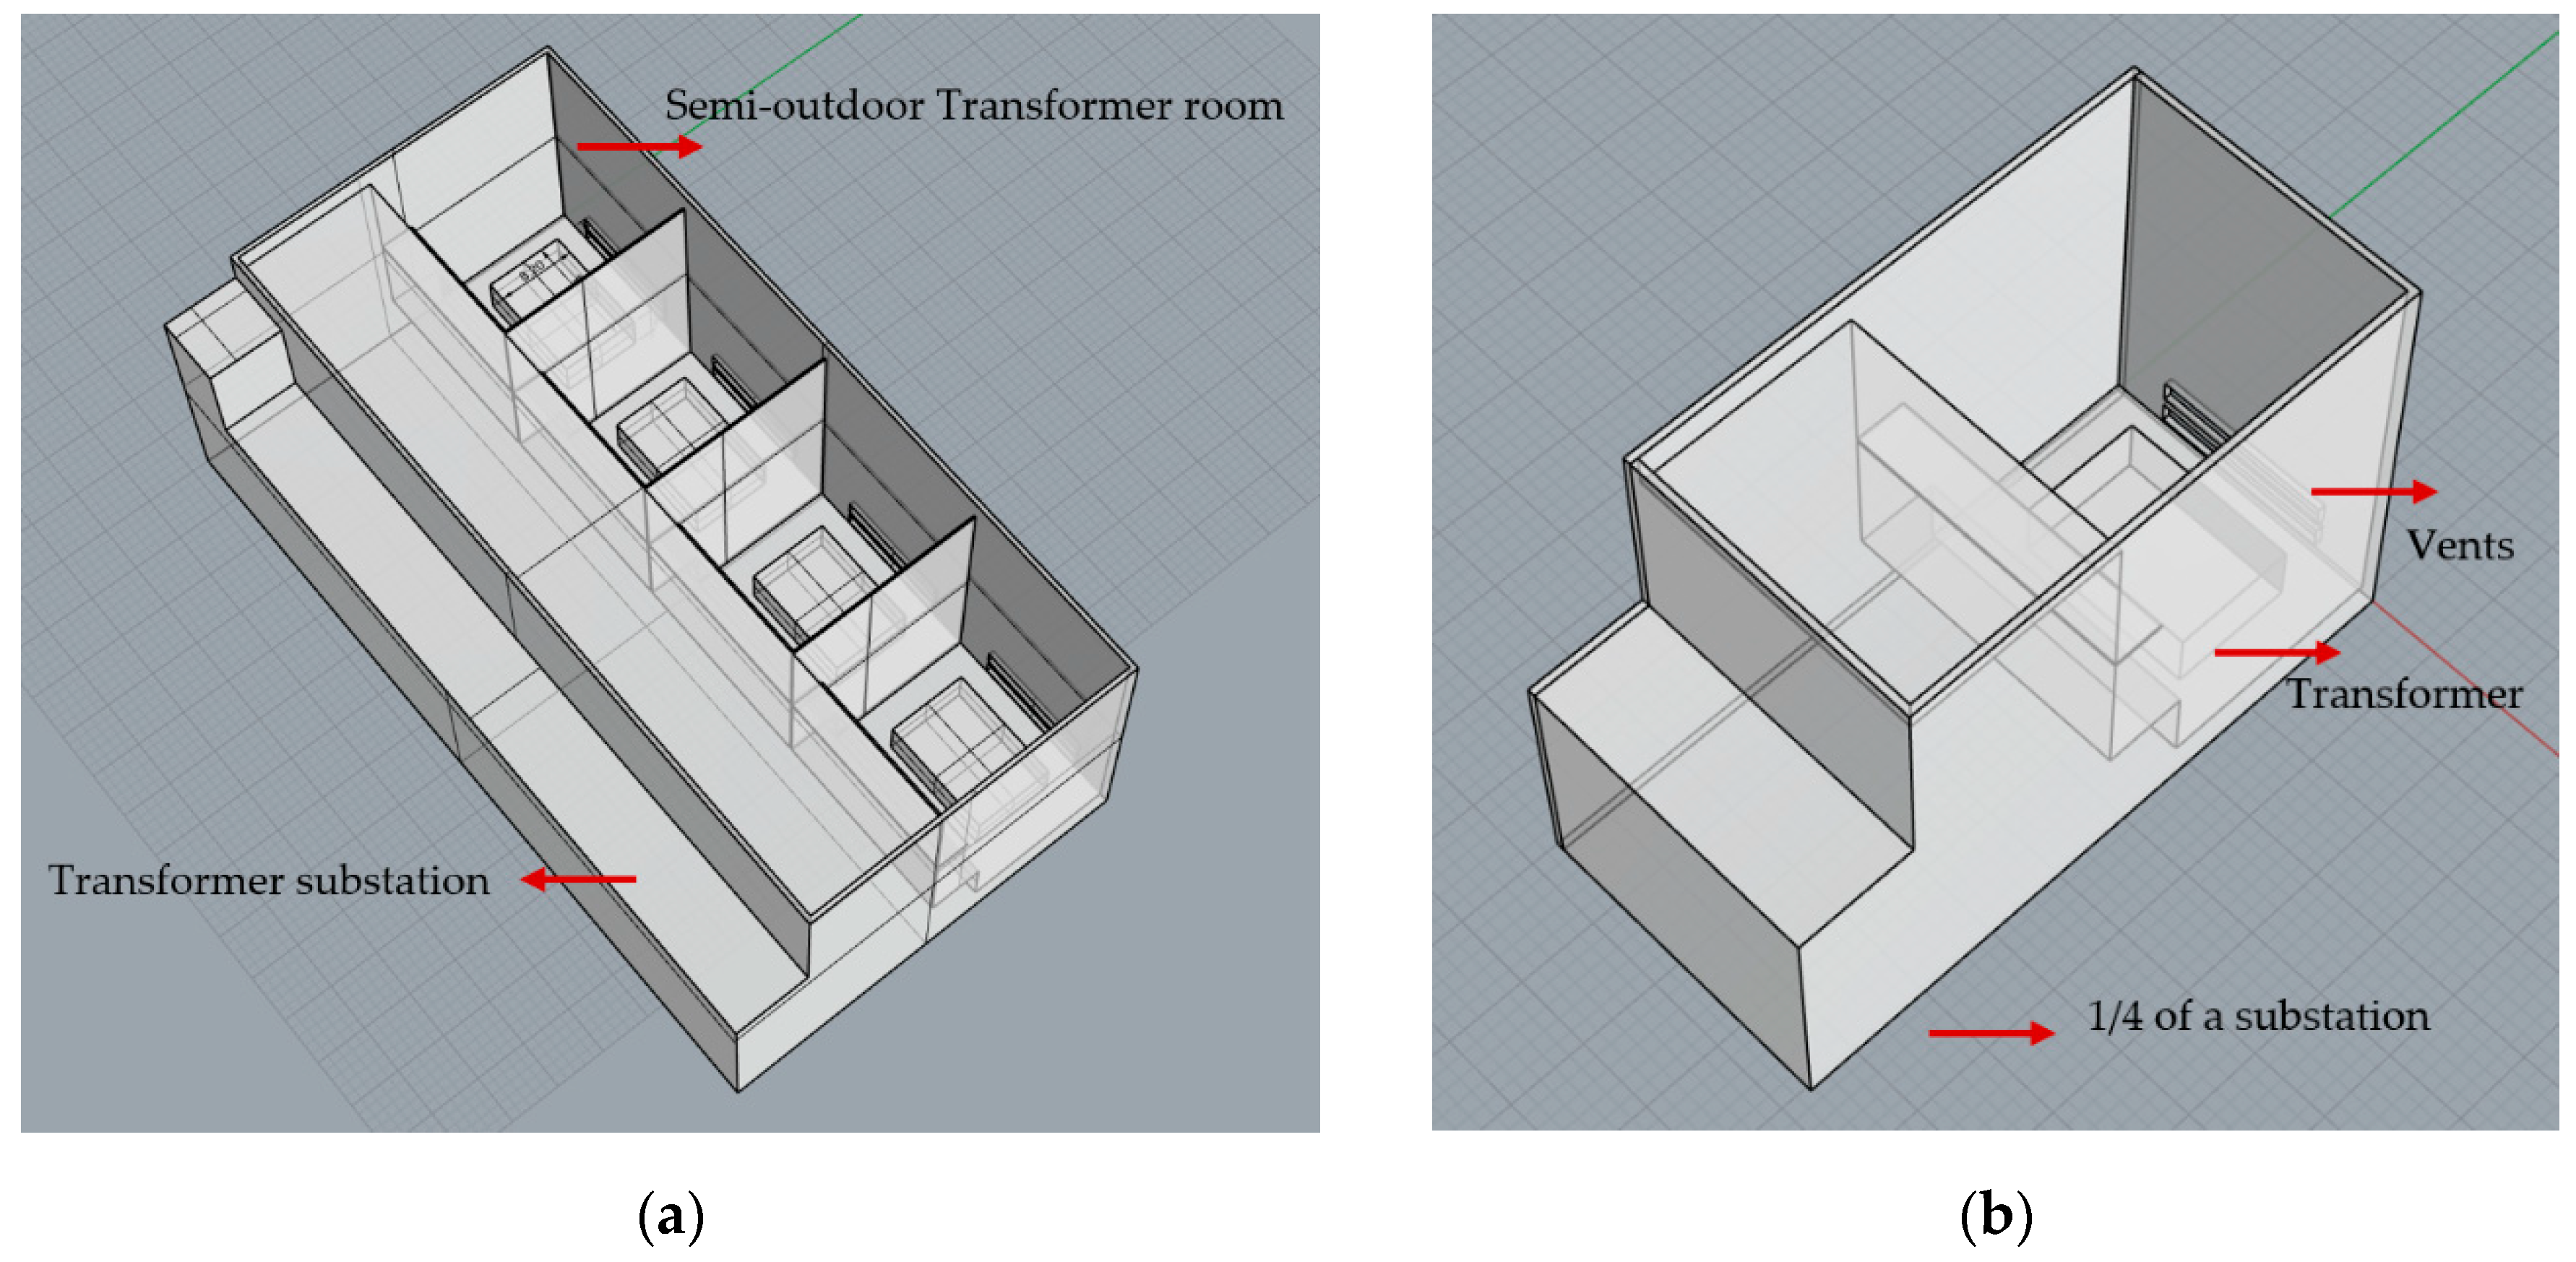
2.1. Research Object
2.2. CFD Numerical Simulation
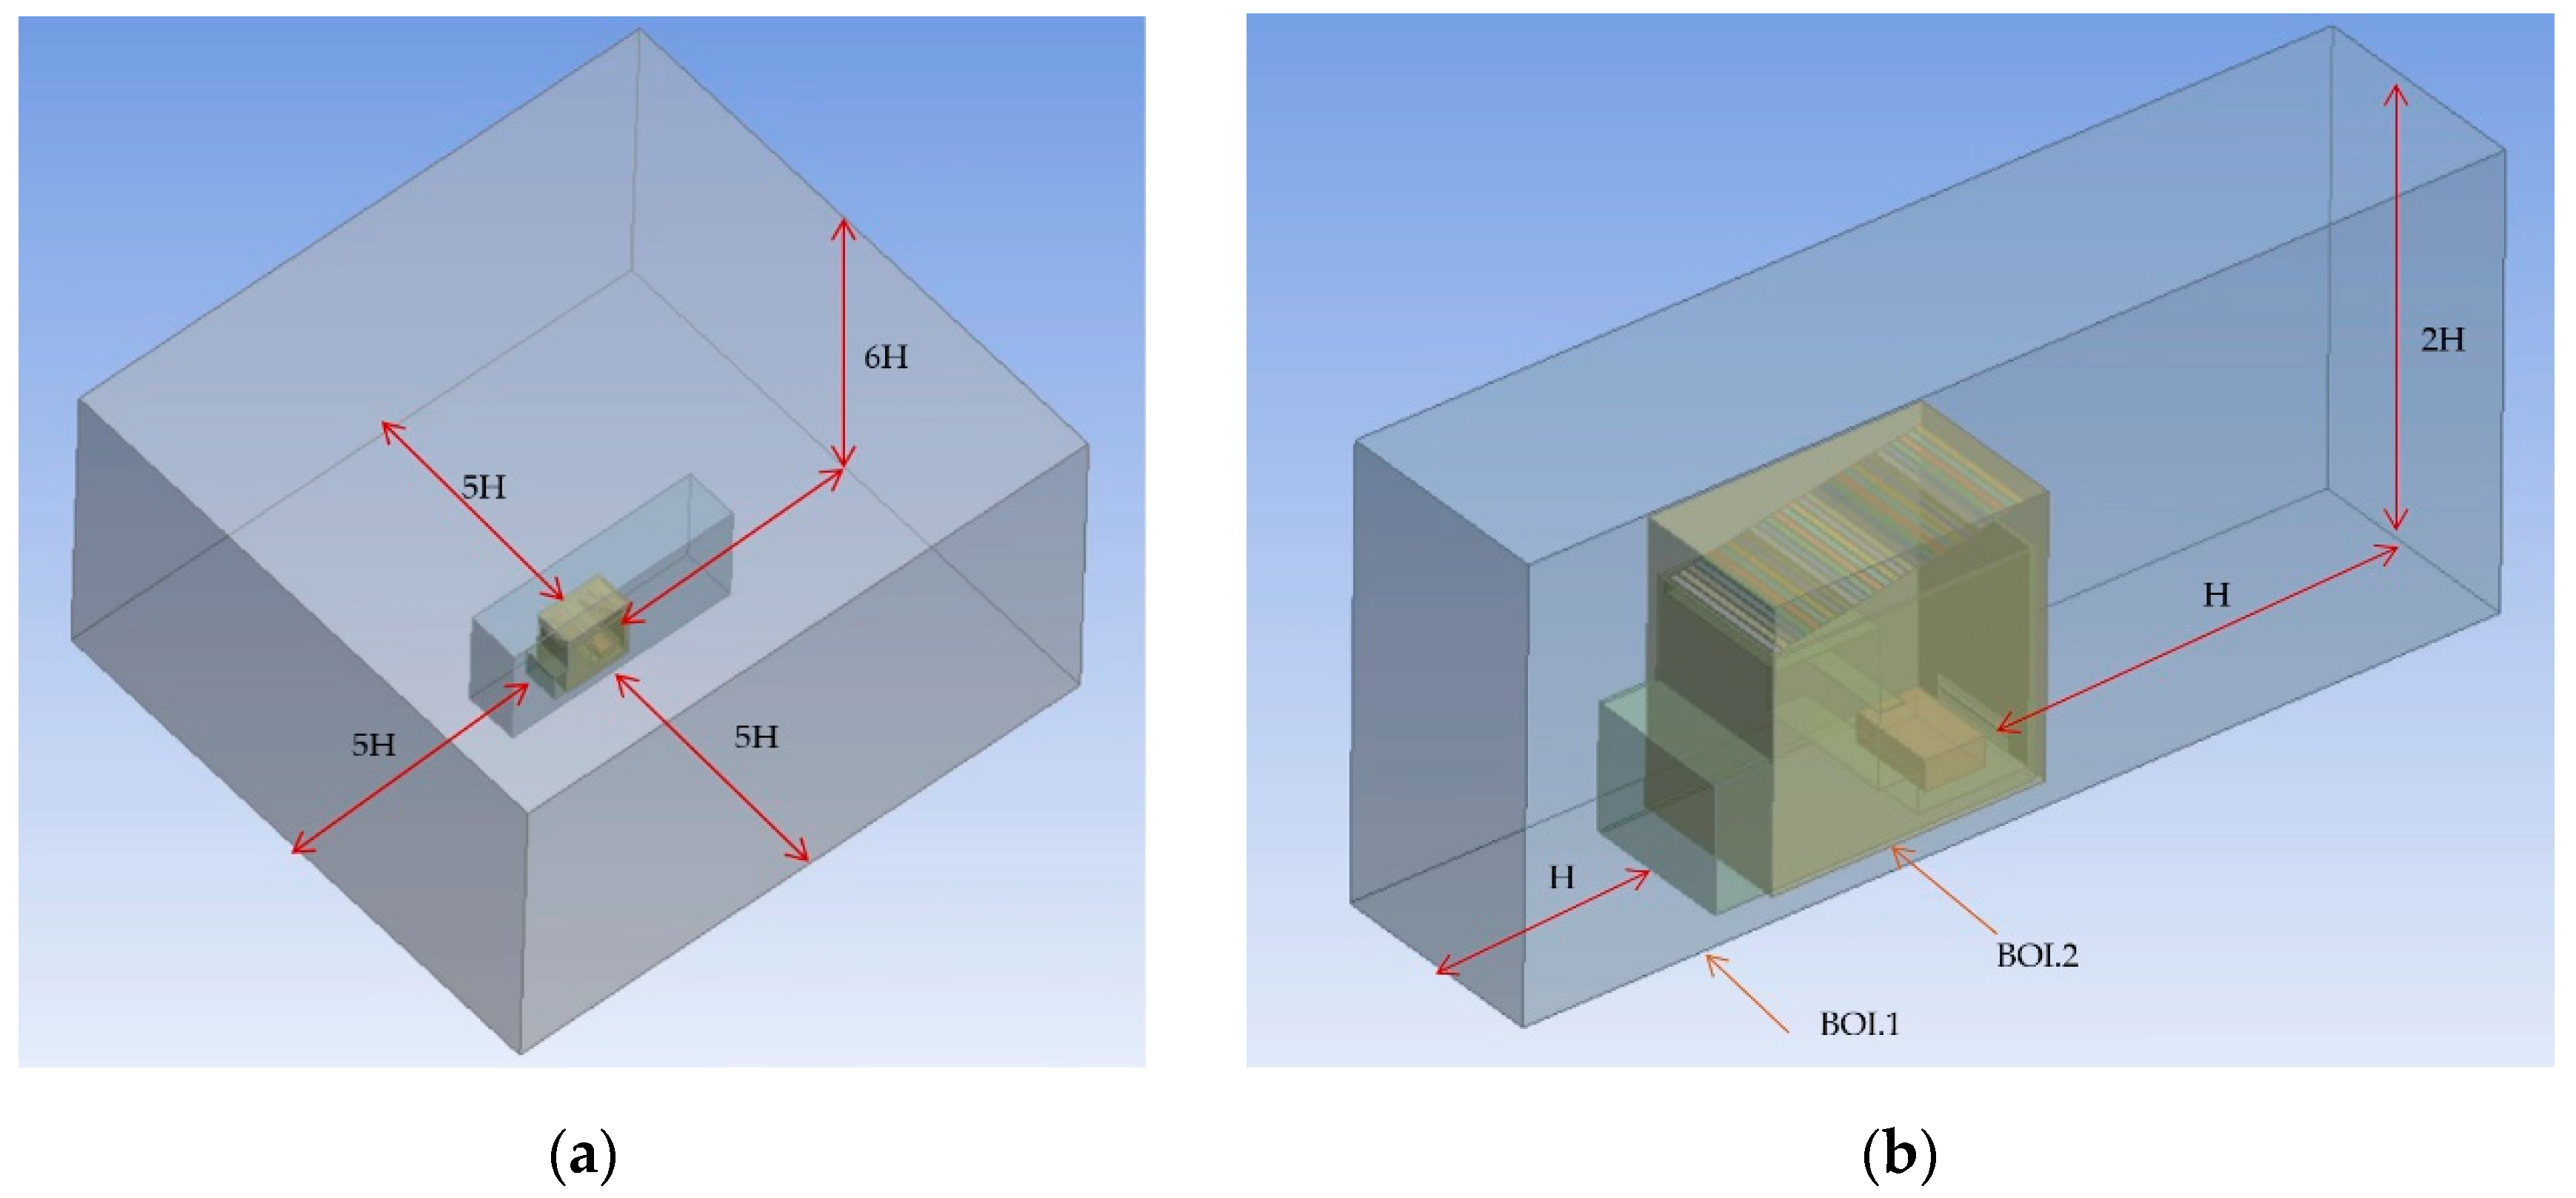
2.2.1. Modeling and Computational Domain
2.2.2. Computational Meshing
2.2.3. Governing Equations
2.2.4. Calculation Boundary Condition Setting
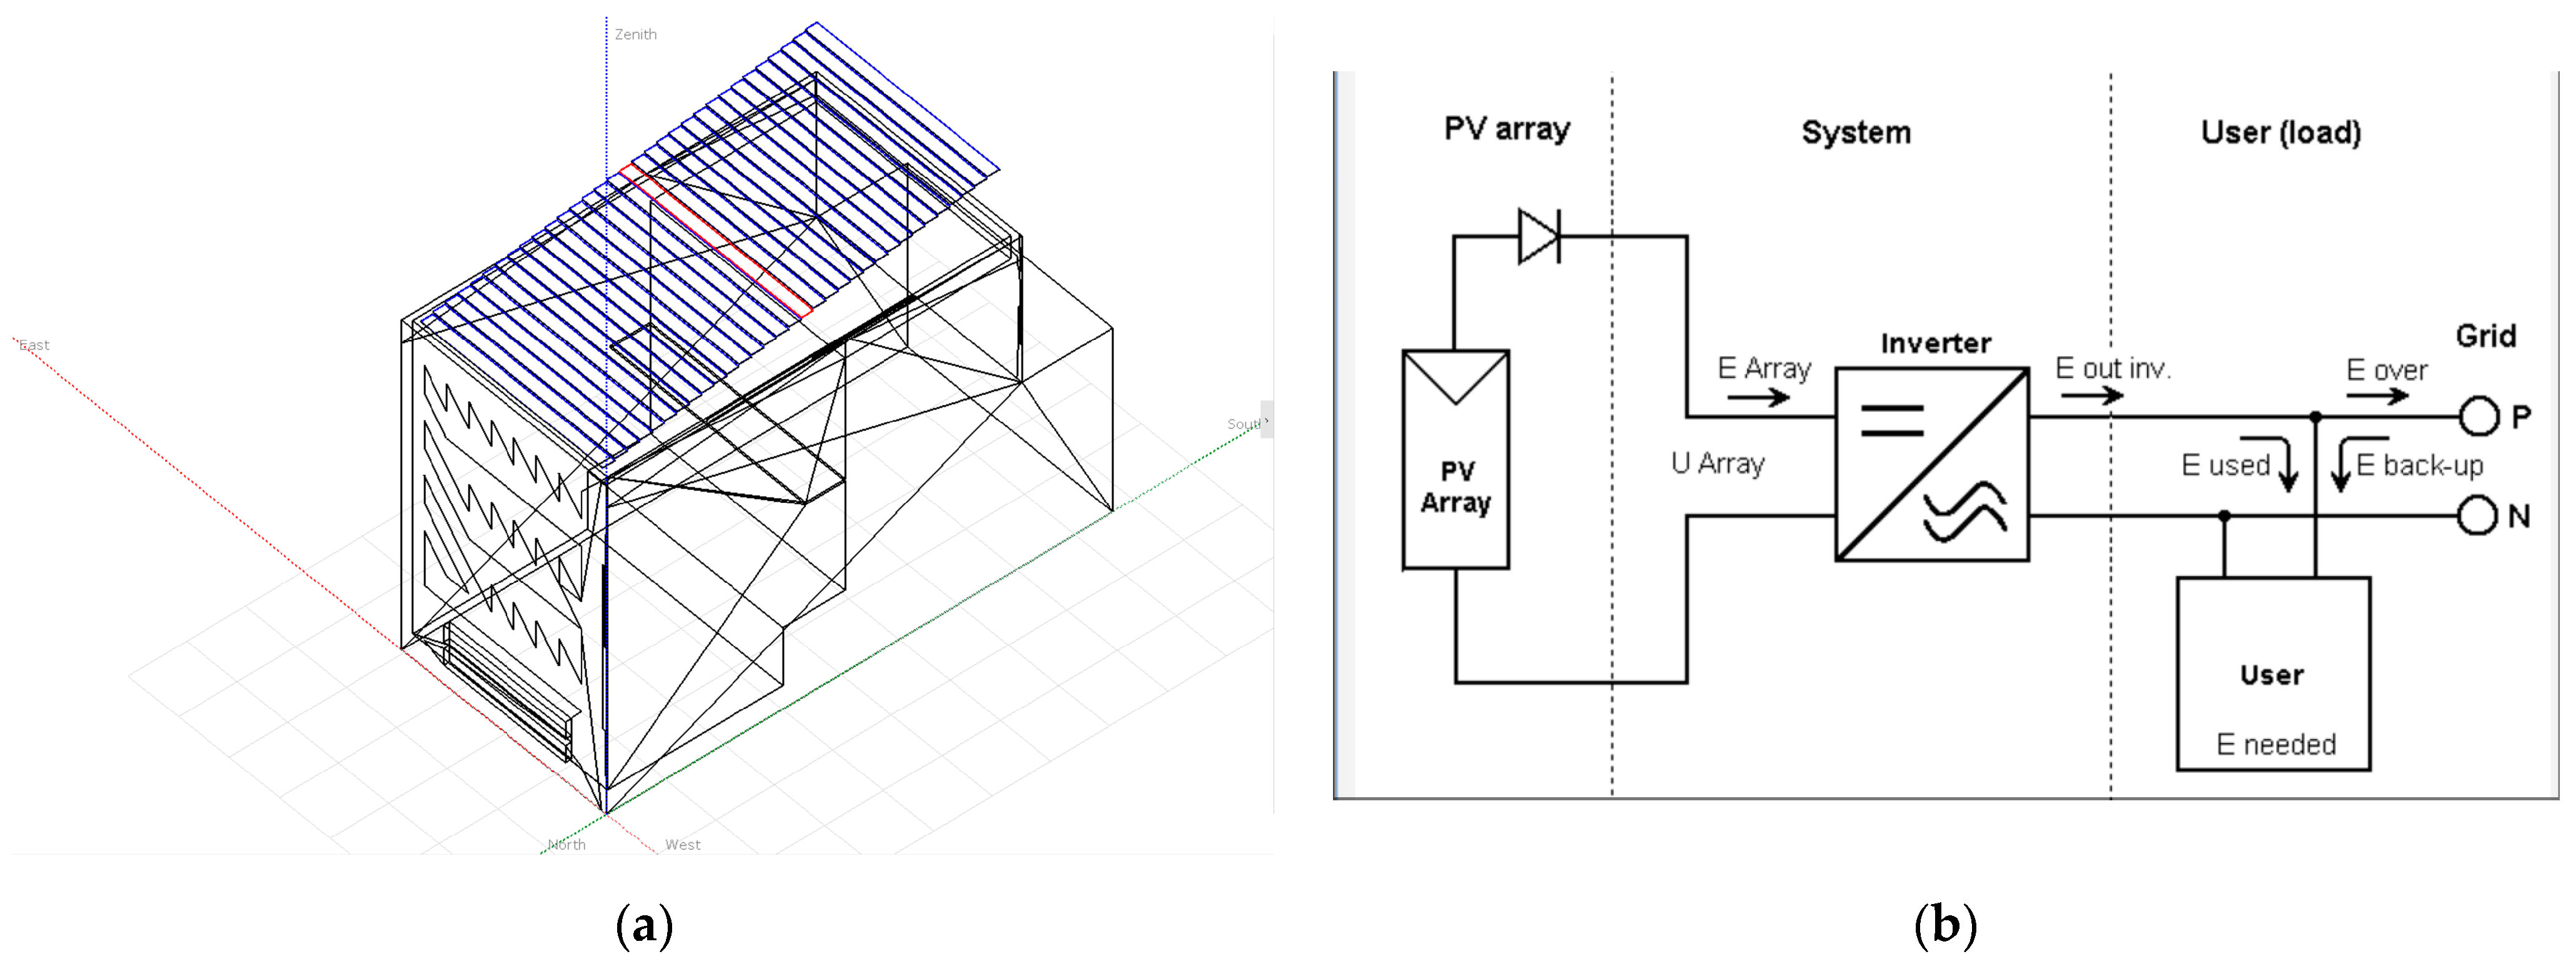
2.3. Photovoltaic Capacity Simulation
- The first step is to select the geographical location of the PV system based on its latitude and longitude. This ensures that the system design is tailored to the specific solar irradiance and climatic conditions of the selected region. In PVsyst, selecting the predefined Guangzhou site (Guangzhou_Baiyun_MN80) from the software’s database provides access to local climate data, such as solar irradiance, temperature, humidity, as well as time zone and altitude information.
- We then specify the electrical parameters of the PV system, including equipment specifications such as PV modules and the inverter. A 400 W PV module from the software’s predefined database is selected, as described in Table 2. The inverter is chosen based on the installed capacity using the predefined 100 kW model SUN2000-100KTL-H1. The PVsyst software package [PVsyst|Photovoltaic Software, Design and Simulate Photovoltaic Systems. Available online: https://www.pvsyst.com (accessed on 20 May 2025)] includes predefined detailed technical specifications for these electrical components, so no additional input from the user is required during the simulation process.
- Finally, based on the PV system configurations in each case (as shown in Table 3), the specific position of each row of PV panels is defined in PVsyst, thus allowing for the construction of a complete PV system model, as illustrated in Figure 4. PVsyst incorporates both the electrical equipment specifications and the 3D layout of the PV modules to account for factors affecting power generation, such as detailed electrical losses and near shading, and provides comprehensive simulation data.
3. Simulation of Operating Conditions
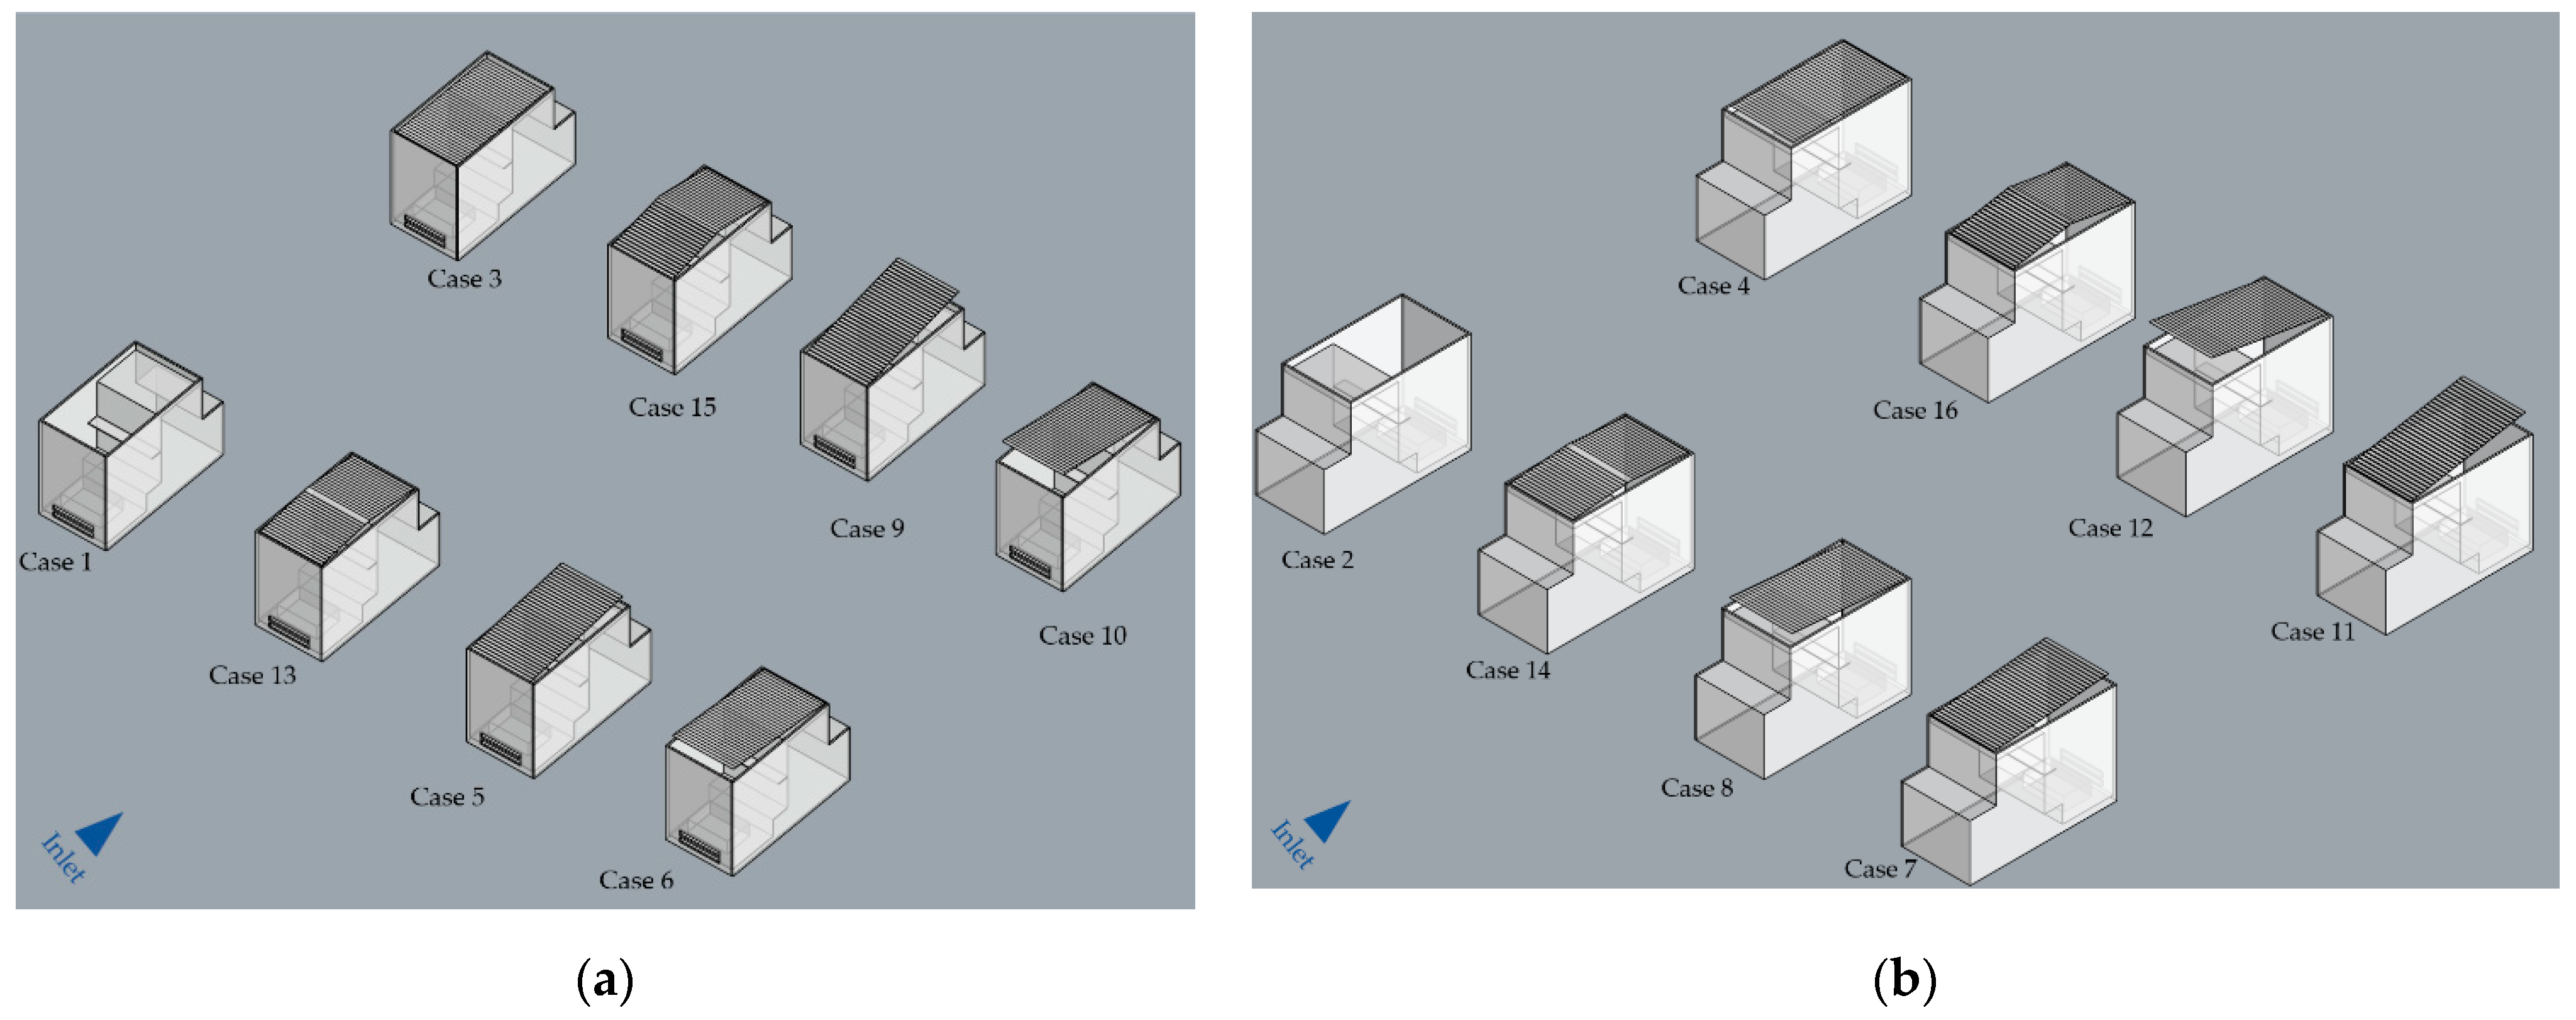
3.1. Case Study
3.2. Model Setup
4. Results and Discussion
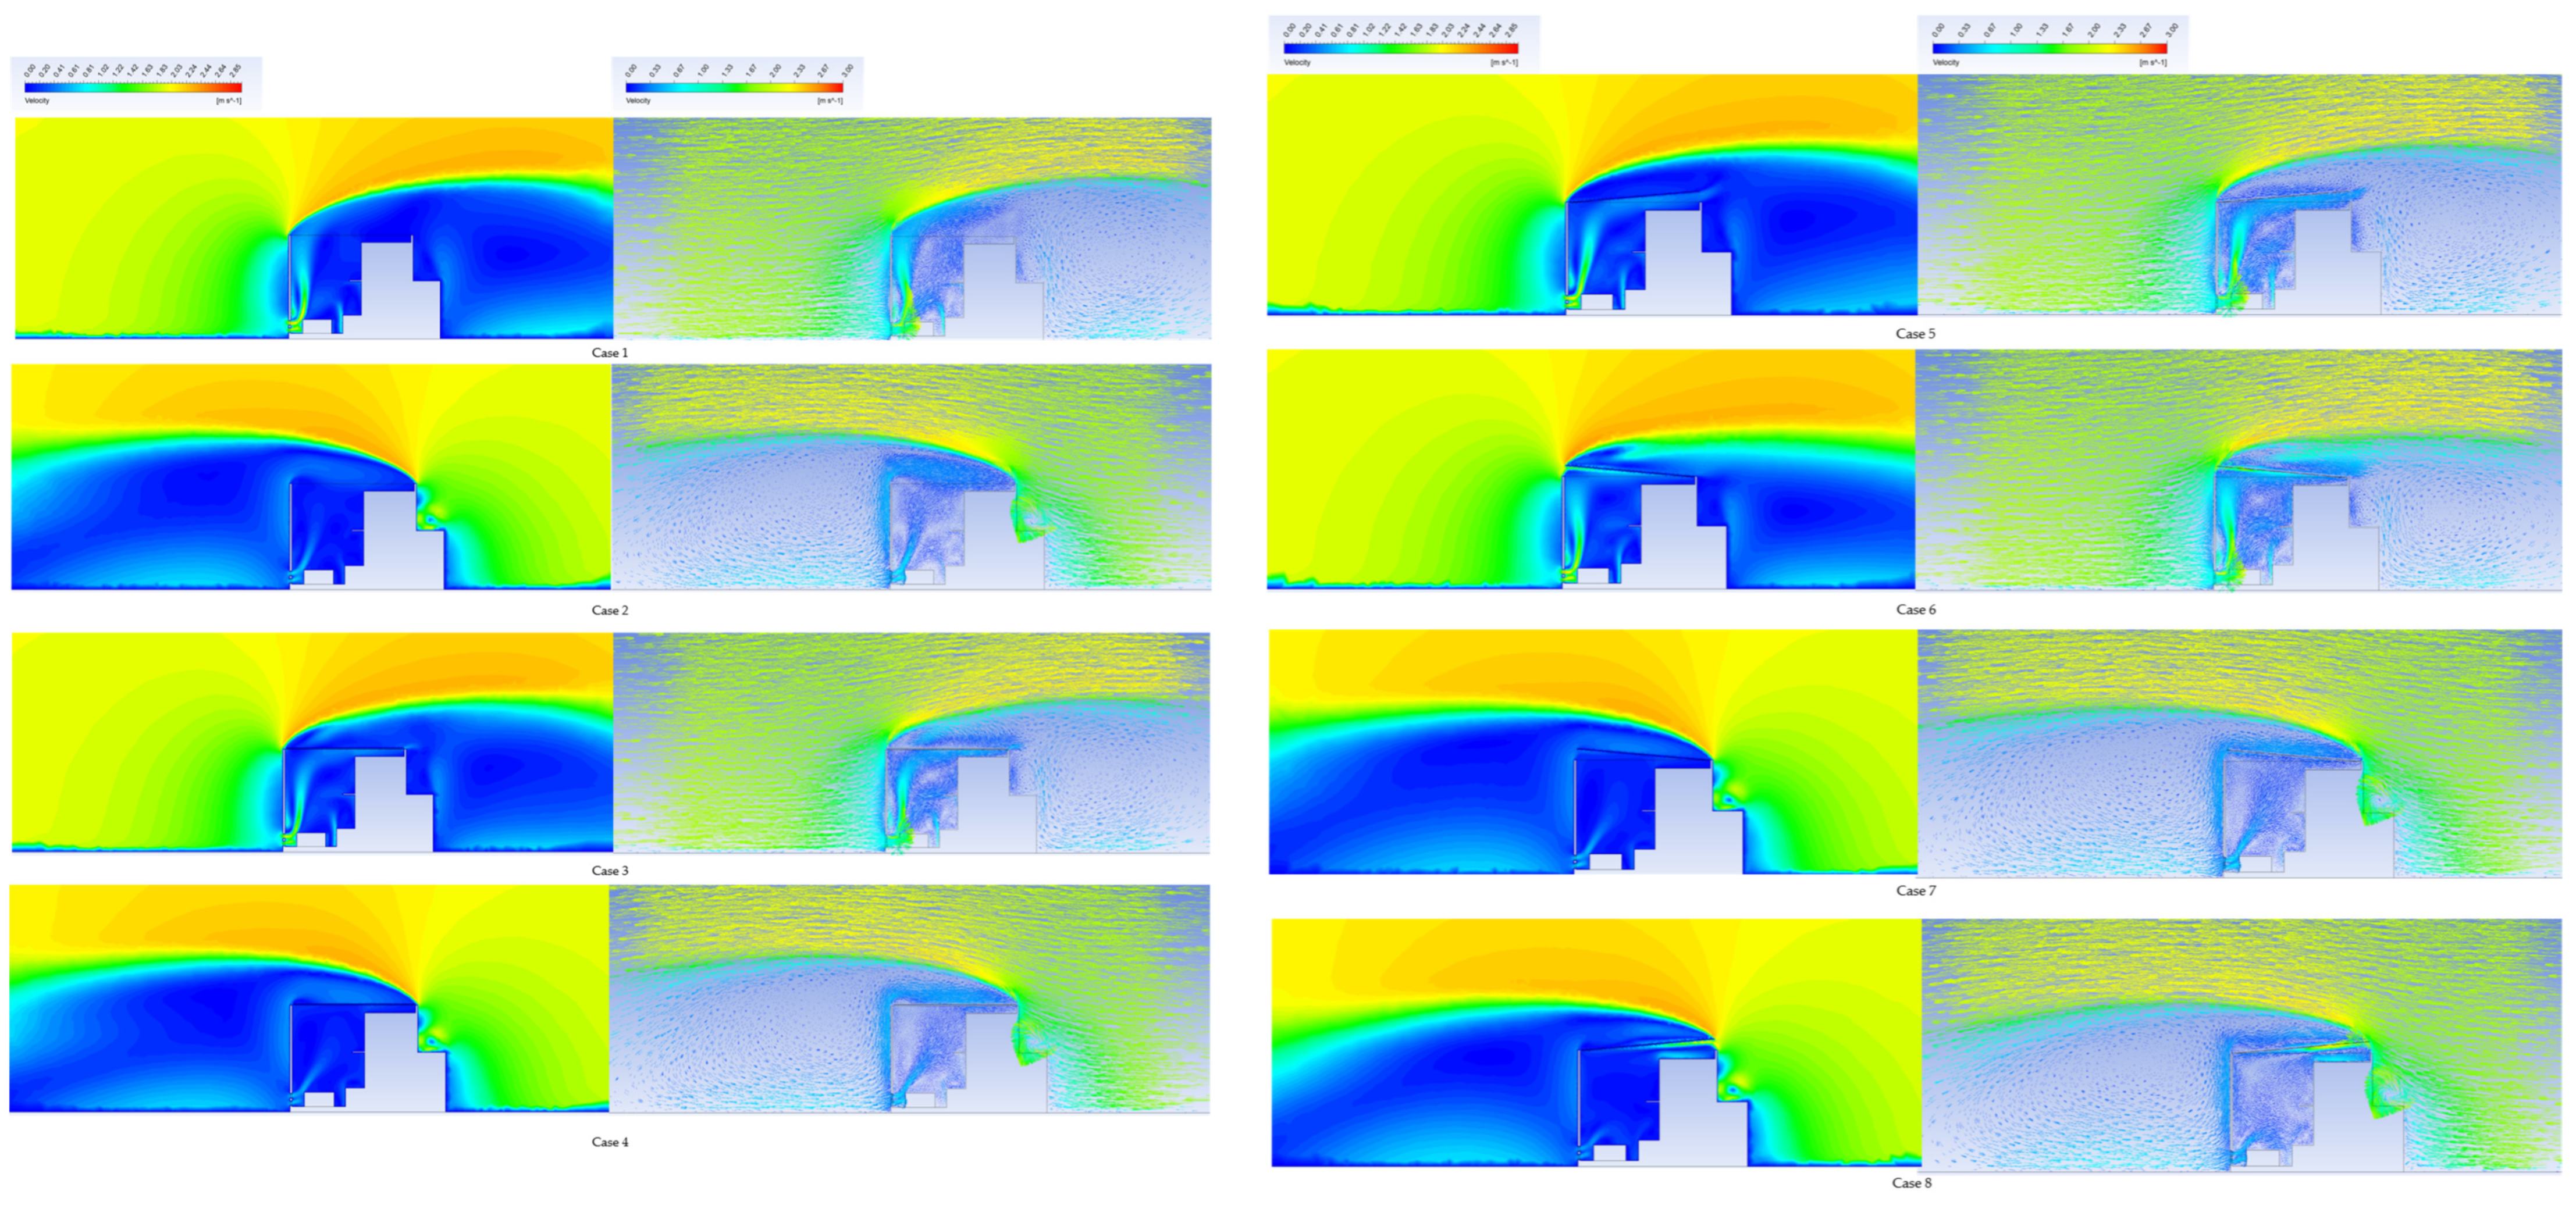
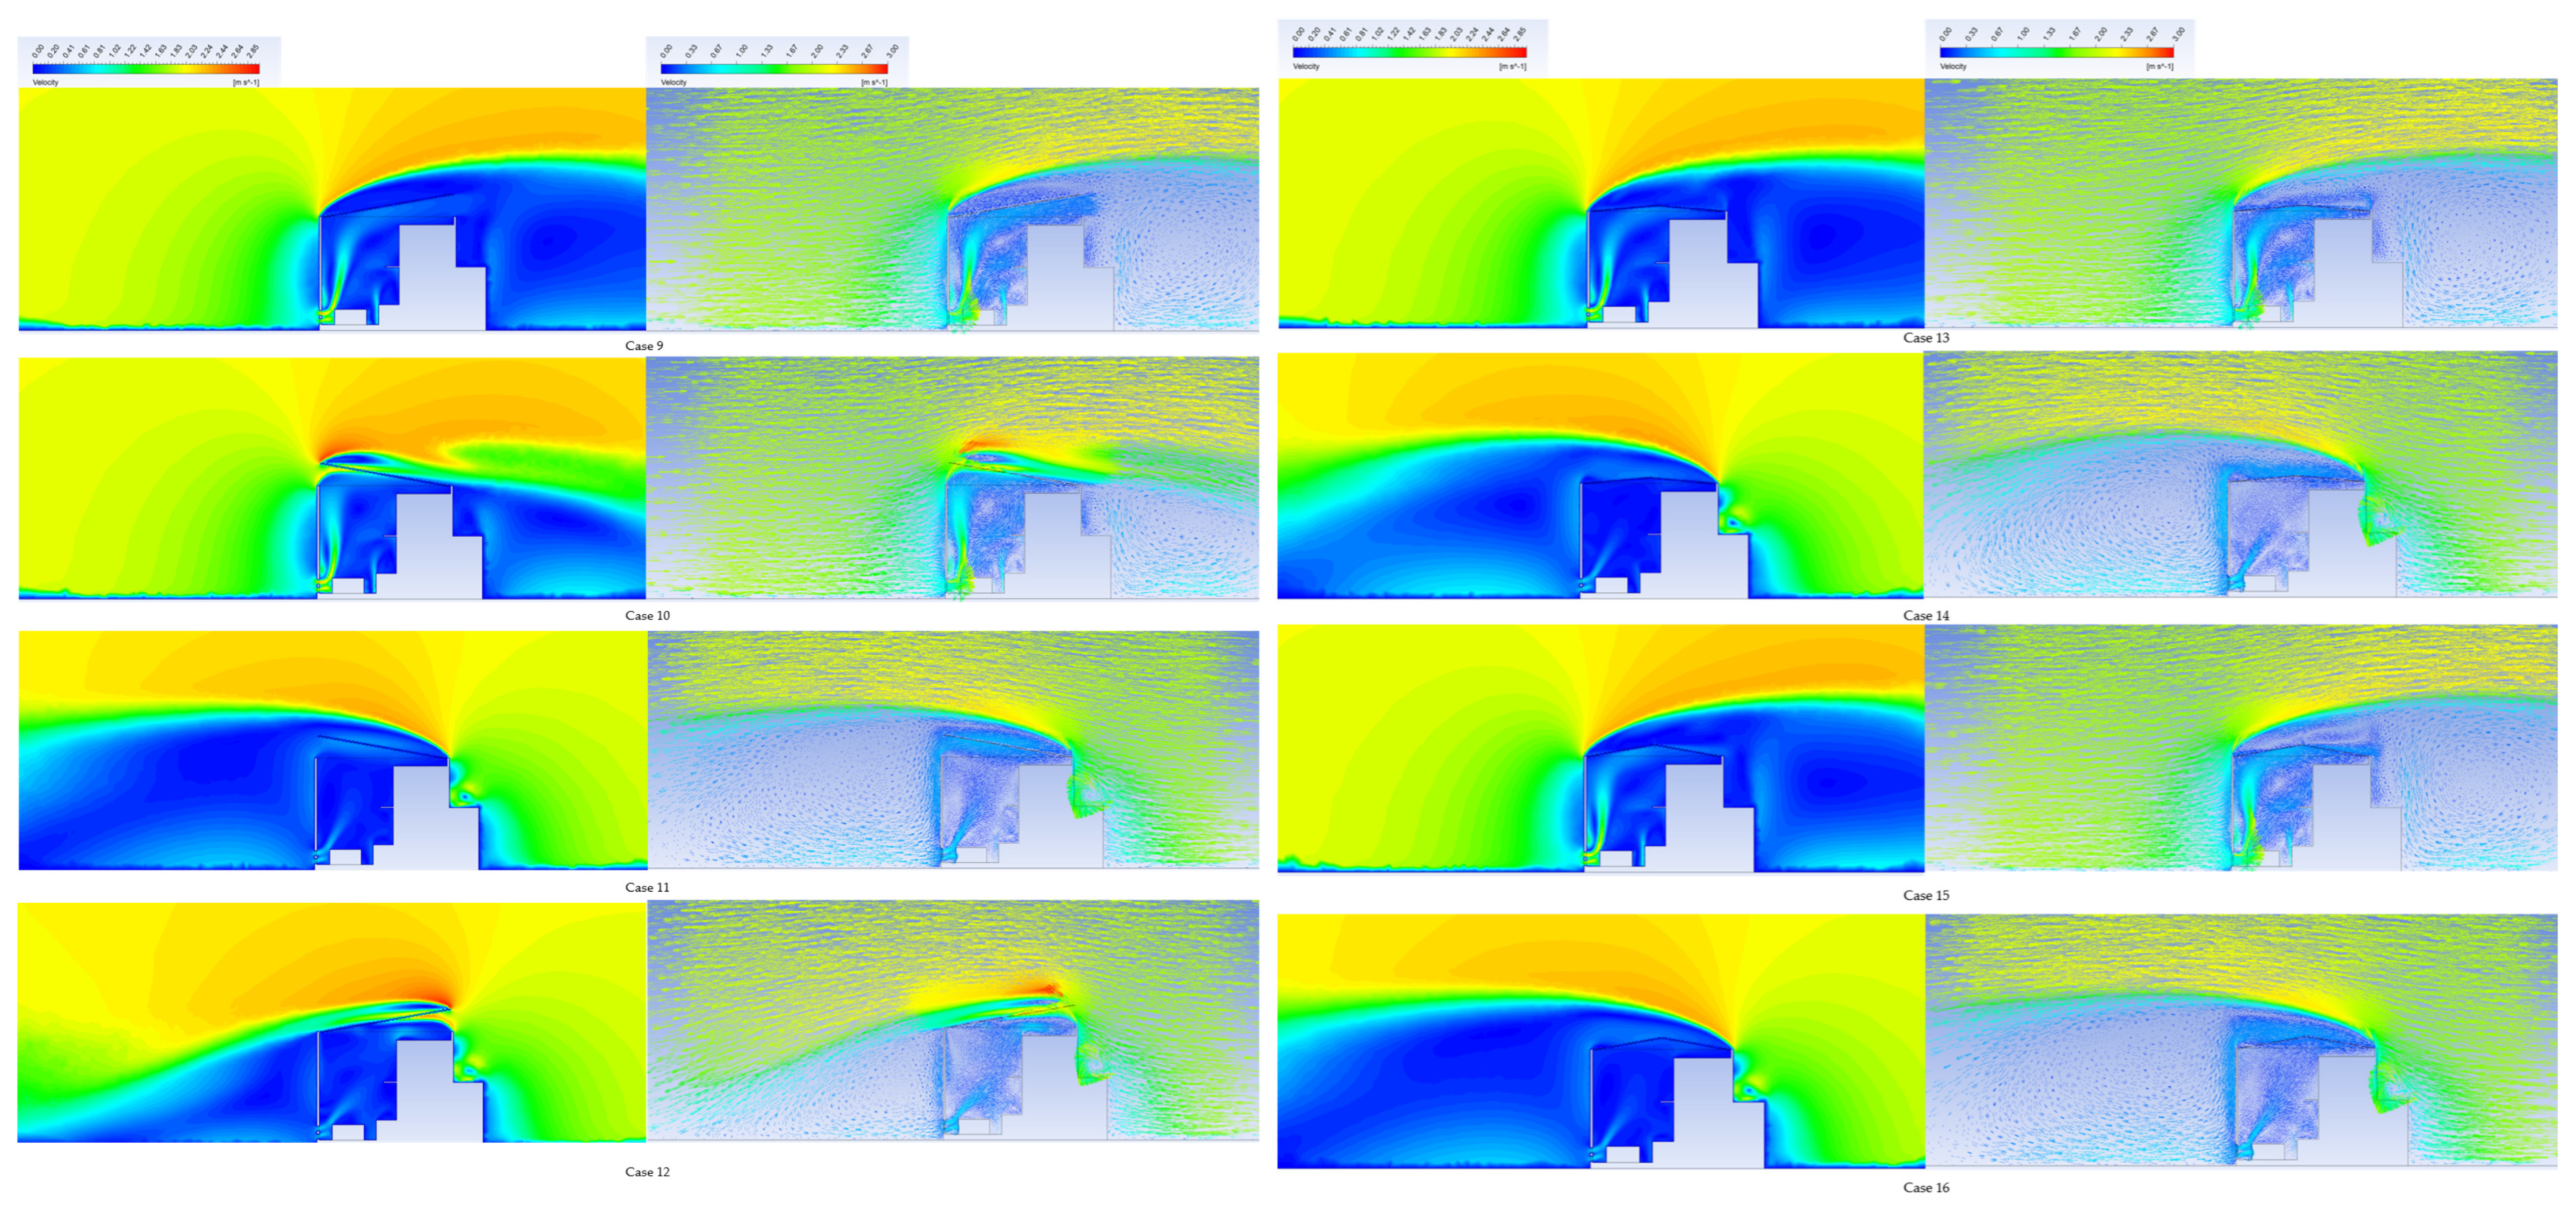
4.1. Effect of Roof PV Forms on Natural Ventilation
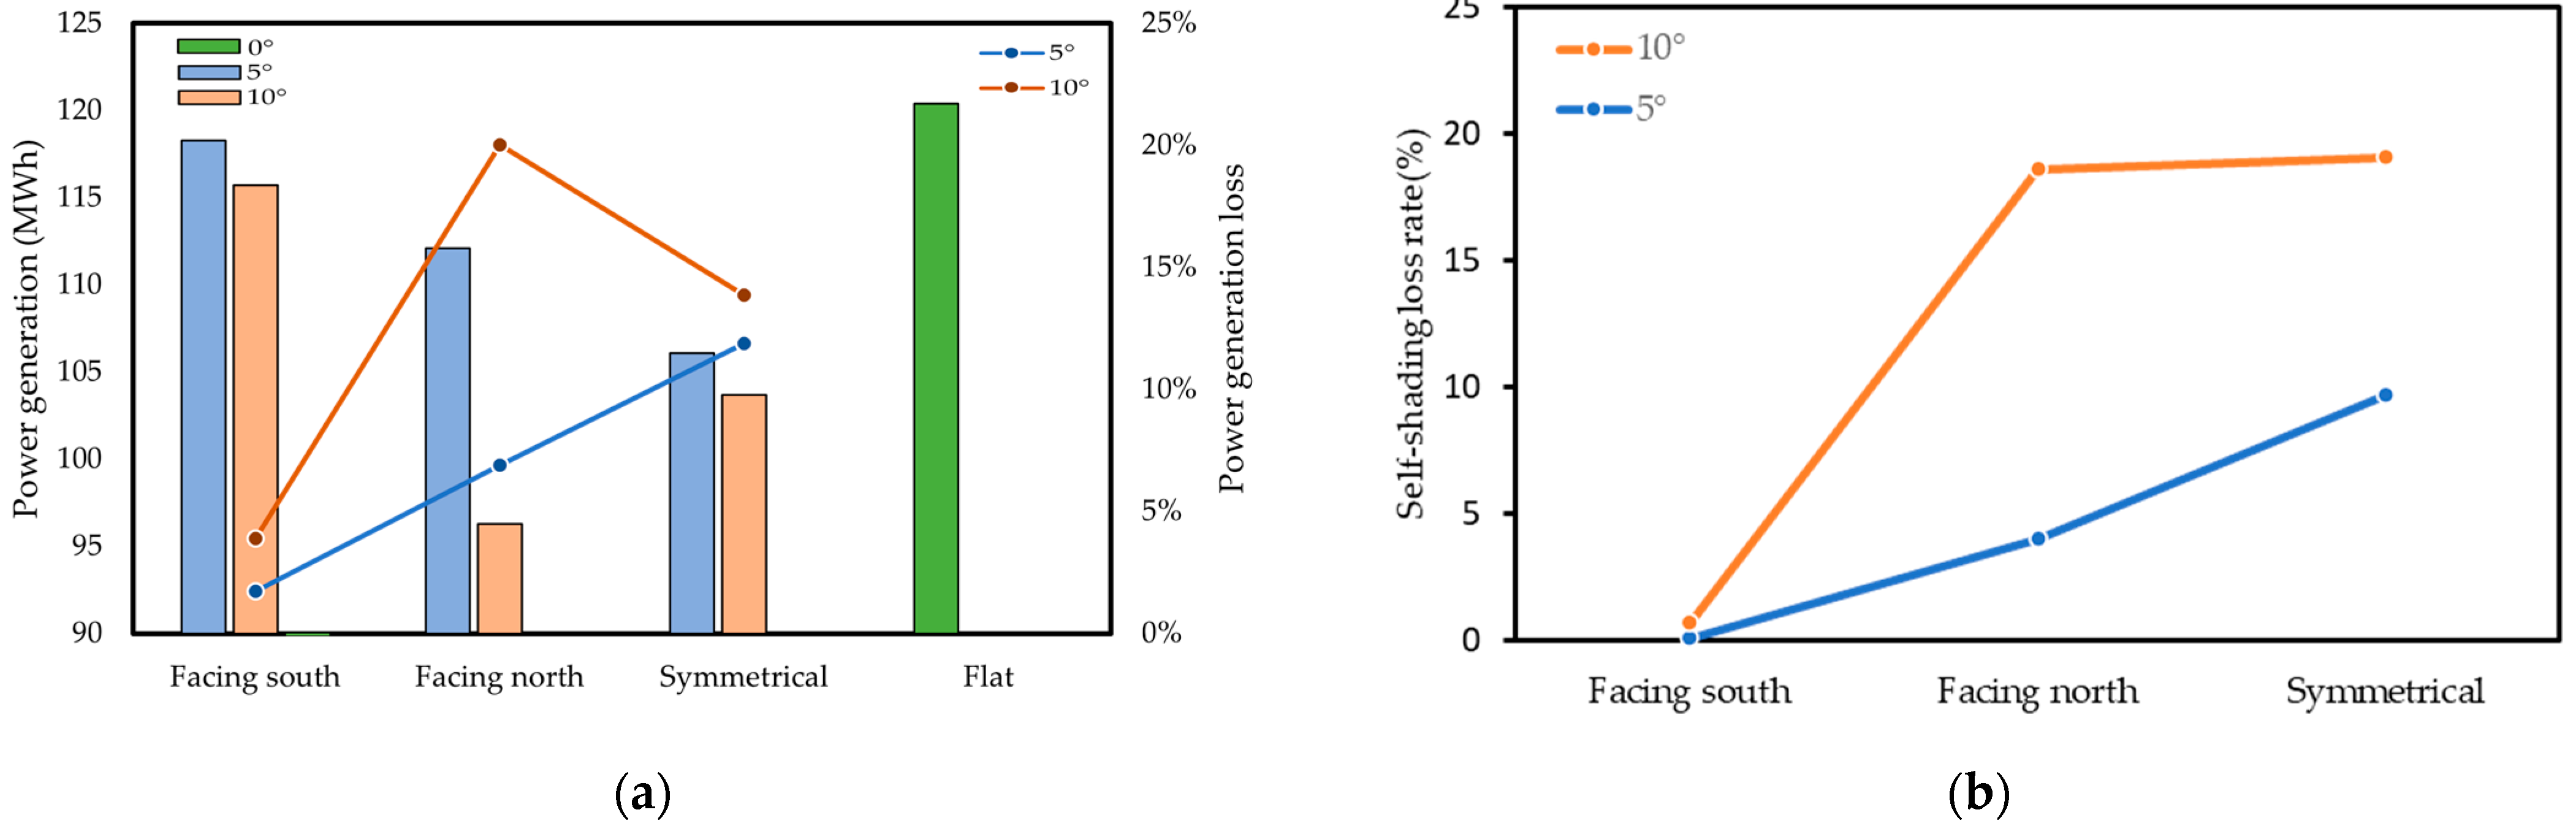
4.2. Influence of PV System Forms on Power Generation Output
4.3. Lessons Learned for PV Layouts in Semi-Outdoor Substations
5. Conclusions
- (1)
- The 10° symmetrical PV system offers the most balanced solution. Although the symmetrical pitched roof installation has relatively lower power output, it provides the most stable and reliable ventilation performance without introducing additional wind load risks. The 10° symmetrical PV system offers the most balanced solution in terms of ventilation velocity, airflow distribution in the transformer room, PV back surface cooling, and structural wind load risks, showing only a 0.6% reduction compared to the no-PV baseline and a 14.6% improvement over the horizontal PV system. While the symmetrical roof installation results in lower power generation, it provides the most reliable ventilation effect and eliminates concerns about the additional wind load.
- (2)
- The traditional horizontal PV installation method presents certain drawbacks for both natural ventilation in the main transformer room and heat dissipation from the rear side of the PV modules. In the windward condition, airflow velocity at the bottom ventilation zone is reduced by 13.2% and by 11.8% in the leeward condition. Therefore, when applying PV systems in semi-outdoor substations, it is essential to integrate wind environment assessments into the design process. However, this installation method is not affected in terms of power generation performance.
- (3)
- The unilateral pitched installation method requires a comprehensive evaluation of multiple factors. It is most suitable for environments with a consistent prevailing wind direction, where a windward layout can achieve dual optimization of power generation and natural ventilation. Compared to the horizontal PV system, ventilation performance improves by more than 10%, and the ventilation loss relative to the no-PV condition remains below 4%. For south-facing orientations, the power generation loss remains under 4%. However, this layout can lead to higher wind loads, increasing installation costs, and may also hinder the airflow entering the ventilation openings in windward configurations.
6. Patents
Author Contributions
Funding
Data Availability Statement
Conflicts of Interest
Appendix A
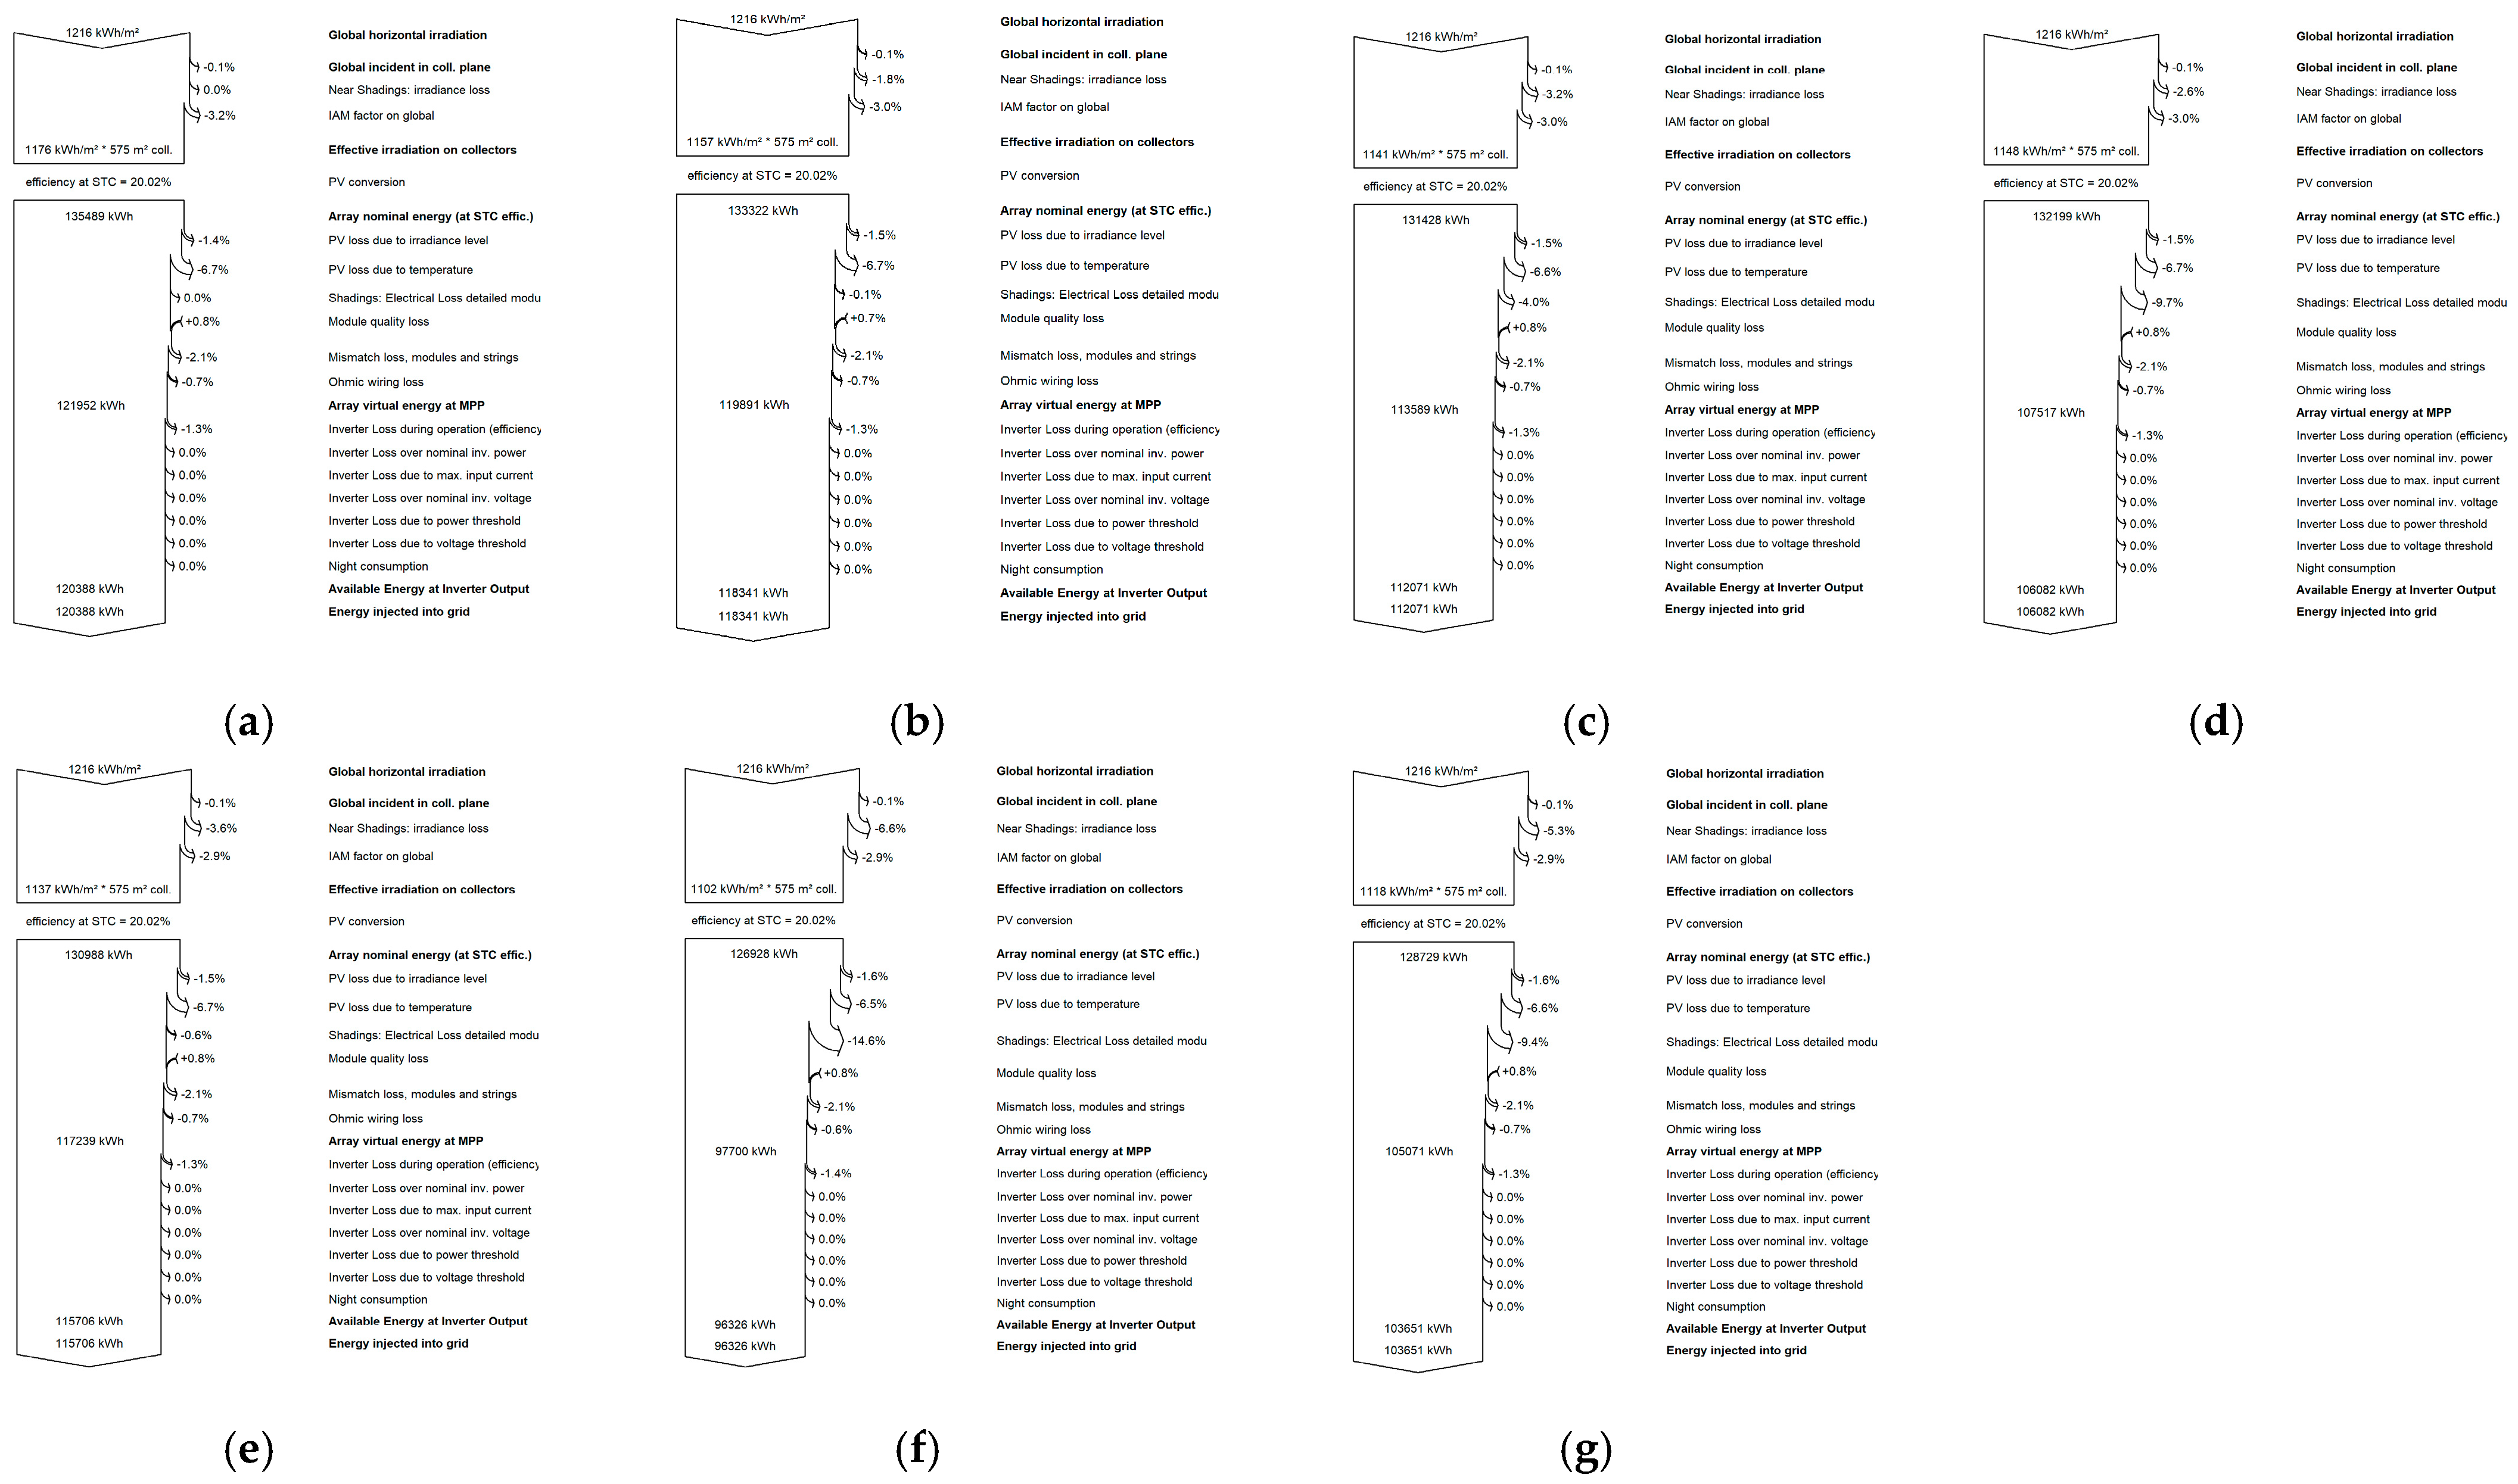
Loss Diagram of Cases in the Study for the Whole Year by PVsyst 7.2
Appendix B
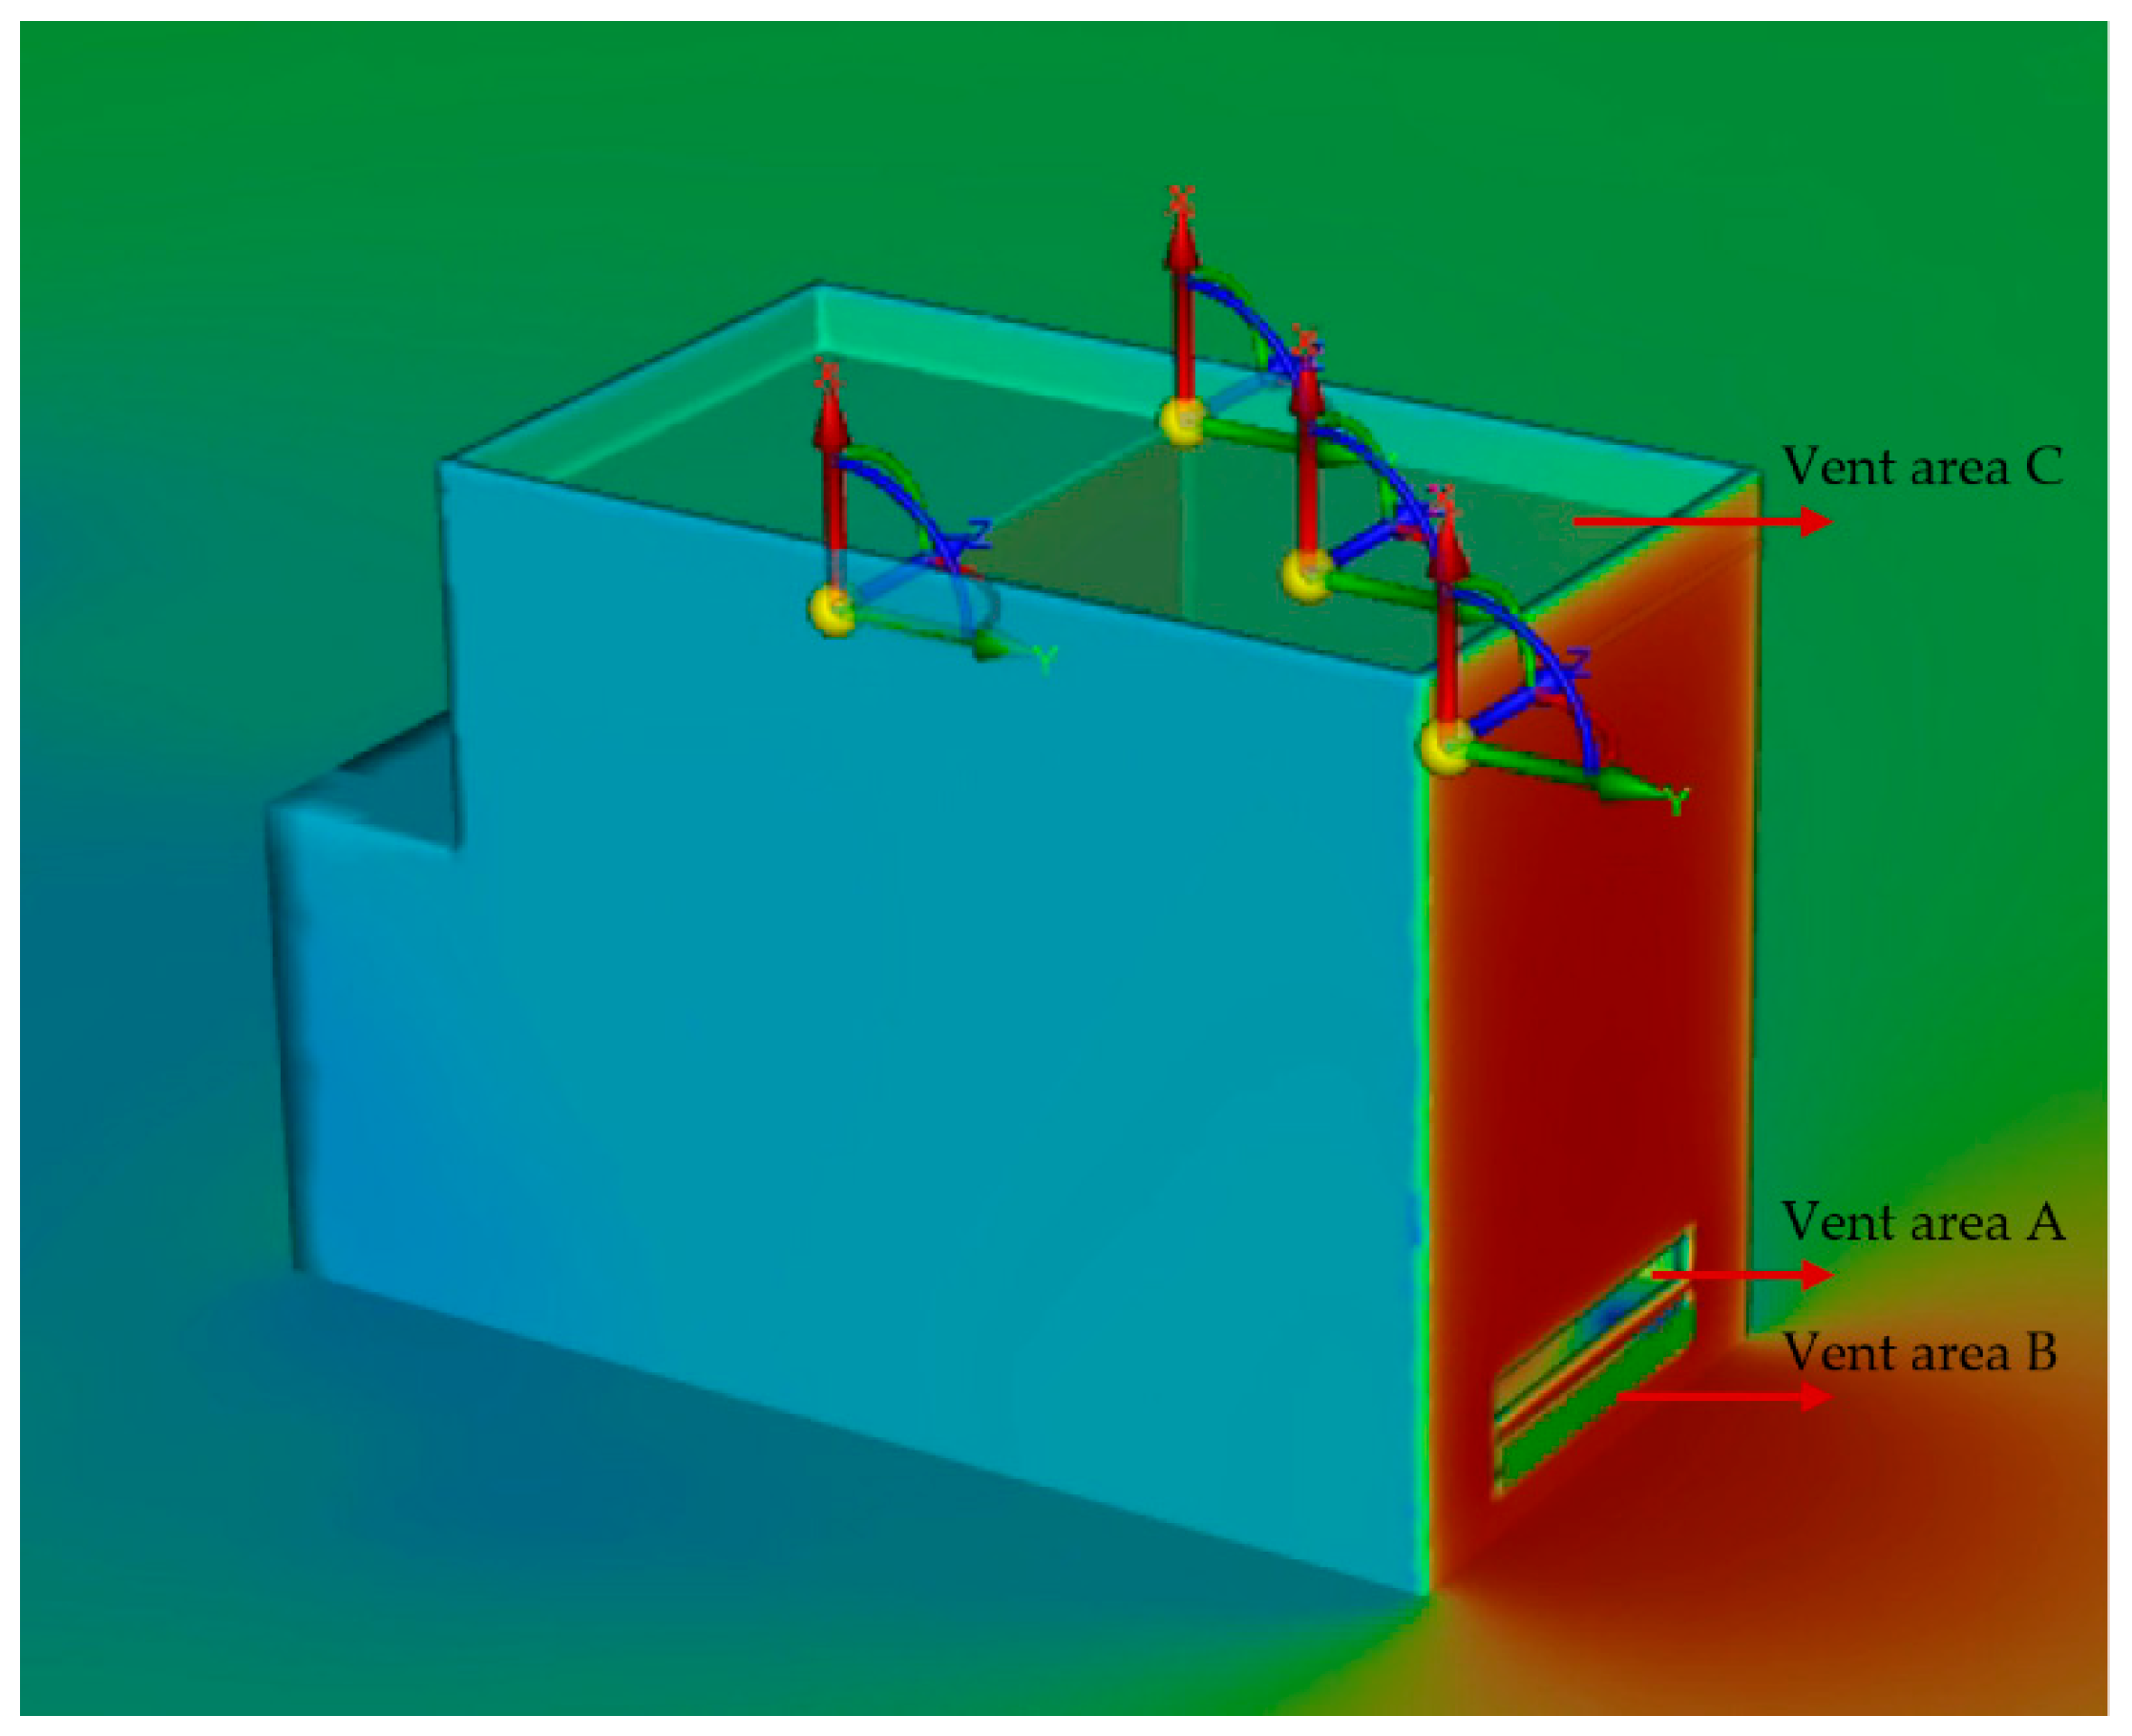
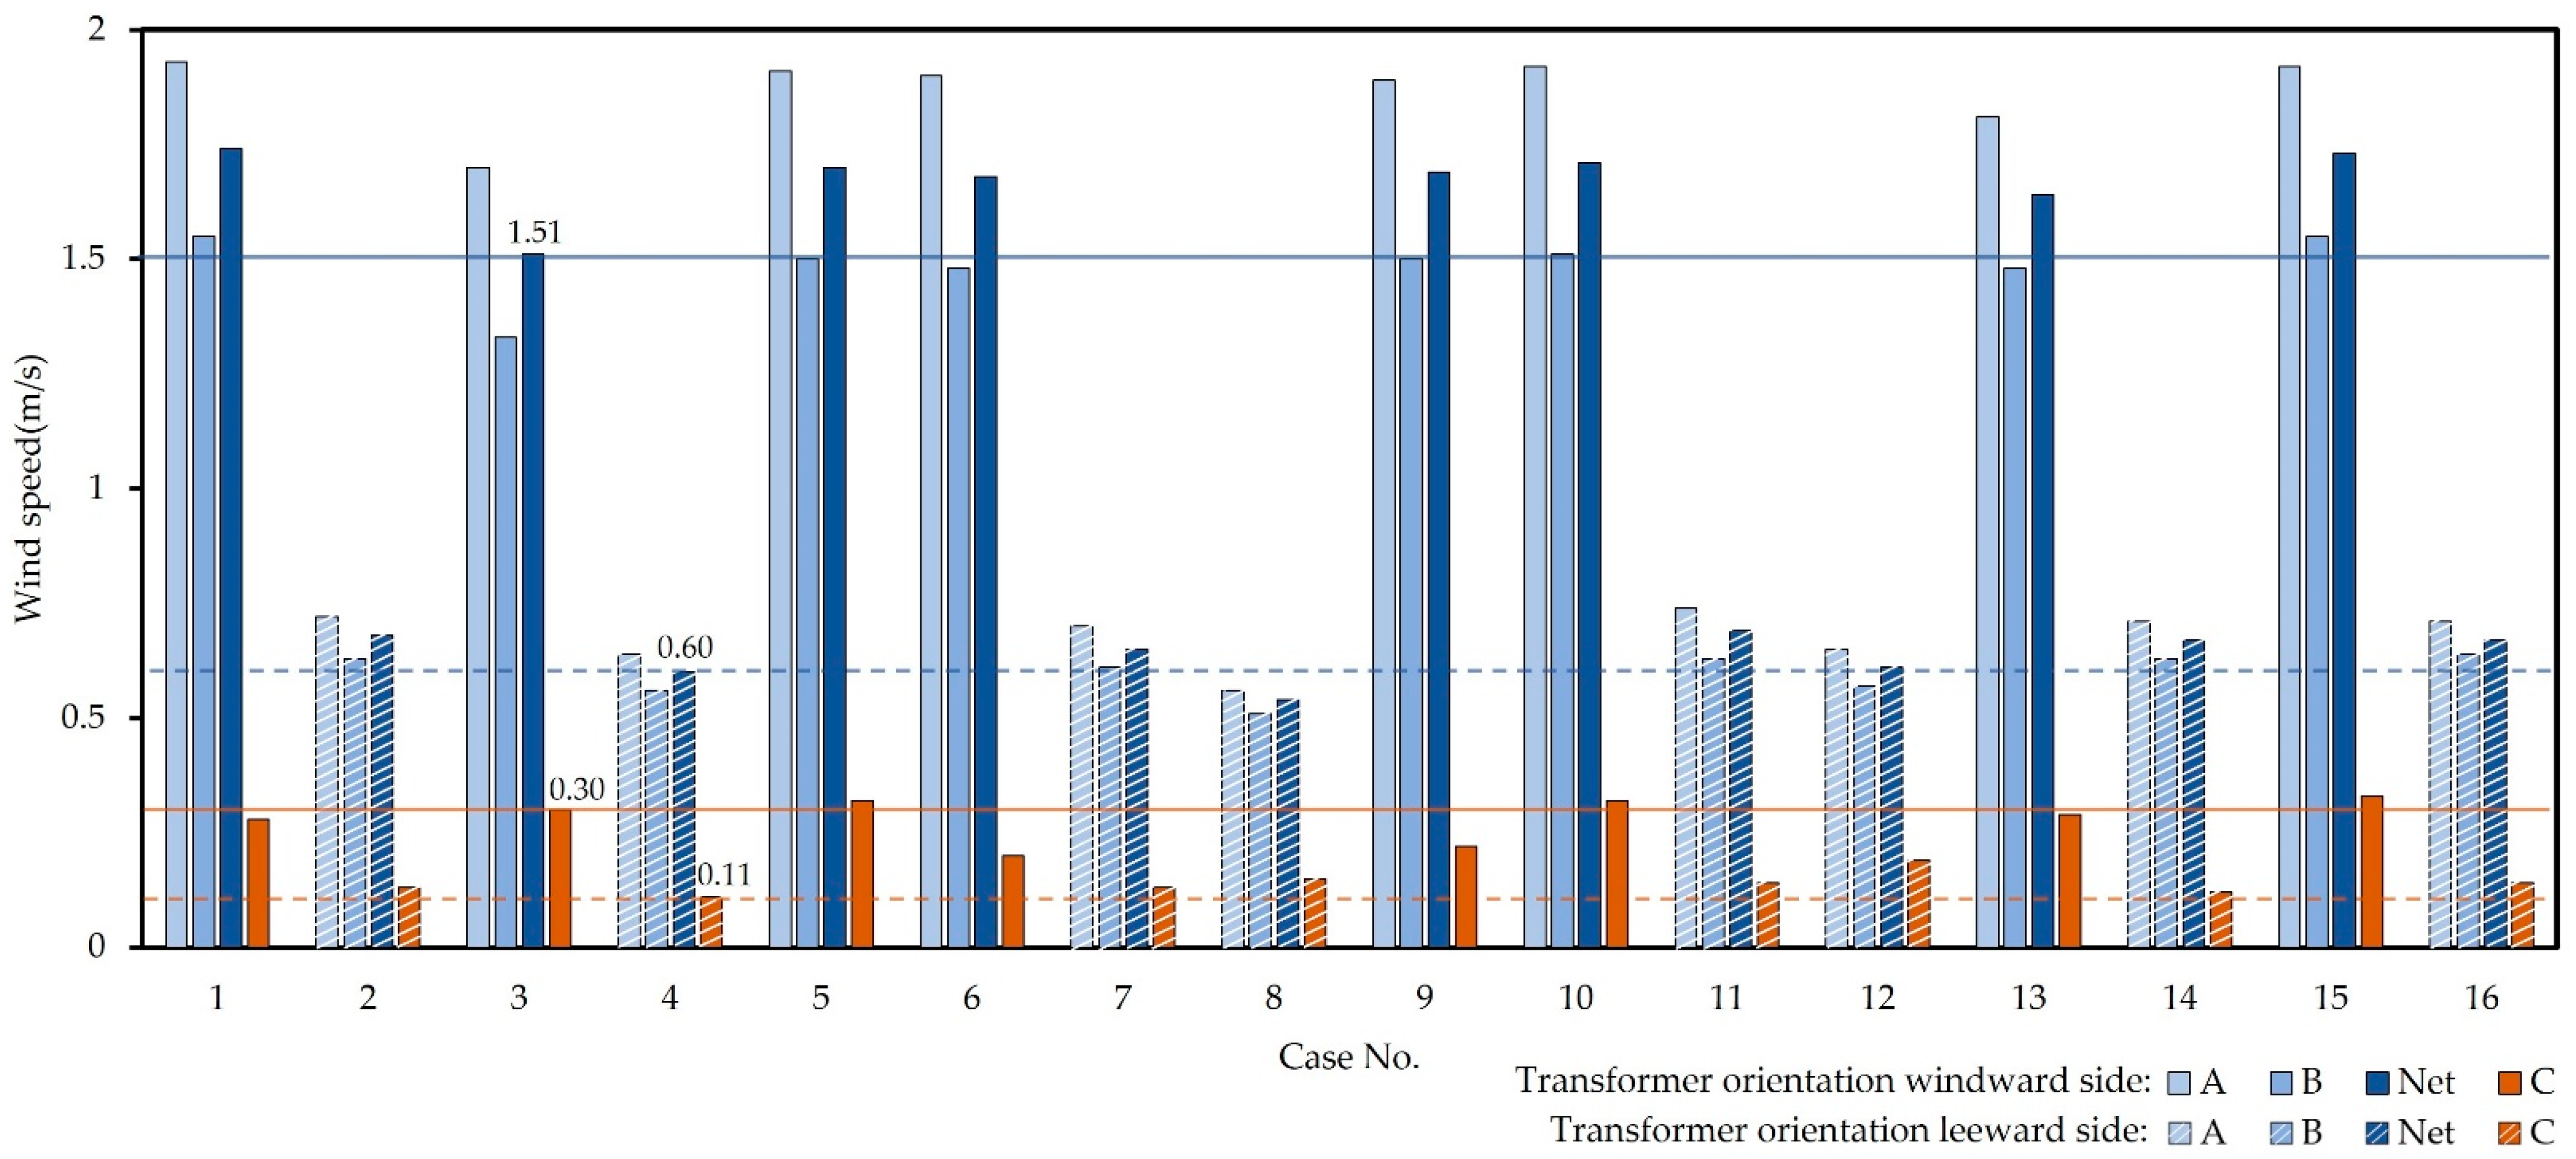
| Case No. | Transformer Orientation | Vent Area A (m/s) | Vent Area B (m/s) | Net of A and B (m/s) | Vent Area C (m/s) |
| 1 | Windward side | 1.93 | 1.55 | 1.74 | 0.28 |
| 2 | Leeward side | 0.72 | 0.63 | 0.68 | 0.13 |
| 3 | Windward side | 1.70 | 1.33 | 1.51 | 0.11 |
| 4 | Leeward side | 0.64 | 0.56 | 0.60 | 0.11 |
| 5 | Windward side | 1.91 | 1.50 | 1.70 | 0.32 |
| 6 | Windward side | 1.90 | 1.48 | 1.68 | 0.2 |
| 7 | Leeward side | 0.70 | 0.61 | 0.65 | 0.13 |
| 8 | Leeward side | 0.56 | 0.51 | 0.54 | 0.15 |
| 9 | Windward side | 1.89 | 1.50 | 1.69 | 0.22 |
| 10 | Windward side | 1.92 | 1.51 | 1.71 | 0.32 |
| 11 | Leeward side | 0.74 | 0.63 | 0.69 | 0.14 |
| 12 | Leeward side | 0.65 | 0.57 | 0.61 | 0.19 |
| 13 | Windward side | 1.81 | 1.48 | 1.64 | 0.29 |
| 14 | Leeward side | 0.71 | 0.63 | 0.67 | 0.12 |
| 15 | Windward side | 1.92 | 1.55 | 1.73 | 0.33 |
| 16 | Leeward side | 0.71 | 0.64 | 0.67 | 0.14 |
References
- United States Joint Economic Committee. Energy Efficiency Is a Bright Idea. Available online: https://www.jec.senate.gov/public/index.cfm/democrats/2007/6/energy-efficiency-is-a-bright-idea-_395 (accessed on 30 March 2025).
- Del Borghi, A.; Spiegelhalter, T.; Moreschi, L.; Gallo, M. Carbon-Neutral-Campus Building: Design Versus Retrofitting of Two University Zero Energy Buildings in Europe and in the United States. Sustainability 2021, 13, 9023. [Google Scholar] [CrossRef]
- Santamouris, M.; Vasilakopoulou, K. Present and future energy consumption of buildings: Challenges and opportunities towards decarbonisation. e-Prime—Adv. Electr. Eng. Electron. Energy 2021, 1, 100002. [Google Scholar] [CrossRef]
- The China Association of Building Energy Efficiency. Research Report on Carbon Emissions in the Urban and Rural Construction Sector. 2024. Available online: https://www.cabee.org/site/content/25289.html (accessed on 30 March 2025).
- Xinhua News Agency: China’s Policies and Actions for Addressing Climate Change. Available online: https://www.gov.cn/zhengce/2021-10/27/content_5646697.htm (accessed on 30 March 2025).
- Korra, C.; Sadhana V., A. Green Warehouses: The Benefits, Challenges and Strategies of Industrial Building Decarbonization. Int. J. Innov. Sci. Res. Technol. (IJISRT) 2024, 9, 1454–1462. [Google Scholar] [CrossRef]
- Reis, D.C.; De Domenico, A.T.; Lopes, L.; Almeida, M. Strategies and Actions for Achieving Carbon Neutrality in Portuguese Residential Buildings by 2050. Sustainability 2023, 15, 15626. [Google Scholar] [CrossRef]
- Solar Energy: Applications, Trends Analysis, Bibliometric Analysis and Research Contribution to Sustainable Development Goals (SDGs). Available online: https://www.mdpi.com/2071-1050/15/2/1418 (accessed on 30 March 2025).
- Notice of the General Office of the State Council. Work Plan for Accelerating Energy Conservation and Carbon Reduction in the Building Sector; National Development and Reform Commission and the Ministry of Housing and Urban-Rural Development: Beijing, China, 2024. [Google Scholar]
- Che, W.; Wang, Y.; Zhu, W.; Hong, L.; Fang, C.; Wu, H.; Liu, J. A Review of Carbon Emission Reduction During the Operation Stage of Substations. Sustainability 2024, 16, 10017. [Google Scholar] [CrossRef]
- Byrne, J.; Taminiau, J.; Kurdgelashvili, L.; Kim, K.N. A Review of the Solar City Concept and Methods to Assess Rooftop Solar Electric Potential, with an Illustrative Application to the City of Seoul. Renew. Sustain. Energy Rev. 2015, 41, 830–844. [Google Scholar] [CrossRef]
- Sha, Y.; Xu, J. Construction Plan for Rooftop Distributed PV Systems in Urban 110 kV Indoor Substations. Electr. Power Energy 2022, 43, 524–528. [Google Scholar]
- Shenzhen Power Grid Construction Accelerates Across the Board: Number of New Substations and Main Transformer Capacity in 2023 Both Reach Highest Levels in a Decade—Shenzhen News Network. Available online: https://www.sznews.com/news/content/2024-01/19/content_30707543.htm (accessed on 30 March 2025).
- Qin, T. Research on the Application of Photovoltaic Power Generation Technology in Green and Energy-Efficient Renovation Projects of Substations. Hydropower Tech. Superv. 2024, 10, 251–254. [Google Scholar]
- Corti, P.; Bonomo, P.; Frontini, F. Paper Review of External Integrated Systems as Photovoltaic Shading Devices. Energies 2023, 16, 5542. [Google Scholar] [CrossRef]
- Tang, B.; Zhang, L.; Liu, S.; Bai, X.; Chen, G.; Shang, Z. Calculation of Noise Field in Main Transformer Room of Indoor Substation Based on Thermal-Acoustic Coupling. Energy 2024, 297, 131046. [Google Scholar] [CrossRef]
- Chen, Y.; Shao, Y.; Li, Y.; Deng, L.; Che, D. Numerical Simulation and Optimization of Ventilation and Heat Dissipation in Main Transformer Room of Semi-Indoor Substations. Appl. Therm. Eng. 2025, 269, 126105. [Google Scholar] [CrossRef]
- Chen, C.-M.; Lin, Y.-P.; Chung, S.-C.; Lai, C.-M. Effects of the Design Parameters of Ridge Vents on Induced Buoyancy-Driven Ventilation. Buildings 2022, 12, 112. [Google Scholar] [CrossRef]
- Cao, Z.; Liu, Y.; Bai, Y.; Wang, Y.; Ye, S.; Cao, H. Study on the Optimal Layout of Roof Vents and Rooftop Photovoltaic of the Industrial Workshop. Build. Environ. 2024, 260, 111624. [Google Scholar] [CrossRef]
- Wang, H.; Wei, J.; Guo, C.; Yang, L.; Wang, Z. Numerical Investigation of the Effects of Different Influencing Factors on Thermal Performance of Naturally Ventilated Roof. Energy 2024, 289, 130039. [Google Scholar] [CrossRef]
- Roeleveld, D.; Hailu, G.; Fung, A.; Naylor, D.; Yang, T.; Athienitis, A. Validation of Computational Fluid Dynamics (CFD) Model of a Building Integrated Photovoltaic/Thermal (BIPV/T) System. Energy Procedia 2015, 78, 1901–1906. [Google Scholar] [CrossRef]
- Baloch, A.A.B.; Bahaidarah, H.M.S.; Gandhidasan, P.; Al-Sulaiman, F.A. Experimental and Numerical Performance Analysis of a Converging Channel Heat Exchanger for PV Cooling. Energy Convers. Manag. 2015, 103, 14–27. [Google Scholar] [CrossRef]
- Zhou, Q.; Dong, P.; Li, M.; Wang, Z. Analyzing the interactions between photovoltaic system and its ambient environment using CFD techniques: A review. Energy Build. 2023, 296, 113394. [Google Scholar] [CrossRef]
- Lebbi, M.; Boutina, L.; Hassani, S.; Touafek, K.; Khelifa, A.; Kherrour, S.; Benchatti, A. Improvement of the Photovoltaic Panel Cooling by Natural Air Ventilation. Environ. Prog. Sustain. Energy 2024, 43, e14304. [Google Scholar] [CrossRef]
- Zhang, H.; Wang, L.; Yang, P.; Liu, Y.; Zhu, C.; Wang, L.; Zhong, H. Optimizing air inlet designs for enhanced natural ventilation in indoor substations: A numerical modelling and CFD simulation study. Case Stud. Therm. Eng. 2024, 59, 104408. [Google Scholar] [CrossRef]
- Chen, H.; Zhang, H.-M.; Wu, S.-Y.; Liu, Y.-W.; Zhong, H. Numerical simulation and optimisation design for ventilation and heat dissipation in high-temperature and high-load indoor substations. Case Stud. Therm. Eng. 2024, 59, 104502. [Google Scholar] [CrossRef]
- Wang, Y.; Jin, X.; Zhang, J.; Zeng, C.; Gao, X.; Zhao, L.; Sha, S. Scheme Design and Energy-Saving Optimization of Cold and Heat Energy Supply System for Substation Main Control Building in Cold Area. Appl. Sci. 2024, 14, 1562. [Google Scholar] [CrossRef]
- Ricci, A.; Kalkman, I.; Blocken, B.; Burlando, M.; Freda, A.; Repetto, M. Local-Scale Forcing Effects on Wind Flows in an Urban Environment: Impact of Geometrical Simplifications. J. Wind. Eng. Ind. Aerodyn. 2017, 170, 238–255. [Google Scholar] [CrossRef]
- Muhsin, F.; Yusoff, W.F.M.; Mohamed, M.F.; Sapian, A.R. CFD Modeling of Natural Ventilation in a Void Connected to the Living Units of Multi-Storey Housing for Thermal Comfort. Energy Build. 2017, 144, 1–16. [Google Scholar] [CrossRef]
- Tominaga, Y.; Mochida, A.; Yoshie, R.; Kataoka, H.; Nozu, T.; Yoshikawa, M.; Shirasawa, T. AIJ Guidelines for Practical Applications of CFD to Pedestrian Wind Environment around Buildings. J. Wind. Eng. Ind. Aerodyn. 2008, 96, 1749–1761. [Google Scholar] [CrossRef]
- Serra, N. Revisiting RANS Turbulence Modelling Used in Built-Environment CFD Simulations. Build. Environ. 2023, 237, 110333. [Google Scholar] [CrossRef]
- Guangzhou Weather. Available online: http://www.tqyb.com.cn/gz/climaticprediction/bulletin/ (accessed on 31 March 2025).
- Wu, Y. Research on Urban Block Ventilation Optimization Method Based on Surrogate Models—Taking Guangzhou as an Example. Ph.D. Thesis, Wuhan University, Wuhan, China, 2023. [Google Scholar]
- IEC 61724; Photovoltaic System Performance Monitoring—Guidelines for Measurement, Data Exchange and Analysis. International Electrotechnical Commission: Geneva, Switzerland, 2021.
- Serat, Z.; Chen, X.; Zuo, H.; Li, J. Design Strategies for Building Rooftop Photovoltaic Systems: Efficiency and Grid Integration. J. Build. Eng. 2025, 100, 111693. [Google Scholar] [CrossRef]
- Xu, D.; Zhang, L.; Wang, H.; Wang, K.; Zhang, W. An Investigation of the Ventilation Systems of Whole-Indoor Urban Substations. Buildings 2024, 14, 3749. [Google Scholar] [CrossRef]


| Item | Parameter (m) |
|---|---|
| Transformer substation | 80.4 × 43.2 × 29.6 |
| the simplified model | 20.1× 43.2 × 29.6 |
| Transformer room | 19.1 × 20.0 × 29.6 |
| Transformer | 12.0 × 8.2 × 4.0 |
| Vents | 12.0 × 1.5 × 0.5 |
| Type | Maximum Power (W) | Maximum Voltage (V) | Maximum Current (A) | Open Circuit Voltage (V) | Open Circuit Current (A) | Temperature Coefficient (%/°C) | Dimensions (mm) |
|---|---|---|---|---|---|---|---|
| Si-mono | 400 | 41.10 | 9.730 | 49.83 | 10.380 | 0.040 | 1984 × 1007 × 40 |
| Case No. | Transformer Orientation | Roof Type | Roof Slope (°) | Roof Orientation |
|---|---|---|---|---|
| 1 | Windward side | None | None | None |
| 2 | Leeward side | None | None | None |
| 3 | Windward side | Flat | 0 | None |
| 4 | Leeward side | Flat | 0 | None |
| 5 | Windward side | Unilateral pitched roof | 5 | Windward side |
| 6 | Windward side | Unilateral pitched roof | 5 | Leeward side |
| 7 | Leeward side | Unilateral pitched roof | 5 | Windward side |
| 8 | Leeward side | Unilateral pitched roof | 5 | Leeward side |
| 9 | Windward side | Unilateral pitched roof | 10 | Windward side |
| 10 | Windward side | Unilateral pitched roof | 10 | Leeward side |
| 11 | Leeward side | Unilateral pitched roof | 10 | Windward side |
| 12 | Leeward side | Unilateral pitched roof | 10 | Leeward side |
| 13 | Windward side | Symmetrical pitched roof | 5 | None |
| 14 | Leeward side | Symmetrical pitched roof | 5 | None |
| 15 | Windward side | Symmetrical pitched roof | 10 | None |
| 16 | Leeward side | Symmetrical pitched roof | 10 | None |
| Zone | Material | Density (kg/m3) | Specific Heat Capacity (J/kg·K) | Thermal Conductivity (W/m2·K) | Emissivity |
|---|---|---|---|---|---|
| Indoor and outdoor air | Air | 1.125 | 1.013 | 2.585 | / |
| wall | Cement | 2800 | 856 | 2.25 | 0.94 |
| Ground surface | Cement | 2800 | 856 | 2.25 | 0.94 |
Disclaimer/Publisher’s Note: The statements, opinions and data contained in all publications are solely those of the individual author(s) and contributor(s) and not of MDPI and/or the editor(s). MDPI and/or the editor(s) disclaim responsibility for any injury to people or property resulting from any ideas, methods, instructions or products referred to in the content. |
© 2025 by the authors. Licensee MDPI, Basel, Switzerland. This article is an open access article distributed under the terms and conditions of the Creative Commons Attribution (CC BY) license (https://creativecommons.org/licenses/by/4.0/).
Share and Cite
Wu, X.; Wang, Y.; Cai, Z.; Su, P. Study on Roof Ventilation and Optimized Layout of Photovoltaics for Semi-Outdoor Main Transformer Rooms in Substations. Appl. Sci. 2025, 15, 6223. https://doi.org/10.3390/app15116223
Wu X, Wang Y, Cai Z, Su P. Study on Roof Ventilation and Optimized Layout of Photovoltaics for Semi-Outdoor Main Transformer Rooms in Substations. Applied Sciences. 2025; 15(11):6223. https://doi.org/10.3390/app15116223
Chicago/Turabian StyleWu, Xiaohui, Yanfeng Wang, Zhiwen Cai, and Ping Su. 2025. "Study on Roof Ventilation and Optimized Layout of Photovoltaics for Semi-Outdoor Main Transformer Rooms in Substations" Applied Sciences 15, no. 11: 6223. https://doi.org/10.3390/app15116223
APA StyleWu, X., Wang, Y., Cai, Z., & Su, P. (2025). Study on Roof Ventilation and Optimized Layout of Photovoltaics for Semi-Outdoor Main Transformer Rooms in Substations. Applied Sciences, 15(11), 6223. https://doi.org/10.3390/app15116223