ReAcc_MF: Multimodal Fusion Model with Resource-Accuracy Co-Optimization for Screening Blasting-Induced Pulmonary Nodules in Occupational Health
Abstract
1. Introduction
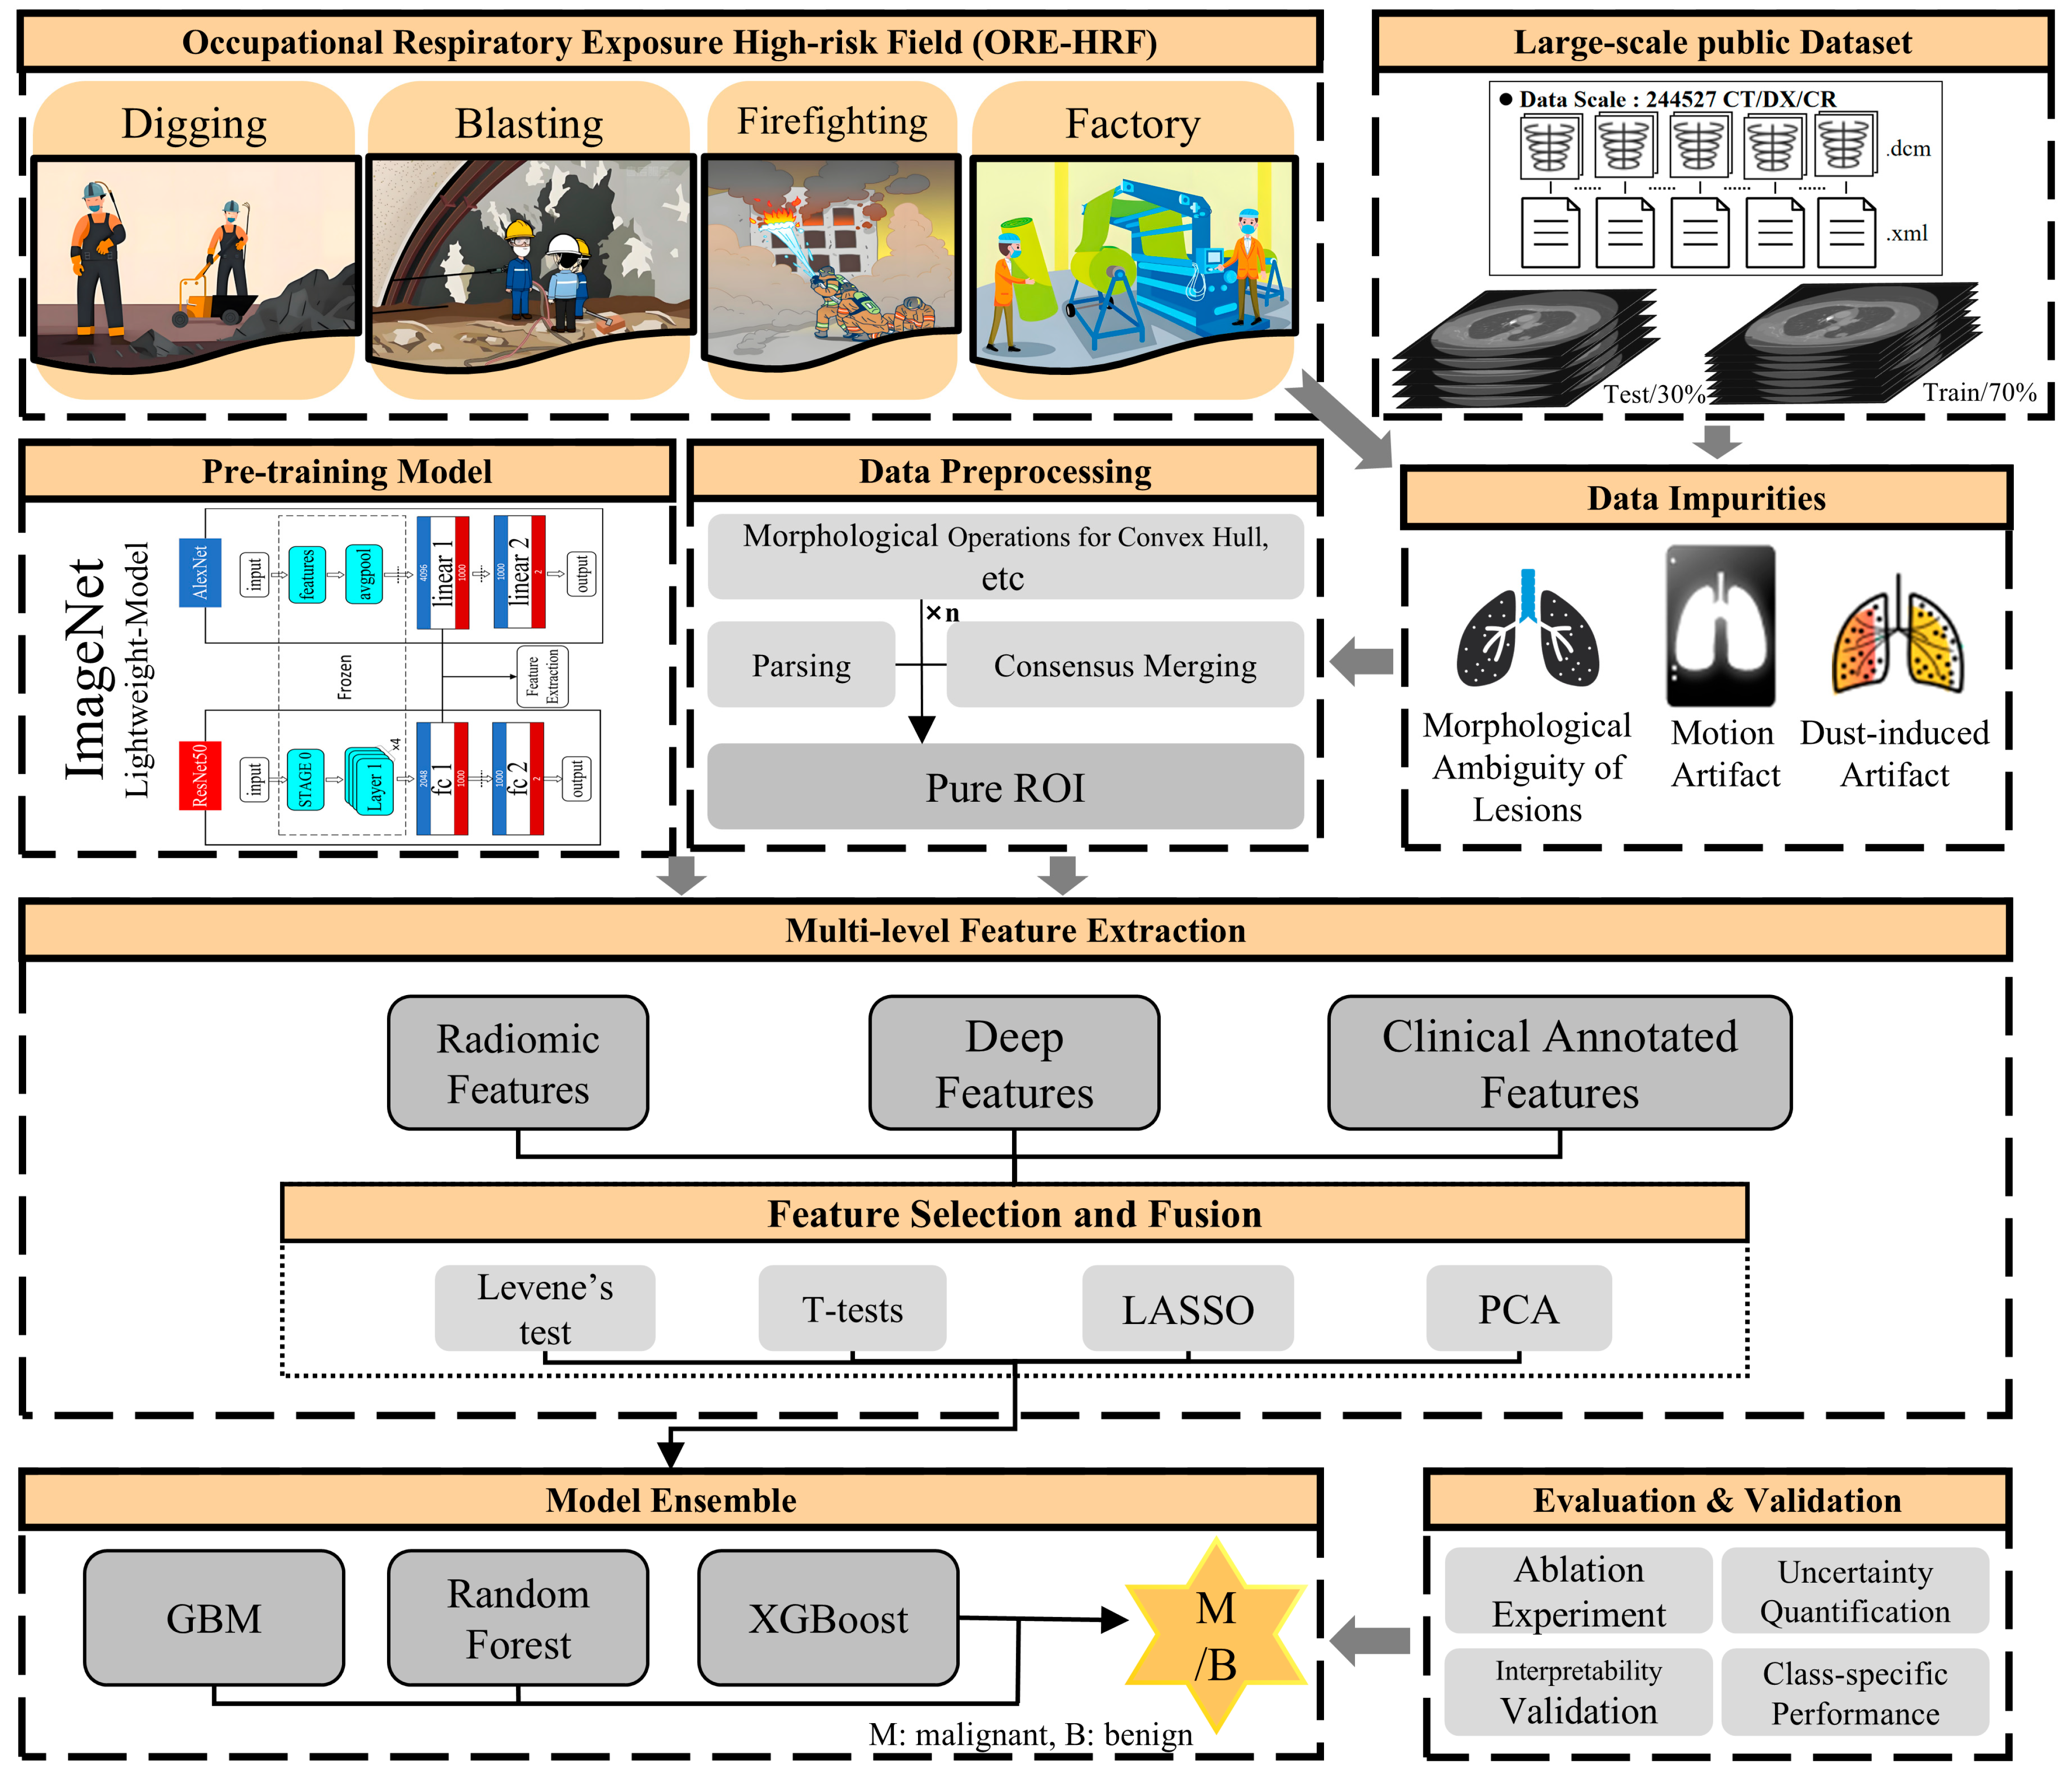
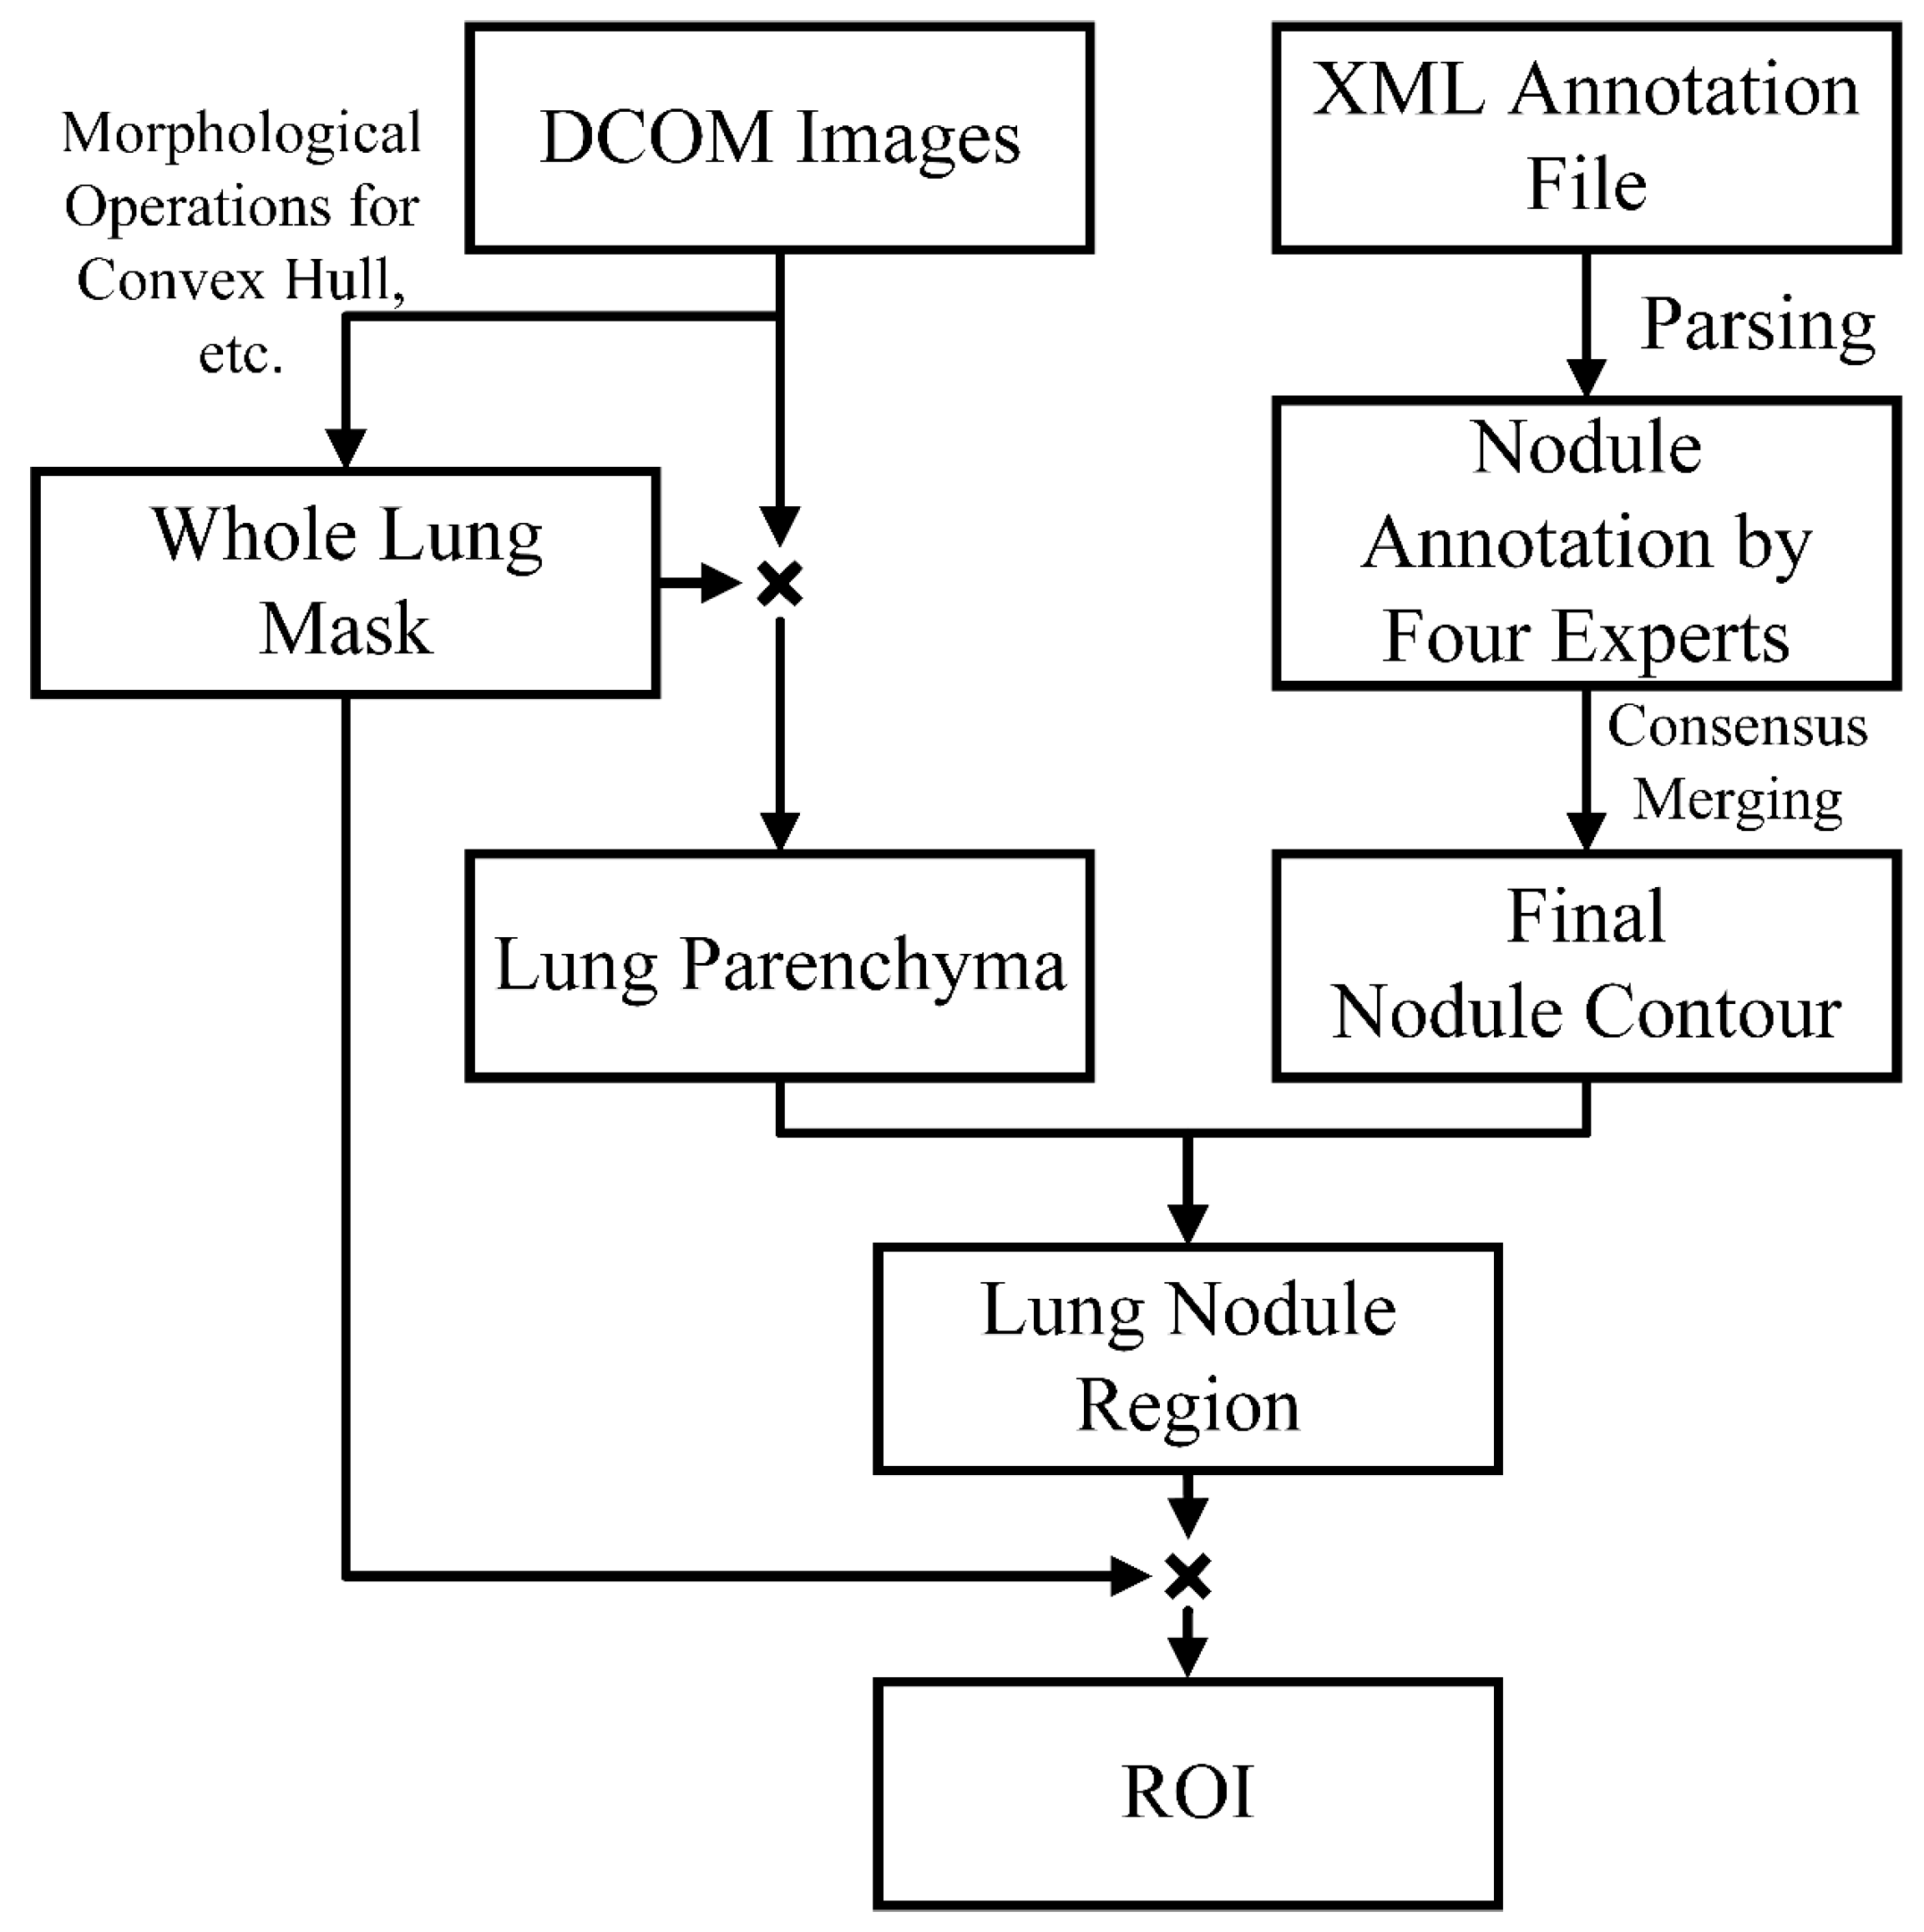
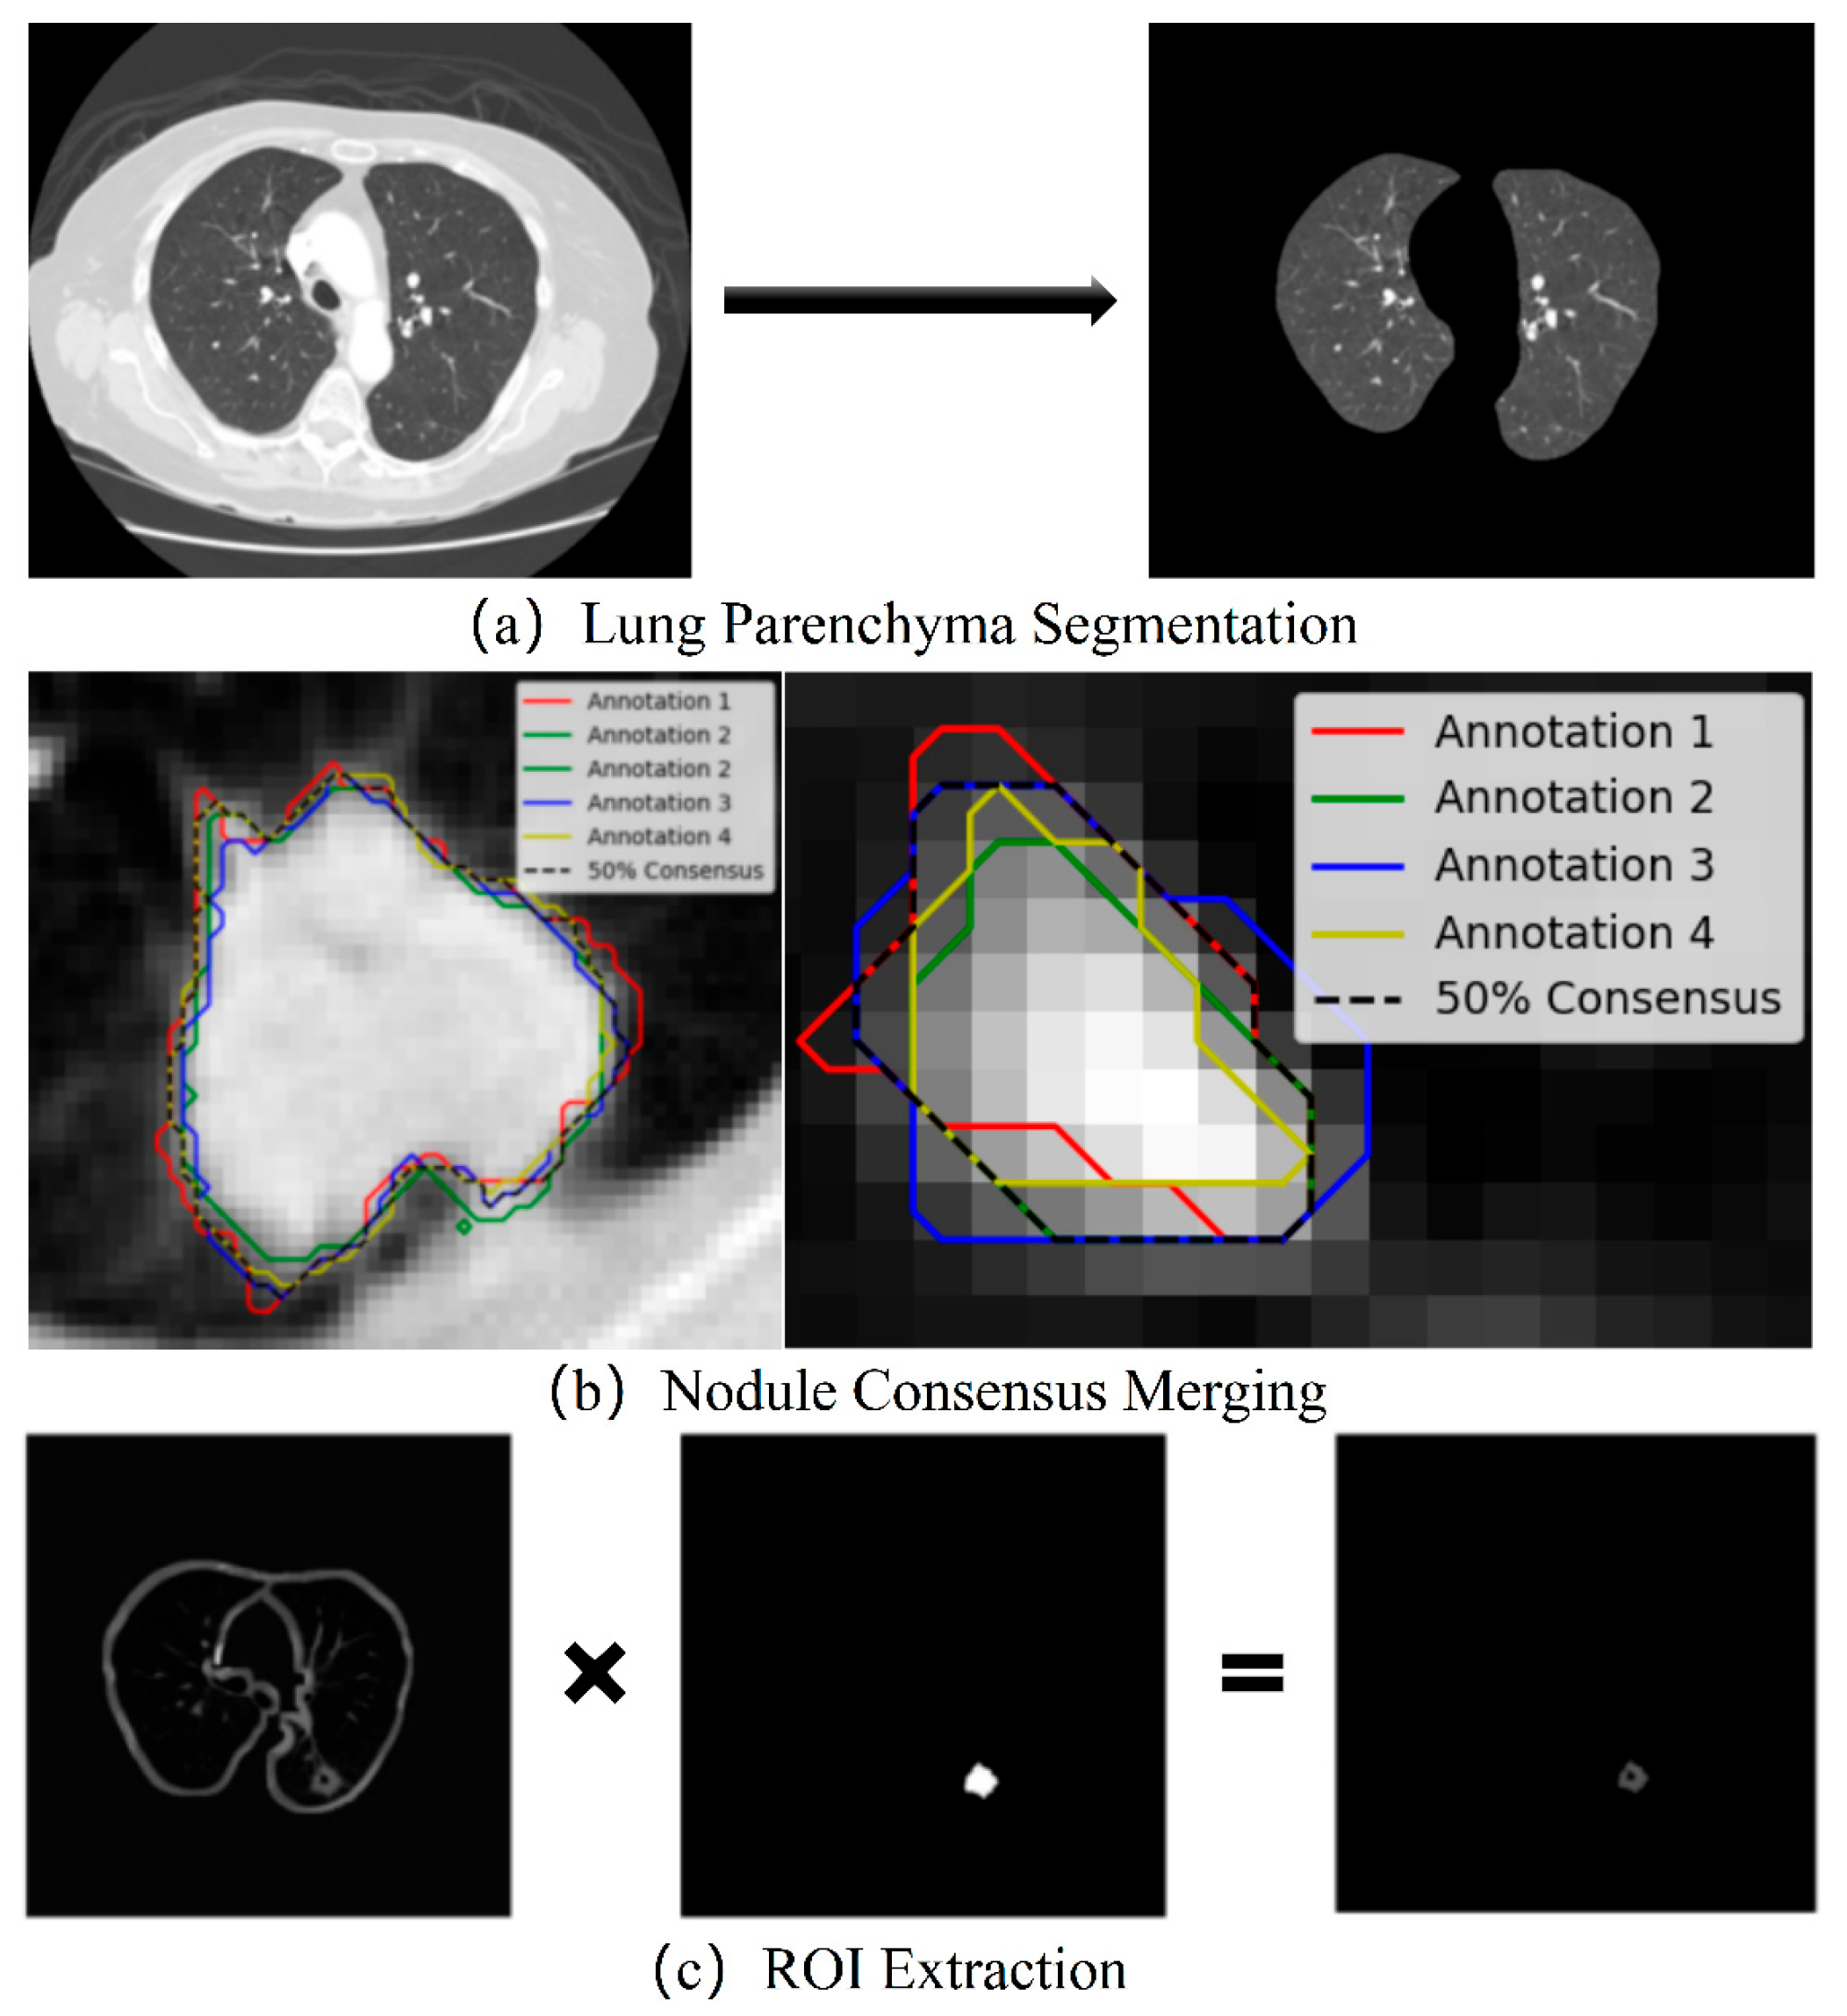
- Morphological Purification: Unlike conventional methods that extract ROIs based on labeled coordinates, which may include noise such as small blood vessels or spicules caused by explosive residue deposition and intermittent dust clouds, we employ a more systematic preprocessing workflow. This includes morphological operations, multiple fillings, convex hull calculations, label consensus merging, and random rotations, ensuring the extraction of cleaner and more representative ROIs.
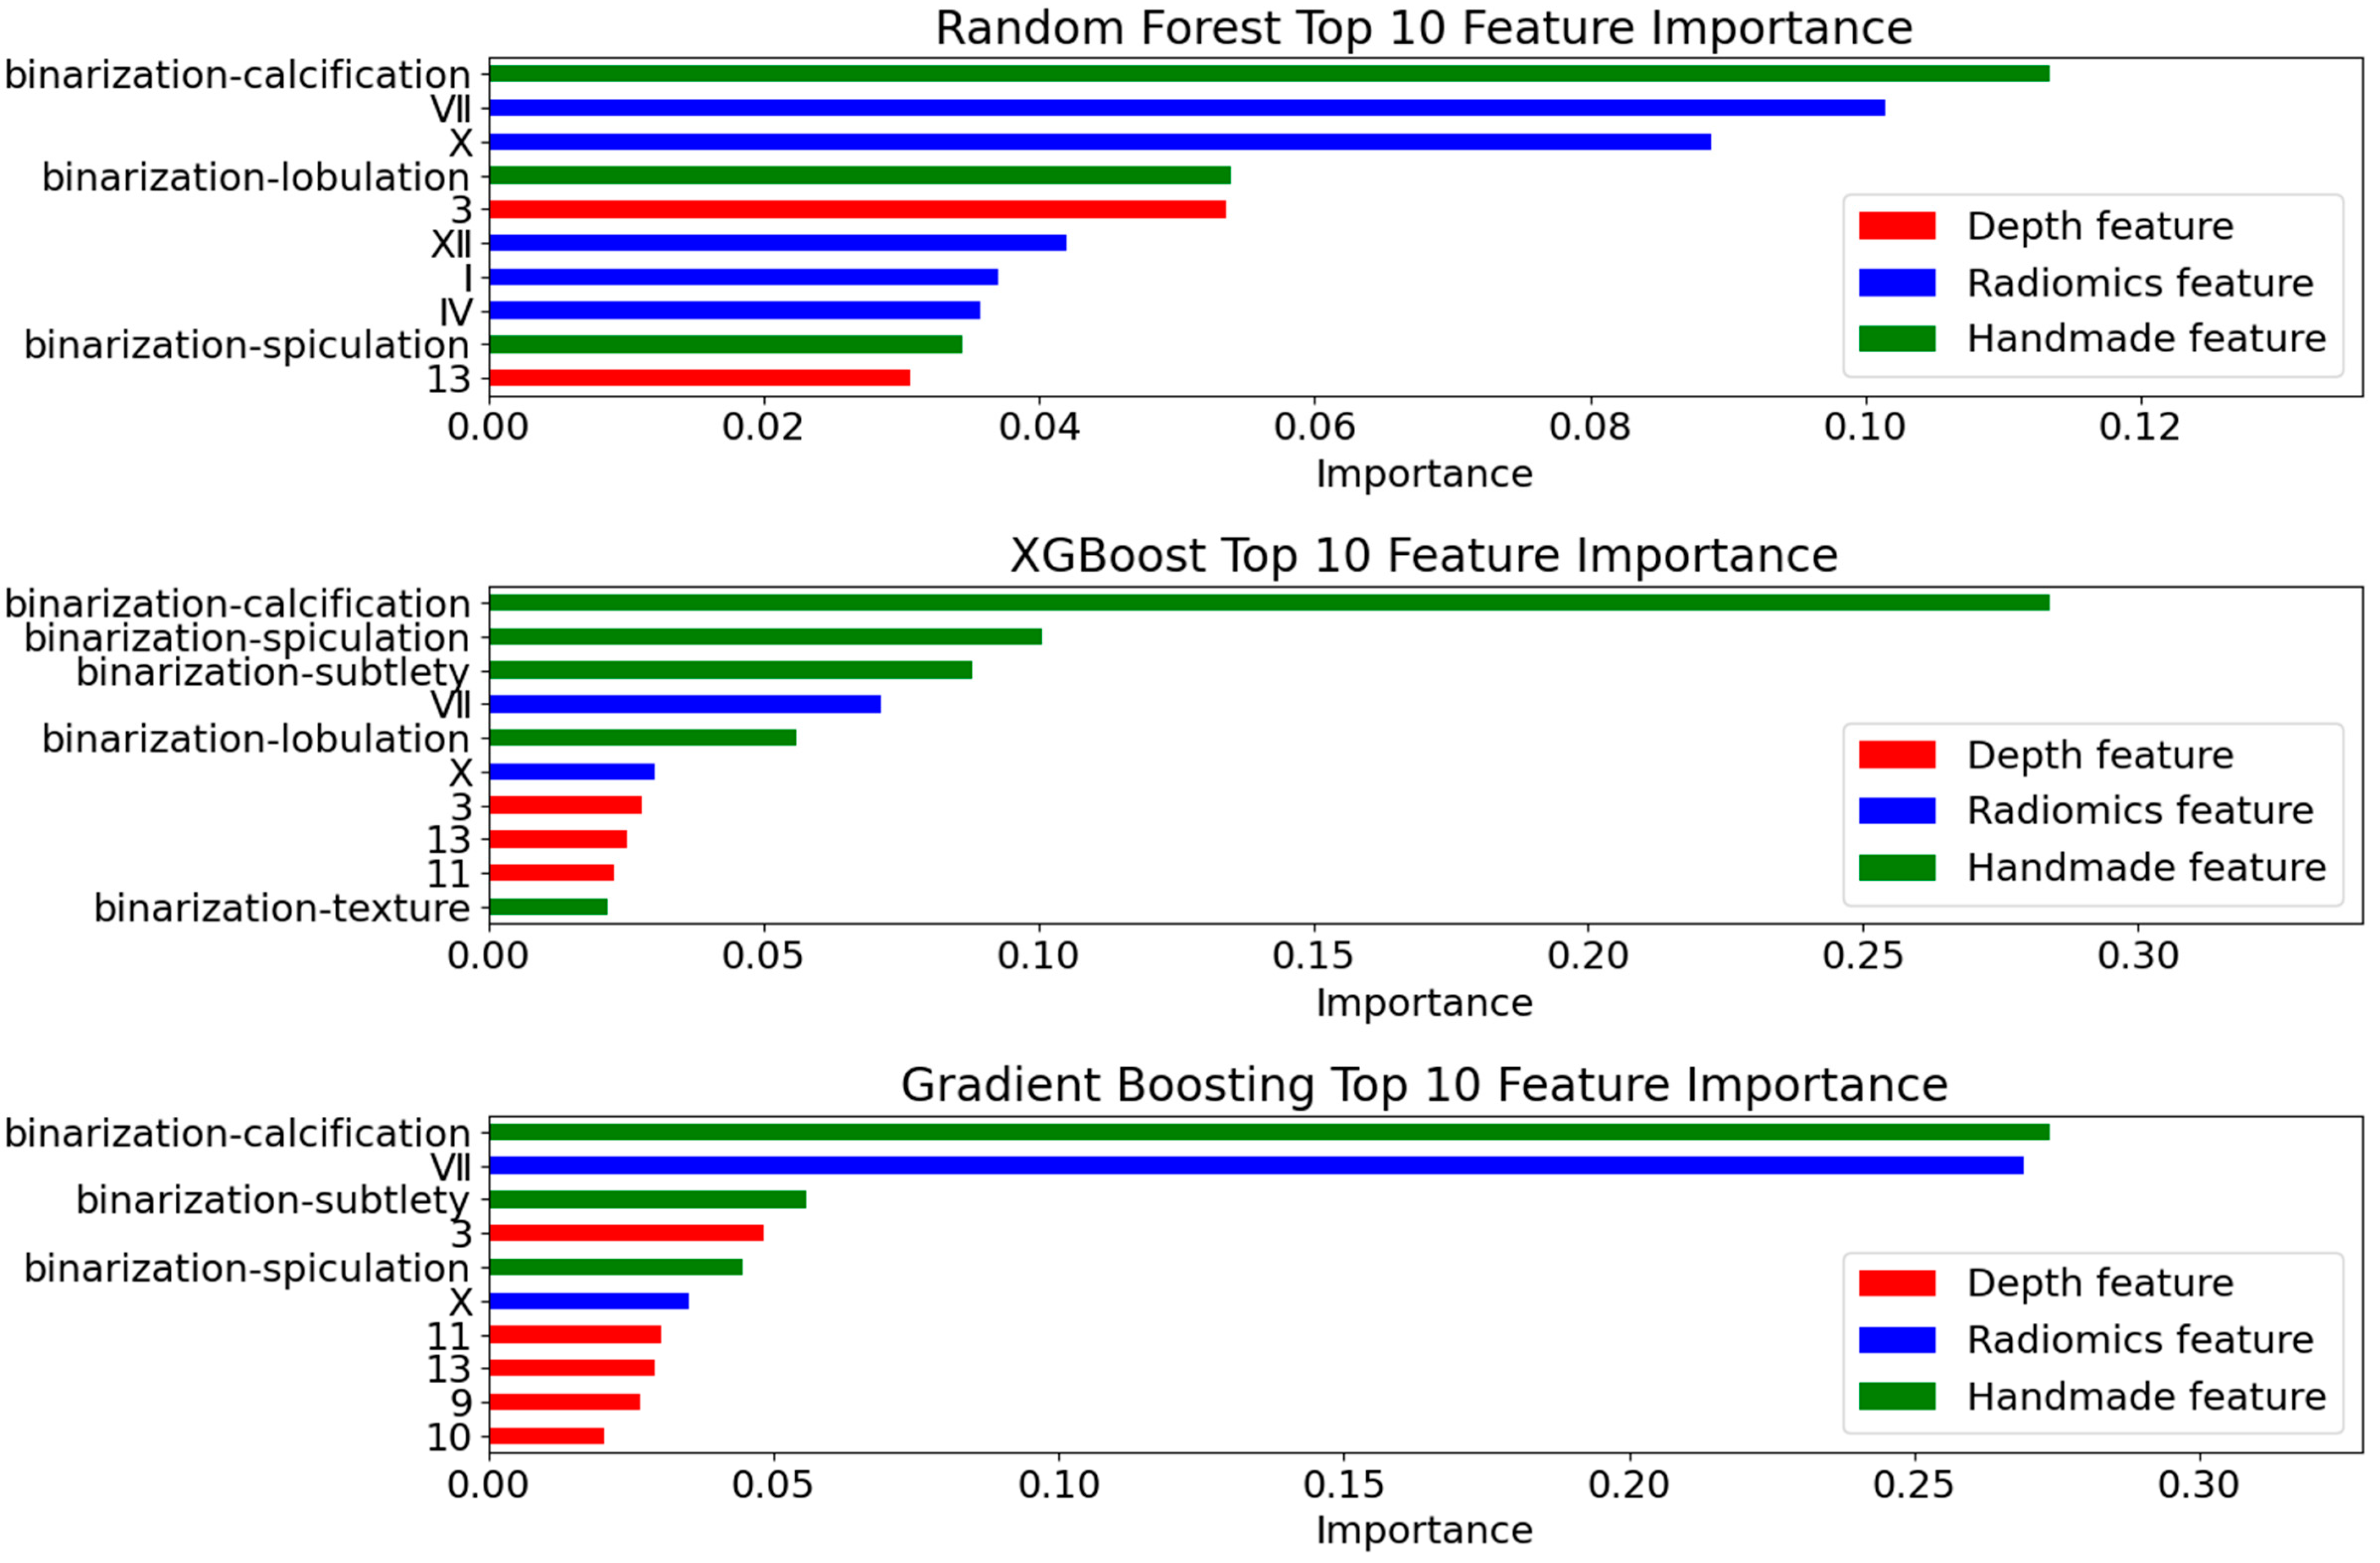
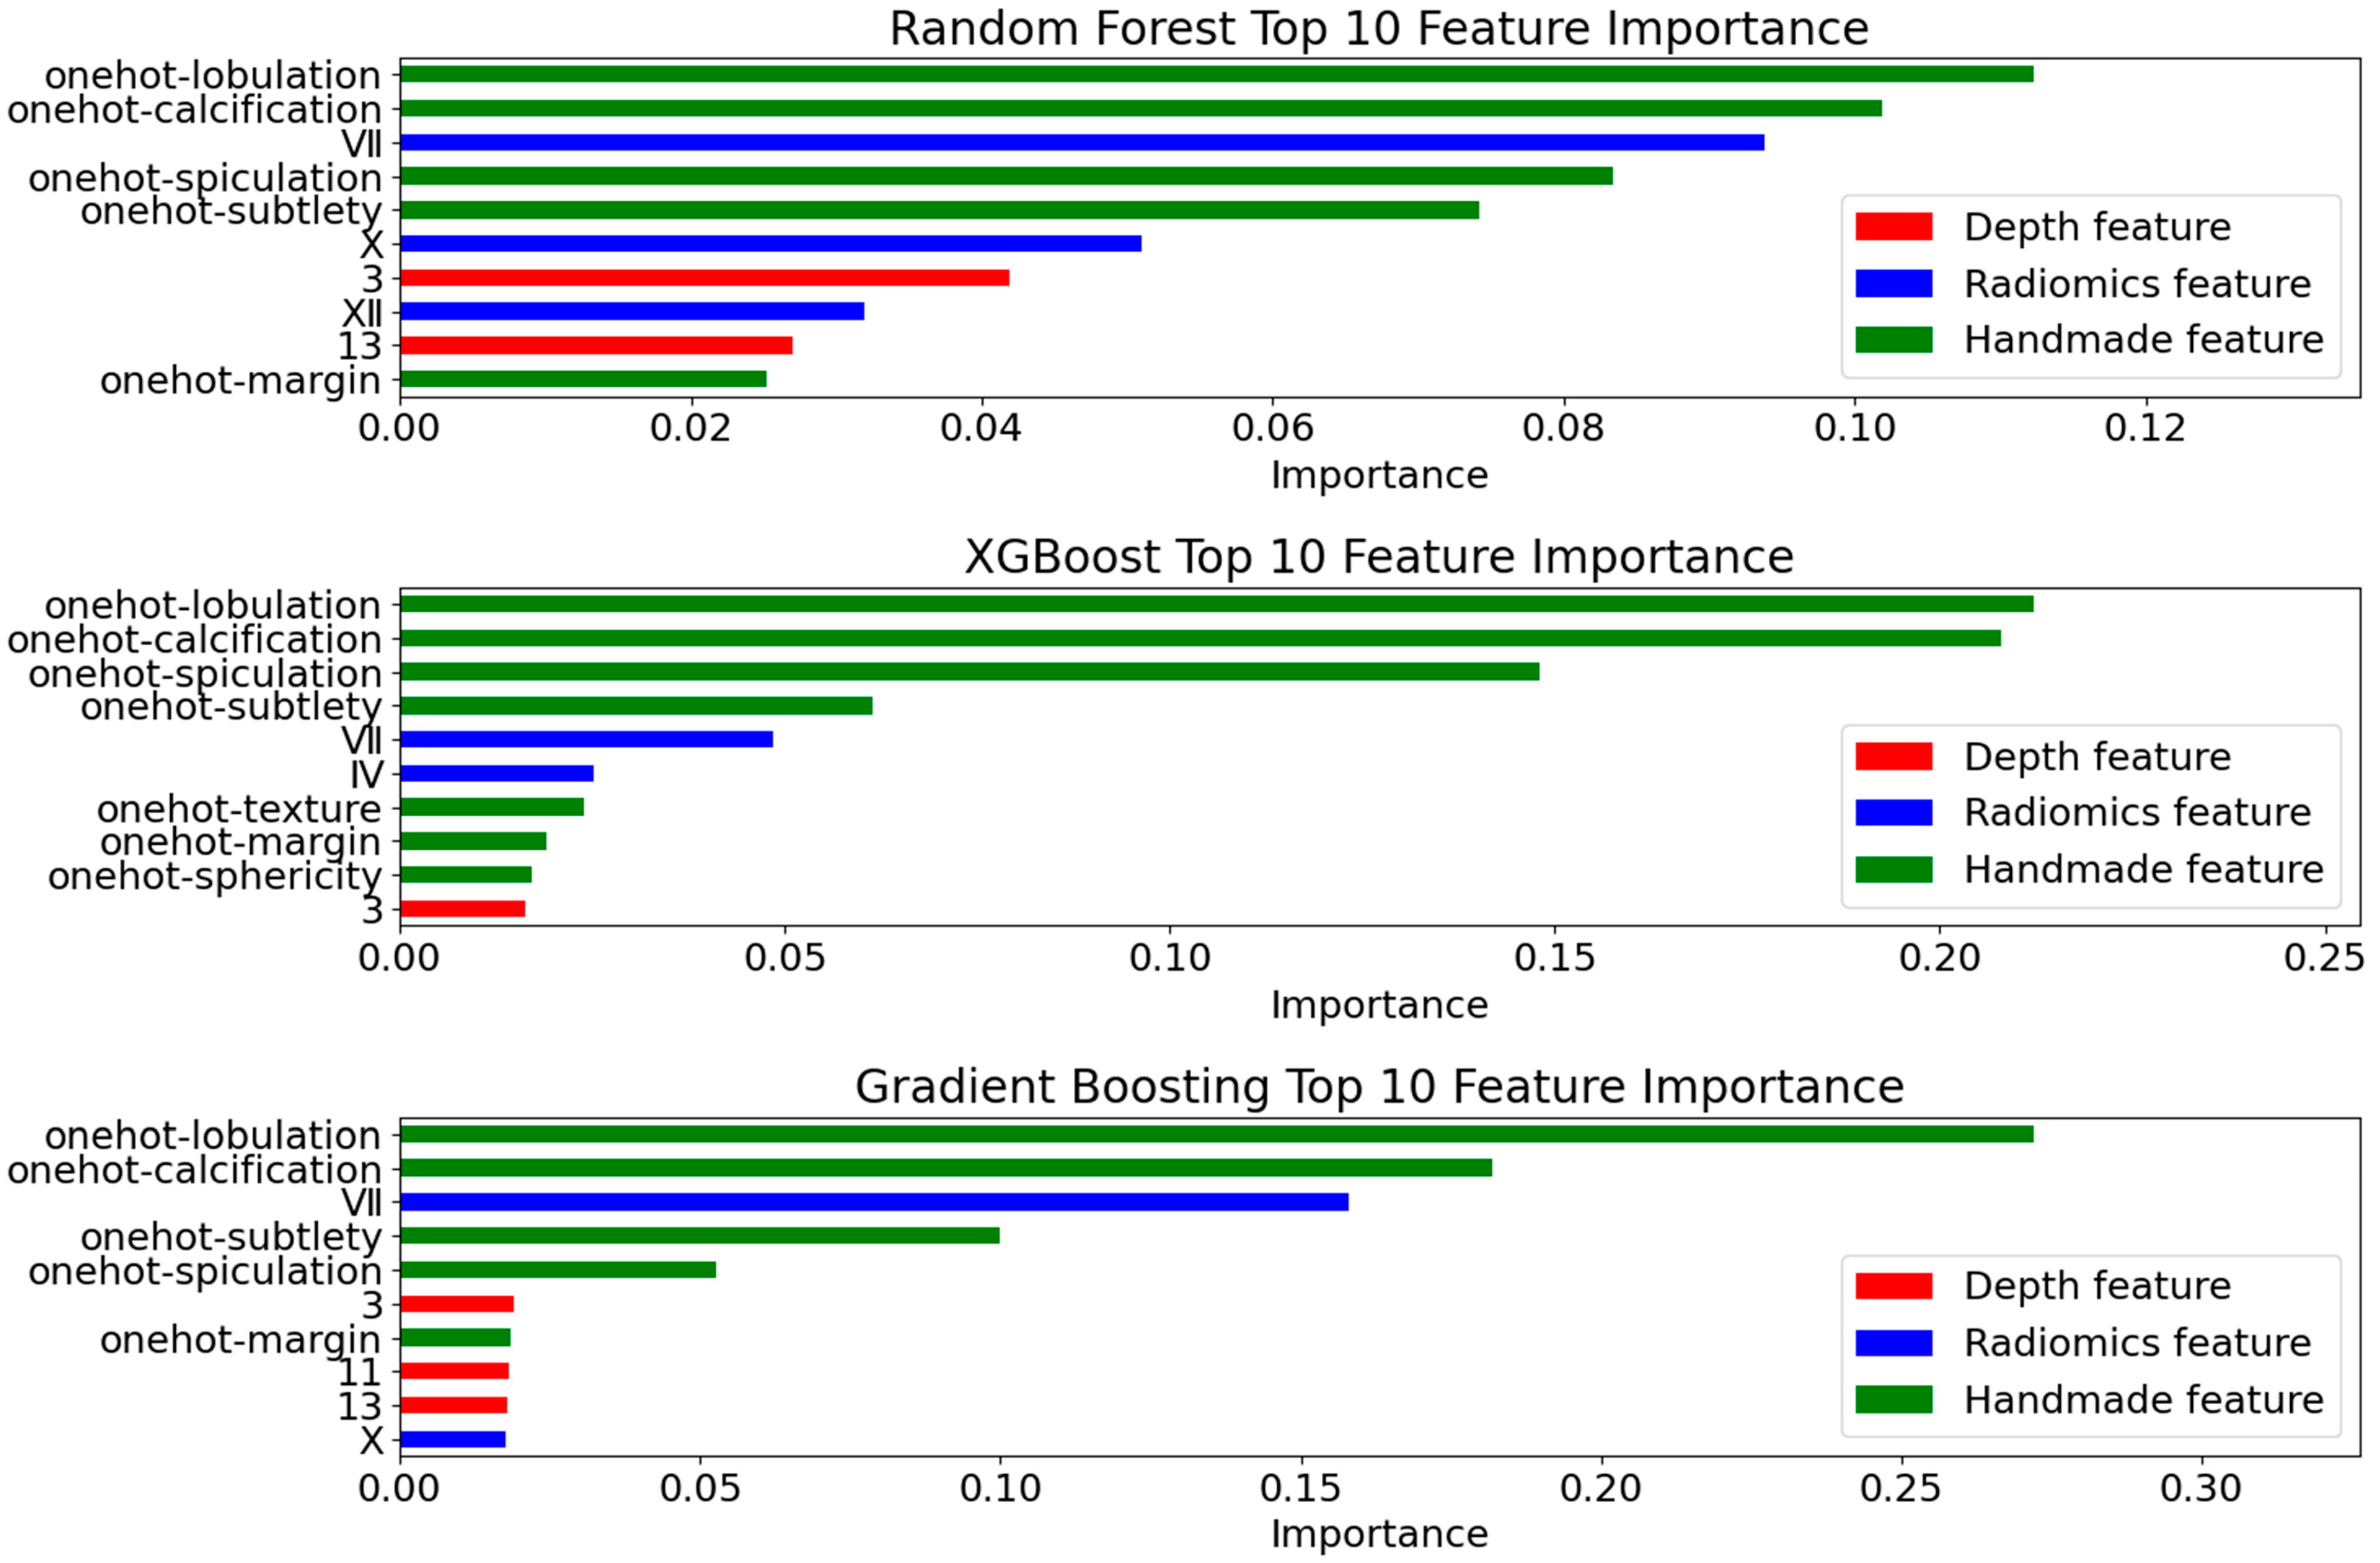
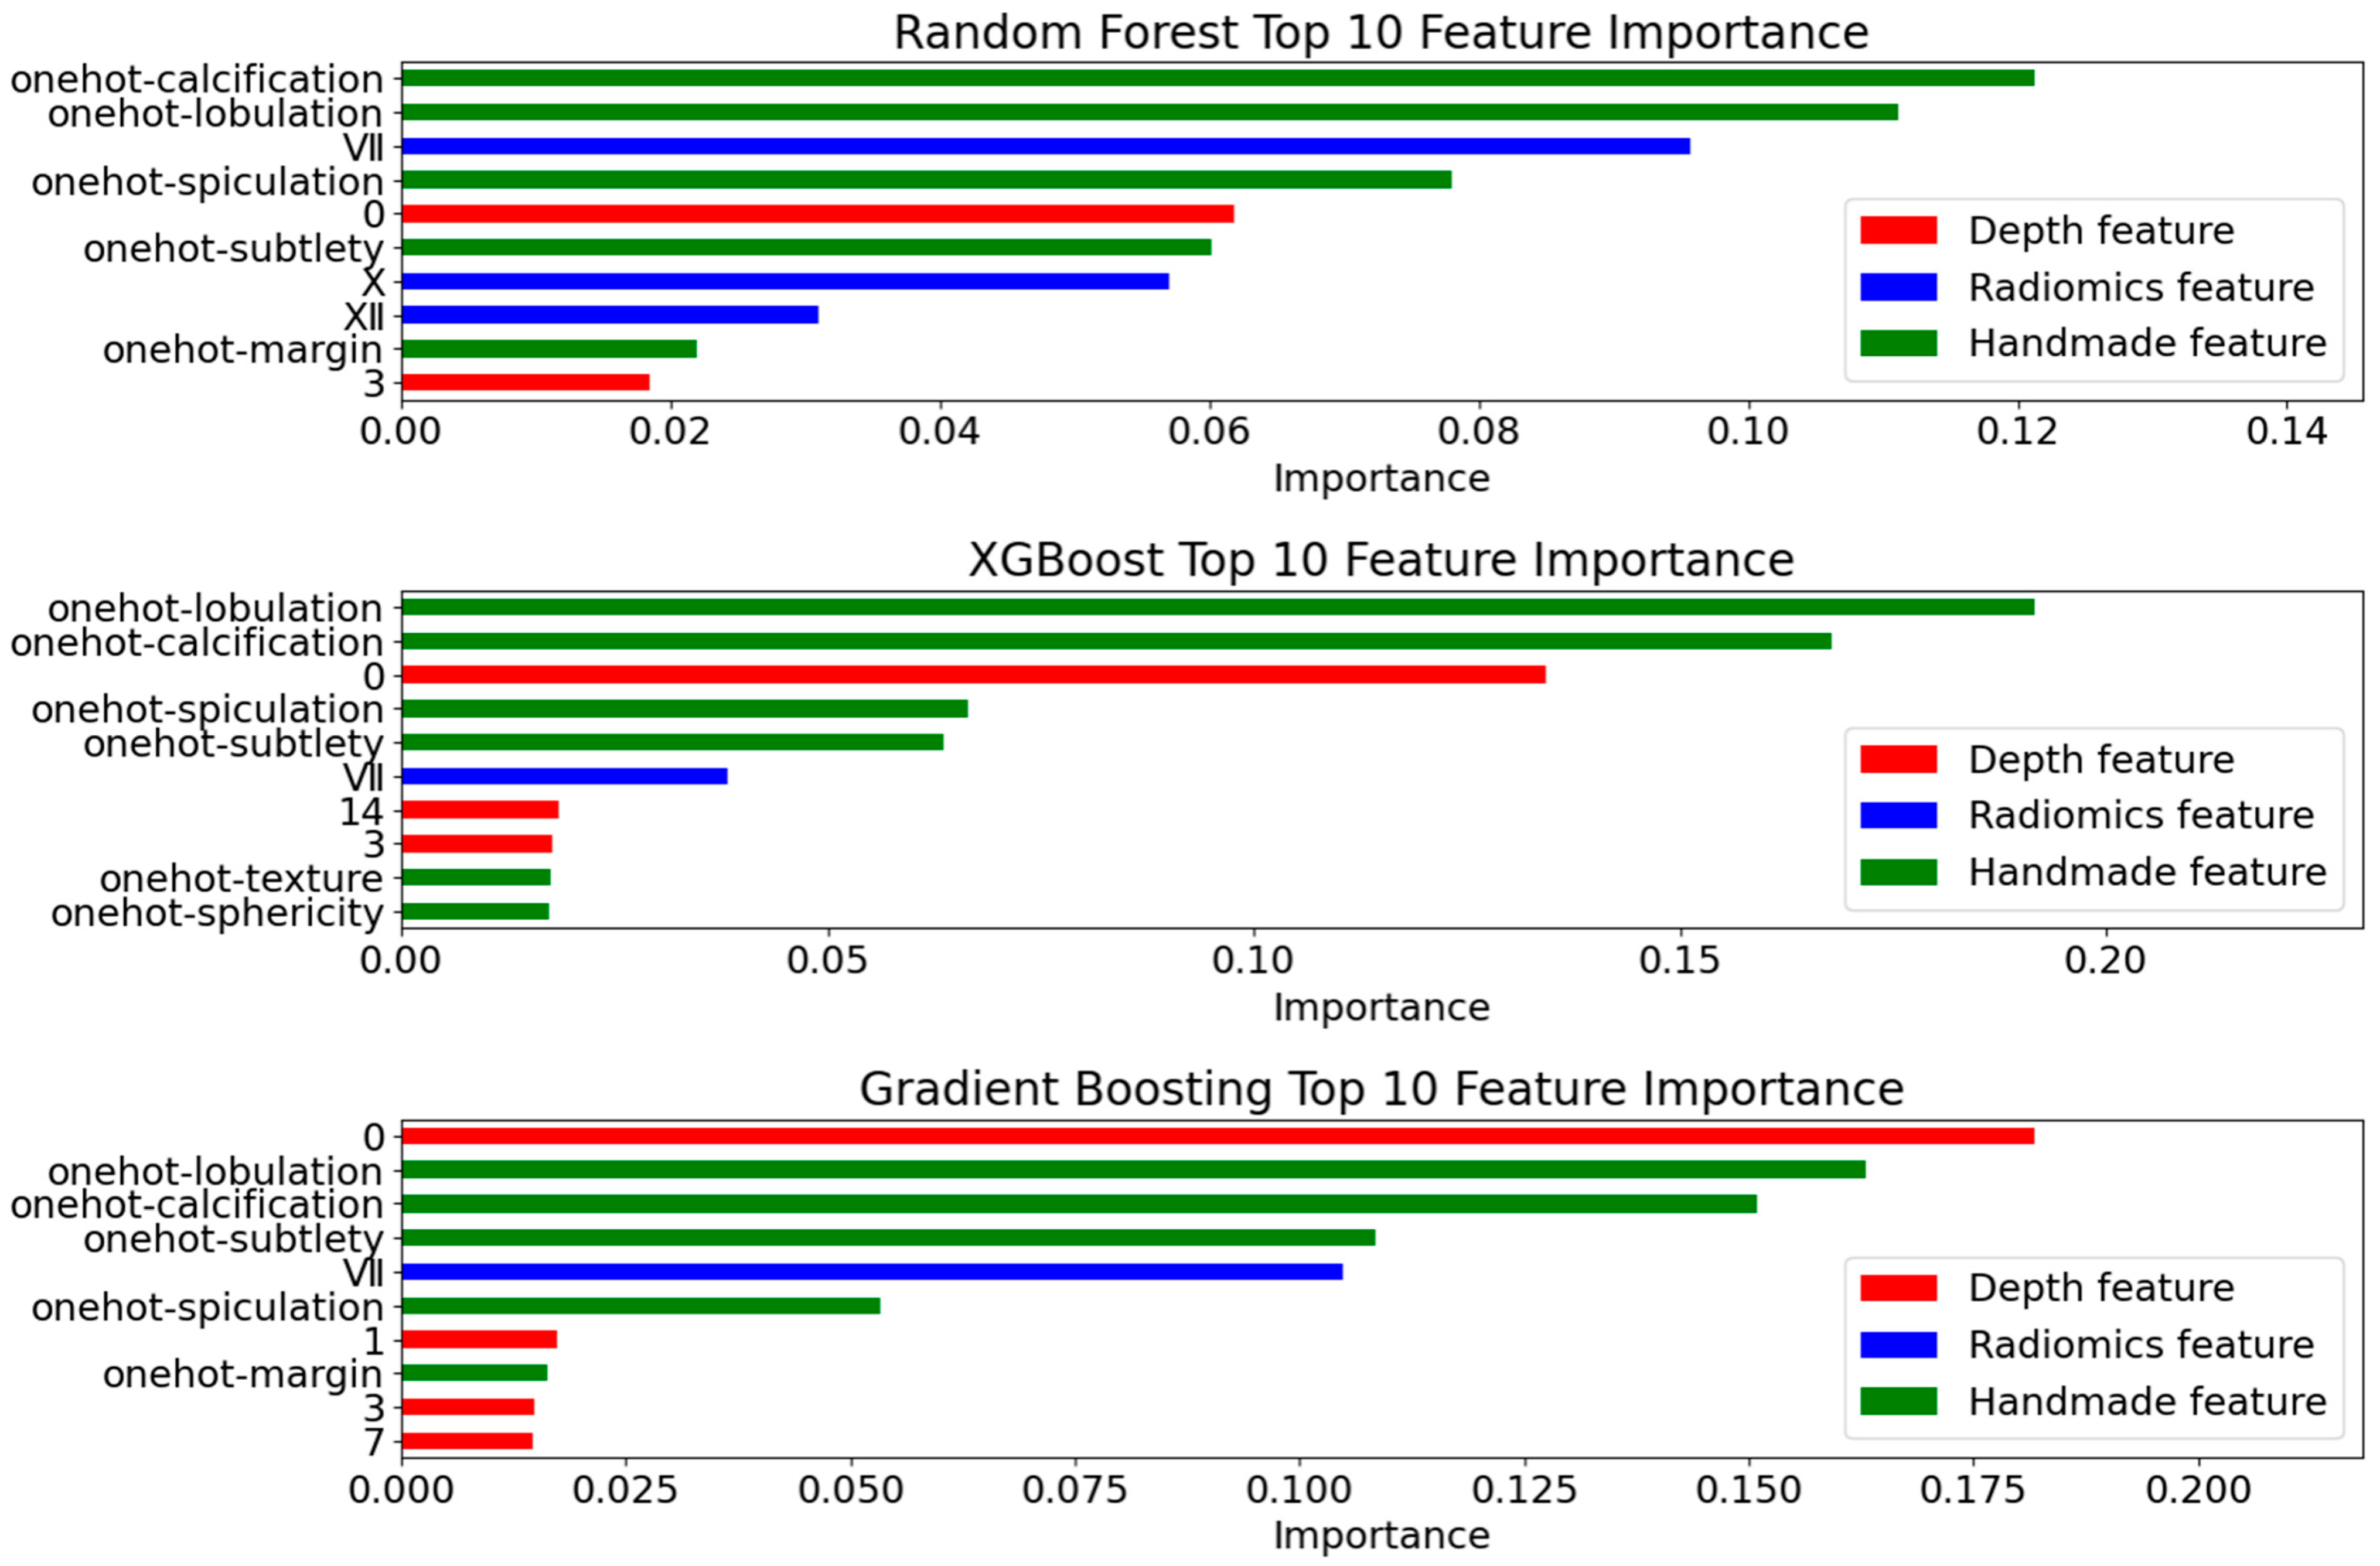
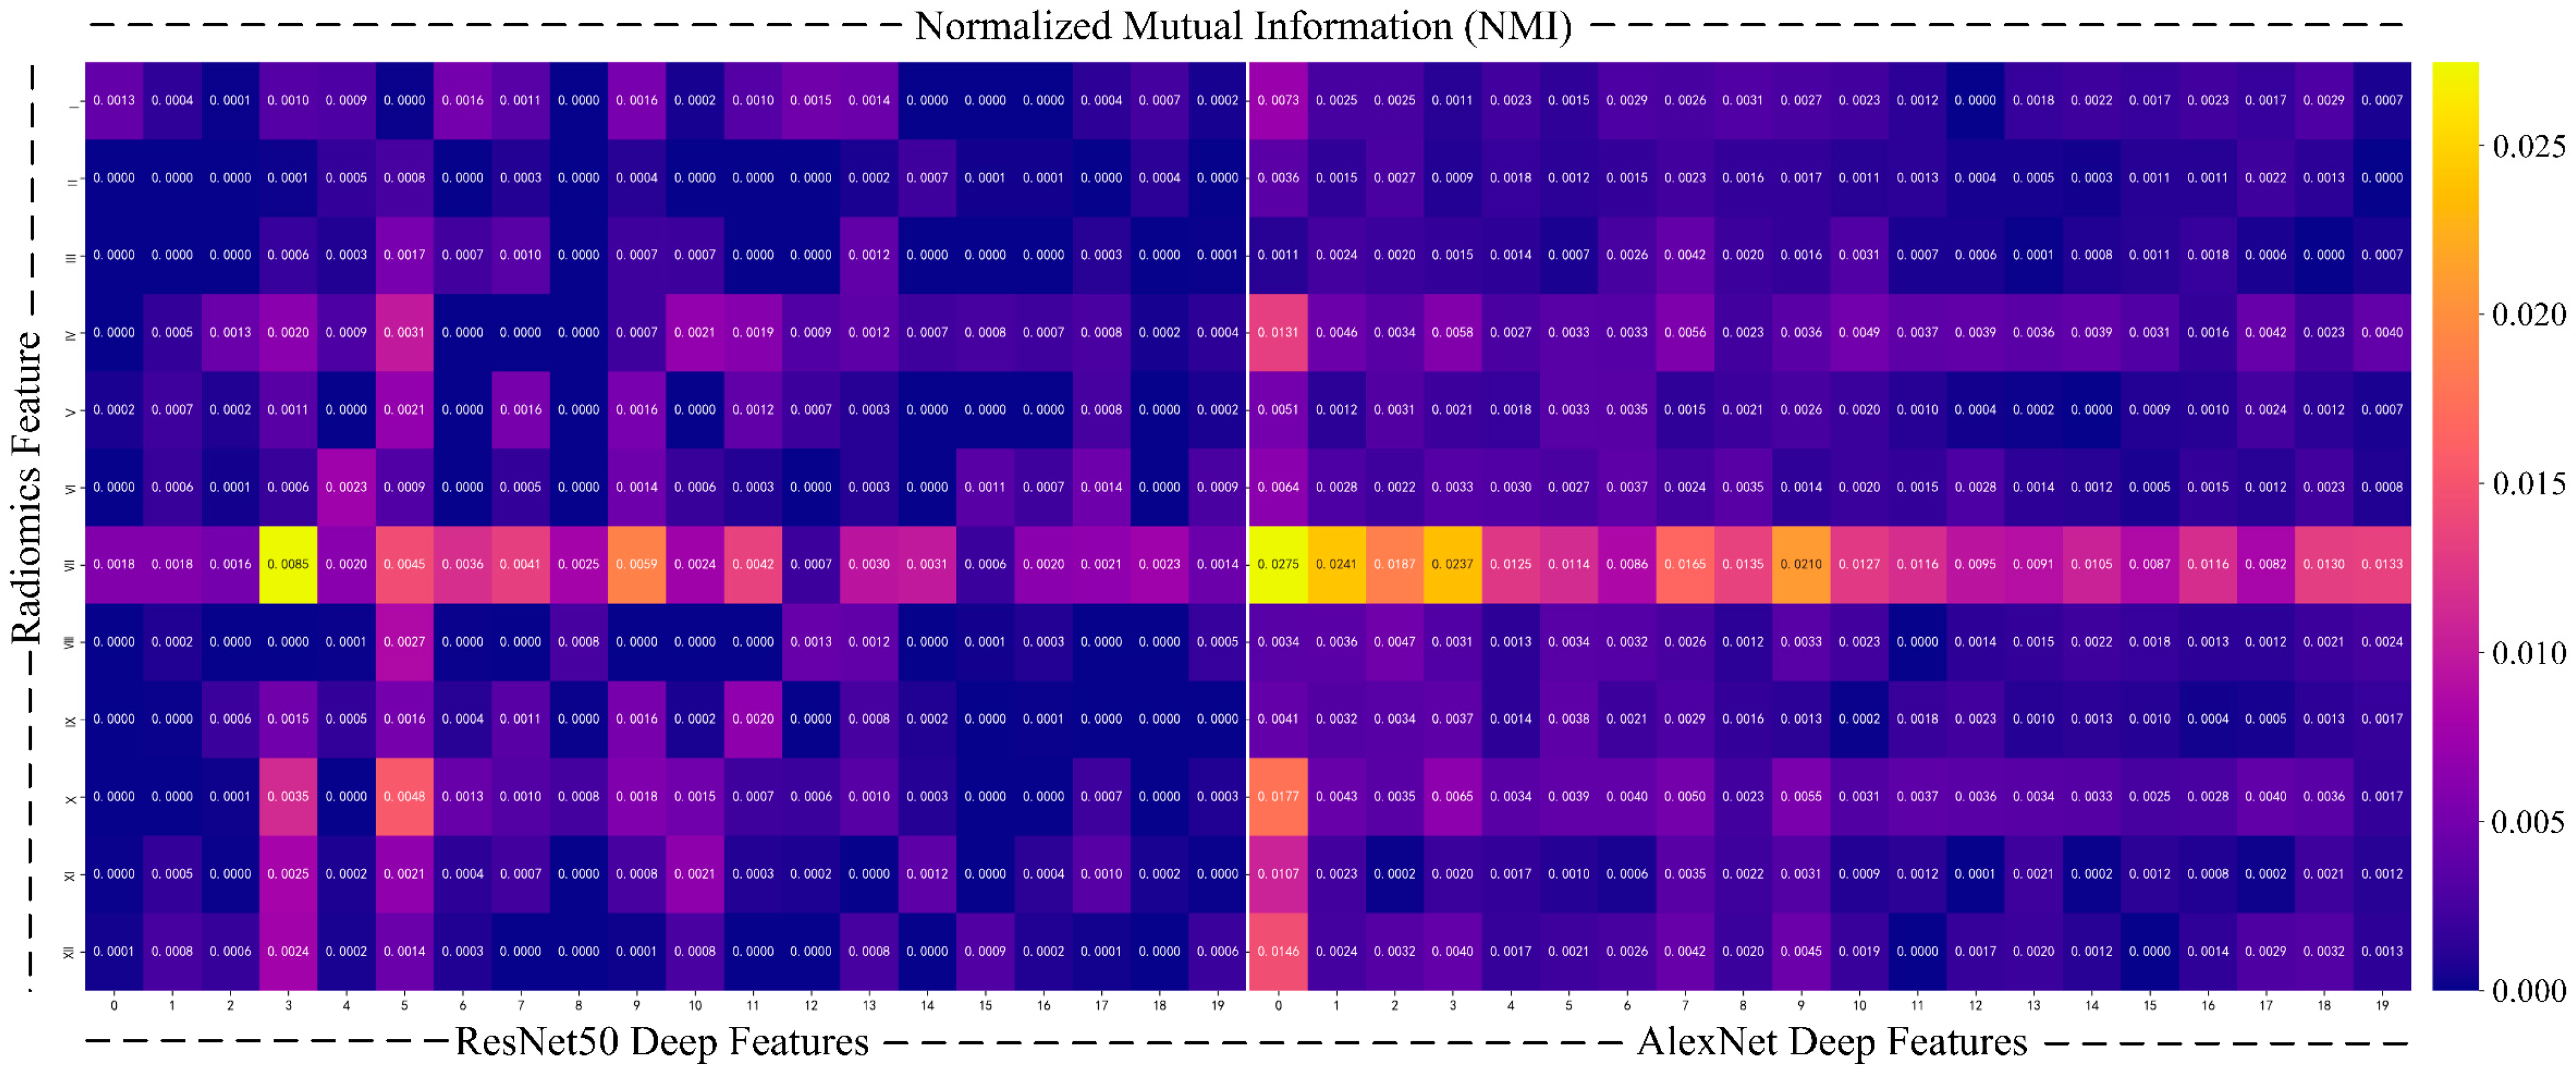
- Interpretability by Design: We integrate clinical annotated features, radiomics features, and deep features into an interpretable ensemble model. Feature weight maps and normalized mutual information heatmaps ensure the transparency of model decisions, providing actionable insights for clinicians.
- Resource-Accuracy Co-Optimization: By shifting computational burdens from hardware-dependent deep architectures to precision-enhanced preprocessing, our approach achieves SOTA accuracy using only clinical-grade equipment. This makes it deployable in resource-constrained settings without sacrificing diagnostic rigor.
2. Related Work
2.1. Pulmonary Nodule Prediction
2.2. Resource-Accuracy Co-Optimization in Occupational Health
3. Methods
3.1. Data Preprocessing
- (1)
- Lung Parenchyma Segmentation
- (2)
- Consensus Merging of Label Coordinates
- (3)
- ROI Extraction and Data Augmentation
3.2. Multi-Dimensional Feature Extraction
- (1)
- Clinical Annotated Features
- (2)
- Radiomics Features
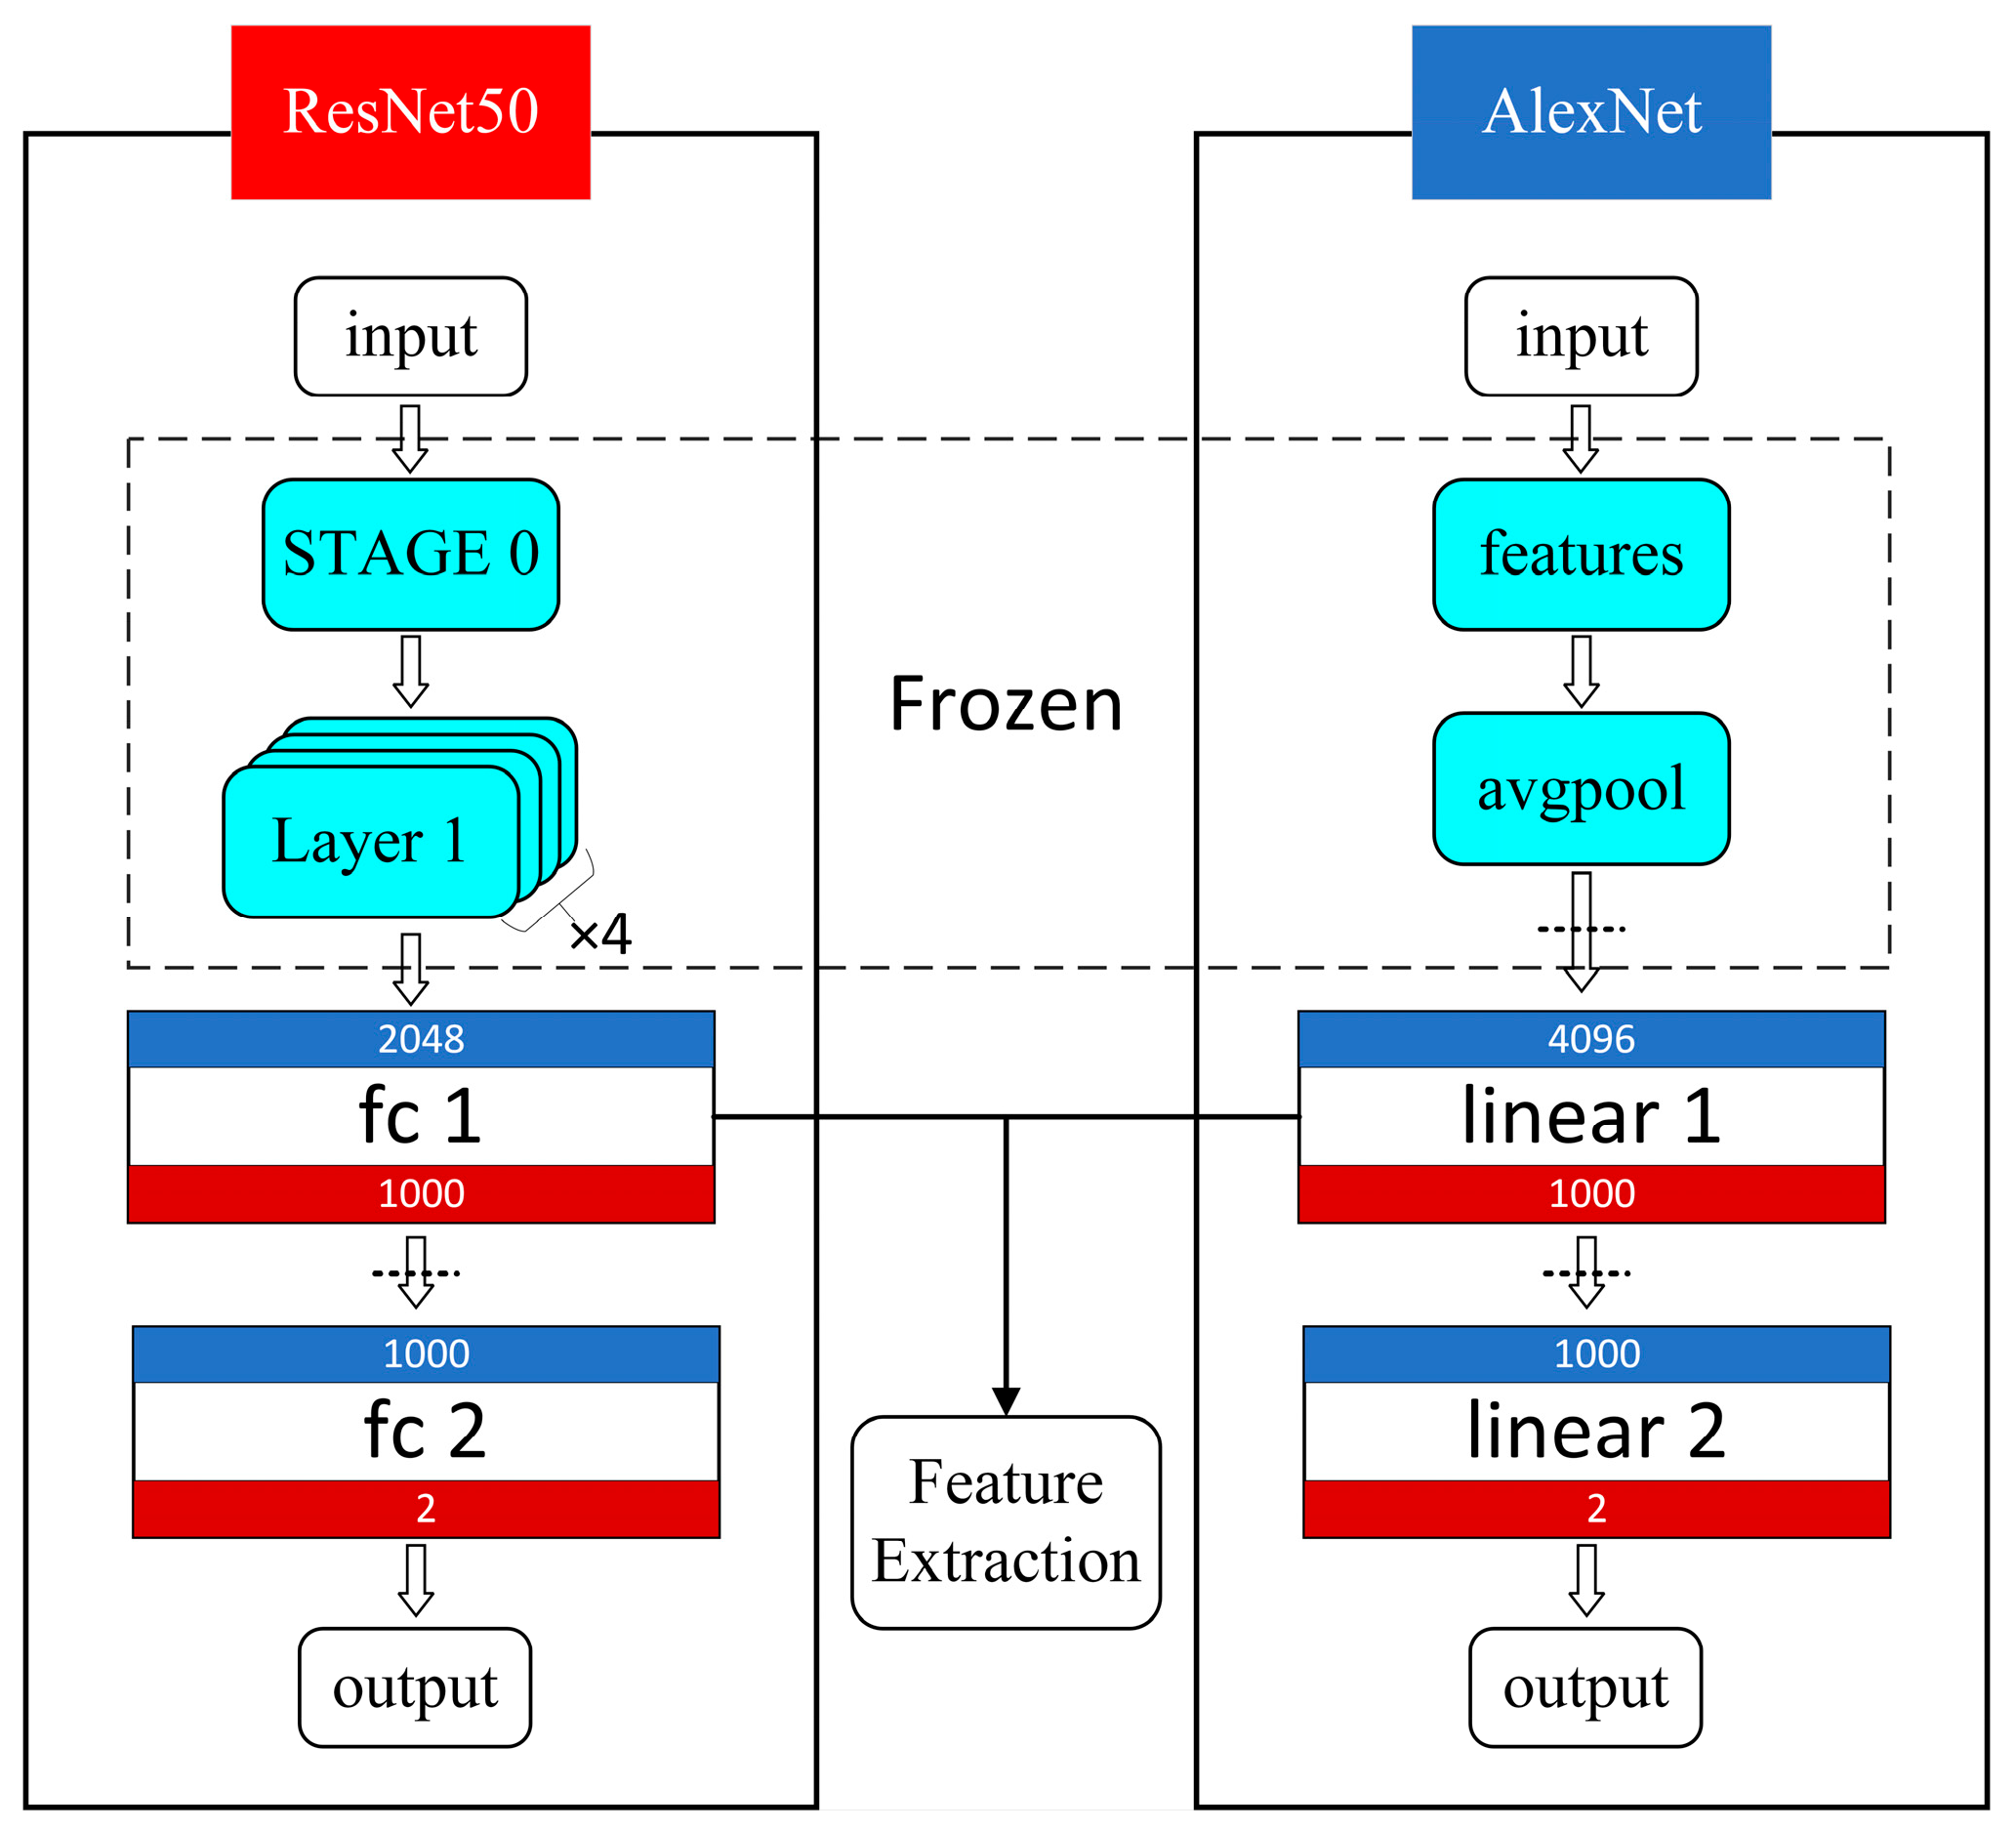
- (3)
- Deep Features
3.3. Feature Selection and Fusion
- (1)
- Radiomics Feature Selection: First, a homogeneity of variance test (Levene’s test) was performed to assess whether features with homogeneous variances could impact the accuracy of subsequent statistical analyses. Next, T-tests (Student’s t-test) and Welch’s t-test were applied to eliminate features with non-significant mean differences. Features were retained based on the following criteria: p-value (PL) > 0.05 and p-value (PT) < 0.05, or p-value (PL) ≤ 0.05 and p-value (PW) < 0.05. These selected features provided a solid foundation for subsequent tasks by ensuring clear distinctions. Finally, the Least Absolute Shrinkage and Selection Operator (LASSO) method was applied with 5-fold cross-validation to optimize the alpha parameter, resulting in the most representative and generalized radiomics features after “double filtering”.
- (2)
- Deep Feature Selection: To eliminate dimensionality effects, the deep features were first standardized. Principal Component Analysis (PCA) was then applied for dimensionality reduction, reducing the deep feature samples to the target dimensions while retaining the principal components.
3.4. Model Ensemble and Analysis
4. Experiment and Results
4.1. Experimental Environment
4.2. Dataset Division
4.3. Evaluation Metrics
- (1)
- Basic Evaluation Metrics: The basic evaluation metrics, including the AUC [37], accuracy (ACC) [38], specificity (SPE) [39], sensitivity (SEN) [38], positive predictive value (PPV) [39], negative predictive value (NPV) [39], and F1-score [38], were calculated based on the results from model validation. These metrics provide a comprehensive assessment of the model’s overall predictive performance.
- (2)
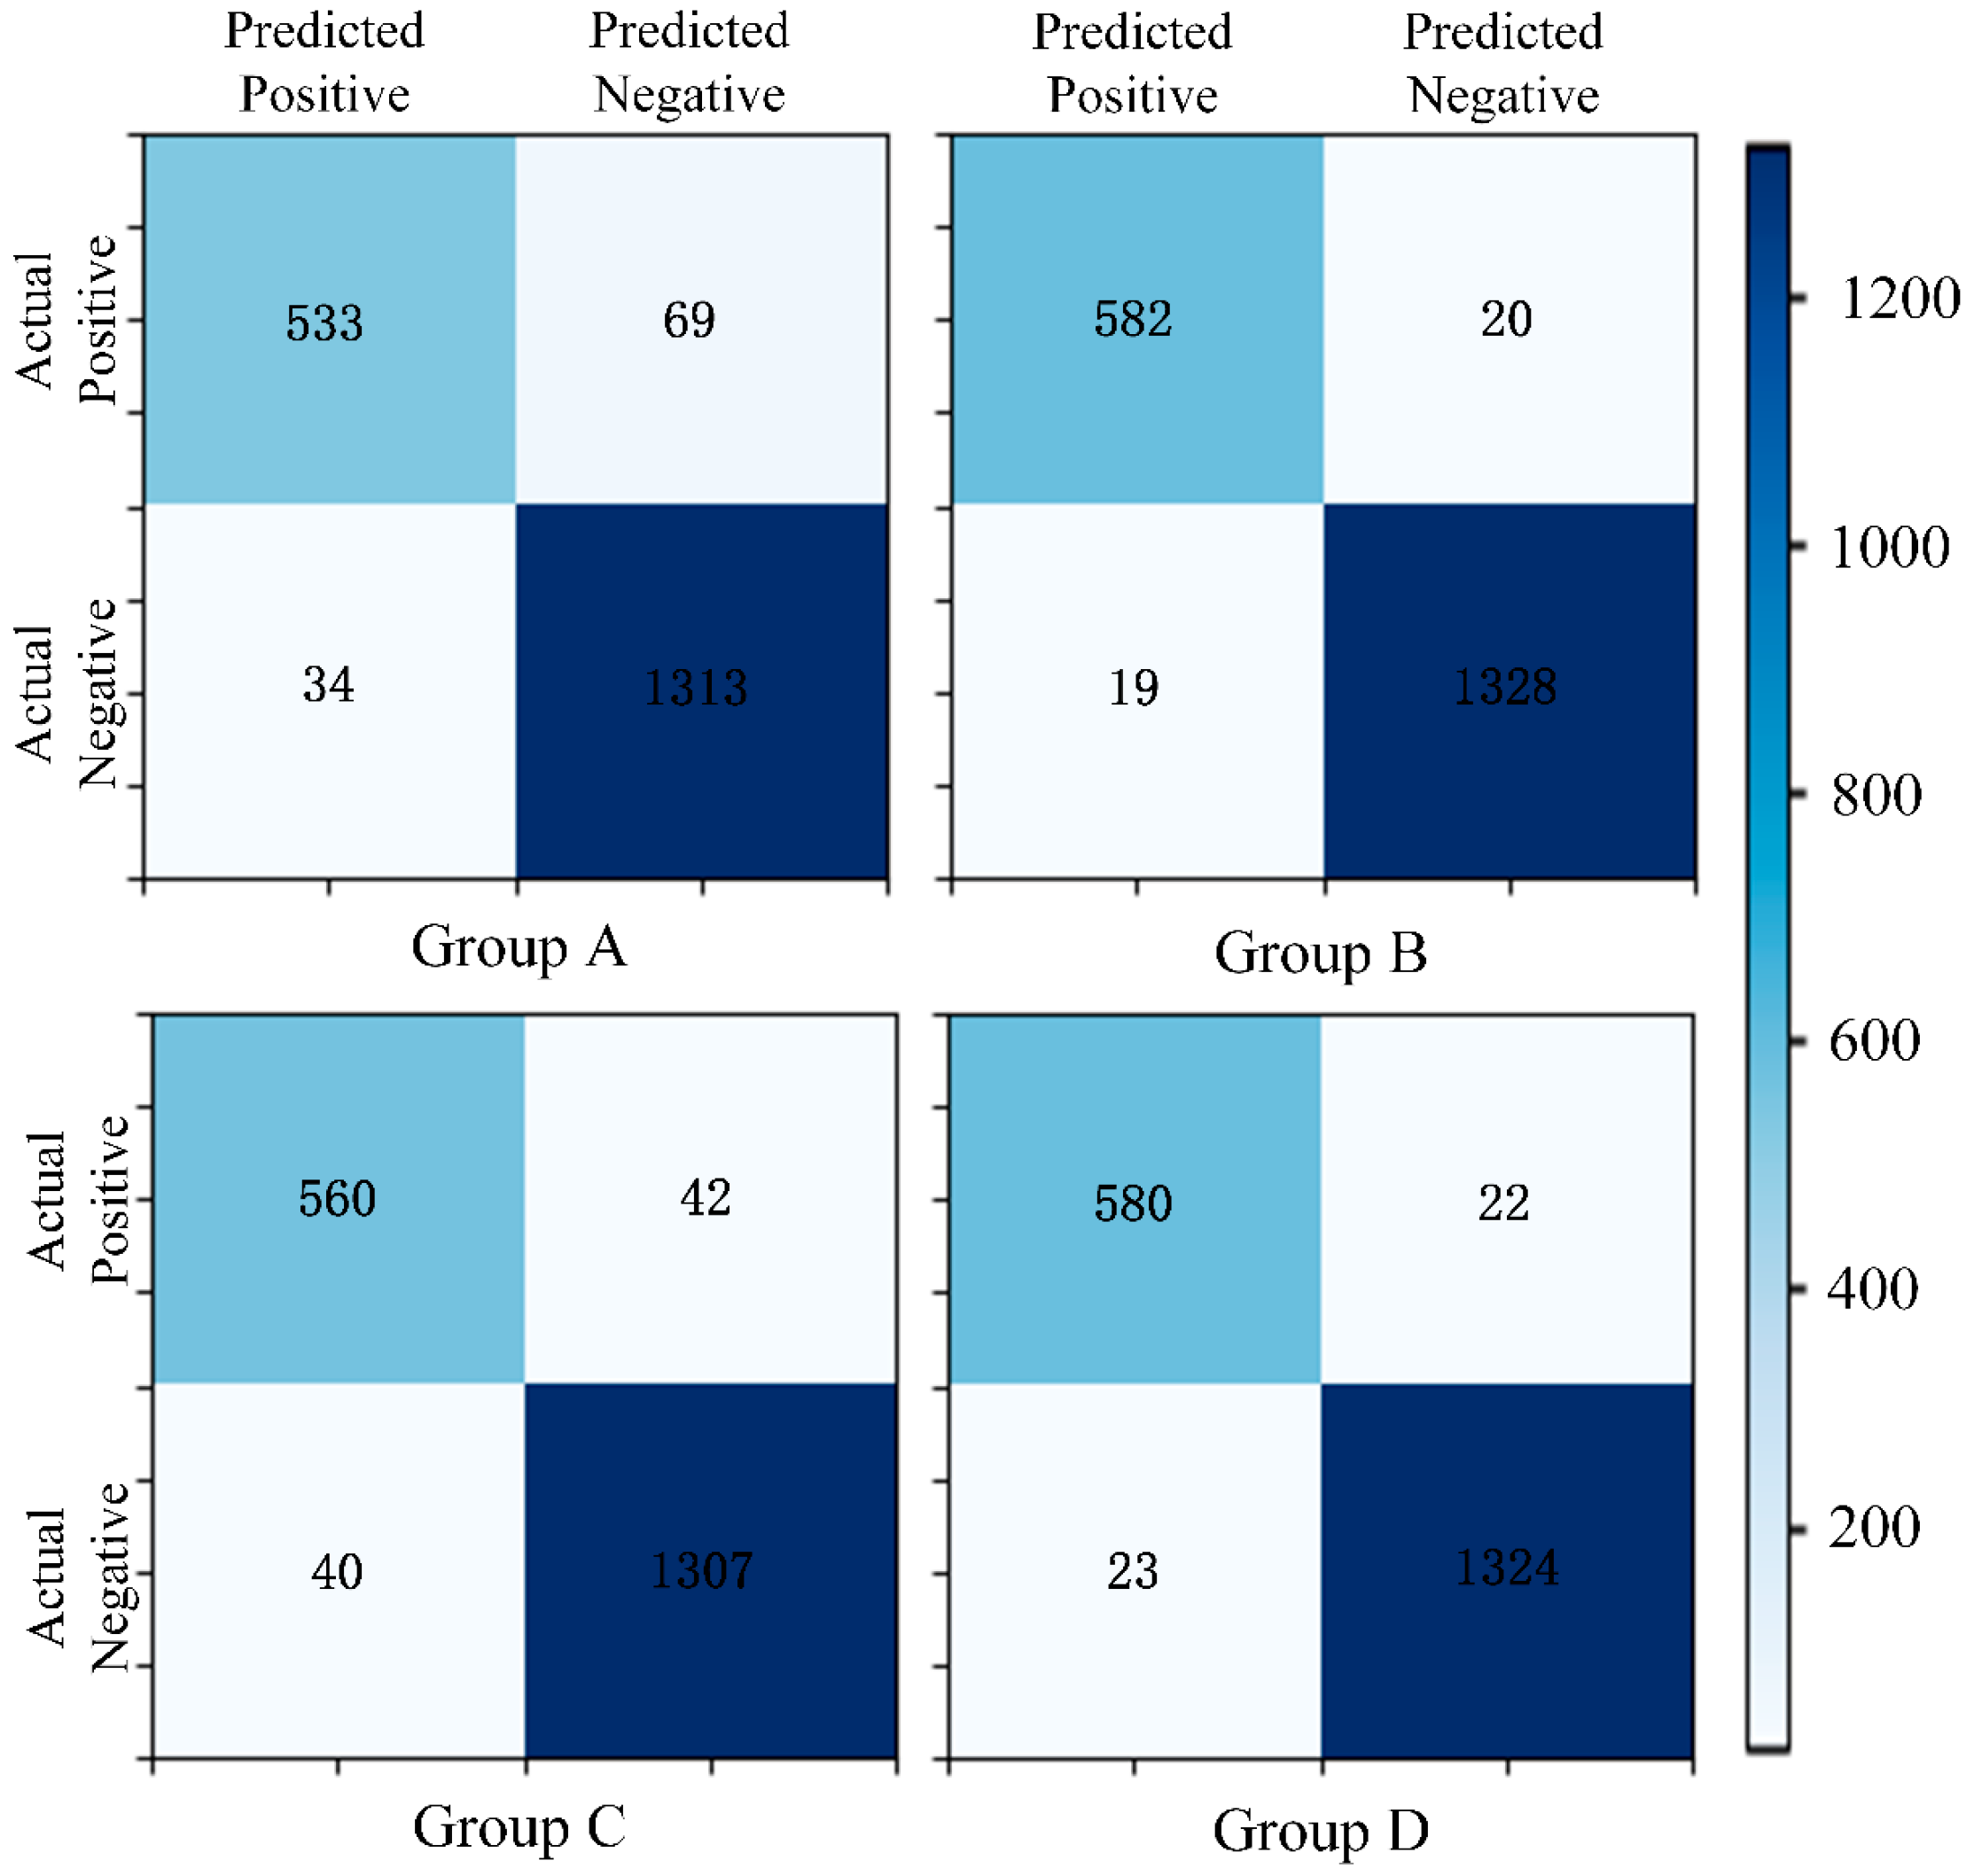
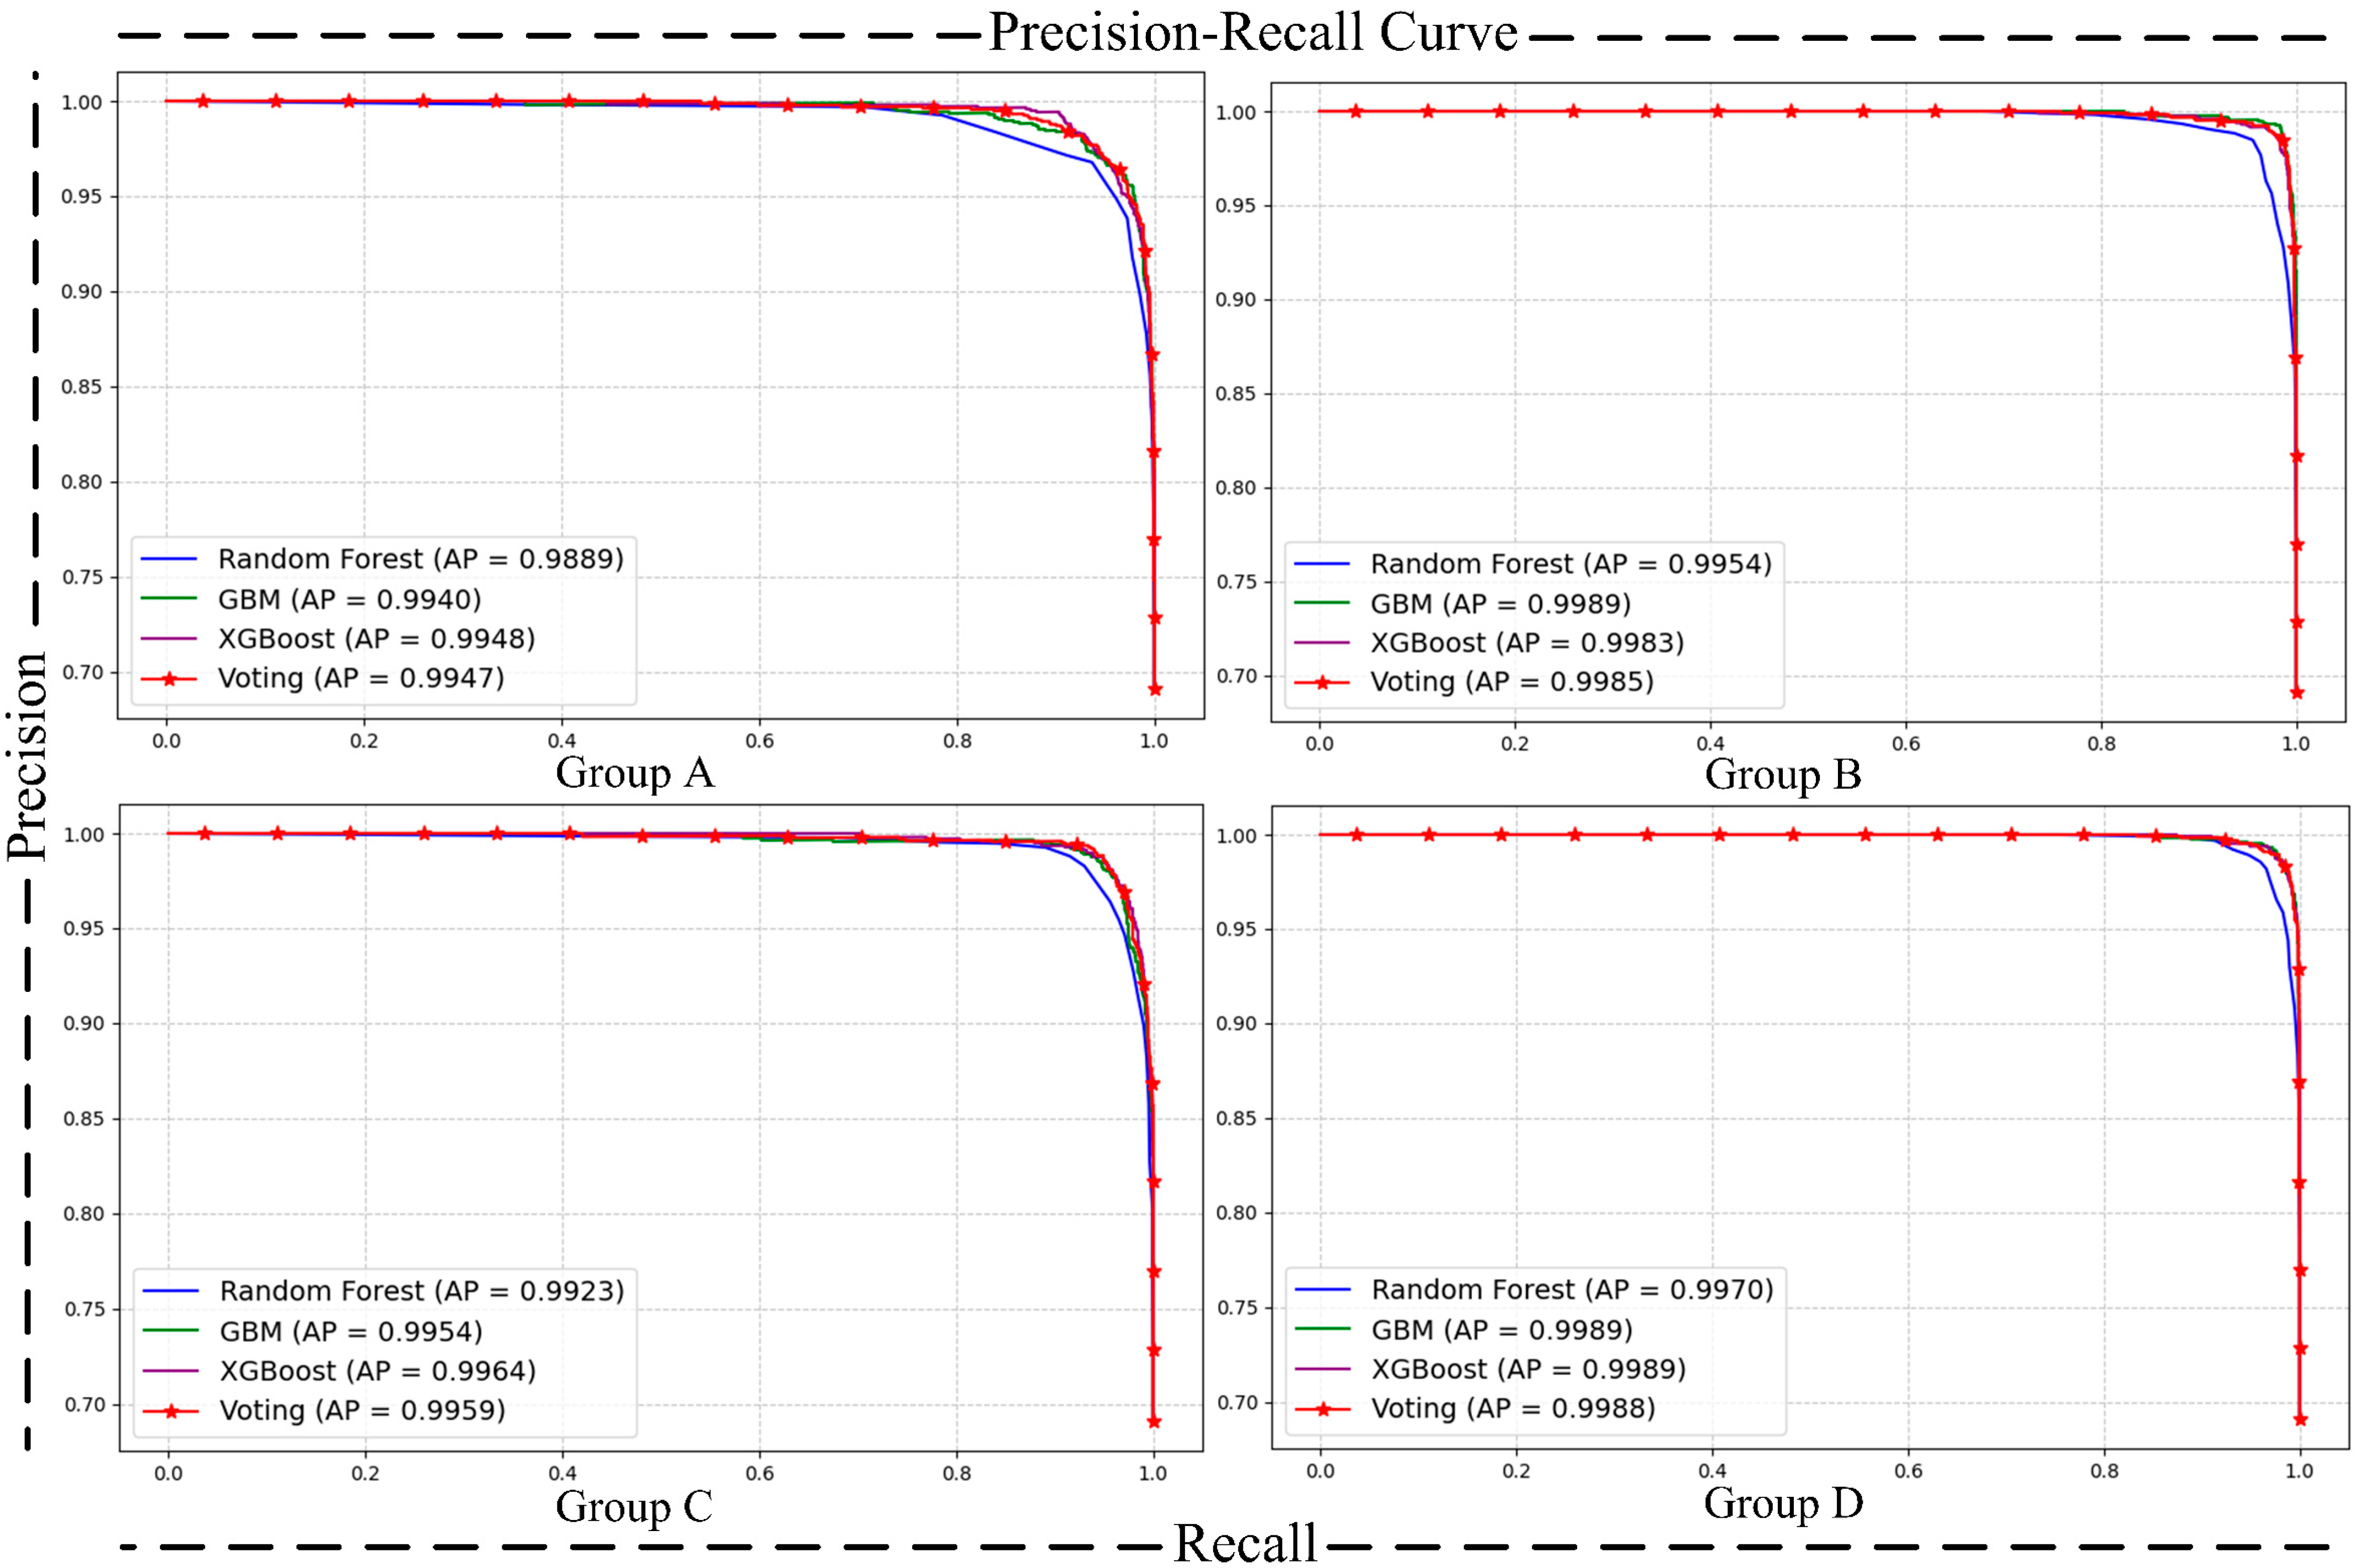
- Matrix [38] and Precision–Recall (P-R) Curve [40]: The confusion matrix and P-R curve provide valuable insights into the model’s performance, especially in imbalanced class distributions. The confusion matrix breaks down the classification results into true positives, true negatives, false positives, and false negatives, allowing for the calculation of metrics like precision, recall, and F1-score, which highlight the model’s ability to correctly identify the positive class. The P-R curve evaluates the trade-off between precision and recall at different thresholds, providing a clearer view of the model’s performance in detecting minority (positive) cases. Together, these tools complement the limitations of basic metrics and ensure good performance of the model on the positive class.
- (3)
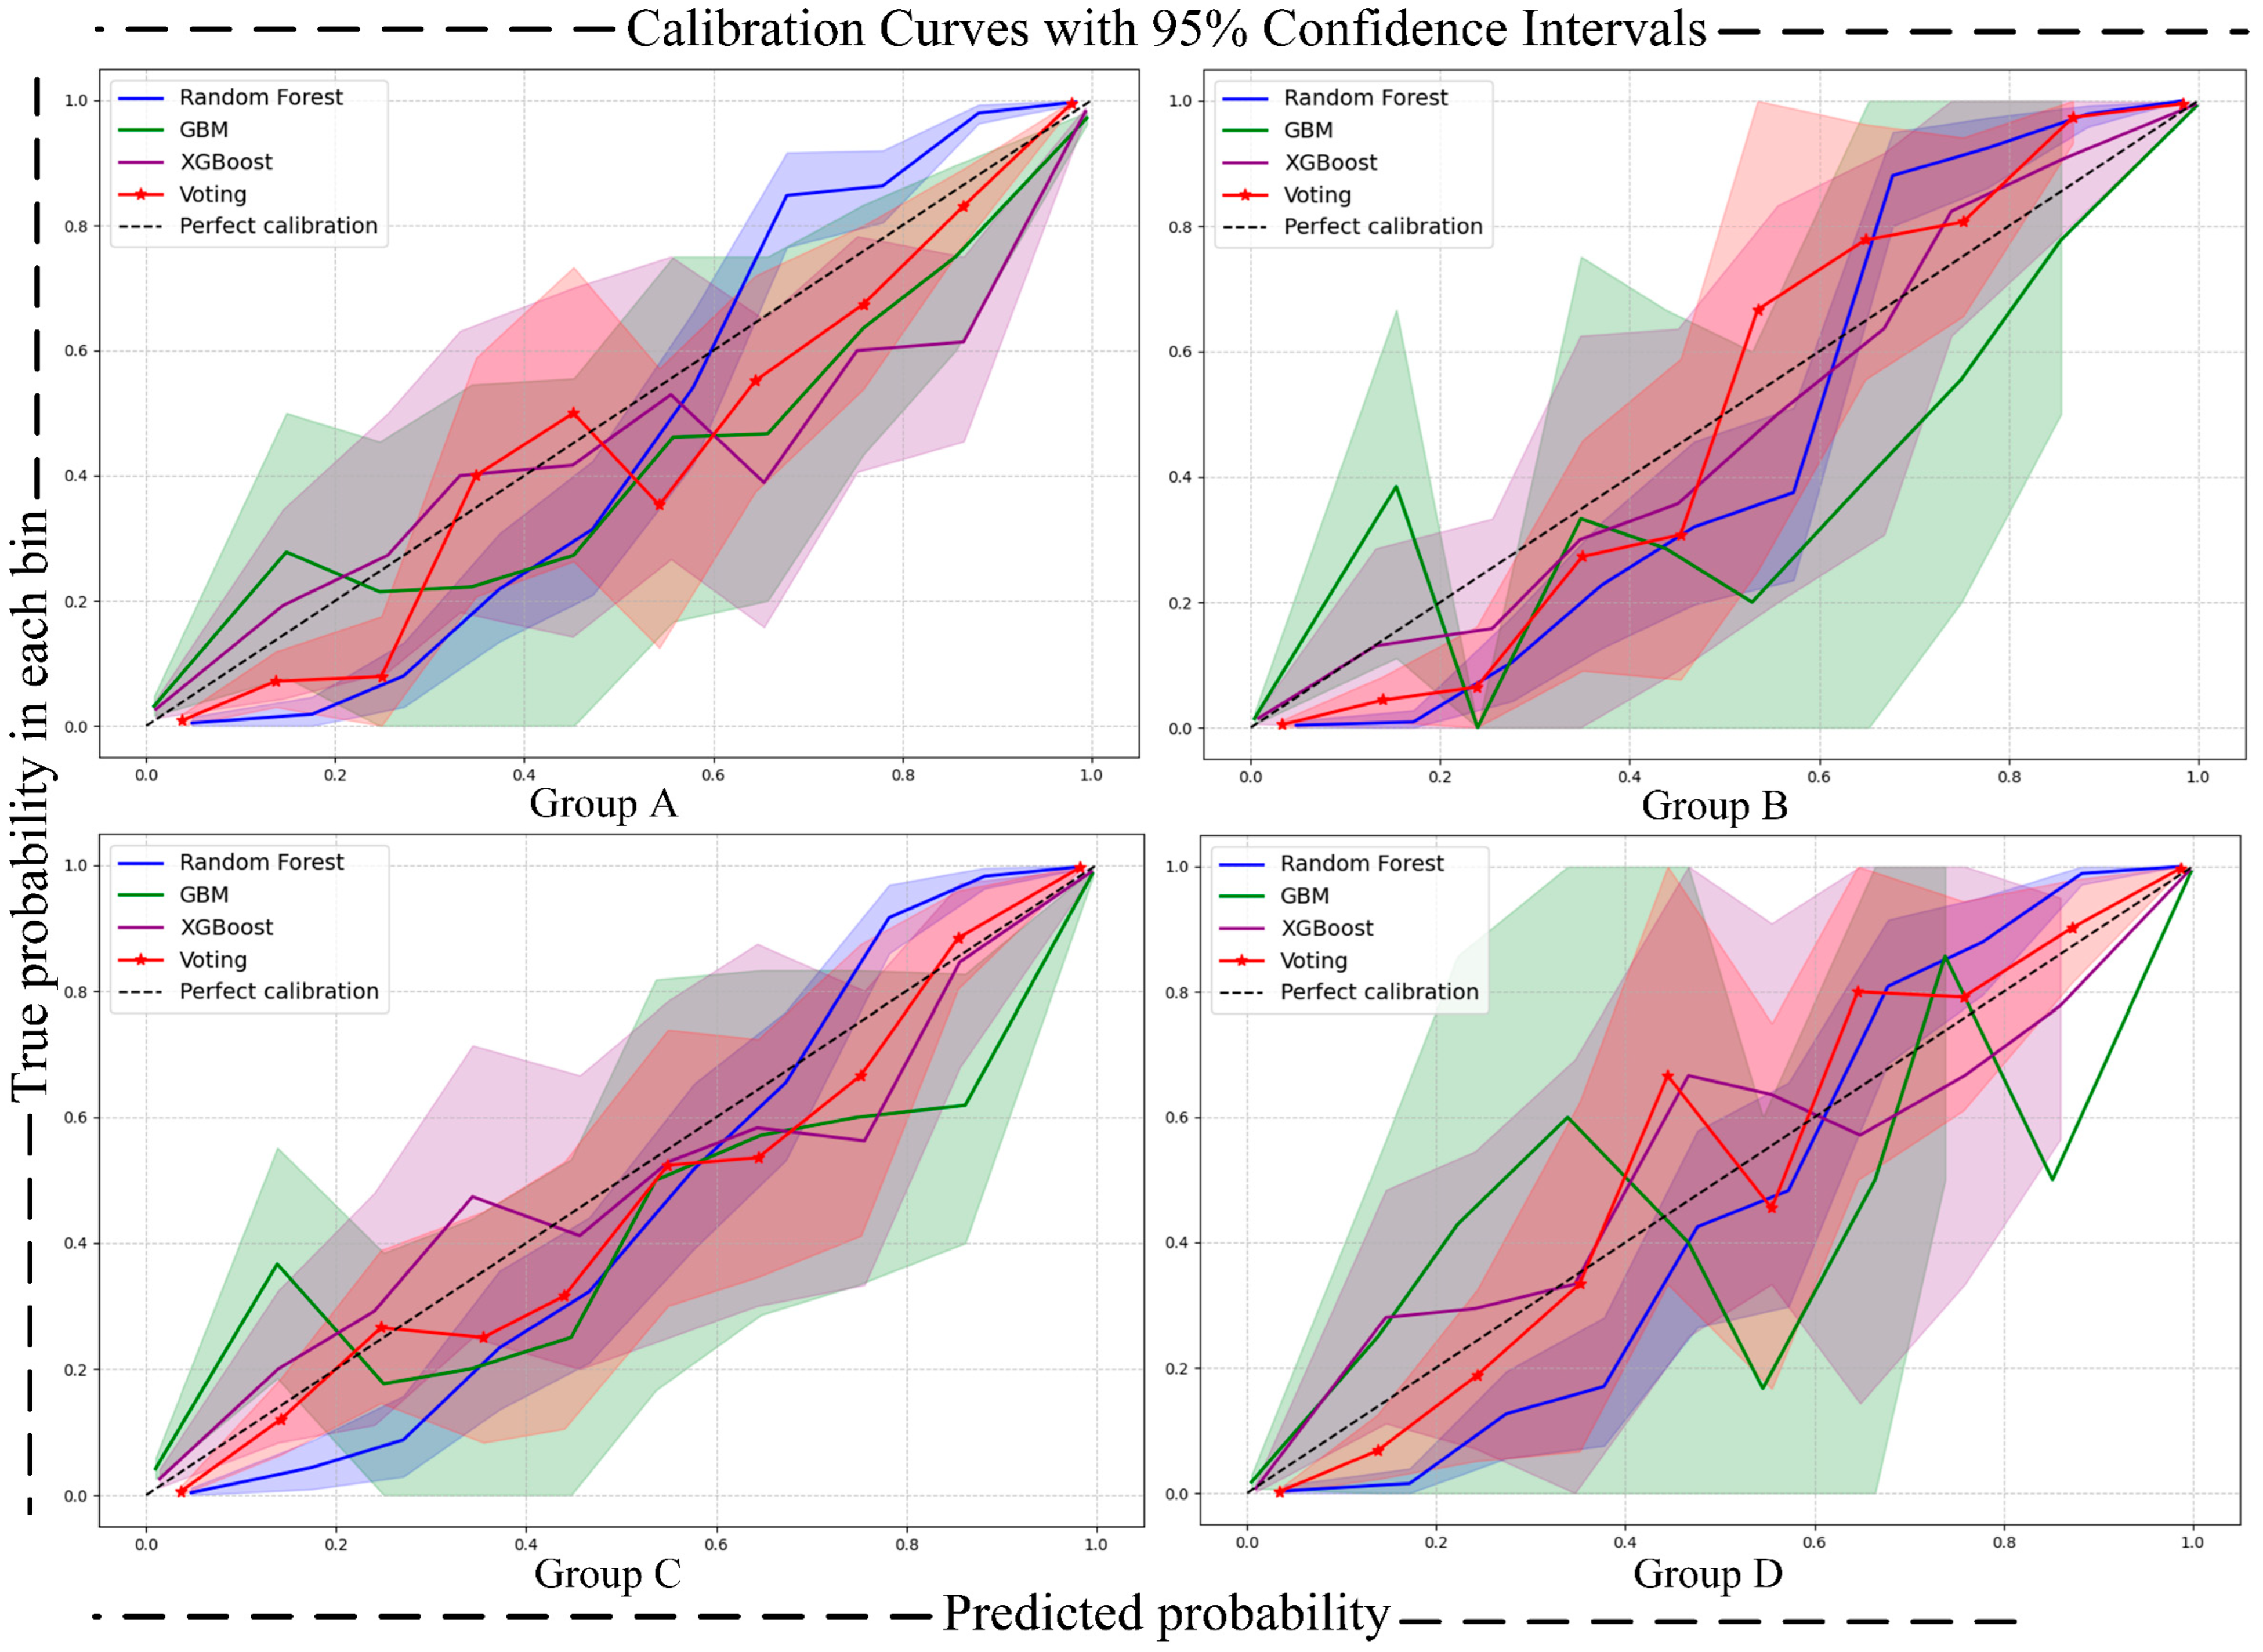
- Calibration Curve [41]: The calibration curve is used to assess the alignment between the predicted probabilities and the actual occurrence probabilities of a classification model. In the calibration curve, the x-axis represents the predicted risk, while the y-axis represents the observed risk. By comparing the position of the calibration curve with the 45-degree diagonal line, the calibration performance of the model can be evaluated. This reflects the model’s accuracy in predicting the probability of an event occurring. To quantify uncertainty, we calculated 95% confidence intervals (CIs) for the calibration curves using the bootstrap method, which were then visualized as shaded areas around the calibration curves. This approach provides a comprehensive assessment of the model’s calibration performance and the uncertainty associated with predicted probabilities.
- (4)
- DCA Curve (Decision Curve Analysis) [42]: Decision Curve Analysis (DCA) is a method for evaluating the clinical utility of classification model predictions under various disease risk thresholds. The x-axis represents the threshold probability, and the y-axis represents the net benefit. DCA evaluates the utility of different models and disease risk thresholds, assisting in the selection of the most suitable classification model and the optimal threshold. The clinical utility of the model is typically assessed by calculating the area under the curve (net benefit) and comparing the DCA curves across different models. Similarly to the calibration curve, a similar approach was adopted in plotting the DCA curve to further quantify uncertainty, with the uncertainty also visualized as shaded areas around the DCA curve.
- (5)
- Brier Score [43] and Expected Calibration Error (ECE) [44]: To further quantify the uncertainty in model predictions, we introduce two key uncertainty quantification metrics: the Brier score and ECE. The Brier score measures the overall accuracy of probability forecasts by calculating the mean squared error (MSE) between predicted probabilities and actual outcomes, as shown in Formula (1): pi is the probability that the model predicts sample i as the positive class, oi is the actual label of sample i, and N is the total number of samples. The ECE quantifies the degree of miscalibration in the predicted probabilities by dividing them into several bins and calculating the difference between the average predicted probability and the actual positive rate within each bin. The overall error is then obtained by taking a weighted average, as shown in Formula (2): |Bm| is the number of the sample of the m-th probability interval, avgm (p) is the average predicted probability within this interval, and accm is the actual accuracy (proportion of positive cases) within this interval. The Brier score is complemented by a 95% confidence interval, which also quantifies the uncertainty of the model and is computed using bootstrap sampling. By combining these uncertainty metrics, we can more comprehensively assess the reliability of the model, ensuring better predictive performance and robustness in real-world scenarios.
- (6)
- To further enhance the interpretability of the model, we use normalized mutual information (NMI) [45] to quantify the relationship between deep features and radiomics features. Mutual information is a commonly used metric to measure the amount of shared information between two variables, revealing their correlation, especially when the relationship between the two types of data is not explicitly clear. To avoid biases caused by differences in data scale and feature count, we chose NMI, which normalizes the mutual information values to a range of [0,1], ensuring a fair comparison between different feature sets.
4.4. Experiment Results and Analysis
4.4.1. Deep Feature Extraction Results
4.4.2. Radiomics Feature Selection Results
4.4.3. Model Evaluation
- (1)
- Prediction Metrics
- (2)
- Comparative Validation
- (3)
- Interpretability Validation
4.4.4. Ablation Experiment
5. Conclusions
Author Contributions
Funding
Institutional Review Board Statement
Informed Consent Statement
Data Availability Statement
Conflicts of Interest
Appendix A

References
- Occupational Safety and Health Administration (OSHA). Occupational Exposure to Respirable Crystalline Silica. U.S. Department of Labor. Available online: https://www.osha.gov/silica (accessed on 17 April 2025).
- De, K.N.H.; Ambrosini, G.L.; William, M.A. Crystalline Silica Exposure and Major Health Effects in Western Australian Gold Miners. Ann. Occup. Hyg. 2002, 46, 1–3. [Google Scholar] [CrossRef][Green Version]
- Chowdhary, C.L.; Acharjya, D.P. Segmentation and Feature Extraction in Medical Imaging: A Systematic Review. Procedia Comput. Sci. 2020, 167, 26–36. [Google Scholar] [CrossRef]
- Gillies, R.J.; Kinahan, P.E.; Hricak, H. Radiomics: Images Are More Than Pictures, They Are Data. Radiology 2013, 278, 563–577. [Google Scholar] [CrossRef] [PubMed]
- Conti, A.; Duggento, A.; Indovina, I.; Guerrisi, M.; Toschi, N. Radiomics in Breast Cancer Classification and Prediction. Semin. Cancer Biol. 2021, 68, 21–34. [Google Scholar] [CrossRef]
- Chetan, M.R.; Gleeson, F.V. Radiomics in Predicting Treatment Response in Non-Small-Cell Lung Cancer: Current Status, Challenges, and Future Perspectives. Eur. Radiol. 2020, 31, 1049–1058. [Google Scholar] [CrossRef]
- Shi, L.; Sheng, M.; Wei, L.Z.J. CT-Based Radiomics Predicts the Malignancy of Pulmonary Nodules: A Systematic Review and Meta-Analysis. Acad. Radiol. 2023, 30, 3064–3075. [Google Scholar] [CrossRef]
- Naik, R.K.V. Lung Nodule Classification on Computed Tomography Images Using FractalNet. Wirel. Pers. Commun. 2021, 119, 1209–1229. [Google Scholar] [CrossRef]
- Tang, N.; Zhang, R.; Wei, Z.; Chen, X.; Li, G.; Song, Q.; Yi, D.; Wu, Y. Improving the Performance of Lung Nodule Classification by Fusing Structured and Unstructured Data. Inf. Fusion 2022, 88, 161–174. [Google Scholar] [CrossRef]
- Li, S.; Hou, Z.; Liu, J.; Ren, W.; Wan, S.; Yan, J.; CC Centre; DT Hospital. Radiomics Analysis and Modeling Tools: A Review. Chin. J. Med. Phys. 2018, 35, 1043–1049. [Google Scholar] [CrossRef]
- Dutande, P.; Baid, U.; Talbar, S. LNCDS: A 2D-3D Cascaded CNN Approach for Lung Nodule Classification, Detection and Segmentation. Biomed. Signal Process. Control 2021, 67, 102527. [Google Scholar] [CrossRef]
- Hosny, A.; Parmar, C.; Quackenbush, J.; Schwartz, L.H.; Aerts, H.J.W.L. Artificial Intelligence in Radiology. Nat. Rev. Cancer 2018, 18, 500–510. [Google Scholar] [CrossRef] [PubMed]
- Sun, W.; Zheng, B.; Qian, W. Automatic Feature Learning Using Multichannel ROI Based on Deep Structure Algorithms for Computerized Lung Cancer Diagnosis. Comput. Biol. Med. 2017, 89, 530–539. [Google Scholar] [CrossRef] [PubMed]
- Paul, R.; Hall, L.; Goldgof, D.; Schabath, M.; Gillies, R. Predicting Nodule Malignancy Using a CNN Ensemble Approach. In Proceedings of the 2018 International Joint Conference on Neural Networks (IJCNN), Rio de Janeiro, Brazil, 8–13 July 2018; pp. 1–8. [Google Scholar] [CrossRef]
- Simonyan, K.; Zisserman, A. Very Deep Convolutional Networks for Large-Scale Image Recognition. arXiv 2014, arXiv:1409.1556. [Google Scholar] [CrossRef]
- Al-Huseiny, M.S.; Sajit, A.S. Transfer Learning with GoogleNet for Detection of Lung Cancer. Indones. J. Electr. Eng. Comput. Sci. 2021, 22, 1078–1086. [Google Scholar] [CrossRef]
- He, K.; Zhang, X.; Ren, S.; Sun, J. Deep Residual Learning for Image Recognition. In Proceedings of the IEEE Conference on Computer Vision and Pattern Recognition, Las Vegas, NV, USA, 27–30 June 2016; pp. 770–778. [Google Scholar] [CrossRef]
- Bruntha, P.M.; Dhanasekar, S.; Ahmed, L.J. Investigation of Deep Features in Lung Nodule Classification. In Proceedings of the 2022 6th International Conference on Devices, Circuits and Systems (ICDCS), Vellore, India, 18–20 March 2022; pp. 67–70. [Google Scholar]
- Dodia, S.; Basava, A.; Padukudru Anand, M. A Novel Receptive Field-Regularized V-Net and Nodule Classification Network for Lung Nodule Detection. Int. J. Imaging Syst. Technol. 2022, 32, 88–101. [Google Scholar] [CrossRef]
- Wu, R.; Huang, H. Multi-Scale Multi-View Model Based on Ensemble Attention for Benign-Malignant Lung Nodule Classification on Chest CT. In Proceedings of the 2022 15th International Congress on Image and Signal Processing, BioMedical Engineering and Informatics (CISP-BMEI), Chengdu, China, 16–18 December 2022; pp. 1–6. [Google Scholar]
- Liu, D.; Liu, F.; Tie, Y.; Qi, L.; Wang, F. Res-Trans Networks for Lung Nodule Classification. Int. J. Comput. Assist. Radiol. Surg. 2022, 17, 1059–1068. [Google Scholar] [CrossRef] [PubMed]
- Bruntha, P.M.; Pandian, S.I.A.; Anitha, J.; Abraham, S.S.; Kumar, S.N. A Novel Hybridized Feature Extraction Approach for Lung Nodule Classification Based on Transfer Learning Technique. J. Med. Phys. 2022, 47, 1–9. [Google Scholar] [CrossRef]
- Xiao, J.; Wang, S.; Zhou, J.; Tian, Z.; Zhang, H.; Wang, Y.-F. MIM: High-Definition Maps Incorporated Multi-View 3D Object Detection. IEEE Trans. Intell. Transp. Syst. 2025, 26, 2501–2511. [Google Scholar] [CrossRef]
- Xiao, J.; Guo, H.; Zhou, J.; Zhao, T.; Yu, Q.; Chen, Y.; Wang, Z. Tiny Object Detection with Context Enhancement and Feature Purification. Expert Syst. Appl. 2023, 211, 118665. [Google Scholar] [CrossRef]
- Xiang, Z. VSS-SpatioNet: A Multi-Scale Feature Fusion Network for Multimodal Image Integrations. Sci. Rep. 2025, 15, 9306. [Google Scholar] [CrossRef]
- Li, Y.; El Habib Daho, M.; Conze, P.; Zeghlache, R.; Le Boité, H.; Tadayoni, R.; Cochener, B.; Lamard, M.; Quellec, G. A Review of Deep Learning-Based Information Fusion Techniques for Multimodal Medical Image Classification. arXiv 2024, arXiv:2404.15022. [Google Scholar] [CrossRef] [PubMed]
- Zhou, T.; Cheng, Q.R.; Lu, H.L.; Li, Q.; Zhang, X.X.; Qiu, S. Deep learning methods for medical image fusion: A review. Comput. Biol. Med. 2023, 160, 106959. [Google Scholar] [CrossRef]
- Qiao, H.; Chen, Y.; Qian, C.; Guo, Y. Clinical Data Mining: Challenges, Opportunities, and Recommendations for Translational Applications. J. Transl. Med. 2024, 22, 185. [Google Scholar] [CrossRef]
- Ranjan, A.; Zhao, Y.; Sahu, H.B.; Misra, P. Opportunities and Challenges in Health Sensing for Extreme Industrial Environments: Perspectives from Underground Mines. IEEE Access 2019, 7, 139181–139195. [Google Scholar] [CrossRef]
- Nobrega, R.V.M.D.; Peixoto, S.A.; Silva, S.P.P.D.; Filho, P.P.R. Lung Nodule Classification via Deep Transfer Learning in CT Lung Images. In Proceedings of the 2018 IEEE 31st International Symposium on Computer-Based Medical Systems (CBMS), Aalborg, Denmark, 18–20 June 2018; pp. 1–6. [Google Scholar] [CrossRef]
- Muñoz-Rodenas, J.; García-Sevilla, F.; Coello-Sobrino, J.; Martínez-Martínez, A.; Miguel-Eguía, V. Effectiveness of Machine-Learning and Deep-Learning Strategies for the Classification of Heat Treatments Applied to Low-Carbon Steels Based on Microstructural Analysis. Appl. Sci. 2023, 13, 3479. [Google Scholar] [CrossRef]
- Mahajan, P.; Uddin, S.; Hajati, F.; Moni, M.A. Ensemble Learning for Disease Prediction: A Review. Healthcare 2023, 11, 1808. [Google Scholar] [CrossRef]
- Chen, T.; Guestrin, C. XGBoost: A Scalable Tree Boosting System. In Proceedings of the 22nd ACM SIGKDD International Conference on Knowledge Discovery and Data Mining, San Francisco, CA, USA, 13–17 August 2016; pp. 785–794. [Google Scholar]
- Friedman, J.H. Greedy Function Approximation: A Gradient Boosting Machine. Ann. Stat. 2001, 29, 1189–1232. [Google Scholar] [CrossRef]
- Breiman, L. Random Forests. Mach. Learn. 2001, 45, 5–32. [Google Scholar] [CrossRef]
- Armato, S.G., III; McLennan, G.; Bidaut, L.; McNitt-Gray, M.F.; Meyer, C.R.; Reeves, A.P.; Zhao, B.; Aberle, D.R.; Henschke, C.I.; Hoffman, E.A.; et al. Data From LIDC-IDRI (Version 4); The Cancer Imaging Archive: Frederick, MD, USA, 2015. [Google Scholar] [CrossRef]
- Bradley, A.P. The use of the area under the ROC curve in the evaluation of machine learning algorithms. Pattern Recogn. 1997, 30, 1145–1159. [Google Scholar] [CrossRef]
- Sokolova, M.; Lapalme, G. A Systematic Analysis of Performance Measures for Classification Tasks. Inf. Process. Manag. 2009, 45, 427–437. [Google Scholar] [CrossRef]
- Powers, D.M.W. Evaluation: From precision, recall and f-factor to roc, informedness, markedness & correlation. arXiv 2010. [Google Scholar] [CrossRef]
- Davis, J.; Goadrich, M. The relationship between Precision-Recall and ROC curves. In Proceedings of the 23rd International Conference on Machine Learning, Pittsburgh, PA, USA, 25–29 June 2006; pp. 233–240. [Google Scholar] [CrossRef]
- Niculescu-Mizil, A.; Caruana, R. Predicting good probabilities with supervised learning. In Proceedings of the 22nd International Conference (ICML 2005) on Machine Learning, Bonn, Germany, 7–11 August 2005. [Google Scholar]
- Vickers, A.J.; Elkin, E.B. Decision curve analysis: A novel method for evaluating prediction models. Med. Decis. Mak. 2006, 26, 565–574. [Google Scholar] [CrossRef]
- Brier, G.W. Verification of forecasts expressed in terms of probability. Mon. Weather Rev. 1950, 78, 1–3. [Google Scholar] [CrossRef]
- Guo, C.; Pleiss, G.; Yu, S.; Weinberger, K.Q. On calibration of modern neural networks. In Proceedings of the 34th International Conference on Machine Learning, Sydney, Australia, 6–11 August 2017. [Google Scholar] [CrossRef]
- Strehl, A.; Ghosh, J. Cluster ensembles—A knowledge reuse framework for combining multiple partitions. J. Mach. Learn. Res. 2002, 3, 583–617. [Google Scholar] [CrossRef][Green Version]
- Halder, A.; Chatterjee, S.; Dey, D. Adaptive Morphology Aided 2-Pathway Convolutional Neural Network for Lung Nodule Classification. Biomed. Signal Process. Control 2022, 72, 103347. [Google Scholar] [CrossRef]
- Yang, J.; Zhu, D.; Shao, J.; Liu, X. A 3D Multi-Scale Cross-Fusion Network for Lung Nodule Classification. Comput. Eng. Appl. 2022, 58, 121–125. [Google Scholar] [CrossRef]
- Wu, K.; Peng, B.; Zhai, D. Multi-Granularity Dilated Transformer for Lung Nodule Classification via Local Focus Scheme. Appl. Sci. 2022, 13, 377. [Google Scholar] [CrossRef]
- Yin, Z.; Xia, K.; Wu, P. A Multimodal Feature Fusion Network for the Benign-Malignant Classification of Lung Nodules. Comput. Eng. Appl. 2023, 59, 228–236. [Google Scholar] [CrossRef]
- Halder, A.; Dey, D. Atrous Convolution Aided Integrated Framework for Lung Nodule Segmentation and Classification. Biomed. Signal Process. Control 2023, 82, 104527. [Google Scholar] [CrossRef]
- Wu, R.; Liang, C.; Li, Y.; Shi, X.; Zhang, J.; Huang, H. Self-Supervised Transfer Learning Framework Driven by Visual Attention for Benign–Malignant Lung Nodule Classification on Chest CT. Expert Syst. Appl. 2023, 215, 119339. [Google Scholar] [CrossRef]
- Balci, M.A.; Batrancea, L.M.; Akgüller, M.; Nichita, A. A Series-Based Deep Learning Approach to Lung Nodule Image Classification. Cancers 2023, 15, 843. [Google Scholar] [CrossRef] [PubMed]
- Qiao, J.; Fan, Y.; Zhang, M.; Fang, K.; Wang, Z. Ensemble Framework Based on Attributes and Deep Features for Benign-Malignant Classification of Lung Nodule. Biomed. Signal Process. Control 2023, 79, 104217. [Google Scholar] [CrossRef]
- Dhasny Lydia, M.; Prakash, M. An Improved Convolution Neural Network and Modified Regularized K-Means-Based Automatic Lung Nodule Detection and Classification. J. Digit. Imaging 2023, 36, 1431–1446. [Google Scholar] [CrossRef]
- Saihood, A.; Abdulhussien, W.R.; Alzubaid, L.; Manoufali, M.; Gu, Y. Fusion-Driven Semi-Supervised Learning-Based Lung Nodule Classification with Dual-Discriminator and Dual-Generator Generative Adversarial Network. BMC Med. Inform. Decis. Mak. 2024, 24, 403. [Google Scholar] [CrossRef] [PubMed]
- Saied, M.; Raafat, M.; Yehia, S.; Khalil, M.M. Efficient Pulmonary Nodules Classification Using Radiomics and Different Artificial Intelligence Strategies. Insights Imaging 2023, 14, 91. [Google Scholar] [CrossRef]
- Gautam, N.; Basu, A.; Sarkar, R. Lung Cancer Detection from Thoracic CT Scans Using an Ensemble of Deep Learning Models. Neural Comput. Appl. 2024, 36, 2459–2477. [Google Scholar] [CrossRef]
- Kumar, V.; Prabha, C.; Sharma, P.; Mittal, N.; Askar, S.S.; Abouhawwash, M. Unified Deep Learning Models for Enhanced Lung Cancer Prediction with ResNet-50–101 and EfficientNet-B3 Using DICOM Images. BMC Med. Imaging 2024, 24, 63. [Google Scholar] [CrossRef]
- Esha, J.F.; Islam, T.; Pranto, M.A.M.; Borno, A.S.; Faruqui, N.; Yousuf, M.A.; AI-Moisheer, A.S.; Alotaibi, N.; Alyami, S.A.; Moni, M.A. Multi-View Soft Attention-Based Model for the Classification of Lung Cancer-Associated Disabilities. Diagnostics 2024, 14, 2282. [Google Scholar] [CrossRef]
- Vanguri, R.S.; Luo, J.; Aukerman, A.T.; Egger, J.V.; Fong, C.J.; Horvat, N.; Pagano, A.; Araujo-Filho, J.d.A.B.; Geneslaw, L.; Rizvi, H.; et al. Multimodal Integration of Radiology, Pathology, and Genomics for Prediction of Response to PD-(L)1 Blockade in Patients with Non-Small Cell Lung Cancer. Nat. Cancer 2022, 3, 1151–1164. [Google Scholar] [CrossRef]
- Biswas, S.; Mostafiz, R.; Paul, B.K.; Uddin, K.M.M.; Hadi, M.A.; Khanom, F. DFU_XAI: A Deep Learning-Based Approach to Diabetic Foot Ulcer Detection Using Feature Explainability. Biomed. Mater. Devices 2024, 2, 2. [Google Scholar] [CrossRef]
- Wani, N.A.; Kumar, R.; Bedi, J. DeepXplainer: An Interpretable Deep Learning-Based Approach for Lung Cancer Detection Using Explainable Artificial Intelligence. Comput. Methods Programs Biomed. 2024, 243, 13. [Google Scholar] [CrossRef] [PubMed]
- Oumlaz, M.; Oumlaz, Y.; Oukaira, A.; Benelhaouare, A.Z.; Lakhssassi, A. Advancing Pulmonary Nodule Detection with ARSGNet: EfficientNet and Transformer Synergy. Electronics 2024, 13, 4369. [Google Scholar] [CrossRef]


| Label | Benign (0) | Malignant (1) | |
|---|---|---|---|
| Features | |||
| Subtlety | 1, 2 | 3, 4, 5 | |
| Calcification | 1~5 | 6 | |
| Sphericity | 1, 2, 3 | 4, 5 | |
| Margin | 1, 2 | 3, 4, 5 | |
| Lobulation | 3, 4, 5 | 1, 2 | |
| Spiculation | 3, 4, 5 | 1, 2 | |
| Texture | 1, 2, 3 | 4, 5 | |
| Library Name | Version Number | Library Name | Version Number |
|---|---|---|---|
| python | 3.9.13 | pylint | 2.14.5 |
| numpy | 1.24.4 | scikit-learn | 1.0.2 |
| pandas | 2.2.2 | torch | 2.2.1+cu118 |
| pylidc | 0.2.3 | tqdm | 4.64.1 |
| Malignancy Degree | 1 | 2 | 3 | 4 | 5 |
|---|---|---|---|---|---|
| Benign | Suspected Benign | Uncertain | Suspected Malignant | Malignant | |
| Quantity | 790 | 1234 | 38 | 2599 | 1871 |
| Binarization | 0 | 0 | Discard | 1 | 1 |
| Num | Feature Name | Feature Characterization | Weight |
|---|---|---|---|
| I | wavelet-LL_glcm_Imc1 | Symmetry and Entropy of Grayscale Distribution | 0.0747 |
| II | log-sigma-5-mm-3D_glcm_InverseVariance | Contrast and Grayscale Uniformity of the Image | 0.0586 |
| III | wavelet-LH_glcm_Imc1 | Symmetry and Entropy of Grayscale Distribution in the Horizontal Direction | 0.0521 |
| IV | wavelet-LH_glrlm_RunEntropy | Complexity and Information Content of Grayscale Levels in the Horizontal Direction | 0.0441 |
| V | log-sigma-3-mm-3D_glcm_InverseVariance | Contrast and Grayscale Uniformity in Local Regions | 0.0407 |
| VI | wavelet-HH_firstorder_InterquartileRange | Extremity of Grayscale Distribution in High-Frequency Regions | 0.0402 |
| VII | original_shape2D_MinorAxisLength | 2D Shape and Size of the Nodule | 0.0377 |
| VIII | log-sigma-5-mm-3D_glrlm_ LowGrayLevelRunEmphasis | Significance of Long Runs and Low-Gray-Level Regions | 0.0338 |
| IX | log-sigma-5-mm-3D_glrlm_RunVariance | Variability of Run Lengths of Grayscale Levels | 0.0324 |
| X | log-sigma-5-mm-3D_glrlm_RunEntropy | Information Content and Complexity of Grayscale Levels | 0.0273 |
| XI | wavelet-LL_glcm_Correlation | Correlation and Consistency of Grayscale Distribution | 0.0244 |
| XII | original_gldm_DependenceVariance | Variability and Complexity of Grayscale Dependence Relationships | 0.0238 |
| Group | Clinical Annotated Features | Radiomics Features | Deep Features | ||
|---|---|---|---|---|---|
| Binarization | One-Hot | ResNet50 | AlexNet | ||
| A | √ | √ | √ | ||
| B | √ | √ | √ | ||
| C | √ | √ | √ | ||
| D | √ | √ | √ | ||
| Group | AUC | ACC | Brier Score (95% CIs) | ECE | SEN | SPE | PPV | NPV |
|---|---|---|---|---|---|---|---|---|
| A | 0.9885 | 0.9497 | (0.0330, 0.0446) | 0.0781 | 0.8854 | 0.9725 | 0.95 | 0.9452 |
| B | 0.9976 | 0.9785 | (0.0151, 0.0232) | 0.0922 | 0.9601 | 0.9866 | 0.9823 | 0.9698 |
| C | 0.9919 | 0.9579 | (0.0267, 0.0369) | 0.0562 | 0.9352 | 0.9681 | 0.971 | 0.929 |
| D | 0.9974 | 0.9779 | (0.0142, 0.0217) | 0.0726 | 0.9651 | 0.9829 | 0.9844 | 0.9619 |
| Model Structure | Source/Year | Evaluation Metrics (LIDC-IDRI) | ||
|---|---|---|---|---|
| ACC | SPE | SEN | ||
| Structured Features + CNN + XGBoost [9] | Information Fusion/2022 | 0.94 | 0.94 | 0.93 |
| CNN + Adaptive Morphology + Dual-path [46] | Biomedical Signal Processing and Control/2022 | 0.97 | 0.98 | 0.93 |
| 3D Multiscale Cross Fusion Network [47] | Computer Engineering and Applications/2022 | 0.90 | 0.88 | 0.93 |
| Multigranularity Transformer + LFS [48] | Applied Sciences/2022 | 0.96 | 0.96 | 0.98 |
| Multimodal Feature + Fusion Network [49] | Computer Engineering and Applications/2023 | 0.93 | 0.95 | 0.91 |
| Dilated Convolution + Multiscale [50] | Biomedical Signal Processing and Control/2023 | 0.95 | 0.96 | 0.95 |
| Self-supervised Learning + Transfer Learning + Visual Attention [51] | Expert Systems with Applications/2023 | 0.92 | 0.93 | 0.91 |
| U-Net + Radial Scan [52] | Cancers/2023 | 0.92 | / | 0.92 |
| LSTM + CNN + Multisemantic Features [53] | Biomedical Signal Processing and Control/2023 | 0.95 | 0.93 | 1.0 |
| CNN+ATSO [54] | Journal of Digital Imaging/2023 | 0.96 | / | 0.94 |
| Radiomics + CNN [55] | Insights Imaging/2023 | 0.90 | 0.94 | 0.90 |
| Ensemble DLM [56] | Neural Computing and Applications/2023 | 0.97 | / | 0.98 |
| DDDG-GAN [57] | BMC Med Inform Decis Mak/2024 | 0.93 | / | / |
| Fusion model [58] | BMC Medical Imaging/2024 | 0.94 | / | 1 |
| MVSA-CNN [59] | Diagnostics(Basel)/2024 | 0.97 | 0.96 | 0.97 |
| Group A | Ours | 0.94 | 0.88 | 0.97 |
| Group B | 0.98 | 0.96 | 0.98 | |
| Group C | 0.95 | 0.93 | 0.96 | |
| Group D | 0.98 | 0.96 | 0.98 | |
| Clinical Annotated Features | Radiomics Features | Deep Features | Ensemble Learning | AUC | ACC | SPE |
|---|---|---|---|---|---|---|
| √ | 0.9908 | 0.9456 | 0.9302 | |||
| √ | √ | 0.9941 | 0.9620 | 0.9452 | ||
| √ | √ | 0.9807 | 0.9354 | 0.8804 | ||
| √ | √ | √ | 0.9910 | 0.9528 | 0.9169 | |
| √ | √ | √ | √ | 0.9976 | 0.9785 | 0.9601 |
| ResNet50 | AUC | ACC | F1-score | Brier Score | ECE | SPE | NPV | ||
|---|---|---|---|---|---|---|---|---|---|
| Group | A | XGBoost | 0.9883 | 0.9456 | 0.9162 | 0.0407 | 0.0889 | 0.9725 | 0.9351 |
| GBM | 0.9869 | 0.9456 | 0.9206 | 0.0408 | 0.1027 | 0.9770 | 0.9351 | ||
| RF | 0.9801 | 0.9374 | 0.9134 | 0.0565 | 0.1111 | 0.9614 | 0.9110 | ||
| ME | 0.9885 | 0.9497 | 0.9162 | 0.0385 | 0.0781 | 0.9725 | 0.9452 | ||
| B | XGBoost | 0.9963 | 0.9769 | 0.9709 | 0.0186 | 0.0472 | 0.9837 | 0.9634 | |
| GBM | 0.9966 | 0.9785 | 0.9702 | 0.0159 | 0.1523 | 0.9866 | 0.9698 | ||
| RF | 0.991 | 0.9528 | 0.9412 | 0.0410 | 0.1329 | 0.9688 | 0.9293 | ||
| ME | 0.9976 | 0.9785 | 0.9702 | 0.0189 | 0.0922 | 0.9866 | 0.9698 | ||
| AlexNet | AUC | ACC | F1-score | Brier Score | ECE | SPE | NPV | ||
|---|---|---|---|---|---|---|---|---|---|
| Group | C | XGBoost | 0.9915 | 0.9584 | 0.9543 | 0.0310 | 0.0588 | 0.9673 | 0.9278 |
| GBM | 0.9900 | 0.9564 | 0.9486 | 0.0355 | 0.1185 | 0.9688 | 0.9301 | ||
| RF | 0.9859 | 0.9441 | 0.9232 | 0.0465 | 0.0965 | 0.9651 | 0.9199 | ||
| ME | 0.9919 | 0.9579 | 0.9512 | 0.0316 | 0.0562 | 0.9681 | 0.9290 | ||
| D | XGBoost | 0.9976 | 0.9769 | 0.9742 | 0.0172 | 0.0738 | 0.9829 | 0.9619 | |
| GBM | 0.9977 | 0.9774 | 0.9709 | 0.0179 | 0.1678 | 0.9852 | 0.9666 | ||
| RF | 0.9939 | 0.9620 | 0.9573 | 0.0336 | 0.1041 | 0.9703 | 0.9342 | ||
| ME | 0.9974 | 0.9779 | 0.9703 | 0.0178 | 0.0726 | 0.9829 | 0.9619 | ||
Disclaimer/Publisher’s Note: The statements, opinions and data contained in all publications are solely those of the individual author(s) and contributor(s) and not of MDPI and/or the editor(s). MDPI and/or the editor(s) disclaim responsibility for any injury to people or property resulting from any ideas, methods, instructions or products referred to in the content. |
© 2025 by the authors. Licensee MDPI, Basel, Switzerland. This article is an open access article distributed under the terms and conditions of the Creative Commons Attribution (CC BY) license (https://creativecommons.org/licenses/by/4.0/).
Share and Cite
Jia, J.; Jia, Q.; Zhang, J.; Zheng, M.; Fu, J.; Sun, J.; Lai, Z.; Gui, D. ReAcc_MF: Multimodal Fusion Model with Resource-Accuracy Co-Optimization for Screening Blasting-Induced Pulmonary Nodules in Occupational Health. Appl. Sci. 2025, 15, 6224. https://doi.org/10.3390/app15116224
Jia J, Jia Q, Zhang J, Zheng M, Fu J, Sun J, Lai Z, Gui D. ReAcc_MF: Multimodal Fusion Model with Resource-Accuracy Co-Optimization for Screening Blasting-Induced Pulmonary Nodules in Occupational Health. Applied Sciences. 2025; 15(11):6224. https://doi.org/10.3390/app15116224
Chicago/Turabian StyleJia, Junhao, Qian Jia, Jianmin Zhang, Meilin Zheng, Junze Fu, Jinshan Sun, Zhongyuan Lai, and Dan Gui. 2025. "ReAcc_MF: Multimodal Fusion Model with Resource-Accuracy Co-Optimization for Screening Blasting-Induced Pulmonary Nodules in Occupational Health" Applied Sciences 15, no. 11: 6224. https://doi.org/10.3390/app15116224
APA StyleJia, J., Jia, Q., Zhang, J., Zheng, M., Fu, J., Sun, J., Lai, Z., & Gui, D. (2025). ReAcc_MF: Multimodal Fusion Model with Resource-Accuracy Co-Optimization for Screening Blasting-Induced Pulmonary Nodules in Occupational Health. Applied Sciences, 15(11), 6224. https://doi.org/10.3390/app15116224


