Article

Bibliometric Insights into Time Series Forecasting and AI Research: Growth, Impact, and Future Directions

1
Department of Economic Informatics and Cybernetics, Bucharest University of Economic Studies, 010552 Bucharest, Romania
2
Department of Accounting and Audit, Bucharest University of Economic Studies, 010552 Bucharest, Romania
*
Author to whom correspondence should be addressed.
Appl. Sci. 2025, 15(11), 6221; https://doi.org/10.3390/app15116221
Submission received: 8 April 2025 / Revised: 26 May 2025 / Accepted: 29 May 2025 / Published: 31 May 2025
(This article belongs to the Special Issue Advanced Methods for Time Series Forecasting)

Abstract

Considering that nowadays the economy plays a crucial role, time series forecasting has become an essential tool across various economic areas and industries. The process of predicting future trends based on historical values in a reliable and accurate manner has generated numerous benefits, such as simplified decision-making processes or strategic planning and reduced risk management. Furthermore, with the advancement made through the use of Artificial Intelligence (AI) methods, time series forecasting has quickly become more precise, adaptive, and scalable, being able to better overcome real-world challenges. In this context, the present paper analyzes the implications of artificial intelligence in time series forecasting by evaluating the scientific articles from the field indexed in Clarivate Analytics’ Web of Science Core Collection database. Through a bibliometric approach, the research identifies key journals, affiliations, authors, and countries, as well as the collaboration networks among authors and countries. It also analyzes the most frequently used keywords and authors’ keywords. The annual growth rate of 23.11% indicates sustained interest among researchers. Prominent journals such as IEEE Access, Energies, Mathematics, Applied Sciences—Basel, and Applied Energy have been the home for the most published papers in this field. Further, thanks to the Biblioshiny library in R, a variety of visualizations have been created, including thematic maps, three-field plots, and word clouds. A comprehensive review of the most cited papers has been performed to highlight the role of AI in time series forecasting. Research results and methods confirmed the versatility of the topics, which have been applied in various fields, such as, but not limited to, finance, energy, climate, and healthcare, and are further discussed. Cutting-edge methodologies and approaches that lead to the transformation of the field of time series analysis in the context of AI are uncovered and discussed through the use of thematic maps.

1. Introduction

Historically, Artificial Intelligence (AI) has been defined in multiple ways, but due to the diverse topics of interest to researchers, it was difficult to formulate a definition accepted by everyone. Recently, AI has been described as a hot topic that offers the possibility of integrating social aspects into a machine that is able to solve tasks and communicate with society [1]. At the same time, AI provides autonomy and the possibility for users to automate activities and tasks.
The time series stands as one of the key topics of the academic community, representing a simple applicable method in domains such as medicine, decision-making, finance, climate modeling, and the biological sciences [2]. Initially, the domain focused on traditional models such as autoregressive models (AR), moving average (MA), seasonal autoregressive integrated moving average (SARIMA), exponential smoothing, and many other algorithms, while the current focus is to merge it with AI or deep learning methods.
Due to global environmental changes, it has become crucial to monitor and predict future trends in order to protect existing resources and minimize the negative impact on key sectors such as agriculture and hydrology [3]. Thanks to the development of remote sensing, the analysis of past and actual environmental characteristics has become much faster, facilitating easier monitoring of vegetation health and water quality and the identification of land cover changes [4].
Also, in the context of technological development, multiple time series models have evolved; the best examples include the self-exciting threshold autoregressive (SETAR) model, generalized autoregressive conditional heteroscedasticity (GARCH), random forest algorithm (RF), artificial neural networks (ANN), and multivariate adaptive regression splines (MARS) [5]. The application of time series models combined with AI opens new possibilities for implementation, the best example being in the hydrological field, where the algorithms have successfully predicted monthly river flows.
Furthermore, several metrics have been implemented, such as root mean square error (RMSE), coefficient of determination (R2), Willmott Index (WI), and normalized root mean square error (NRMSE), which are also used to calculate the accuracy of the methods [6].
The scope of interest among researchers in recent decades has ranged from developing and improving algorithms that predict water resources to developing new models such as MARS or gene expression programming (GEP), which has shown strong results in real case scenarios. Some of the algorithms included time series models such as AR, MA, autoregressive conditional heteroscedasticity (ARCH), and non-linear time series methods [7]. According to the existing literature, AI methods have been more frequently implemented than time series models for streamflow estimation, thanks to the development of hybrid models that combine AI and time series [7]. The domain has recently been expanded to include algorithms such as support vector machine (SVM), feed-forward neural network, multilayer perception (MLP), and multiple linear regression (MLR).
Time series prediction has a significant impact on daily activities, thanks to the evolution of deep learning and AI. The development of convolutional neural networks and recurrent neural networks has led to an increased rate of implementation for deep learning and AI [8].
Rough sets represent an alternative for forecasting methods, with applications in decision-making, expert systems, and data mining, focusing on explaining the rule-based models and applying similar steps such as a time series analysis. The dataset is divided into multiple sections, with a lower approximation that contains the elements that correspond to a class, and an upper approximation where the elements could belong to the class [9].
In 2024, Bas et al. [10] published an analysis of the implementation of artificial neural networks in time series forecasting problems, evaluating the possibility of the dendritic neuron model to identify outliers and their impact. The model has been tested on closing prices from German, Spanish, and Italian stock exchanges for a specific timespan, resulting in an algorithm that is able to accurately predict the values even when outliers exist in the dataset.
Edalatpanah et al. [11] described the existing risks on the market, together with the economic pressures and how technological developments, time series forecasting, and artificial intelligence could improve scientific productivity and business environments. Multiple algorithms have been developed, such as particle swarm optimization, genetic algorithm, and quantum optimization, resulting in a hybrid model between neutrosophic time series and AI models as an optimal solution.
Furthermore, Dynamic Bayesian Networks (DBNs), included in the family of probabilistic graphical models (PGMs), have been used to model the evolution of parameters described as a time series, with a series of applications in the agricultural field, such as digital agriculture [12], and in transportation [13,14,15].
The purpose of the present bibliometric analysis was to evaluate the academic development of time series forecasting and AI domains and to understand the evolution of the algorithms and the level of inclusivity of the models. Thus, a bibliometric analysis has been conducted for a comprehensive overview of the main authors, affiliations, journals, international collaboration, thematic evolution, main contributors, and most used keywords, also taking into account the existing bibliometric analyses by the academic community [16,17,18,19]. According to Block and Fisch [17], a bibliometric analysis is different from a review analysis that focuses on the main findings in the investigated field; the bibliometric overview explores the structural elements of the topic, extracting the main factors of time series forecasting and AI. In order to extract representative information from the research, this paper will focus on answering the following scientific questions:
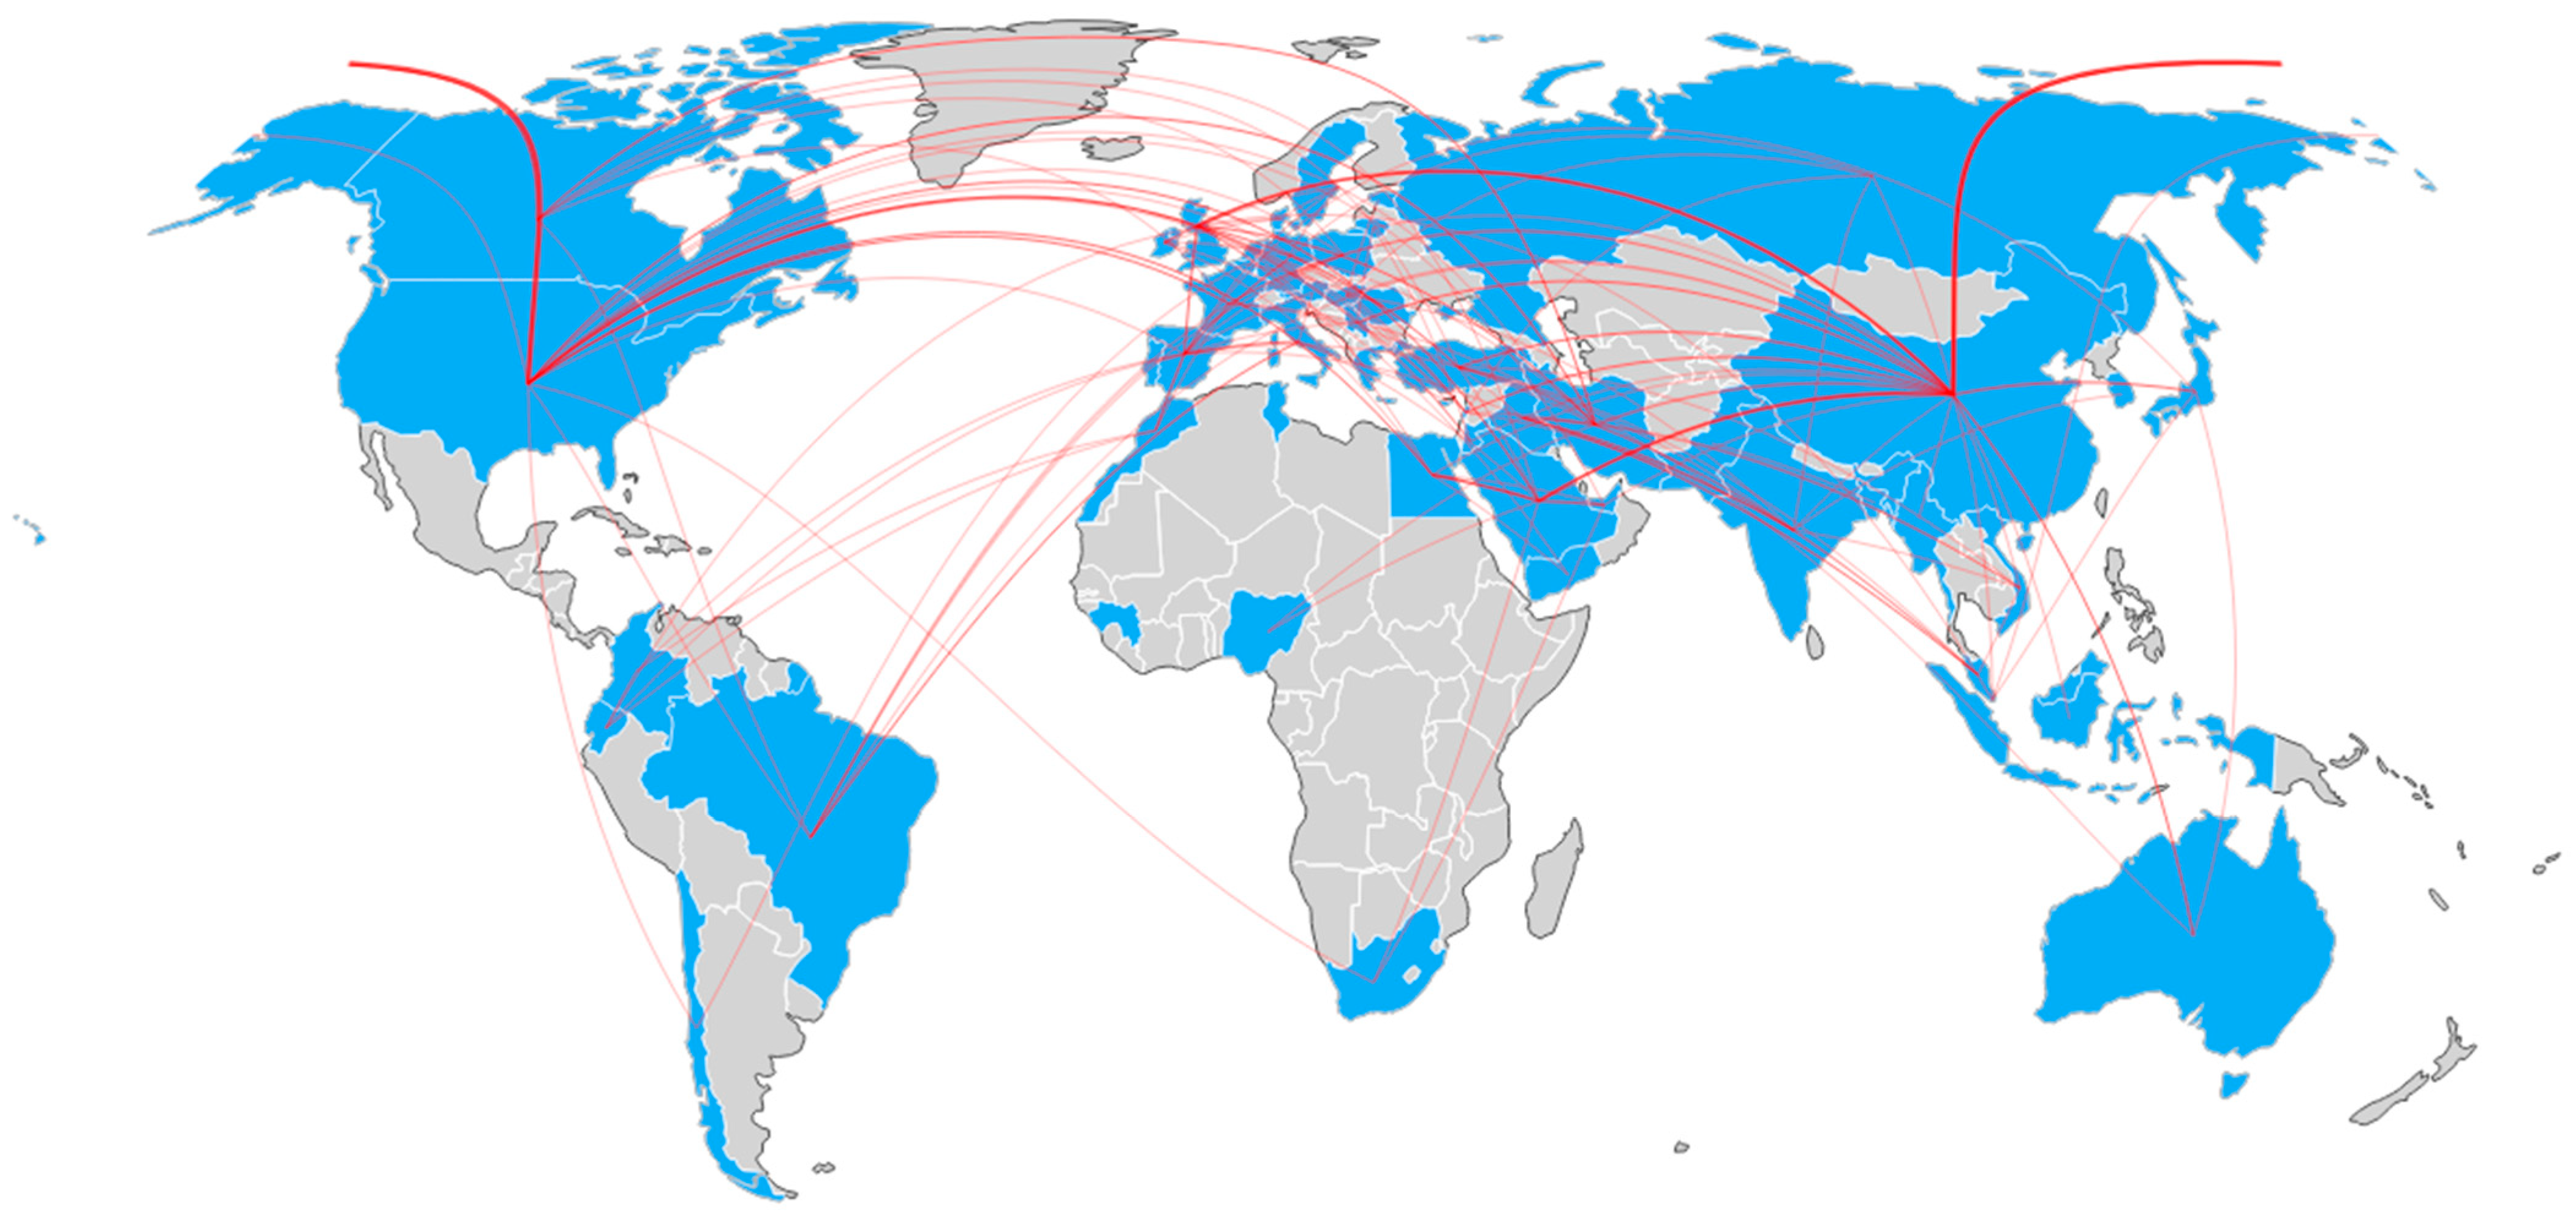
  • SQ1: Are the authors contributing to this field likely to collaborate? If yes, what does the collaboration map look like?
  • SQ2: What are the most relevant themes discussed in the time series and artificial intelligence topics?
  • SQ3: Which countries are the most representative, taking into account the number of publications and citations?
  • SQ4: What are the outcomes of the 10 most cited articles?
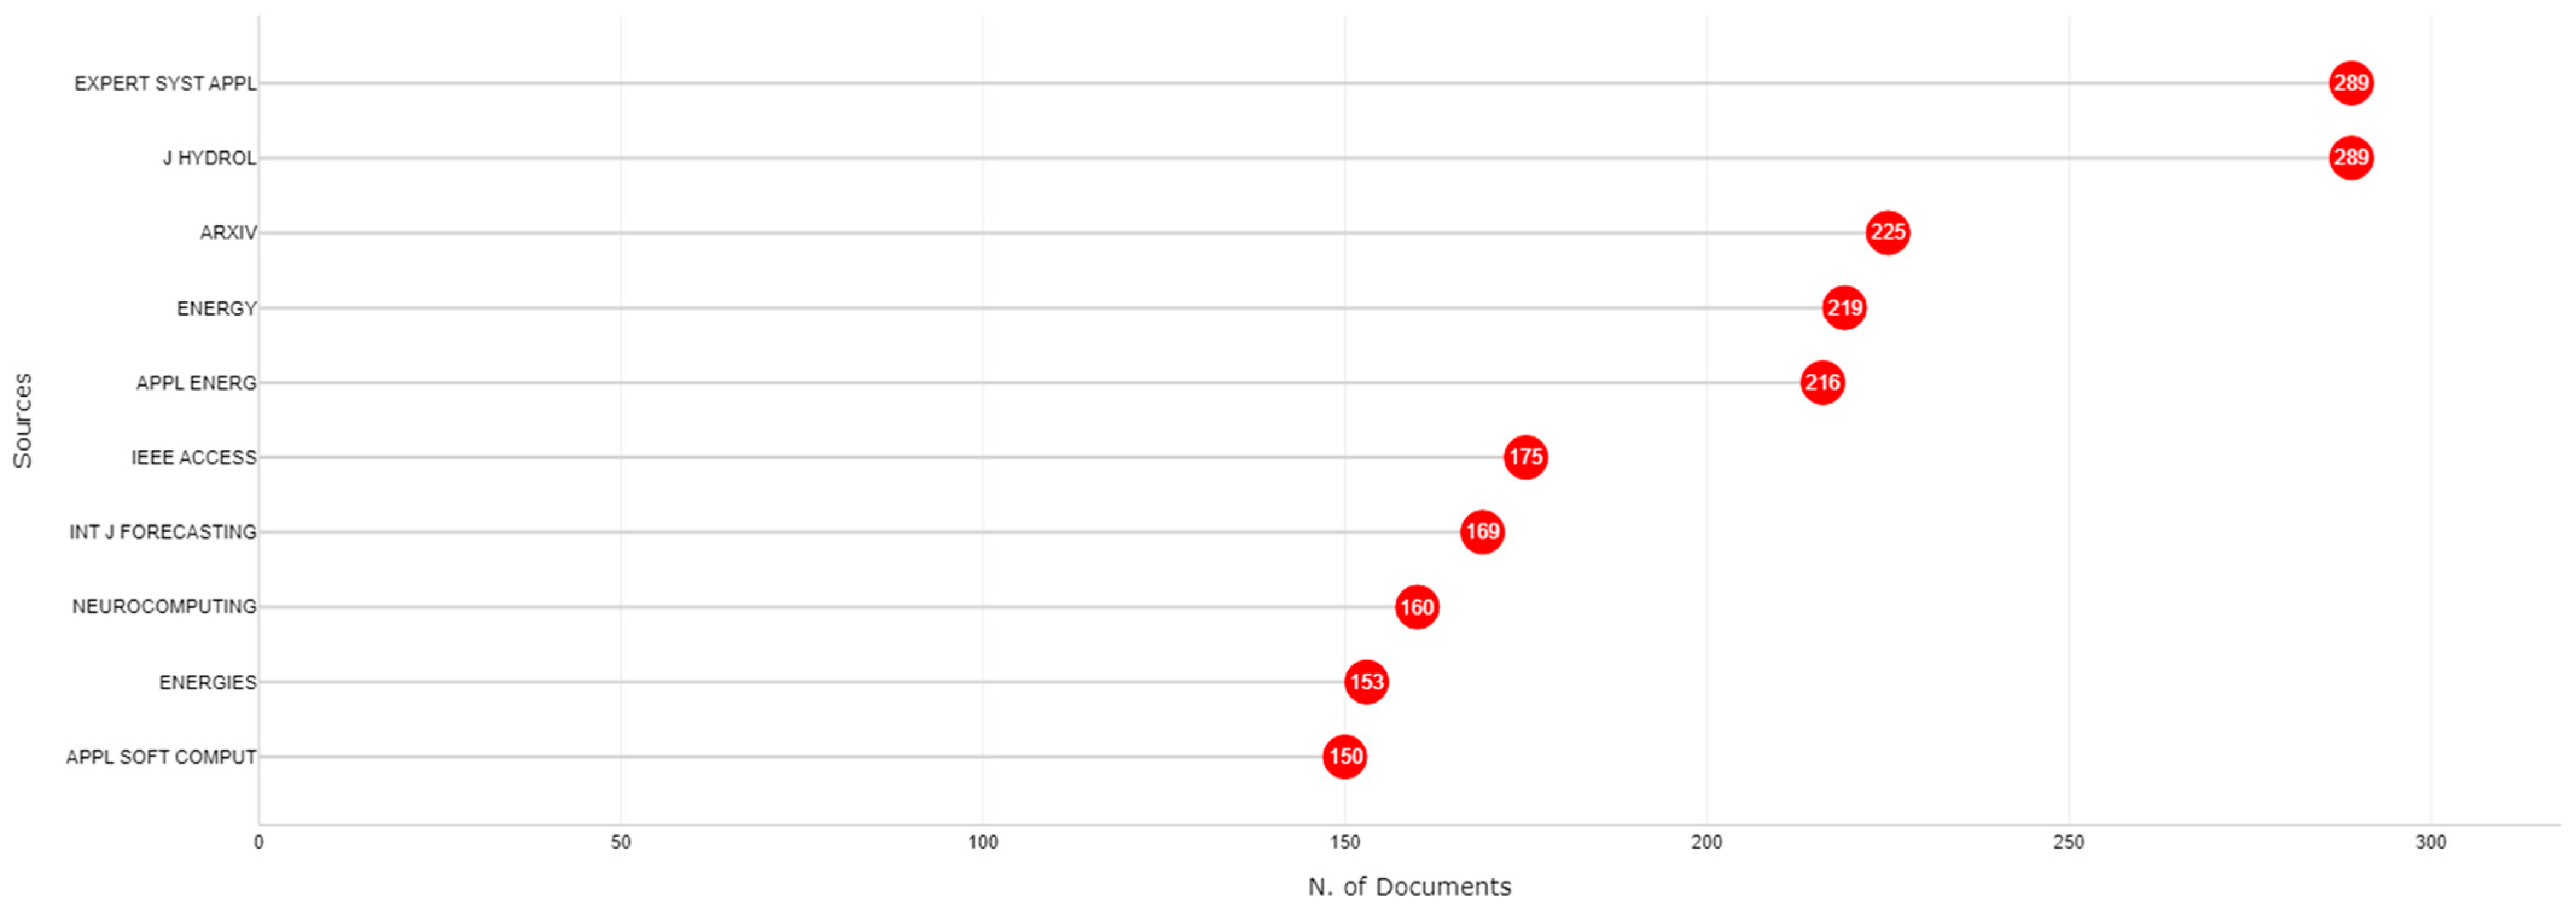
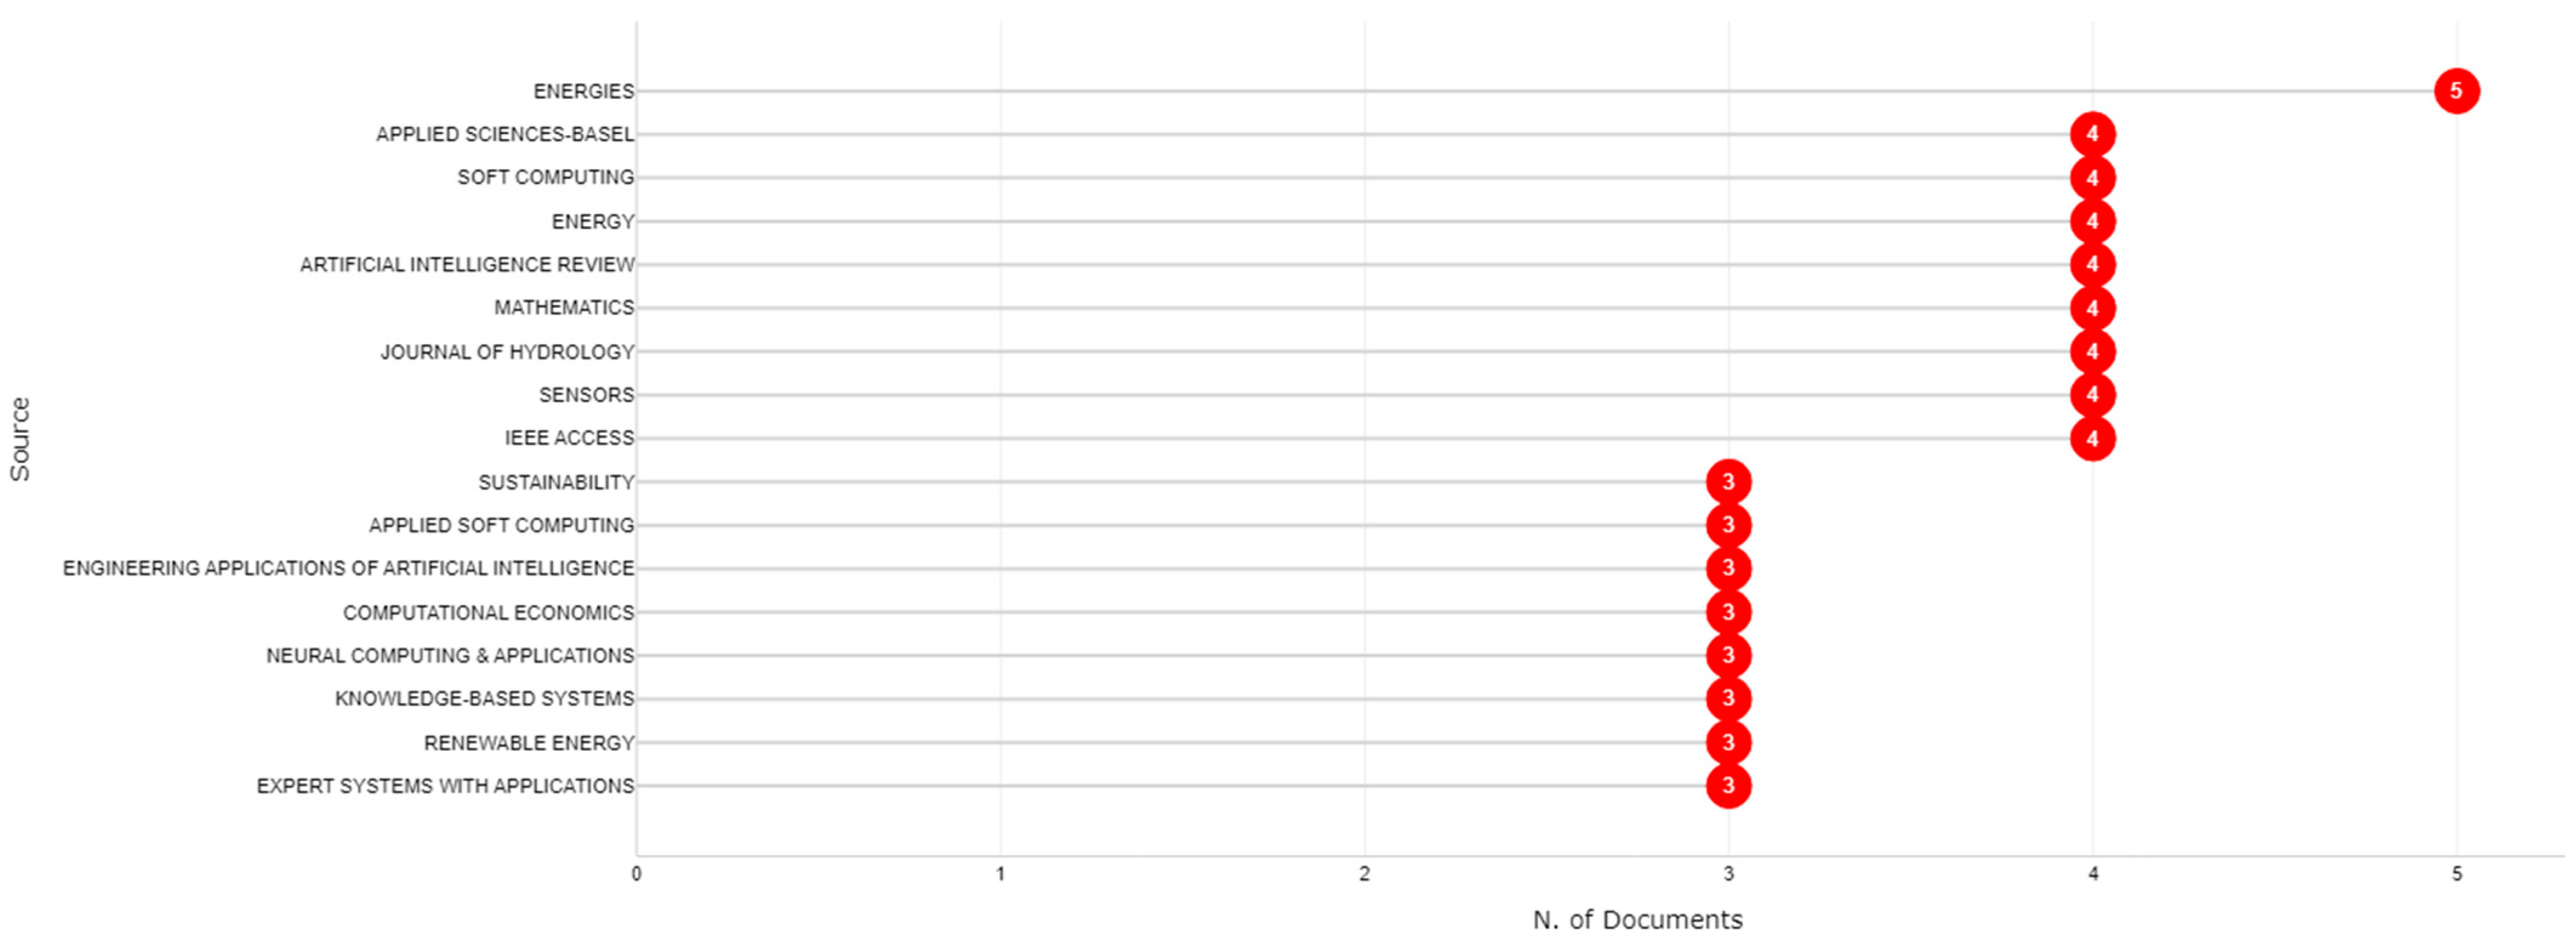
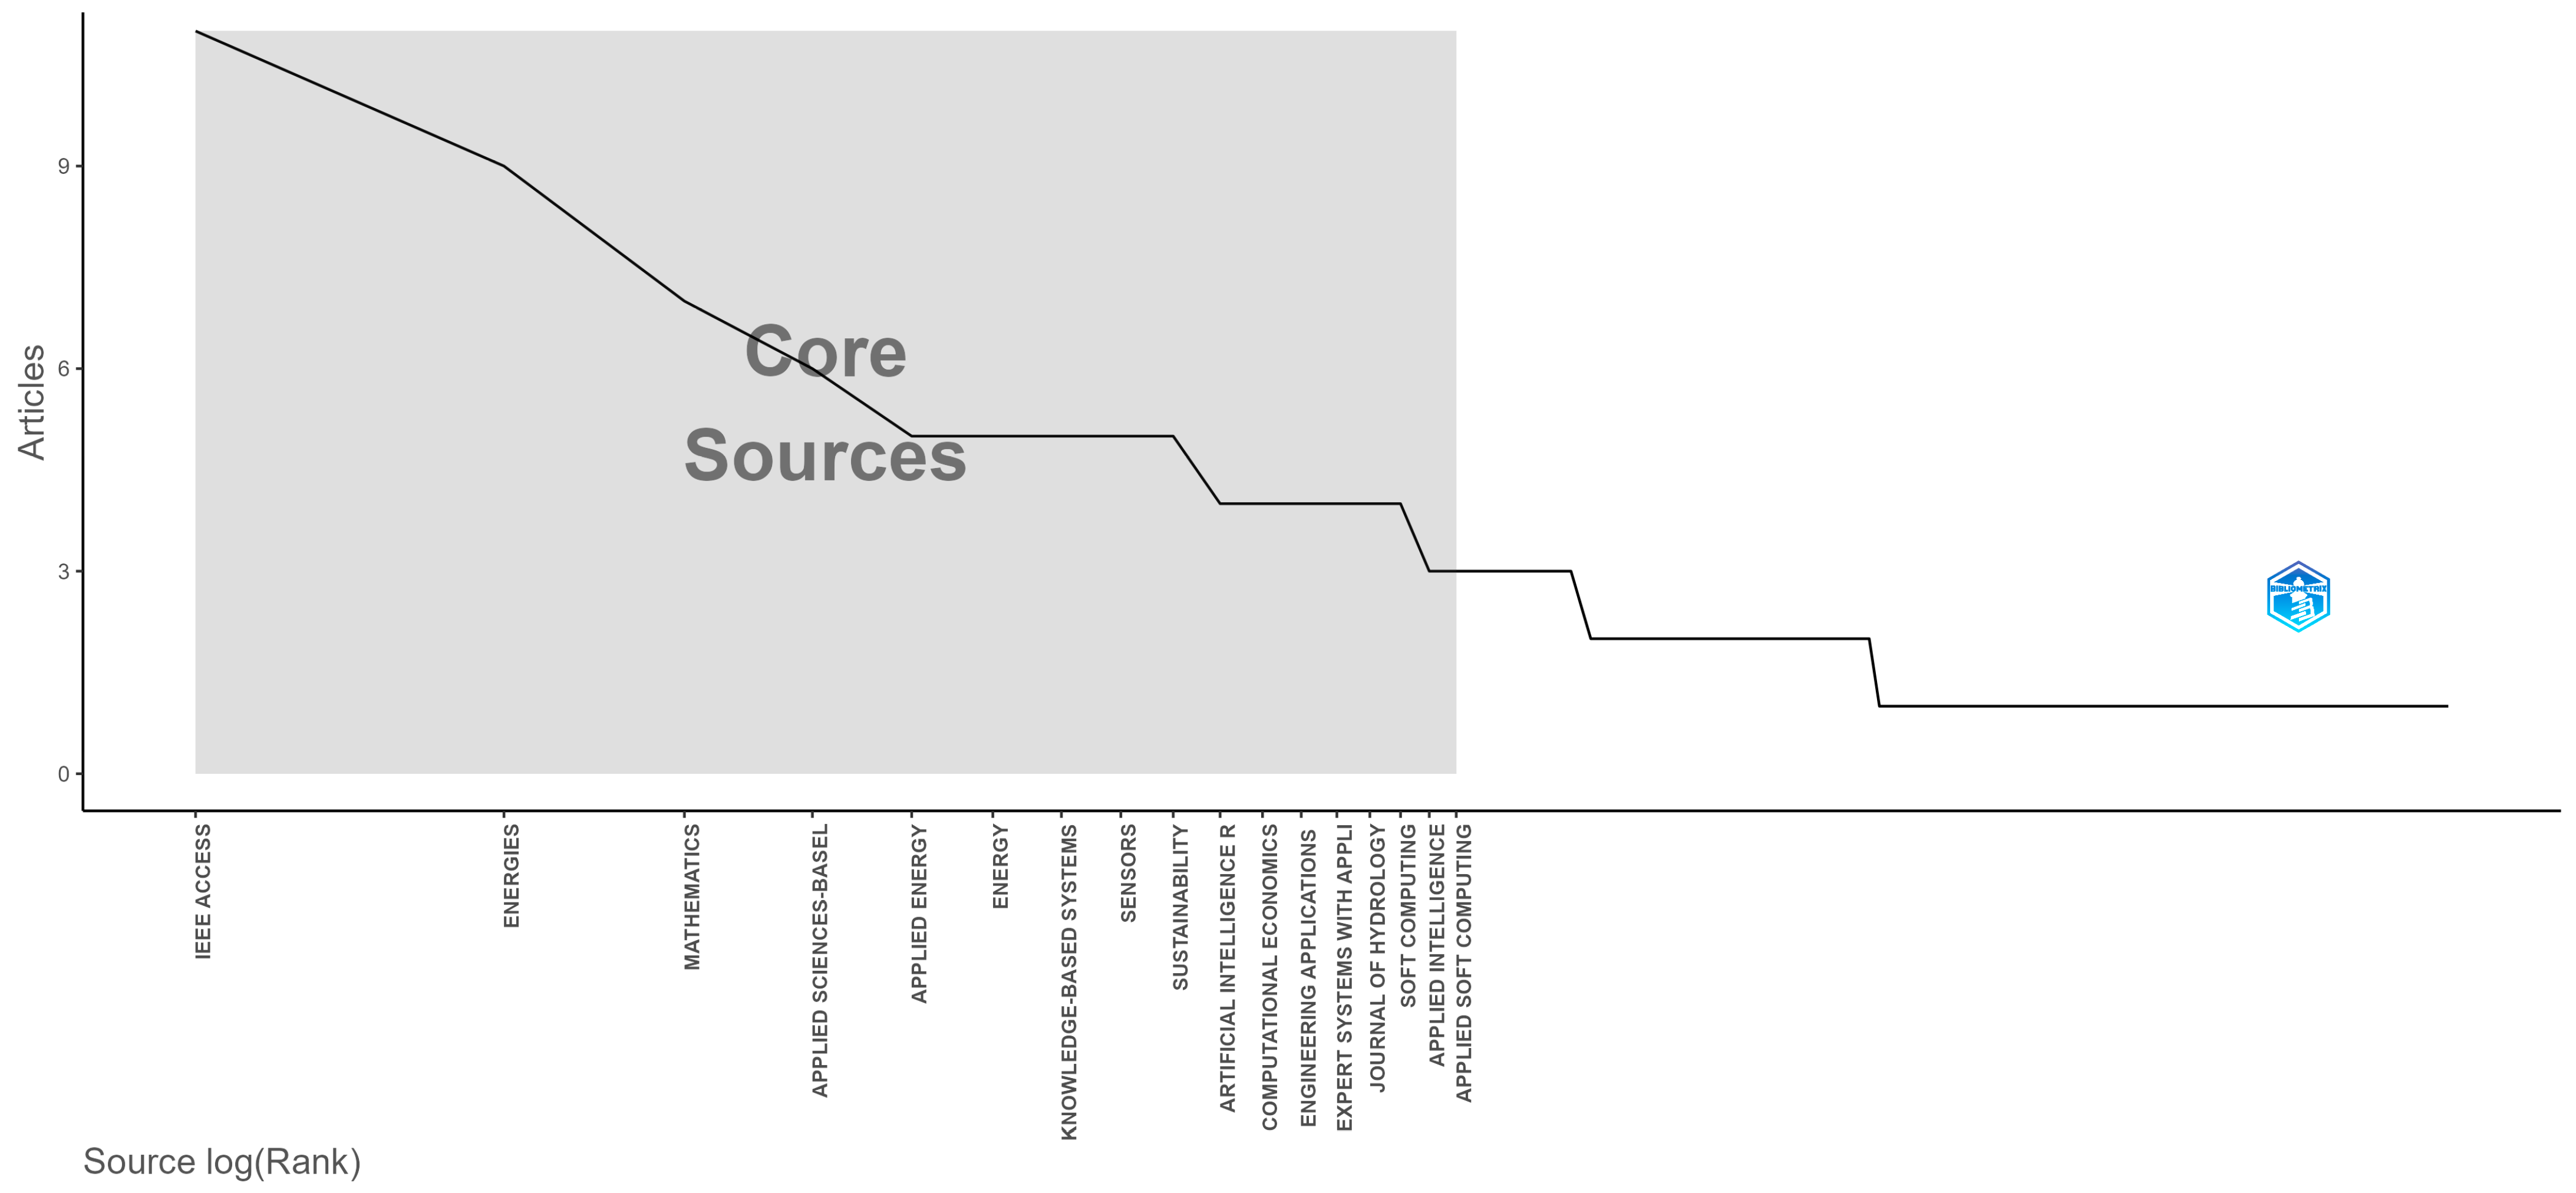
  • SQ5: What are the sources with the highest impact based on the number of articles published?
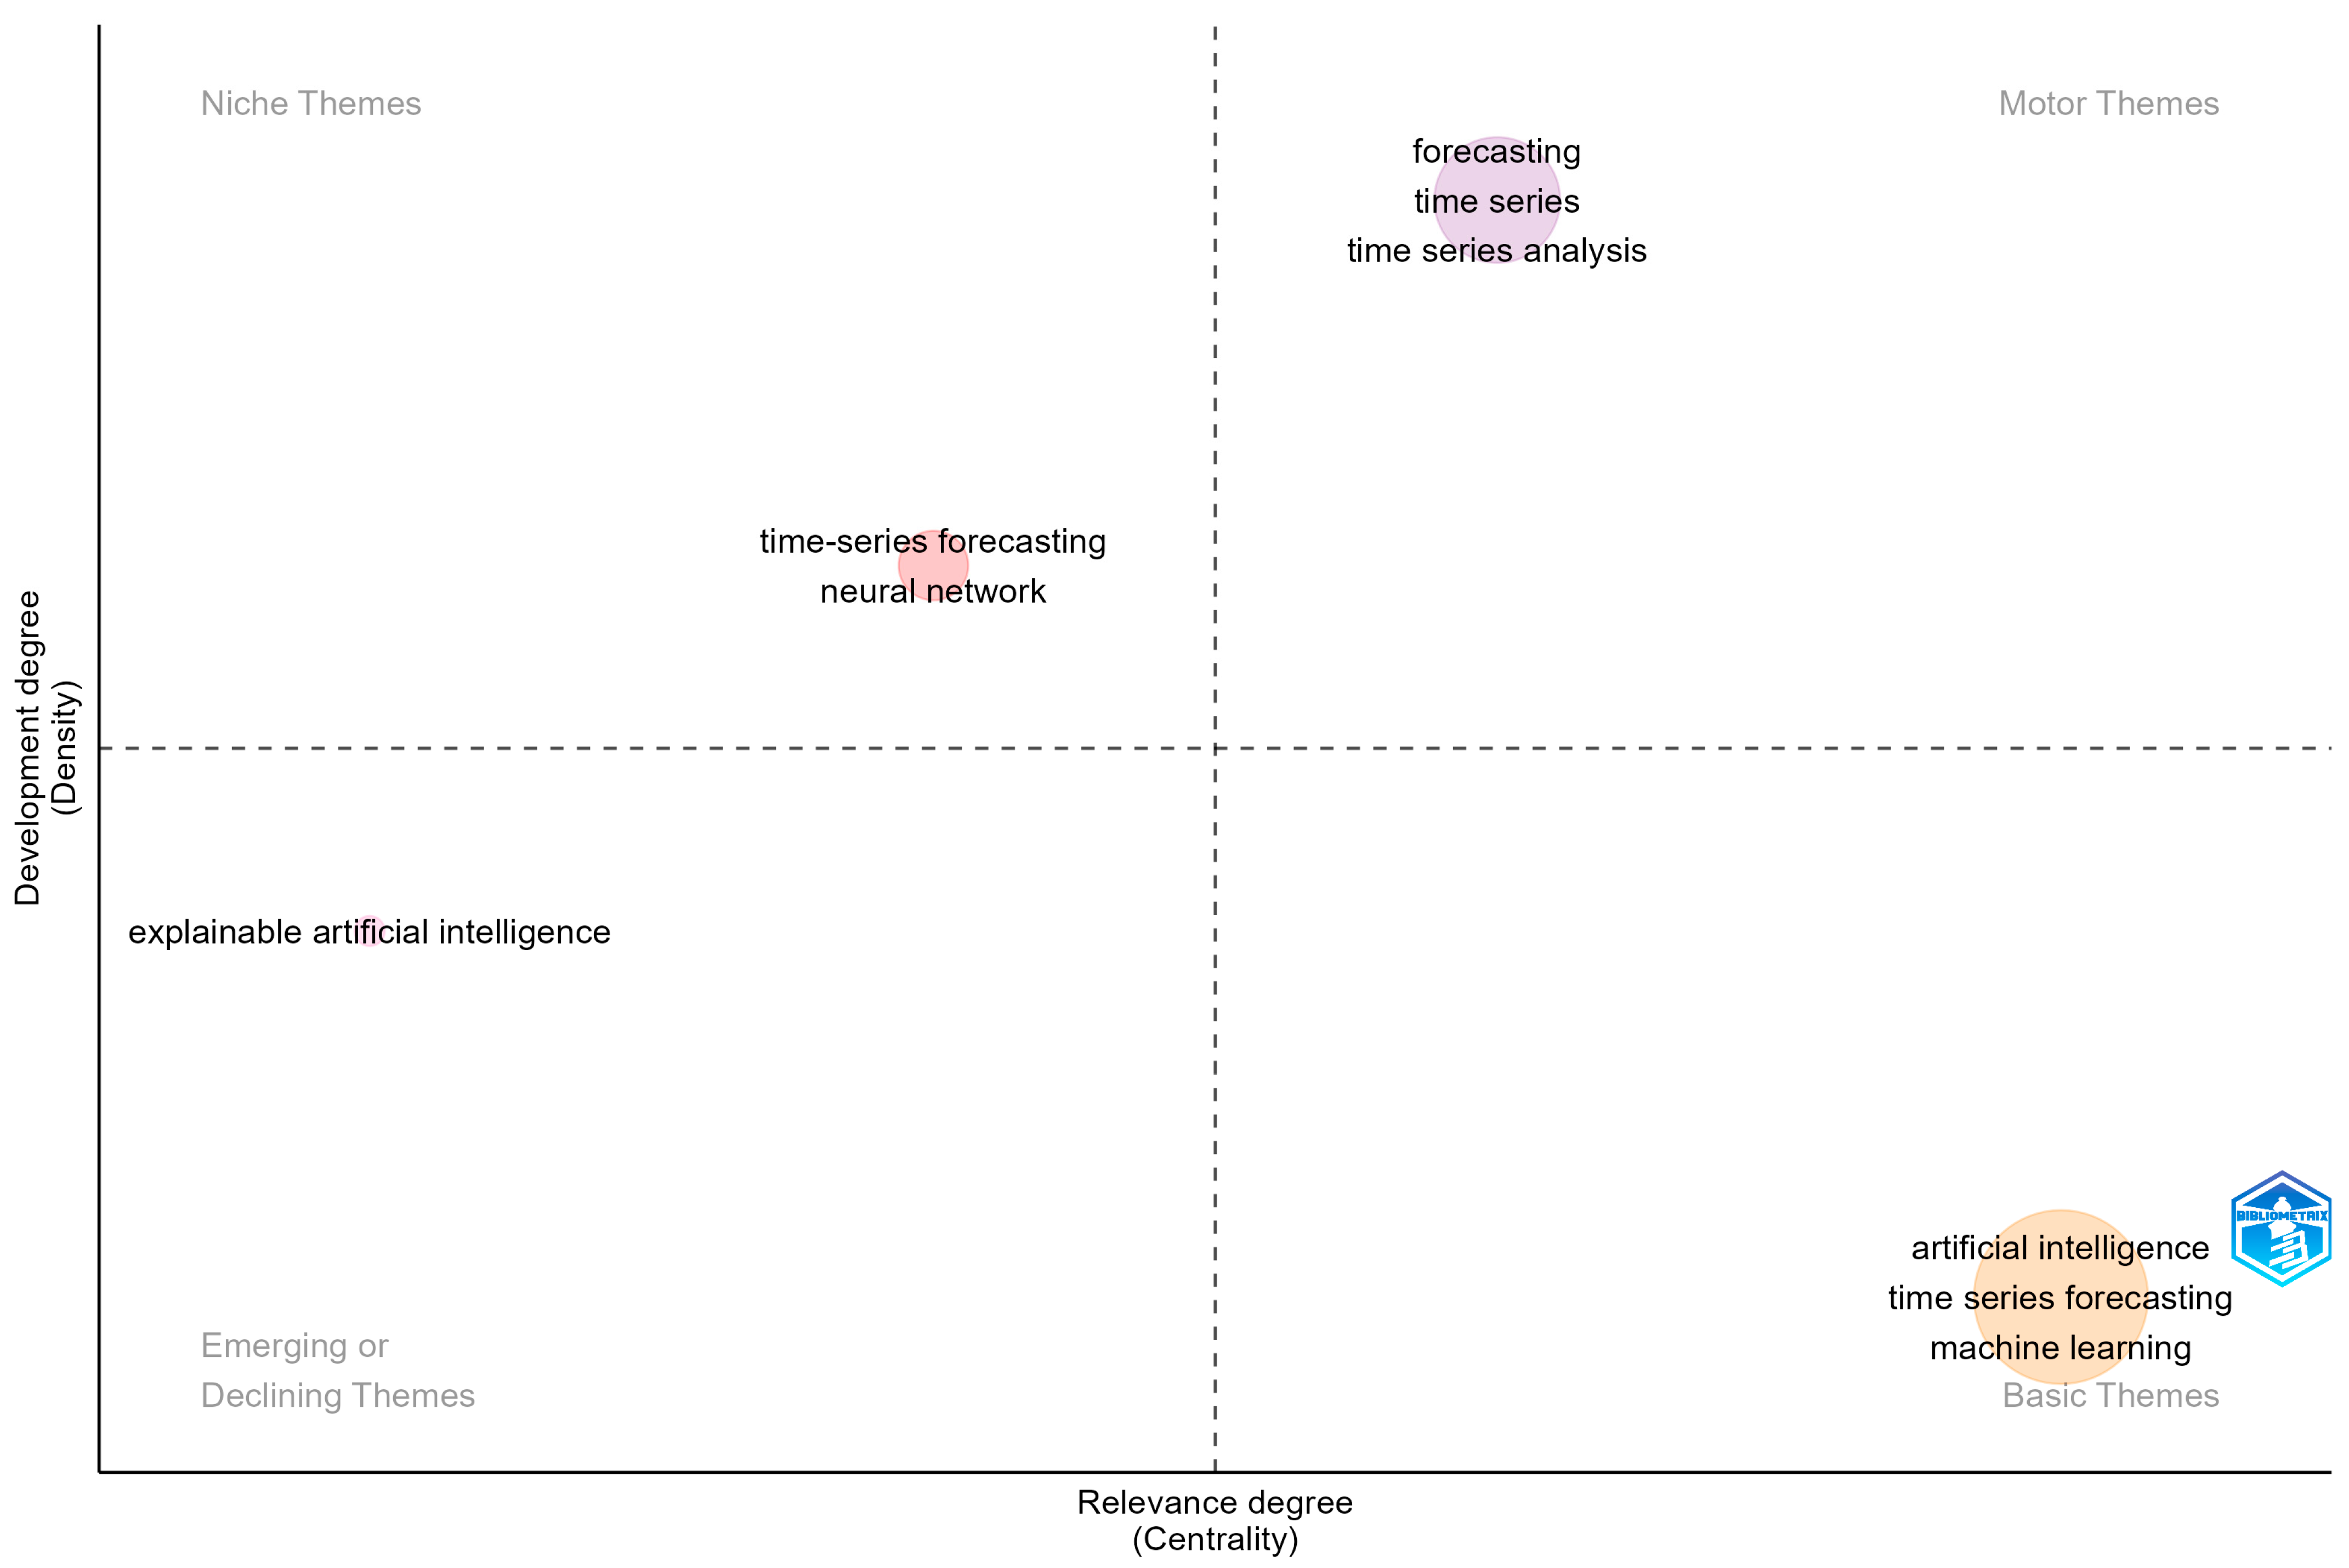
  • SQ6: What are the main keywords included in the thematic graphical representation?
As was already mentioned above, a detailed investigation of the 10 most cited papers will be carried out for a better understanding of the time series and AI domains. Furthermore, the time distribution of the publications included in the dataset is crucial in topic analysis evolution.
The decision to conduct a bibliometric analysis for evaluating the time series and AI domains is in accordance with the existing literature, focusing on extracting, in a proper manner, the main topics, key contributors, collaboration map, main research institutions, and the evolution of the research themes [16,20]. The bibliometric approach delves deeply into the analysis of the dataset using indicators such as the H-index or G-index, which will be further explained, together with graphical representations of Bradford’s Law or Lotka’s Law. Due to the nature of the scientific question, quantitative analysis is mandatory, evaluating the 10 most representative papers from the time series forecasting and AI fields.
The paper is divided into multiple sections as follows: the Section 1 explores the introductory information of the research, defining the scope of the article, while the Section 2 focuses on the main methods and techniques implemented in the bibliometric analysis, explaining also the dataset extraction process. The Section 3 describes the results of the analysis, highlighting the most representative countries, affiliations, authors, journals, keywords, and themes. The Section 4 presents the discussions and limitations of the analysis, while the Section 5 concludes the research.

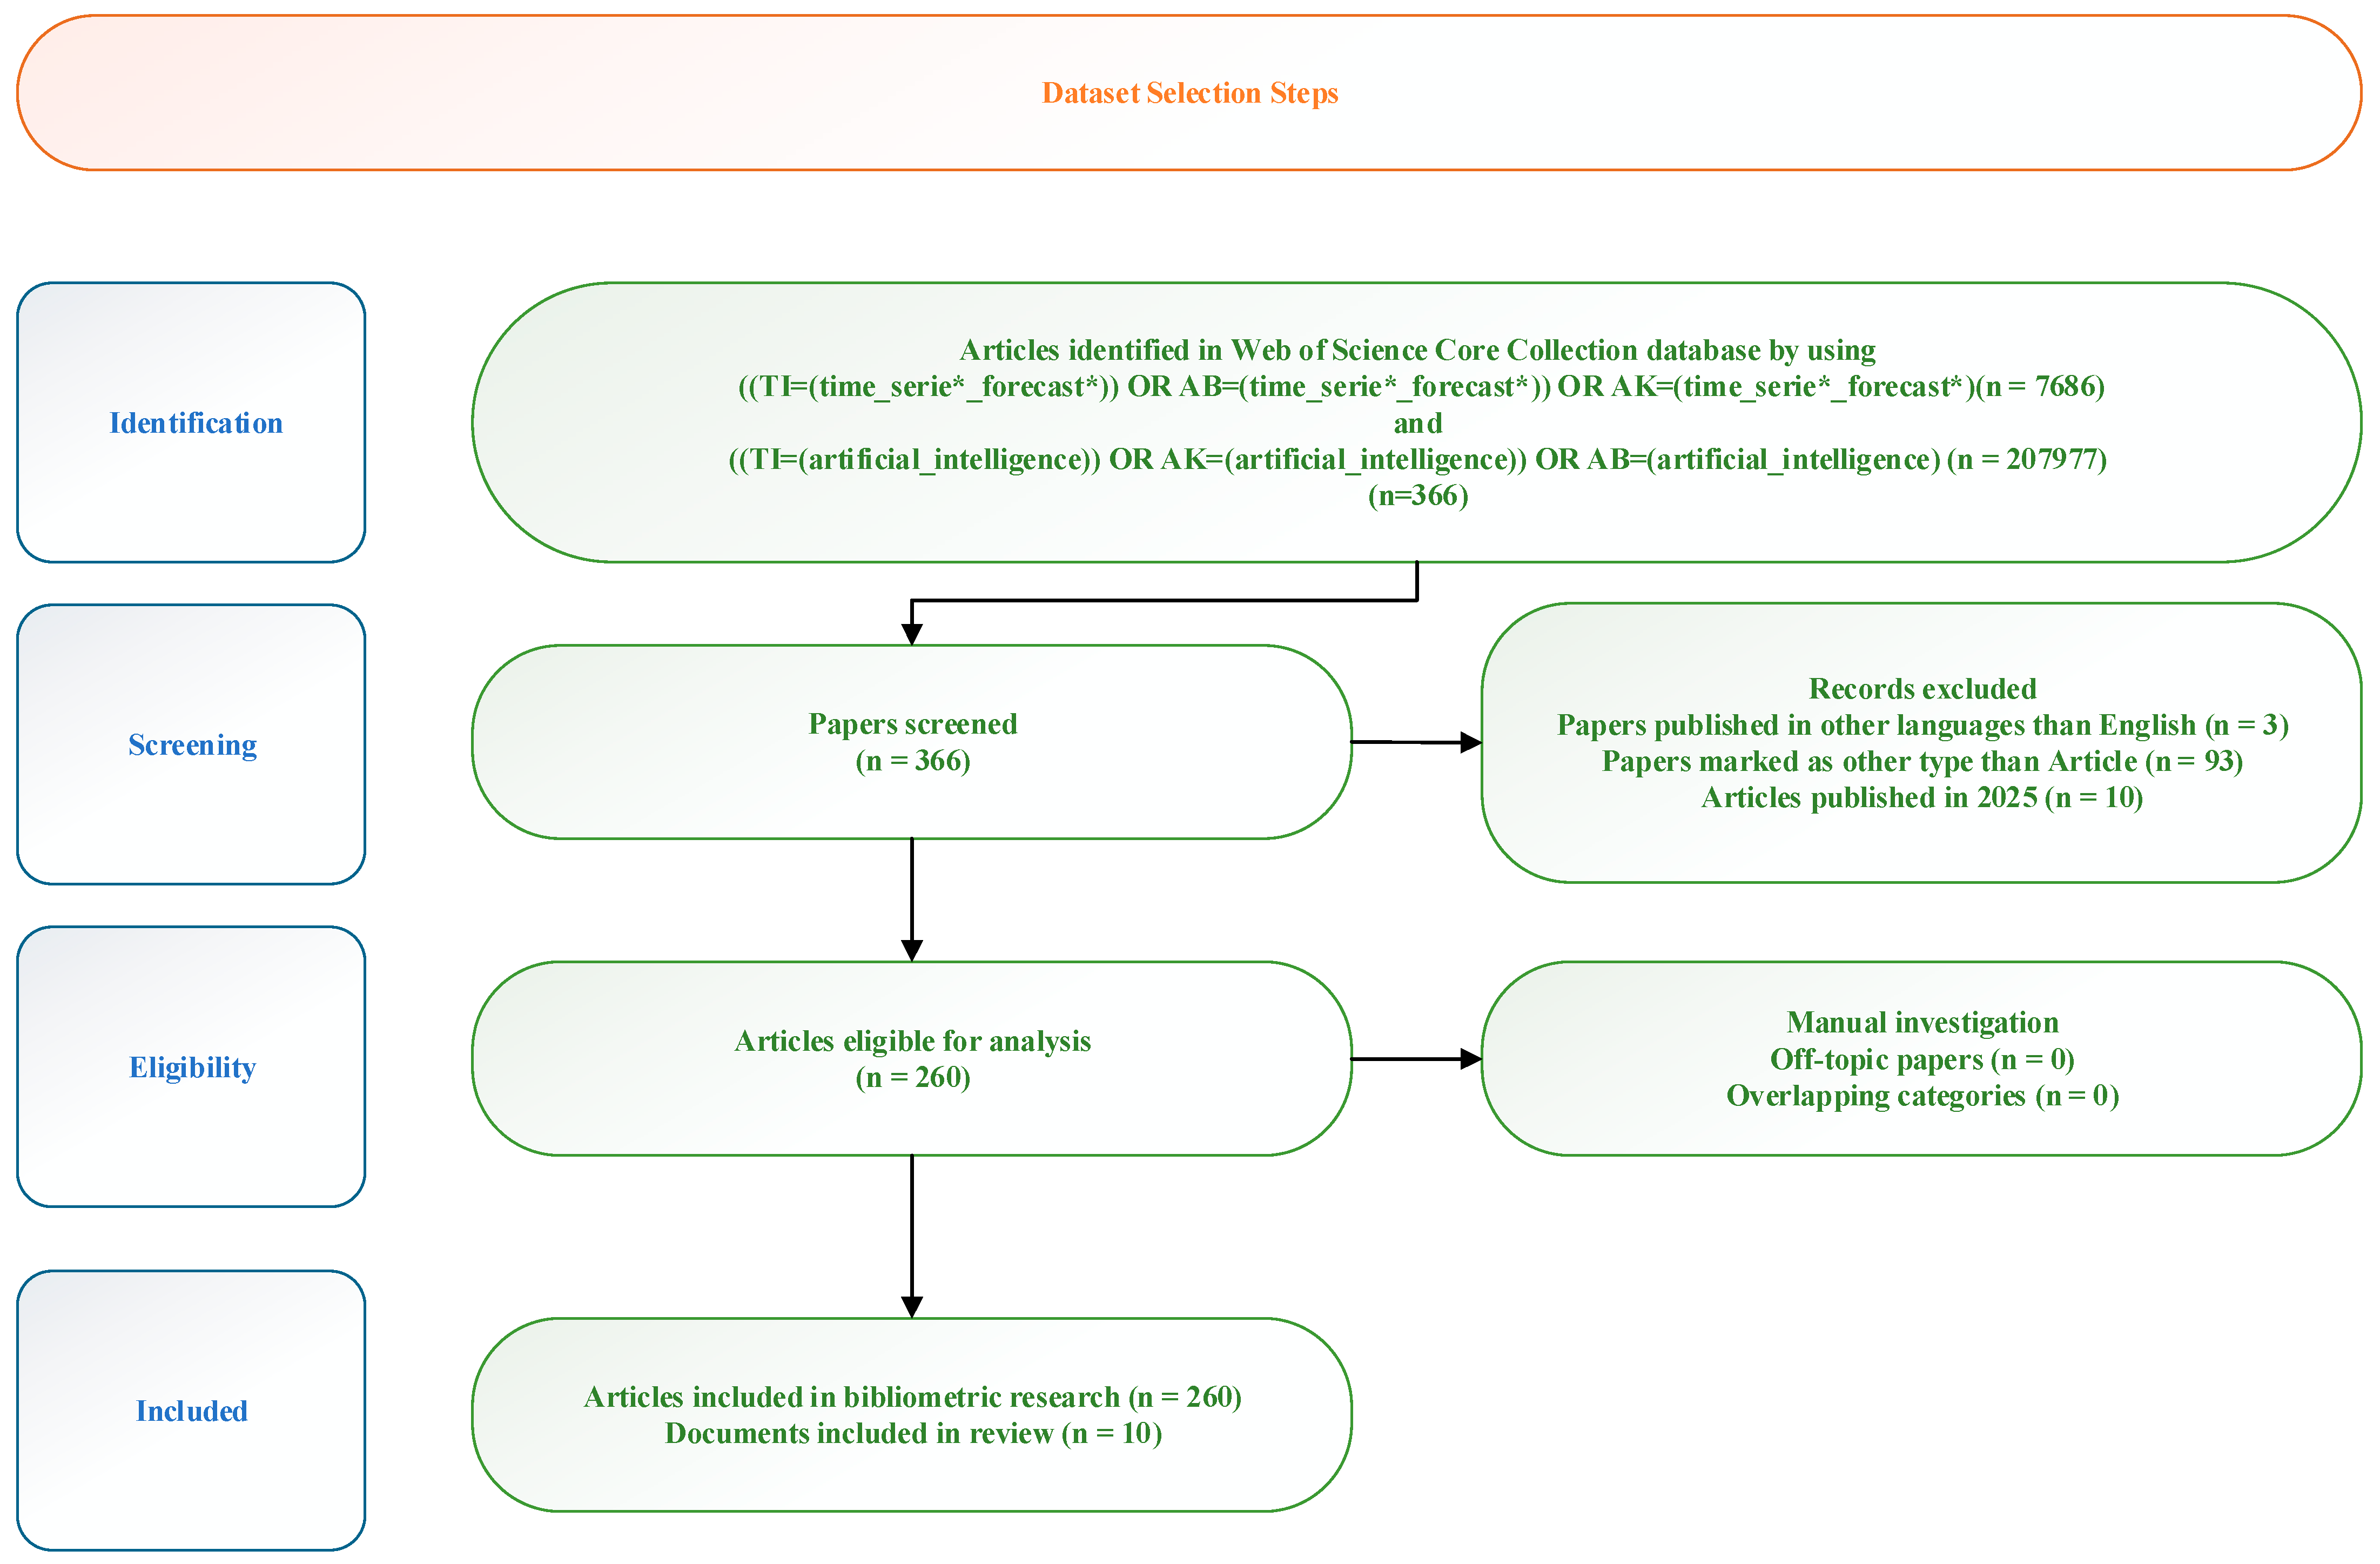
2. Materials and Methods

The initial step was to investigate the existing literature in order to identify the most suitable database for the bibliometric analysis. ISI Web of Science, known also as Clarivate Analytics’ Web of Science Core Collection or WoS [21], was chosen as the database used for the papers’ extraction [22,23,24,25,26]. Bakir et al. [27] explained why WoS is the best database to perform a bibliometric analysis, having a variety of journals and domains, most of them recognized and known in the academic community. Even if the level of inclusivity is smaller compared with other databases, the WoS database is still one of the best sources for researchers. Also, the choice of this database has been further highlighted by Koca [28]. The author mentions the number of publications included, their subject distribution, and their geographical distribution among the reasons for choosing this database. The majority of ISI Web of Science documents are published in English and have a wider journal coverage compared to Dimensions, IEEE, or Scopus databases, with a total of 74.8 million scholarly datasets and over 1.5 billion cited references, describing a diversity of academic topics [29]. Singh et al. [29] explained that WoS coverage improved significantly starting in 1990, indexing over 13,610 journals and 13 million publications as of June 2020. Even if the Scopus database has more papers (18 million as of June 2020), the impact of Scopus-indexed journals is smaller compared to those indexed by WoS. Furthermore, it should be stated that the WoS database offers, within the extracted dataset, a special feature related to the papers included in the dataset, called Keywords Plus [30]. This special class of keywords is extracted based on the references in the papers included in the dataset, helping in better shaping the information included in the studies.
A detailed analysis of the existing research has been carried out, in order to understand how to extract documents from Clarivate Analytics’ Web of Science Core Collection. Liu [31,32] explained the main steps that should be taken in the extraction process. A crucial point that should be mentioned is that the WoS database is subscription-based, meaning that the results can be differentiated based on the subscription type. At the same time, some of the subscriptions offer limited access to specific indexes, while other subscriptions provide access to a variety of indexes and papers, and, as Liu [32] highlighted, it is crucial for authors to investigate and explain the indexes that are available with their subscription. The subscription influences the total number of papers that are extracted from WoS, and in our case, the indexes that were available are detailed below:
  • Social Sciences Citation Index (SSCI)—1975–present;
  • Book Citation Index—Science (BKCI-S)—2010–present;
  • Emerging Sources Citations Index (ESCI)—2005–present;
  • Science Citation Index Expanded (SCIE)—1900–present;
  • Index Chemicus (IC)—2010–present;
  • Book Citation Index—Social Sciences and Humanities (BKCI-SSH)—2010–present;
  • Arts and Humanities Citation Index (A&HCI)—1975–present;
  • Conference Proceedings Citation Index—Science (CPCI-S)—1990–present;
  • Conference Proceedings Citation Index—Social Sciences and Humanities (CPCI-SSH)—1990–present;
  • Current Chemical Reactions (CCR-Expanded)—2010–present;
In Figure 1 are detailed the main steps that should be performed for a bibliometric analysis, according to Preferred Reporting Items for Systematic Reviews and Meta-Analyses, also known as the PRISMA flowchart.
Sarkis-Onofre et al. [33] explained that PRISMA comprises a set of rules and recommendations used mainly for transparent and complete reporting of systematic reviews, offering the possibility to develop appropriate analyses of papers and include all aspects accurately.
The first step consists of dataset Identification, where the documents are related to time series forecasting and artificial intelligence. The keywords such as “time_serie*_forecast” and “artificial_intelligence” were applied to the existing WoS, searching in abstracts (AB), titles (TI), and authors’ keywords (AK) in the most representative papers. In total, there were 207,977 papers related to artificial intelligence and 7686 papers related to time series forecasting. In order to investigate the common documents, a filter was applied, resulting in a total of 366 documents that contained artificial intelligence and time series forecasting. It should be mentioned that the query was performed using the singular forms of the filtering keywords, in order to be able to include also the plural forms of the terms by adding an asterisk (“*”) at the end of the singular form. At the same time, the focus was to include also the combination of terms, rather than including only the individual forms, grouping the words using the underline (“_”). Thanks to the underline, the results contained sequences of the search terms and not just the individual forms. For instance, the keywords “artificial_intelligence” written in this form extracted from the database the papers that had “artificial intelligence” as a sequence either in the abstract, authors’ keywords, or titles, and not only the individual term of “artificial” or “intelligence”.
The second step refers to the screening part, where the extracted papers were filtered in order to reduce the gap between documents and to define a relevant dataset. The documents published in languages other than English were excluded, reducing the size of the dataset by three articles. At the same time, the types of documents were restricted, including only papers marked as “Article”, resulting in a total of 260 articles. At the same time, a manual analysis of paper with overlapping topics was performed during the eligibility step, as suggested by Oo and Rakthin [34], resulting in a homogenous dataset. According to Pham and Le [35], who performed a bibliometric analysis and review of papers published in the Scopus database using the PRISMA approach, the main steps they applied were similar to ours, including only specific types of documents, restricting the articles published in other languages than English, and restricting the timespan of the publications. The authors began with a dataset that contained 502 articles, and after the filters, the final dataset contained only 51 papers. Peixoto et al. [36] defined a set of inclusion and exclusion criteria. The exclusion criteria specified non-English papers and papers that were theoretical. The inclusion criteria specified the types of documents that should be taken into account in the research. From 705 documents at the beginning, the final dataset contained only 30 articles after screening.
In the end, our final dataset contained a total of 260 articles that would be evaluated from a bibliometric point of view, while a selection of the top-10 most cited papers would be used for the papers’ review.

3. Overview of Results

The third chapter describes the main information about the dataset from different points of view, focusing initially on the timespan, number of documents, sources, and references; the chapter is divided into multiple sections, such as journals, authors, an evaluation of the literature, and mixed analysis. Using the R programming language and Biblioshiny library, a bibliometric analysis was performed. The current version of the R programming language is 4.4.1, while the Biblioshiny library version is 4.2.3.
Table 1 encompasses the most relevant information about the dataset that was extracted from WoS. The analyzed period was between 1997 and 2024, with a total of 158 sources and 260 documents with a mean of 3.91 years from publication and a mean of 20.51 citations per paper. In total, there were 4.08 co-authors per article and 11,079 references. Friou and Graa [37] explored the AI impact on e-commerce using a bibliometric approach, evaluating a total of 669 papers and 329 sources that had been published between 2014 and 2023, with an average of 3.24 co-authors per document and an average document age of 2.76 years. Bawack et al. [38] extracted from WoS papers published between 1991 and 2020, obtaining 4335 documents and 2599 sources in total with a mean of 8.645 citations per paper, 3.03 co-authors per article, and a total of 84,474 references. The description of the datasets differs from one paper to another due to the focus of the analysis, which was reflected in the filters that were applied to the databases.

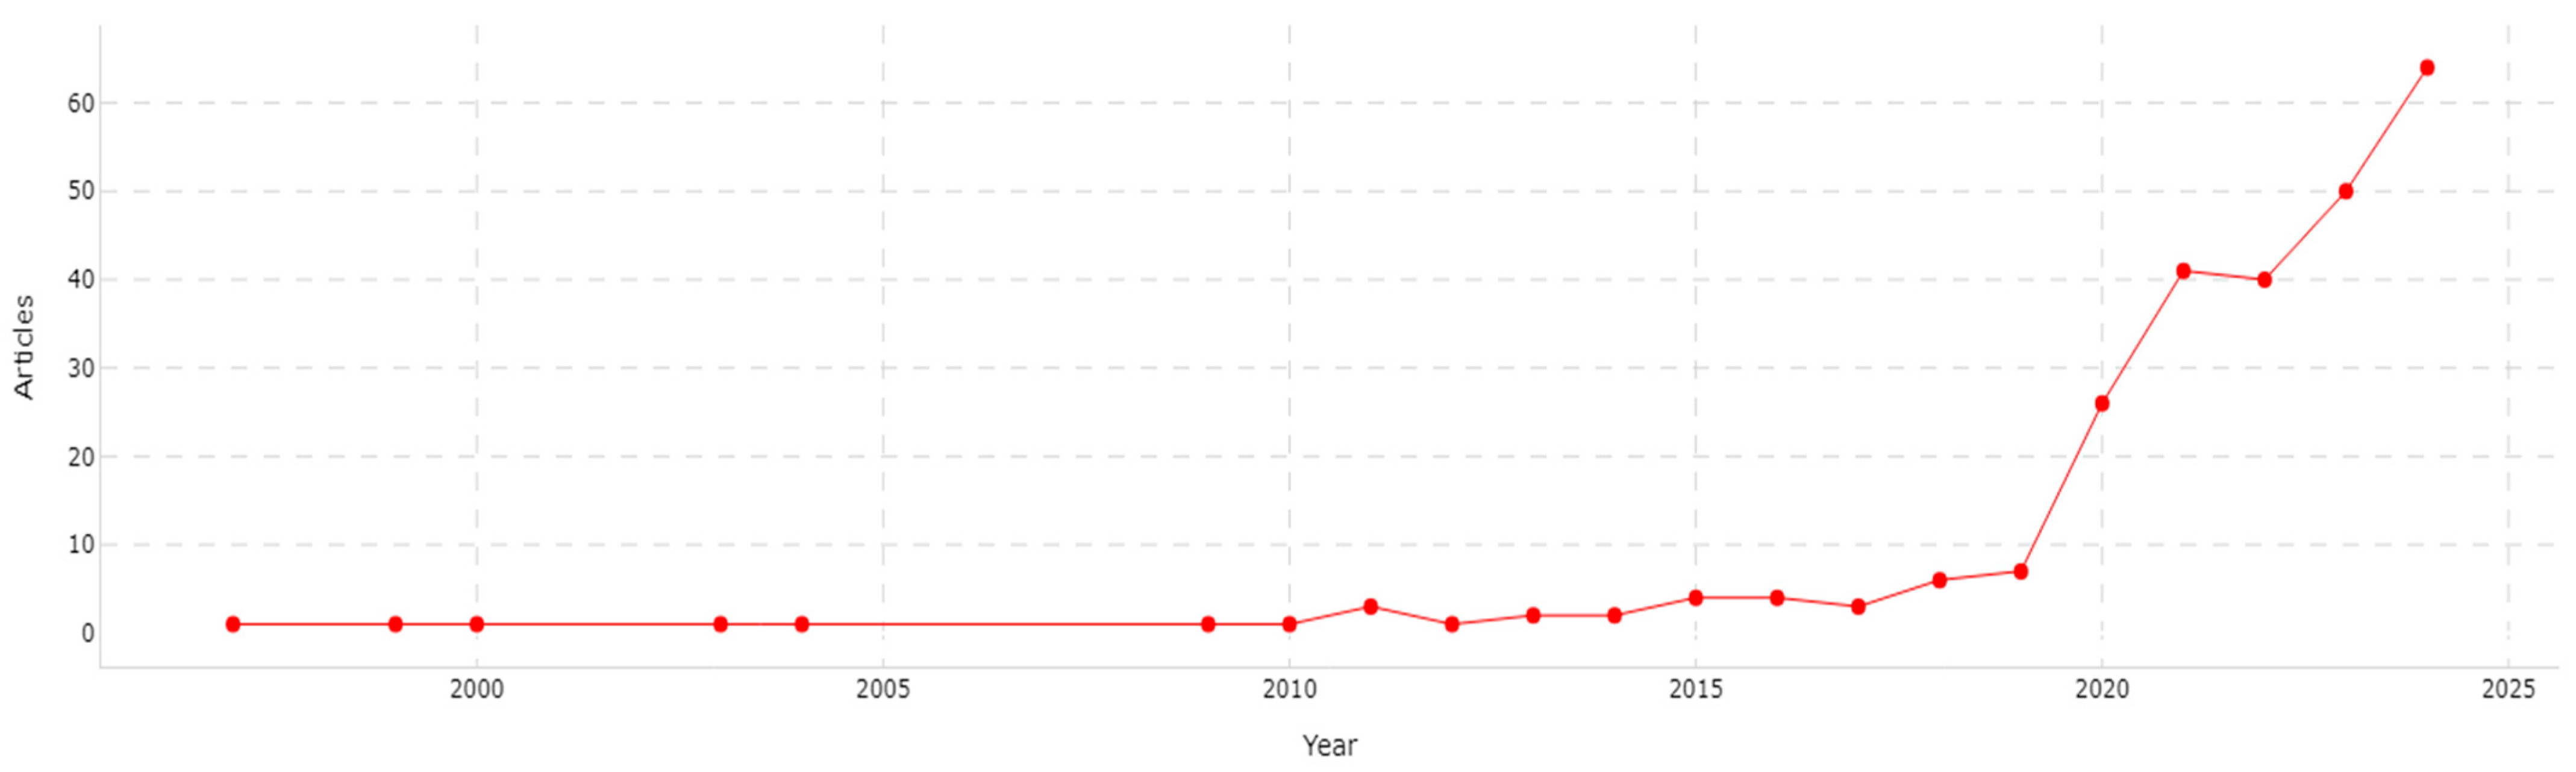
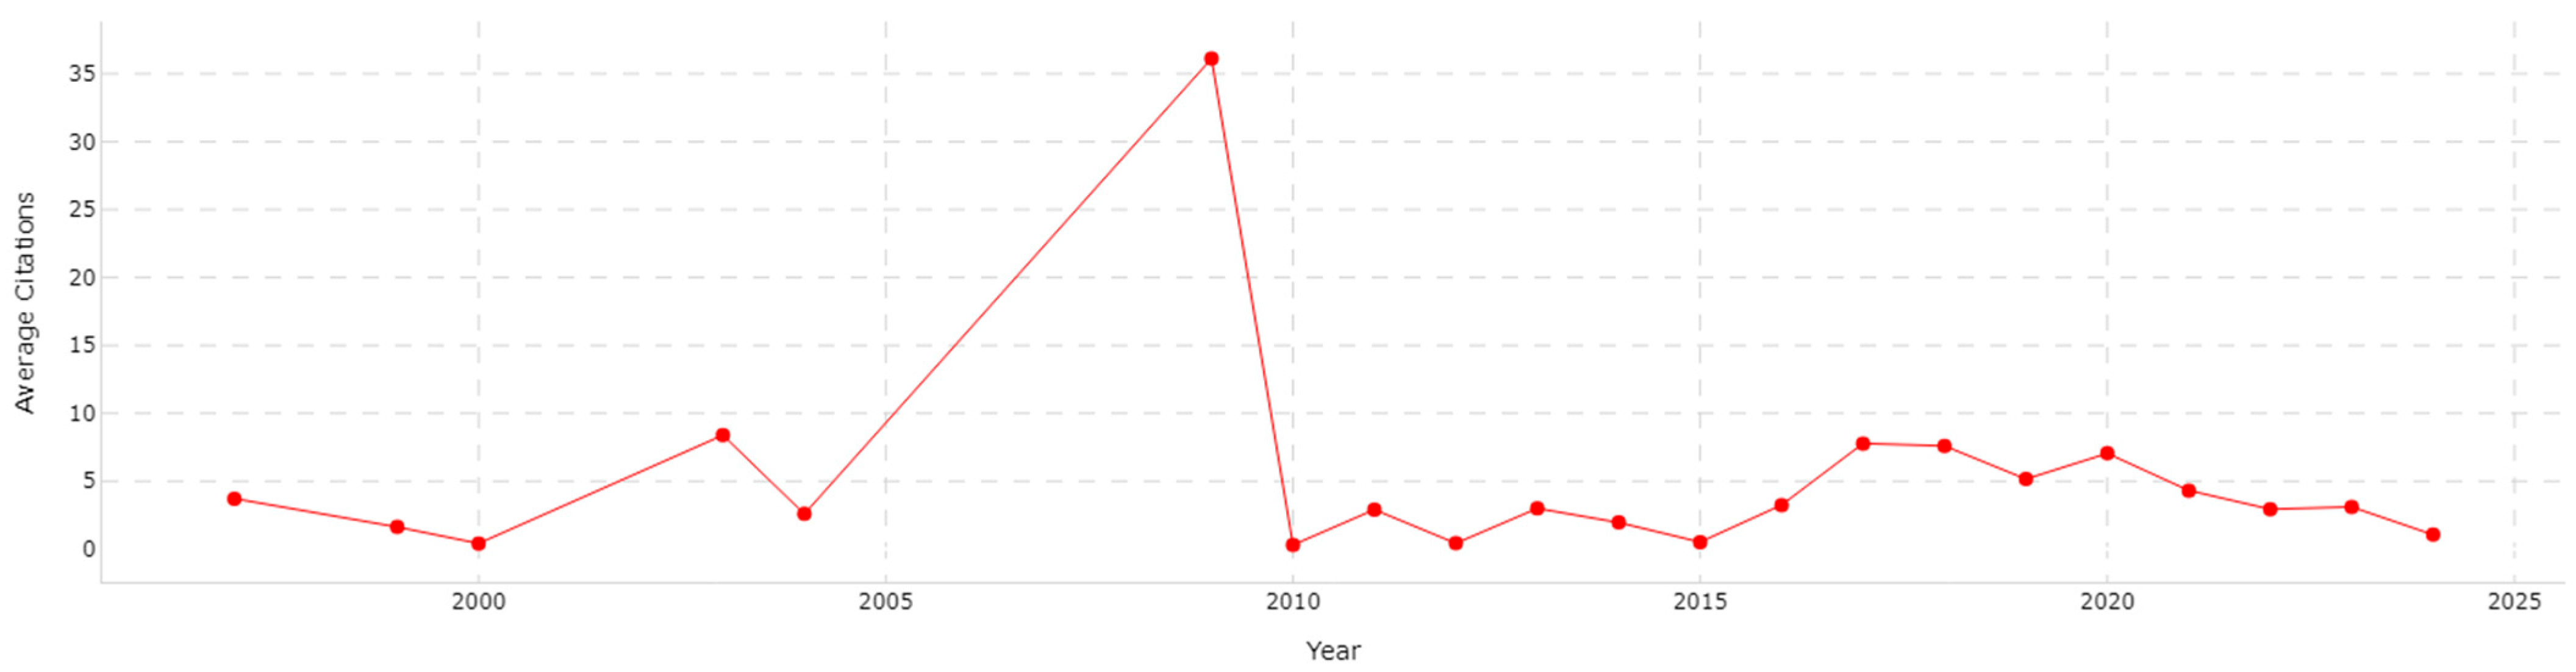
3.1. Journal Analysis

This sub-section focuses on the investigation of the main journals based on the number of published articles or citations. At the same time, a description of yearly scientific production and mean citations will be discussed.
Figure 2 details the yearly scientific production on the time series forecast and AI domains, between 1997 and 2024. During the timespan, a positive trend could be observed, especially starting with the 2019–2020 period. The increase in the number of papers starting with this period could have two main reasons. The first one could be related to the mainstream adoption of the transformer models across various disciplines as well as the creation of new transformer variants for time series forecasting, with impacts on the improvement of long-term forecasting accuracy. On the other hand, some of the increase could be due to the general trend observed in research by Ofer et al. [39], that underlined that the number of scientific papers had increased in recent decades. The increase in the number of publications could have multiple causes, such as, but not limited to, better automated data indexing observed through the use of various databases [39], the use of the keyword annotation scheme by research subjects [39], the advancements in computer science [39], the growth in research and development expenditures [40], and the overall number of researchers in the field [40].
The Annual Growth Rate was 23.11%, which points to the increased interest of researchers. It should be stated that the formula used for determining this indicator was the one offered by Biblioshiny [26,41]:
A n n u a l   G r o w t h   R a t e = F i n a l   Y e a r   P r o d u c t i o n I n i t i a l   Y e a r   P r o d u c t i o n 1 T i m e   S p a n 1
in which the indicators are as follows:
  • Initial Year Production refers to the initial year for the latest period of the timespan in which all years have at least one publication
  • Final Year Production refers to the final year for the latest period of the timespan in which all years have at least one publication
  • Timespan refers to the period between the initial and the final year of the latest period of the timespan in which all years have at least one publication
In the case depicted in Figure 2, the Annual Growth Rate was determined as follows:
A n n u a l   G r o w t h   R a t e = 2024   Y e a r   P r o d u c t i o n 2009   Y e a r   P r o d u c t i o n 1 T i m e   S p a n   b e t w e e n   2009   a n d   2024 1 = 64 1 1 15 1 = 1.2311 1 = 0.2311 = 23.11 %
The first paper was published in 1997, which represents 0.38% of total articles released. In 1998, no papers were published, followed by two consecutive years with papers published. Until 2018, the number of publications was around three or four papers per year, which represented approximately 1.5% of total publications. Starting in 2018, the number increased to six (2.31%), followed by seven in 2019 (2.69%). In 2020, a significant spike was registered, with 26 articles published (10%), followed by 41 in 2021 (15.77%), 40 in 2022 (15.38%), 50 in 2023 (19.23%), and a peak in 2024, with 64 documents (24.62%) published. Monroy and Diaz [42] evaluated the time series of papers using a bibliometric approach. The authors focused on papers published between 1960 and 2020, and the trend was similar, starting to increase in 2000, with a peak in 2020. Palomero et al. [43] presented the evolution of fuzzy-based time series forecasting, applying a bibliometric approach for articles that had been published between 2017 and 2021. There was a positive trend between 2017 and 2020, similar to our findings, but in 2021, the value decreased (in a manner similar to what happened in 2022 in our dataset). According to the investigated research, there were similarities between our outcome and the existing literature reviews. Bawack et al. [38] described the AI impact on e-commerce, investigating the existing literature using a bibliometric analysis. The first paper was published in 1991, with a positive trend noted during the timespan. In 2019, a peak of 522 articles was achieved, followed by a small decrease in 2020 to 439 articles. Frioui and Graa [37] presented the impact of AI on e-commerce and discovered that there was a positive trend in the publication of articles starting in 2016, peaking in 2021 with 149 papers, followed by a small decrease in 2022, to 146 articles, and a more significant decrease in 2023, to 73.
Figure 3 illustrates the average citations per year on the domains of time series and AI. The first year with citations was 1997, with an average of 3.72 citations. A significant spike was observed in 2009, where the average citations per year reached 36.12, when the most cited article, with a total of 614 citations, was published by Wang [44]. During the remaining period, the mean citations were between 1 and 7 per year.
Figure 4 includes the most representative sources based on the number of publications. In first place was IEEE Access with 11 papers published, followed by Energies with nine documents, Mathematics with seven documents, and Applied Sciences-Basel with six articles. In fifth place, there were multiple journals: Applied Energy, Energy, Knowledge-Based Systems, Sensors, and Sustainability with five papers each, while Artificial Intelligence Review, Computational Economics, Soft Computing, Journal of Hydrology, Engineering Applications of Artificial Intelligence, and Expert Systems with Applications were the sources with four articles each. For a better understanding of the results, the existing articles that were published on similar topics were investigated. Palomero et al. [43] evaluated fuzzy-based time series forecasting using a bibliometric approach, discovering that IEEE Access, Energies, Knowledge-Based Systems, Applied Sciences-Basel, and Applied Energy were among the journals with the highest impact on the investigated field. Chen et al. [45] explored the AI impact on traffic flow prediction, where the time series method is one of the most implemented. The most significant journals identified were also among those in our findings: Sustainability, Applied Sciences-Basel, Sensors, and IEEE Access, but at the same time, there were sources that were not found in our results, such as Neurocomputing or Neural Computing & Applications.
Figure 5 shows the 10 most crucial local journals based on the number of citations. In first place are two journals, Expert Systems with Applications and Journal of Hydrology, each with 289 citations, followed by ARXIV with 225 citations, Energy with 219 citations, and Applied Energy with 216 citations. IEEE Access had 175 citations and International Journal of Forecasting had a total of 169 citations, followed by Neurocomputing with 160 citations, Energies with 153 citations, and Applied Soft Computing with 150 citations. Shabani et al. [46] explored portfolio optimization using AI and discovered that Expert Systems with Applications was the journal with the highest number of publications, followed by Journal of Portfolio Management and IEEE Access. The rest of the journals had less impact and were not common in our outcome, demonstrating the variety of the domain and how the impact on the results changed if, during the extraction process, different filters were applied.
Figure 6 presents the 10 most representative local sources using the H-index, also known as the Hirsch Index, which quantifies the total number of papers where the source has at least the same number of citations as the article [47].
Additionally, the G-index represents an improvement over the H-index, taking into account only the unique highest number where the top g documents obtained, in total, at least g2 citations [48].
In our case, the most relevant source was Energies, with an H-index value of 5 and a G-index value of 9, followed by Applied Sciences-Basel, with an H-index value of 4 and a G-index value of 6. In third place was Artificial Intelligence Review, with an H-index of 4 and a G-index of 4. Energy, IEEE Access, Journal of Hydrology, Mathematics, Sensors, and Soft Computing each had an H-index value of 4, while Applied Soft Computing, Engineering Applications of Artificial Intelligence, Computational Economics, Neural Computing & Applications, Knowledge-Based Systems, Renewable Energy, and Expert Systems with Applications had an H-index value of 3.
Figure 7 incorporates the most cited sources, separating the journals with fewer citations.
The Bradford’s Law method groups the journals into three different sections that should have the same number of papers, but each category has a different number of citations. According to Yang et al. [49], the Bradford’s Law clusters journals using the formula 1:n:n2. The most representative journals from Zone 1 were IEEE Access (11 articles), Energies (9 articles), Mathematics (7 articles), Applied Sciences-Basel (6 articles), and Applied Energy (5 articles). The most relevant sources in Zone 2 were Journal of Hydrologic Engineering (3 articles), Journal of Intelligent & Fuzzy Systems (3 articles), Neural Computing & Applications (3 articles), Renewable Energy (3 articles), and Theoretical And Applied Climatology (3 articles). In the last part, Zone 3, the most significant journals were Economies (1 article), Energy and AI (1 article), Energy and Buildings (1 article), Energy Conversion and Management (1 article), and Energy Exploration & Exploitation (1 article).
Shabani et al. [46] implemented the Bradford’s Law method and discovered that Expert Systems with Applications, IEEE Access, Knowledge-Based Systems, Mathematics, and Computational Economics were the main journals, which confirmed our results. At the same time, there were differences, with Bradford’s Law identifying journals that were not included in our analysis, such as Journal of Portfolio Management, Financial Markets and Portfolio Management, and Quantitative Finance.

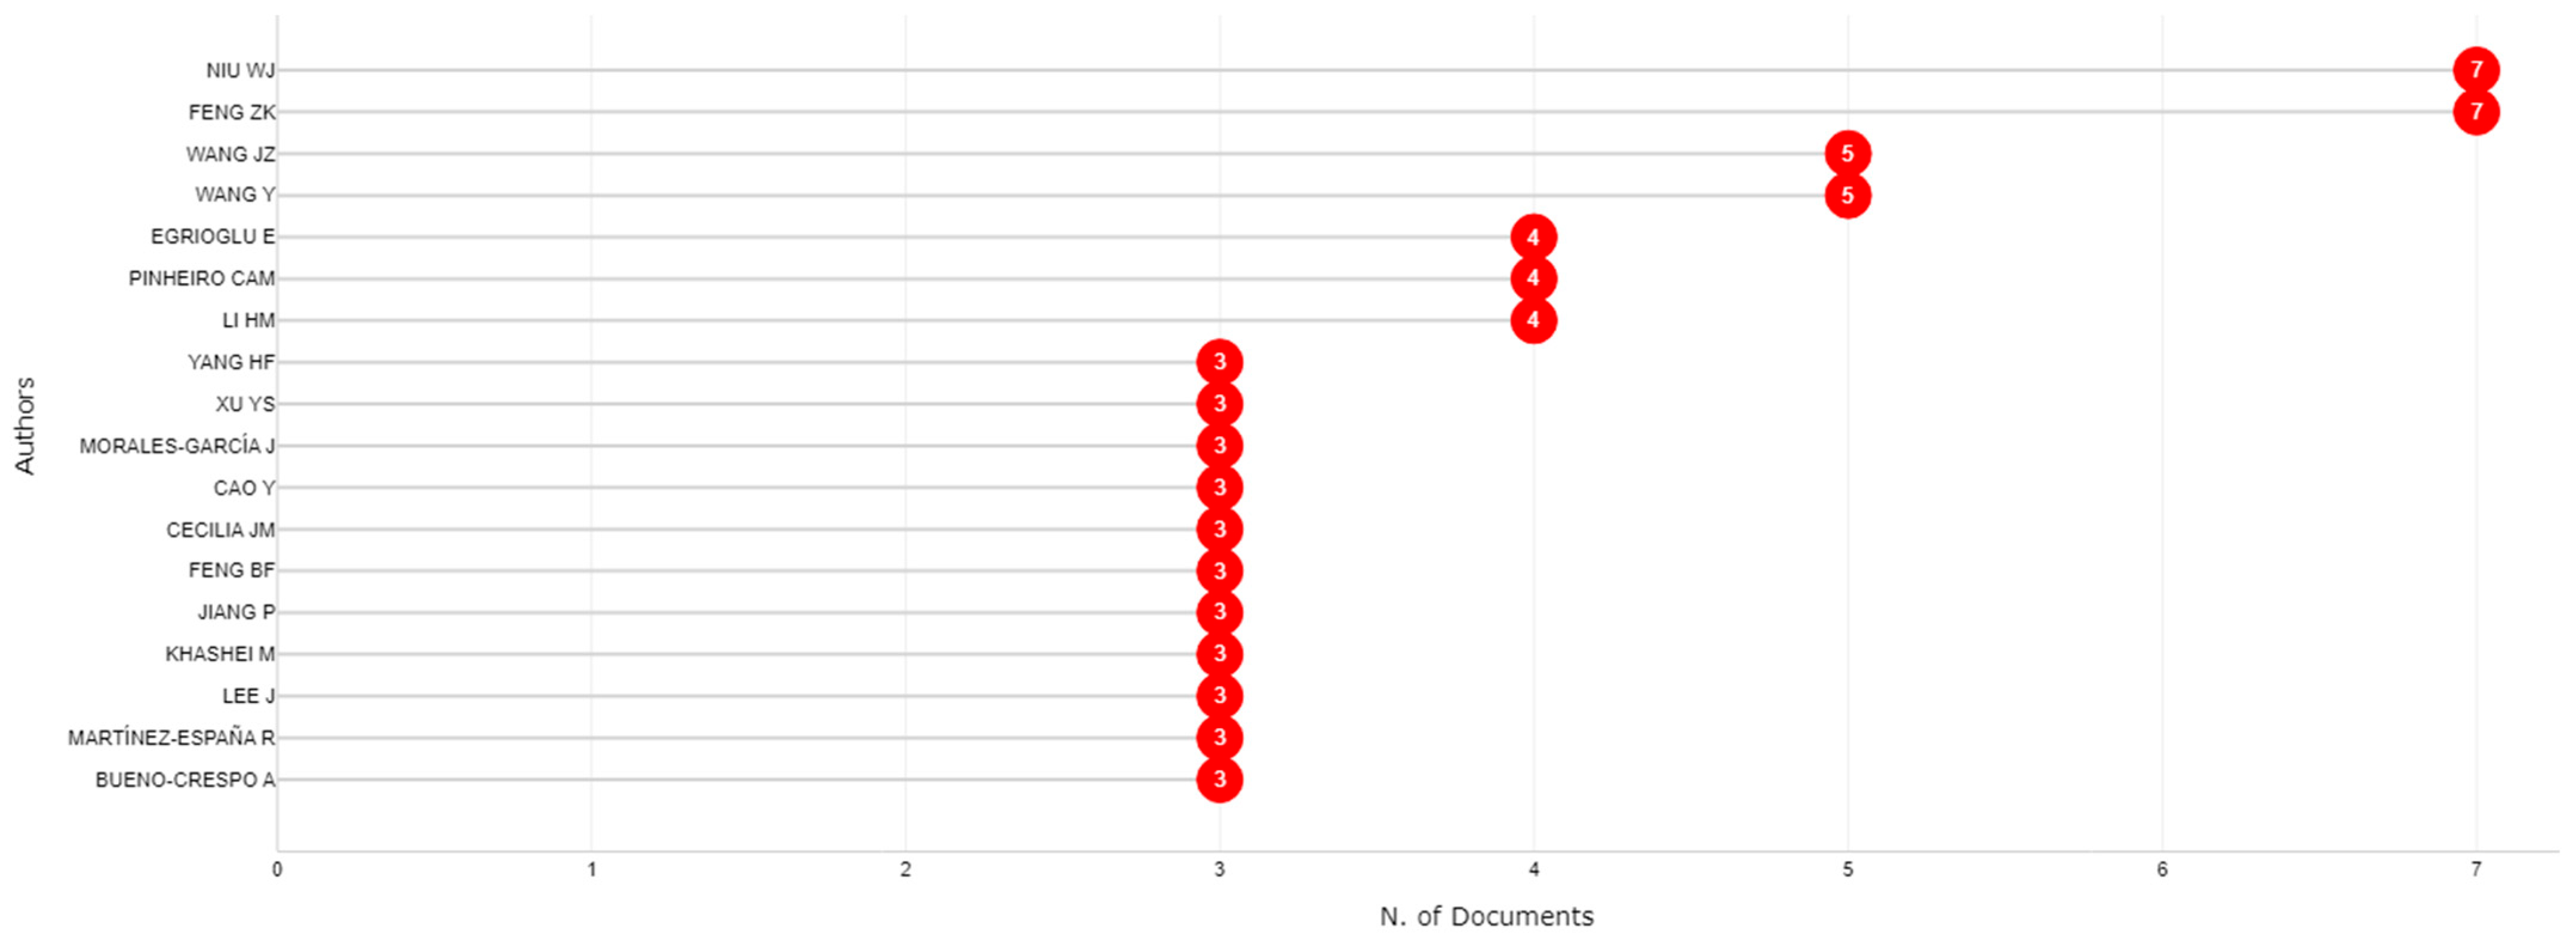
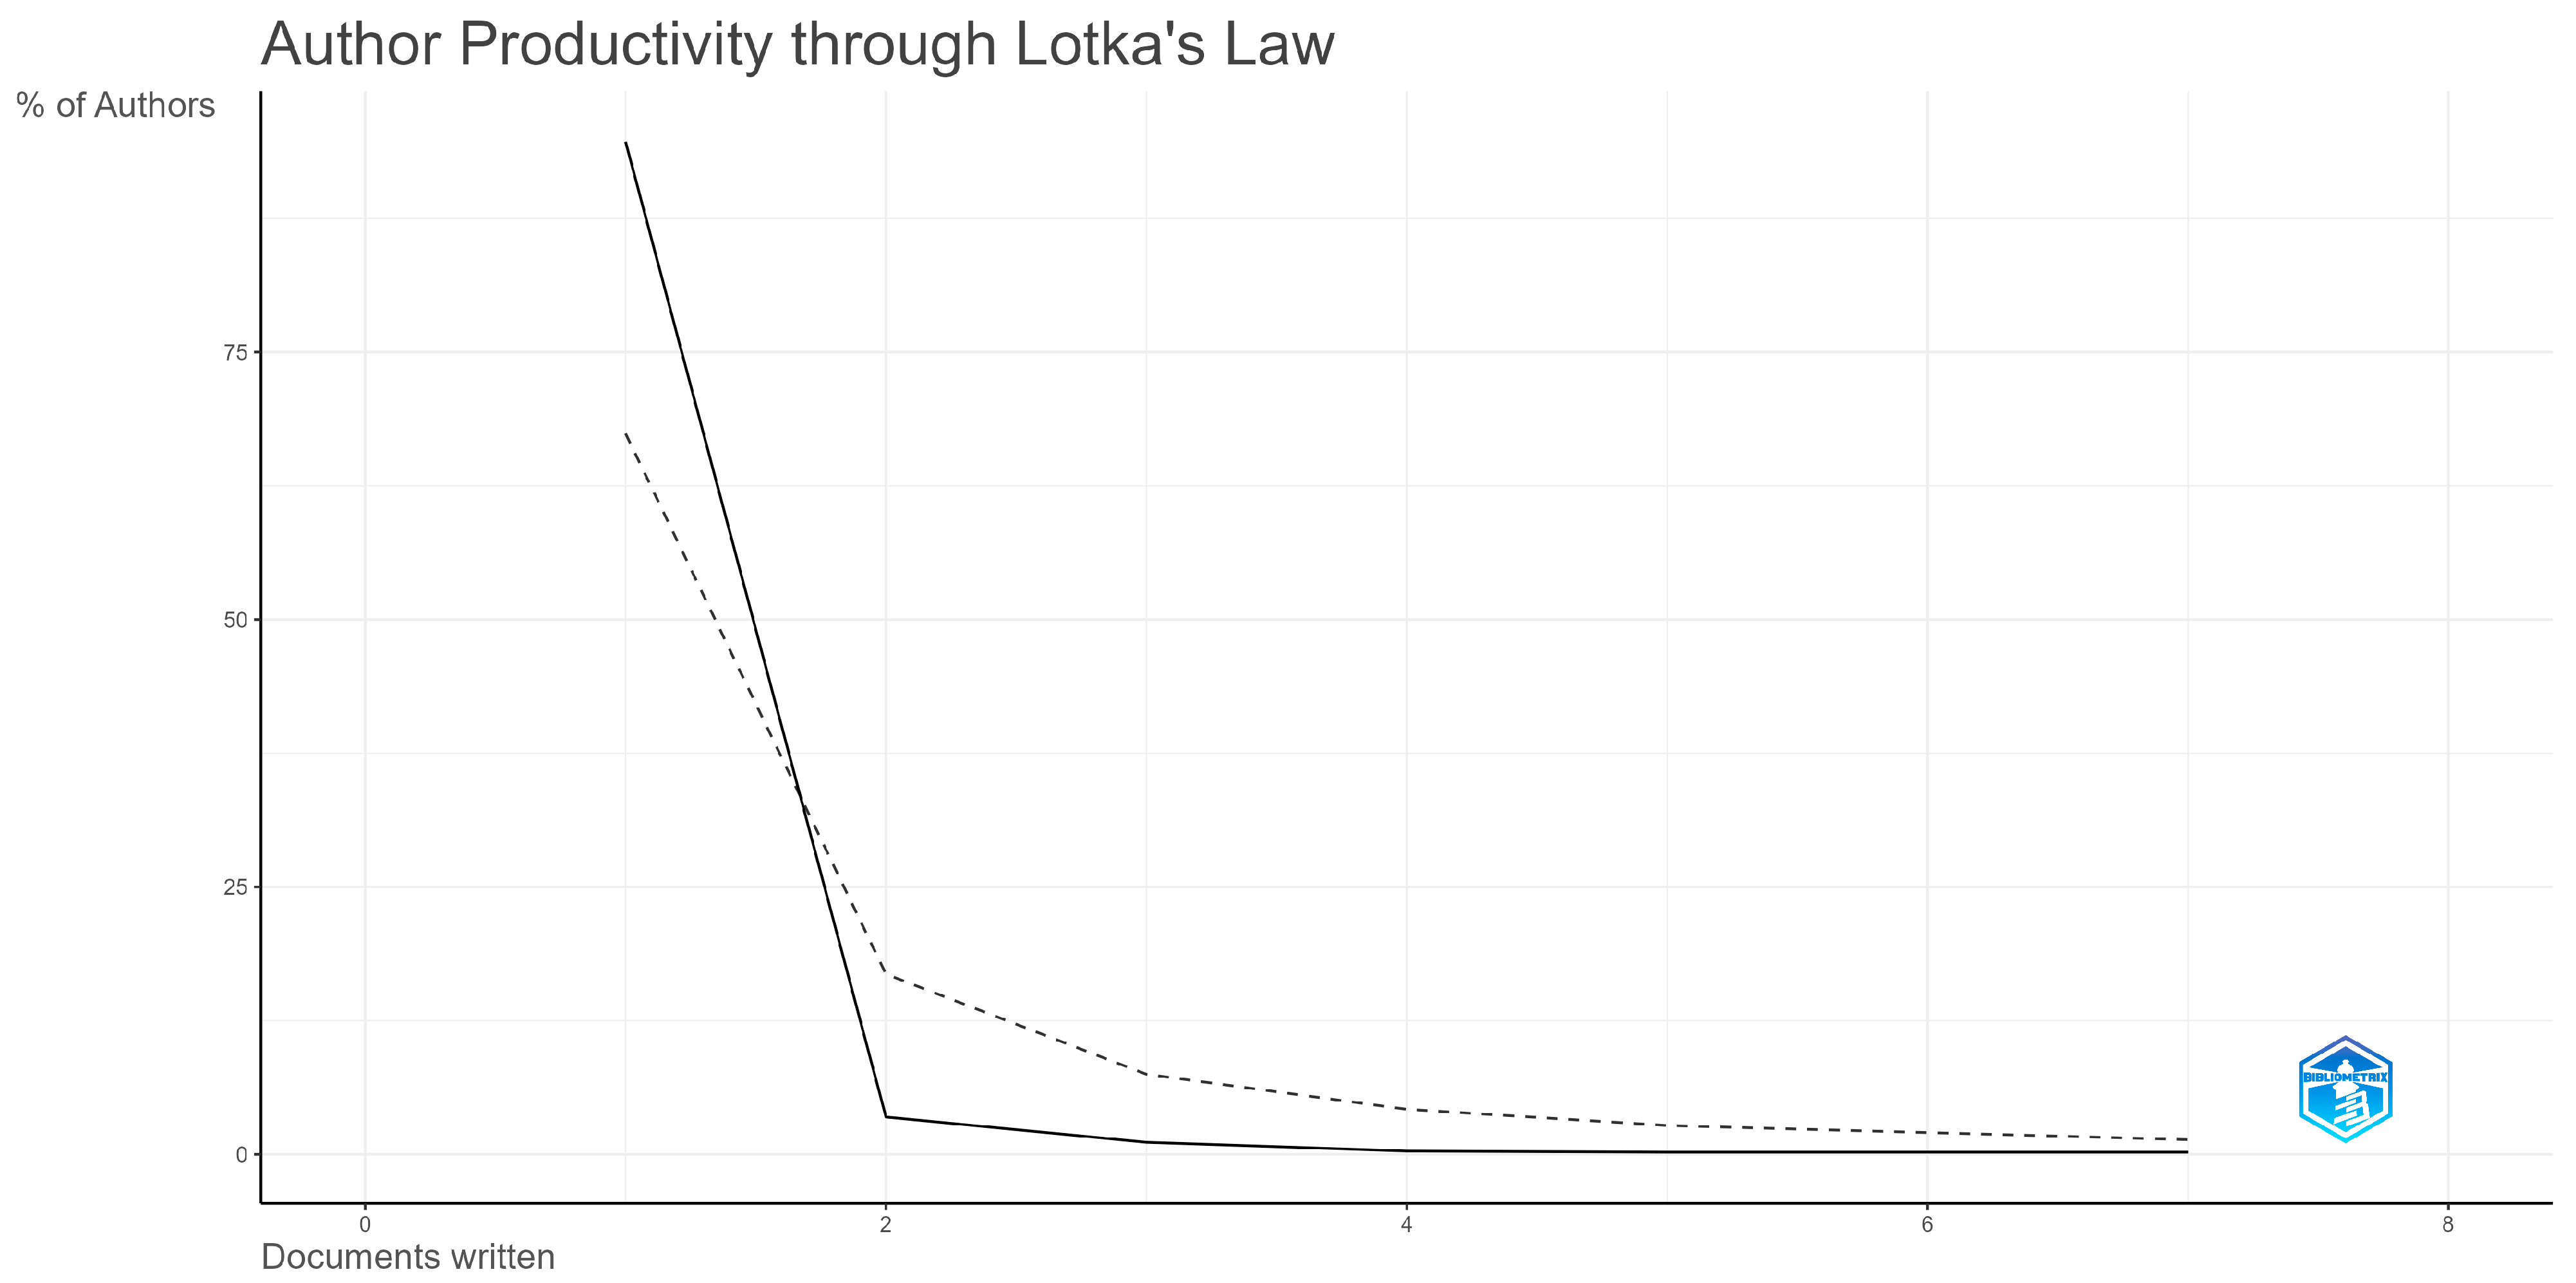
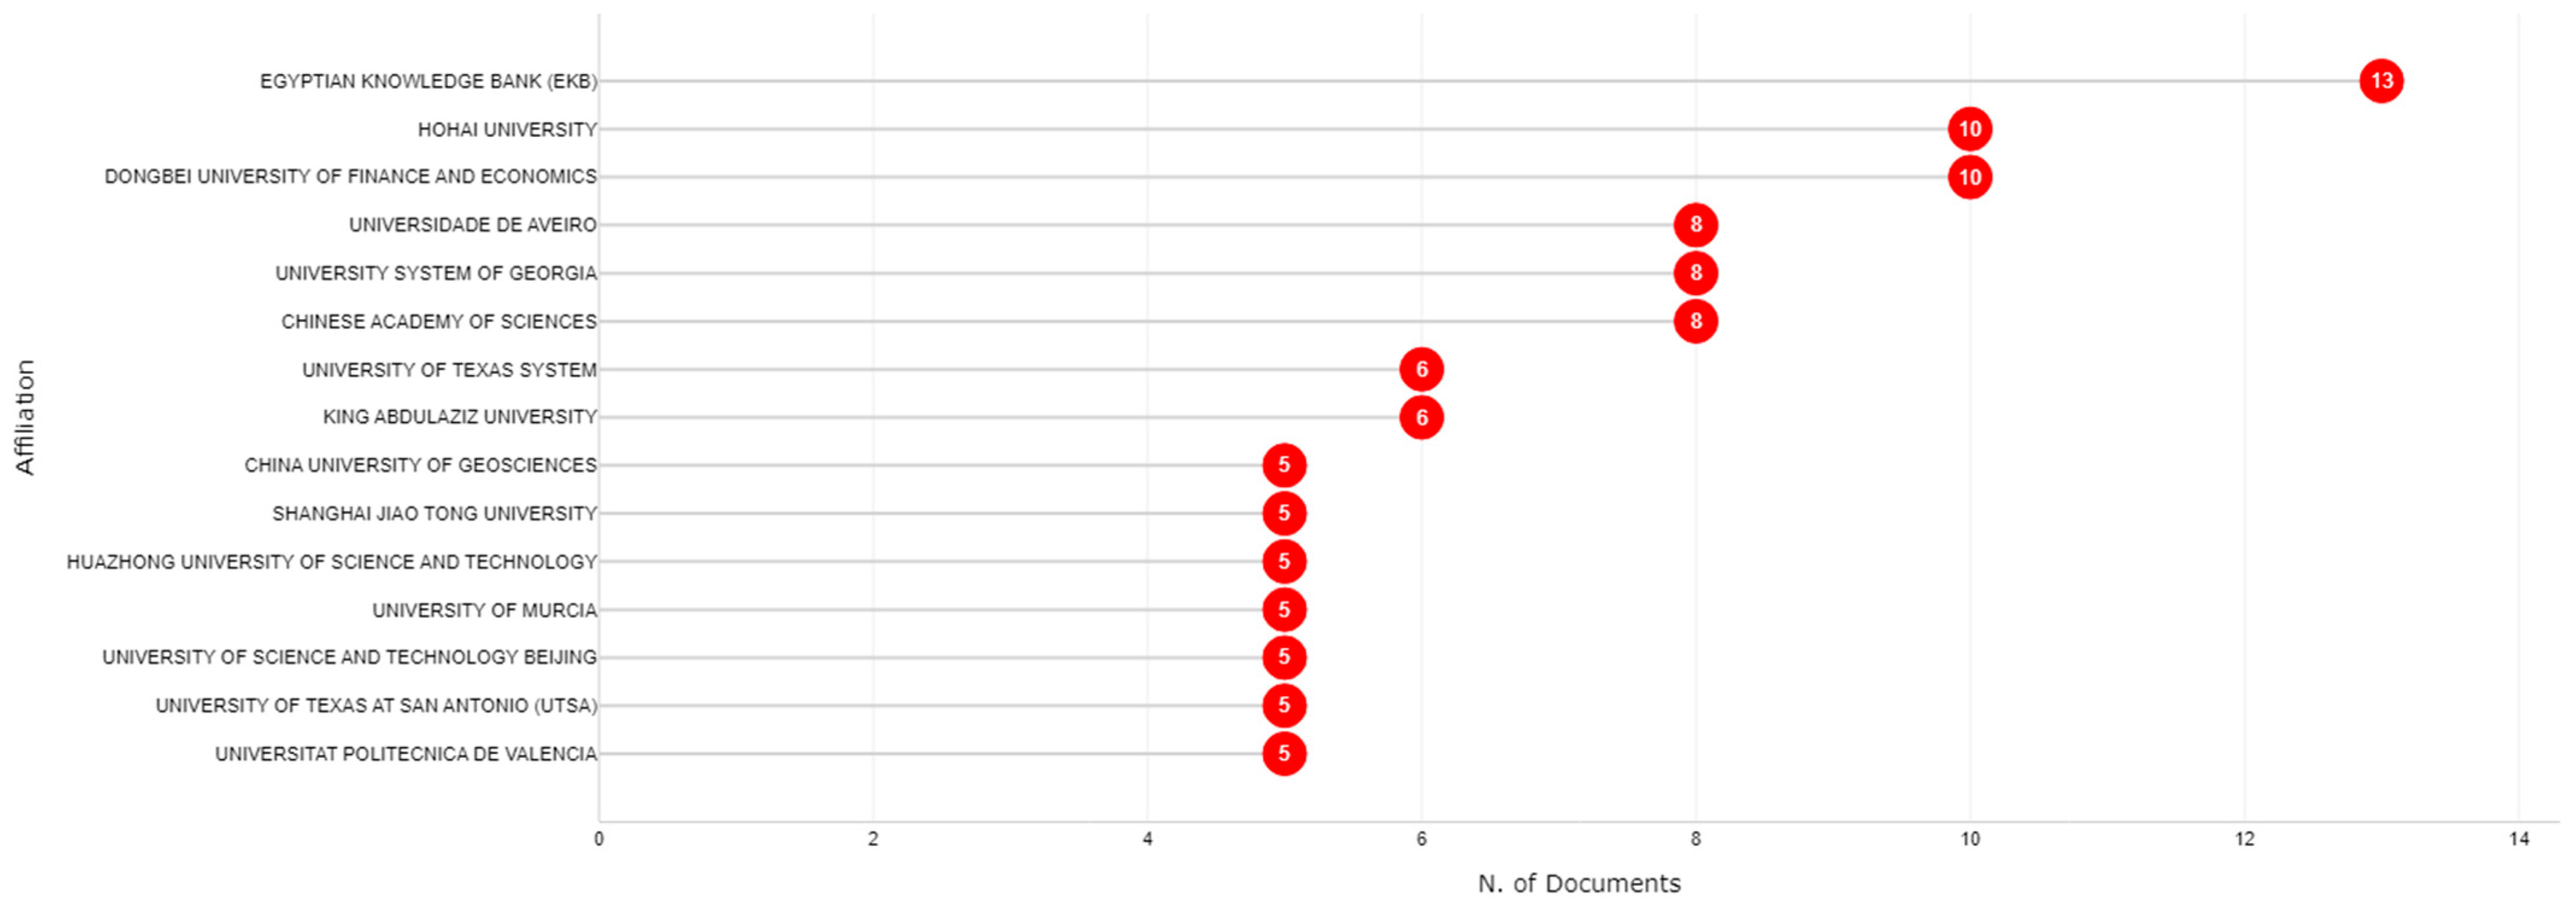
3.2. Authors and Affiliations Analysis

The second part of the third chapter explores the contributions of the most relevant researchers, presenting the total number of contributions, citations, and the main universities that published on the topic of time series forecasting and AI.
Figure 8 presents the authors with the highest impact, based on the number of published articles. In first place were two authors, Feng ZK. and Niu WJ., each with seven articles, followed by Wang JZ. and Wang Y., each with five documents, while Egrioglu E., Li HM., and Pinheiro CAM. published four documents each. The last authors, with three documents released, were Bueno-Crespo A., Cao Y., Cecilia JM., Yang HF., Xu YS., Morales-Garcia J., Feng BF., Jiang P., Khashei M., Lee J., and Martinez-Espana R. The article fractionalized value defines the contributions of authors based on the number of published articles [50], according to the Bibliometrix webpage. The author with the highest article fractionalized value was Egrioglu E. with 1.78, followed by Feng ZK. and Niu WJ. with 1.58 each, Wang JZ. with 1.33, Wang Y. with 1.25, Cao Y. with 1.03, and Li HM. and Pinheiro CAM. with 1.00 each, while Bueno-Crespo A. and Cecilia JM had the lowest values in the top 10, with only 0.58 each. Yang HF. had an article fractionalized value of 0.75, while Xu YS. had an article fractionalized value of 0.54, Morales-Garcia J. had a value of 0.58, Feng BF. had an article fractionalized value of 0.54, Jiang P. had an article fractionalized value of 1.00, Khashei M. had an article fractionalized value of 1.33, Lee J. had a value of 0.64, and Martinez-Espana R had a value of 0.58.
According to the research conducted by Soliman et al. [51], the most relevant authors in the field of AI were Li X (148 papers), Wang Y. (144 papers), Zhang Y. (143 papers), Wang Z (139 papers), Liu Y. (133 papers) and Wang J. (131 papers). Comparing the authors’ results with our outcome, only two authors were common, with the differences coming from the database and timespan selection, as Soliman et al. [51] focused on CiteScore Scopus journal papers that had been published between 2020 and 2021.
Figure 9 focuses on the major authors by taking into account the local citations. In first place are Feng ZK. and Niu WJ. with 11 citations each, while Cheng CT. is third with 8 citations, and Chau KW., Qiu L., and Wang WC., each have 7 citations. The last authors are Balog RS., Chou JS., Egrioglu E., Hajmirza S., Shardaga H., Tran DS., and Wang JZ., with 3 citations each.
Figure 10 reveals the productivity of the authors using Lotka’s Law, which explains the number of publications of researchers, estimating that a reduced percentage of authors contributed to the majority of the articles [52].
The law takes into consideration a proportional rule of 1/n2, where n stands for the number of papers an author published, highlighting the contribution and productivity of high-performing researchers [52]. Most of the authors (94.7%) published only one article, and only 3.5% published two papers, 1.1% published three, 0.3% published four, and only 0.2% published five and seven articles. Lotka’s distribution points out the complexity of the domains, since almost all authors published only once, but at the same time, the fields evolved significantly in recent years, and the imbalance can be reduced in the following period. According to Shabani et al. [46], the outcome with Lotka’s law showed that 87.6% of the researchers contributed to a single paper, while 9% contributed to two documents, 1.9% to three articles, and only 0.7% contributed to four publications. Only 0.4% of the authors worked on five papers, while 0.1% worked on six and seven articles. The results were comparable with our outcome, showing the majority of researchers contributing to just one paper, while the percentage dropped sharply starting with two papers.
Figure 11 includes the 10 most representative universities that published in the fields of time series forecasting and AI by taking into account the number of publications. In first place was Egyptian Knowledge Bank (EKB) from Egypt with 13 documents, followed by Dongbei University of Finance and Economics and Hohai University, both from China with 10 documents each, while Chinese Academy of Sciences (China), Universidade de Aveiro (Portugal) and Unversity System of Georgia (United States of America) had eight publications each. King Abdulaziz University (Saudi Arabia) and University of Texas System (United States of America) published six papers each, while China University of Geosciences (China), Huazhong University of Science and Technology (China), Shanghai Jiao Tong University (China), University of Murcia (Spain), University of Science and Technology Beijing (China), University of Texas at San Antonio (USA) and Universitat Politecnica de Valencia (Spain) published five articles each.
In total, there were seven universities from China, three from the United States of America (USA), two from Spain, one from Saudi Arabia, one from Portugal, and one from Egypt.

3.3. Most Cited Documents

This section presents the 10 most representative papers in the time series forecasting and Artificial Intelligence domains based on the total number of citations. A short description of each article will be described below in order to observe and understand the main objective of the analysis, extracting the major topics and methods that have been implemented.
Table 2 includes relevant information regarding the 10 most cited papers, such as the first author of the article, year when it was published, journal name, the number of researchers, region, total citations (TC), total citations per year (TCY), and normalized total citations (NTC). The NTC indicator presents importance mostly in the context of the other papers included in the dataset, as it presents how many times an article succeeds in receiving more citations than the average number of citations received by the papers published in the same year as the analyzed paper and included in the dataset [53,54].
AI and time series forecasting developed significantly in recent years, mainly thanks to the technological evolution. The most cited paper was published by Wang [44] and has been cited 614 times, having four authors, a total citations per year (TCY) of 36.12, and a normalized total citation (NTC) of 1. The authors explored the hydrological sector, focusing on estimating hydropower reservoir management and optimal scheduling, using past data, implementing multiple models such as the autoregressive moving average (ARMA), adaptive neural-based fuzzy inference system (ANFIS), artificial neural networks (ANN), genetic programming (GP), and support vector machine (SVM). The algorithms were trained on monthly river flow discharges and, in order to classify the models, multiple statistical metrics were calculated, such as the Nash–Sutcliffe efficiency coefficient (E), coefficient of correlation (R), mean absolute percentage error (MAPE), and root mean squared error (RMSE). The outcome showed that SVM, GP, and ANFIS were the algorithms with the highest accuracy based on various criteria that had been tested for training and validation processes.
Oil production was forecasted with the long short-term memory (LSTM) neural network approach for production by fractured horizontal wells, using two case studies from Xinjiang oilfield, China. Song et al. [55] also included Particle Swarm Optimization (PSO) in order to optimize the LSTM algorithm. The results were compared with traditional neural network methods, conventional decline curves, and time-series solutions. The outcome demonstrated that LSTM outperformed the traditional algorithms. In total, eight authors contributed, obtaining a total of 241 citations, with total citations per year of 40.17 and a normalized total citation of 5.70.
Solar power generated by photovoltaic panels plays a significant role in the electricity market, especially when fluctuations in the systems occur due to environmental factors. Sharadga et al. [56] predicted solar power generation using AI, neural networks, LSTM, and a multilayer perceptron (MLP) network. The objective of the research was to accurately predict solar power production, facilitating the operation, scheduling, and management of related power systems. At the same time, the effect of power forecasting was explored. The data included in the analysis contained over 3640 h of operation-related data points extracted from grid-connected photovoltaic stations in China, which produced a total of 20 megawatts (MW). There were three authors that investigated the topic, receiving a total of 225 citations, with a value of 37.50 for TCY and 5.32 for NTC.
The tourism sector plays a crucial role in the global economy, representing a priority for Cho, who evaluated multiple time series algorithms like exponential smoothing, Elman’s Model of Artificial Neural Networks, and ARIMA. The objective of the research was to estimate tourism traffic based on historical data and to understand tourists’ behavior. According to the results, the neural network algorithm was the most suitable solution for the prediction of visitor arrivals, especially if the data had no trend or pattern. Only one author contributed to the paper, receiving 193 citations, with a TCY value of 8.39 and an NTC value of 1.
A long short-term memory recurrent neural network (LSTM-RNN) and AI were implemented by Sahoo et al. for a gauging station located in the Mahanadi River basin, India, containing daily information. A comparison was performed between LSTM-RNN, RNN, and naïve methods. Multiple metrics, such as the Nash–Sutcliffe coefficient, correlation coefficient, and root mean squared error, were applied in order to test the accuracy of the algorithms. The outcome confirmed that LSTM-RNN was the model with the best metrics, representing a reliable AI solution for low-flow forecasting. The article had 171 citations, and four authors contributed to the research. The TCY value was 24.43, while the NTC value was 4.73.
The importance of accurately predicting photovoltaic power generation represents a crucial step for integrating, operating, and scheduling smart grid systems, as Qu et al. pointed out in their research. The authors focused on predicting the day-ahead hourly photovoltaic power supply, using historical data extracted from the DKASC website and taking into account existing constraints like volatility and intermittence of solar energy. A short-term temporal neural network model (ALSM), LSTM, and other algorithms were tested. The outcome confirmed that ALSM predicted the photovoltaic power with the highest accuracy. Three authors contributed to the article, resulting in a total of 154 citations, with a TCY value of 30.80 and an NTC value of 7.13.
Using time series and AI, Chou and Tran [57] predicted the energy consumption of buildings by taking into account the real-time data collected from an experimental construction project. The objective of the research was to improve sustainable development and energy efficiency, reducing the costs and environmental impact. A hybrid model that combines optimization and forecasting methods was defined, affording better accuracy than ensemble models and representing a significant support for planning energy efficiency and management. Two authors investigated the topic, and the article was cited 146 times, with a TCY value of 18.25 and an NTC value of 2.40.
A time series analysis, together with AI, was explored by Nourani [58] in order to predict daily rainfall runoff related to the hydrological domain. An emotional artificial neural network (EANN) was defined, trained, and evaluated, demonstrating the capability of the algorithm, compared with ANN, in understanding and differentiating rainless days and rainy days using artificial emotional system elements, such as hormonal criteria. Nourani was the only author that worked on the paper, obtaining 137 citations, with a TCY value of 15.22 and an NTC value of 1.96.
Published in 1997, the paper in nineth position based on the number of citations, authored by Ledoux [59], demonstrates an interest in the domain before the 21st century. Using simulated data, the author explored urban traffic flow based on neural networks. The initial approach focused on modeling a local neural network, then including the traffic flow. The objective of the analysis was to demonstrate the possibility of modeling traffic flow using AI. The outcome showed that the model predicted the queue lengths one minute ahead, representing a good starting point for further analysis. A total of 108 citations have been obtained by the paper published by Ledoux, with a TCY value of 3.72 and an NTC value of 1.
Self-organizing maps (SOMs) and least square support vector machine (LSSVM) have been combined, resulting in the SOM-LSSVM model, which was been tested by Ismail et al. [60] on two datasets, the Wolf yearly sunspot and monthly unemployed young women datasets. The outcome confirmed the accuracy and efficiency of the model, compared with LSSVM, with a much smaller mean absolute error (MAE) and root mean squared error (RMSE). At the same time, the algorithm was able to perform time series forecasting, representing a promising solution for time series topics. In total, three authors explored the topic, obtaining a total of 100 citations, with a TCY value of 6.67 and an NTC value of 2.29.
Table 2. Top 10 most cited documents.
No.Paper (First Author, Year, Journal, Reference)Number of AuthorsTotal
Citations (TC)
Total
Citations per Year (TCY)
Normalized TC (NTC)
1Wang WC., 2009, Journal of Hydrology [44]461436.121.00
2Song XY., 2020, Journal of Petroleum Science and Engineering [55]824140.175.70
3Sharadga H., 2020, Renewable Energy [56]322537.505.32
4Cho V., 2003, Tourism Management [61]11938.391.00
5Sahoo BB., 2019, Acta Geophysica [62]417124.434.73
6Qu JQ., 2021, Energy [63]315430.807.13
7Chou JS, 2018, Energy [57]214618.252.40
8Nourani V., 2017, Journal of Hydrology [58]113715.221.96
9Ledoux C., 1997, Transportation Research Part C: Emerging Technologies [59] 11083.721.00
10Ismail S., 2011, Expert Systems with Applications [60]31006.672.29
Table 3 contains information about the 10 most cited publications on the topic of time series forecasting and AI, presenting the first author name, year of publication, journal, title of the paper, the data used during the research, and the scope of the investigation.

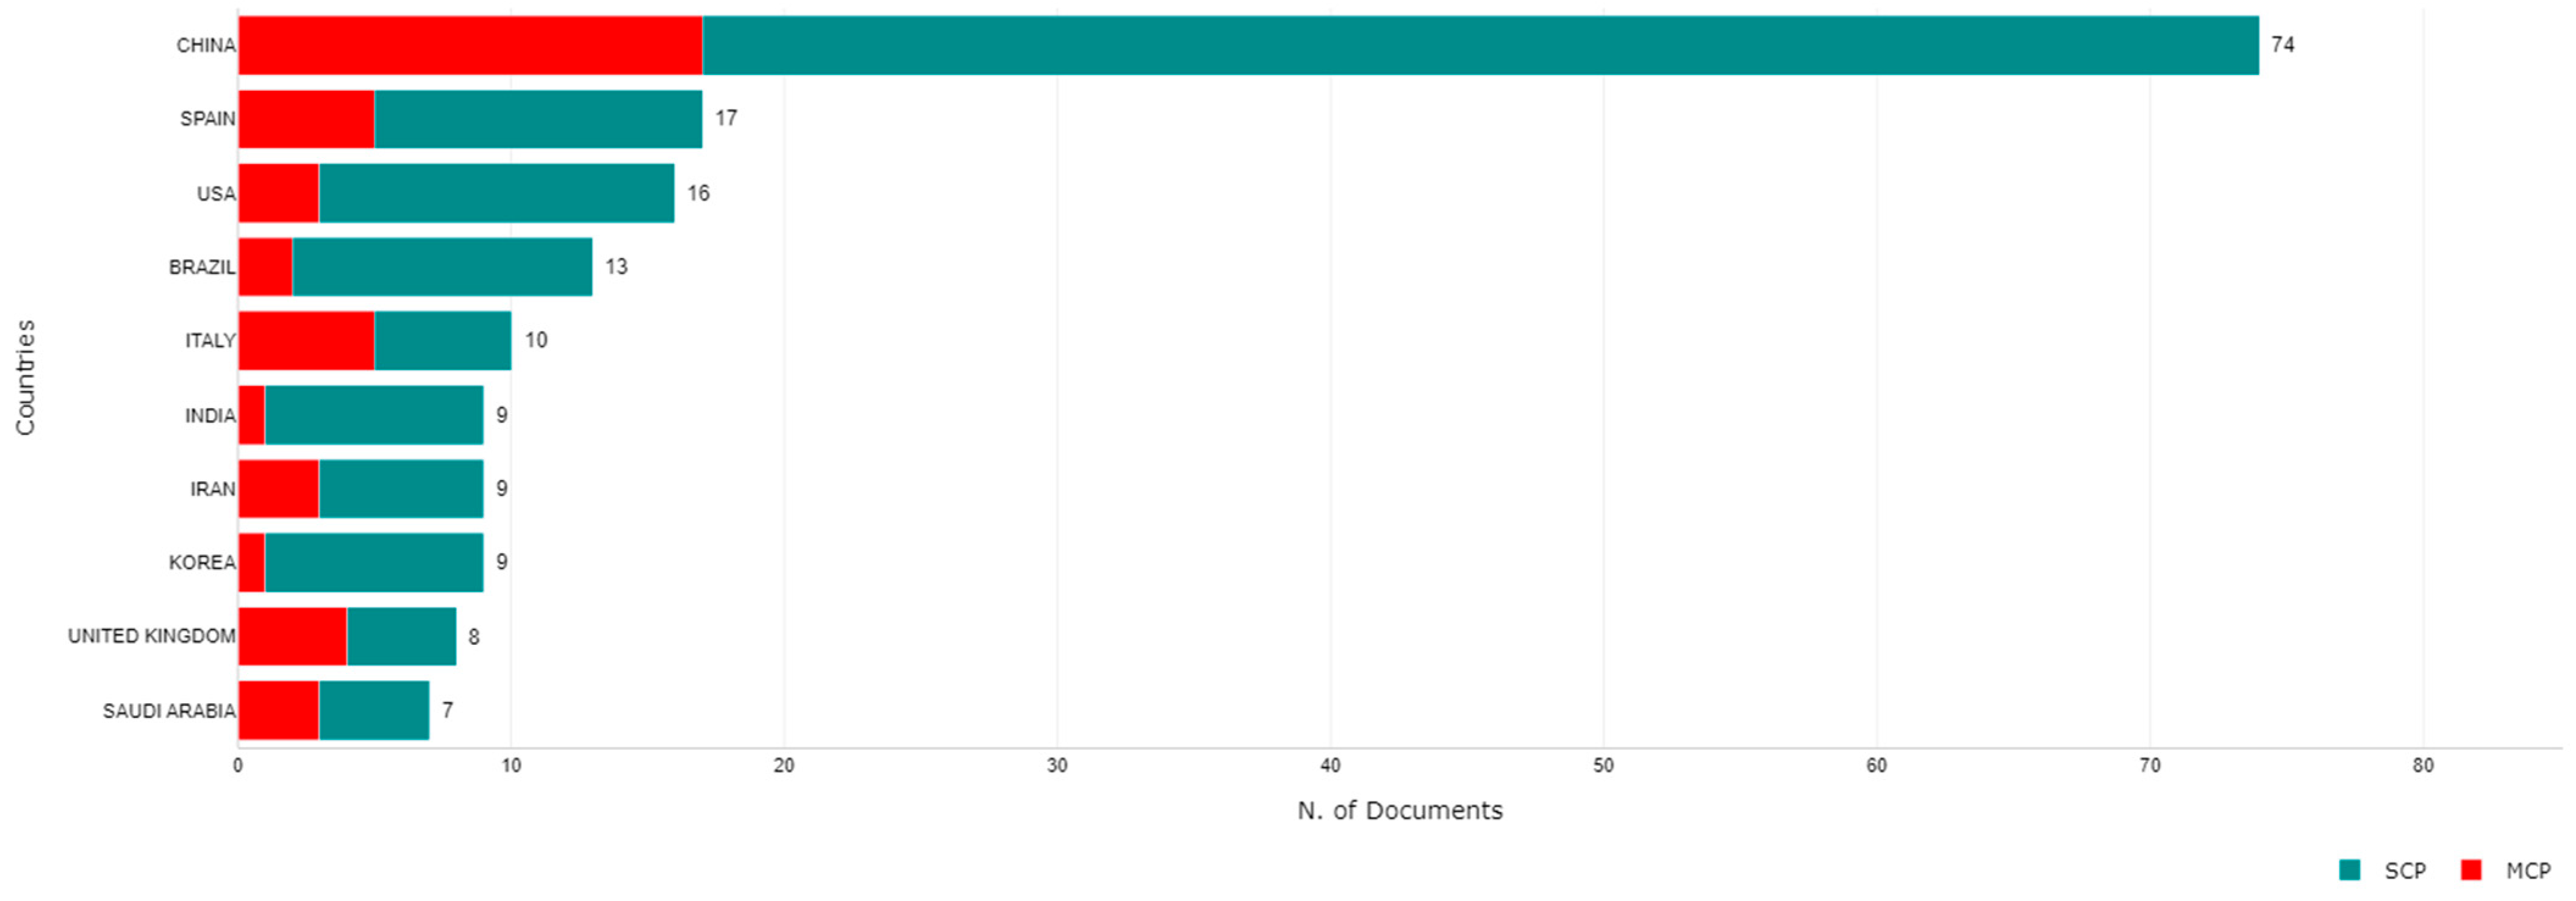
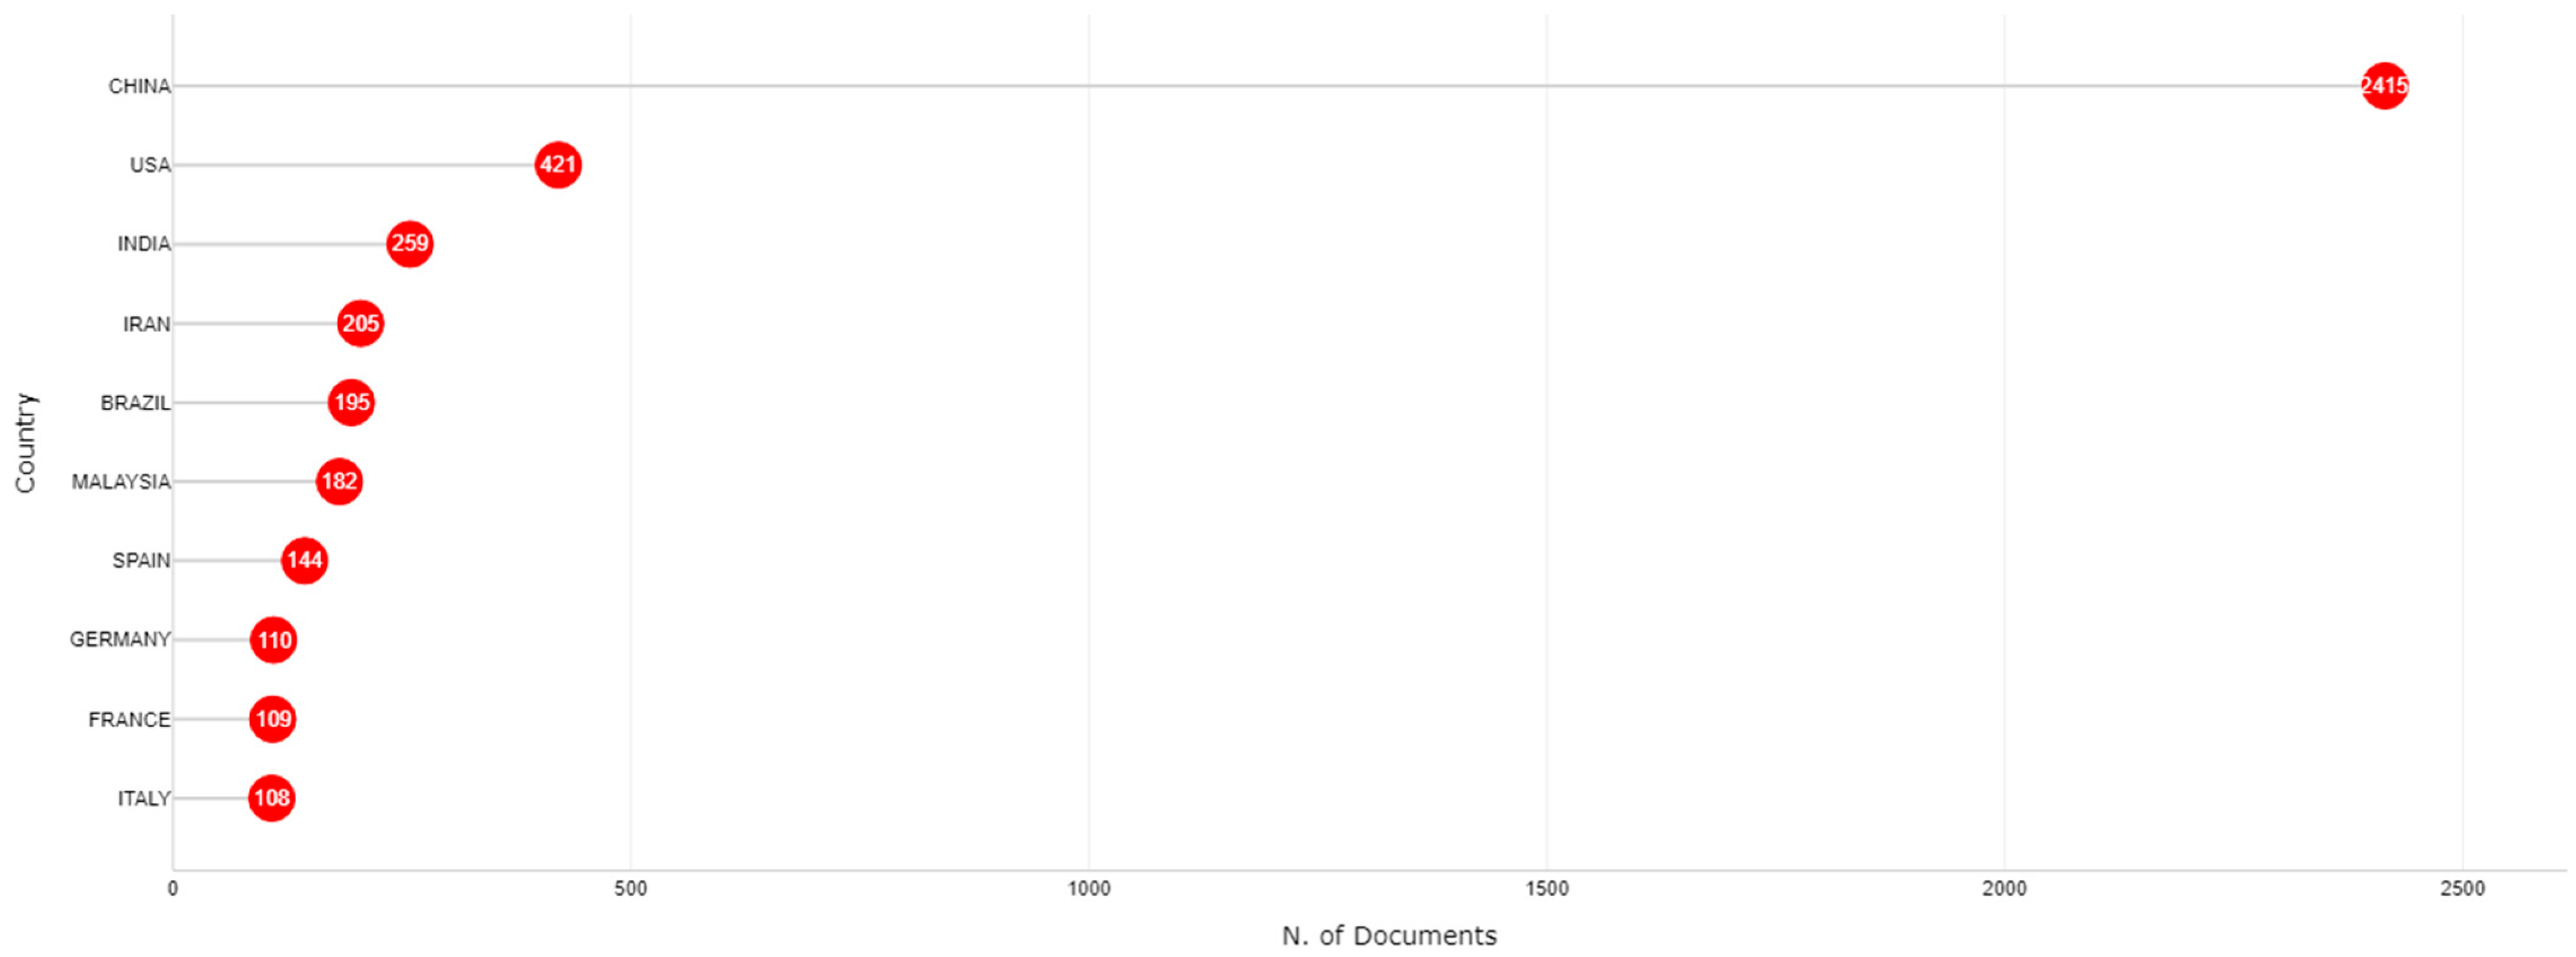
3.4. Country Analysis

This section includes information about the countries with the highest number of publications and citations, noting also the collaboration between states.
Figure 12 explores the main 10 countries that contributed the most to the development of time series forecasting and AI topics. The countries are classified based on the number of published papers, single-country publications (SCPs), and multiple-country publications (MCPs). In first place was China with 74 papers, which represented 28.5% of the total in articles published, with 57 SCPs (77%) and 17 MCPs (23%). In second place was Spain with only 17 articles, representing 6.5% of the total in articles published. In total, Spanish authors published 12 SCPs (70.6%) and five MCPs (29.4%). In third place was the United States of America (USA), with 16 publications (6.2% of total publications), comprising 13 SCPs (81.2%) and three MCPs (18.8%). In fourth place was Brazil, which released a total of 13 documents, representing 5% of the article total, with 11 SCPs (74.6%) and two MCPs (15.4%), followed by Italy with 10 papers (3.8% of total papers), including five SCPs (50%) and five MCPs (50%). The remaining countries each had less than 10 documents published but were still worthy of mention: India with nine papers (3.5% of total articles), including eight SCPs (88.9%) and only one MCPs (11.1%); Iran with nine documents (3.5% of total articles), comprising six SCPs (66.7%) and three MCPs (33.3%); Korea with nine papers (3.5% of total articles), consisting of eight SCPs (88.9%) and one MCP (11.1%); the United Kingdom (UK) with eight documents (3.1% of total published documents), comprising four SCPs (50%) and four MCPs (50%); and Saudi Arabia with only seven publications (2.7% of total papers), consisting of four SCPs (57.1%) and three MCPs (42.9%).
According to Frioui and Graa [37], the country with the most articles published was China, with a total of 98 papers, 79 of them SCPs and 19 MCPs, followed by India with 55 papers, including 49 SCPs and six MCPs, while the USA was third with 38 articles, consisting of 31 SCPs and seven MCPs. Also in the top 10 were the UK, Korea, Australia, Germany, Spain, France, and Greece. Compared with our results, half of the countries included in top 10 were common, with China being the most representative country in both cases, and the USA third. The differences could appear due to the different filters that were applied to dataset extraction.
Shabani et al. [46] investigated the scientific evolution and contribution of AI in the field of portfolio optimization, evaluating the most representative countries. Regarding the number of publications, China was in first place with a total of 233 papers, including 187 SCPs and 46 MCPs, followed by the USA with 78 articles, consisting of 57 SCPs and 21 MCPs, and India with 39 articles, including 36 SCPs and only three MCPs. The rest of the countries included in the top 10 were Korea, the UK, Iran, Canada, Brazil, Japan, and Italy. According to our results, there were numerous similarities with the paper published by Shabani et al. [46], with China being the most relevant country based on the number of publications and a total of eight countries in common.
Figure 13 focuses on the 10 most cited countries. In first place was China, with a total of 2415 citations, having a mean article citation count of 32.60, followed by the USA, with 421 citations and an average article citation count of 26.30. In third place was India, with 259 citations and an average article citation count of 28.80, while Iran had 205 citations and a mean article citation count of 22.80. The remaining countries had less than 200 citations: Brazil (195 citations, with a mean of 15.00 article citations), Malaysia (182 citations, with a mean of 60.70 article citations), Spain (144 citations, with a mean of 8.50 article citations), Germany (110 citations, with a mean of 18.30 article citations), France (109 citations, with a mean of 36.30 article citations) and Italy (108 citations, with a mean of 10.80 article citations).
Soliman et al. [51] evaluated the main trends and themes in AI that had been discussed by the academic community during the COVID-19 era, finding that China was the most cited country with 2874 citations, followed by the USA with 895 citations, the UK with 430 citations, Australia with 426 citations, Canada with 218 citations, France with 182 citations, Germany with 181 citations, South Korea with 169 citations, and Singapore with 164 citations. In total, the findings for four countries were similar to our results, with China being, in both cases, the most representative country, followed by the USA by a significant margin, while Germany and France stood out as relevant countries in the time series and AI domains.
Shabani et al. [46] found that China had the highest number of citations, with a total of 2169, followed by the USA with 1171, Brazil with 589, India with 500, and Singapore with 432. The remaining countries included in the top 10 were Korea, Greece, the UK, Spain, and Italy, highlighting that the findings for the majority of the countries were similar with our results, but at the same time, there were significant differences due to the different topics, timespan and focus of the research.
Figure 14 presents a map of scientific collaboration between countries. First, it should be mentioned that the blue color used for the countries in Figure 14 depicts the contribution of each country in the selected domain. Furthermore, the countries shaded in grey made no contribution to the selected field, according to the extracted dataset. Consequently, the density of the lines marked in red in Figure 14 symbolizes the intensity of the collaboration between two countries, measured by the number of papers written through collaboration between the two countries at the end of each line. Therefore, it can be observed that the most fruitful collaboration was between China and the USA, which together published a total of six papers, followed by China–Saudi Arabia with four documents, China–UK with four articles, and Saudi Arabia–Egypt, Saudi Arabia–Tunisia, and the USA–UK with three articles each; and Brazil–Italy, China–Australia, China–Canada, and China–Japan with two documents each.
To better understand the impact of countries in international collaboration, Table 4 contains the number of publications for the most representative 20 states in terms of number of publications. In first place was China with 42 articles, followed by the USA with 26 documents, the UK with 21 papers, and Spain and Saudi Arabia with 20 each. Among the remainder of the top-20 most productive countries listed in Table 4, Malaysia and Ireland were at the bottom, with only six papers each.

3.5. Mixed Analysis

This section focuses on the thematic evolution and analysis, noting the major topics that have been discussed by the academic community, at the same time highlighting the most frequently used Keywords Plus and author’s keywords. A detailed analysis of collaboration networks for the 30 most representative authors has been performed.
Figure 15 presents the 150 most used Keywords Plus grouped in multiple circles, based on the thematic context. In order to obtain the graph below, the minimum cluster frequency was set to 27. Two metrics are available in the thematic map: centrality, which expresses the impact of the keywords in the thematic context, investigating the external associations; and the density, which shows the degree of development, exploring the internal association of keywords in various thematic contexts [64]. The most representative cluster, colored in blue, on the bottom right part of the graph with a high centrality and a reduced density, contains information about ML algorithms and time series methods such as “prediction” (52 occurrences), “models” (41 occurrences), “models” (25 occurrences), “neural-networks” (40 occurrences), “algorithm” (20 occurrences), “optimization” (20 occurrences), “system” (19 occurrences), “time-series” (18 occurrences), and “regression” (16 occurrences). In the middle of the graph is a cluster colored in orange, with a medium density and centrality, referring to the ML networks: “machine” (10 occurrences) and “networks” (8 occurrences). The last cluster, in the top left part of the graph and highlighted in pink, contains two of the most used time series algorithms: “lstm” (8 occurrences) and “arima” (7 occurrences).
Figure 16 includes the 150 most representative keywords used by the main authors, grouped in four different themes. The minimum cluster frequency setting was set to 25. In the bottom right part of the graph is the most representative circle, highlighted in orange, referring to machine learning integration with time series and AI, featuring a high centrality and small density.
The most used keywords in the orange cluster are “artificial intelligence” (93 occurrences), “time series forecasting” (67 occurrences), “machine learning” (41 occurrences), “deep learning” (40 occurrences), “time series” (17 occurrences), “neural networks” (15 occurrences), “COVID-19” (13 occurrences), “explainable artificial intelligence” (11 occurrences), “artificial neural network” (9 occurrences), and “lstm” (8 occurrences). The second most relevant cluster is colored in pink and presents the time series analysis, together with forecasting, containing the following keywords: “forecasting” (39 occurrences), “time series” (17 occurrences), “time series analysis” (14 occurrences), “predictive models” (11 occurrences), “lstm” (8 occurrences), and “recurrent neural network” (8 occurrences). The last two clusters, colored in red and pink, have a relatively small centrality value, while the red circle has a higher density compared to the pink circle. The focus on the red circle is “time-series forecasting” (21 occurrences) and “neural network” (6 occurrences), while the pink circle contains “explainable artificial intelligence” (11 occurrences). Soliman et al. [51] performed a bibliometric analysis of the main themes of AI in the leading scientific journals during the COVID-19 pandemic, discovering that the main authors’ keywords were clustered in three groups, with the first cluster focusing on “training”, “deep learning”, and “classification”, the second cluster presenting “functions”, “uncertainty”, and “neural networks”, and the third cluster containing information about “robots”, “neurons”, and “computer simulation”. There are similarities between the existing literature and our results, COVID-19 being one of the main factors that contributed to the development of the fields, together with “neural networks” and “deep learning”, according to Soliman et al. [51]. At the same time, there are significant differences, which is normal, thanks to the different databases that were used, different software tools, different topics, and different time periods.
Figure 17 presents the thematic evolution for Keywords Plus, divided into three different periods: 1997–2015, 2016–2020, and 2021–2024. Between 1997 and 2015, the main topics discussed in the contexts of time series and AI were related to “neural networks” and “model”, while, starting in 2016, they evolved to “prediction”, “particle swarm optimization”, “classification”, “market”, “models”, and “artificial neural network”, demonstrating the development of the domains, making it more versatile. Between 2021 and 2024, the main focus of the researchers was on improving the prediction, since numerous models had been defined between 2016 and 2019. At the same time, the “artificial neural network” remained a key topic, together with “system” and “network”.
In their research, Romero-Riano et al. [65] defined the most used AI keywords between 2000 and 2020. Initially, the majority of terms were related to “optimization”, “prediction”, “models”, and “neural networks”, while researcher interest shifted during the timespan to a broader variety of topics, such as “complexity”, “agents”, “prediction”, “architecture”, and “behavior”.
Figure 18 includes a factorial analysis of the most frequently used 100 Keywords Plus, grouped in three clusters.
The blue cluster contains the majority of terms, which define the applicability of time series and AI: “wavelet transform”, “empirical mode decomposition”, “optimization”, “power”, “system”, “impact”, “runoff”, “river”, “streamflow”, and “reservoir system”, while the red cluster focuses on “artificial neural networks”, “genetic algorithms”, and “forecasting enrollments”. The last cluster, highlighted in green, encapsulates the strategies that should be taken into account: “optimal operation”, “basin”, “synchronization”, “strategies”, and “intelligence”.
Articles that investigated the time series forecasting and AI domains were evaluated to compare the results with the existing literature, and Romero-Riano et al. [65] grouped the keywords into multiple clusters, with one focusing on “wavelet transform”, “decomposition”, “memory”, and “validation, another cluster exploring “genetic algorithms”, “regression”, “svm”, and "prediction”, and the last cluster focusing on “reliability” and “complexity”.
According to Sarikoc [66], the most frequently used keywords were “artificial neural network”, “runoff”, “neural networks”, “forecasting”, “hydrological modeling”, “artificial intelligence”, “stream flow” and “prediction”. Comparing our results with the existing literature, there are similarities for the majority of keywords, but at the same time, there are differences due to the analyzed timespan or the domain the articles focusing on.
Figure 19 illustrates a factorial analysis for the most representative 100 bigrams used in abstracts, grouped into two clusters. The blue cluster contains terms referring to time series and AI algorithms: “AI techniques”, “deep learning”, “memory lstm”, “energy consumption”, “regression svr”, “machine learning”, “forecasting accuracy”, “convolutional neural”, and “time series”, while the red cluster, which is smaller, contains information about the time series and AI error metrics, such as “percentage error”, “error rmse”, “squared error”, “absolute error”, and “error mape”.
Palomero et al. [43] evaluated the time series forecasting and modeling domain using a bibliometric analysis. The most relevant keywords discovered were divided into multiple groups: “mean square error”, “root mean square errors”, and “mean absolute percentage error”, while the second group focused on “deep neural networks”, “time series forecasting”, “prediction”, “long short-term memory”, and “artificial neural network”.
Loan et al. [67] investigated the applied artificial intelligence of an international journal using a bibliometric approach, discovering that “model”, “system”, “neural networks”, “artificial neural networks”, and “genetic algorithms” were the most representative terms. Our outcome correlates with the existing literature results, which confirm that the approach was correct, but at the same time, there were significant differences, which makes sense, due to the database differences, time period, and fields that were investigated.
Figure 20 presents the 30 most relevant authors, grouped into five clusters. The most representative cluster is colored in blue, and it contains six authors: Niu W.J., Feng Z.K., Xu Y.S., ChenJ., Feng B.F., and Cheng C.T. The focus of the authors was on AI algorithms for hydrological time series analysis, using parallel and swarm intelligence methods, signal decomposition, twin support vector machine, and river flow time series analysis using artificial neural networks for humid and semi-humid regions [68,69,70,71].
The second cluster, colored in red, is represented by four authors: Carpinteiro O.A.S., Pinheiro C.A.M., Carpinteiro O.A., and Faustino C.P. The main topics discussed by the researchers incorporated financial prediction using support vector regression, improving the accuracy of fuzzy forecasting of fuzzy c-means, explaining the rough sets, and testing time series algorithms for improving the prediction rate [9,72,73,74].
The third group, delimited in green, is formed by five authors: Wang Y., Wang J.Z., Li H.M., Jiang P., and Yang H.F., who focused mainly on predicting traffic accident economic loss and air pollution, wind speed prediction using defuzzificaition, and multi-objective optimization methods, energy consumption forecasting, and air quality prediction with nonlinear robust outliers and fuzzy sets [75,76,77,78].
The fourth cluster, highlighted in purple, contains three authors: Egrioglu E., Bas E., and Kocak C., who explored Istanbul stock market prediction using fuzzy time series methods, ARMA, artificial neural networks, and fuzzy time-series evaluation [79,80,81].
The fifth cluster, colored in yellow, is formed by four authors: Bueno-Crespo A., Cecilia J.M., Martinez-Espana R., and Morales-Garcia J. The main subjects explored by these authors were machine learning models for operational smart greenhouses, evaluation of smart greenhouses, evolution of low-power devices, and the investigation of data generated by intelligent climate control of greenhouses [82,83,84].
Based on the mixed analysis, the major topics discussed in the analyzed papers were related to artificial neural network algorithms, deep learning models, long short-term memory algorithms, random forest, support vector machines, recurrent neural networks, network CNN, explainable AI, vector regression, and support vector regression. At the same time, the main steps of AI and ML implementation were presented, such as data processing, learning methods from historical data, forecasting, and accuracy estimation. The last step was also explained by the following terms: squared error, absolute percentage error, absolute error, root mean squared error, and mean absolute percentage error.
The main domains were the time series algorithms and AI, focusing on energy consumption, climate change, stock analysis, decision making, and wind power estimation.

4. Discussion and Limitations

The Section 4 discusses the results, together with the existing limitations of the research.

4.1. Bibliometric Research Summary

The bibliometric approach presented in this paper evaluated the development of time series forecasting and AI domains from the beginning of the period in which papers have been written and indexed in the WoS database, including the first paper published in 1997, which had an impact if we take into consideration the number of citations. Thanks to technological and scientific developments, it became easier to investigate the topics, and a positive trend was observed in the number of publications, especially in recent years. As observed during the bibliometric analysis process, a series of results, such as the most impactful sources, were also identified in similar studies from the field, underlining once more the stability of the selected research field over time.
To demonstrate the outcome, the research addressed several scientific questions in the first chapter of the paper, to which, during the analysis, answers have been provided. First, it was observed that the collaboration network among the 30 most representative authors could be presented in five different clusters, each one focusing on different topics related to time series forecasting and artificial intelligence. Niu W.J., Feng Z.K., Xu Y.S., Feng B.F., Chen J., and Cheng C.F. explored hydrological time series prediction. Carpinteiro O.A.S., Pinheiro C.A.M., Faustino C.P., and Carpinteiro O.A. evaluated the time series and artificial intelligence algorithms for financial predictions. Yang H.F., Wang Y., Jiang P., Li H.M., and Wang J.Z. focused on traffic accident loss and air pollution estimations, while Egrioglu E., Bas E., and Kocak C. presented Istanbul stock market prediction using time series algorithms. Morales-Garcia J., Bueno-Crespo A., Martinez-Espana R., and Cecilia J.M. described smart greenhouse methods for the evaluation of low-power devices.
Second, the main topics extracted during the scientific research present the methods and domains where time series and artificial intelligence have been successfully implemented. The algorithms that have been implemented often were “lstm”, “neural networks”, “support vector regression”, “ARIMA”, “particle swarm optimization”, and “regression”, with great success especially in the hydrological, financial, and environmental fields, where the prediction of future values stands out as a key factor in the evolution of these domains.
In terms of the most representative countries based on the number of publications and citations, the following countries were ranked at the top: China with 74 articles and 2415 citations, followed by Spain with 17 documents and 144 citations, the USA with 16 articles and 421 citations, Brazil with 13 documents and 195 citations, Italy with 10 documents and 108 citations, India with 9 papers and 259 citations, Iran with 9 articles and 205 citations, Korea with 9 documents and 17 citations, the UK with 8 articles and 75 citations, and Saudi Arabia with 7 papers and 52 citations.
The 10 most cited documents explore the implementation of new methods of time series and artificial intelligence using adaptive neural-based fuzzy systems or genetic programming for monthly river flow discharges, oil production estimation using LSTM, and prediction of the number of tourists with ARIM or Elman’s Model of Artificial Neural Networks. At the same time, detailed analyses were provided for electricity, energy consumption, and urban traffic flow, implementing multiple methods in order to obtain high accuracy and a reduced error rate.
The sources with the highest impact based on the number of publications were IEEE Access with 11 documents, Energies with 9 articles, Mathematics with 7 papers, Applied Sciences-Basel with 6 papers, and Applied Energy, Energy, Knowledge-Based Systems, Sensors, and Sustainability with 5 documents each.
The main keywords used by the authors on time series forecasting and artificial intelligence topics refer to the main algorithms that have been implemented, such as “ARIMA”, “LSTM”, “regression”, “neural-networks”, and “artificial neural network”, or present the main factors that contributed to the evolution of the fields, such as “COVID-19”, “uncertainty”, “optimization”, “strategies”, and “impact”.

4.2. Discussion of Specific Topics

In this section, the focus is on analyzing the main topics where time series and AI have been successfully implemented, presenting also five of the most representative articles from each field.

4.2.1. Implications of Time Series Forecasting and Artificial Intelligence in the Energy and Electricity Sector

The energy and electricity topics have become more and more relevant not only for the academic community, but also for stakeholders and governments, since it is crucial now to provide sustainable and affordable sources of energy and power for the population. Using time series and AI, an estimation of production and consumption levels can be achieved.
Estimates of solar energy production have been explored by Al-Ali et al. [85], implementing a combination of algorithms, convolutional neural networks (CNN), LSTM, and a transformer, due to the evolution of AI and time series, which now facilitate this approach. The Fingrid open dataset was extracted for training and testing the model, and the outcome demonstrated high efficiency. The results were compared with existing methods, and the accuracy of the hybrid algorithm was higher, positioning it as a new technique that could be integrated into the solar energy domain.
Power system safety and stability represent crucial aspects for short-term electricity load time and, according to Niu et al. [86], electricity demand is marked by high randomness and volatility, with the consumption levels being almost impossible to predict with traditional algorithms. The objective of the authors was to define a machine learning model capable of creating an empirical decomposition that would be divided into subcomponents, and, using a support vector machine and cooperation search algorithm, an estimation of the short-term load data would be performed. A case study has been performed on provincial grid centers in China, showing great results compared to conventional algorithms.
The sustainable development of the environment and economy is a key topic that was discussed by Jiang et al. [77], and considers energy consumption a key element. The scope of the research was focused on fuzzy time series and fuzzy c-means clustering for fuzzification and to predict energy consumption using the previous algorithms. The outcome confirms the good stability and accuracy of the algorithms, which are able to predict the structure of energy consumption in an optimal manner.
A dynamic transformer for energy power prediction has been developed by Zhou et al. [87], as power estimation is considered to be one of the key elements nowadays for carbon neutrality. Thanks to AI algorithms that have been recently developed, predictions can now be achieved more easily. The authors proposed a dynamic self-differential transformer method (Diformer) that can be used for univariate time series analysis and predictions. The algorithm has been tested on six power time series datasets related to the energy and power domain, showing great results and metrics and outperforming existing models.
The prediction of energy consumption using time series data was discussed by Hamdoun et al. [88], focusing on an analytical evaluation of artificial intelligence, deep learning, and machine learning algorithms that are used for energy consumption estimation and at the same time on implementing the methods in real use cases, extracting datasets related to natural gas, electric power, or energy consumption. The authors underlined the main challenges and potential developments for the research, emphasizing the importance of deep learning and machine learning algorithms in the energy sector.
Based on the descriptions provided above for the five most representative papers on energy and electricity areas, the main applicability of time series and AI is focused in the estimation of energy consumption [77,88], energy power prediction [87], short-term loads [86], and solar energy production [85].

4.2.2. Implications of Time Series Forecasting and Artificial Intelligence for Tourism and Economic Activities

The impact of time series forecasting and artificial intelligence on economic activities will be discussed further, investigating five relevant papers.
An evaluation of portfolio management using time series and AI was accomplished by Bareith et al. [89], who also took inflation into account. The scope of the research was focused on using AI to predict the inflation rate and stock index evolution and to define a portfolio of indexes that would protect investments against inflation. Two algorithms were tested: Long Short-Term Memory (LSTM), Gated Recurrent Unit (GRU), and a hybrid model that contained both algorithms for inflation forecasting. The outcome showed that errors in inflation rate forecasting account for a quarter of stock market index estimation, recommending investments in the national economy for economic rebalancing.
A forecast for sustainable tourism in Saudi Arabia was performed by Louati et al. [90], who investigated the behavior of tourists during the COVID-19 pandemic. The dataset was obtained from the Saudi Tourism Authority and contained information from 2015 through 2021. Multiple AI algorithms, such as K-Neighbors Classifiers, Gaussian Naïve Bayes, Support Vector Classifiers, Decision Trees, ARIMA, and Random Forests, were tested. The results portrayed a positive trend in the number of tourists, providing insights regarding future decisions and plans for sustainable development of the tourism sector. The mean expenditure of tourists was estimated as SAR 89,443 per trip, with a value of SAR 9198 per night, according to the statistical tests that were performed.
The LSTM algorithm was implemented by Zhang et al. [91] for time series forecasting in the tourism sector, focusing on daily consumer and tourist datasets from Jiuzhaigou, a popular tourist attraction in China, containing information for the period from 8 October 2013 to 7 August 2017. A prediction for the next 150 days was performed, obtaining good results according to statistical metrics that had been applied for training and testing, with the authors confirming that LSTM stands as one of the most suitable models for tourism prediction.
Supply chain management is one of the main elements of the economic sector in each country, and it is crucial in predicting future sales with high accuracy. Sohrabpour et al. [92] proposed a framework using Genetic Programming, an AI model that estimates export sales for the next 6 weeks. A causal estimation was included, facilitating extraction of the behavior between features, together with the previous trends and behavior. A variable sensitivity analysis was performed for the algorithm, and the results were compared with real sales data.
Economic recession was the focus of Tang et al. [93], who also included share prices in the logistics sector for the purpose of improving decision-making and estimating future share prices in the logistics industry. The LSTM algorithm was tested on historical data from five logistics companies in Hong Kong. The Mean Absolute Percentage Error (MAPE) and Root Mean Square Error (RMSE) were the metrics used, demonstrating that LSTM can efficiently predict future share prices. The LSTM model was trained with multiple hyperparameters, and the optimum algorithm obtained an RMSE value of 0.43%. Economic recession forecasts were performed using the stock predictions and LSTM model.
Based on the scientific approaches discussed above, time series forecasting and AI have significant implications for economic activities, and their use is being sought more and more by stakeholders for predicting the number of tourists [90,91], stock price trends [89,93], and sales trends [92].

4.2.3. Implications of Time Series Forecasting and Artificial Intelligence for Hydrologic Predictions

The hydrologic domain has recently adopted time series forecasting and AI, thanks to technological developments that facilitate their implementation in a variety of fields. Five of the most representative papers on the implementation of time series forecasting and AI in the hydrological field will be discussed.
Streamflow prediction was discussed by Feng et al. [94], who developed an algorithm that estimates the nonlinear streamflow for hydrological stations in China. A parallel cooperation search algorithm (PCSA) and extreme learning machine (ELM) were tested. The PCSA method was optimized with multiple input-hidden weights and biases, obtaining better results than the ELM model. Initially, a large population was stored, then divided into multiple subswarms that would be further investigated using the PCSA algorithm.
The domain of water resource management is very sensitive to disasters, and it is crucial to optimally predict the hydrologic metrics in order to minimize risks. Christian et al. [95] explored multiple time series algorithms, a support vector machine, and a seasonal autoregressive moving average (SARIMA) for estimation of Pemali River Basin discharges in Indonesia. Using an autocorrelation function (ACF), the analysis demonstrated a correlation between historical values up to 12 months prior, which facilitated the prediction of future values and reduced the risks.
In the hydrological domain, a crucial step is to optimally predict the streamflow. Yaseen et al. [96] investigated the literature and implemented the non-tuned machine learning algorithm ELM. The model’s effectiveness and reliability were tested on predicting one-step-ahead streamflow of the Johor River in Malaysia, using three time-scale datasets (daily, average weekly, and average monthly). The outcome demonstrated that ELM has higher accuracy than an artificial neural network (ANN) algorithm, with a higher R2 value (0.94 compared to 0.90 for ANN) and a lower RMSE (2.78 compared to 11.63) and MAE (0.10 compared to 0.43). The authors recommended the ELM algorithm for streamflow prediction.
Using a Least-Squares Support Vector Machine algorithm, decomposition reconstruction, and swarm intelligence, Niu et al. [97] developed an improved method for hydrologic time series prediction. Four indexes that contained monthly information on two hydrologic stations in China were analyzed, resulting in multiple scenarios. The hybrid algorithm that contained signal swarm intelligence and decomposition reconstruction provided optimum results, improving the accuracy with an RMSE of 58.9%, compared to support vector machine and neural network algorithms.
Water wave oscillation, a topic in the hydrological domain, was evaluated by Sang et al. [98], detailing the preprocessing, modeling, and problems regarding wavelet analysis, such as the choice of mother wavelet, selection of temporal scale, uncertainty evaluation of the predicted wavelet, and differences between discrete and continuous wavelet methods. The authors explained the key differences between continuous and discrete wavelet algorithms, when they can be implemented, and what the main advantages are with time series forecasting, also taking into consideration the uncertainty.
The hydrological domain benefits from AI models, which facilitate the implementation of solutions that predicts water wave oscillation, hydrologic prediction [97,98], streamflow [94,96], and discharge estimation [95].
Nevertheless, apart from the areas of applicability for time series forecasting and artificial intelligence, a focused discussion should be conducted on the evaluation metrics considered in these cases. Even though a wide range of statistical metrics are commonly employed, including Mean Squared Error (MSE), Root Mean Squared Error (RMSE), Mean Absolute Error (MAE), Mean Absolute Percentage Error (MAPE), and the coefficient of determination (R2), distinct attention should be given to the inconsistencies that may arise in model performance assessment due to the different sensitivities and mathematical properties of each metric. As Mishra et al. [99] pointed out, even though some of these metrics are well-known and widely used in evaluating the predictive accuracy of the models, attention should be paid to various issues such as non-convergent assessments that might derive from the fact that different methods favor or penalize models when outliers are encountered. Furthermore, as Zhou et al. [100] showed, RMSE is more suitable for scenarios in which large errors are of primary concern, as the metric squares them; MAE is more appropriate for cases in which large errors should not be unduly penalized; MAPE emphasizes the importance of relative errors, while R2 evaluates the model’s ability to explain the variation in the dependent variable. As a result, in the scientific literature, recently, heavy emphasis has been placed on using composite measures that combine RMSE, MAE, MAPE, and R2 and offer a more balanced approach to model evaluations [100].

4.3. Limitations

This research faced several limitations that could have had an impact on the obtained results, most of them related to the process of dataset extraction.
The main limitation is the inclusion of only one database, namely WoS, into the analysis. The argument for taking into consideration only one database was based on the prestige of WoS, which offers a variety of sources, according to papers in the academic community that also had been investigated before the decision was made. The indexes that are very popular, such as Social Sciences Citations Index (SSCI) or Science Citation Index Expanded (SCIE), are part of the WoS database, providing a robust analysis of the citations. At the same time, the Keywords Plus [30] variable is offered by WoS and identifies the terms derived from the references in the document, highlighting the scope of the analysis, a feature that is not offered by other databases. In order to further support the choice for a single database for the bibliometric analysis, a fact that should also be stated is that using multiple databases would have interfered with the analysis conducted in terms of the number of citations, as it would have been hard to decide which database to use for these analyses because various situations might arise, such as papers missing from one or another database or duplicated in multiple databases. To support this point of view, in Table 5, we included the number of citations recorded for the five most cited papers included in the dataset, according to each database.
Furthermore, it should be mentioned that, as access to the WoS database is based on a paid subscription, the resulting dataset might be different depending on the level of the subscription. As stated at the beginning of the paper, in this case, we had access to all 10 indexes offered by WoS.
The exclusion of any other language apart from English stands as a constraint for the research, limiting the temporal coverage of papers. The decision to include only English language papers was intentional, in order to have a relevant n-grams and themes analysis. At the same time, we were restricted to English due to the lack of proficiency in any other languages. In our case, only three papers among those initially extracted were published in a language other than English, showing that the decision to exclude papers in other languages would not affect the outcome in a decisive manner.
The software tool that was used for the bibliometric approach, the Biblioshiny library from the R programming language, is a popular tool used, together with VOSViewer for analysis of specific datasets extracted from databases [41]. For example, Biblioshiny is able to analyze Scopus, Dimensions, Cochrane Library, WoS, Lens, and PubMed, while VOSViewer is able to work with Lens, Scopus, WoS, PubMed and Dimensions [101].
The inclusion of only the documents that were marked as “Article” in the WoS database [102] represents another limitation, but the step was mandatory in order to obtain a representative comparison among papers from the number of citations and content perspectives.
Lastly, somewhat different results might be obtained if the steps provided in the paper are slightly different when selecting the dataset.

5. Conclusions

This research focuses on the main elements of a bibliometric analysis of the time series forecasting and artificial intelligence fields, presenting the evolution from 1997 to 2024. The major factor that aided the evolution of these domains was technological advancement, and the analysis that we performed highlights the main papers, authors, sources, collaborative networks, and thematic maps.
Therefore, in terms of collaboration networks among authors in the selected research areas, it was observed that the 30 most representative authors based on the number of publications were grouped into five major clusters addressing various research topics, such as hydrological time series prediction; the evaluation of time series and artificial intelligence algorithms on financial predictions; traffic accident loss and air pollution estimations; stock market predictions using time series algorithms; and smart greenhouse methods for the evaluation of low-power devices.
The analysis of the most used keywords, main topics, and most cited documents revealed interests in various research areas such as environmental and hydrological forecasting, energy consumption and electricity demand modeling, oil production estimation, tourism demand forecasting, and urban traffic flow analysis. These areas often rely on advanced time series forecasting techniques and artificial intelligence methods, including adaptive neuro-fuzzy systems, genetic programming, ARIMA models, LSTM networks, and Elman’s recurrent neural networks.
Lastly, the sources with the highest impact were extracted, as well as the most representative countries and authors considering the number of publications.
Based on the papers included in the dataset, some research directions that were highlighted related to the use of time series forecasting and artificial intelligence in the energy and electricity sector, in tourism and economic activities, as well as in hydrologic predictions. Considering the works in the above mentioned fields, it was noticed that the main areas of applicability for time series forecasting and AI were in energy consumption estimation [77,88], energy power prediction [87], short-term load [86], solar energy production [85], prediction of water wave oscillations, hydrologic prediction [97,98], stream-flow [94,96] and discharge estimation [95], and in forecasting the number of tourists [90,91], stock prices [89,93], and sales trends [92].
The research community associated with the time series forecasting and artificial intelligence research areas can benefit from the results presented in this paper by gaining a general view on the evolution of the field, a better understanding of the main areas of research that have captured the interest of researchers—highlighted by the most cited works from the field, as well as by easily identifying the journals that have been dedicated to works in the field. In terms of authors, the most prominent authors have been presented, which might help the interested parties in easily following the research conducted by these authors. Furthermore, by discussing some of the research directions in various fields, as well as the main themes, the interested parties can orient their research into the emerging or motor themes.
While the process of article information collection has improved significantly in recent years, there are still some inherent limitations that could have impacted the outcome of the analysis, such as the filtering terms used for dataset collection, together with the restrictions applied over the data, such as the inclusion of only English papers that were marked as “Article” in WoS and not published in 2025. At the same time, the decision to include only the WoS database in the analysis could have had an impact on the results of the research, but the decision was adopted based on an investigation of the existing academic literature. The graphical representation of the data could also represent a limitation, as only some of the results were provided, generally those referring to the top or the most prominent results.
Future research in time series forecasting and artificial intelligence could continue the exploration of scientific articles, extracting the outcomes from a wider variety of databases and comparing the results with other software tools. At the same time, a comparative analysis of algorithm performance could be achieved by testing the models on various datasets from different domains in order to classify them. The current integration of time series forecasting and artificial intelligence into the activities of stakeholders and individuals is a reality that should be noticed by the academic community.

Author Contributions

Conceptualization, A.D., P.D. and C.D.; Data curation, A.D., P.D. and C.D.; Formal analysis, A.D., P.D. and C.D.; Investigation, A.D., P.D. and C.D.; Methodology, A.D. and C.D.; Project administration, P.D. and C.D.; Resources, C.D.; Software, A.D.; Supervision, C.D.; Validation, A.D. and P.D.; Visualization, A.D., P.D. and C.D.; Writing—original draft, A.D.; Writing—review and editing, P.D. and C.D. All authors have read and agreed to the published version of the manuscript.

Funding

The work is supported by a grant of the Romanian Ministry of Research, Innovation and Digitalization, project CF 178/31.07.2023—‘JobKG—A Knowledge Graph of the Romanian Job Market based on Natural Language Processing’.

Institutional Review Board Statement

Not applicable.

Informed Consent Statement

Not applicable.

Data Availability Statement

The original contributions presented in the study are included in the article, further inquiries can be directed to the corresponding author.

Conflicts of Interest

The authors declare no conflicts of interest.

Abbreviations

ABabstract
ACFautocorrelation function
AIArtificial Intelligence
AKauthors’ keywords
ANNartificial neural network
ARautoregressive models
ARIMAautoregressive integrated moving average
A&HCIArts and Humanities Citation Index
BKCI-SBook Citation Index-Science
CCRCurrent Chemical Reactions
CNNConvolutional Neural Networks
CPCI-SConference Proceedings Citation Index—Science
DBNDynamic Bayesian Networks
DIFORMERdynamic self-differential transformer method
EANNemotional artificial neural network
ELMextreme learning machine
ESCIEmerging Sources Citations Index
GARCHgeneralized autoregressive conditional heteroscedasticity
GEPgene expression programming
GRUGated Recurrent Unit
ICIndex Chemicus
LSSVMleast square support vector machine
LSTMLong Short-Term Memory
LSTM-RNNLong-Short Term Memory Recurrent Neural Network
MAmoving average
MAEmean absolute error
MAPEmean absolute percentage error
MARSmultivariate adaptive regression splines
MCPMultiple-Country Publications
MLmachine learning
MLPmultilayer perception
MLRmultiple linear regression
NRMSEnormalized root mean square error
NTCnormalized total citations
PCSAParallel cooperation search algorithm
PGMprobabilistic graphical models
PRISMAPreferred Reporting Items for Systematic Reviews and Meta-Analysis
RFrandom forests
RMSEroot mean squared error
SARIMAseasonal autoregressive integrated moving average
SCIEScience Citation Index Expanded
SCPSingle-Country Publications
SETARself-exciting threshold autoregressive
SOMSelf-organizing Maps
SSCISocial Sciences Citations Index
SVMsupport vector machine
TCtotal citations
TCYtotal citations per year
TItitles
UKUnited Kingdom
USAUnited States of America
WIWillmott Index
WoSClarivate Analytics’ Web of Science Core Collection database

References

  1. Abbass, H. Editorial: What Is Artificial Intelligence? IEEE Trans. Artif. Intell. 2021, 2, 94–95. [Google Scholar] [CrossRef]
  2. Lim, B.; Zohren, S. Time-Series Forecasting with Deep Learning: A Survey. Philos. Trans. R. Soc. A Math. Phys. Eng. Sci. 2021, 379, 20200209. [Google Scholar] [CrossRef] [PubMed]
  3. Yang, J.; Gong, P.; Fu, R.; Zhang, M.; Chen, J.; Liang, S.; Xu, B.; Shi, J.; Dickinson, R. Erratum: The Role of Satellite Remote Sensing in Climate Change Studies. Nat. Clim. Change 2013, 3, 1001. [Google Scholar] [CrossRef]
  4. Naciri, H.; Ben Achhab, N.; Ezzaher, F.E.; Raissouni, N. AIRS: A QGIS Plugin for Time Series Forecasting Using Deep Learning Models. Environ. Model. Softw. 2024, 177, 106045. [Google Scholar] [CrossRef]
  5. Fathian, F.; Mehdizadeh, S.; Kozekalani Sales, A.; Safari, M.J.S. Hybrid Models to Improve the Monthly River Flow Prediction: Integrating Artificial Intelligence and Non-Linear Time Series Models. J. Hydrol. 2019, 575, 1200–1213. [Google Scholar] [CrossRef]
  6. Aghelpour, P.; Varshavian, V. Evaluation of Stochastic and Artificial Intelligence Models in Modeling and Predicting of River Daily Flow Time Series. Stoch. Environ. Res. Risk Assess. 2020, 34, 33–50. [Google Scholar] [CrossRef]
  7. Mehdizadeh, S.; Fathian, F.; Safari, M.J.S.; Adamowski, J.F. Comparative Assessment of Time Series and Artificial Intelligence Models to Estimate Monthly Streamflow: A Local and External Data Analysis Approach. J. Hydrol. 2019, 579, 124225. [Google Scholar] [CrossRef]
  8. Wang, M.; Qin, F. A TCN-Linear Hybrid Model for Chaotic Time Series Forecasting. Entropy 2024, 26, 467. [Google Scholar] [CrossRef]
  9. Faustino, C.P.; Pinheiro, C.A.M.; Carpinteiro, O.A.; Lima, I. Time Series Forecasting through Rule-Based Models Obtained via Rough Sets. Artif. Intell. Rev. 2011, 36, 299–310. [Google Scholar] [CrossRef]
  10. Bas, E.; Egrioglu, E.; Cansu, T. Robust Training of Median Dendritic Artificial Neural Networks for Time Series Forecasting. Expert Syst. Appl. 2024, 238, 122080. [Google Scholar] [CrossRef]
  11. Edalatpanah, S.A.; Hassani, F.S.; Smarandache, F.; Sorourkhah, A.; Pamucar, D.; Cui, B. A Hybrid Time Series Forecasting Method Based on Neutrosophic Logic with Applications in Financial Issues. Eng. Appl. Artif. Intell. 2024, 129, 107531. [Google Scholar] [CrossRef]
  12. Kocian, A.; Massa, D.; Cannazzaro, S.; Incrocci, L.; Di Lonardo, S.; Milazzo, P.; Chessa, S. Dynamic Bayesian Network for Crop Growth Prediction in Greenhouses. Comput. Electron. Agric. 2020, 169, 105167. [Google Scholar] [CrossRef]
  13. Li, C.; Mahadevan, S.; Ling, Y.; Choze, S.; Wang, L. Dynamic Bayesian Network for Aircraft Wing Health Monitoring Digital Twin. AIAA J. 2017, 55, 930–941. [Google Scholar] [CrossRef]
  14. Fan, H.; Jia, H.; He, X.; Lyu, J. Navigating Uncertainty: A Dynamic Bayesian Network-Based Risk Assessment Framework for Maritime Trade Routes. Reliab. Eng. Syst. Saf. 2024, 250, 110311. [Google Scholar] [CrossRef]
  15. Guo, J.; Ma, K. Risk Analysis for Hazardous Chemical Vehicle-Bridge Transportation System: A Dynamic Bayesian Network Model Incorporating Vehicle Dynamics. Reliab. Eng. Syst. Saf. 2024, 242, 109732. [Google Scholar] [CrossRef]
  16. Delcea, C.; Oprea, S.-V.; Dima, A.M.; Domenteanu, A.; Bara, A.; Cotfas, L.-A. Energy Communities: Insights from Scientific Publications. Oecon. Copernic. 2024, 15, 1101–1155. [Google Scholar] [CrossRef]
  17. Block, J.H.; Fisch, C. Eight Tips and Questions for Your Bibliographic Study in Business and Management Research. Manag. Rev. Q. 2020, 70, 307–312. [Google Scholar] [CrossRef]
  18. Sandu, A.; Ioanăș, I.; Delcea, C.; Florescu, M.-S.; Cotfas, L.-A. Numbers Do Not Lie: A Bibliometric Examination of Machine Learning Techniques in Fake News Research. Algorithms 2024, 17, 70. [Google Scholar] [CrossRef]
  19. Sandu, A.; Cotfas, L.-A.; Stănescu, A.; Delcea, C. A Bibliometric Analysis of Text Mining: Exploring the Use of Natural Language Processing in Social Media Research. Appl. Sci. 2024, 14, 3144. [Google Scholar] [CrossRef]
  20. Sandu, A.; Cotfas, L.-A.; Delcea, C.; Crăciun, L.; Molănescu, A.G. Sentiment Analysis in the Age of COVID-19: A Bibliometric Perspective. Information 2023, 14, 659. [Google Scholar] [CrossRef]
  21. WoS Web of Science. Available online: http://webofknowledge.com (accessed on 10 October 2024).
  22. Ciuverca, A.-C.-D.; Oprea, S. The Influence of AI on Price Forecasting. The View of the Academic Community. JBEM 2025, 26, 231–254. [Google Scholar] [CrossRef]
  23. Întorsureanu, I.; Oprea, S.-V.; Bâra, A.; Vespan, D. Generative AI in Education: Perspectives Through an Academic Lens. Electronics 2025, 14, 1053. [Google Scholar] [CrossRef]
  24. Oprea, S.-V.; Bâra, A. Generative Literature Analysis on the Rise of Prosumers and Their Influence on the Sustainable Energy Transition. Util. Policy 2024, 90, 101799. [Google Scholar] [CrossRef]
  25. Cișmașu, I.-D.; Cibu, B.R.; Cotfas, L.-A.; Delcea, C. The Persistence Puzzle: Bibliometric Insights into Dropout in MOOCs. Sustainability 2025, 17, 2952. [Google Scholar] [CrossRef]
  26. Sandu, A.; Cotfas, L.-A.; Stănescu, A.; Delcea, C. Guiding Urban Decision-Making: A Study on Recommender Systems in Smart Cities. Electronics 2024, 13, 2151. [Google Scholar] [CrossRef]
  27. Bakır, M.; Özdemir, E.; Akan, Ş.; Atalık, Ö. A Bibliometric Analysis of Airport Service Quality. J. Air Transp. Manag. 2022, 104, 102273. [Google Scholar] [CrossRef]
  28. Koca, T.T. Bibliometric Analysis of “Sarcopenia” in Web of Science. Egypt. Rheumatol. Rehabil. 2023, 50, 26. [Google Scholar] [CrossRef]
  29. Singh, V.K.; Singh, P.; Karmakar, M.; Leta, J.; Mayr, P. The Journal Coverage of Web of Science, Scopus and Dimensions: A Comparative Analysis. Scientometrics 2021, 126, 5113–5142. [Google Scholar] [CrossRef]
  30. Clarivate. KeyWords Plus Generation, Creation, and Changes. Available online: https://support.clarivate.com/ScientificandAcademicResearch/s/article/KeyWords-Plus-generation-creation-and-changes?language=en_US (accessed on 2 March 2024).
  31. Liu, F. Retrieval Strategy and Possible Explanations for the Abnormal Growth of Research Publications: Re-Evaluating a Bibliometric Analysis of Climate Change. Scientometrics 2023, 128, 853–859. [Google Scholar] [CrossRef]
  32. Liu, W. The Data Source of This Study Is Web of Science Core Collection? Not Enough. Scientometrics 2019, 121, 1815–1824. [Google Scholar] [CrossRef]
  33. Sarkis-Onofre, R.; Catalá-López, F.; Aromataris, E.; Lockwood, C. How to Properly Use the PRISMA Statement. Syst. Rev. 2021, 10, 117. [Google Scholar] [CrossRef] [PubMed]
  34. Khin Khin Oo, N.C.; Rakthin, S. Integrative Review of Absorptive Capacity’s Role in Fostering Organizational Resilience and Research Agenda. Sustainability 2022, 14, 12570. [Google Scholar] [CrossRef]
  35. Pham, X.-L.; Le, T. Bibliometric Analysis and Systematic Review of Research on Expert Finding: A PRISMA-Guided Approach. Int. Arab J. Inf. Technol. 2024, 21, 661–674. [Google Scholar] [CrossRef]
  36. Peixoto, B.; Pinto, R.; Melo, M.; Cabral, L.; Bessa, M. Immersive Virtual Reality for Foreign Language Education: A PRISMA Systematic Review. IEEE Access 2021, 9, 48952–48962. [Google Scholar] [CrossRef]
  37. Frioui, S.; Graa, A. Bibliometric Analysis of Artificial Intelligence in the Scope of E-Commerce: Trends and Progress over the Last Decade. Manag. Econ. Rev. 2024, 9, 5–24. [Google Scholar] [CrossRef]
  38. Bawack, R.E.; Wamba, S.F.; Carillo, K.D.A.; Akter, S. Artificial Intelligence in E-Commerce: A Bibliometric Study and Literature Review. Electron. Mark. 2022, 32, 297–338. [Google Scholar] [CrossRef] [PubMed]
  39. Ofer, D.; Kaufman, H.; Linial, M. What’s next? Forecasting Scientific Research Trends. Heliyon 2024, 10, e23781. [Google Scholar] [CrossRef]
  40. Vincent-Lancrin, S. What Is Changing in Academic Research? Trends and Futures Scenarios. Eur. J. Educ. 2006, 41, 169–202. [Google Scholar] [CrossRef]
  41. Aria, M.; Cuccurullo, C. Bibliometrix: An R-Tool for Comprehensive Science Mapping Analysis. J. Informetr. 2017, 11, 959–975. [Google Scholar] [CrossRef]
  42. Monroy, S.E.; Diaz, H. Time Series-Based Bibliometric Analysis of the Dynamics of Scientific Production. Scientometrics 2018, 115, 1139–1159. [Google Scholar] [CrossRef]
  43. Palomero, L.; García, V.; Sánchez, J.S. Fuzzy-Based Time Series Forecasting and Modelling: A Bibliometric Analysis. Appl. Sci. 2022, 12, 6894. [Google Scholar] [CrossRef]
  44. Wang, W.-C.; Chau, K.-W.; Cheng, C.-T.; Qiu, L. A Comparison of Performance of Several Artificial Intelligence Methods for Forecasting Monthly Discharge Time Series. J. Hydrol. 2009, 374, 294–306. [Google Scholar] [CrossRef]
  45. Chen, Y.; Wang, W.; Chen, X.M. Bibliometric Methods in Traffic Flow Prediction Based on Artificial Intelligence. Expert Syst. Appl. 2023, 228, 120421. [Google Scholar] [CrossRef]
  46. Shabani, M.; Ghousi, R.; Mohammadi, E. Exploring the Evolution of Scientific Publication on Portfolio Optimization in the Light of Artificial Intelligence: A Bibliometric Study. Accounting 2025, 11, 71–90. [Google Scholar] [CrossRef]
  47. Hirsch, J.E. An Index to Quantify an Individual’s Scientific Research Output. Proc. Natl. Acad. Sci. USA 2005, 102, 16569–16572. [Google Scholar] [CrossRef]
  48. Egghe, L. Theory and Practise of the G-Index. Scientometrics 2006, 69, 131–152. [Google Scholar] [CrossRef]
  49. Yang, J.-M.; Tseng, S.-F.; Won, Y.-L. A Bibliometric Analysis on Data Mining Using Bradford’s Law. In Proceedings of the 3rd International Conference on Intelligent Technologies and Engineering Systems (ICITES2014) 2016, Kaohsiung, Taiwan, 19–21 December 2014; pp. 613–620. [Google Scholar] [CrossRef]
  50. Bibliometrix—Home. Available online: https://www.bibliometrix.org/home/ (accessed on 3 July 2024).
  51. Soliman, M.; Fatnassi, T.; Elgammal, I.; Figueiredo, R. Exploring the Major Trends and Emerging Themes of Artificial Intelligence in the Scientific Leading Journals amidst the COVID-19 Era. Big Data Cogn. Comput. 2023, 7, 12. [Google Scholar] [CrossRef]
  52. Newby, G.B.; Greenberg, J.; Jones, P. Open Source Software Development and Lotka’s Law: Bibliometric Patterns in Programming. J. Am. Soc. Inf. Sci. Technol. 2003, 54, 169–178. [Google Scholar] [CrossRef]
  53. Cibu, B.; Delcea, C.; Domenteanu, A.; Dumitrescu, G. Mapping the Evolution of Cybernetics: A Bibliometric Perspective. Computers 2023, 12, 237. [Google Scholar] [CrossRef]
  54. Jigani, A.-I.; Delcea, C.; Florescu, M.-S.; Cotfas, L.-A. Tracking Happiness in Times of COVID-19: A Bibliometric Exploration. Sustainability 2024, 16, 4918. [Google Scholar] [CrossRef]
  55. Song, X.; Liu, Y.; Xue, L.; Wang, J.; Zhang, J.; Wang, J.; Jiang, L.; Cheng, Z. Time-Series Well Performance Prediction Based on Long Short-Term Memory (LSTM) Neural Network Model. J. Pet. Sci. Eng. 2020, 186, 106682. [Google Scholar] [CrossRef]
  56. Sharadga, H.; Hajimirza, S.; Balog, R.S. Time Series Forecasting of Solar Power Generation for Large-Scale Photovoltaic Plants. Renew. Energy 2020, 150, 797–807. [Google Scholar] [CrossRef]
  57. Chou, J.-S.; Tran, D.-S. Forecasting Energy Consumption Time Series Using Machine Learning Techniques Based on Usage Patterns of Residential Householders. Energy 2018, 165, 709–726. [Google Scholar] [CrossRef]
  58. Nourani, V. An Emotional ANN (EANN) Approach to Modeling Rainfall-Runoff Process. J. Hydrol. 2017, 544, 267–277. [Google Scholar] [CrossRef]
  59. Ledoux, C. An Urban Traffic Flow Model Integrating Neural Networks. Transp. Res. Part C Emerg. Technol. 1997, 5, 287–300. [Google Scholar] [CrossRef]
  60. Ismail, S.; Shabri, A.; Samsudin, R. A Hybrid Model of Self-Organizing Maps (SOM) and Least Square Support Vector Machine (LSSVM) for Time-Series Forecasting. Expert Syst. Appl. 2011, 38, 10574–10578. [Google Scholar] [CrossRef]
  61. Cho, V. A Comparison of Three Different Approaches to Tourist Arrival Forecasting. Tour. Manag. 2003, 24, 323–330. [Google Scholar] [CrossRef]
  62. Sahoo, B.B.; Jha, R.; Singh, A.; Kumar, D. Long Short-Term Memory (LSTM) Recurrent Neural Network for Low-Flow Hydrological Time Series Forecasting. Acta Geophys. 2019, 67, 1471–1481. [Google Scholar] [CrossRef]
  63. Qu, J.; Qian, Z.; Pei, Y. Day-Ahead Hourly Photovoltaic Power Forecasting Using Attention-Based CNN-LSTM Neural Network Embedded with Multiple Relevant and Target Variables Prediction Pattern. Energy 2021, 232, 120996. [Google Scholar] [CrossRef]
  64. Wilczewski, M.; Alon, I. Language and Communication in International Students’ Adaptation: A Bibliometric and Content Analysis Review. High Educ. 2023, 85, 1235–1256. [Google Scholar] [CrossRef]
  65. Romero-Riaño, E.; Rico-Bautista, D.; Martinez-Toro, M.; Medina-Cárdenas, Y.; Rico-Bautista, N. Artificial Intelligence Theory: A Bibliometric Analysis. J. Phys. Conf. Ser. 2021, 2046, 012078. [Google Scholar] [CrossRef]
  66. Özdoğan Sarıkoç, G. Artificial Intelligence Applications in the Field of Streamflow: A Bibliometric Analysis of Recent Trends. Hydrol. Sci. J. 2024, 69, 1141–1157. [Google Scholar] [CrossRef]
  67. Loan, F.A.; Bashir, B.; Nasreen, N. Applied Artificial Intelligence: A Bibliometric Study of an International Journal. COLLNET J. Scientometr. Inf. Manag. 2021, 15, 27–45. [Google Scholar] [CrossRef]
  68. Feng, Z.; Niu, W. Hybrid Artificial Neural Network and Cooperation Search Algorithm for Nonlinear River Flow Time Series Forecasting in Humid and Semi-Humid Regions. Knowl. Based Syst. 2021, 211, 106580. [Google Scholar] [CrossRef]
  69. Fu, X.; Feng, Z.; Cao, H.; Feng, B.; Tan, Z.; Xu, Y.; Niu, W. Enhanced Machine Learning Model via Twin Support Vector Regression for Streamflow Time Series Forecasting of Hydropower Reservoir. Energy Rep. 2023, 10, 2623–2639. [Google Scholar] [CrossRef]
  70. Feng, Z.; Niu, W.; Wan, X.; Xu, B.; Zhu, F.; Chen, J. Hydrological Time Series Forecasting via Signal Decomposition and Twin Support Vector Machine Using Cooperation Search Algorithm for Parameter Identification. J. Hydrol. 2022, 612, 128213. [Google Scholar] [CrossRef]
  71. Niu, W.; Feng, Z.; Feng, B.; Xu, Y.; Min, Y. Parallel Computing and Swarm Intelligence Based Artificial Intelligence Model for Multi-Step-Ahead Hydrological Time Series Prediction. Sustain. Cities Soc. 2021, 66, 102686. [Google Scholar] [CrossRef]
  72. Carpinteiro, O.A.S.; Leite, J.P.R.R.; Pinheiro, C.A.M.; Lima, I. Forecasting Models for Prediction in Time Series. Artif. Intell. Rev. 2012, 38, 163–171. [Google Scholar] [CrossRef]
  73. Faustino, C.P.; Novaes, C.P.; Pinheiro, C.A.M.; Carpinteiro, O.A. Improving the Performance of Fuzzy Rules-Based Forecasters through Application of FCM Algorithm. Artif. Intell. Rev. 2014, 41, 287–300. [Google Scholar] [CrossRef]
  74. Vilela, L.F.S.; Leme, R.C.; Pinheiro, C.A.M.; Carpinteiro, O.A.S. Forecasting Financial Series Using Clustering Methods and Support Vector Regression. Artif. Intell. Rev. 2019, 52, 743–773. [Google Scholar] [CrossRef]
  75. Li, H.; Wang, J.; Yang, H.; Wang, Y. Air Quality Deterministic and Probabilistic Forecasting System Based on Hesitant Fuzzy Sets and Nonlinear Robust Outlier Correction. Knowl. Based Syst. 2022, 237, 107789. [Google Scholar] [CrossRef]
  76. Wang, J.; Li, H.; Wang, Y.; Lu, H. A Hesitant Fuzzy Wind Speed Forecasting System with Novel Defuzzification Method and Multi-Objective Optimization Algorithm. Expert Syst. Appl. 2021, 168, 114364. [Google Scholar] [CrossRef]
  77. Jiang, P.; Yang, H.; Li, H.; Wang, Y. A Developed Hybrid Forecasting System for Energy Consumption Structure Forecasting Based on Fuzzy Time Series and Information Granularity. Energy 2021, 219, 119599. [Google Scholar] [CrossRef]
  78. Wang, J.; Li, H.; Wang, Y.; Yang, H. A Novel Assessment and Forecasting System for Traffic Accident Economic Loss Caused by Air Pollution. Environ. Sci. Pollut. Res. 2021, 28, 49042–49062. [Google Scholar] [CrossRef] [PubMed]
  79. Kocak, C.; Egrioglu, E.; Bas, E. A New Explainable Robust High-Order Intuitionistic Fuzzy Time-Series Method. Soft Comput. 2023, 27, 1783–1796. [Google Scholar] [CrossRef]
  80. Kocak, C.; Dalar, A.Z.; Cagcag Yolcu, O.; Bas, E.; Egrioglu, E. A New Fuzzy Time Series Method Based on an ARMA-Type Recurrent Pi-Sigma Artificial Neural Network. Soft Comput. 2020, 24, 8243–8252. [Google Scholar] [CrossRef]
  81. Yolcu, U.; Aladag, C.H.; Egrioglu, E.; Uslu, V.R. Time-Series Forecasting with a Novel Fuzzy Time-Series Approach: An Example for Istanbul Stock Market. J. Stat. Comput. Simul. 2013, 83, 599–612. [Google Scholar] [CrossRef]
  82. Morales-García, J.; Bueno-Crespo, A.; Martínez-España, R.; Cecilia, J.M. Data-Driven Evaluation of Machine Learning Models for Climate Control in Operational Smart Greenhouses. J. Ambient Intell. Smart Environ. 2023, 15, 3–17. [Google Scholar] [CrossRef]
  83. Morales-García, J.; Bueno-Crespo, A.; Martínez-España, R.; Posadas, J.-L.; Manzoni, P.; Cecilia, J.M. Evaluation of Low-Power Devices for Smart Greenhouse Development. J. Supercomput. 2023, 79, 10277–10299. [Google Scholar] [CrossRef]
  84. Morales-García, J.; Bueno-Crespo, A.; Terroso-Sáenz, F.; Arcas-Túnez, F.; Martínez-España, R.; Cecilia, J.M. Evaluation of Synthetic Data Generation for Intelligent Climate Control in Greenhouses. Appl. Intell. 2023, 53, 24765–24781. [Google Scholar] [CrossRef]
  85. Al-Ali, E.M.; Hajji, Y.; Said, Y.; Hleili, M.; Alanzi, A.M.; Laatar, A.H.; Atri, M. Solar Energy Production Forecasting Based on a Hybrid CNN-LSTM-Transformer Model. Mathematics 2023, 11, 676. [Google Scholar] [CrossRef]
  86. Niu, W.; Feng, Z.; Li, S.; Wu, H.; Wang, J. Short-Term Electricity Load Time Series Prediction by Machine Learning Model via Feature Selection and Parameter Optimization Using Hybrid Cooperation Search Algorithm. Environ. Res. Lett. 2021, 16, 055032. [Google Scholar] [CrossRef]
  87. Zhou, C.; Che, C.; Wang, P.; Zhang, Q. Diformer: A Dynamic Self-Differential Transformer for New Energy Power Autoregressive Prediction. Knowl. Based Syst. 2023, 281, 111061. [Google Scholar] [CrossRef]
  88. Hamdoun, H.; Sagheer, A.; Youness, H. Energy Time Series Forecasting-Analytical and Empirical Assessment of Conventional and Machine Learning Models. J. Intell. Fuzzy Syst. 2021, 40, 12477–12502. [Google Scholar] [CrossRef]
  89. Bareith, T.; Tatay, T.; Vancsura, L. Navigating Inflation Challenges: AI-Based Portfolio Management Insights. Risks 2024, 12, 46. [Google Scholar] [CrossRef]
  90. Louati, A.; Louati, H.; Alharbi, M.; Kariri, E.; Khawaji, T.; Almubaddil, Y.; Aldwsary, S. Machine Learning and Artificial Intelligence for a Sustainable Tourism: A Case Study on Saudi Arabia. Information 2024, 15, 516. [Google Scholar] [CrossRef]
  91. Zhang, B.; Li, N.; Shi, F.; Law, R. A Deep Learning Approach for Daily Tourist Flow Forecasting with Consumer Search Data. Asia Pac. J. Tour. Res. 2020, 25, 323–339. [Google Scholar] [CrossRef]
  92. Sohrabpour, V.; Oghazi, P.; Toorajipour, R.; Nazarpour, A. Export Sales Forecasting Using Artificial Intelligence. Technol. Forecast. Soc. Change 2021, 163, 120480. [Google Scholar] [CrossRef]
  93. Tang, Y.M.; Chau, K.-Y.; Li, W.; Wan, T.W. Forecasting Economic Recession through Share Price in the Logistics Industry with Artificial Intelligence (AI). Computation 2020, 8, 70. [Google Scholar] [CrossRef]
  94. Feng, Z.; Shi, P.; Yang, T.; Niu, W.; Zhou, J.; Cheng, C. Parallel Cooperation Search Algorithm and Artificial Intelligence Method for Streamflow Time Series Forecasting. J. Hydrol. 2022, 606, 127434. [Google Scholar] [CrossRef]
  95. Christian, K.; Roy, A.F.V.; Yudianto, D.; Zhang, D. Application of Optimized Support Vector Machine in Monthly Streamflow Forecasting: Using Autocorrelation Function for Input Variables Estimation. Sustain. Water Resour. Manag. 2021, 7, 29. [Google Scholar] [CrossRef]
  96. Yaseen, Z.M.; Allawi, M.F.; Yousif, A.A.; Jaafar, O.; Hamzah, F.M.; El-Shafie, A. Non-Tuned Machine Learning Approach for Hydrological Time Series Forecasting. Neural Comput. Appl. 2018, 30, 1479–1491. [Google Scholar] [CrossRef]
  97. Niu, W.; Feng, Z.; Xu, Y.; Feng, B.; Min, Y. Improving Prediction Accuracy of Hydrologic Time Series by Least-Squares Support Vector Machine Using Decomposition Reconstruction and Swarm Intelligence. J. Hydrol. Eng. 2021, 26, 04021030. [Google Scholar] [CrossRef]
  98. Sang, Y.-F.; Singh, V.P.; Sun, F.; Chen, Y.; Liu, Y.; Yang, M. Wavelet-Based Hydrological Time Series Forecasting. J. Hydrol. Eng. 2016, 21, 06016001. [Google Scholar] [CrossRef]
  99. Mishra, M.; Byomakesha Dash, P.; Nayak, J.; Naik, B.; Kumar Swain, S. Deep Learning and Wavelet Transform Integrated Approach for Short-Term Solar PV Power Prediction. Measurement 2020, 166, 108250. [Google Scholar] [CrossRef]
  100. Zhou, Y.; He, X.; Montillet, J.-P.; Wang, S.; Hu, S.; Sun, X.; Huang, J.; Ma, X. An Improved ICEEMDAN-MPA-GRU Model for GNSS Height Time Series Prediction with Weighted Quality Evaluation Index. GPS Solut. 2025, 29, 113. [Google Scholar] [CrossRef]
  101. Tay, A. Using VOSviewer as a Bibliometric Mapping or Analysis Tool in Business, Management & Accounting | Singapore Management University (SMU). Available online: https://library.smu.edu.sg/topics-insights/using-vosviewer-bibliometric-mapping-or-analysis-tool-business-management (accessed on 7 March 2025).
  102. WoS Document Types. Available online: https://webofscience.help.clarivate.com/en-us/Content/document-types.html (accessed on 3 December 2023).
Figure 1. Paper Selection Process for Bibliometric Research Using PRISMA Flow Diagram.
Applsci 15 06221 g001
Figure 2. Annual Scientific Production.
Applsci 15 06221 g002
Figure 3. Average Citations per Year.
Applsci 15 06221 g003
Figure 4. Most Relevant Sources.
Applsci 15 06221 g004
Figure 5. Most Relevant Local Sources.
Applsci 15 06221 g005
Figure 6. Sources with Local Impact.
Applsci 15 06221 g006
Figure 7. Core Sources by Bradford’s Law.
Applsci 15 06221 g007
Figure 8. Most Relevant Authors.
Applsci 15 06221 g008
Figure 9. Authors with Most Local Citations.
Applsci 15 06221 g009
Figure 10. Author Productivity Using Lotka’s Law.
Applsci 15 06221 g010
Figure 11. Most Representative Universities.
Applsci 15 06221 g011
Figure 12. Top 10 Most Representative Corresponding Author’s Countries.
Applsci 15 06221 g012
Figure 13. Top 10 Most Cited Countries.
Applsci 15 06221 g013
Figure 14. Country Collaboration Map.
Applsci 15 06221 g014
Figure 15. Thematic Map of Keywords Plus.
Applsci 15 06221 g015
Figure 16. Thematic Map of Authors’ Keywords.
Applsci 15 06221 g016
Figure 17. Thematic Evolution of Keywords Plus.
Applsci 15 06221 g017
Figure 18. Factorial Analysis of Keywords Plus.
Applsci 15 06221 g018
Figure 19. Factorial Analysis of Abstract Bigrams.
Applsci 15 06221 g019
Figure 20. Collaboration Network of 30 authors.
Applsci 15 06221 g020
Table 1. Main information about extracted dataset.
IndicatorValue
Timespan1997–2024
Sources 158
Documents260
Average years from publication3.91
Average citations per documents20.51
Co-authors per document4.08
References11,079
Table 3. Brief summary of the content of the top 10 most globally cited documents.
No.Paper (Primary
Author, Year, Journal, Reference)
TitleDataPurpose
1Wang WC., 2009, Journal of Hydrology [44]A comparison of performance of several artificial intelligence methods for forecasting monthly discharge time seriesHydrological data from January 1953 to December 2004 from Manwan Hydropower on Lancanjiang RiverTo develop a hydrological forecasting model based on historical values, in order to manage and schedule the hydropower reservoir in an optimal way,
2Song XY., 2020, Journal of Petroleum Science and Engineering [55]Time-series well performance based on long short-term memory (LSTM) neural network modelTwo use cases from Xianjiang oilfield, China, with production rate over time To predict the oil production by implementing a long short-term memory neural network algorithm, including the existing production limitations
3Sharadga H., 2020, Renewable Energy [56]Time series forecasting of solar power generation for large-scale photovoltaic plansTime series data with historical production of solar powerTo estimate the solar power for grid-connected photovoltaic systems
4Cho V., 2003, Tourism Management [61]A comparison of three different approaches to tourist arrival forecastingHistorical data from the USA, UK, Japan, Singapore, Korea regarding travel demandTo evaluate three time-series algorithms, ARIMA, Elman’s Model of Artificial Neural Networks, and exponential smoothing, to forecast travel demand such as the number of arrivals in various countries
5Sahoo BB., 2019, Acta Geophysica [62]Long short-term memory (LSTM) recurrent neural network for low-flow hydrological time series forecastingDaily data from Basantapur, India gauging station which is situated in Mahanadi River basinTo explore the long short-term memory recurrent neural network (LSTM-RNN) algorithm and low-flow time series forecasting of Basantapur gauging station from India
6Qu JQ., 2021, Energy [63]Day-ahead hourly photovoltaic power forecasting using attention-based CNN-LSTM neural network embedded with multiple relevant and target variables prediction patternHistorical data on photovoltaic systems extracted from DKASC websiteTo implement short-term and long-term temporal neural network algorithms that predict the photovoltaic power values based on historical data
7Chou JS, 2018, Energy [57]Forecasting energy consumption time series using machine learning techniques based on usage patterns of residential householdsReal-time information extracted from a smart grid of an experimental buildingTo predict the energy consumption of buildings using machine learning algorithms and based on past data
8Nourani V., 2017, Journal of Hydrology [58]An emotional ANN (EANN) approach to modeling rainfall-runoff processData from two watersheds have been selectedTo define an emotional artificial neural network approach for daily rainfall runoff
9Ledoux C., 1997, Transportation Research Part C: Emerging Technologies [59] An urban traffic flow model integrating neural networksSimulated dataTo explore the neural network technique in traffic management systems, in order to be integrated into a real-time adaptive urban traffic system if the results are in accordance with expectations
10Ismail S., 2011, Expert Systems with Application [60]A hybrid model of self-organizing maps (SOMs) and least square support vector machine (LSSVM) for time-series forecastingWolf yearly sunspot and monthly unemployed young women datasets have been taken into considerationTo develop self-organizing maps and least square support vector machine (SOM-LSSVM) algorithm and to test the accuracy of the model
Table 4. Countries with Most Papers published.
CountryNumber of Papers
China42
USA26
UK21
Spain20
Saudi Arabia20
Iran15
India12
Turkey12
France11
Canada10
Egypt10
Serbia10
Tunisia9
Lebanon9
Brazil8
Iraq8
Italy7
United Arab Emirates7
Malaysia6
Ireland6
Table 5. Example of citations for top-five most cited papers included in the dataset.
PaperNumber of Citations
ISI Web of Science (Database Used in This Study)Scopus
Wang et al. [44]614714
Song et al. [55]241-
Sharadga et al. [56]225-
Cho [61]193238
Sahoo et al. [62]171-
Disclaimer/Publisher’s Note: The statements, opinions and data contained in all publications are solely those of the individual author(s) and contributor(s) and not of MDPI and/or the editor(s). MDPI and/or the editor(s) disclaim responsibility for any injury to people or property resulting from any ideas, methods, instructions or products referred to in the content.

