Article

Investigation of Ti65 Powder Spreading Behavior in Multi-Layer Laser Powder Bed Fusion

1
Key Laboratory for Ecological Metallurgy of Multimetallic Mineral of Ministry of Education, School of Metallurgy, Northeastern University, Shenyang 110819, China
2
Shenyang Aircraft Industry Group Co., Ltd., Shenyang 110850, China
3
School of Engineering, RMIT University, Melbourne, VIC 3001, Australia
4
School of Mechanical and Aerospace Engineering, Jilin University, Changchun 130025, China
*
Author to whom correspondence should be addressed.
Appl. Sci. 2025, 15(11), 6220; https://doi.org/10.3390/app15116220
Submission received: 30 April 2025 / Revised: 27 May 2025 / Accepted: 30 May 2025 / Published: 31 May 2025
(This article belongs to the Special Issue Advanced Granular Processing Technologies and Applications)

Abstract

Powder bed fusion using a laser beam (PBF-LB) offers a suitable alternative to manufacturing Ti65 with intricate geometries and internal structures in hypersonic aerospace applications. However, issues such as undesirable surface roughness, defect formation, and microstructural inhomogeneity remain critical barriers to its wide application. In this study, a coupled discrete element method–computational fluid dynamics (DEM-CFD) model was utilized to investigate the spreading behavior of Ti65 powder in a multi-layer PBF-LB process. The macro- and microscopic characteristics of the powder beds were systematically analyzed across different layers and regions under various spreading velocities. The results show that the packing density and uniformity of the powder beds in multi-layer PBF-LB of Ti65 powder improves as the number of solidified layers increases. Poor bed quality is observed in the first two layers due to a strong boundary effect, while a stable and denser powder bed emerges from the fourth layer. The presence of a previously solidified region strongly influences its neighboring unsolidified areas, enhancing density in the upstream region and causing looser packing downstream. Additionally, due to the existence of a solidified region, the height of the powder bed progressively decreases along the spreading direction.

1. Introduction

Titanium alloys such as TA15 (Ti-6.5Al-1Mo-1V-2Zr), TC4 (Ti-6Al-4V), and Ti60 (Ti-6Al-2Zr-4.8Sn-1Mo-0.35Si-0.85Nd) exhibit excellent high-temperature strength (up to ~600 °C), low thermal conductivity (~7–12 W/m·K), and good oxidation resistance in moderate-temperature environments [1,2,3]. Ti65 (Ti-Al-Sn-Zr-Mo-Si-Nb-Ta-W-C-Fe), as one of the near-α titanium alloys [4,5], demonstrates even better properties, with service temperatures reaching 650 °C or even 750 °C. Titanium alloys are considered difficult-to-machine materials [6,7] due to challenges such as high cutting temperatures, severe tool wear, and material adhesion during machining, primarily resulting from their low thermal conductivity, strain hardening behavior, and high-temperature chemical activity. As the demand for fabricating titanium alloy parts with intricate geometries and internal structures continues to grow, conventional manufacturing methods (e.g., casting, bulk forming, and machining) struggle to meet the stringent requirements [1]. Moreover, conventional processes typically lead to significant material waste, high manufacturing costs, and long production time. By contrast, additive manufacturing (AM) via powder bed fusion using a laser beam (PBF-LB) offers an effective alternative [8,9,10] for fabricating titanium alloy components that require high precision, multi-variety customization, small batch sizes, and complex inner structures. Specifically, PBF-LB can achieve final parts with low porosity, reduced surface roughness (Ra) (7–20 μm), and minimal dimensional deviation (0.04–0.2 mm) [7].
However, the forming quality in PBF-LB is determined by various factors, such as processing parameters in powder spreading and the complex interplay of powder material properties during powder melting [11,12]. Improper control of the influencing factors often results in typical defects such as pores, unfused regions, cracks, and high-density inclusions [13]. As a 10-component near-α titanium alloy, Ti65 possesses distinct physical properties [5]. In addition, the incorporation of high-melting-point elements such as Mo, Nb, and W increases the viscosity of the melt pool [14]. Those distinct properties make the operation parameters (e.g., powder spreading speed, laser power, and scanning speed) of other metals (e.g., 316L stainless steel, Ti-6Al-4V, W, and Mo [7,11,15,16]) in PBF-LB not applicable to Ti65. Despite T65’s promising potential, research efforts to date have largely focused on optimizing its alloy composition, characterizing microstructures, and evaluating mechanical properties [5,17,18], with relatively limited work on its PBF-LB manufacturing process. Presently, process development for Ti65 still heavily relies on trial-and-error experimentation, which is costly, time-consuming, and subjected to interlayer cracking and warpage deformation, especially under thermal gradients that accumulate during multi-layer builds. Therefore, there is an urgent need to establish numerical models capable of simulating Ti65 powder behavior during multi-layer PBF-LB.
Against this background, a coupled discrete element method–computational fluid dynamics (DEM-CFD) numerical model [19] is utilized to investigate the powder spreading behavior of Ti65 in multi-layer PBF-LB, aiming to address the following critical questions: (1) How does powder bed quality evolves over successive layers? (2) How do solidified regions influence the spreading of new layers and the resulting powder bed quality? (3) What are the underlying mechanisms? Powder bed quality is evaluated using macroscopic properties such as packing density, uniformity, and surface roughness, as well as microscopic properties including particle rearrangement, coordination number, and pore size. The underlying mechanisms are analyzed through particle movement and average contact force.
The remainder of the paper is organized as follows: Section 2 introduces the methodology, including a detailed description of the DEM and CFD models, simulation setup, and validation against a corresponding experiment. Section 3 provides a comprehensive analysis and discussion of the powder bed quality across successive layers and different zones, along with associated mechanisms. Finally, Section 4 summarizes the key findings of this study. The findings are expected to provide valuable guidance for achieving high-quality powder spreading in the PBF-LB of Ti65 (PBF-LB/Ti65) components.

2. Methodology

In the PBF-LB process, powder spreading and melting are the two fundamental stages [20]. In this study, the dynamic behavior of the Ti65 powders during the spreading stage is simulated using a DEM model. Following powder deposition, the powder bed data are transferred to a CFD model to simulate the subsequent melting behavior. The resulting solidified geometry is then fed back into the DEM model to enable simulation of the next spreading layer. These alternate data exchange between the DEM and CFD models, facilitating an integrated simulation framework for the multi-layer PBF-LB process.

2.1. DEM Model

The DEM is an effective approach to study the dynamic behavior and complex interaction of particulate systems; therefore, it is utilized to simulate the spreading process of Ti65 powder. The translational and rotational motions of each individual particle are governed by Newton’s second law [21]:
m i d v i d t = ( F n , i j + F t , i j ) + m i g I i d ω i d t = j T i j
where mi, vi, ωi, and Ii represent the mass, translational velocity, angular velocity, and inertia moment of the particle i; g is the acceleration of gravity; Fn,ij and Ft,ij are the normal and tangential forces between particle i and particle j; and Tij is the torque acting on particle i.
Notably, the weak adhesive inter-particle force becomes strong enough to have an impact on particle behavior when the particle size is less than 200 μm [22] (the particle size of the Ti65 powder used in PBF-LB generally falls below 100 μm). Therefore, the Hertz–Mindlin with Johnson–Kendall–Roberts (JKR) model [23] was employed to describe the contact forces between particles. The normal force is calculated as follows:
F n , i j = 4 ( π E γ ) 1 2 a 3 2 n + 4 E * 3 R a 2 n 2 5 6 β S n m * v n
where, in the first term (the adhesive force), E∗* and γ are the equivalent Young’s modulus and surface energy, respectively. The relationship between the radius of the contact area a and the normal overlap δn is given by
δ n = a 2 R 4 π γ a E 1 2
The second and third terms in Equation (2) denote the Hertz contact force and damping force in the normal direction. R is the equivalent radius. m and vn are the equivalent mass and relative velocity between two contact particles in the normal direction. Sn and β are the normal stiffness and damping coefficient, given by
S n = 2 E * R * δ n
β = ln e ln 2 e + π 2
where e stands for the restitution coefficient. The tangential contact force is calculated by [24]
F t , i j = S t δ t 2 5 6 β S t m * v t
where vt and δt are tangential relative velocity and displacement. St represents the tangential stiffness, which is given by
S t = 8 G * R * δ n
The relationship between shear modulus G and Young’s modulus is given by
G * = E * 2 ( 1 + v )
The tangential force is limited by Coulomb friction force:
F t , i j = F t , i j , F t , i j < μ S F n , i j v t v t μ S F n , i j , F t , i j μ S F n , i j
The Tij includes a torque resulting from tangential force and a torque from rotation [25]:
T i j = R i j × F t , i j + μ r F n , i j R i j ω i ω i

2.2. CFD Model

To accurately replicate the powder spreading process in multi-layer PBF-LB, the influence of printed regions should be incorporated. The selective melting of the spread powder bed is simulated by a computational fluid dynamics (CFD) approach [12,13]. The volume of fluid (VOF) method is used to track the evolution of the melt pool’s free surface during laser melting. The model accounts for key physical phenomena influencing melt pool dynamics, including radiation heat transfer, the Marangoni effects, and vapor recoiling pressure resulting from metal evaporation. A Gaussian surface heat source is adopted to represent the laser heat source.
The VOF method tracks the liquid–gas interface via the evolution of metal phase α1, governed by [12,13]
α 1 t + ( v α 1 ) = 0
α 1 + α 2 = 1
where α2 represents the volume fraction of the gas phase; t is the time; and v is the velocity vector.
The mass, momentum, and energy conservation equations are expressed as follows:
(1)
Mass:
( ρ ¯ v ) = 0
(2)
Momentum [26,27,28]:
t ( ρ ¯ v ) + ( ρ ¯ v v ) = ( μ ¯ v ) p + ρ ¯ g + F mushy + ( F tension + F Marangoni + F recoil ) α 1 2 α 1 ρ 1 + α 2 ρ 2 ρ 1 + ρ 2
where ρ ¯ , ρ1, and ρ2 are the average density, metal density, and gas density, respectively; p is the pressure; and μ ¯ is the average viscosity.
  • The mushy zone damping force, Fmushy, models resistance to flow in partially solidified regions [26,27]:
F mushy = ρ ¯ K c 1 f l 2 f l 3 + C K v
f l = 1 T T l T T s T l T s T l T T s 0 T T s
where Kc is the permeability coefficient; CK is a small constant to avoid division by zero; fl is the liquid fraction of the metal phase; T is the temperature; Ts is the solidus temperature; and Tl is the liquidus temperature.
  • Surface tension, Ftension, is modeled using the continuum surface force approach [29,30]:
F tension = σ κ n = σ 0 d σ d T ( T T 0 ) n
where σ is the surface tension coefficient; d σ d T is the coefficient of surface tension varying with temperature; σ0 is the surface tension coefficient at the reference temperature T0; κ is the curvature of metal/gas interface; and n is the unit vector.
  • The Marangoni force, FMarangoni, accounts for surface tension gradients along the interface [26,27]:
F Marangoni = d σ d T T n n T
  • Recoil pressure, Frecoil, due to metal vaporization at high temperatures is given by [9,31]
F recoil = 0.54 P 0 exp L v m k B ( T T v T T v ) n
where P0 is the ambient pressure; Lv is the latent heat of vaporization; m is the molecular mass; kB is the Boltzmann constant; and Tv is the gasification temperature.
(3)
Energy [32,33,34]:
ρ ¯ c ¯ e T t + ( ρ ¯ v c ¯ e T ) = ( k ¯ T ) + q laser + q con + q rad + q evap α 1 2 ρ ¯ c ¯ e ρ 1 c 1 + ρ 2 c 2
where c ¯ e , c1, and c2 are the equivalent specific heat capacity, metal heat capacity, and gas heat capacity, and k ¯ is the thermal conductivity. The heat losses and source are described below [27]:
  • Convection heat loss (qcon):
q con = h con ( T T con )
where hcon is the convective heat transfer coefficient, and Tcon is the ambient temperature at the gas–liquid interface.
  • Radiation heat loss (qrad):
q rad = σ s ε T 4 T rad 4
where σs is the Stefan–Boltzmann constant; ε is the emissivity; and Trad is the radiation outside temperature.
  • Evaporation heat loss (qevap):
q evap = 0.82 L v m 2 π m k B T P 0 exp ( L v m ( T T v ) k B T T v )
  • Laser heat input (qlaser) [10]:
q laser = 2 η P π R 2 exp 2 r 2 R 2
where R is the laser spot radius; r is the distance to the central line of the laser spot; and η is the power absorptivity rate.

3. Simulation Conditions and Model Validation

3.1. Powder Characterization

Particle size distribution (PSD) is a critical property influencing the spreading behavior of Ti65 powder. The PSD of Ti65 powder (provided by Xi’an Bright Laser Technologies Co., Ltd., Xi’an, China) used in experiment is statistically analyzed and presented in Figure 1a. Measurements obtained using a laser particle size analyzer (Mastersizer 3000, Malvern Panalytical®, Malvern, UK) indicate that the distribution approximates a normal distribution, with D50 and D90 values of approximately 38.7 μm and 61.5 μm, respectively. The inset image, obtained via Zeiss field emission scanning electron microscopy (SEM) (Zeiss, Oberkochen, Germany), reveals that the Ti65 powder particles are nearly spherical in morphology. Accordingly, the particles are assumed to be spheres in the simulations. Detailed information regarding the chemical composition of the Ti65 powder is provided in Figure 1b.

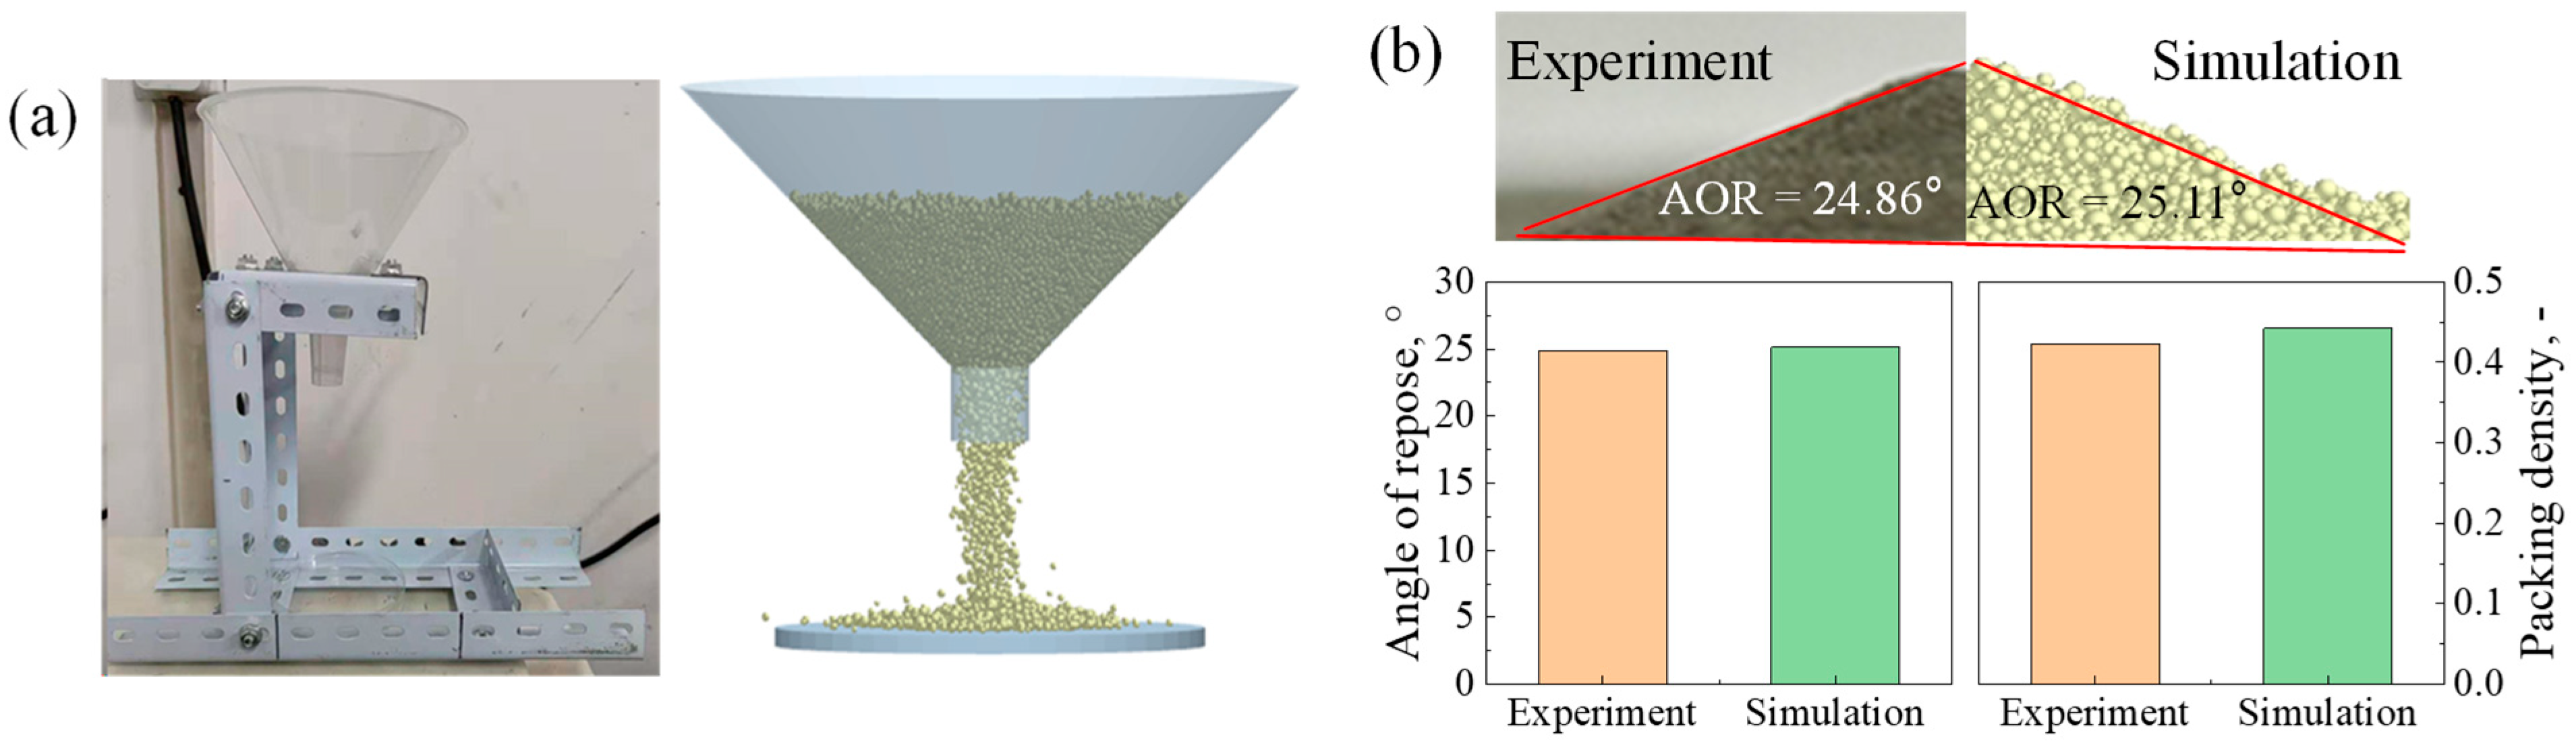
3.2. Parameter Calibration

The simulation parameters of Ti65 powder are calibrated by comparing the numerical and experimental measurements of the angle of repose (AOR) and the packing density of the formed Ti65 powder pile. Both AOR and packing density are widely used to characterize the effects of particle friction, restitution coefficient, adhesive force, and particle size [35]. Figure 2a illustrates the physical setup. The left image shows the experimental configuration, where Ti65 powder is discharged from a hopper positioned above a fixed platform under gravity, forming a powder pile. The right image depicts the corresponding DEM simulation of the same process. Notably, the particle size distribution of T65 powder in the simulation replicates that of the experimental powder, as detailed in the following section. Figure 2b compares the numerical and experimental results, where the AOR is defined as the angle between the horizontal base and the slope of the powder heap [36]. The deviations in both AOR and packing density are within 5%, indicating that the simulation parameters are sufficiently calibrated. The calibrated parameters used in the simulation are summarized in Table 1.

3.3. Simulation Setup

The schematic of the multi-layer powder spreading process is presented in Figure 3. During spreading, powder particles are driven forward by the recoating blade at a defined velocity (V), depositing a layer with a set thickness (Hset) onto either the substrate or the previously spread/solidified powder layer. The computational domain for the powder spreading process is set to 10,000 µm × 1000 µm × 3000 µm (X-Y-Z), with periodic boundary conditions applied in the Y direction. Notably, the spreading thickness is fixed at Hset = 60 µm, based on the experimental median particle diameter (D50 ≈ 38.7 μm).
Following powder deposition, the melting process is simulated within a computational domain of 1000 µm × 1000 µm × 400 µm (X-Y-Z), as illustrated in Figure 4. The laser melting area covers 800 µm × 800 µm in the X-Y plane. The laser processing parameters are set to a laser power of 250 W, scanning speed of 1.4 m/s, and hatch spacing of 100 µm [37]. The initial temperature of both the powder bed and substrate is 300 K. To simulate the actual manufacturing process, a 67° rotation of the scanning direction is applied between successive layers, with the printing strategies for different layers shown in Figure 4c.

3.4. Model Validation

To validate the accuracy of the coupled DEM-CFD model, both numerical simulations and physical experiments of powder spreading and selective laser melting are conducted under identical conditions. In this study, the powder spreading and printing experiments were performed by the EOS M280, and the microstructure morphology was obtained by the Olympus BX51M microscope. The top-view morphologies of the first powder layer are presented in Figure 5a (Hset = 60 μm, V = 0.100 m/s). In both the simulation and experimental results, powders are randomly distributed on the substrate, exhibiting a certain degree of clustering due to cohesive forces. The quantitative characterization of powder layer porosity is presented in Figure 5b, showing good agreement between the simulation and the experiment, with porosity values of approximately 0.9.
Figure 5c provides a qualitative comparison of morphologies of the printed regions (laser power p = 250 W, printing speed Vp = 1.40 m/s). Both experimental and numerical results display a continuous, well-defined melt track. In the experimental image, the track edges are notably rough and exhibit visible spatter. The simulation also captures the overall geometry and irregularities at the edge, although with slightly smoother boundaries. This deviation is largely attributed to the inherent difficulty in fully capturing powder spatter dynamics with the CFD model. A quantitative comparison of the single-track dimensions is shown in Figure 5d. The experimentally measured width and depth of the track are approximately 171 μm and 109 μm, respectively. The corresponding simulated values are 176 μm in width and 107 μm in depth, demonstrating a strong agreement.

4. Results and Discussion

4.1. Variation in Powder Bed Quality over Successive Layers

The morphologies of the powder bed from layer 1 to layer 6 in the multi-layer PBF-LB process are shown in Figure 6. Both top and side views are provided to enable a qualitative understanding of how powder spreads and accumulates over different layers. As shown, the presence of previously printed/solidified regions significantly influences the spreading behavior of the subsequent powder layers. These printed regions introduce local topographical variations that can alter the powder flow, ultimately affecting the quality and dimensional accuracy of the printed part. Therefore, both macroscopic properties (packing density, surface roughness, and uniformity) and microscopic properties (particle rearrangement, coordination number, and void distribution) of the powder beds are analyzed across each layer to assess the evolution of spreading quality.

4.1.1. Macroscopic Properties

The packing density, defined as the volume of powder particles divided by the volume of the powder bed [38], is a key metric for evaluating the powder bed quality. Figure 7a presents the evolutions of packing densities of powder beds over printed regions at different layer heights. The packing densities in the first two printed layers are extremely low (below 0.10) but increase rapidly from the third layer onward, eventually stabilizing as the number of printed layers increases. Additionally, for a given printed region, an increase in spreading velocity leads to a reduction in packing density.
In addition to the packing density, the surface roughness Ra is another important index to evaluate the powder bed quality [19]. As shown in Figure 7b, the Ra values for the first and second layers are notably high but gradually decrease and stabilize as more layers are added. A reduction in spreading velocity can significantly reduce surface roughness.
The trends observed in both packing density and surface roughness are in good agreement with previous studies involving other materials [16]. The poor quality of the first two powder layers is primarily attributed to the low Hset, which limits the amount of powder released for powder bed formation. As the number of layers increases, the height of the previously deposited powder bed rises, mitigating boundary effects and improving packing. This indicates that the powder bed characteristics after the third layer can better represent the powder bed quality during the actual printing process, and can provide more effective guidance and optimization for the real AM operations. Moreover, slower spreading velocities provide more time for particle rearrangement and void filling, thereby improving the powder bed quality.
In a practical 3D printing process, the uniformity of the powder bed, characterized by the coefficient of variation (CV), is also a critical quality metric. As shown in Figure 8a, the variation in CV across successive powder beds reveals that, in addition to the powder beds in the first two layered printed regions, the CV reaches higher values at the third layer and then gradually decreases. The abnormal low values of CV in the first two layered powder beds can be ascribed to the insufficient powders involved; thus, using incomplete powder beds caused by boundary effects should be avoided during printing. It can also be observed from Figure 8a that during multi-layer spreading, decreasing spreading velocity can lower the CV value so that the powder bed quality can be improved.
In addition, the height of the spread bed, Hreal, defined as the distance between the bottom of the blade and the average height of the printed region [16], is also analyzed and presented in Figure 8b. It is observed that Hreal gradually increases with layer number and eventually stabilizes. Notably, reducing the spreading velocity results in a lower stable Hreal. As the number of printed layers increases, the density of the powder bed gradually improves, causing the height of the printed region to increase (where the limit of the height of the printed region is Hset). However, the rate of increase in height reduces with each layer. On the other hand, the decrease in spreading velocity increases the packing density of the powder bed so that the height of the printed region increases, which leads to a decrease in Hreal.

4.1.2. Microscopic Properties

In addition to the macroscopic properties of spread powder beds on printed regions, corresponding microscopic properties are also analyzed. Figure 9 presents particle rearrangement within the powder beds in the printed region under different spreading velocities. In this analysis, particles with diameters d < 30 μm are classified as small, those with d > 60 μm as large, and the rest as medium-sized particles. As shown, with the increase in layer number, the percentage of small particles in the powder bed in the printed region decreases, while the percentage of medium- and large-sized particles increases. This trend is primarily due to the low preset spreading height (Hset) in the initial several layers, which limits the deposition of large particles due to the boundary effects imposed by the blade. Hreal increases with each subsequent layer; thus, this boundary constraint is alleviated, allowing more medium- and large-sized particles to be released in the printed region.
Figure 10a demonstrates the distribution of coordination number (CN), defined as the number of particles in contact with the given particle, across different layers. As can be seen, starting from the second layer, the peak of each CN curve shifts from 2 to 3, implying the poor quality of the first-layer powder bed. In addition, the CN evolutions of large particles with the layer number under different conditions are also analyzed and presented in Figure 10b. As can be seen, with the increase in layer number, the peak of the CN distribution curve shifts to the right and stabilizes after the fourth layer, reflecting a more densely packed powder bed. Furthermore, a reduction in spreading velocity leads to a more pronounced rightward shift in the CN peak, further confirming that lower spreading velocities contribute to denser powder beds.
To further analyze the powder bed structure, pores within the powder bed are quantitatively characterized using the Radical Tessellation (RT) technique, as shown in Figure 11a. Figure 11b gives the normalized pore size distributions of powder beds obtained under different spreading velocities. It can be observed that with the increase in printed layer number, the peak of the pore size distribution progressively moves to the left, indicating a reduction in large pores within the powder bed. This trend tends to be stable after the fourth layer. Figure 11b also shows that small pores are usually accompanied by lower spreading velocity, suggesting a much denser powder bed structure.

4.2. Variation in Powder Bed Quality Across Printed and Non-Printed Regions

Figure 12 presents the morphologies of the powder bed (layer 2 and layer 4, V = 0.075 m/s) across three different zones: the unprinted region (Zone 1) ahead of the printed area, the printed or solidified region (Zone 2), and the unprinted region following it (Zone 3). As shown in both the top and side views, the presence of the printed region introduces significant spatial heterogeneity in the powder bed quality. Not only does the printed region (Zone 2) directly affect powder deposition, but it also causes indirect disturbances in Zones 1 and 3, influencing the flow dynamics and particle rearrangement before and after the spreading blade traverses the printed feature. This section analyzes the macroscopic and microscopic characteristics of the powder bed across these zones.

4.2.1. Macroscopic Properties

Figure 13 demonstrates the evolution of packing density, surface roughness, uniformity, and real height across different sub-regions of the powder bed as a function of layer number. As can be observed, with the increase in the layer number, the macroscopic properties of the powder beds in Zones 1 and 3 exhibit similar trends to those in Zone 2. The packing densities in Zone 1 and Zone 2 are nearly identical, while the surface roughness, uniformity, and Hreal in Zone 1 are slightly lower than those in Zone 2. This suggests that a dense packing bed can be formed in front of and directly on the printed region. In contrast, all four metrics in Zone 3 are consistently inferior compared to the other two regions, implying that the existence of the printed region negatively impacts the powder spreading quality in the downstream area.

4.2.2. Microscopic Properties

The distributions of CN and pore size within the three different zones across the six successive layers as given in Figure 14. The results show that Zones 1 and 2 exhibit similar microscopic properties. In contrast, Zone 3 displays a leftward shift in the CN distribution and a rightward shift in the pore size distribution, indicating a loosely packed powder bed with higher prevalence of large pores. These findings are consistent with the variation in macroscopic properties discussed in Section 4.2.1, further confirming that the printed region influences both the macro- and microscopic properties of the surrounding powder beds. The underlying mechanisms and the implications of the packing structures in Zones 1 and 3 on the subsequent printing quality will the discussed further in the following section.

4.3. Mechanism Analysis

The height profiles of the powder beds across Zones 1, 2, and 3 under different spreading velocities are shown in Figure 15. Overall, the height of the powder bed generally exhibits a decreasing trend along the spreading direction, with Zone 3 exhibiting a noticeably lower height compared to the other two zones. Additionally, as the spreading velocity increases, the height profiles of the three zones exhibit distinct variations, with a general decreasing trend along the spreading direction. To explore the underlying mechanisms of this phenomenon, particle movements are analyzed in these three zones.
As illustrated in Figure 16a, three local zones (denoted as Zones A1–A3) are defined for detailed analysis. Zone A1 and Zone A3 have identical dimensions (500 μm × 1000 μm × 300 μm), while Zone 2 (printed region) spans 1000 μm × 1000 μm × 300 μm. The temporal distribution of particle velocity is shown in Figure 16b–d, where arrows represent the velocity vector and color denotes the velocity magnitude. At t = 0.079 s, particles in Zone A1 accumulate along the spreading direction due to the obstruction of the printed region, which induced the formation of a low-velocity area at the interface between Zones A1 and A2. With the advancement of the blade, more particles are accumulated at the interface, which results in an increase in the powder height and packing density. Meanwhile, the particles located in the low-velocity area move upward and then fall to form the dense local structure. By t = 0.091 s, the blade has passed through Zone A1; although the particles settle slightly, the previously accumulated particles maintain higher packing densities in both the interface and the leading edge of Zone A2. For Zone A2, particles are directed onto the surface of the printed region by the advancing blade. Their motion is further restricted by the geometry of the underlying printed region, promoting the formation of a densely packed region. At the rear of Zone A2, some particles overflow into Zone A3, contributing to the formation of a pit in the powder bed. In Zone A3, the particles near the A2–A3 interface are displaced outward from the printed region. This leads to the formation of voids due to insufficient particle supply. Even though some particles do migrate to partially fill the voids, a large portion is transported downstream, ultimately resulting in a loosely packed, low-density structure in Zone A3. This issue can be mitigated by reducing the spreading velocity as the blade approaches Zone A3, thereby allowing more time for particle deposition.
To further reveal the particle motion behavior, Zone A4 was set in front of the blade (300 μm × 1000 μm × 300 μm). Figure 17a gives the evolution of average contact force ( F ¯ ) of particles in front of the blade, and Figure 17b,c illustrate the particle motion in the low-velocity area and around the voids, as identified in Figure 16d. As shown, in Zone A1, F ¯ gradually increases and reaches its peak at the interface between Zones A1 and A2, implying that the particles at this area experience confinement by the strong contact forces. Figure 17b further confirms that particle displacements within the low-velocity area are minimal, resulting in a highly compact powder bed due to the confinement. In contrast, Figure 16c demonstrates that, although some voids in Zone A3 are partially filled by adjacent particles, the contact forces ( F ¯ ) in this zone remain substantially lower than those in other zones. Consequently, the weak confinement fails to effectively eliminate the voids, resulting in a powder bed with reduced height and packing density. Moreover, the reduced confinement in Zone A3 allows particles at the tail of Zone A2 to fall into this area, forming a pit. As a result of the high-density powder bed in front of Zone A2 and the pit formation behind it, the overall powder bed exhibits a height profile that is elevated in the front and reduced at the rear.

5. Conclusions

In this work, a multi-layer PBF-LB/Ti65 powder was investigated by using a coupled DEM-CFD approach. The macro- and microscopic properties of the powder beds across successive layers and different sub-regions were analyzed under various spreading velocities. Furthermore, the mechanisms of powder bed densification and void formation induced by the presence of a printed region were elucidated. The key findings are summarized as follows:
  • The powder bed quality improves with increasing layer number. The first two layers exhibit low packing density and high surface roughness due to limited powder availability and a strong boundary effect. From the third layer onward, the powder bed properties stabilize, indicating a diminishing influence from the initial layer constraints.
  • Properly reducing the spreading velocity enhances powder bed quality, as evidenced by increased packing density, improved surface uniformity, a higher coordination number, and a reduced coefficient of variation. This improvement is attributed to the longer time available for particle rearrangement and void filling at lower velocities.
  • The printed region influences not only the powder bed formed directly above it (Zone 2) but also indirectly alters the bed quality in front of (Zone 1) and behind (Zone 3) it. As a result, the height profile of the powder bed across the three zones shows a decreasing trend along the spreading direction.
  • Mechanism analysis reveals that the printed region induces a high-contact force zone at the interface between Zones 1 and 2 due to the obstruction, leading to the formation of a low-velocity area and enhanced local densification. In Zone 2, particle motion is constrained by printed geometry, promoting a relatively dense packing structure. Driven by the recoating blade, only a limited number of particles fall into the area ahead of Zone 3, leading to the formation of a pit. Additionally, due to insufficient particle supply, a relatively loosely packed powder bed forms in Zone 3.

Author Contributions

Conceptualization, G.Y., M.L. and X.A.; Methodology, Z.L., J.W. and H.Z.; Software, Z.L., X.L. and H.Z.; Validation, J.N. and Q.M.; Formal analysis, Z.L., J.W., G.Y., M.L. and X.A.; Investigation, J.W. and J.N.; Resources, Z.L., G.Y., X.L., M.L., X.A. and J.N.; Data curation, J.W., X.L., M.L. and Q.M.; Writing—original draft, Z.L.; Writing—review & editing, J.W., G.Y., X.L., X.A., J.N., H.Z. and Q.M.; Visualization, H.Z.; Supervision, X.A.; Project administration, X.A.; Funding acquisition, X.A. All authors have read and agreed to the published version of the manuscript.

Funding

This research received no external funding.

Institutional Review Board Statement

Not applicable.

Informed Consent Statement

Not applicable.

Data Availability Statement

The raw data supporting the conclusions of this article will be made available by the authors on request.

Acknowledgments

The authors are grateful to the Liaoning Revitalization Talents Program (XLYC1805007) and Fundamental Research Funds for the Central Universities (N2425007) of China for the financial support of current work.

Conflicts of Interest

Authors Zhe Liu, Xiaodan Li and Jiaqiang Ni were employed by the company Shenyang Aircraft Industry Group Co., Ltd. The remaining authors declare that the research was conducted in the absence of any commercial or financial relationships that could be construed as a potential conflict of interest.

References

  1. Liu, S.Y.; Shin, Y.C. Additive manufacturing of Ti6Al4V alloy—A review. Mater. Des. 2019, 164, 107552. [Google Scholar] [CrossRef]
  2. Li, W.Y.; Chen, Z.Y.; Liu, J.R.; Wang, Q.J.; Sui, G.X. Effect of texture on anisotropy at 600 °C in a near-α titanium alloy Ti60 plate. Mater. Sci. Eng. A 2017, 688, 322–329. [Google Scholar] [CrossRef]
  3. Zhong, W.; Yu, K.; Shi, J.P.; Shen, Y.M.; Li, P.F.; Lu, J.Z. High-temperature oxidation behavior of TA15 aerospace titanium alloy at 500 °C and 800 °C. J. Mater. Res. Technol. 2024, 30, 3355–3366. [Google Scholar] [CrossRef]
  4. Sun, J.F.; Lu, H.F.; Wang, Z.; Luo, K.Y.; Lu, J.Z. High-temperature oxidation behaviour of Ti65 titanium alloy fabricated by laser direct energy deposition. Corros. Sci. 2024, 229, 111866. [Google Scholar] [CrossRef]
  5. Yue, K.; Liu, J.R.; Zhang, H.J.; Yu, H.; Song, Y.Y.; Hu, Q.M.; Wang, Q.J.; Yang, R. Precipitates and alloying elements distribution in near α titanium alloy Ti65. J. Mater. Sci. Technol. 2020, 36, 91–96. [Google Scholar] [CrossRef]
  6. Li, J.M.; Wang, Y.; Jiang, S.W.; Cheng, Y.S.; Zou, Y.S.; Liu, H.B. Correction of the constitutive model and analysis of chip formation in cryogenic machining of TA15 titanium alloy. J. Manuf. Process. 2024, 113, 16–33. [Google Scholar] [CrossRef]
  7. Balc, A.; Çiçek, A.; Uçak, N.; Aslantas, K. Investigation of the effects of heat treatment and hot isostatic pressing in micro-drilling of Ti6Al4V alloy fabricated by laser powder bed fusion. Precis. Eng. 2024, 91, 617–631. [Google Scholar] [CrossRef]
  8. Cao, L. Mesoscopic-scale numerical investigation including the influence of scanning strategy on selective laser melting process. Comput. Mater. Sci. 2021, 189, 110263. [Google Scholar] [CrossRef]
  9. Gao, X.; Faria, G.A.; Zhang, W.; Wheeler, K.R. Numerical analysis of non-spherical particle effect on molten pool dynamics in laser-powder bed fusion additive manufacturing. Comput. Mater. Sci. 2020, 179, 109648. [Google Scholar] [CrossRef]
  10. Gu, D.D.; Xia, M.J.; Dai, D.H. On the role of powder flow behavior in fluid thermodynamics and laser processability of Ni-based composites by selective laser melting. Int. J. Mach. Tools Manuf. 2019, 137, 67–78. [Google Scholar] [CrossRef]
  11. Han, Q.Q.; Gu, H.; Setchi, R. Discrete element simulation of powder layer thickness in laser additive manufacturing. Powder Technol. 2019, 352, 91–102. [Google Scholar] [CrossRef]
  12. Zhou, H.T.; Su, H.J.; Guo, Y.N.; Yang, P.X.; Liu, Y.; Shen, Z.L.; Zhao, D.; Liu, H.F.; Huang, T.W.; Guo, M.; et al. Formation and evolution mechanisms of pores in Inconel 718 during selective laser melting: Meso-scale modeling and experimental investigations. J. Manuf. Process. 2022, 81, 202–213. [Google Scholar] [CrossRef]
  13. Yan, W.; Ge, W.; Qian, Y.; Lin, S.; Zhou, B.; Liu, W.K.; Lin, F.; Wagner, G.J. Multi-physics modeling of single/multiple-track defect mechanisms in electron beam selective melting. Acta Mater. 2017, 134, 324–333. [Google Scholar] [CrossRef]
  14. Wu, Q.; Qiao, C.; Yao, D.Z.; An, X.Z.; Zhang, H.; Fu, H.T.; Yang, X.H.; Zou, Q.C. Research on improving the spread ability of viscous powder in additive manufacturing. Powder Technol. 2023, 413, 118061. [Google Scholar] [CrossRef]
  15. Laskowski, R.; Ahluwalia, R.; Hock, G.T.W.; Ying, C.S.; Sun, C.N.; Wang, P.; Cheh, D.T.C.; Sharon, N.M.L.; Vastola, C. Concurrent modeling of porosity and microstructure in multilayer three-dimensional simulations of powder-bed fusion additive manufacturing of INCONEL 718. Addit. Manuf. 2022, 60, 103266. [Google Scholar]
  16. Wang, J.; Yao, D.Z.; Li, M.; An, X.Z.; Li, S.J.; Hou, W.T.; Zhang, X.; Yang, G.Y.; Wang, J.; Wang, L. Hierarchical effects of multi-layer powder spreading in the electron beam powder bed fusion additive manufacturing of pure tungsten material. Addit. Manuf. 2022, 55, 102835. [Google Scholar] [CrossRef]
  17. Sun, J.F.; Lu, H.F.; Zhang, H.M.; Luo, K.Y.; Lu, J.Z. Effect of thermal exposure on microstructure and mechanical properties of Ti65 high-temperature titanium alloy deposited by laser direct energy deposition. Mater. Sci. Eng. A 2024, 908, 146757. [Google Scholar] [CrossRef]
  18. Sun, J.F.; Lu, H.F.; Liang, Y.C.; Zhang, H.M.; Luo, K.Y.; Lu, J.Z. Evolution of microstructure and mechanical properties of Ti65 high-temperature titanium alloy after additive manufacturing and annealing. Mater. Sci. Eng. A 2024, 913, 147002. [Google Scholar] [CrossRef]
  19. Long, Y.F.; An, X.Z.; Wang, J.; Li, M.; Wu, Q.; Jiang, C.N.; Liu, J.F.; Ren, D.C.; Ji, H.B.; Li, S.J.; et al. Surface roughness and pore evolutions in multi-layer laser powder bed fusion of extra-low interstitial Ti-5Al-2.5Sn powder: A numerical study. Addit. Manuf. 2024, 95, 104530. [Google Scholar] [CrossRef]
  20. Chowdhury, S.; Yadaiah, N.; Prakash, C.; Ramakrishna, S.; Dixit, S.; Gupta, L.R.; Buddhi, D. Laser powder bed fusion: A state-of-the-art review of the technology, materials, properties & defects, and numerical modelling. J. Mater. Res. Technol. 2022, 20, 2109–2172. [Google Scholar]
  21. Zhao, H.Y.; An, X.Z.; Wu, Y.L.; Qian, Q. DEM modeling on stress profile and behavior in granular matter. Powder Technol. 2018, 323, 149–154. [Google Scholar] [CrossRef]
  22. Yang, R.Y.; Zou, R.P.; Yu, A.B. Computer simulation of the packing of fine particles. Phys. Rev. E 2000, 62, 3900. [Google Scholar] [CrossRef]
  23. Yao, D.Z.; Liu, X.H.; Wang, J.; Fan, W.; Li, M.; Fu, H.T.; Zhang, H.; Yang, X.H.; Zou, Q.C.; An, X.Z. Numerical insights on the spreading of practical 316L stainless steel powder in SLM additive manufacturing. Powder Technol. 2021, 390, 197–208. [Google Scholar] [CrossRef]
  24. He, Y.; Hassanpour, A.; Behjani, A.M.; Bayly, A.E. A novel stiffness scaling methodology for discrete element modelling of cohesive fine powders. Appl. Math. Model. 2021, 90, 817–844. [Google Scholar] [CrossRef]
  25. An, X.Z.; Yang, R.Y.; Dong, K.J.; Yu, A.B. DEM study of crystallization of monosized spheres under mechanical vibrations. Comput. Phys. Commun. 2011, 182, 1989–1994. [Google Scholar] [CrossRef]
  26. Tang, C.; Tan, J.L.; Wong, C.H. A numerical investigation on the physical mechanisms of single track defects in selective laser melting. Int. J. Heat Mass Transf. 2018, 126, 957–968. [Google Scholar] [CrossRef]
  27. Cao, L. Numerical simulation of the impact of laying powder on selective laser melting single-pass formation. Int. J. Heat Mass Transf. 2019, 141, 1036–1048. [Google Scholar] [CrossRef]
  28. Xia, M.J.; Gu, D.D.; Yu, G.Q.; Dai, D.H.; Chen, H.Y.; Shi, Q.M. Porosity evolution and its thermodynamic mechanism of randomly packed powder-bed during selective laser melting of Inconel 718 alloy. Int. J. Mach. Tools Manuf. 2017, 116, 96–106. [Google Scholar] [CrossRef]
  29. Cao, L. Mesoscopic-scale simulation of pore evolution during laser powder bed fusion process. Comput. Mater. Sci. 2020, 179, 109686. [Google Scholar] [CrossRef]
  30. Cao, L. Workpiece-scale numerical simulations of SLM molten pool dynamic behavior of 316L stainless steel. Comput. Math. Appl. 2021, 96, 209–228. [Google Scholar] [CrossRef]
  31. Tian, Y.F.; Yang, L.J.; Zhao, D.J.; Huang, Y.M.; Pan, J.J. Numerical analysis of powder bed generation and single track forming for selective laser melting of SS316L stainless steel. J. Manuf. Process. 2020, 58, 964–974. [Google Scholar] [CrossRef]
  32. Yuan, W.H.; Chen, H.; Cheng, T.; Wei, Q.S. Effects of laser scanning speeds on different states of the molten pool during selective laser melting: Simulation and experiment. Mater. Des. 2020, 189, 108542. [Google Scholar] [CrossRef]
  33. Wei, H.L.; Cao, Y.; Liao, W.H.; Liu, T.T. Mechanisms on inter-track void formation and phase transformation during laser Powder Bed Fusion of Ti-6Al-4V. Addit. Manuf. 2020, 34, 101221. [Google Scholar] [CrossRef]
  34. Wang, Z.; Yan, W.; Liu, W.K.; Liu, M. Powder-scale multi-physics modeling of multi-layer multi-track selective laser melting with sharp interface capturing method. Comput. Mech. 2018, 63, 649–661. [Google Scholar] [CrossRef]
  35. Al-Hashemi, H.M.B.; Al-Amoudi, O.S.B. A review on the angle of repose of granular materials. Powder Technol. 2018, 330, 397–417. [Google Scholar] [CrossRef]
  36. Zhao, H.Y.; An, X.Z.; Gou, D.Z.; Zhao, B.; Yang, R.Y. Attenuation of pressure dips underneath piles of spherocylinders. Soft Matter 2018, 14, 4404–4410. [Google Scholar] [CrossRef]
  37. Xu, W.; Du, Z.H.; Wang, Z.; Ran, X.; Li, Z.Y.; Chen, R.; Zhu, X.Y.; Zhang, X.H.; Zhang, J.Z.; Lin, X. A comparative study on the corrosion, wear, and tribocorrosion performances of Ti-6.5Al-2Zr-1Mo-1V (TA15) alloy fabricated by selective laser melting and laser metal deposition. J. Mater. Res. Technol. 2024, 30, 6245–6253. [Google Scholar] [CrossRef]
  38. Wang, L.; Li, E.L.; Shen, H.; Zou, R.P.; Yu, A.B.; Zhou, Z.Y. Adhesion effects on spreading of metal powders in selective laser melting. Powder Technol. 2020, 363, 602–610. [Google Scholar] [CrossRef]
Figure 1. (a) Size distribution and SEM morphology (inset image); (b) chemical composition of Ti65 powder.
Applsci 15 06220 g001
Figure 2. (a) Experimental (left) and numerical (right) setups; (b) comparison between numerically and experimentally measured AOR and packing density.
Applsci 15 06220 g002
Figure 3. Schematic illustration of the multi-layer powder spreading process, where W is the width of the powder layer; H represents the height between the blade and substrate; and V is the spreading velocity, with its base value being 0.100 m/s.
Applsci 15 06220 g003
Figure 4. Illustration of the melting process, where (a) powder bed before printing; (b) printing process; (c) printing strategy.
Applsci 15 06220 g004
Figure 5. Comparison of powder spreading (Hset = 60 μm, V = 0.100 m/s) and selective melting (printing power p = 250 W, printing speed Vp = 1.40 m/s) between numerical simulations and physical experiments, showing (a) morphology and (b) porosity of the first powder layer, and (c) morphology and (d) size of the printed region.
Applsci 15 06220 g005
Figure 6. Morphologies of powder beds over successive printed layers (V = 0.100 m/s).
Applsci 15 06220 g006
Figure 7. Packing density (a) and Ra (b) of the powder bed across successive layers at different spreading velocities.
Applsci 15 06220 g007
Figure 8. Uniformity (a) and Hreal (b) of the powder bed across successive layers at different spreading velocities.
Applsci 15 06220 g008
Figure 9. Particle rearrangement of each layer in the printed region when V = 0.075 m/s (a), V = 0.100 m/s (b), and V = 0.125 m/s (c).
Applsci 15 06220 g009
Figure 10. CN evolution of all particles (a) and large particles (b) in each layer in the printed region under different spreading velocities.
Applsci 15 06220 g010
Figure 11. Radical subunit (polyhedron) and tessellation (a) and pore size distribution (b) of each powder layer in the printed region under different conditions.
Applsci 15 06220 g011
Figure 12. Morphologies of powder beds across different zones (layer 2 and layer 4, V = 0.075 m/s).
Applsci 15 06220 g012
Figure 13. Packing density (a), Ra (b), coefficient of variation (c), and Hreal (d) of different zones from layer 1 to layer 6 when V = 0.075 m/s.
Applsci 15 06220 g013
Figure 14. CN (a) and pore size distribution of different zones (b) in powder layer 6 when V = 0.075 m/s.
Applsci 15 06220 g014
Figure 15. Height distributions of different powder zones obtained from different V.
Applsci 15 06220 g015
Figure 16. (a) Morphology of powder bed at layer 6 across three subzones when V = 0.075 m/s; (bd) evolutions of particle velocity in Zones A1, A2 and A3, respectively.
Applsci 15 06220 g016
Figure 17. (a) Average contact forces of particles in Zone A4; (b,c) motion behaviors of particles in low-velocity zone and around the voids, respectively.
Applsci 15 06220 g017
Table 1. Simulation parameters used in DEM model.
ParametersValues
Particle size, D, μmD50 = 38.7, D90 = 61.5
Poisson’s ratio, υ, -0.28
Density, ρ, kg/m34540
Young’s modulus, E, GPa117
Coefficient of restitution, e, -0.775
Coefficient of sliding friction, μs, -0.564
Coefficient of rolling friction, μr, -0.012
Surface energy, γ, J/m20.0002
Acceleration of gravity, g, m/s29.8
Disclaimer/Publisher’s Note: The statements, opinions and data contained in all publications are solely those of the individual author(s) and contributor(s) and not of MDPI and/or the editor(s). MDPI and/or the editor(s) disclaim responsibility for any injury to people or property resulting from any ideas, methods, instructions or products referred to in the content.

