
The Multistate Reliability Assessment of Ship Hull Girders


Abstract
1. Introduction
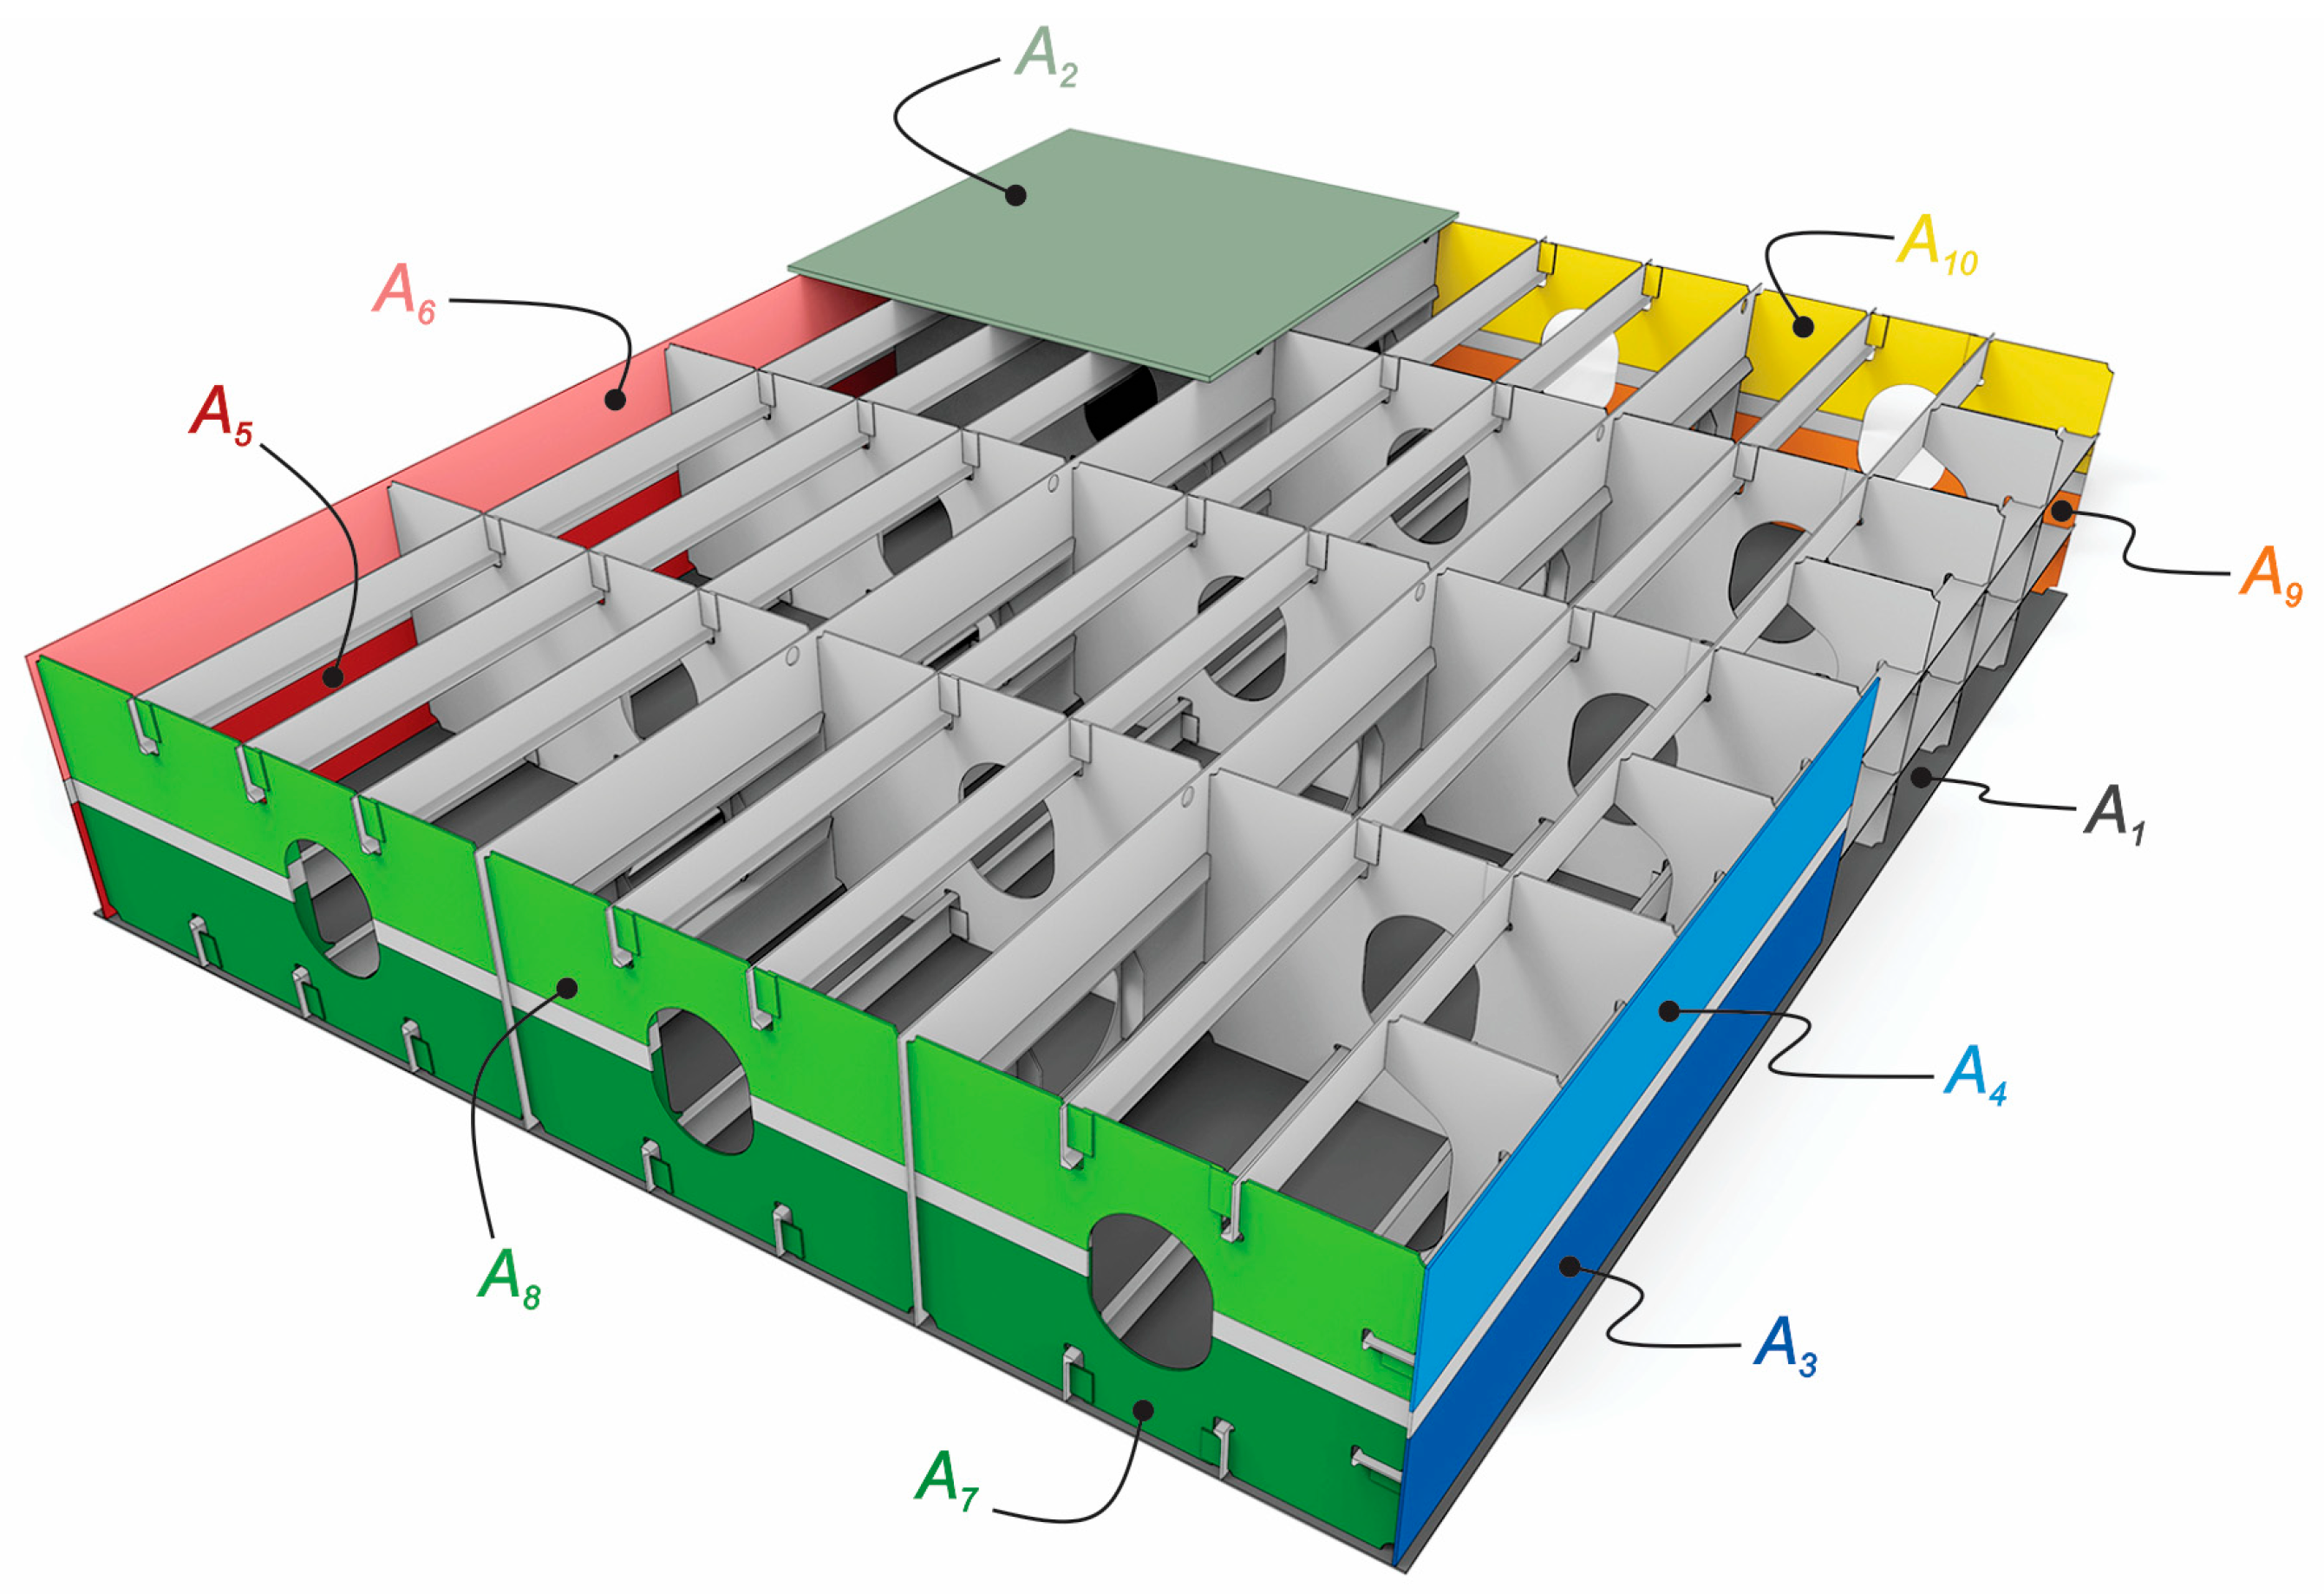
2. Materials
- -
- A total of 25 aging bulk carriers between five and twenty-five years of age;
- -
- The period investigated, between 2005 and 2017;
- -
- The analysis results of 38 varied special surveys.
3. Methodology
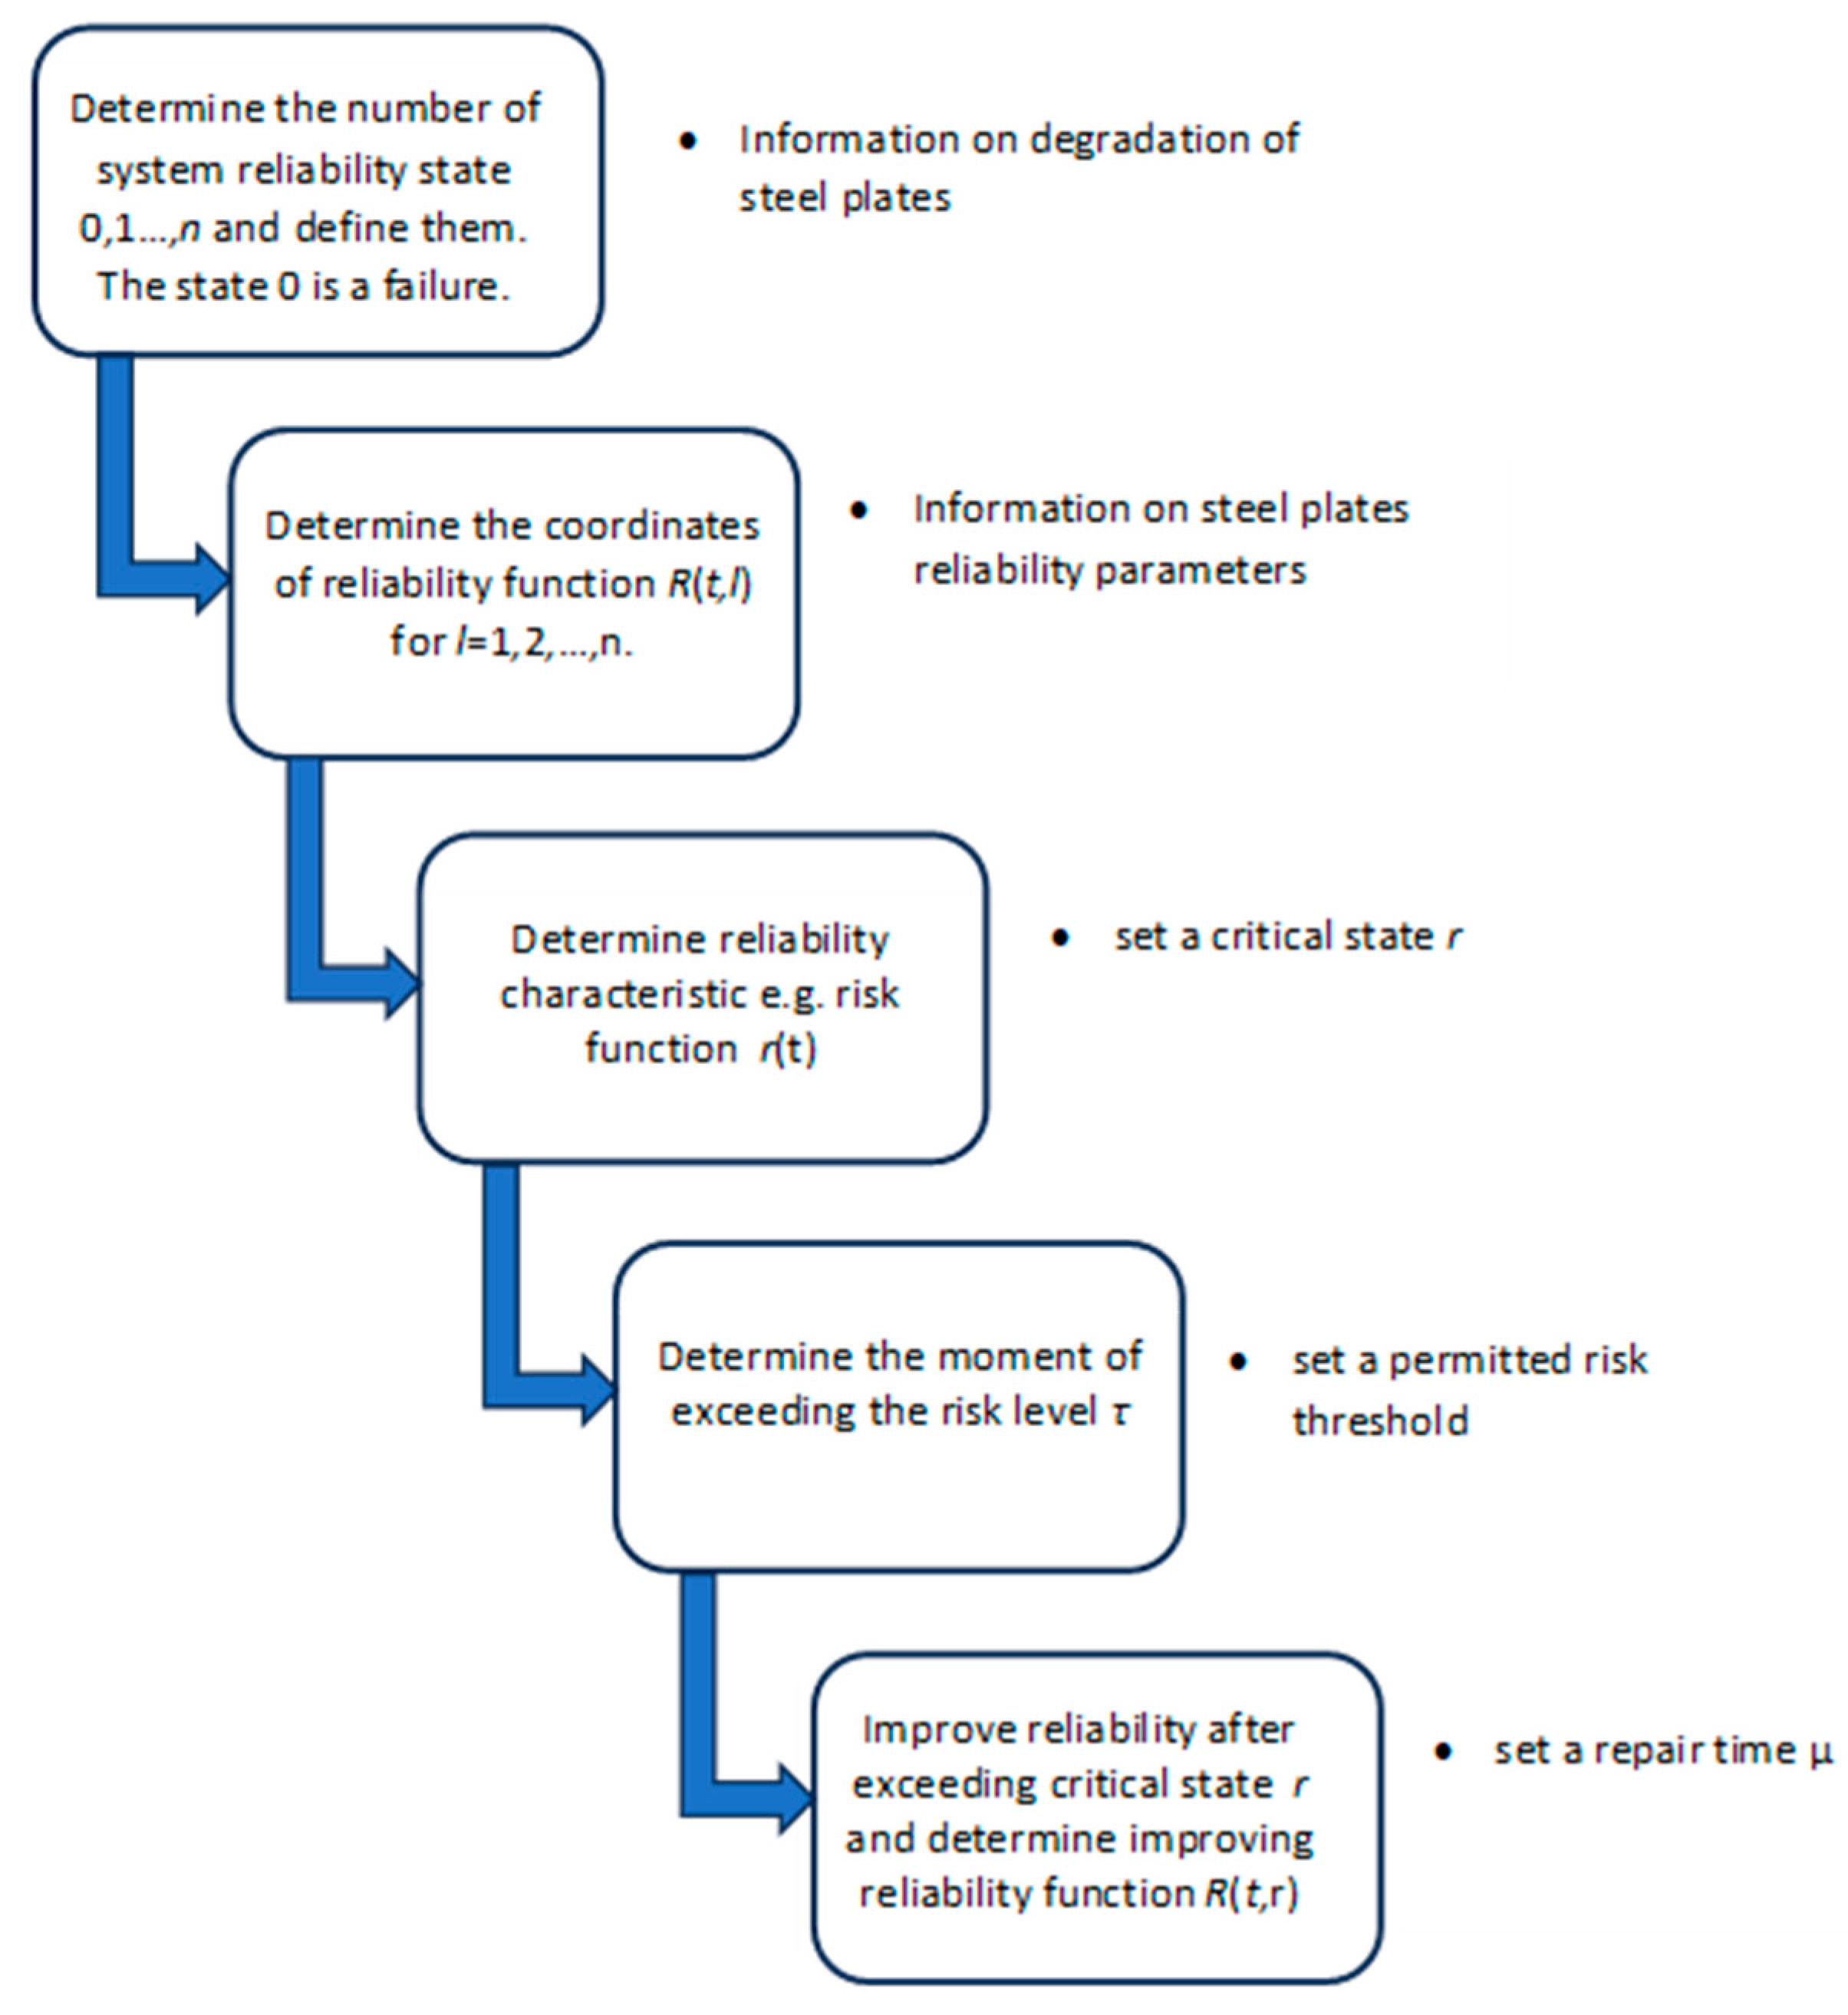
3.1. Multistate Approach to Reliability Analysis of Longitudinal Watertight Girder Plating
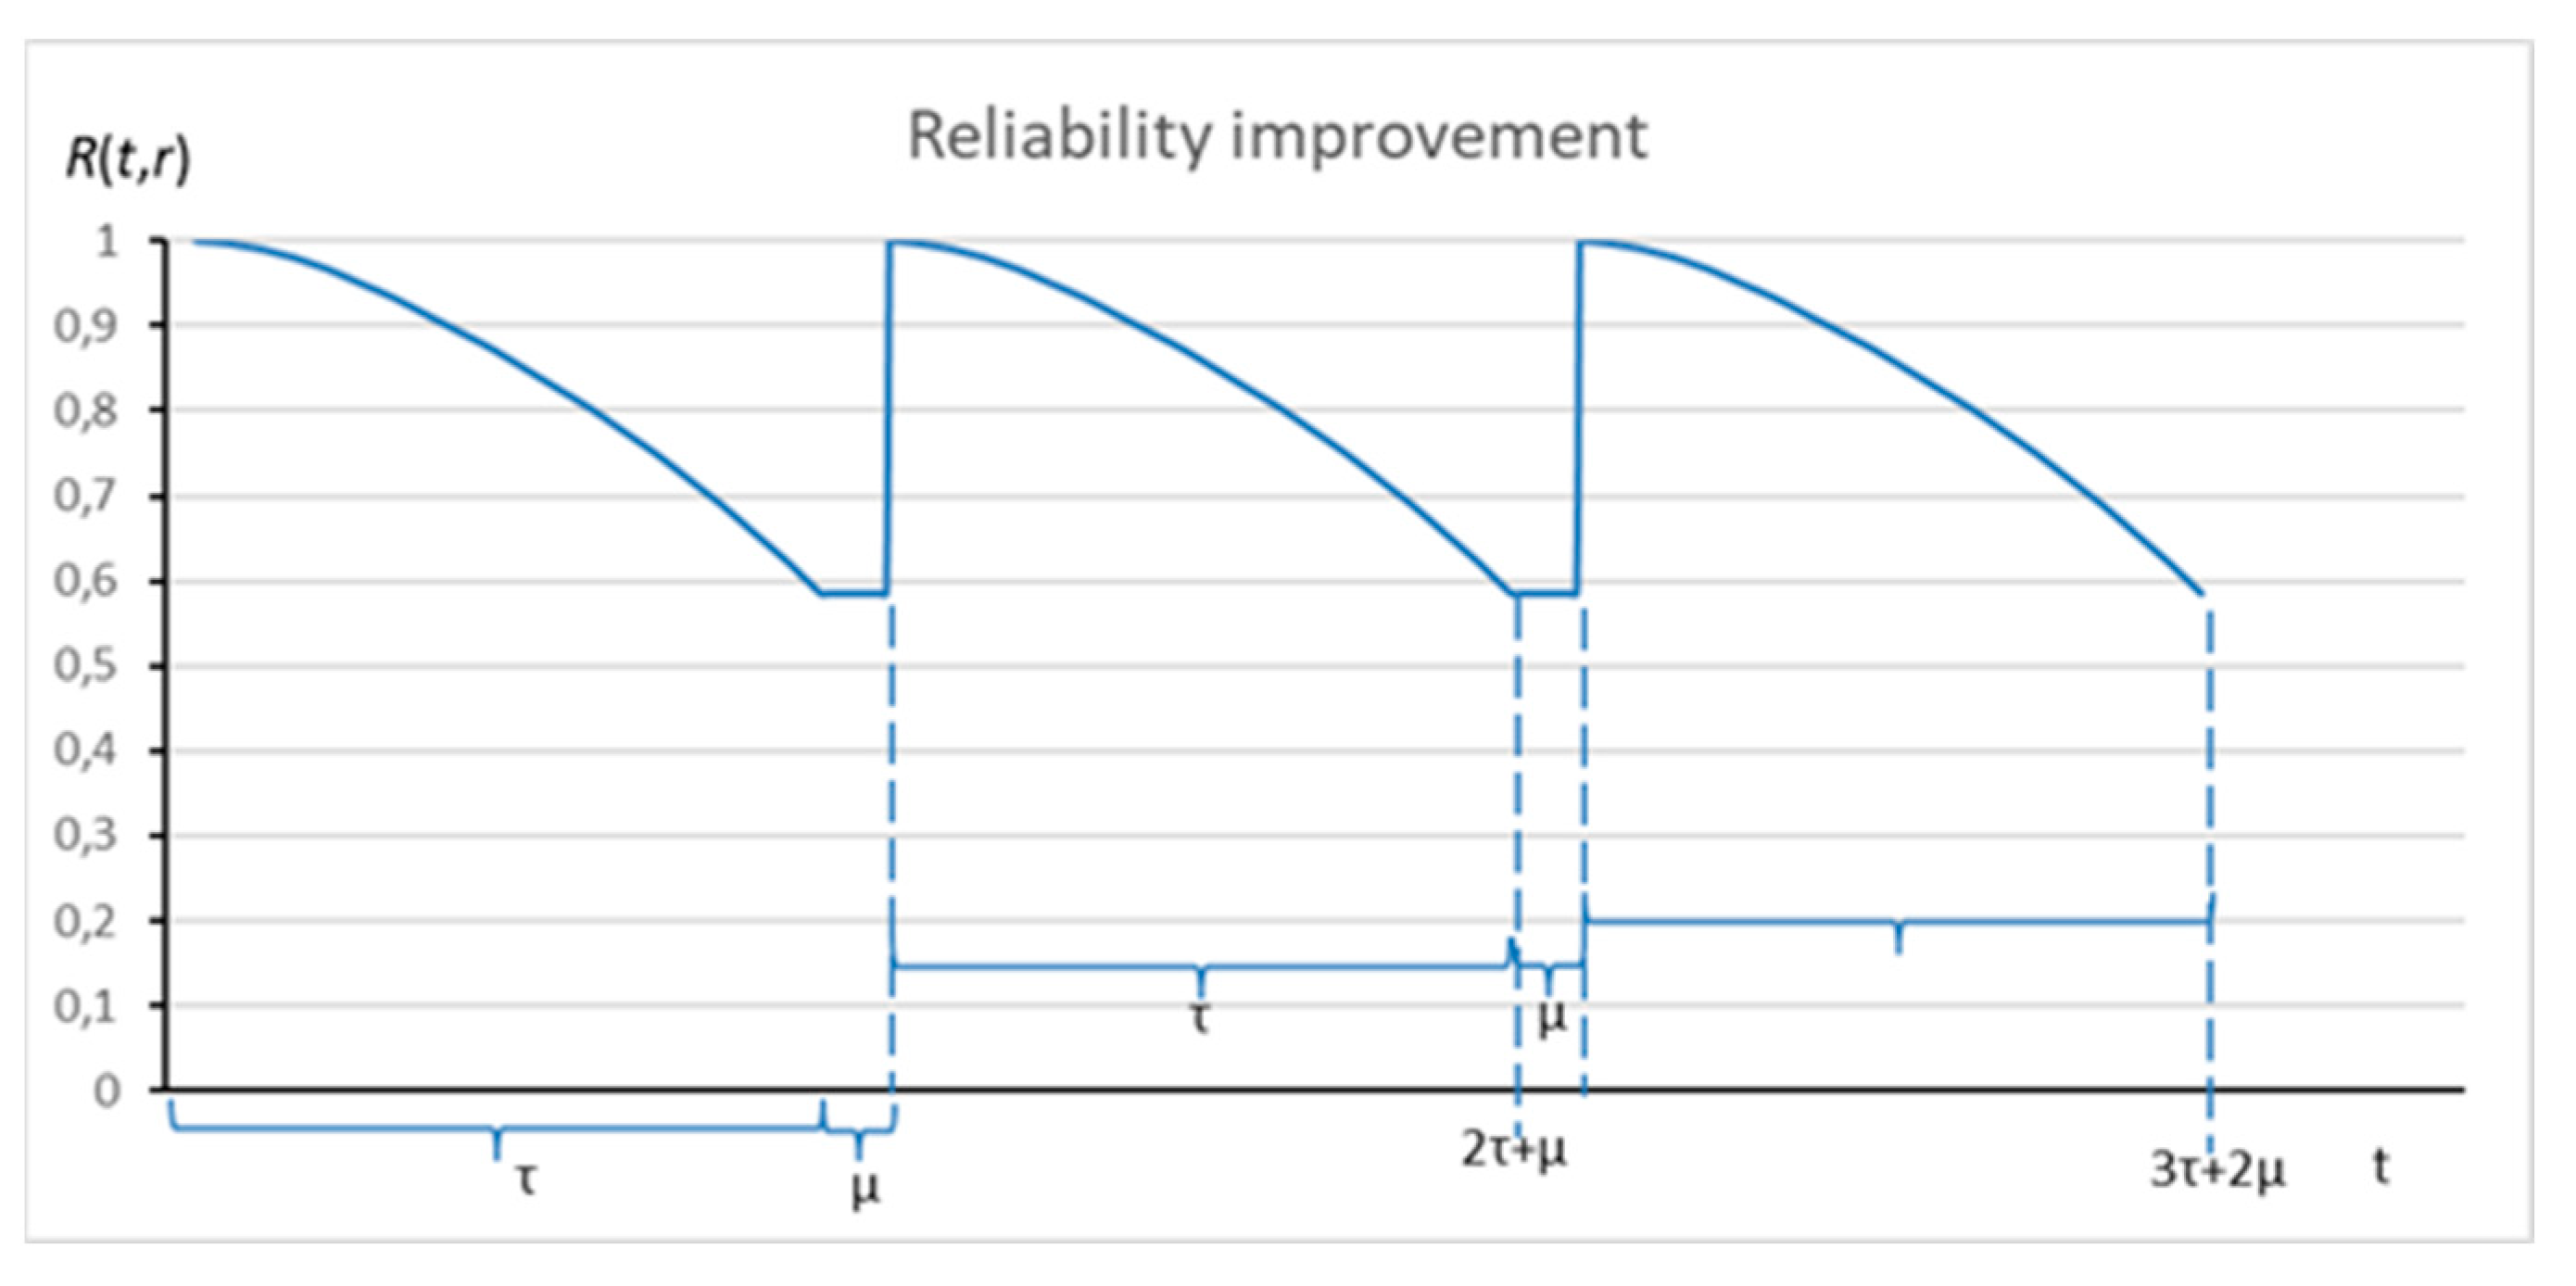
3.2. Improving Reliability
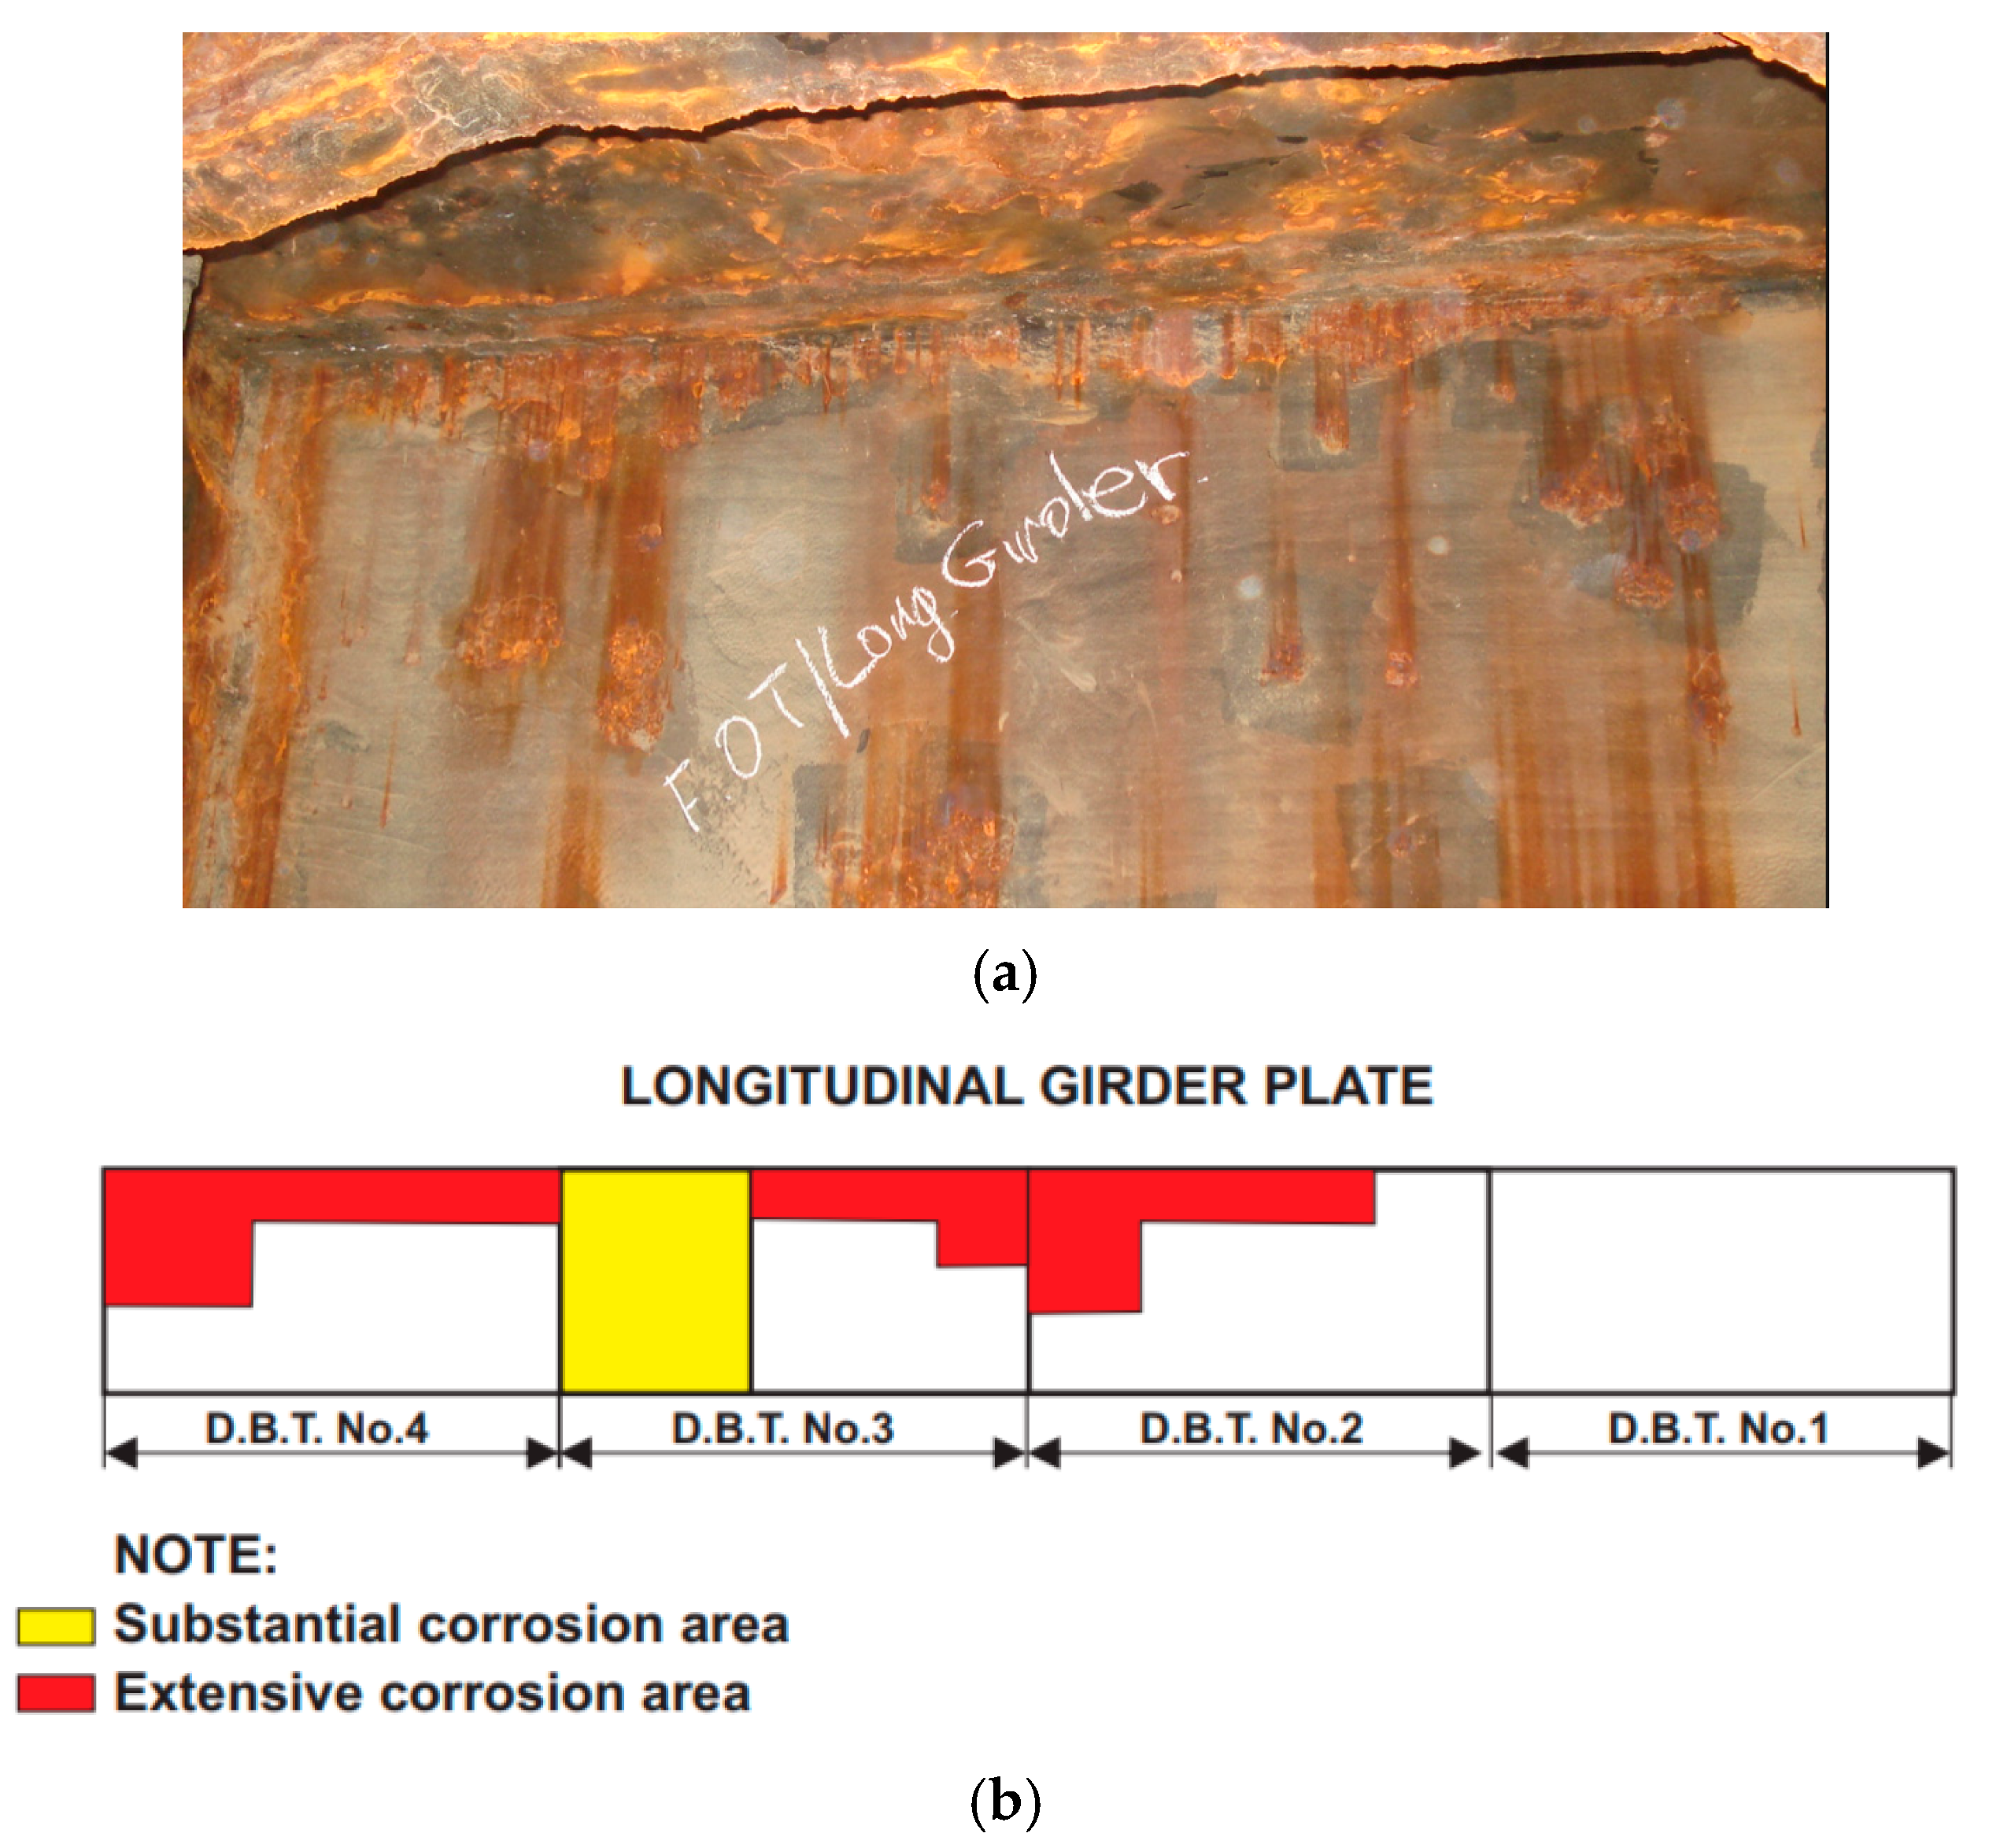
4. Results of Reliability Analysis of Longitudinal Watertight Girder Plating
4.1. Estimation of Reliability and Risk
- Second state of reliability—The system works and is totally safe; the corrosion wear of steel plates is in the range of <0.15%).
- First state of reliability—The system works, but its operation is less safe, which may cause environmental pollution, cargo damage, decrease the ship’s safety, etc.; the corrosion wear of steel plates is in the range of <15%, 20%).
- Zeroth state of reliability—The system is damaged (not fulfilling (regulatory) requirements); the corrosion wear of steel plates exceeds 20%.
4.2. Reliability Improvement
- -
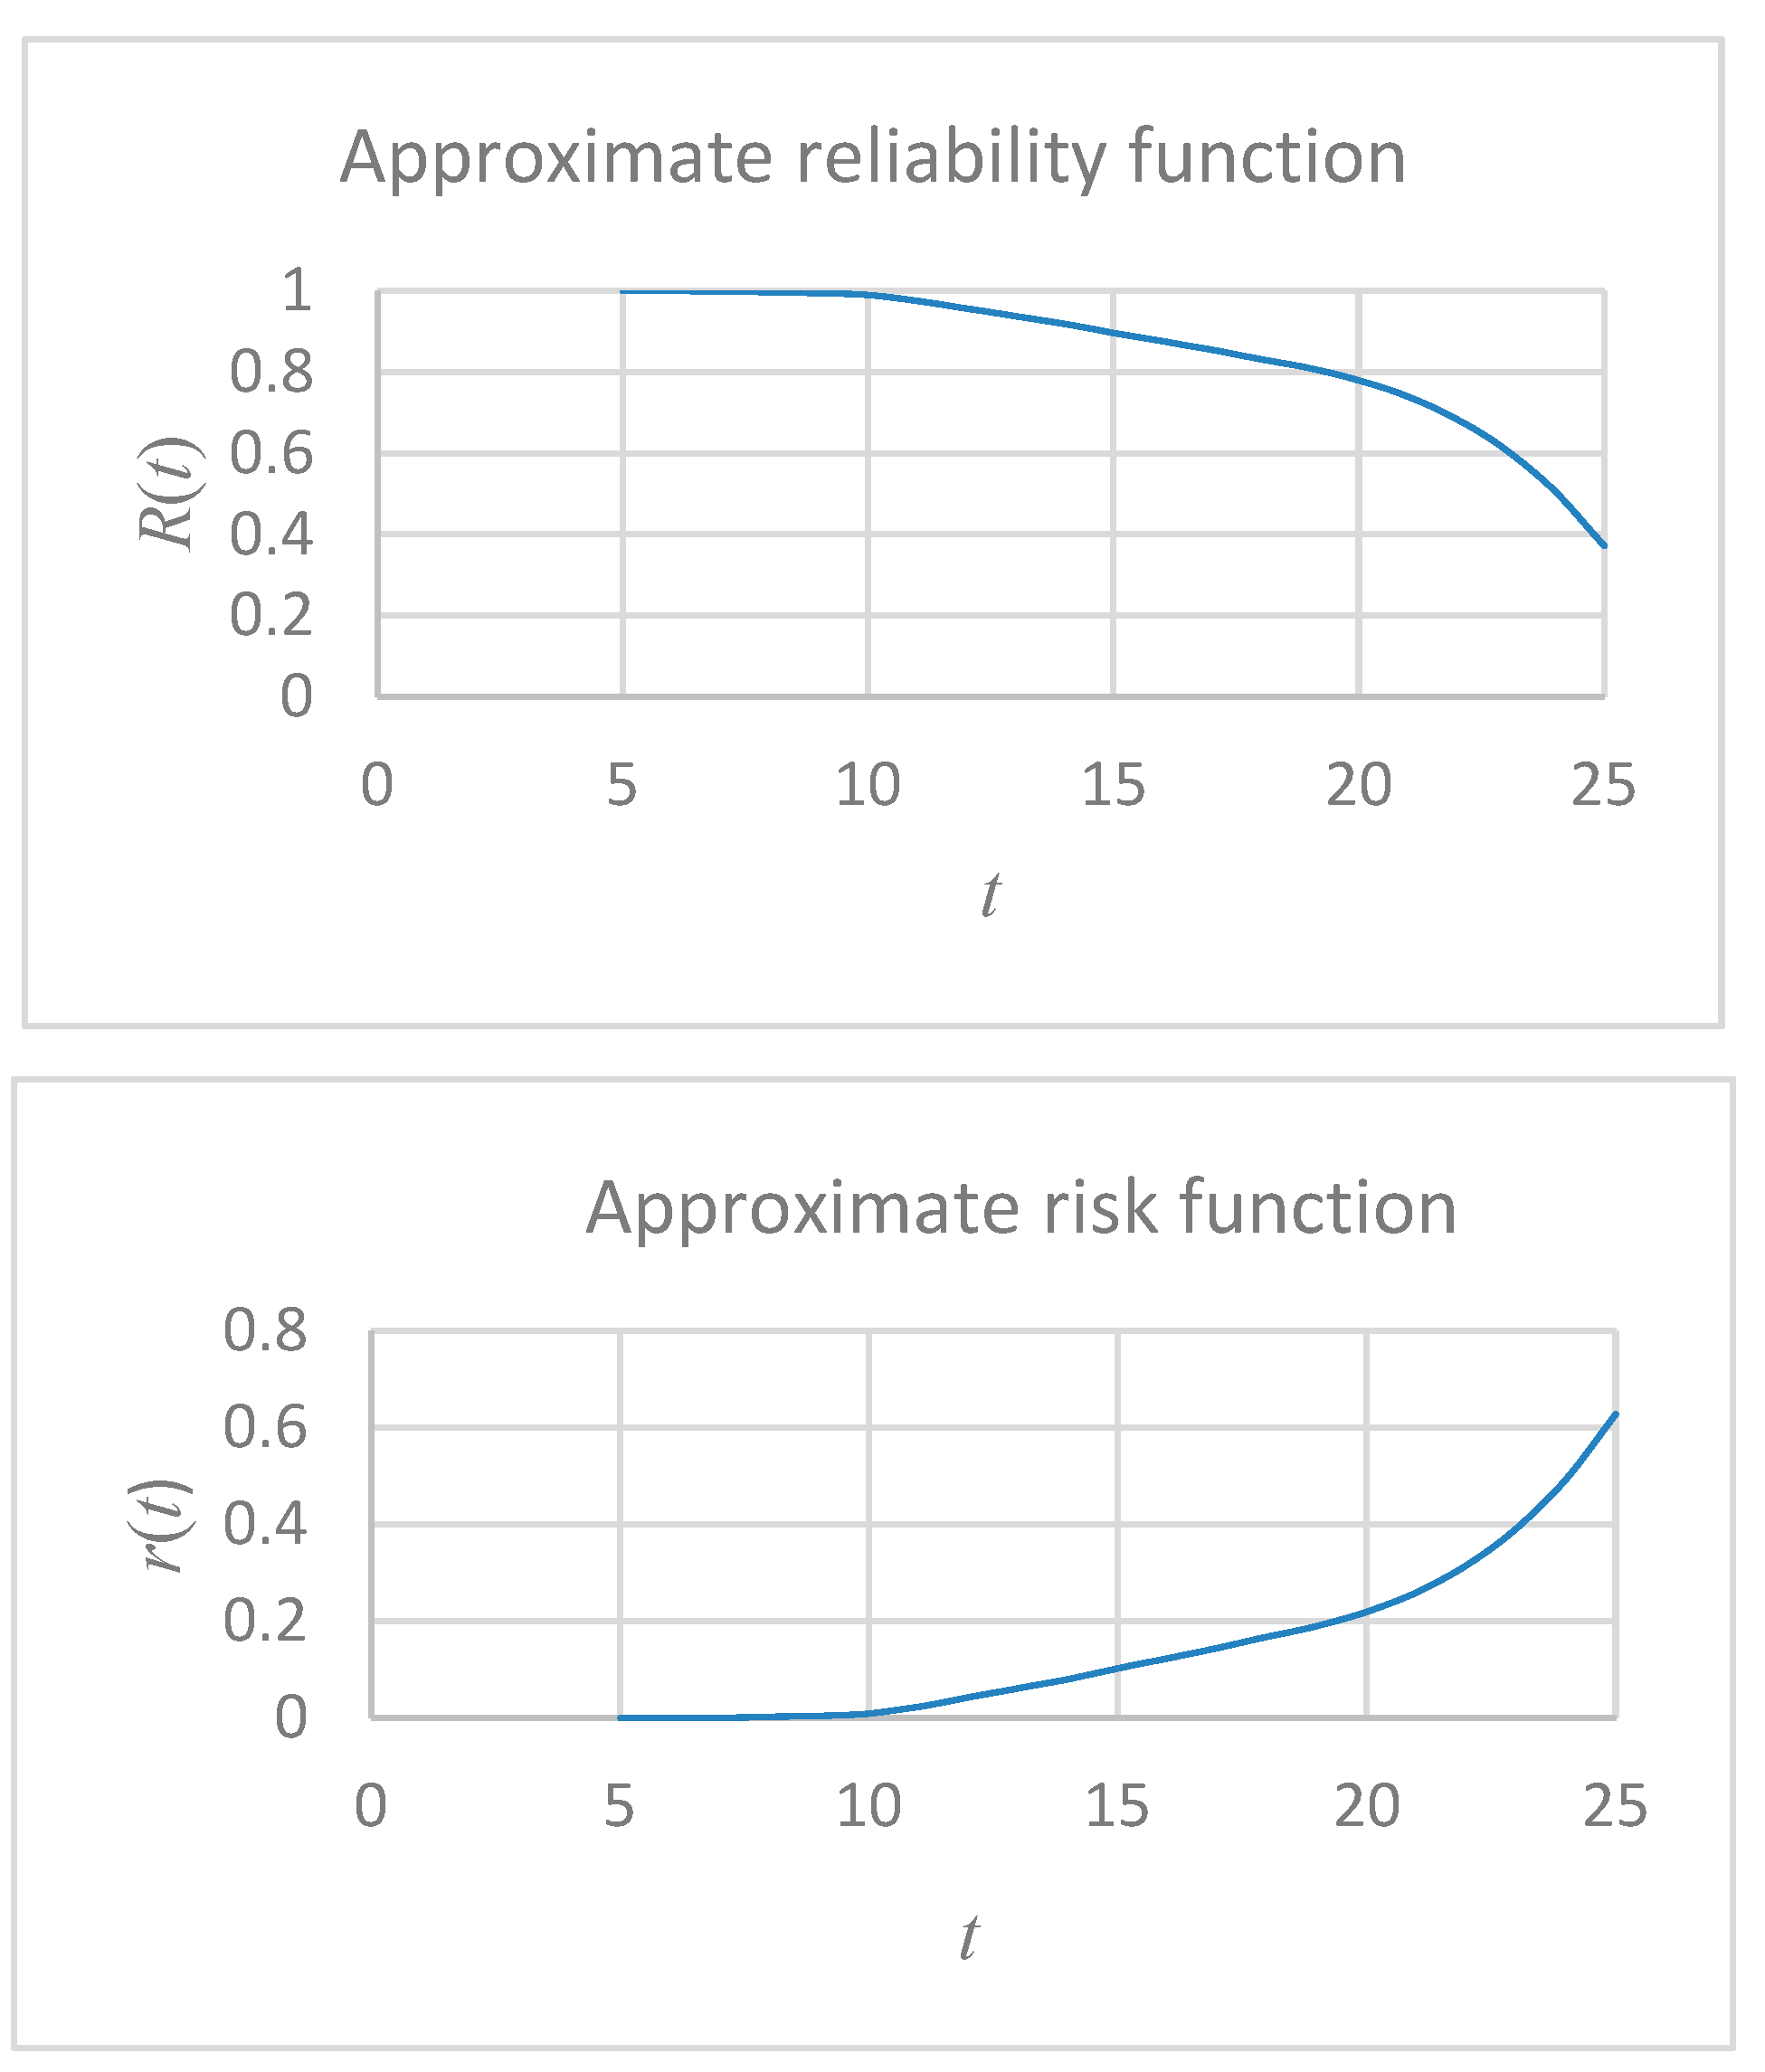
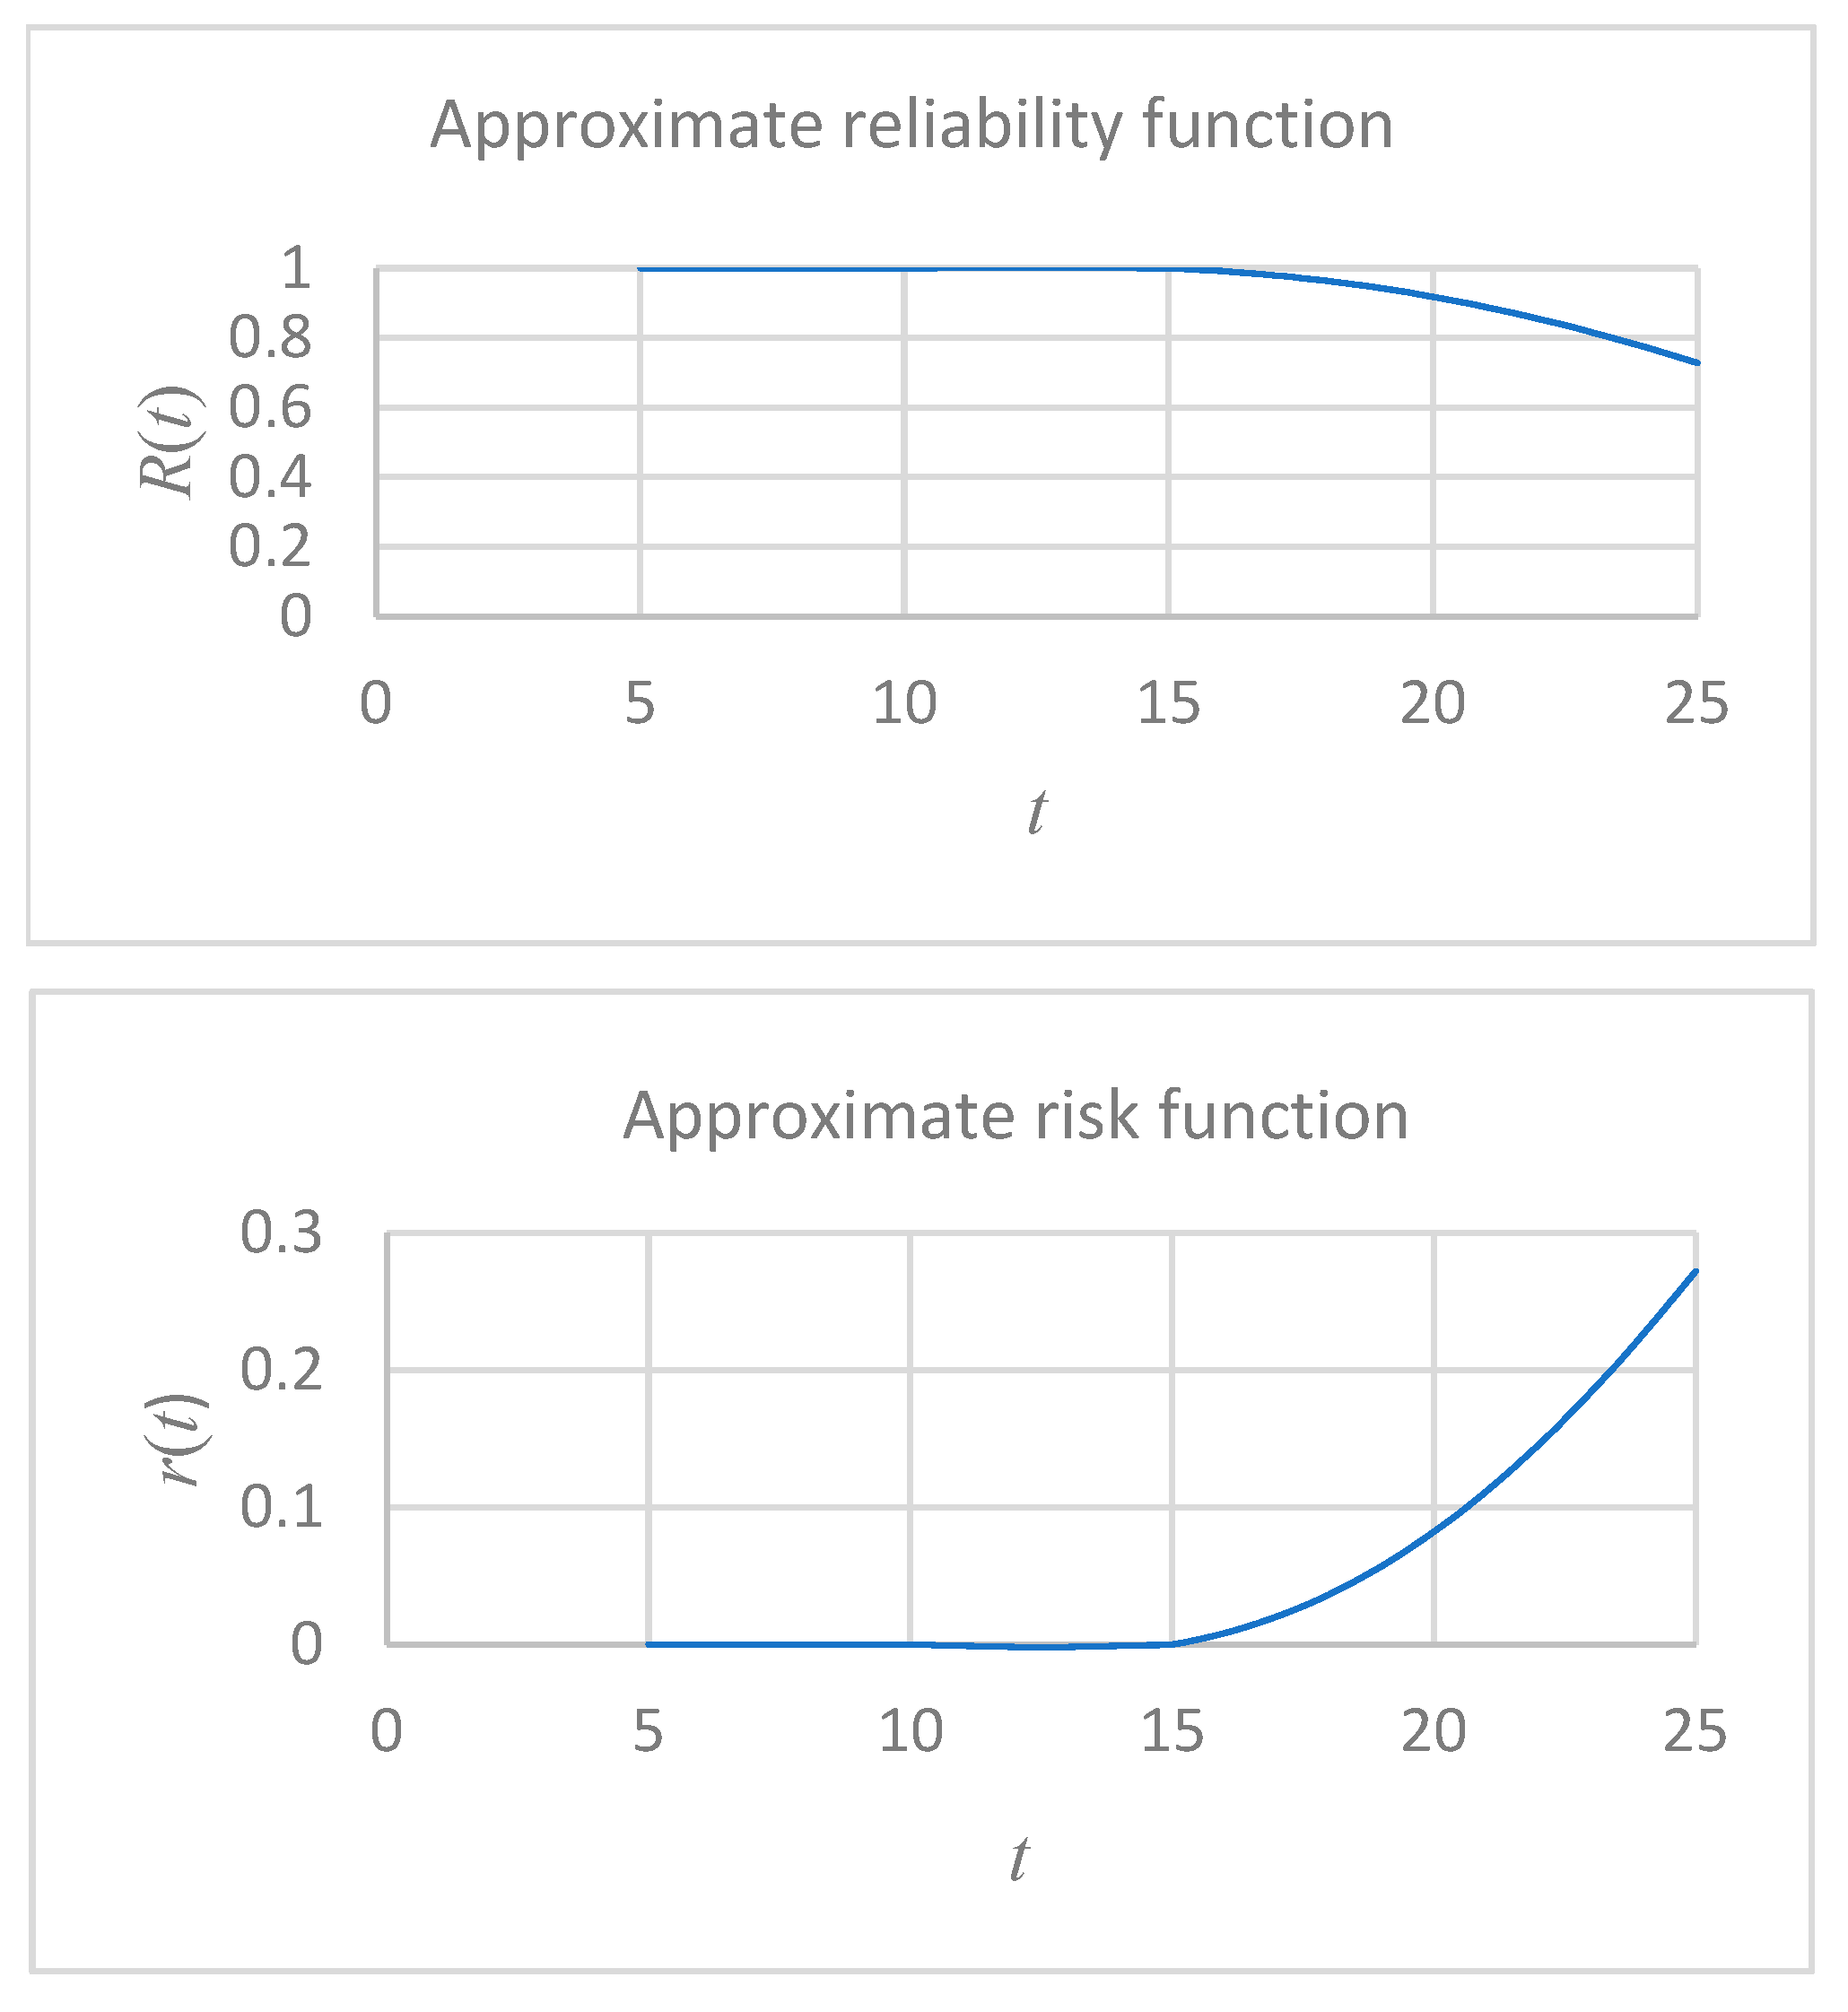
- For the upper side of girders, reliability is improved upon the second special survey, i.e., after ten years.
- -
- For the lower side of girders, reliability is improved upon the fourth special survey, i.e., after twenty years.
5. Conclusions
Author Contributions
Funding
Institutional Review Board Statement
Informed Consent Statement
Data Availability Statement
Acknowledgments
Conflicts of Interest
References
- Knapp, S.; Bijwaard, G.; Heij, C. Estimated incident cost savings in shipping due to inspections. Accid. Anal. Prev. 2011, 43, 1532–1539. [Google Scholar] [CrossRef] [PubMed]
- Heij, C.; Knapp, S. Shipping inspections, detentions, and incidents: An empirical analysis of risk dimensions. Marit. Policy Manag. 2019, 46, 866–883. [Google Scholar] [CrossRef]
- EMSA, European Maritime Safety Agency. Annual Overview of Marine Casualties and Incidents 2019; EMSA: Lisbon, Portugal, 2019. [Google Scholar]
- Małyszko, M. Analysis of the relationships between factors contributing to marine casualties. Appl. Sci. 2024, 14, 3870. [Google Scholar] [CrossRef]
- Wang, G.; Boon, B.; Brennan, F.P.; Garbatov, Y.; Ji, C.; Parunov, J.; Rahman, T.A.; Rizzo, C.; Rouhan, A.; Shin, C.H.; et al. Commıttee V.6, Condıtıon assessment of aged shıps and offshore structures. In Proceedings of the 17th International Ship and Offshore Structures Congress, Seoul, Republic of Korea, 16–21 August 2009. [Google Scholar]
- Zriouel, W.; Bentis, A.; Majid, S.; Hammouti, B.; Gmouh, S.; Umoren, P.S.; Umoren, S.A. The blue tansy essential oil–Petra/Osiris/ Molinspiration (POM) analyses and prediction of its corrosion inhibition performance based on chemical composition. Sustainability 2023, 15, 14274. [Google Scholar] [CrossRef]
- IACS. Common Structural Rules for Bulk Carriers and Oil Tankers; IACS: Kolkata, India, 2024. [Google Scholar]
- IACS. TB Report. In Corrosion Additions and Wastage Allowance; Report No., Pt 1, CH 3, Sec 3; IACS: Kolkata, India, 2014. [Google Scholar]
- Woloszyk, K.; Garbatov, Y. Advances in Modelling and Analysis of Strength of Corroded Ship Structures. J. Mar. Sci. Eng. 2022, 10, 807. [Google Scholar] [CrossRef]
- Ivošević, Š.; Meštrović, R.; Kovač, N. Probabilistic estimates of corrosion rate of fuel tank structures of aging bulk carriers. Int. J. Nav. Archit. Ocean Eng. 2019, 11, 165–177. [Google Scholar] [CrossRef]
- Bosen, L.; Xinghui, D. Ship hull inspection. A survey. Ocean Eng. 2023, 289, 1–36. [Google Scholar] [CrossRef]
- Barbulescu, A.; Dumitriu, C.S. Fractal Characterization of Brass Corrosion in Cavitation Field in Seawater. Sustainability 2023, 15, 3816. [Google Scholar] [CrossRef]
- Poggi, L.; Gaggero, T.; Gaiotti, M.; Ravina, E.; Rizzo, C. Recent developments in remote inspections of ship structures. Int. J. Nav. Archit. Ocean Eng. 2020, 12, 881–891. [Google Scholar] [CrossRef]
- Li, X.; Zhang, X.; Yuan, Y. Dynamic Multi-Attribute Decision-Making Method for Risk-Based Ship Design. Appl. Sci. 2024, 14, 5387. [Google Scholar] [CrossRef]
- Madusanka, N.S.; Fan, Y.; Yang, S.; Xiang, X. Digital twin in the maritime domain: A review and emerging trends. J. Mar. Sci. Eng. 2023, 11, 1021. [Google Scholar] [CrossRef]
- Pagonis, D.N. Sensors and Measurement Systems for Marine Engineering Applications. Appl. Sci. 2024, 14, 3761. [Google Scholar] [CrossRef]
- Kovač, N.; Ivošević, S.; Momčilović, N. Corrosion-induced thickness diminution of an ageing bulk carrier. Shipbuild. Theory Pract. Nav. Archit. 2024, 75, 75404. [Google Scholar] [CrossRef]
- Qin, S.; Cui, W. Effect of corrosion models on the time-dependent reliability of steel plated elements. Mar. Struct. 2003, 16, 15–34. [Google Scholar] [CrossRef]
- Guedes Soares, C.; Garbatov, Y. Reliability of maintained ship hulls subjected to corrosion. J. Ship Res. 1996, 40, 235–243. [Google Scholar] [CrossRef]
- Paik, J.K.; Lee, J.M.; Park, Y.I.; Hwang, J.S.; Kim, C.W. Time–variant ultimate longitudinal strength of corroded bulk carriers. Mar. Struct. 2003, 16, 567–600. [Google Scholar] [CrossRef]
- Ivošević, Š.; Kovač, N.; Momčilović, N.; Vukelić, G. Evaluation of the corrosion depth of double bottom longitudinal girder on aging bulk carriers. J. Mar. Sci. Eng. 2022, 10, 1425. [Google Scholar] [CrossRef]
- Soszyńska-Budny, J.; Ivošević, S. A Multistate Approach to Reliability Analyses of a Ship Hull Structure. Int. J. Mar. Navig. Saf. Sea Transp. 2024, 18, 897–904. [Google Scholar] [CrossRef]
- Kołowrocki, K.; Soszyńska-Budny, J. Reliability and Safety of Complex Technical Systems and Processes: Modeling-Identification-Prediction–Pptimization; Springer: London, UK; Dordrecht, The Netherlands; Berlin/Heildeberg, Germany; New York, NY, USA, 2011. [Google Scholar]
- Kołowrocki, K. Reliability of Large Systems; Elsevier: Amsterdam, The Netherlands, 2004. [Google Scholar]

| The Age of Ships (Years) | The Number of Ship Surveys | The Number of Tanks | The Number of Measured Points | The Number of Sections | The Mean Values of Plate Thickness Diminution Caused by Corrosion (%) | |
|---|---|---|---|---|---|---|
| Lower | Upper | |||||
| 0–5 | 4 | 9 | 180 | 45 | 0.3% | 0.4% |
| 5–10 | 4 | 10 | 200 | 55 | 0.6% | 1.4% |
| 10–15 | 7 | 19 | 380 | 100 | 1.1% | 6.7% |
| 15–20 | 13 | 43 | 800 | 220 | 4.8% | 9.9% |
| 20–25 | 10 | 29 | 360 | 150 | 9.6% | 23.0% |
| Total: | 38 | 110 | 1920 | 570 | ||
| Time (Year) | Number of Measurements That Are <0.15%) of the Original Thickness | Number of Measurements That Are <15%, 20%) of the Original Thickness | Number of Measurements That Exceed 20% of the Original Thickness |
|---|---|---|---|
| 0–5 | 90 | 0 | 0 |
| 5–10 | 99 | 0 | 1 |
| 10–15 | 152 | 16 | 22 |
| 15–20 | 299 | 13 | 88 |
| 20–25 | 65 | 2 | 113 |
| Time (Years) | Number of Measurements | Number of Measurementsin Reliability State Subset {0, 1, 2} | Number of Measurements in Reliability State Subset {1, 2} | Number of Measurements in Reliability State Subset {2} |
|---|---|---|---|---|
| 0–5 | 90 | 90 | 90 | 90 |
| 5–10 | 100 | 100 | 99 | 99 |
| 10–15 | 190 | 190 | 168 | 152 |
| 15–20 | 400 | 400 | 312 | 299 |
| 20–25 | 180 | 180 | 67 | 65 |
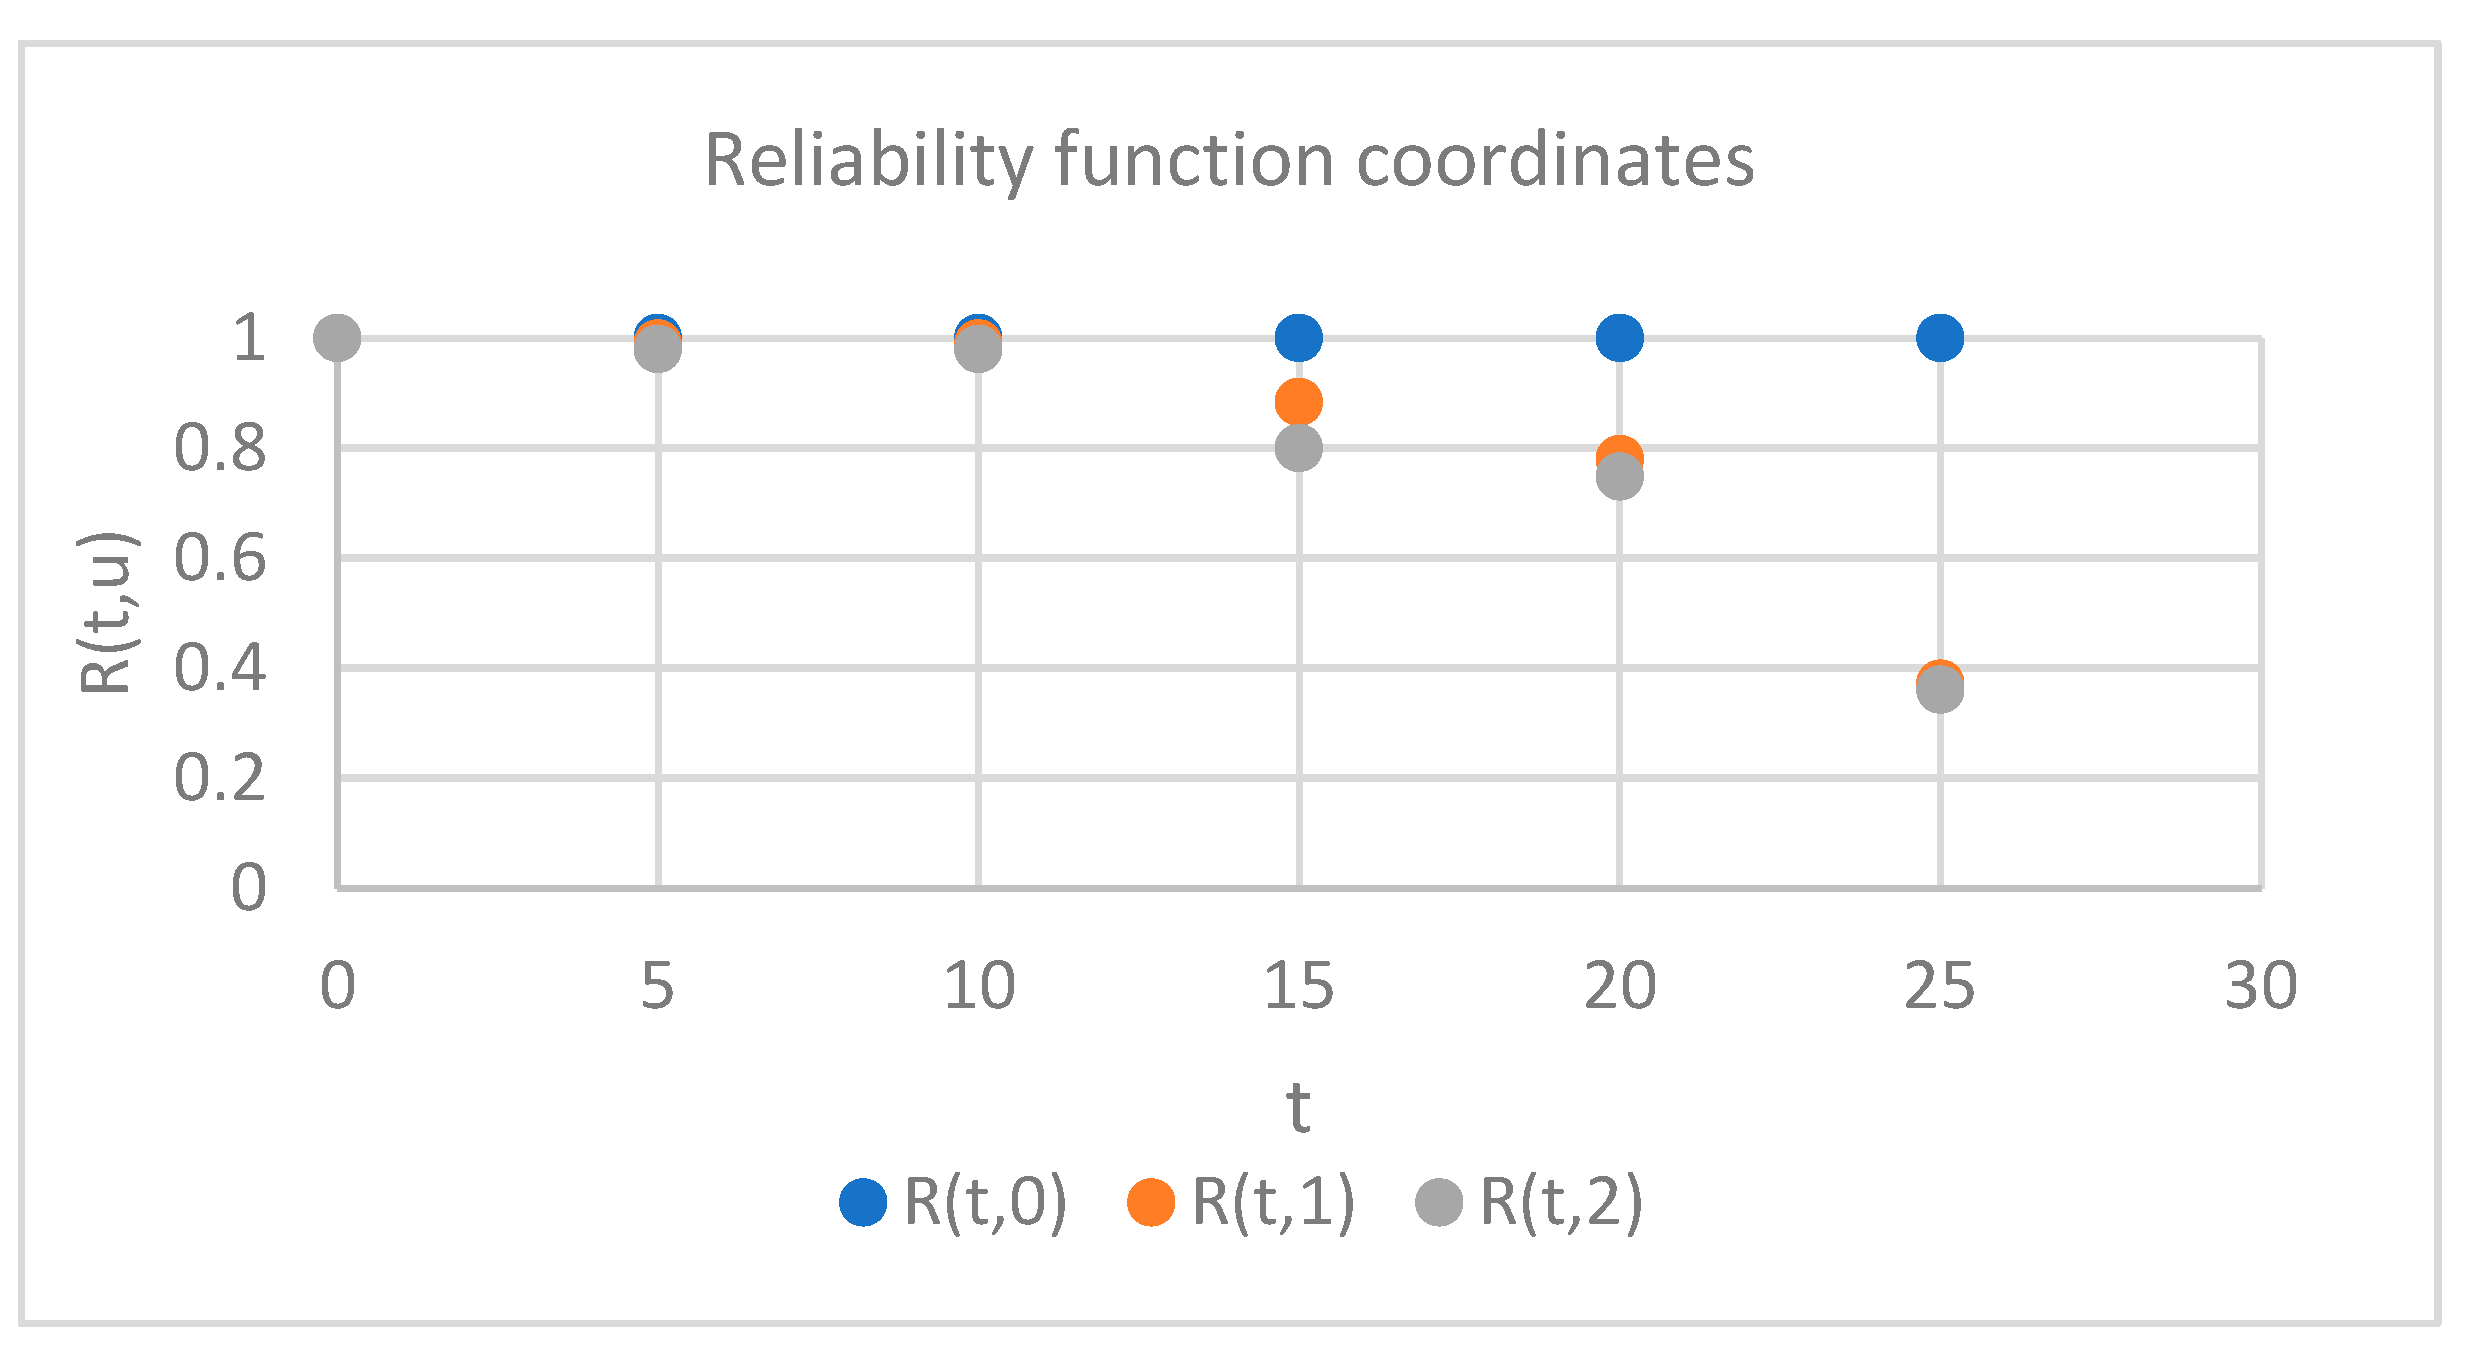
| Time (Years) | R(t, 0) | R(t, 1) | R(t, 2) |
|---|---|---|---|
| 5 | 1 | 1 | 1 |
| 10 | 1 | 0.99 | 0.99 |
| 15 | 1 | 0.884 | 0.800 |
| 20 | 1 | 0.780 | 0.748 |
| 25 | 1 | 0.372 | 0.361 |
| Time (Years) | Number of Measurements That Are <0.15%) of the Original Thickness | Number of Measurements That Are <15%, 20%) of the Original Thickness | Number of Measurements That Exceed 20% of the Original Thickness |
|---|---|---|---|
| 0–5 | 90 | 0 | 0 |
| 5–10 | 100 | 0 | 0 |
| 10–15 | 190 | 0 | 0 |
| 15–20 | 364 | 3 | 33 |
| 20–25 | 130 | 1 | 49 |
| Time (Years) | Number of Measurements | Number of Measurementsin Reliability State Subset {0, 1, 2} | Number of Measurements in Reliability State Subset {1, 2} | Number of Measurements in Reliability State Subset {2} |
|---|---|---|---|---|
| 0–5 | 90 | 90 | 90 | 90 |
| 5–10 | 100 | 100 | 100 | 100 |
| 10–15 | 190 | 190 | 190 | 190 |
| 15–20 | 400 | 400 | 367 | 364 |
| 20–25 | 180 | 180 | 131 | 130 |
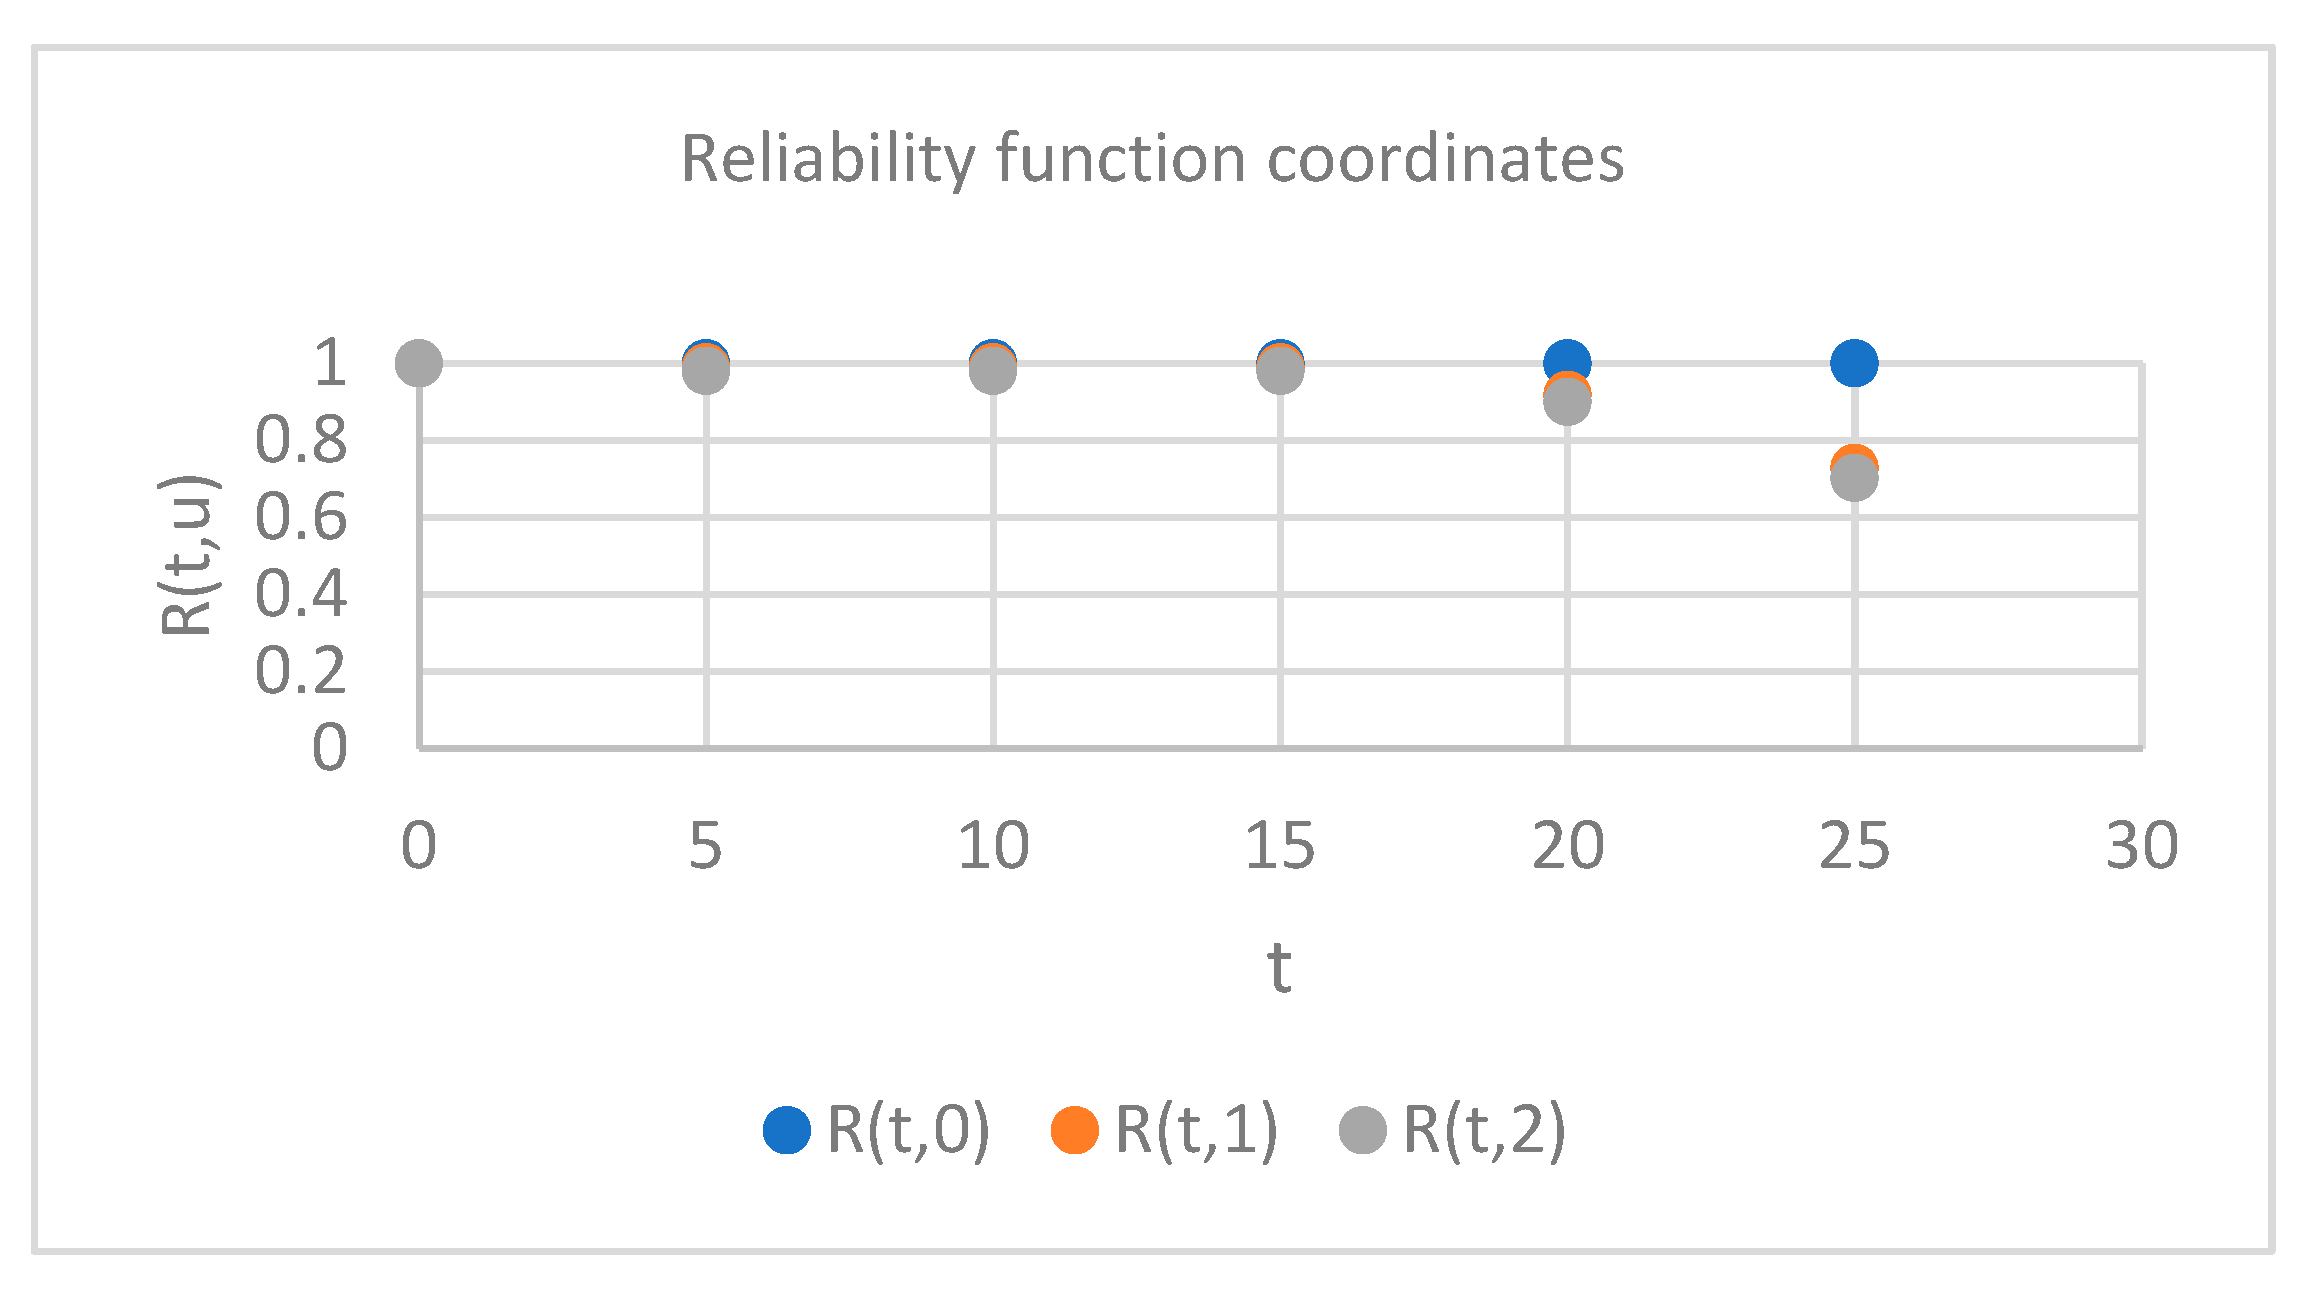
| Time (Years) | R(t, 0) | R(t, 1) | R(t, 2) |
|---|---|---|---|
| 5 | 1 | 1 | 1 |
| 10 | 1 | 1 | 1 |
| 15 | 1 | 1 | 1 |
| 20 | 1 | 0.918 | 0.910 |
| 25 | 1 | 0.728 | 0.722 |
Disclaimer/Publisher’s Note: The statements, opinions and data contained in all publications are solely those of the individual author(s) and contributor(s) and not of MDPI and/or the editor(s). MDPI and/or the editor(s) disclaim responsibility for any injury to people or property resulting from any ideas, methods, instructions or products referred to in the content. |
© 2025 by the authors. Licensee MDPI, Basel, Switzerland. This article is an open access article distributed under the terms and conditions of the Creative Commons Attribution (CC BY) license (https://creativecommons.org/licenses/by/4.0/).
Share and Cite
Soszyńska-Budny, J.; Ivošević, Š. The Multistate Reliability Assessment of Ship Hull Girders. Appl. Sci. 2025, 15, 6218. https://doi.org/10.3390/app15116218
Soszyńska-Budny J, Ivošević Š. The Multistate Reliability Assessment of Ship Hull Girders. Applied Sciences. 2025; 15(11):6218. https://doi.org/10.3390/app15116218
Chicago/Turabian StyleSoszyńska-Budny, Joanna, and Špiro Ivošević. 2025. "The Multistate Reliability Assessment of Ship Hull Girders" Applied Sciences 15, no. 11: 6218. https://doi.org/10.3390/app15116218
APA StyleSoszyńska-Budny, J., & Ivošević, Š. (2025). The Multistate Reliability Assessment of Ship Hull Girders. Applied Sciences, 15(11), 6218. https://doi.org/10.3390/app15116218