Abstract
Progressive damage evolution in rock masses serves as the fundamental mechanism driving geological hazards by controlling deformation patterns and failure predictability. To address the critical challenge of predicting fracture behaviors in heterogeneous geological media, this study pioneers the integration of real-time computed tomography (CT) scanning and acoustic emission (AE) monitoring to investigate self-organized criticality and fracture predictability in Cretaceous sandstone under uniaxial compression. By systematically analyzing internal structural evolution and damage parameters, this established a multiparameter framework to characterize self-organized processes and critical phase transitions during progressive fracturing. Key findings include the following: (1) Distinct critical thresholds emerge during yield-stage self-organization, marked by abrupt transitions in AE signals and crack metrics—from microdamage coalescence initiating volumetric expansion (first critical point) to macrocrack nucleation preceding peak strength (second critical point). (2) AE-crack evolution follows power–law statistics, where elevated scaling exponents (r > 0.85) correlate with intensified nonlinear damage, accelerated localization, and progressive rate enhancement. Yield-stage power–law acceleration provides quantifiable failure precursors. (3) Yield-stage damage patterns exhibit 85% similarity with terminal failure configurations, confirming yield-stage as the definitive precursor with critical temporal signatures for failure prediction. A conceptual framework integrating multiparameter responses (AE signals, crack metrics) was developed to decipher self-organized critical phase transitions during deformation-failure processes. This work establishes methodological foundations for investigating damage mechanisms and predictive strategies in heterogeneous rock systems.
1. Introduction
Solid rock failure poses a major scientific challenge, constraining the advancement of deep underground infrastructure. Rapid progress in China’s large-scale tunnel projects (e.g., the Sichuan–Tibet Railway) [1], the development of the world’s energy and the construction of the urban underground, which all have exacerbated high-stress hazards including microearthquakes [2], rockbursts, landslides, and gas outbursts [3]. These disasters not only endanger project safety and stability but also undermine environmental sustainability, human security, and socioeconomic progress. Rock’s inherent complexity, diversity, and nonlinearity—key attributes of Earth’s crustal materials—give rise to unpredictable and evolving fracture behaviors [4,5]. Fracture behavior results from the interaction between internal microstructures [6] and external stimuli (e.g., stress, temperature, fluid pressure) [7]. Specific combinations of internal and external factors can trigger rock mass fracturing, leading to catastrophic engineering geological events. On 24 May, 2024, a rockslide in Papua New Guinea killed over 2000 people. Weak rock interfaces and steep slopes synergistically compromised structural integrity, causing collapse. However, uncertainties remain about how stress, deformation, and crack fields evolve in deteriorating discontinuous rock masses [8]. Empirical studies and theoretical models lack sufficient capability to visualize and quantify rock deformation–failure processes [9]. Moreover, the relationships among stress distribution, fracture patterns, and loading conditions are poorly understood [10], hindering accurate disaster assessment and effective mitigation strategies. Therefore, understanding damage evolution and predicting fracture failure are now priorities in rock mechanics [11,12], offering key insights for improving fracture prediction methodologies [13].
The self-organized criticality (SOC) theory, initially proposed by Bak et al. (1987) [14], elucidates the spontaneous evolution of dissipative systems toward criticality and explains how complex systems self-organize into critical states. However, the pronounced nonlinearities in rock deformation and failure motivate the application of SOC theory to interpret the transition from disordered to ordered internal structures, offering novel insights into fracture propagation in complex nonlinear rock systems [6]. Consequently, SOC theory emerges as a robust framework for investigating rock damage and fracture behaviors. To date, researchers have employed experimental [15], theoretical, numerical [16], and machine learning [12,17,18] approaches to investigate self-organized criticality in rock failure and its predictive modeling [19,20]. Nevertheless, limitations in rock sample mechanical response mechanisms [21,22] impede comprehensive understanding of rock behavior and accurate prediction of meta-critical phase transitions prior to failure [23]. The intrinsic heterogeneity of rock masses introduces critical uncertainties in progressive damage prediction, which compromises the reliability of conventional detection and characterization methodologies, thereby posing significant challenges to failure forecasting. Real-time CT imaging under variable stress conditions has facilitated visualization of internal failure processes in uniaxial compression [24,25], loading/unloading cycles [26], triaxial compression [27], and matrix soil loading. Nevertheless, existing methodologies suffer from limited mutual validation across experimental datasets, compromising the reliability of experimental outcomes. Conventional laboratory compression testing and theoretical modeling predominantly rely on empirical dataset representation (e.g., stress–strain curves), but the spatial crack size and localization of the sample cannot be visualized. This visualization deficiency fundamentally limits mechanistic understanding of anisotropic rock material damage propagation. Advances in acoustic emission (AE) monitoring technology have enabled its widespread adoption in rock mechanics testing, leveraging its capabilities in damage localization and nondestructive sample monitoring [28]. Importantly, integrating AE measurements with mechanical loading and real-time CT scanning allows for spatiotemporal cross-validation of monitoring methods, maximizing the reliability of rock failure test results. Qualitative studies on mudstone failure processes [29] have demonstrated the feasibility of synchronous real-time CT and AE monitoring in rock mechanics research. Regrettably, current research lacks integration of mesostructural information derived from CT scans and AE signals. Presently, multisource monitoring data (e.g., CT, AE) lack integrated analysis [11], and synergy mechanisms during fracture processes remain unexplored. This deficiency significantly impedes structural damage and fracture prediction capabilities. Addressing this challenge, this study proposes an integrated approach combining real-time CT imaging [30] and AE monitoring [31] to quantify and visualize self-organized criticality in heterogeneous rock fracture processes.
Traditional fracture theories (e.g., Griffith theory) [32] and failure criteria (e.g., Coulomb criterion) [33] overlook material internal disorder and precursory failure phenomena [34]. Such theories typically assume catastrophic global failure with a first-order phase transition from intact to failed states. Notably, natural rock heterogeneity profoundly impacts damage evolution [35,36], especially strength variability and associated size effects [37]. Prior research conceptualized crack quasistatic propagation in heterogeneous rocks as a dynamic critical transition [6]. Experimental observations reveal that increasing strain/fracture rate induces power–law scaling of critical parameters—including energy release, damage scales, and maximum damage area—in rock specimens at failure thresholds [35,38,39]. Criticality concepts provide a framework for interpreting failure transitions and associated characteristics in heterogeneous rocks [40,41]. Classical models exhibit significant shortcomings in interpreting/predicting damage processes in highly disordered rocks. Indeed, rock failure progresses through distinct precursor stages: microcrack nucleation, propagation, coalescence, and eventual macroscopic failure [42]. Damage precursor concepts have been applied to natural hazard forecasting (e.g., earthquakes; landslides; mine collapses; volcanic eruptions; rockburst) [43,44,45,46,47]. Heterogeneous media failure characteristics have been extensively validated through power–law analyses [48,49], critical state theory [50], mechanical modeling [51], failure mechanism studies [52], and engineering applications [53]. Critical limitations remain: (1) precise identification of failure transition points; (2) incomplete understanding of self-organization-to-criticality transitions; (3) absence of methods for spatiotemporal-energy prediction during failure.
To address the critical limitations outlined above, this study established an integrated testing platform employing sandstone specimens. Synchronized AE monitoring and X-ray CT scanning were conducted during compression experiments. Internal structural evolution and damage parameters of sandstone were systematically characterized, enabling detailed analysis of self-organized processes and critical phase transitions during progressive fracturing. Building on self-organized criticality (SOC) characteristics and phase transition predictions, we explored the application of self-organized damage processes for failure prediction in unstable stages. Key investigations include: (1) characterization of self-organized processes and critical points in sandstone damage evolution; (2) clarification of evolutionary principles governing damage self-organized criticality; (3) mechanistic interpretation of failure instabilities through self-organized critical phase transitions. The methodology and findings provide valuable insights for evaluating safety and stability of weakness planes in rock slopes.
2. Experimental Materials and Methodology
2.1. Sample Preparation
The Cretaceous sandstone from the Xiashijie Coal Mine (Tongchuan, Shaanxi, China) exemplifies typical continental crustal crystalline rock formations. To minimize mechanical heterogeneity, core samples were extracted from unlayered fresh rock faces on the open-pit slope using consistent drilling orientation and precision cutting techniques. Test specimens conformed to ISRM standards: 50 mm × 100 mm cylinders with geometric tolerances controlled to 10′ for angular misalignment and 0.02 mm for surface deviation.
The prepared specimens were vacuum-dried at 105 °C for 48 h to achieve constant mass equilibrium. After natural cooling, dry density and P-wave velocity were determined using standard procedures. Specimens were saturated via vacuum impregnation (−0.1 MPa) for 24 h, followed by porosity measurement using Archimedes’ principle. Twelve specimens with comparable physical properties were categorized into three groups for comparative analysis. Basic physical and mechanical characteristic parameters of sandstone materials are summarized in Table 1. Among them, the average radius of sandstone particles is determined by X-ray diffraction (XRD).

Table 1.
Basic physical and mechanical parameters of sandstone.
2.2. Experimental Device and Procedure
An indigenously developed continuous loading system was designed and fabricated for this investigation. The experiments were conducted in the nanoVoxel-4000 micro-CT facility (Tianjin Sanying Precision Instruments Co., Ltd., Tianjin, China) under ambient conditions (25 °C). The integrated system comprised (1) a servo-controlled loading actuator, (2) an acoustic emission (AE) monitoring module, and (3) a four-dimensional X-ray computed tomography (4D-XCT) imager (Figure 1). Key geometric and operational parameters are summarized in Table 2.
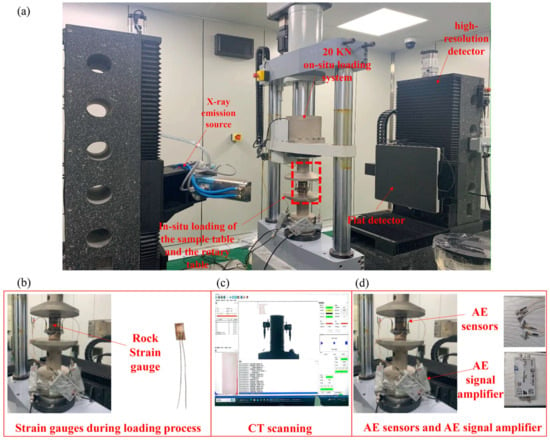
Figure 1.
Experimental device and procedure: (a) Real-time 4D-XCT scanning and AE monitoring during in-suit continuous uniaxial compression; (b) Strain gauge during in-suit loading process; (c) CT scanning; (d) AE sensors and AE signal amplifier.

Table 2.
Parameters of the continuous loading device, AE monitoring device, and CT real-time scanning device.
AE monitoring and CT scanning were synchronized during sandstone compression (Figure 1a). Throughout the loading process, mechanical loading equipment and AE devices continuously collected data, while CT scans captured internal structures at different loading moments. Rock strain gauges on the mechanical loading system measured compressive strain in sandstone specimens (Figure 1b). The CT scanning system acquired images of sandstone’s internal structural configurations (Figure 1c). AE signal amplifiers were adjusted to monitor acoustic emissions during loading (Figure 1d). During the scanning process of sandstone samples, the position of the loading piston will not move. Since the piston is fixed at the designated position during the scanning process, the scanning image of the sandstone sample will not be affected.
2.3. Analysis Method for Experimental Data and Images
Engineering-scale rock slope deformation/failure characteristics mirror laboratory-scale sandstone damage fracture behaviors [56]. AE waveform morphologies exhibit strong similarities between field slopes and laboratory sandstone specimens (Figure 2a,b). Leveraging this similarity, real-time crack propagation monitoring in sandstone is achieved through integrated AE monitoring and moment tensor inversion techniques, mirroring faulting mechanisms in engineering rock masses. Surface-mounted AE sensors enable automated source localization and capture critical waveform parameters (onset time, rise time, duration, energy, amplitude, etc.) for each AE event (Figure 2c). AE signals serve as proxies for sandstone damage evolution (e.g., microcracking). AE source localization employed the GCLM-Grid Search Method for precise multi-sensor signal triangulation. Denoising and waveform feature extraction enable quantitative characterization of damage/fracture progression.
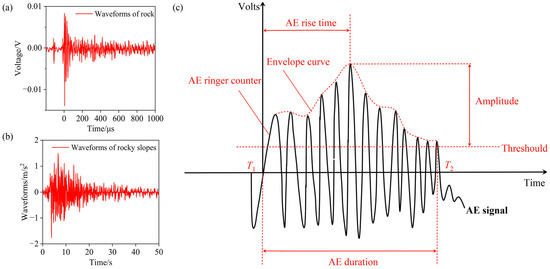
Figure 2.
AE signal features derived from: (a) engineering-scale rock slope waveforms; (b) laboratory-scale sandstone waveforms; and (c) sandstone AE signal parameters.
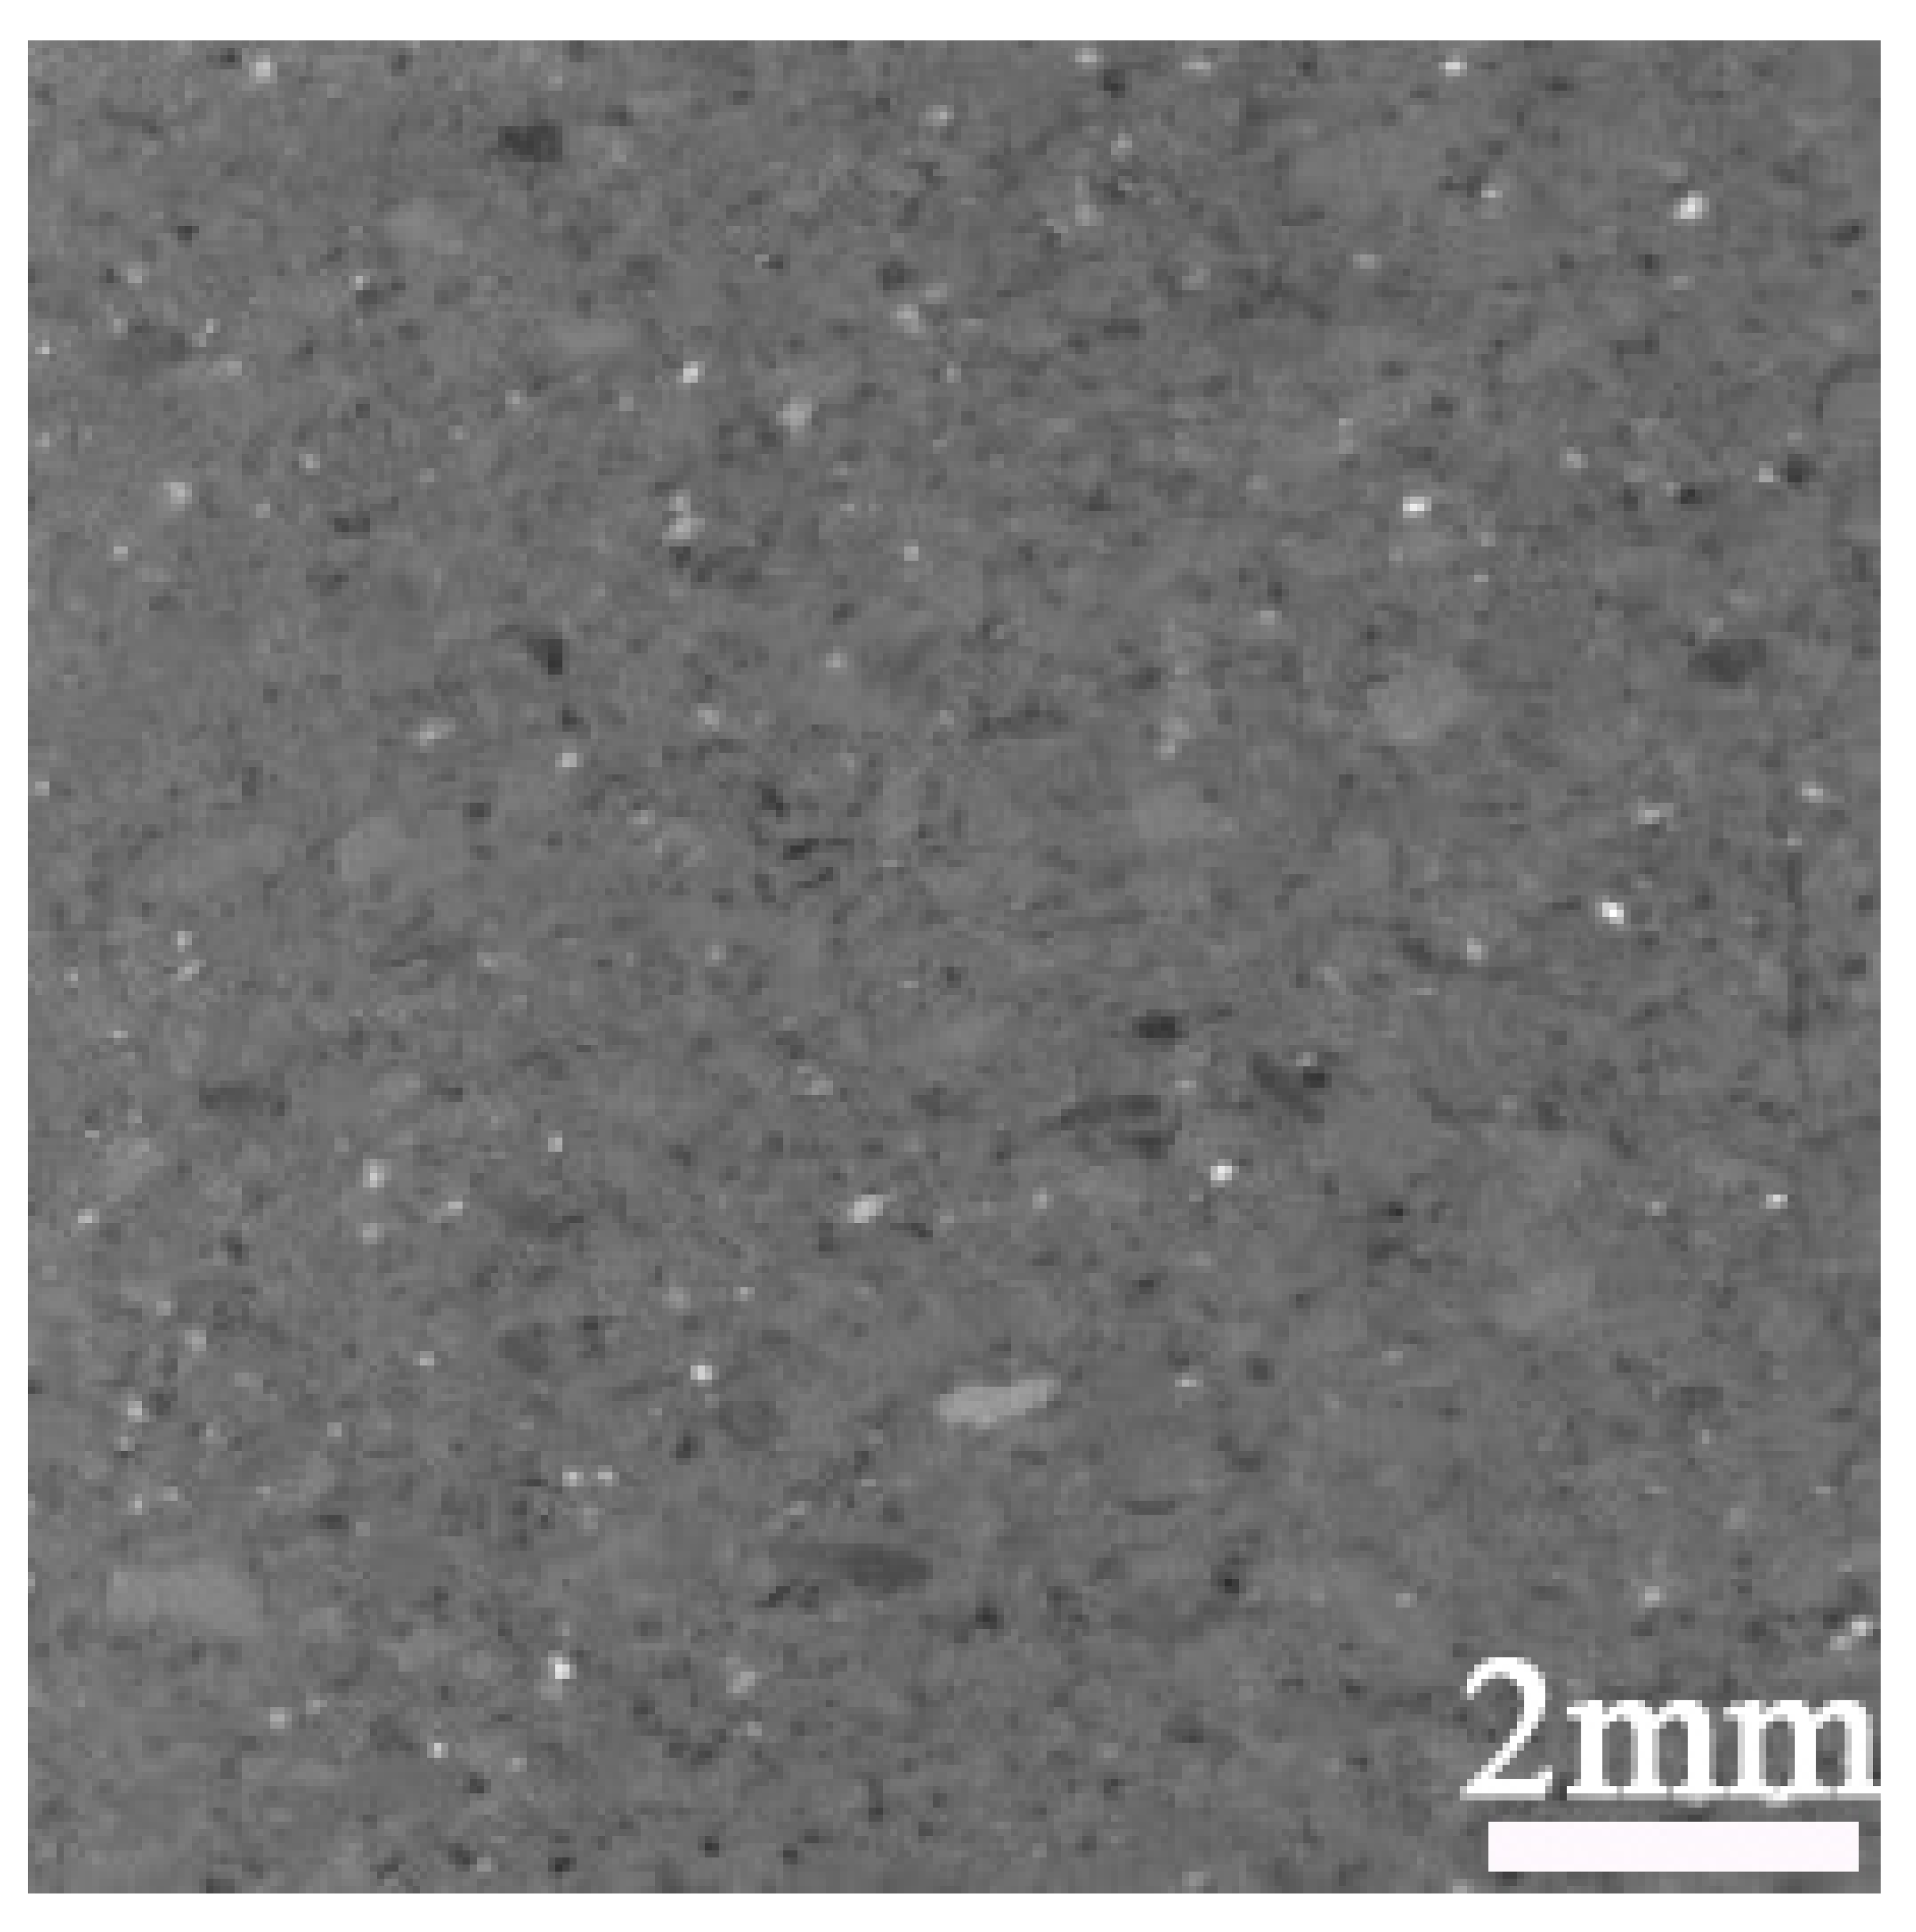
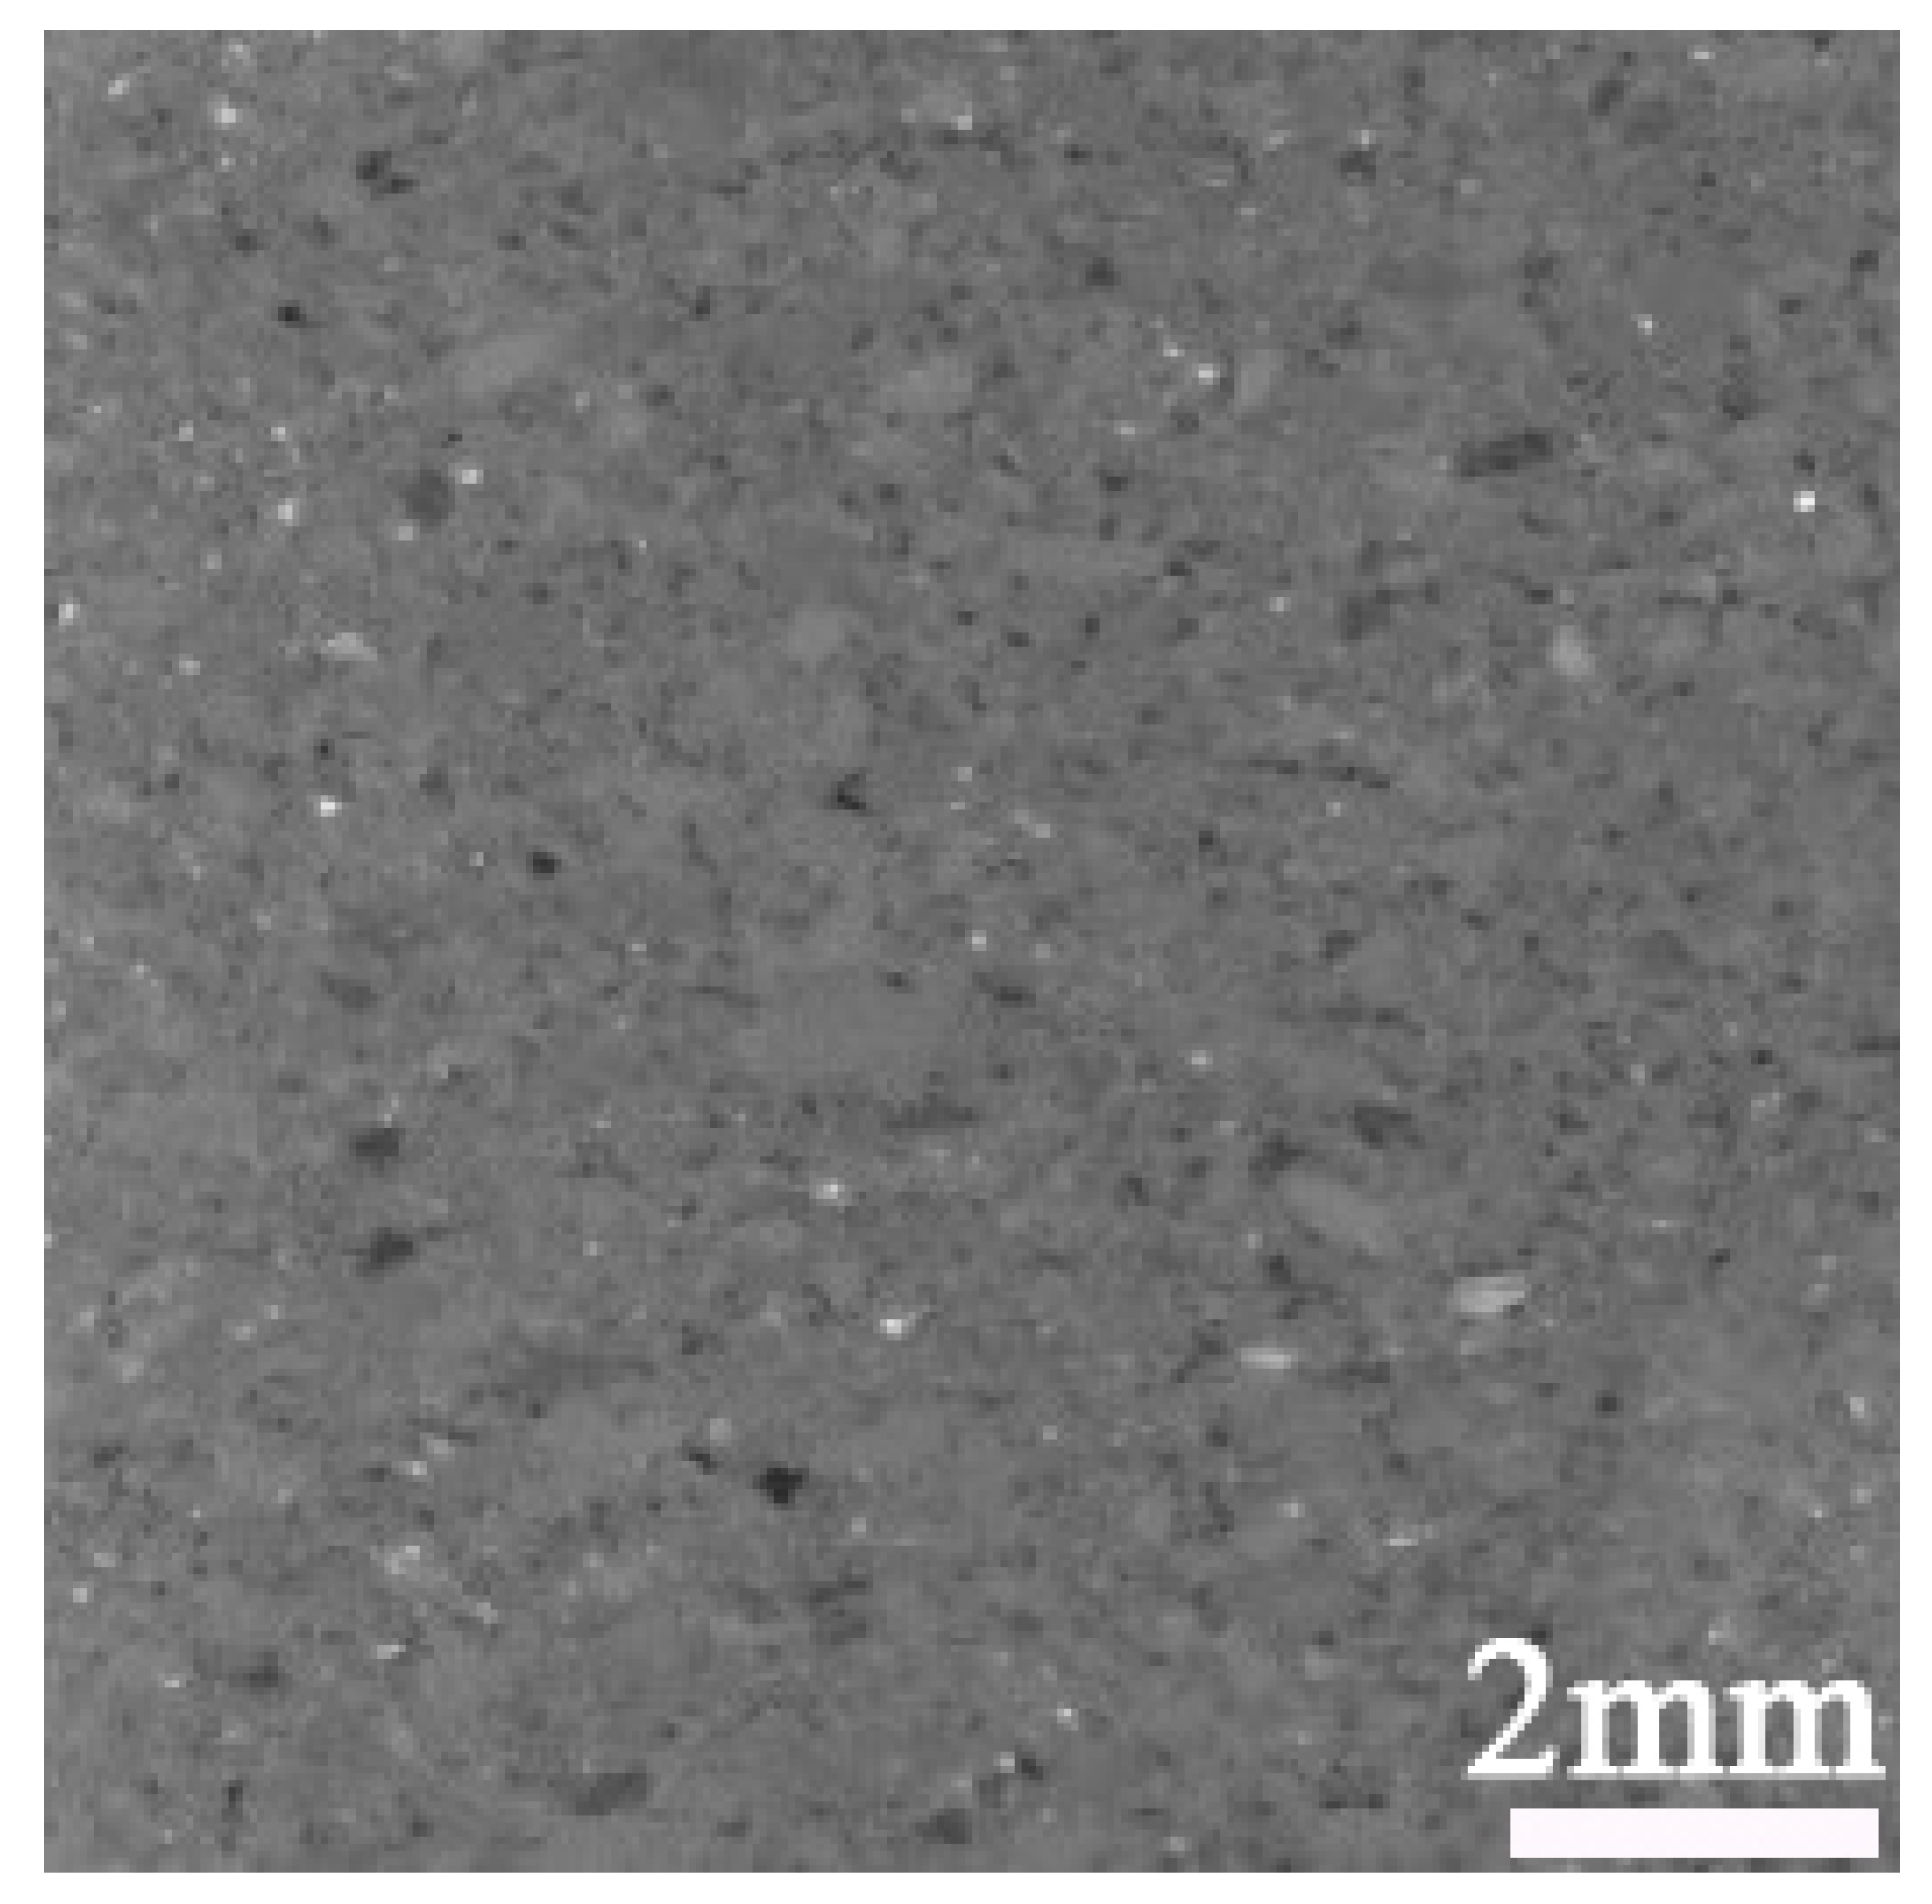
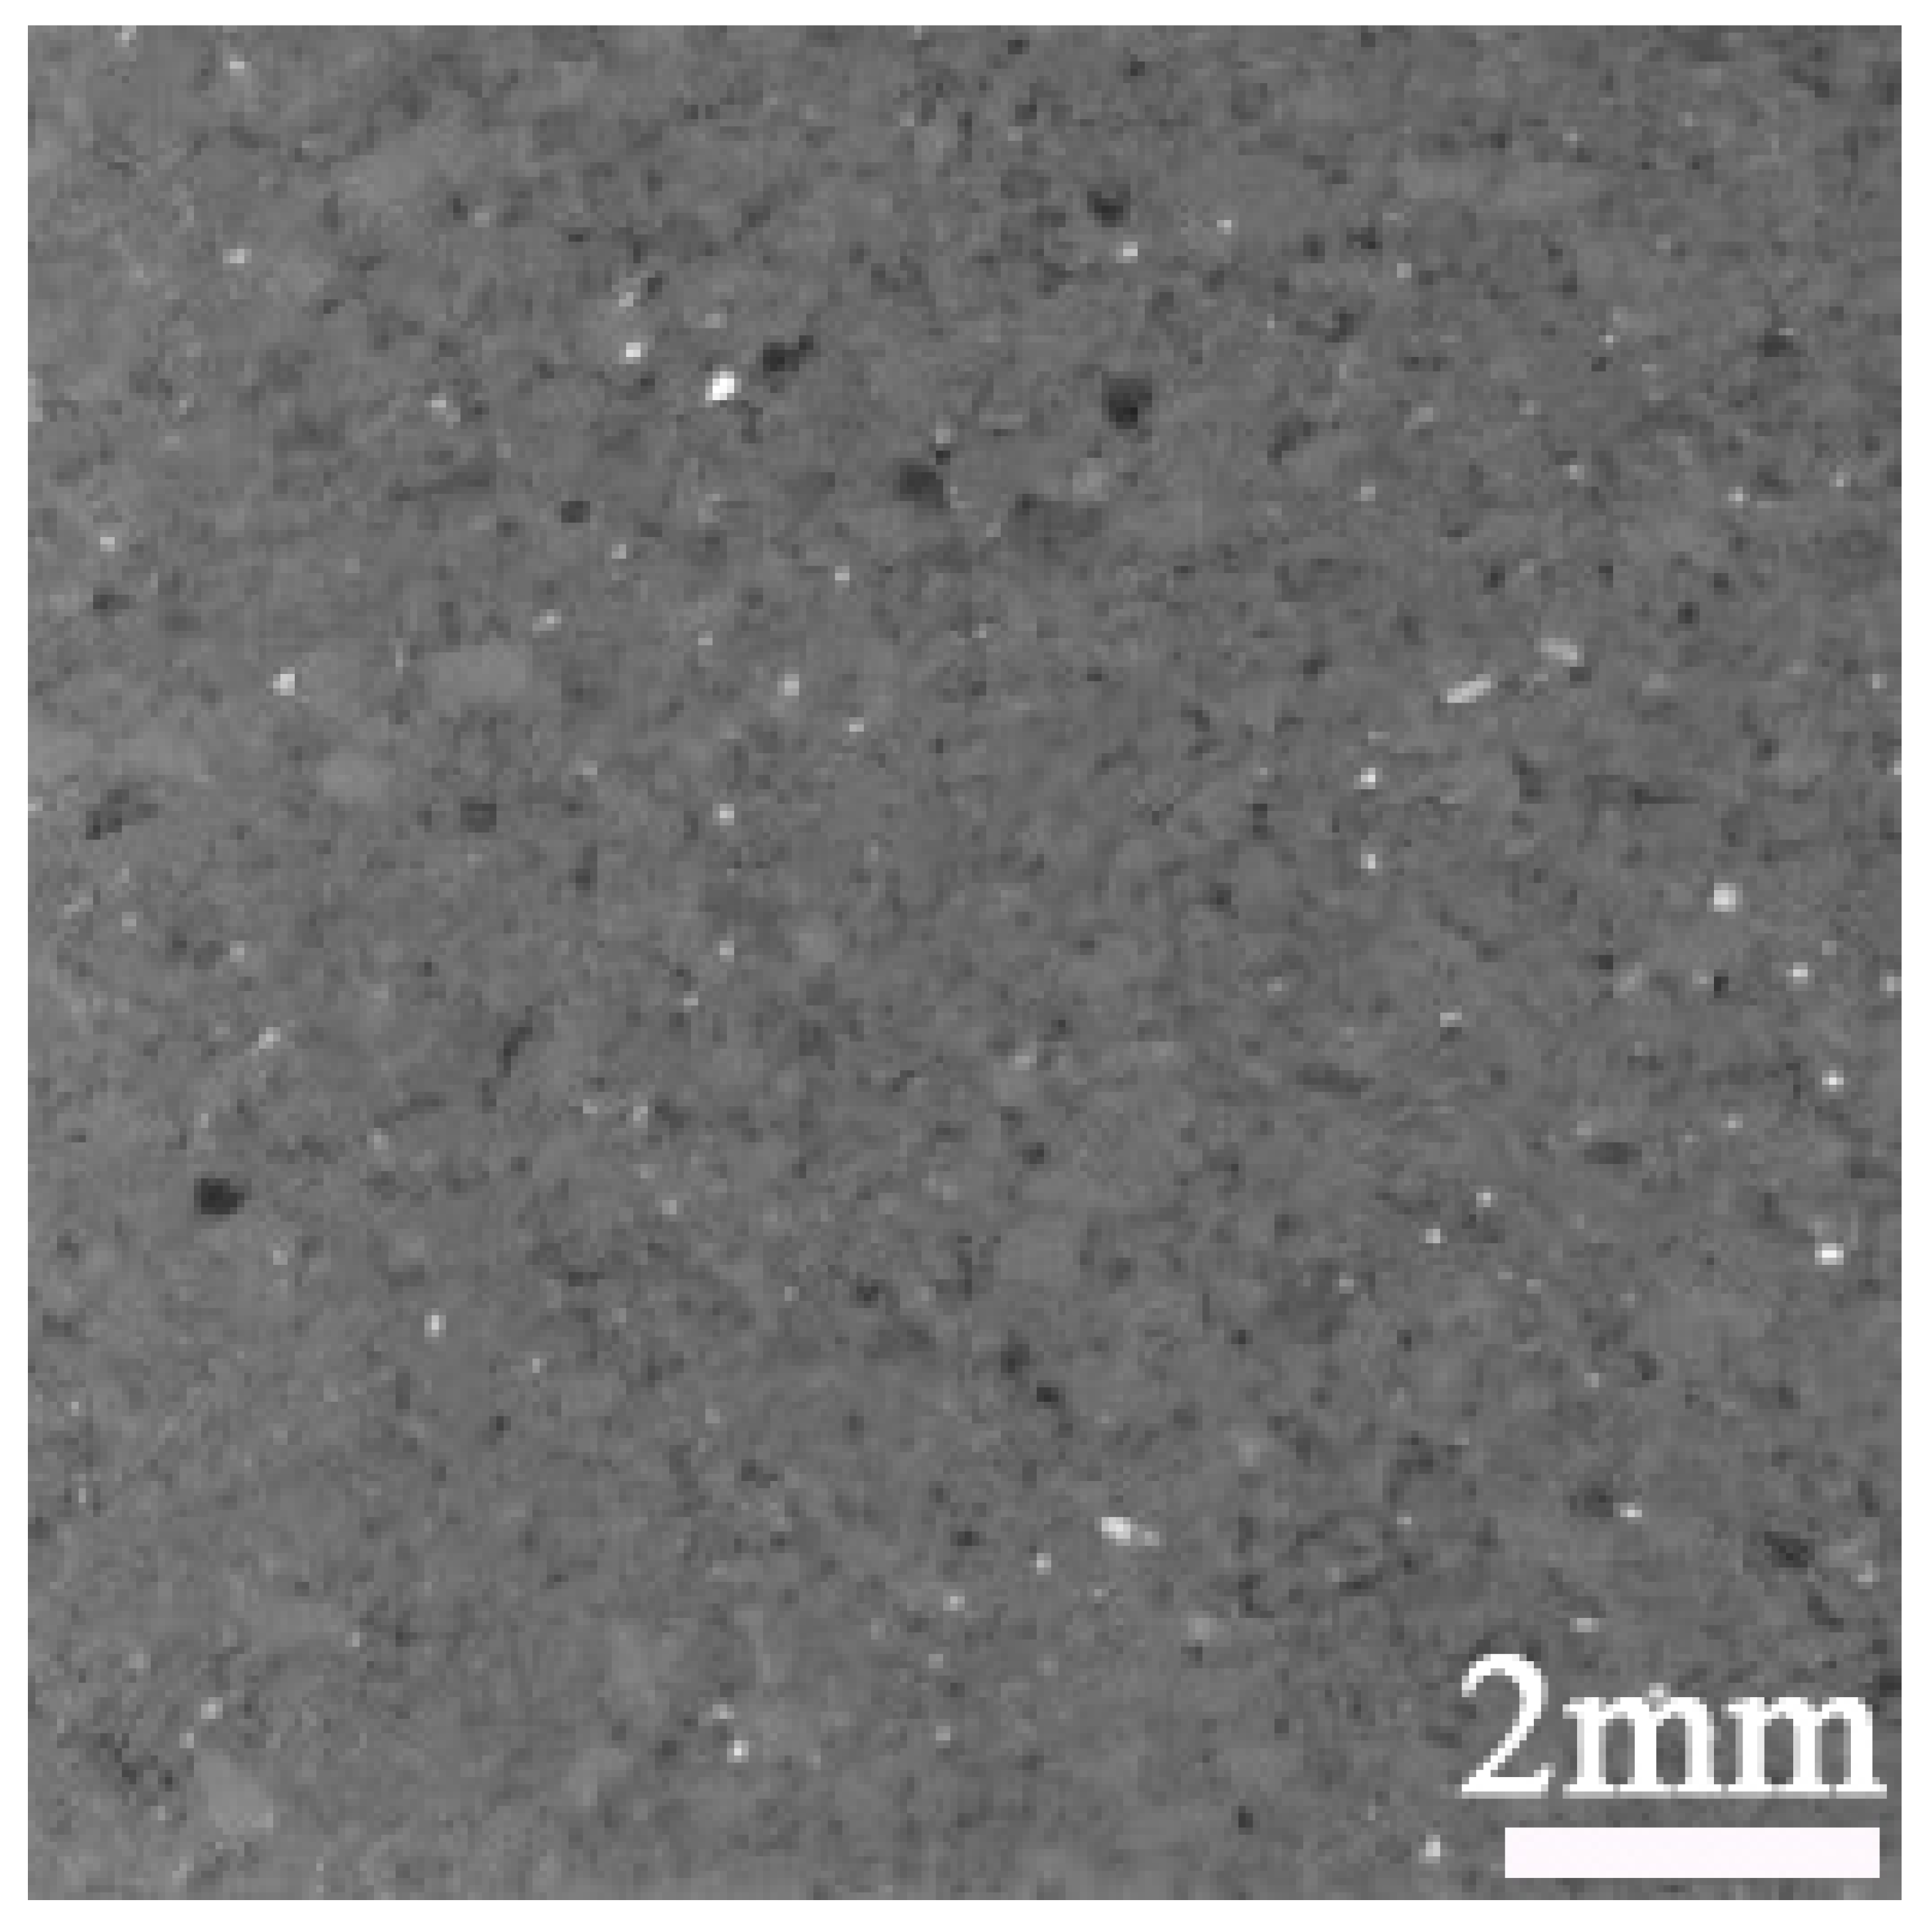
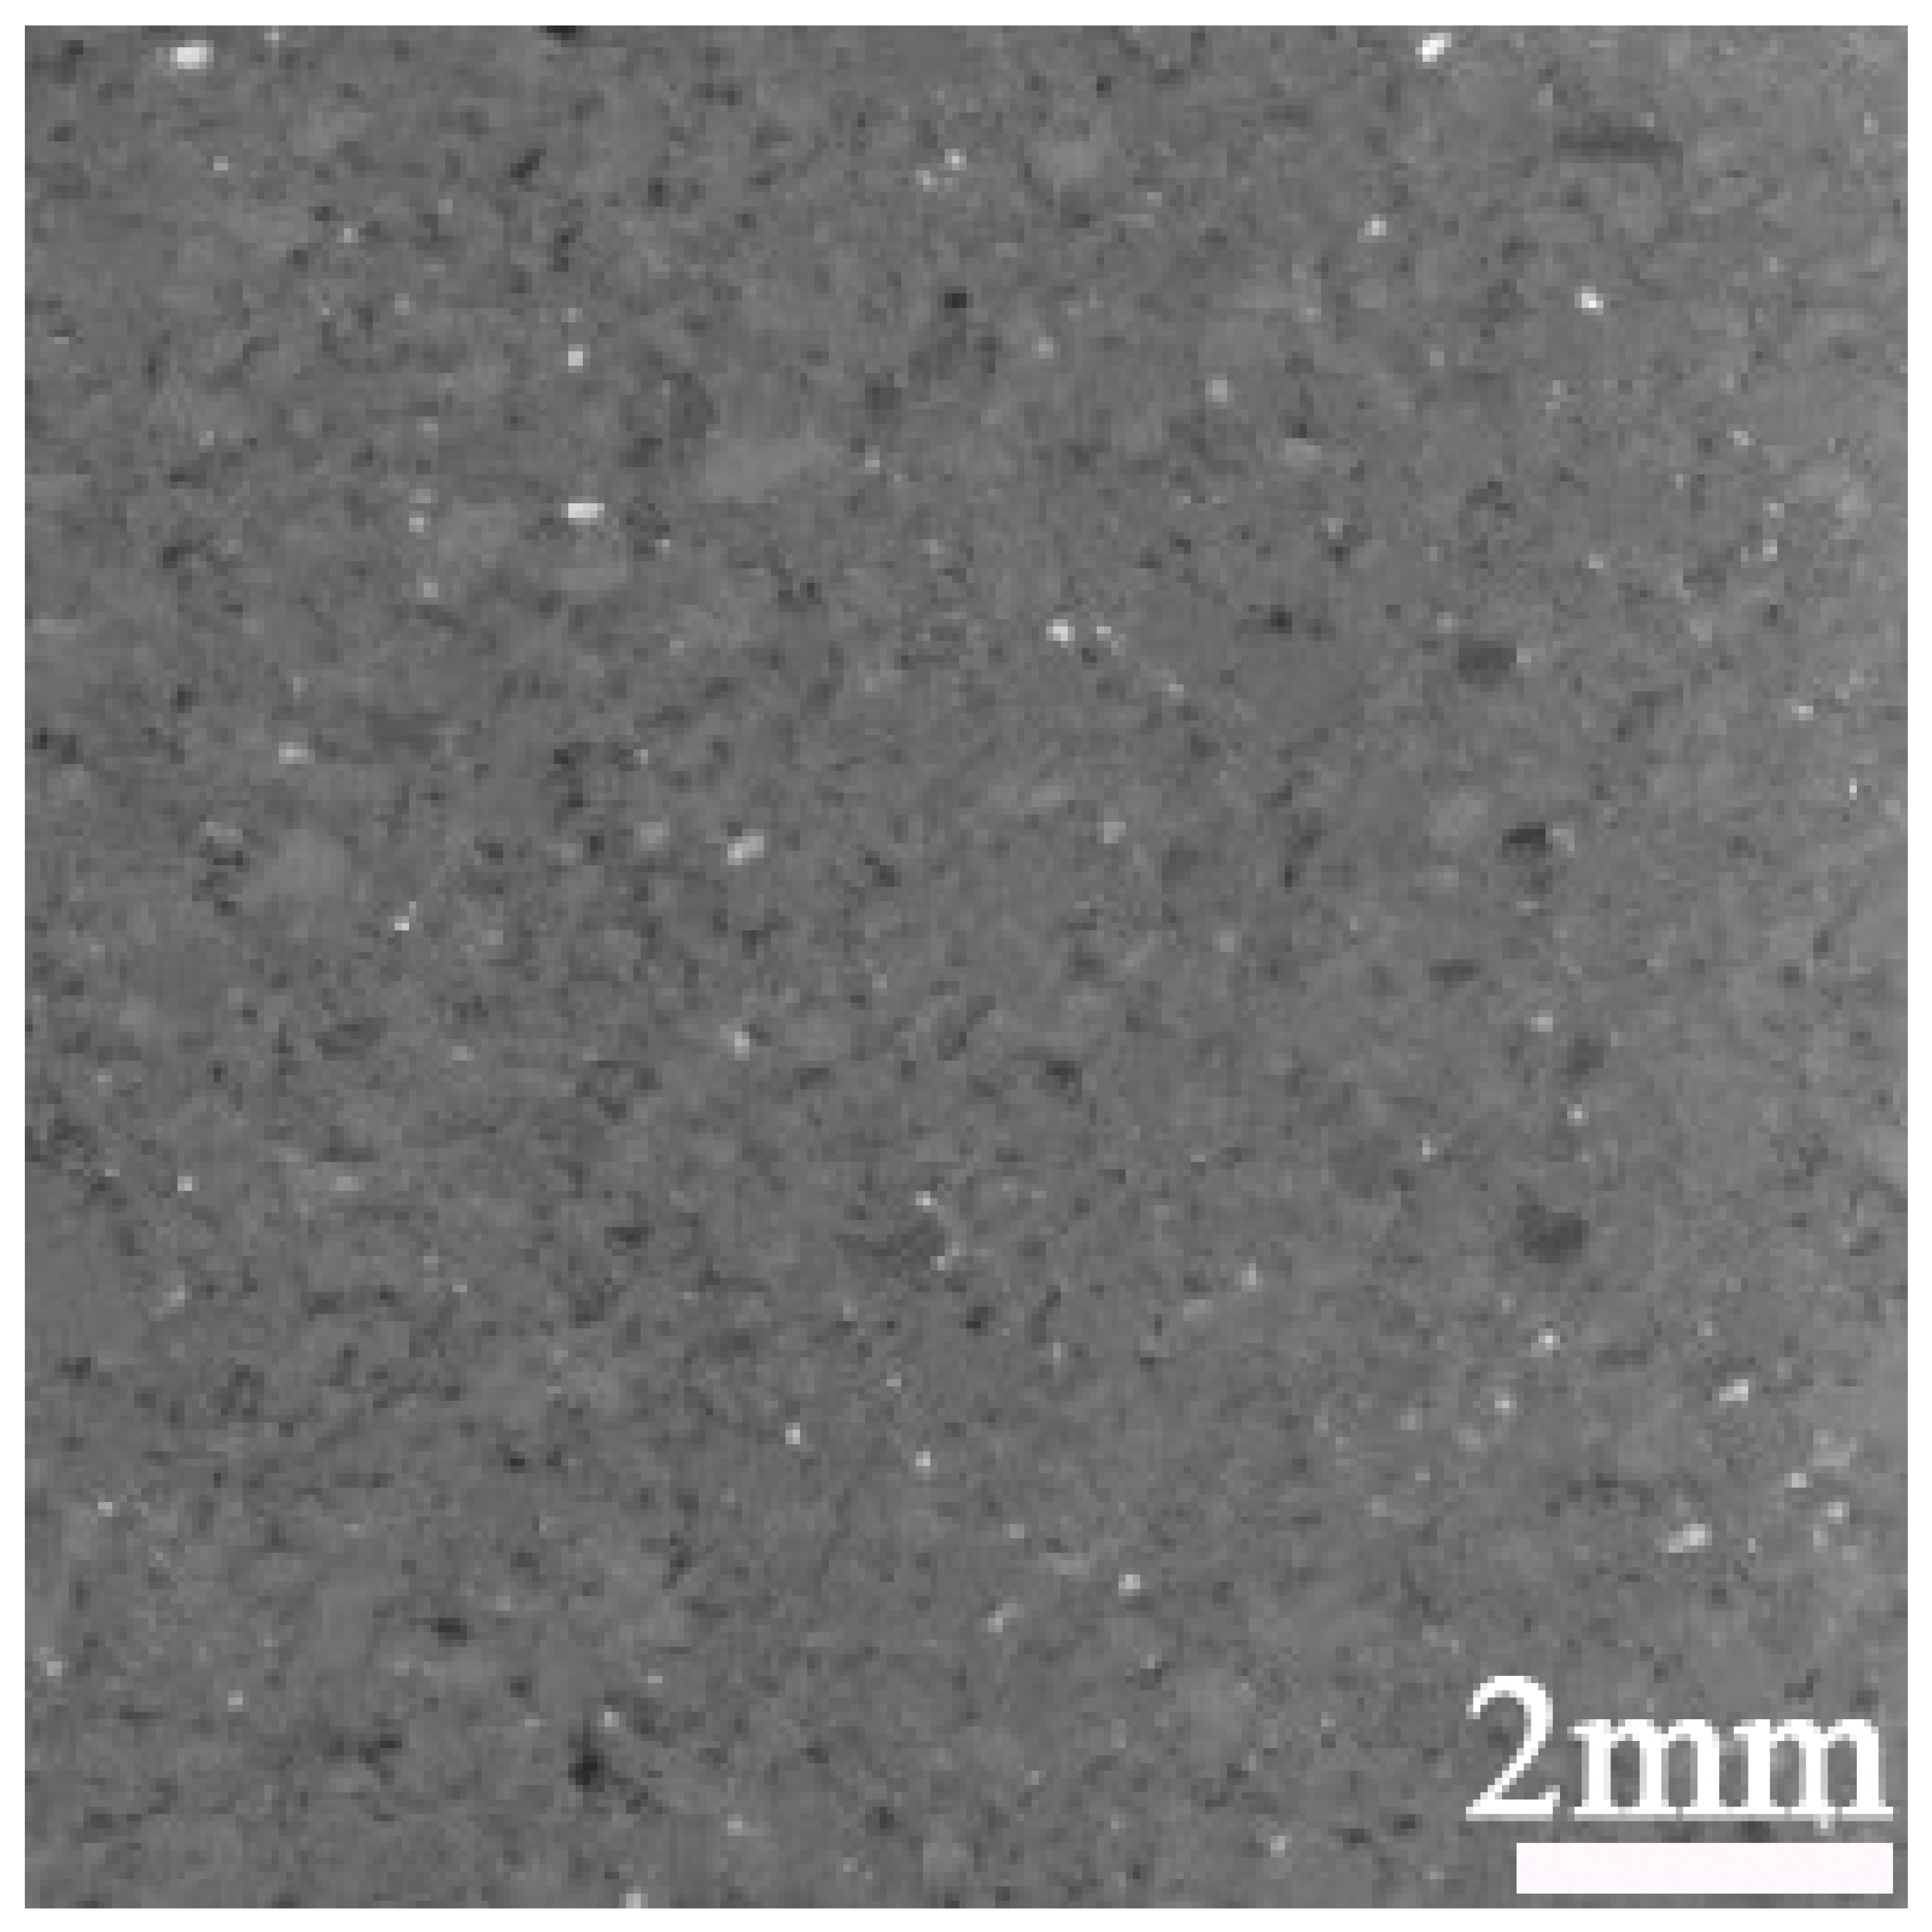
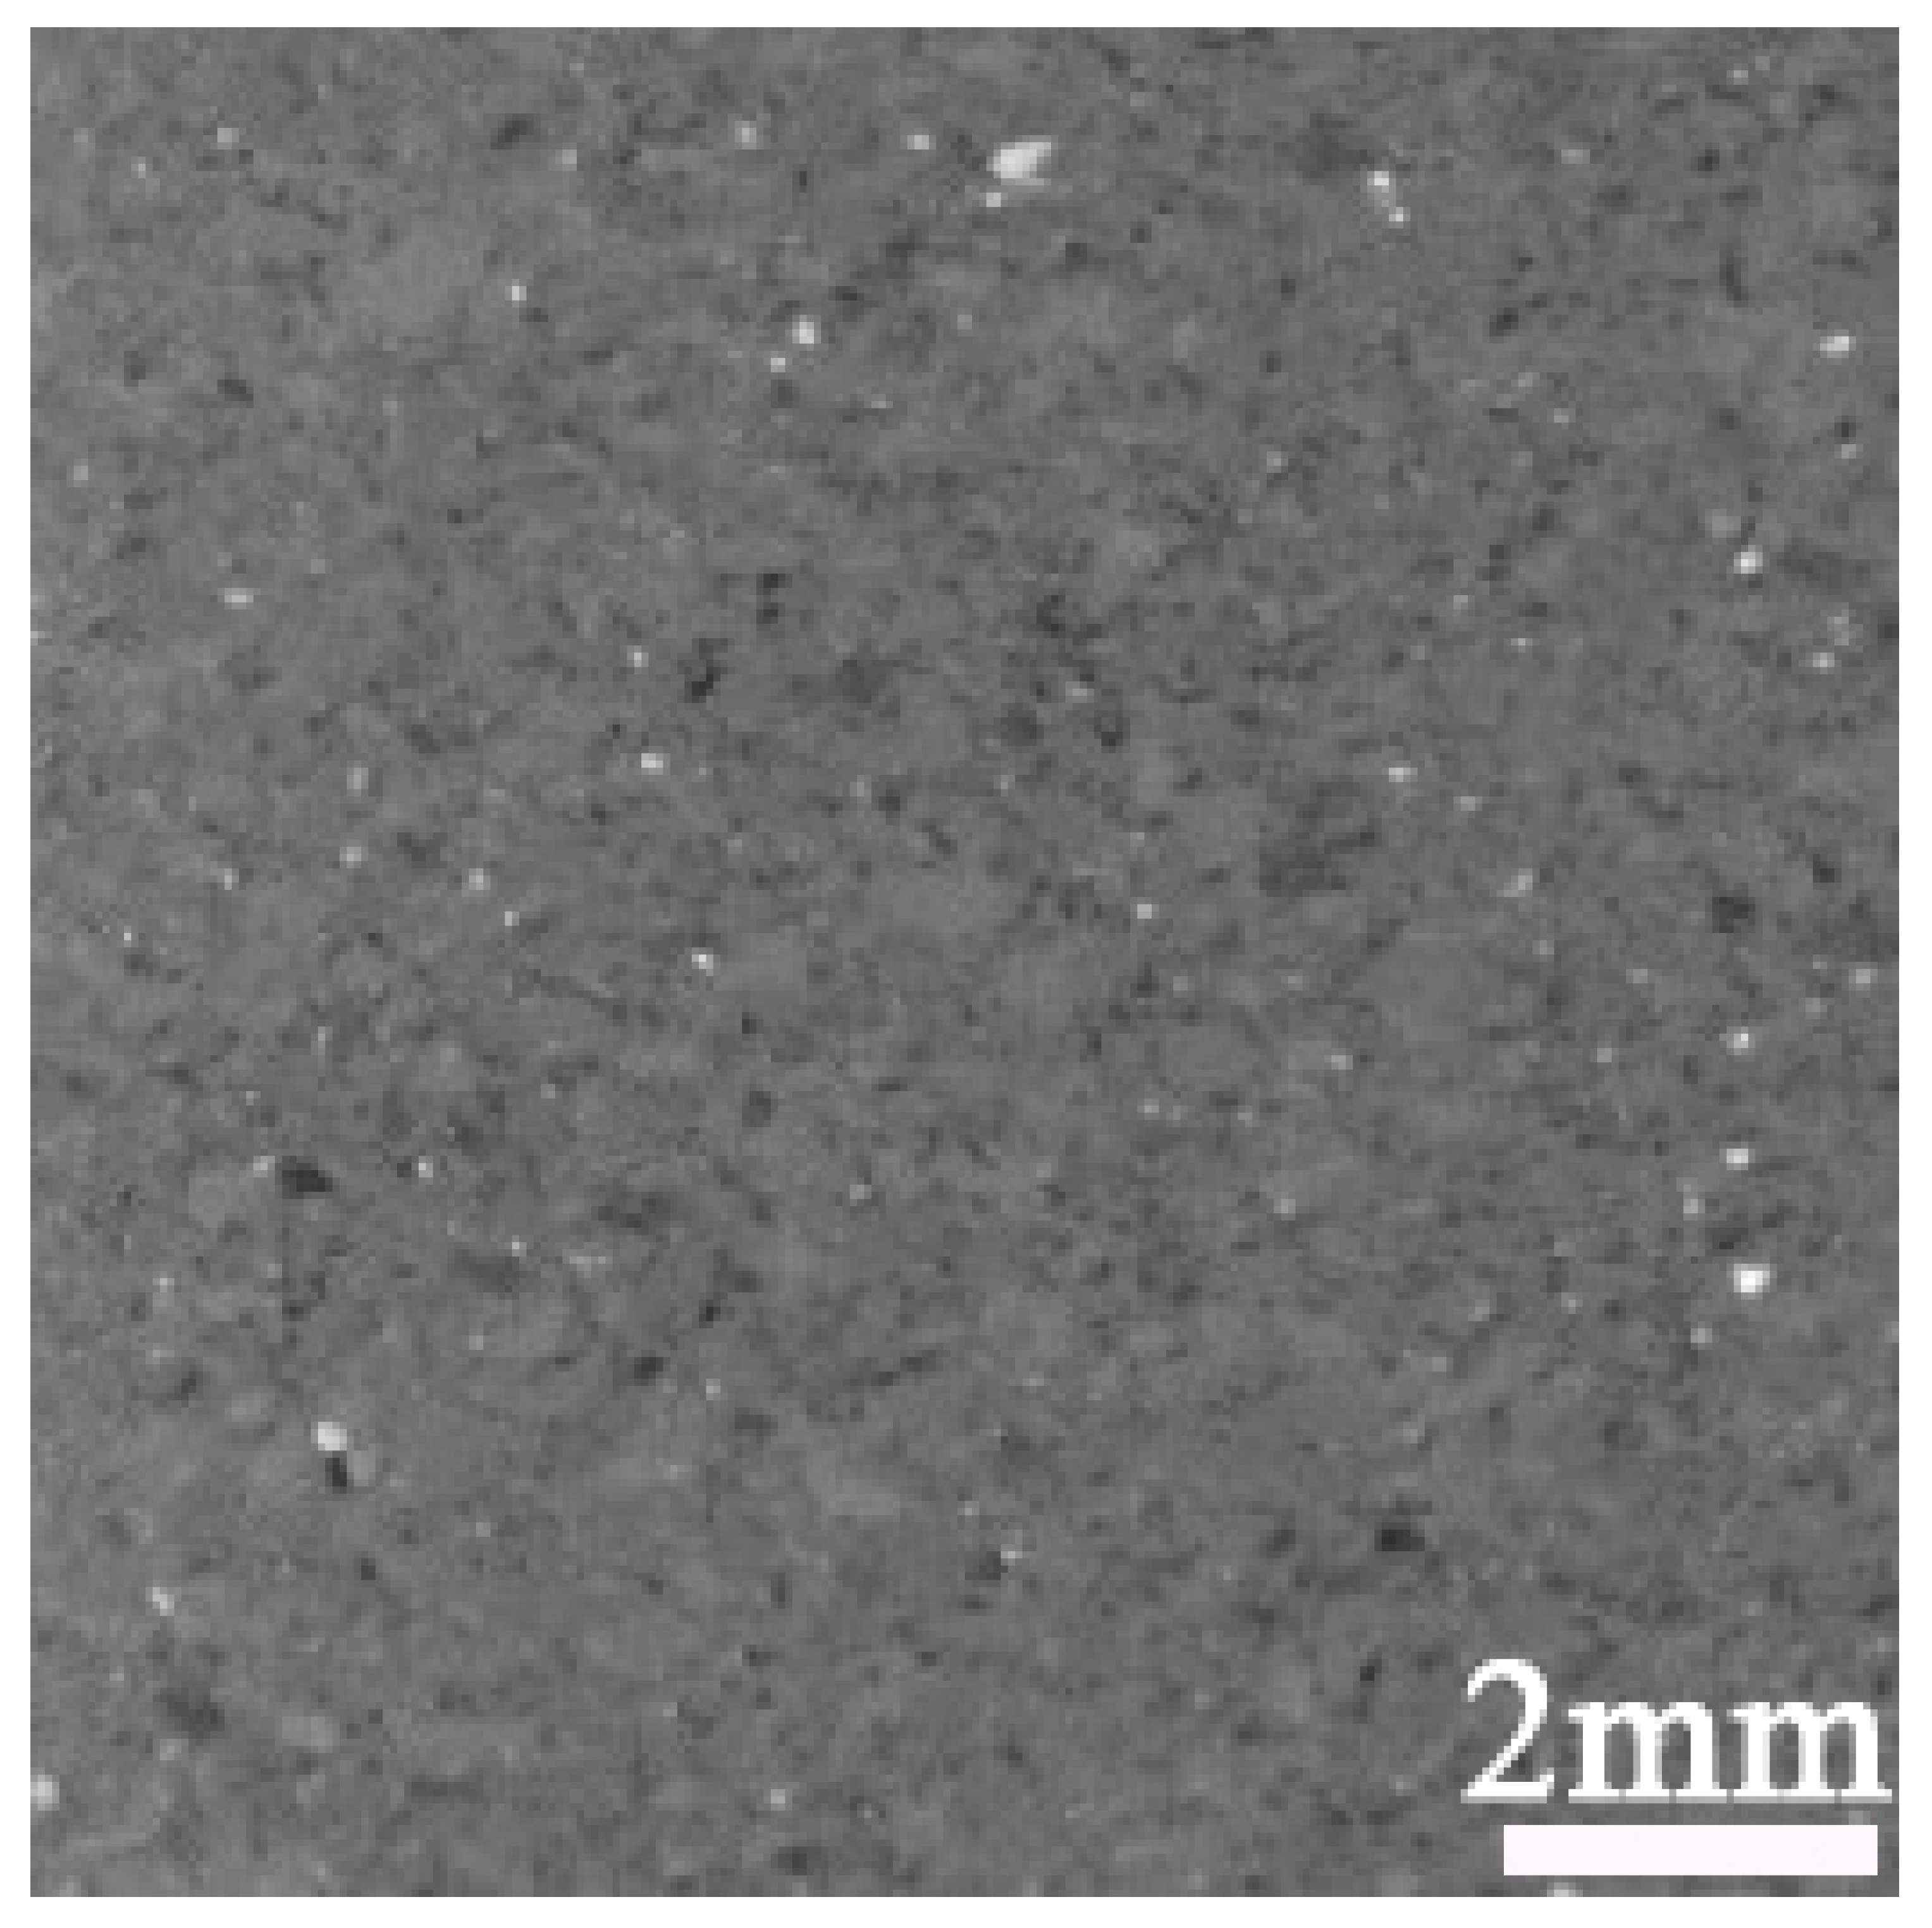
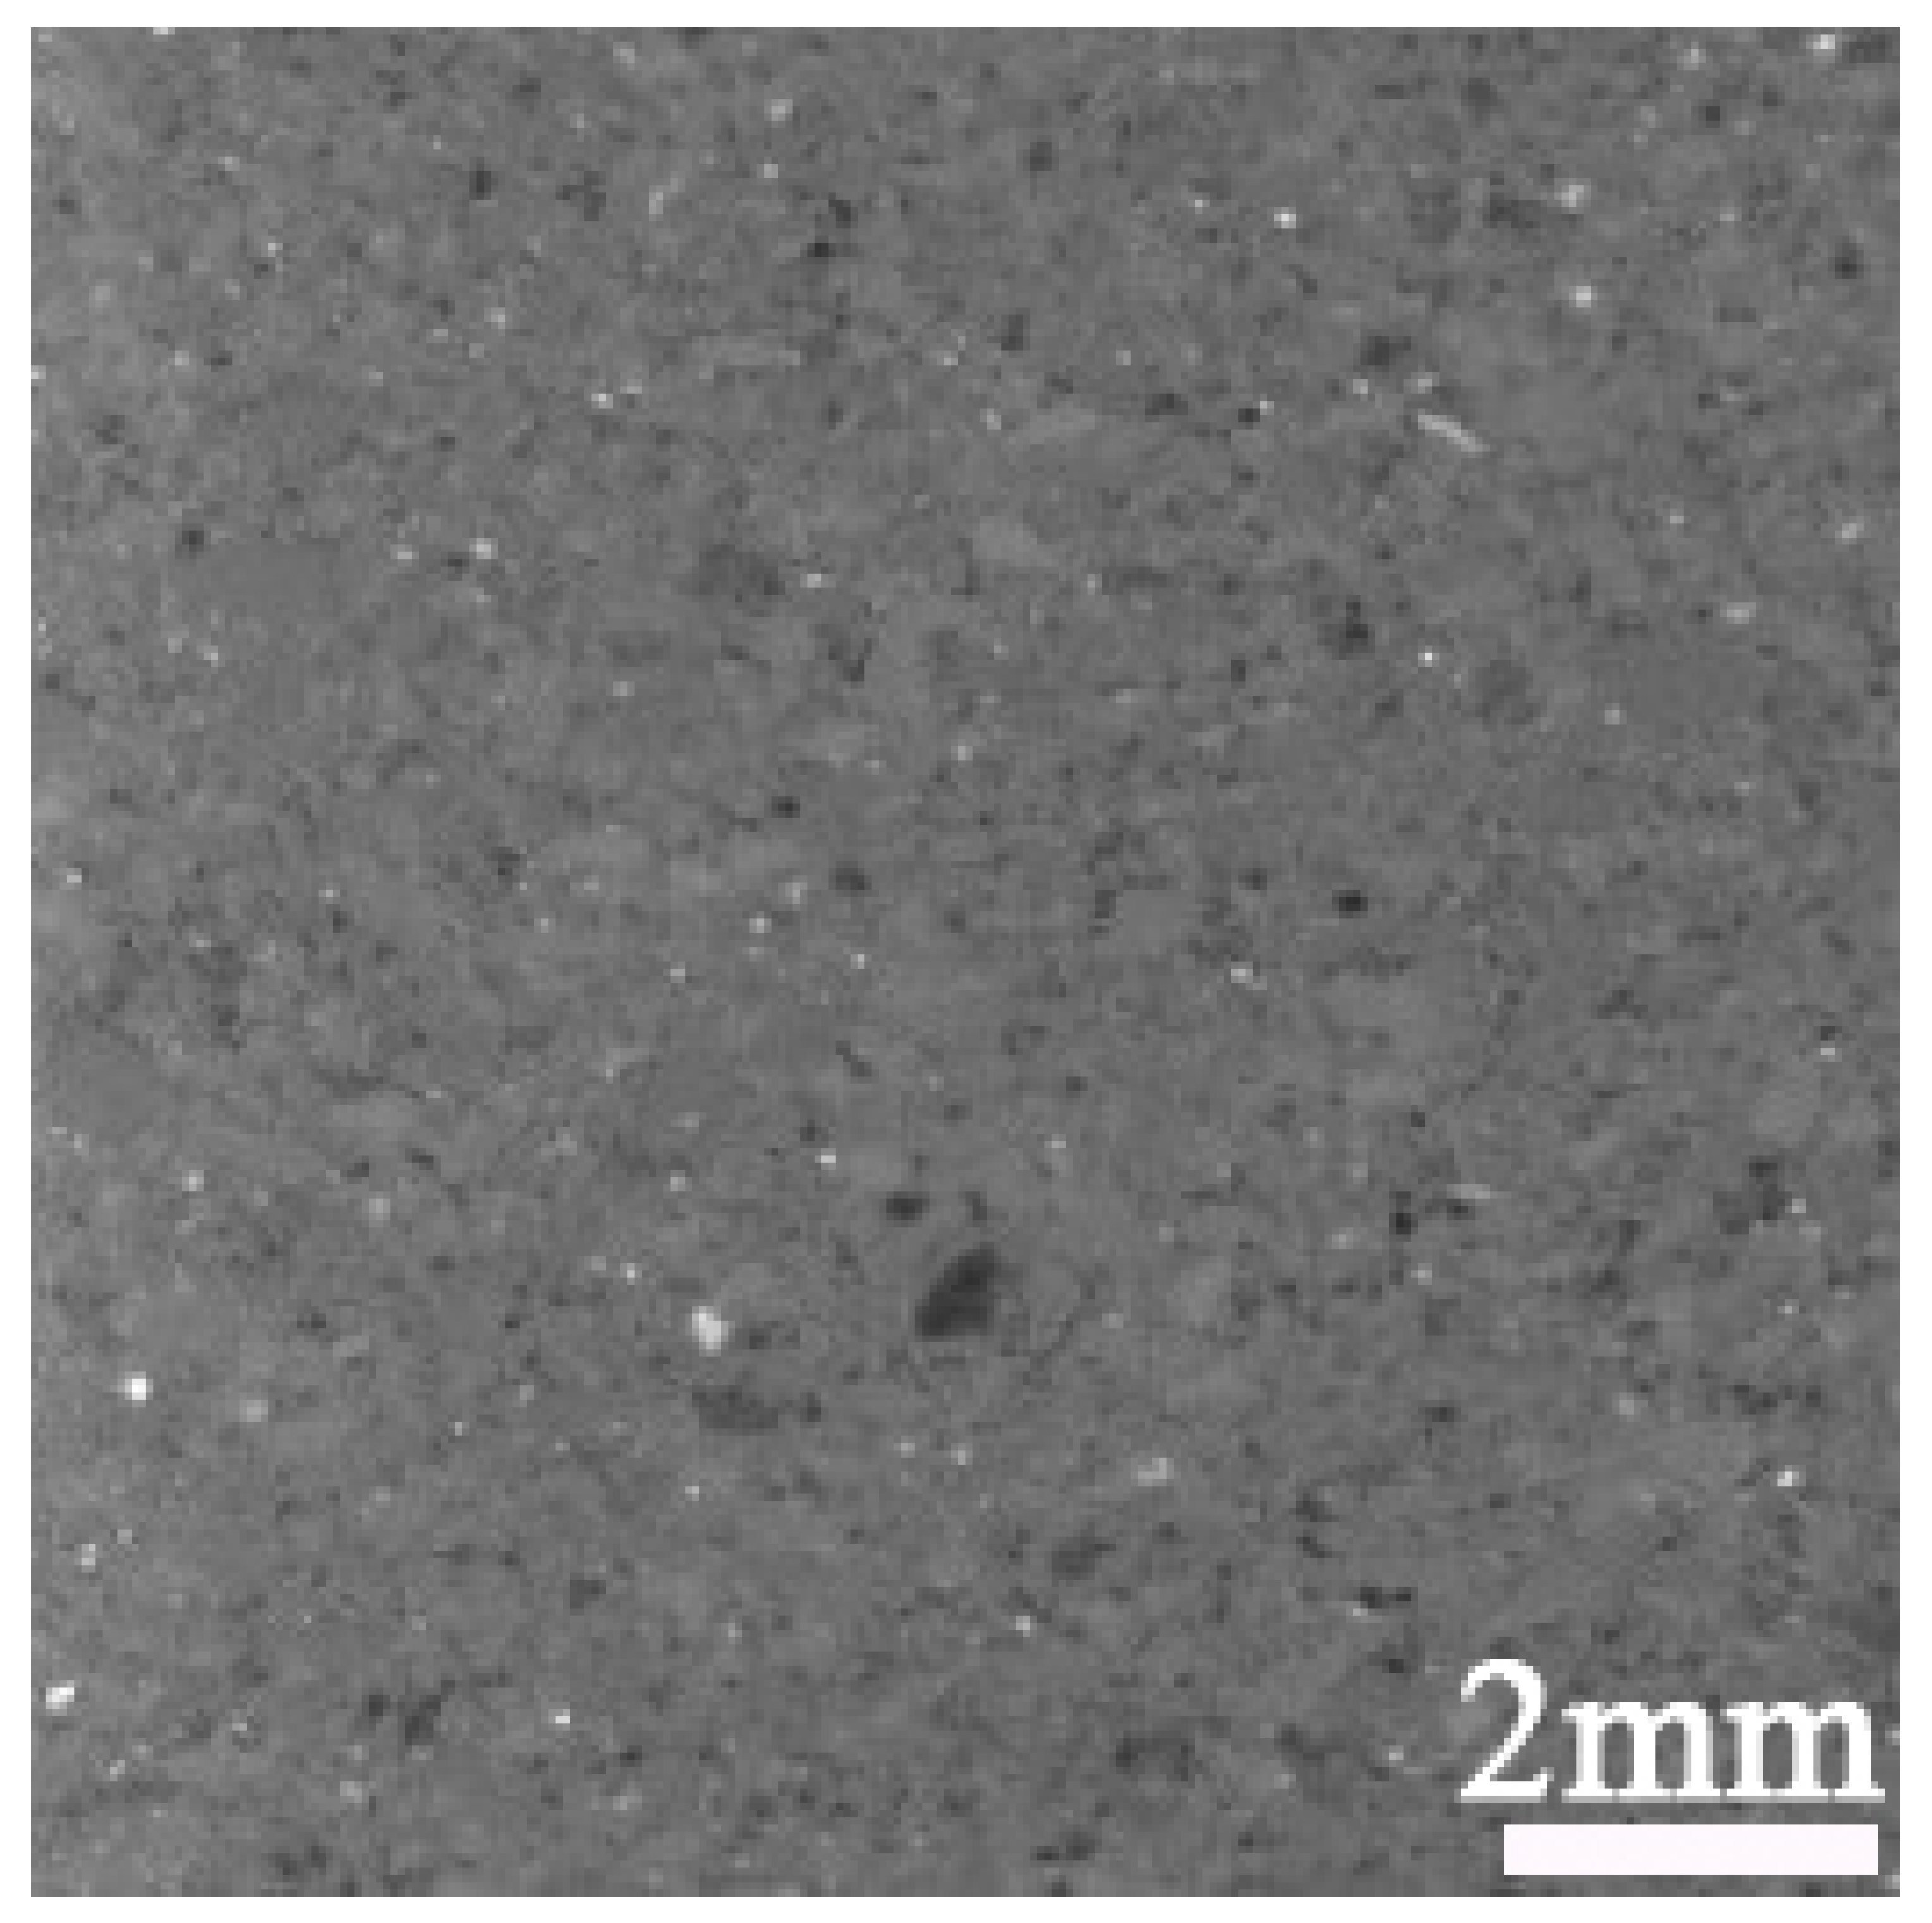
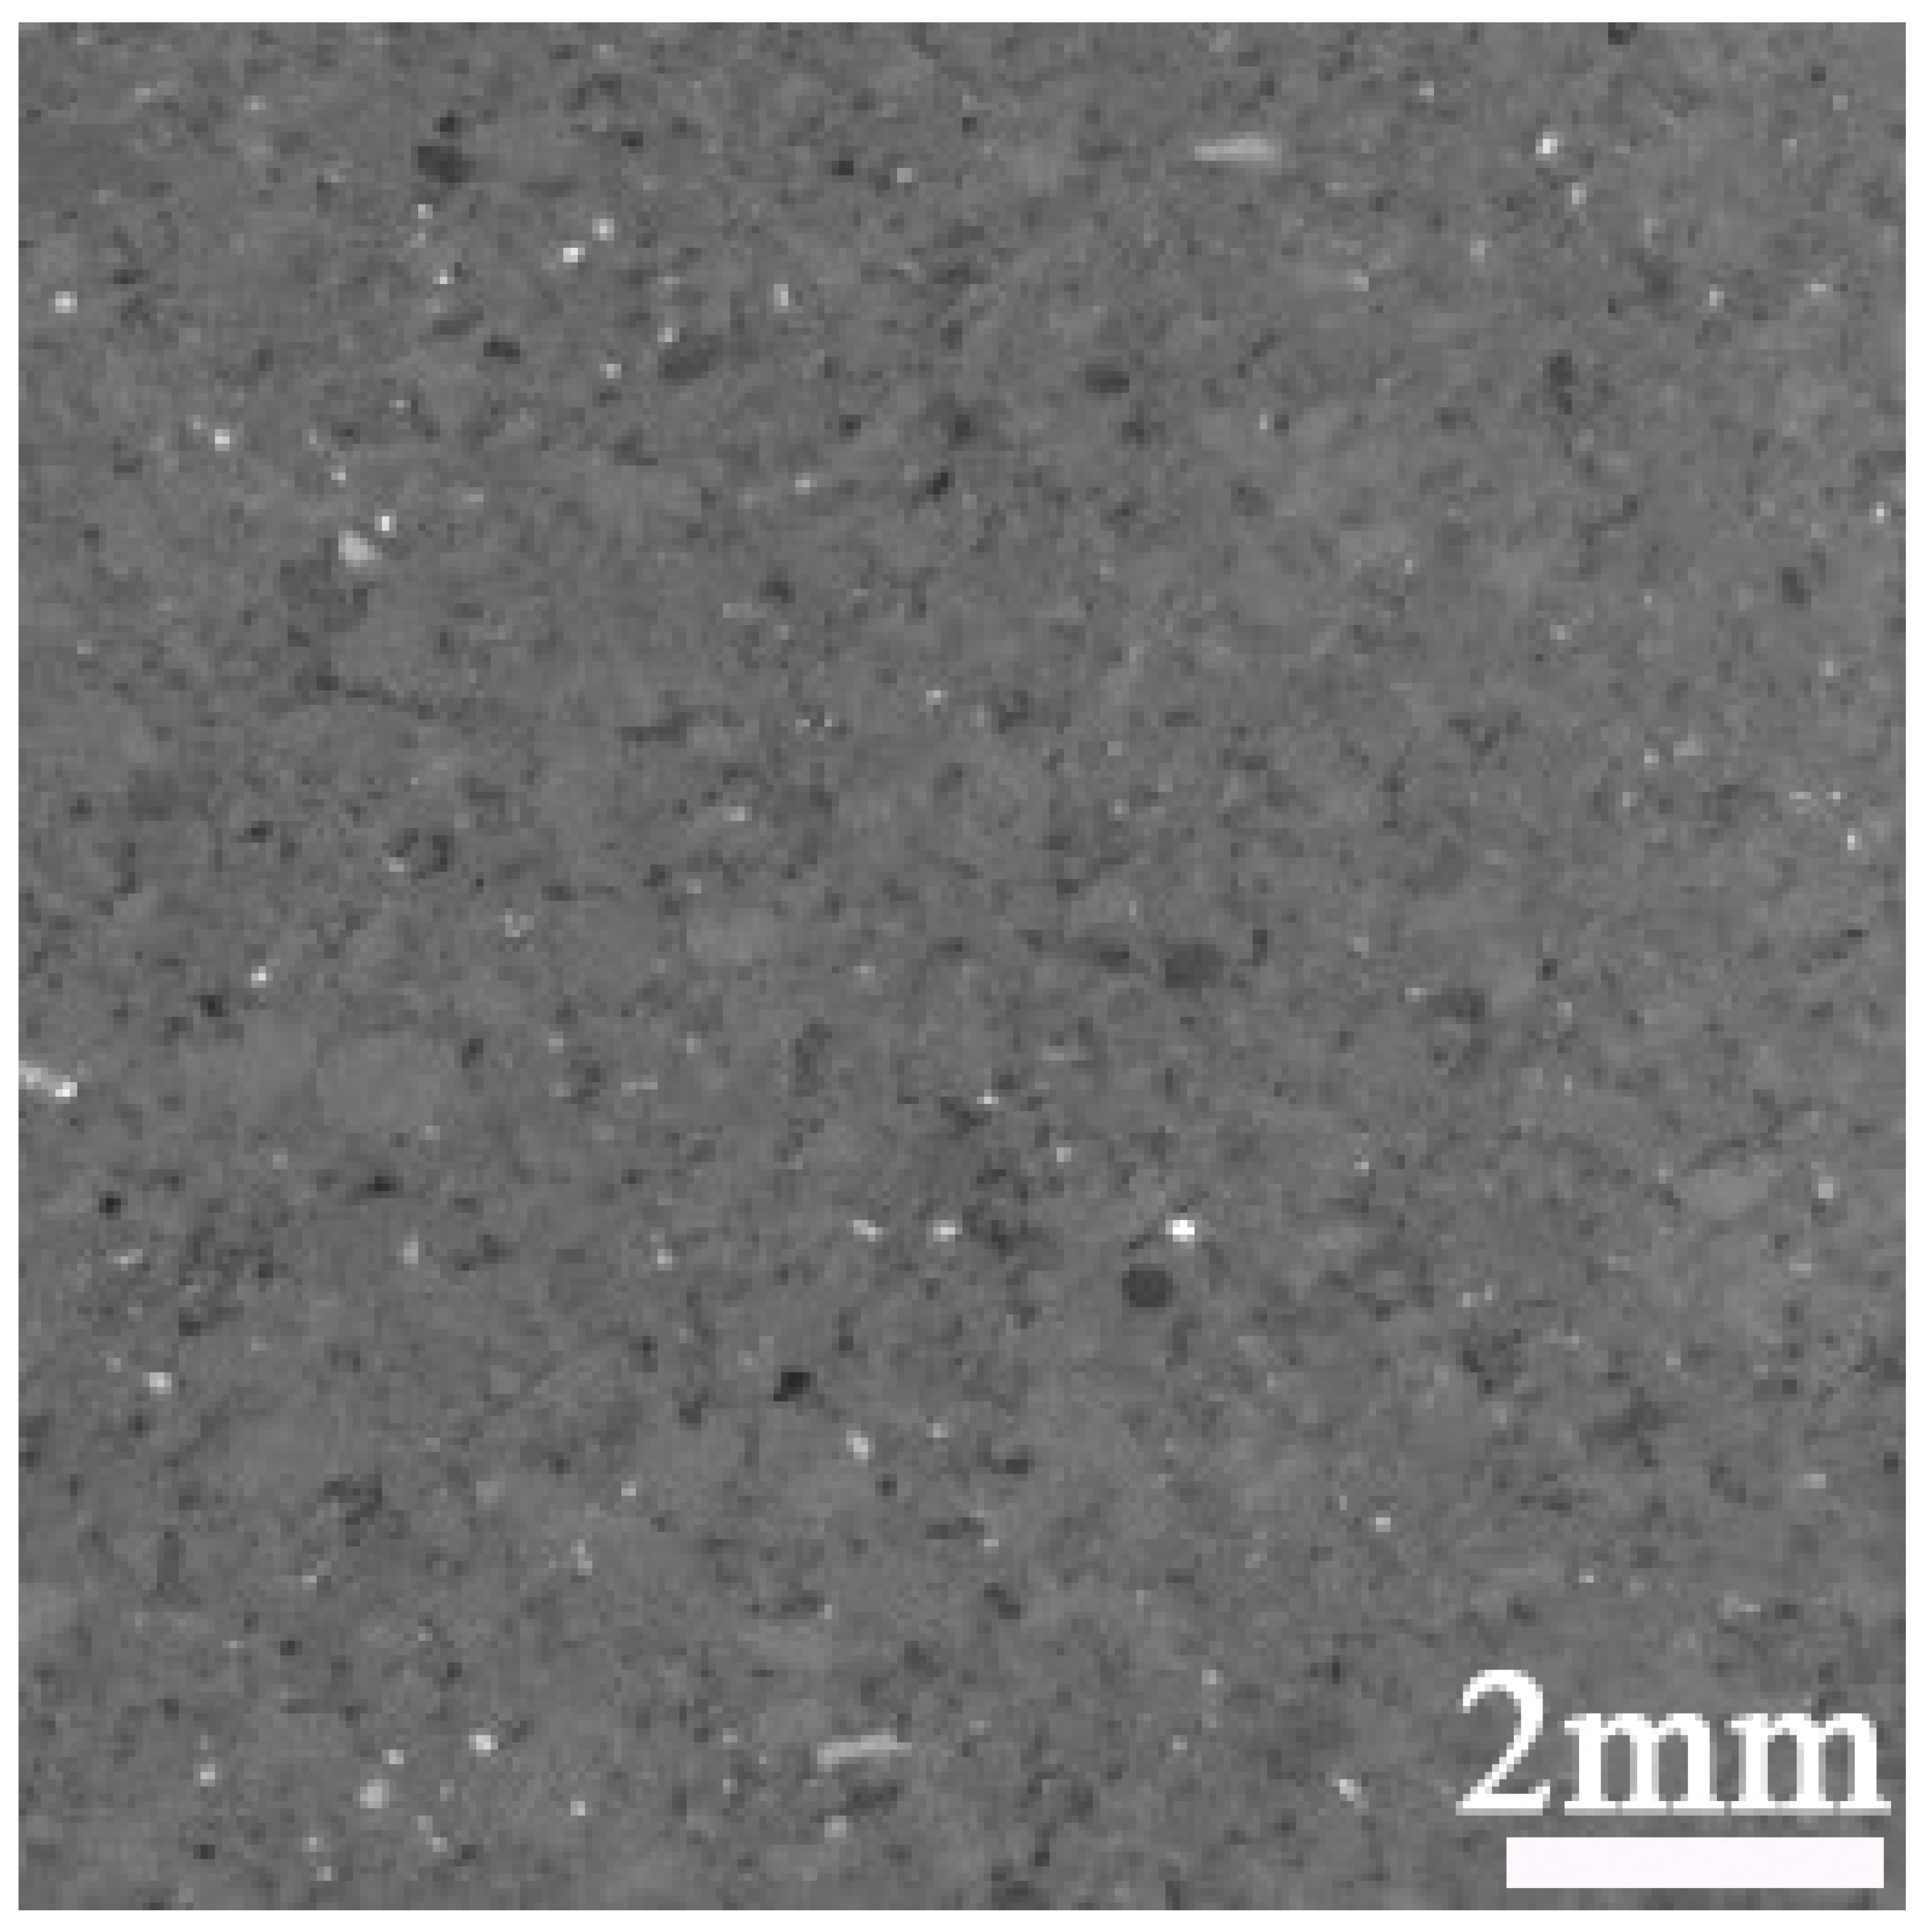
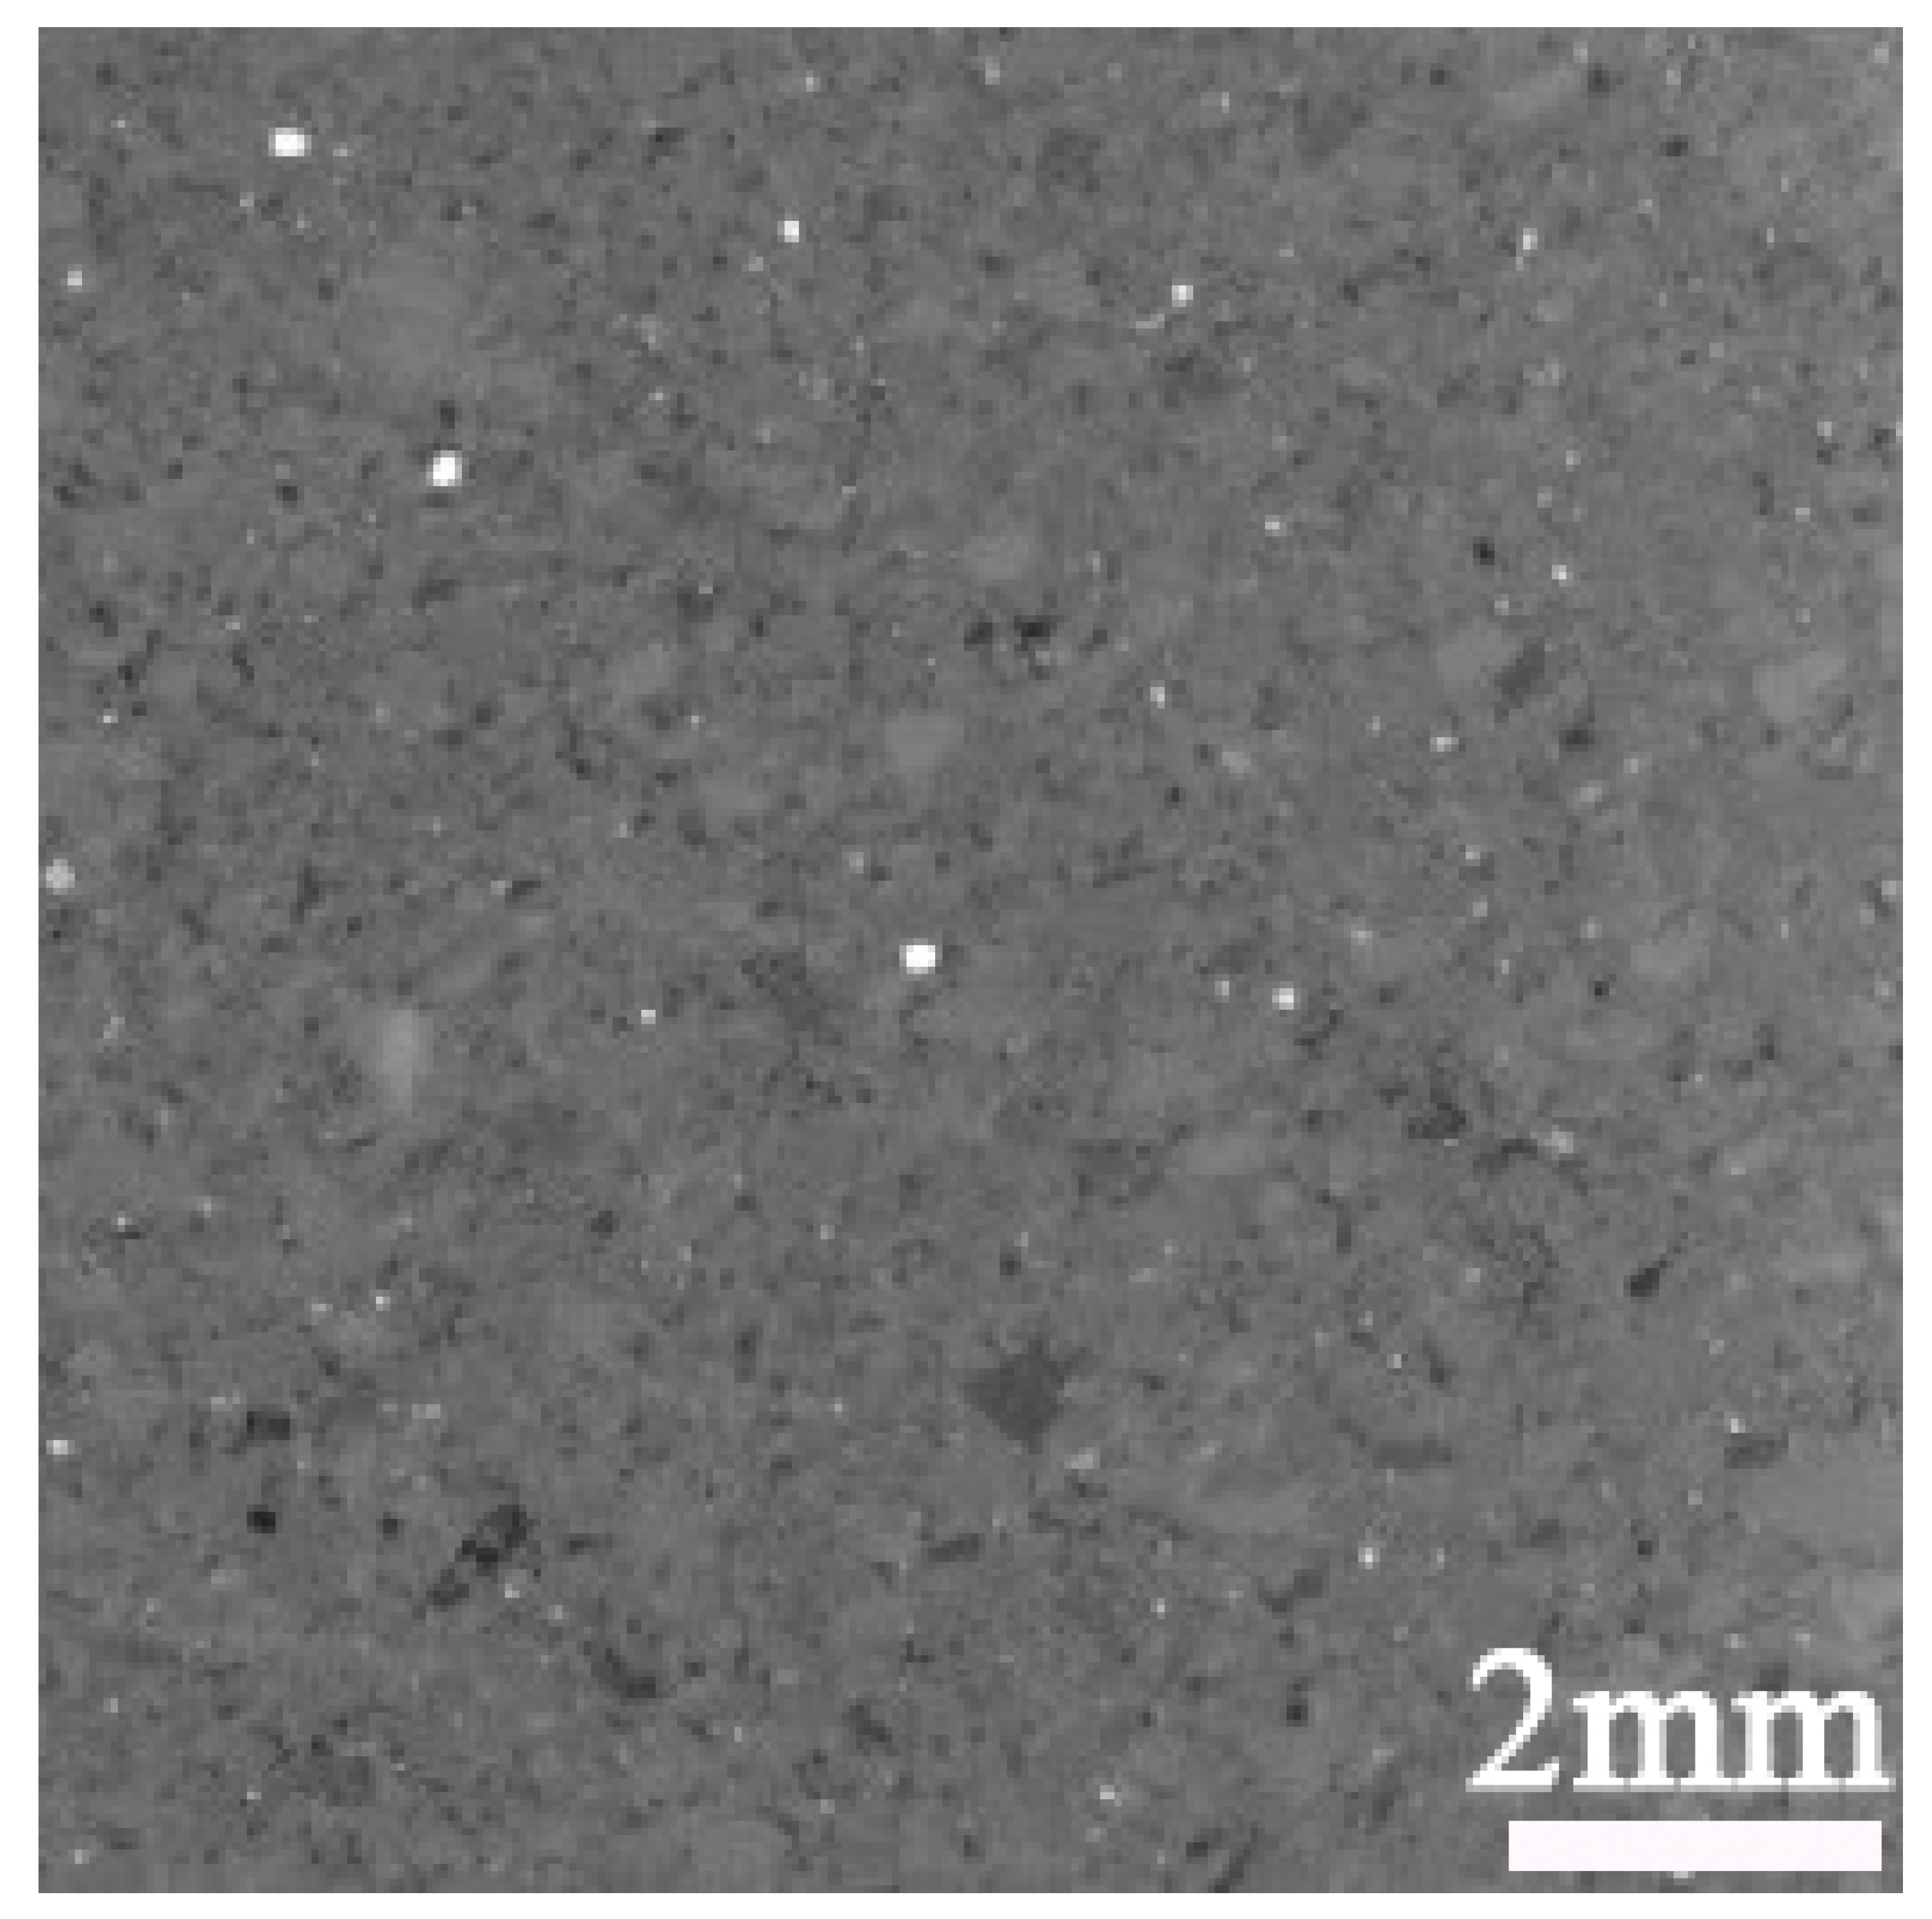
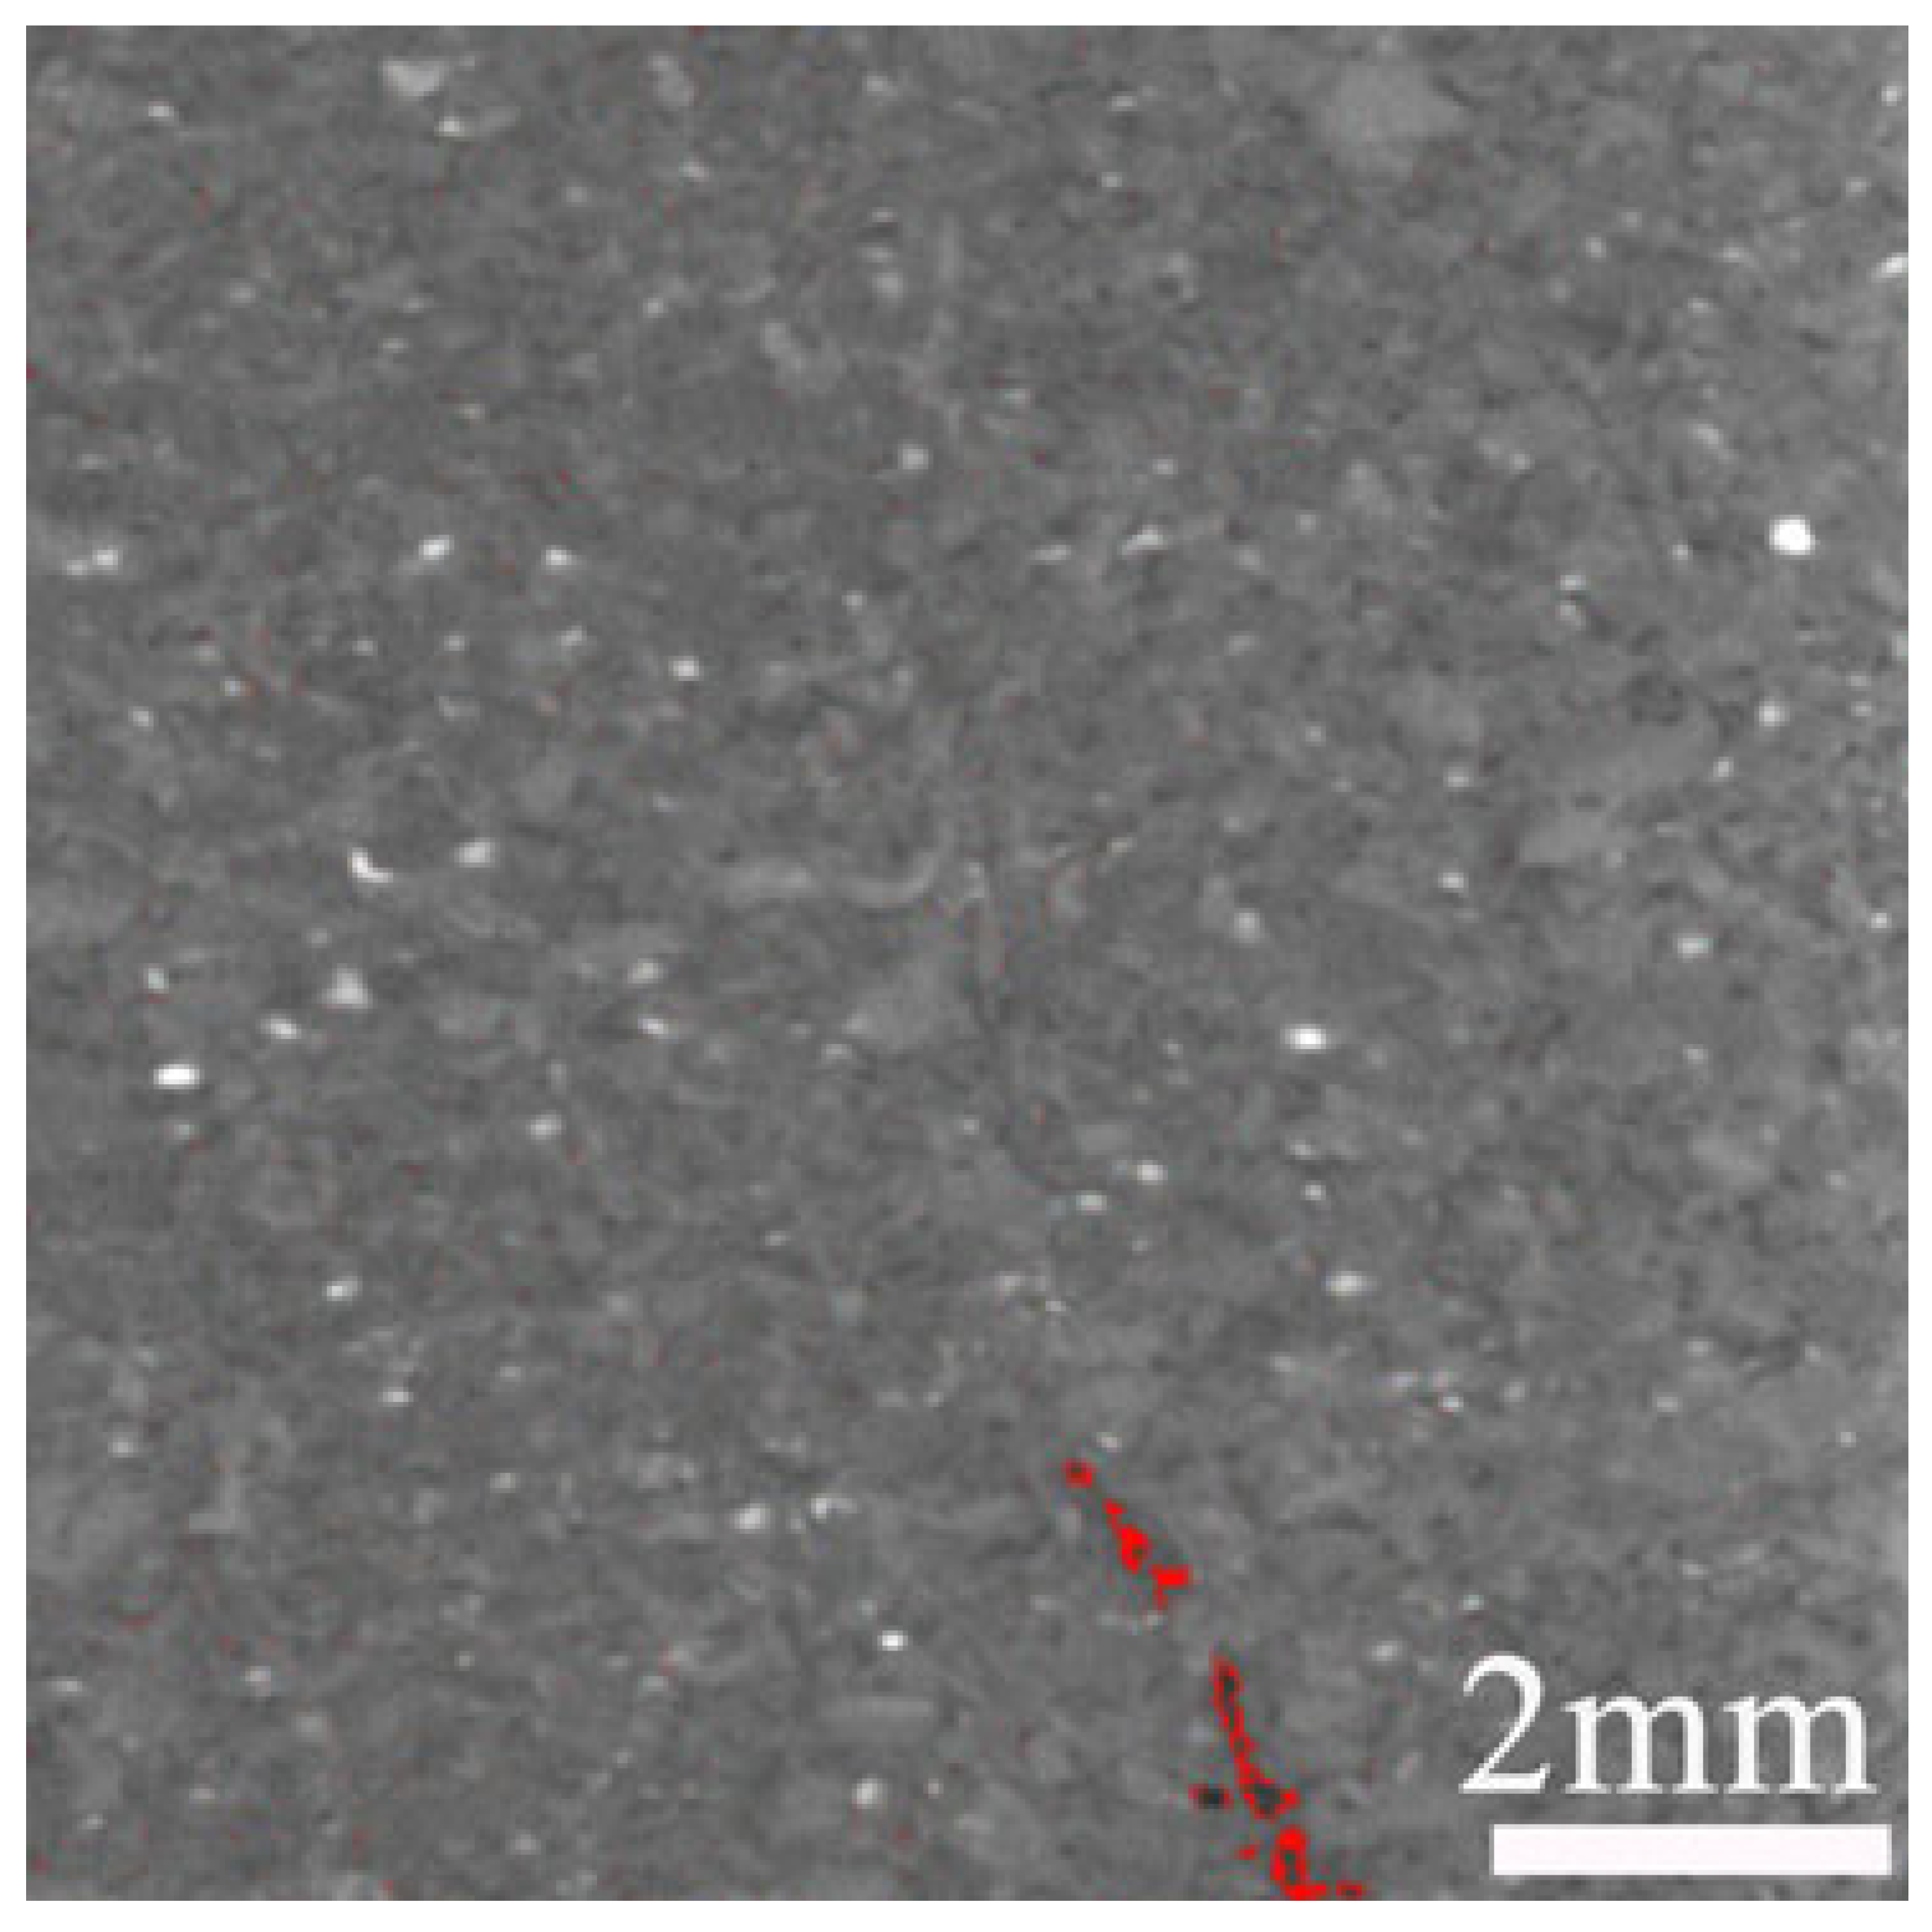
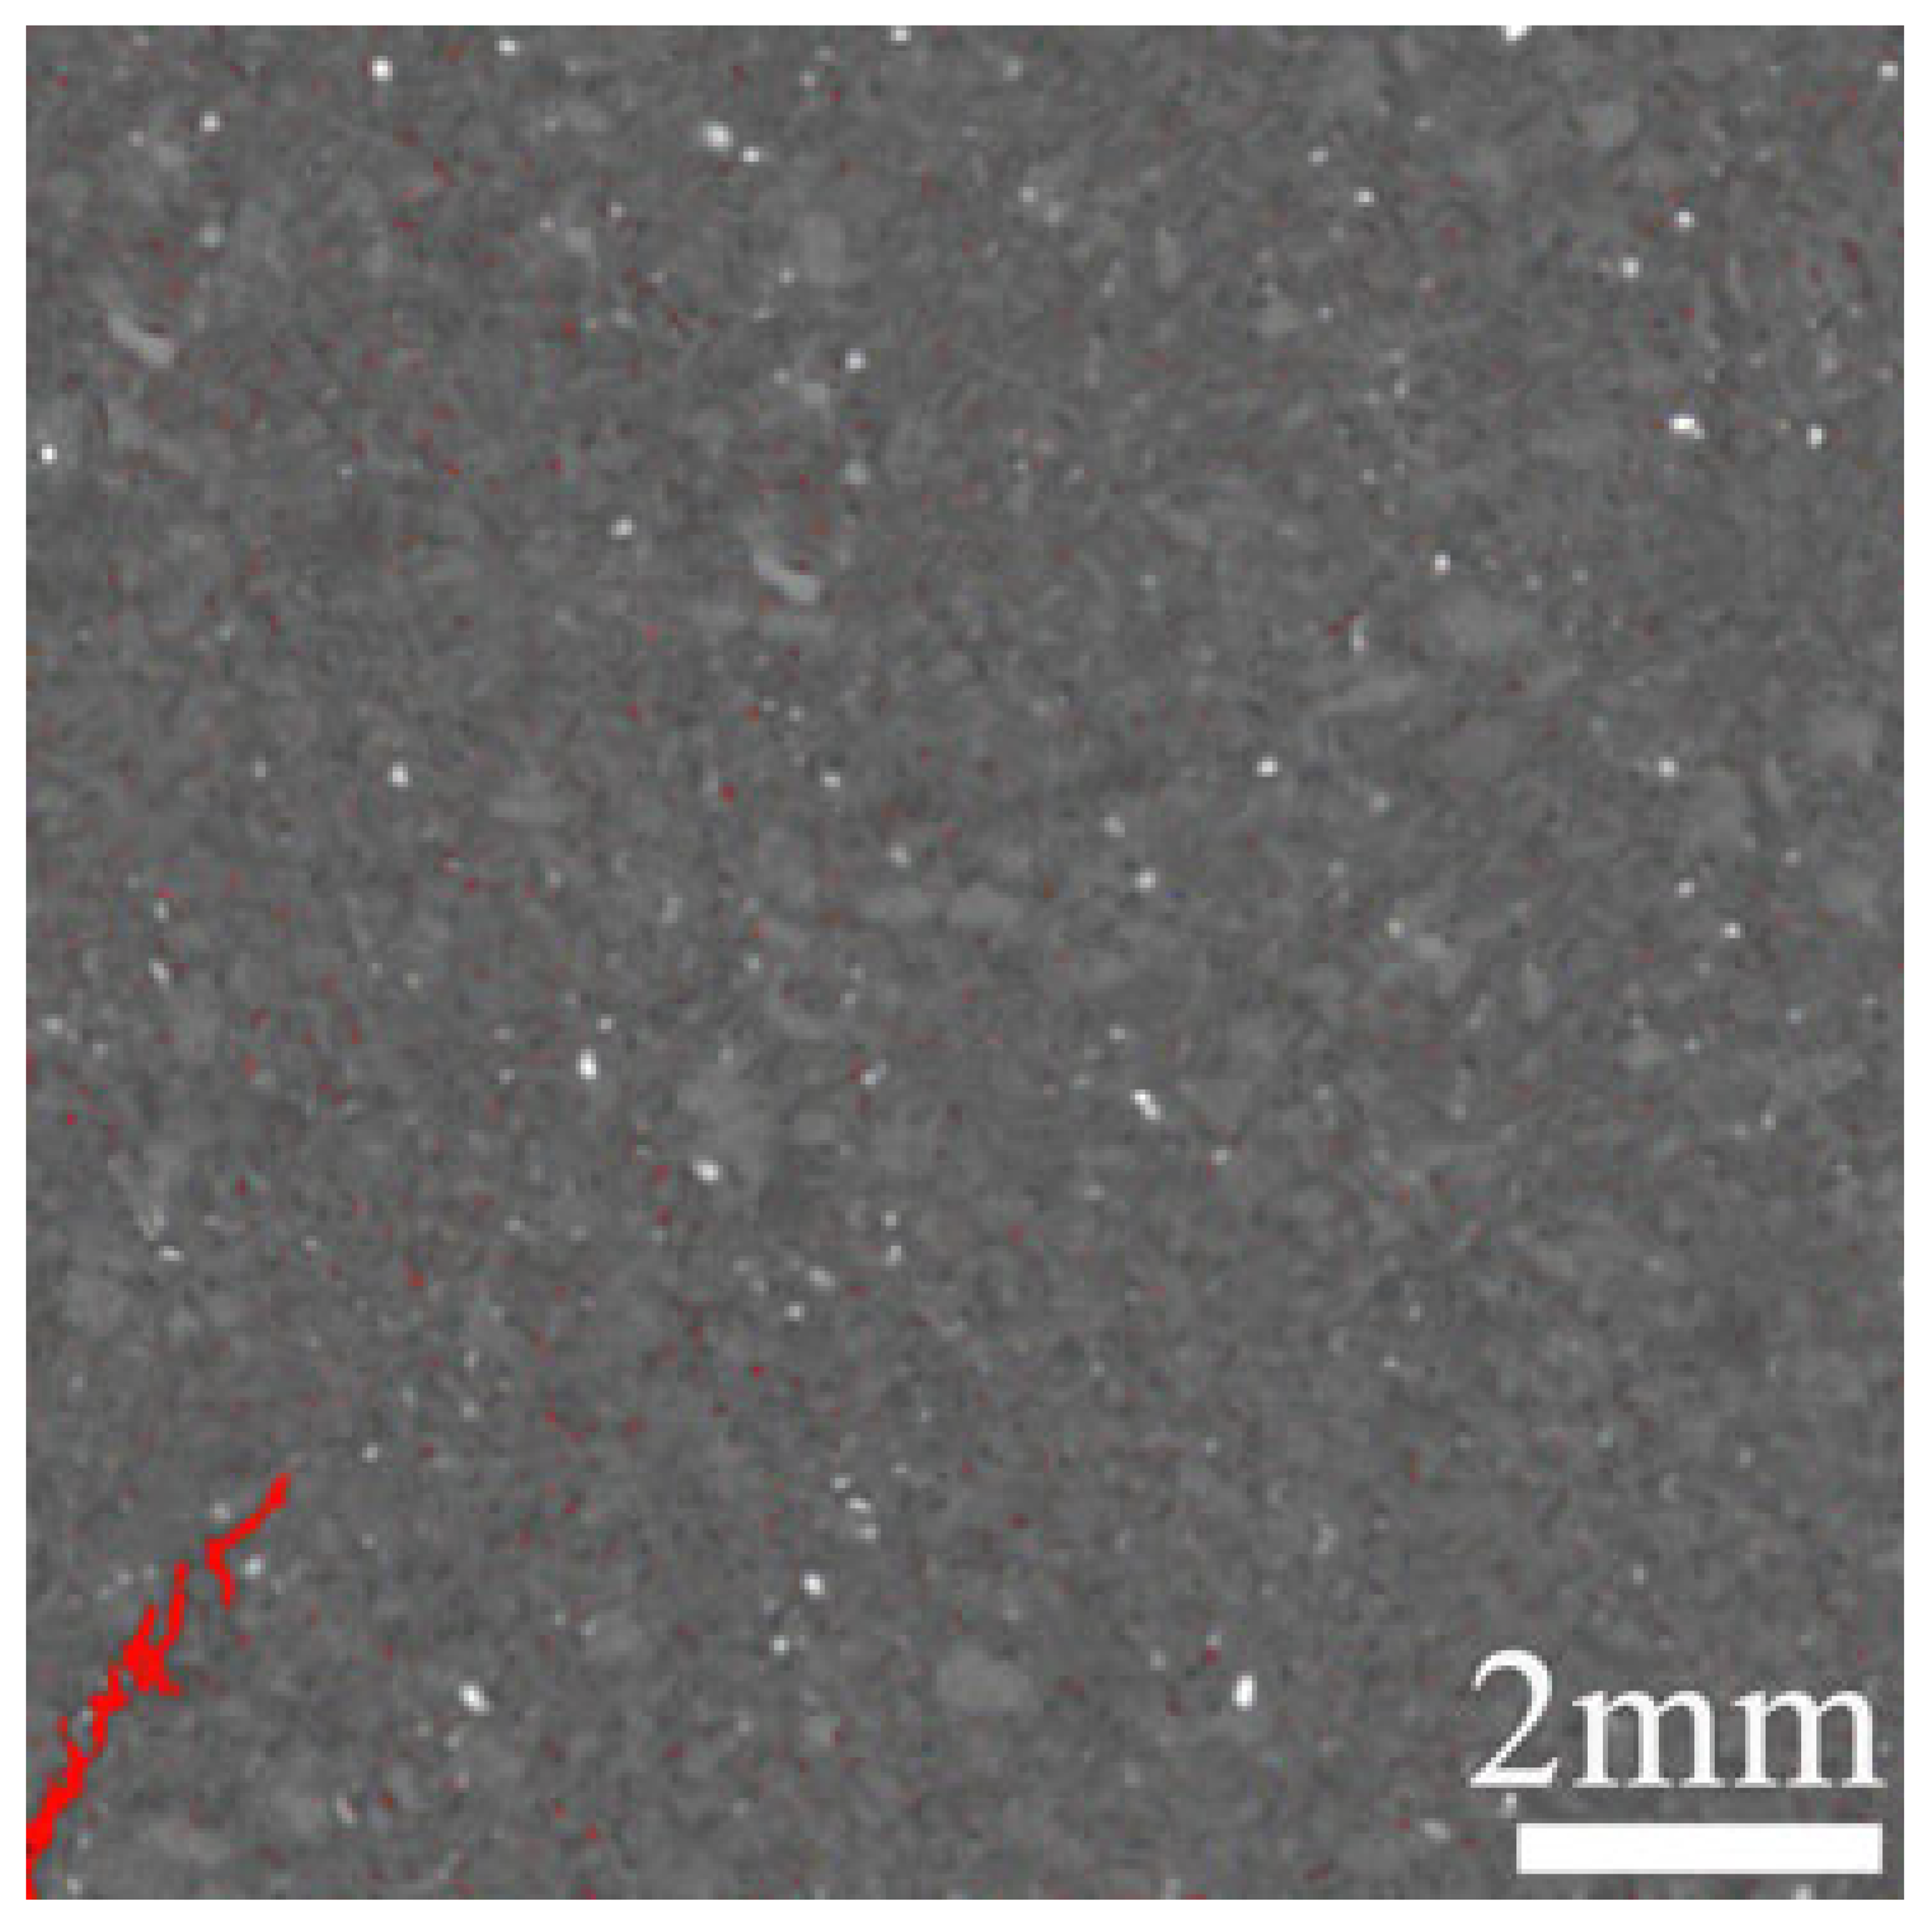
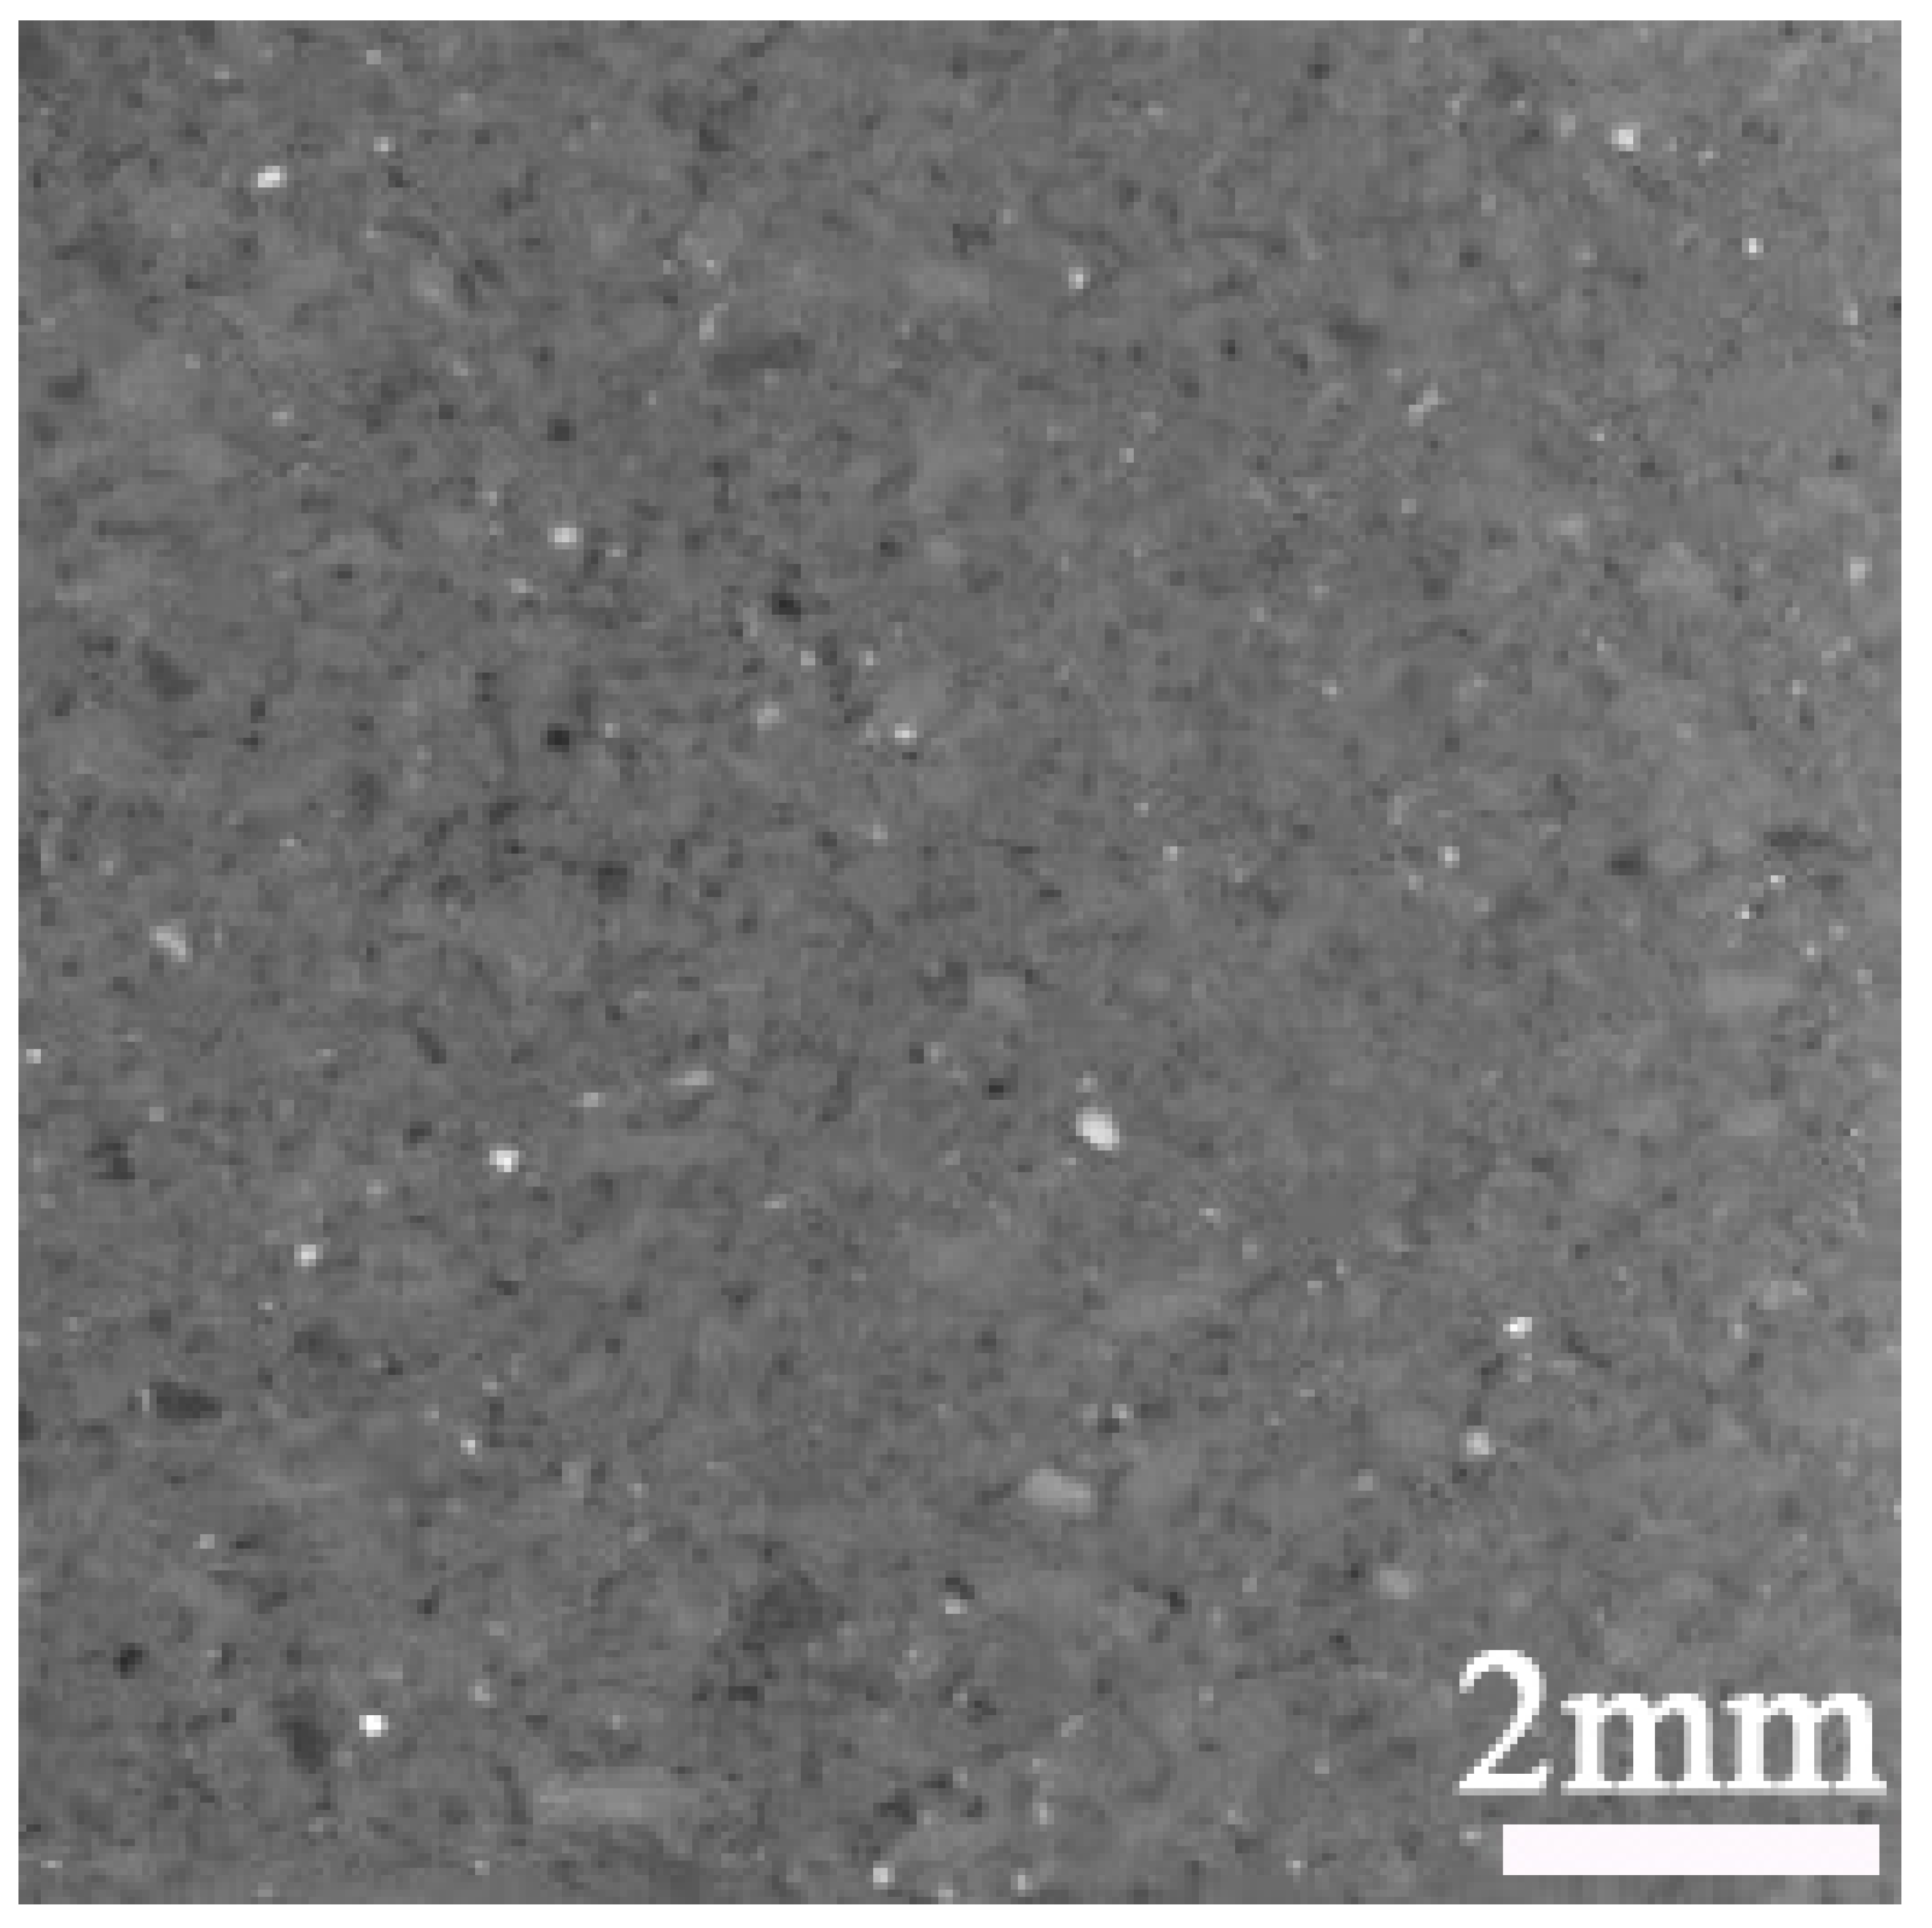
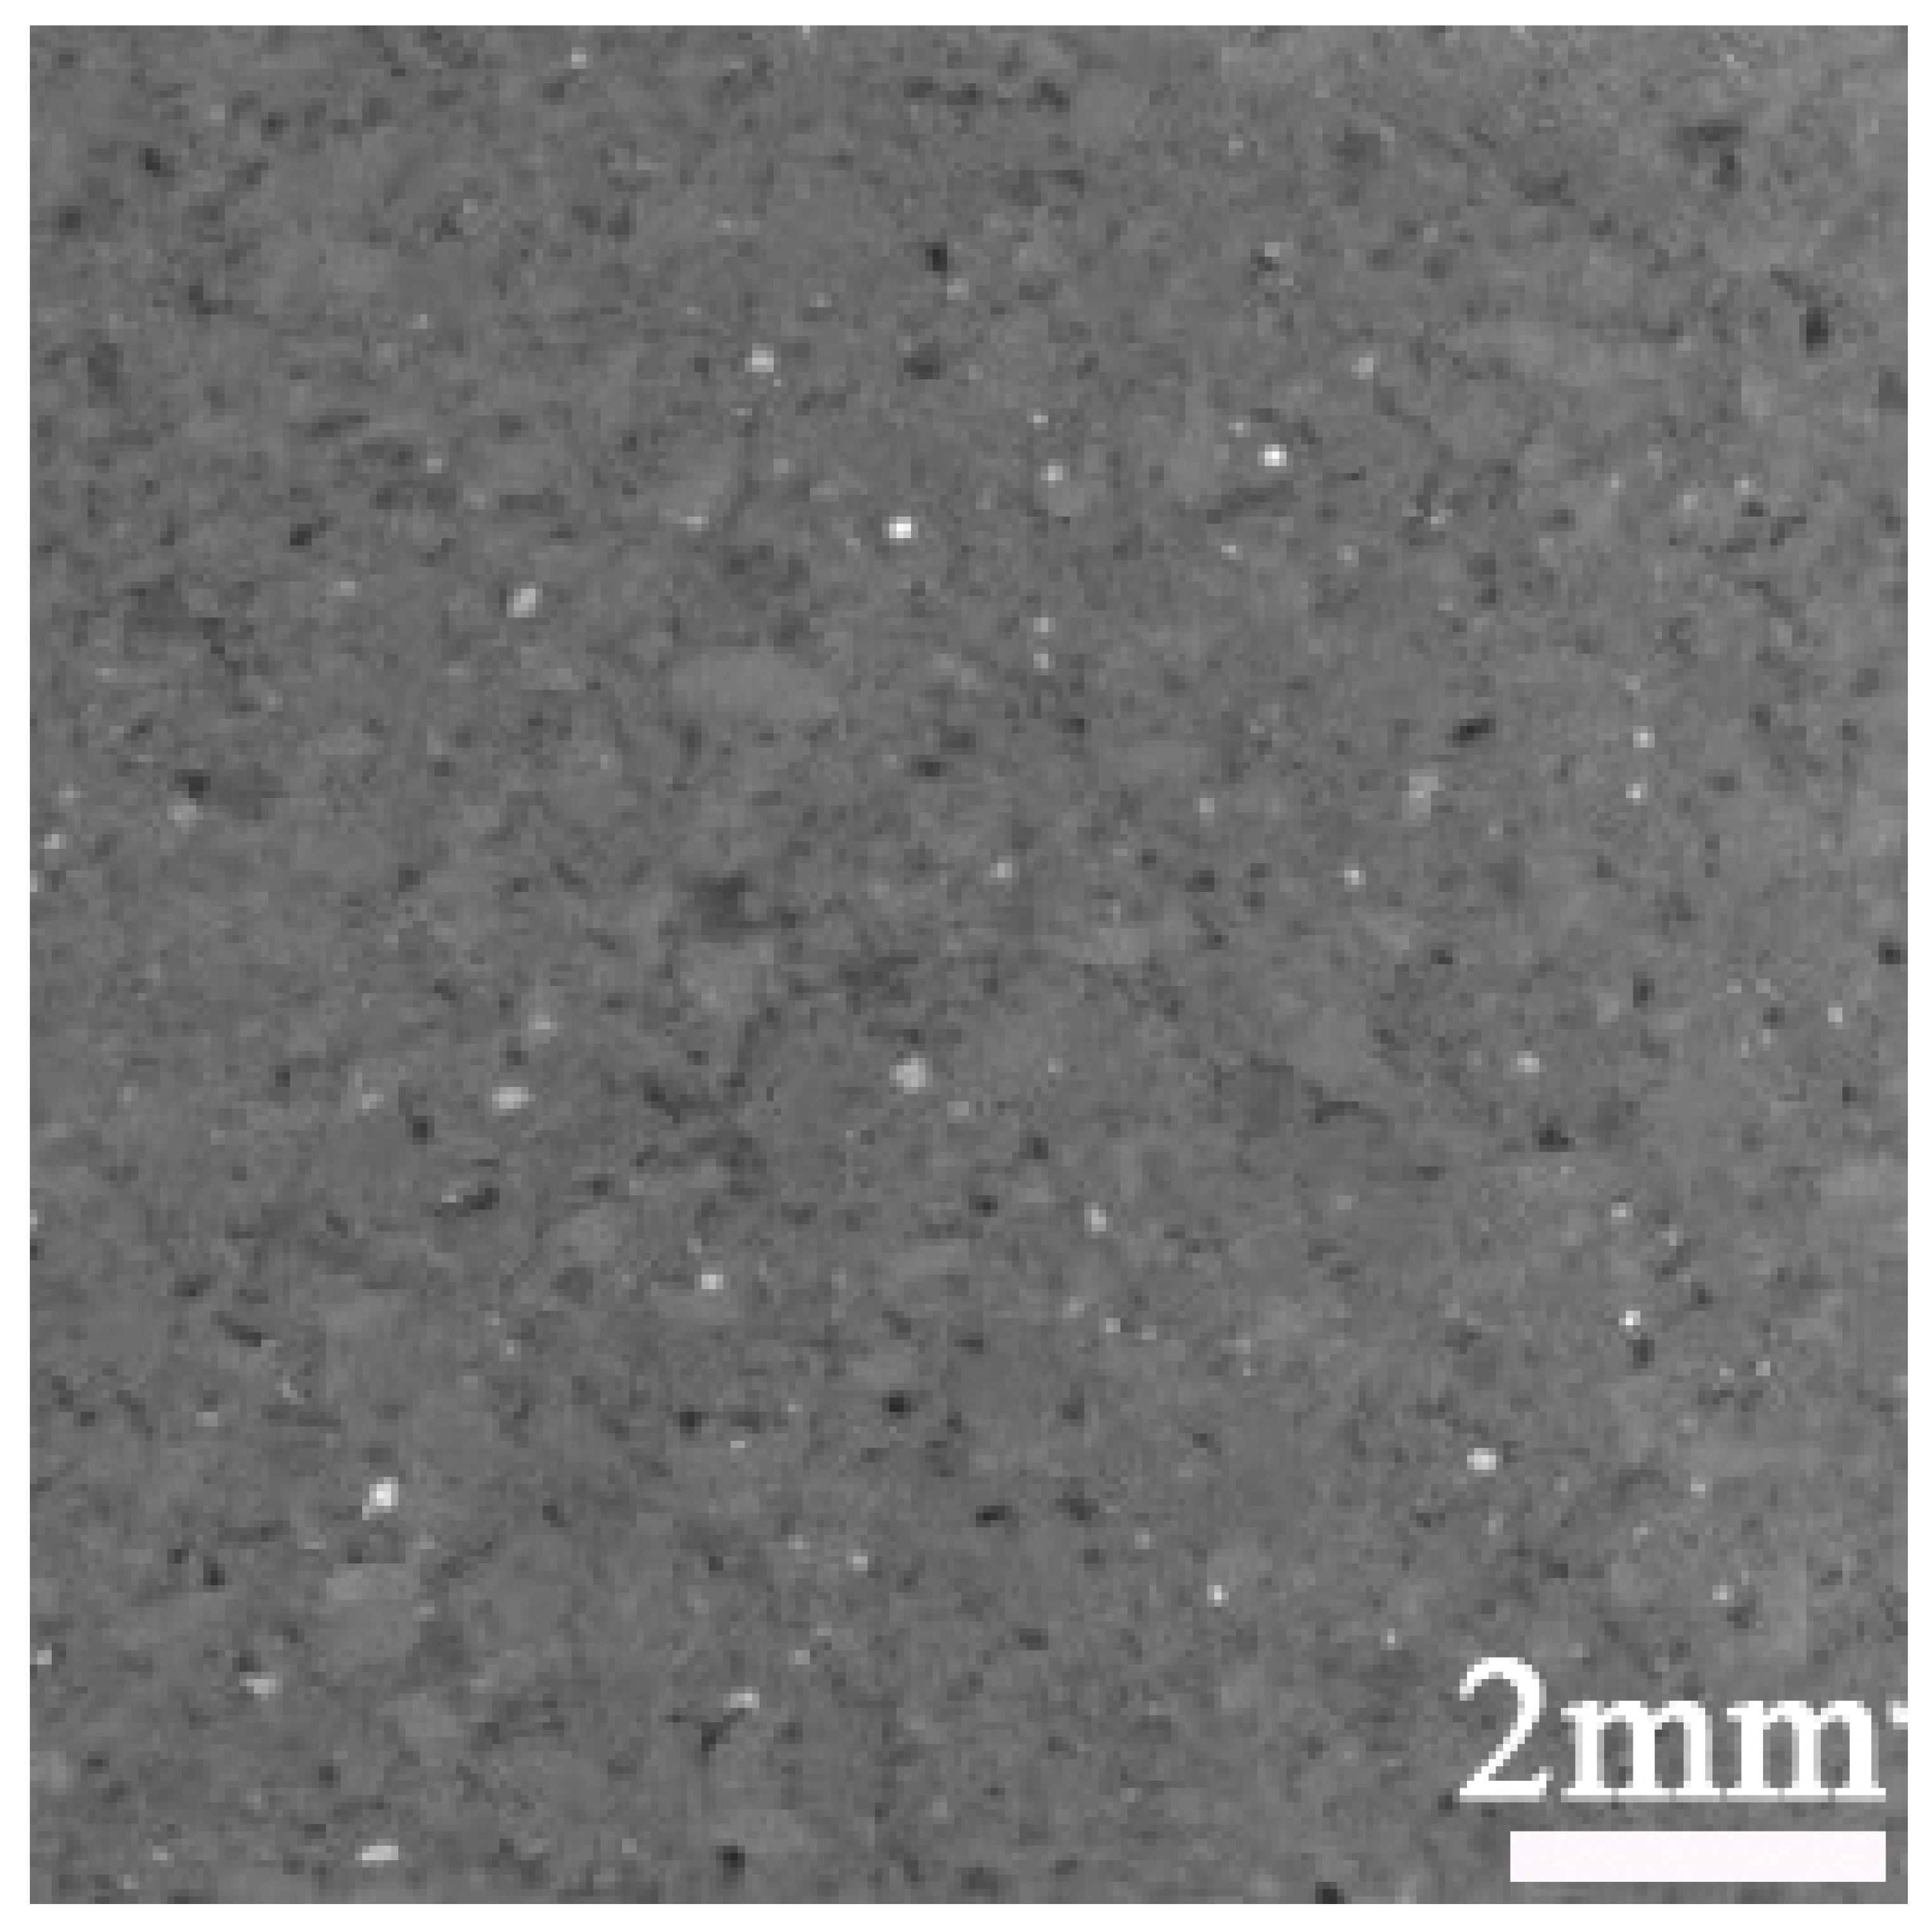
The progressive evolution of internal cracks in sandstone was non-destructively characterized through time-resolved 4D X-ray CT and synchrotron micro-CT imaging. The crack evolution–encompassing nucleation, initiation, propagation, and coalescence–was digitally reconstructed through Avizo 2020 software. Full CT scans of entire sandstone specimens (100 mm cylindrical samples), and the central region (10 mm cubic subsamples) of sandstone specimens are shown in Figure 3a. The azimuth map of the coordinate axes for scanning sandstone samples is shown in Figure 3a. The naturally collected sandstone specimens of Group 3 showed inherent heterogeneity. It can be seen from the physical and mechanical parameters of the sandstone samples from Group 3 (Table 1), and the two-dimensional CT images of the initial internal structure of the heterogeneous sandstone in Group 3 (Figure 3b).
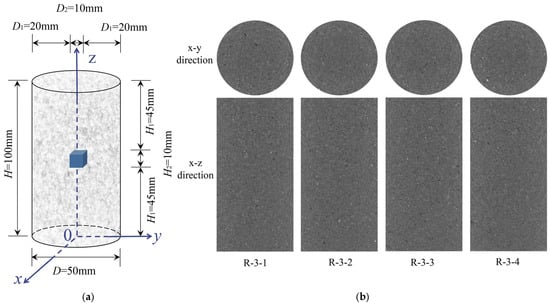
Figure 3.
(a) Cubic subsamples of 10 mm extracted from the central region of sandstone specimens with coordinate axes; (b) two-dimensional CT images of the initial internal structure of the heterogeneous sandstone in Group 3.
The particle-pore interfaces in sandstone were segmented using Interactive Thresholding (Figure 4a), with the grayscale threshold determined by identifying the local minima in the bimodal histogram of CT voxel intensities. Crack morphology was quantified via 3D covariance matrix analysis, yielding three principal eigenvalues (, , ) and two projection angles (, ) (Figure 4b). Crack morphology parameters were derived from XCT 3D reconstructions through the following steps: (1) Binary masks of cracks were extracted using threshold-based region growing. (2) The spatial coordinates of crack voxels were used to compute covariance matrix, whose eigenvalues ( ≥ ≥ ) represent crack dimensions along principal axes. (3) (dip angle): Angle between the major principal axis ( direction) and the vertical axis (Z-axis of the sample). (4) (azimuth angle): Projection of onto the horizontal plane (XY-plane), measured counterclockwise from the X-axis. The Equivalent Pore Network Model (E-PNM) retains interconnected micropores while excluding isolated micropores. Spheres represent pores, and rods between them represent throats. Rod radii and lengths correspond to throat equivalent radii and lengths (Figure 4c). Color-coding by pore size visualizes connectivity in geomaterials. Additionally, the E-PNM categorizes pore space into connected pores and interconnecting throats [57]. The Maximal Ball Algorithm identifies pores and throats. Here, pore equivalent radii are determined by maximum inscribed spheres. Throats are defined as the narrowest connecting sections between pores. At the same time, the pore Coordination Number in topological connectivity analysis is used to judge the connectivity. That is, isolated micropores have a coordination number of 0, and connected micropores show coordination numbers ≥1. A 3D pore–throat network model was constructed using the equivalent sphere method, representing pores as spheres and cracks as throats (Figure 4c). Multi-parametric analysis integrated Label Analysis to extract morphometric parameters and dynamic parameters for quantitative damage characterization.
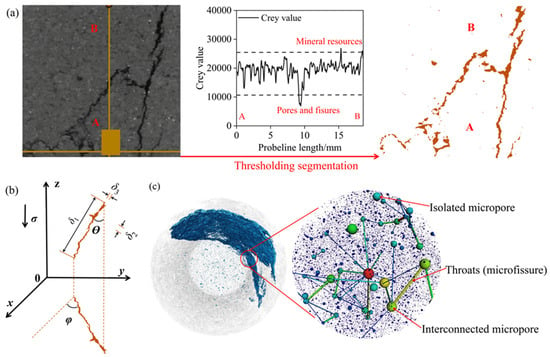
Figure 4.
Crack characteristics derived from CT imaging: (a) Sandstone pores/cracks (orange) via threshold segmentation; (b) crack eigenvectors (, , ) and projection angles ( for axial, for vertical); (c) 3D pore–crack network model with equivalent spheres (isolated micropores, connected micropores, and throat microcracks).
2.4. CT Scanning Points Selection and Scanning Procedure
Unlike the sudden brittle failure observed in homogeneous rocks [4], natural sandstone usually undergoes progressive failure due to the existence of its anisotropic microstructure. Key scanning locations were strategically selected at distinct loading stages to monitor microstructural evolution. Group 1 specimens underwent CT scanning at three critical stress–strain curve inflection points: loading initiation (1-1), peak stress (1-2), and failure (1-3) (Figure 5a). The parameter k was defined as the slope of the linear elastic region in the stress-time curve, which quantifies the sandstone’s resistance to elastic deformation under uniaxial compression. Considering the marked mesostructural disparities observed in Group 1, Group 2 specimens received 1-2 additional scans near each of the three key points identified in Group 1. Specific additions included point 2-2 (near loading initiation 2-1), dual points 2-3/2-5 (adjacent to peak 2-4), and point 2-6 (close to failure 2-7) (Figure 5b). Accounting for crack propagation, the fracture process of Group 3 specimens was segmented into five loading stages (compression I, elastic II, yield III, pre-failure IV, instability V) with six stress levels, informed by Group 1/2 stress–strain curves and CT imagery. The six stress levels aligned with six real-time CT scanning nodes (3-1 to 3-6) illustrated in Figure 5c [32]. Integrated CT real-time scanning and SEM experiments were conducted at critical transition points during Group 3’s continuous uniaxial compression and AE monitoring.
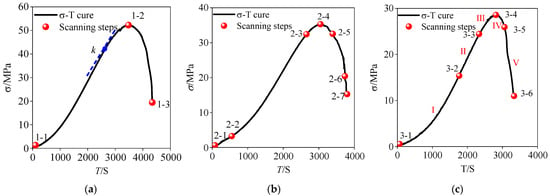
Figure 5.
Selection of CT scanning points: (a) Key scanning point distribution for Group 1 (4 R-1 specimens); (b) Group 2 (4 R-2 specimens); (c) Group 3 (4 R-3 specimens).
The experimental procedure for Group 3 of specimens is outlined as follows: (1) Baseline Scan: As demonstrated in Figure 3b, the initial CT scan captured the pristine microstructure of Group 3 samples (Point 3-1 in Figure 5c). (2) Loading and Scanning Cycle: Following the reset of the CT platform, the servo-controlled loading system and AE monitoring module were activated. The scanning parameters were dynamically optimized based on real-time stress–strain curves, AE activity, and specimen deformation. The initiation of CT scans was contingent upon predefined stress thresholds (see Points 3-2 to 3-5). (3) Failure Stage Scan: A final CT scan (Point 3-6) was obtained during the post-failure stabilization phase. For the final scanning point (3-6) of Group 3 sandstone specimens, CT scanning was conducted post-failure after complete specimen damage. At this stage, the sandstone no longer sustained axial load, as the specimen had reached its failure state. The CT scanning system captured the post-failure internal configuration of the damaged specimen. The implementation of AE-driven emergency shutdown was undertaken to facilitate the observation of crack propagation. The mitigation of scanning induced stress relaxation was achieved through the optimization of scan scheduling. The loading system was programmed to autonomously halt when the strain-hardening load fell below 50% of the peak load [54]. Integrated experimental workflows yielded time-series data, including stress–strain curves, AE activity records, and 4D-XCT images for the Group 3 samples.
3. Experimental Results and Analysis
3.1. Macromechanical Response Characteristics
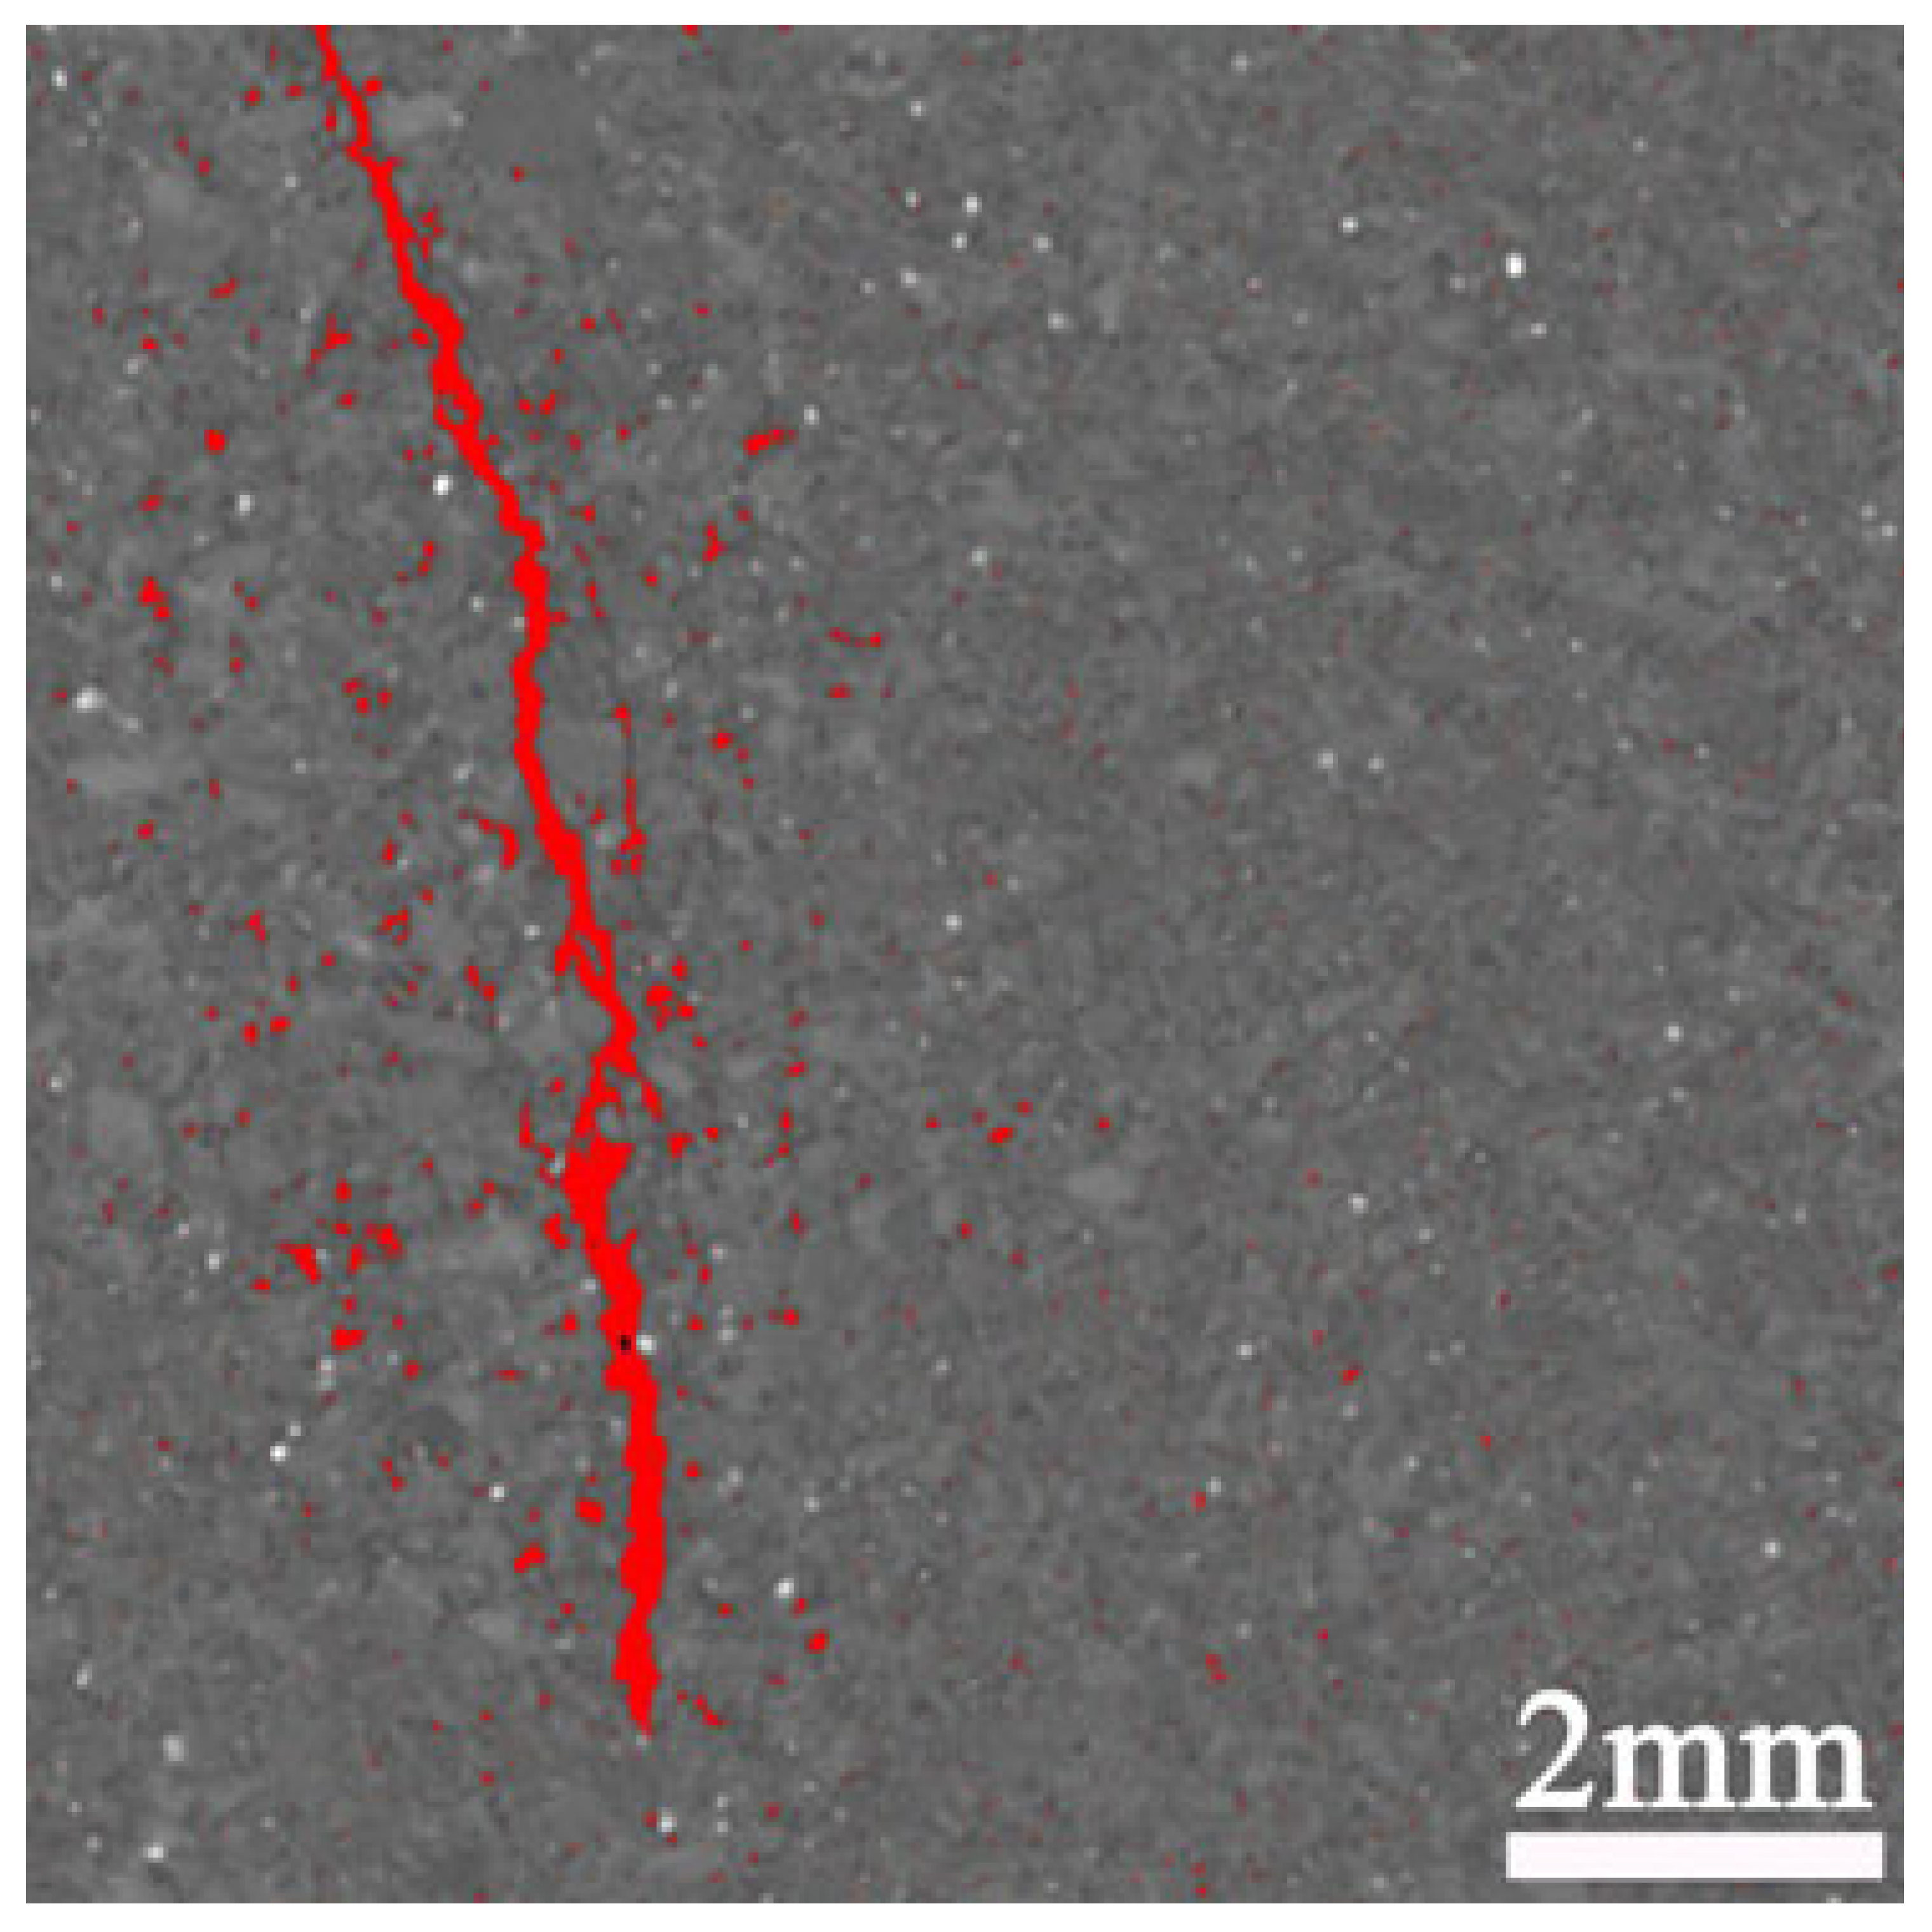
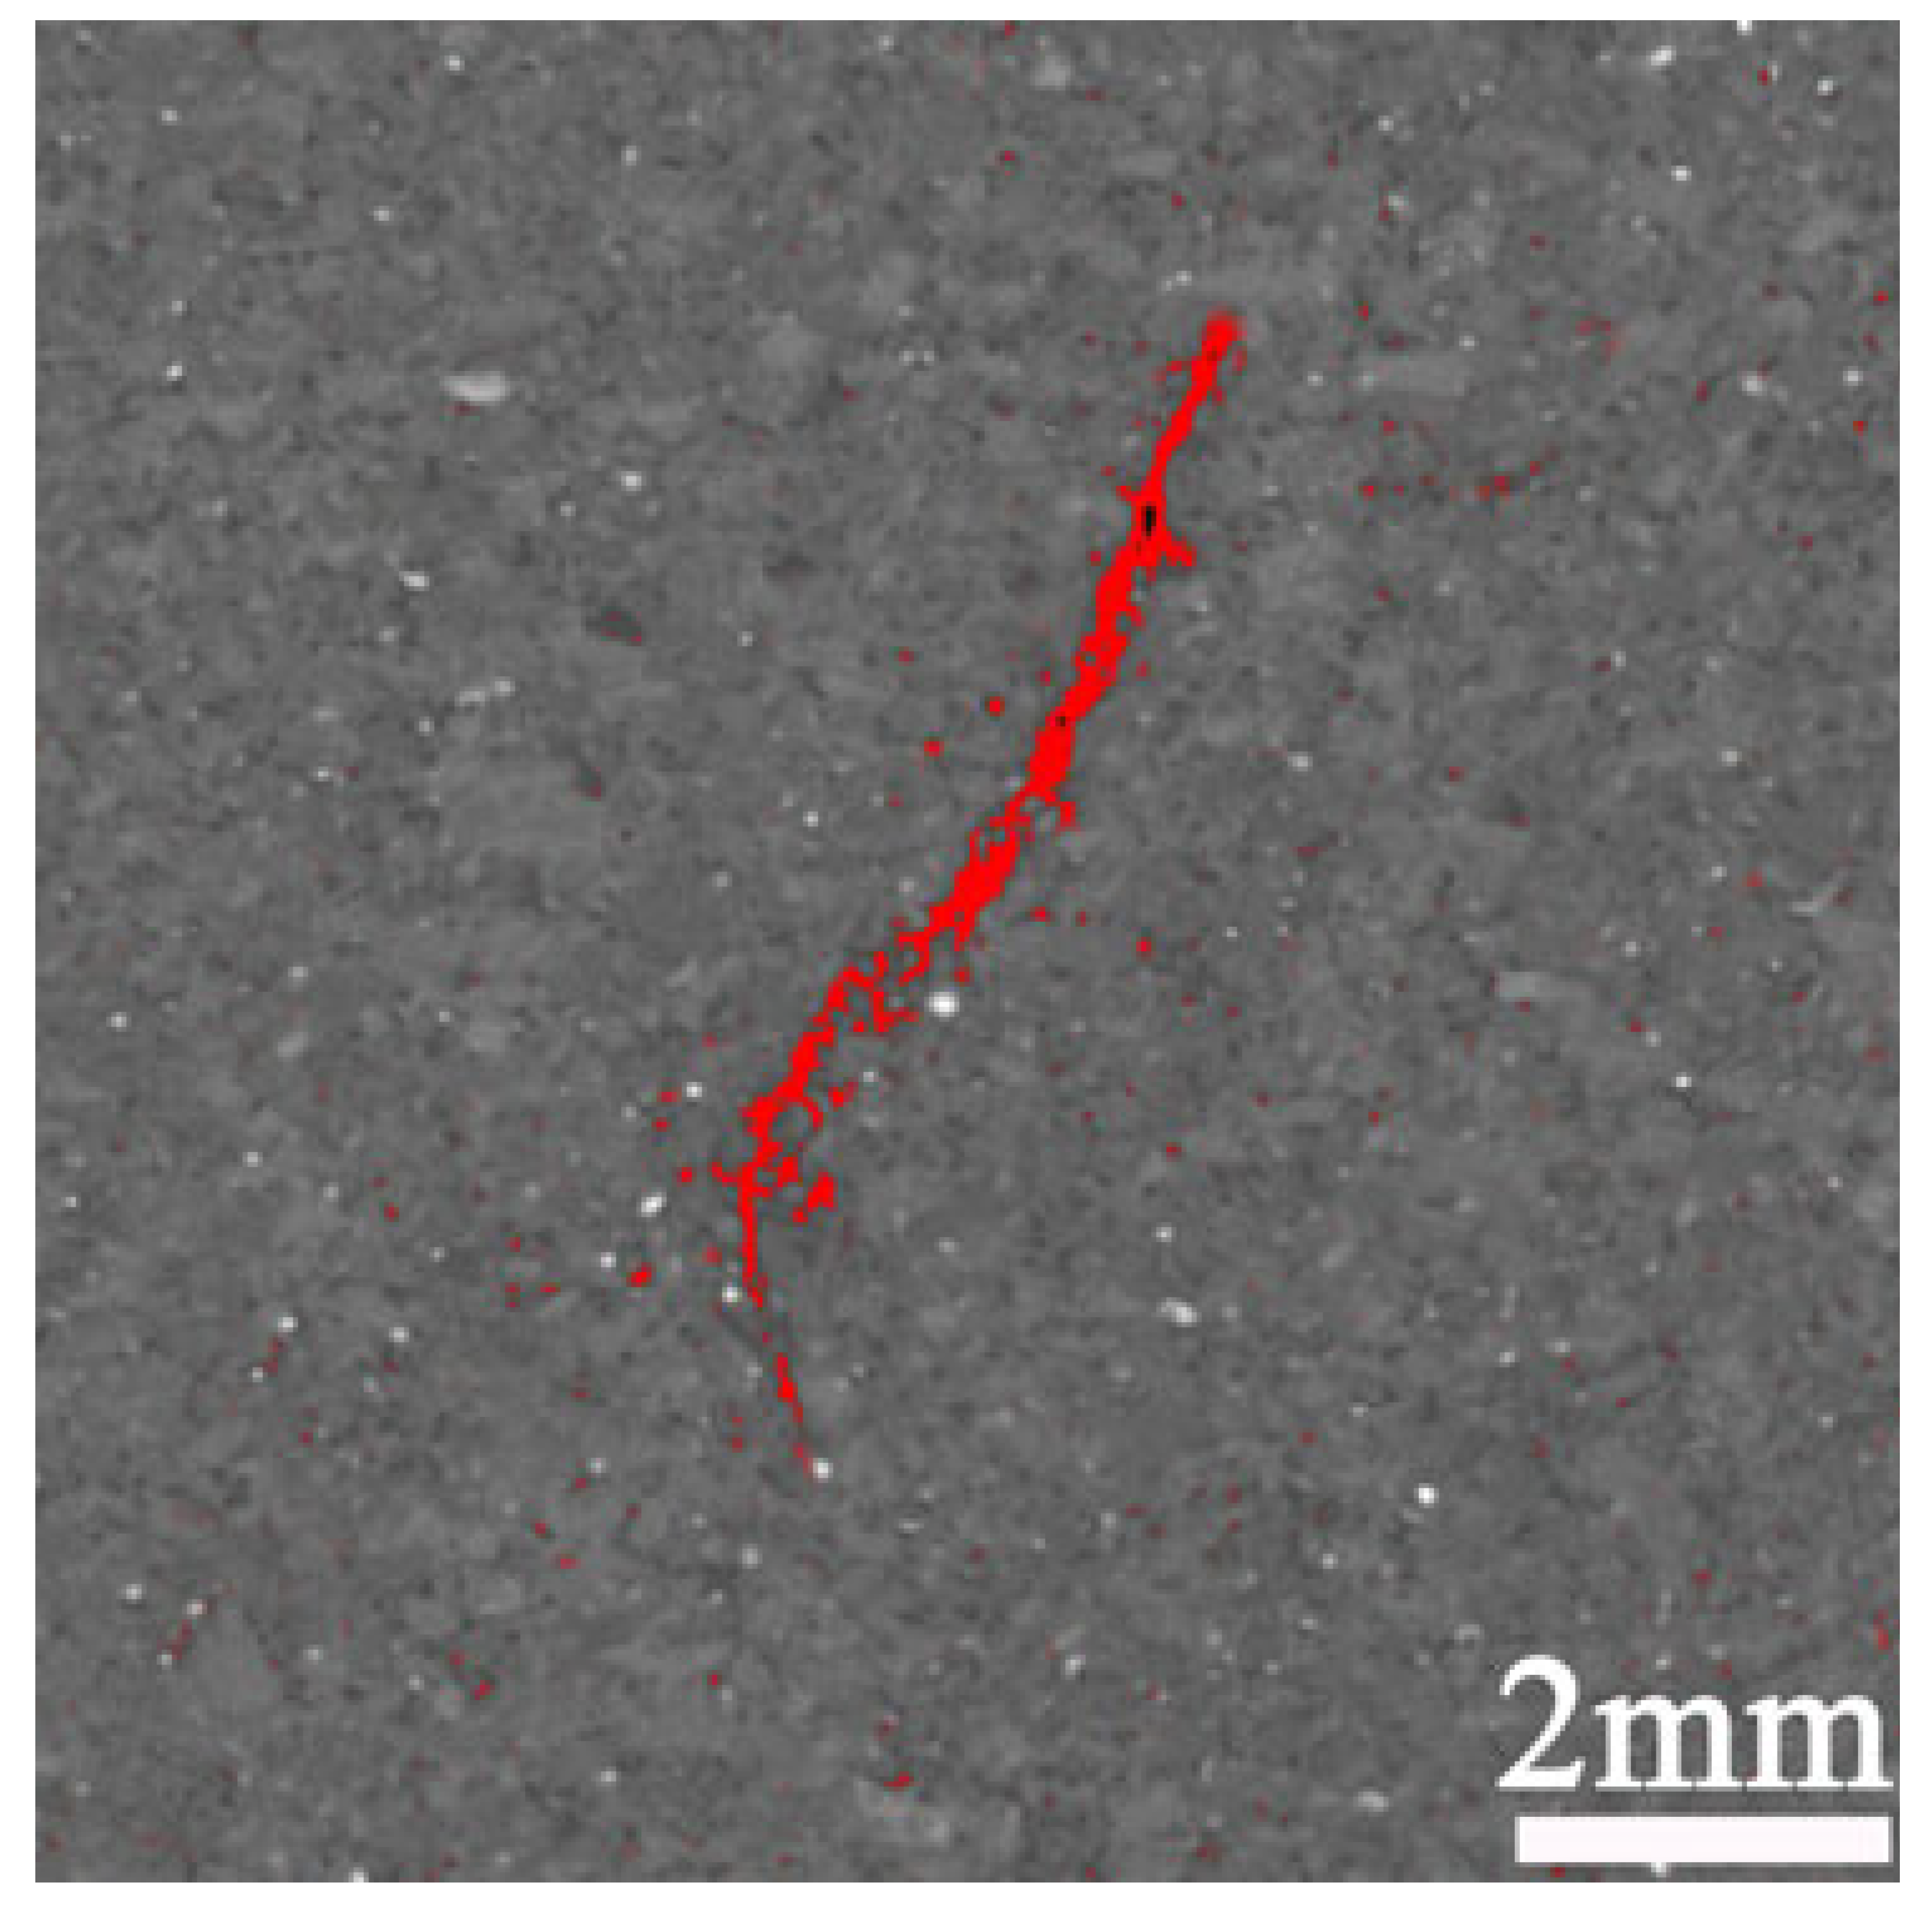
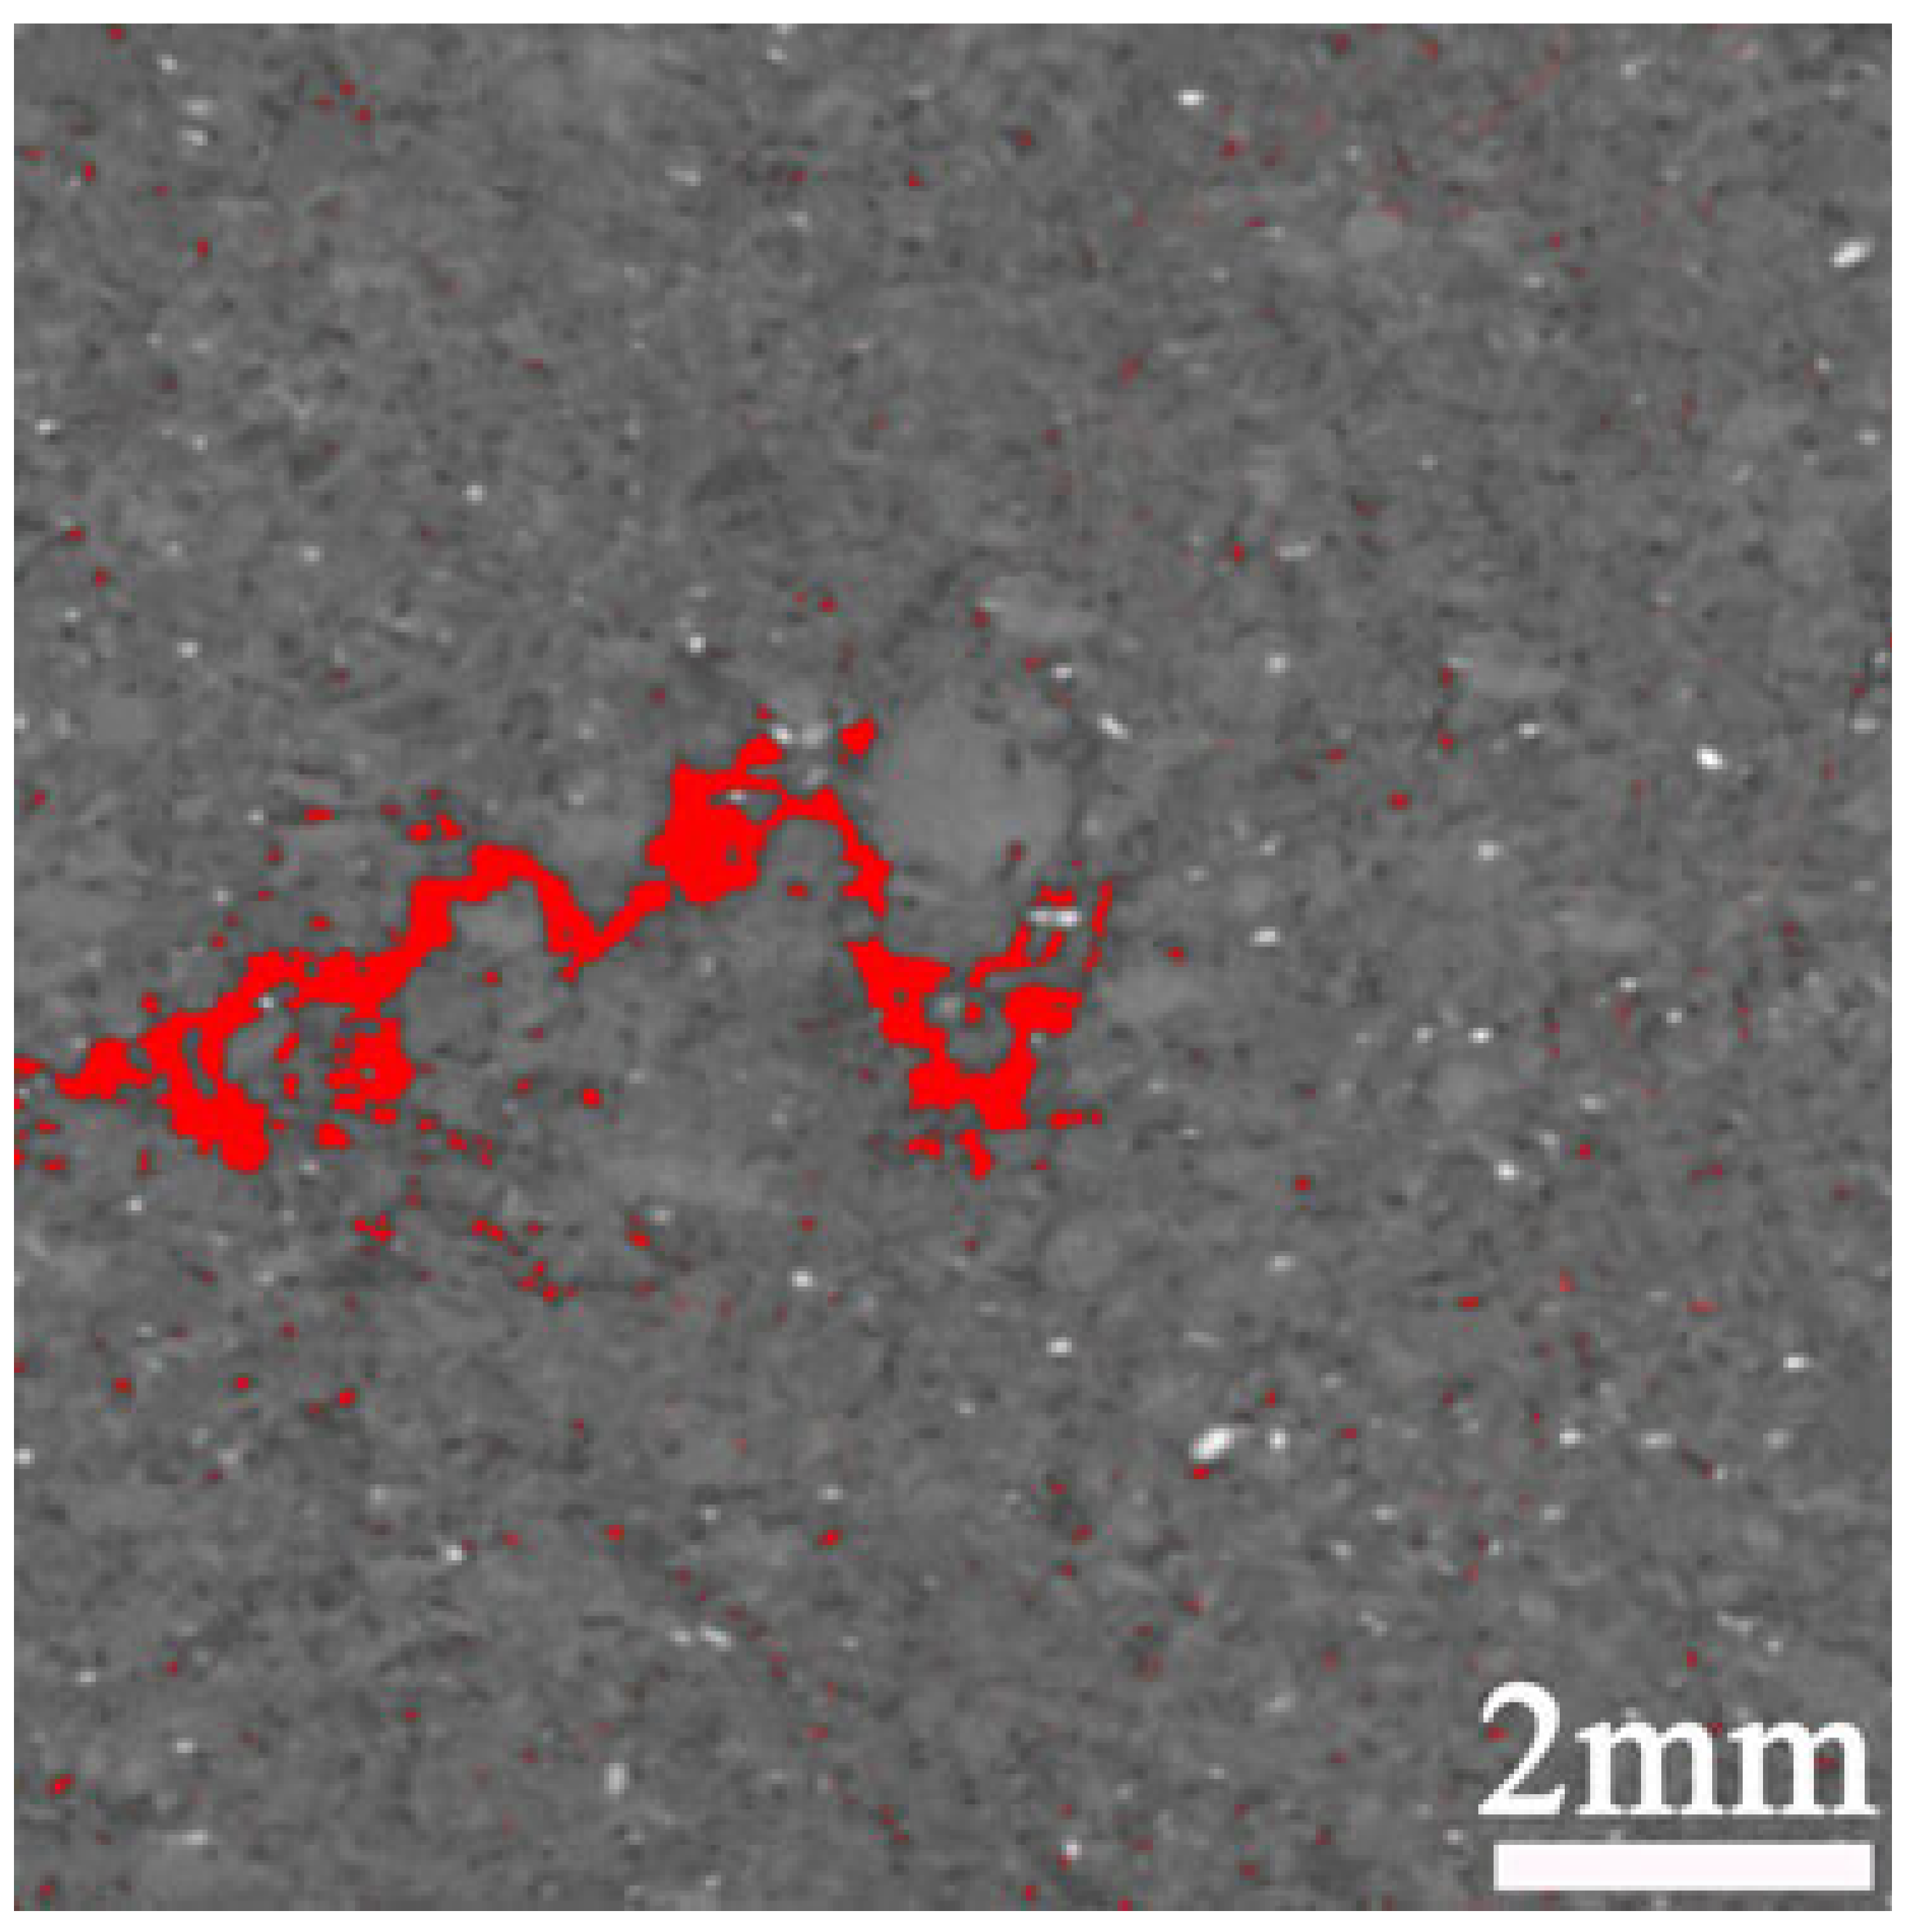
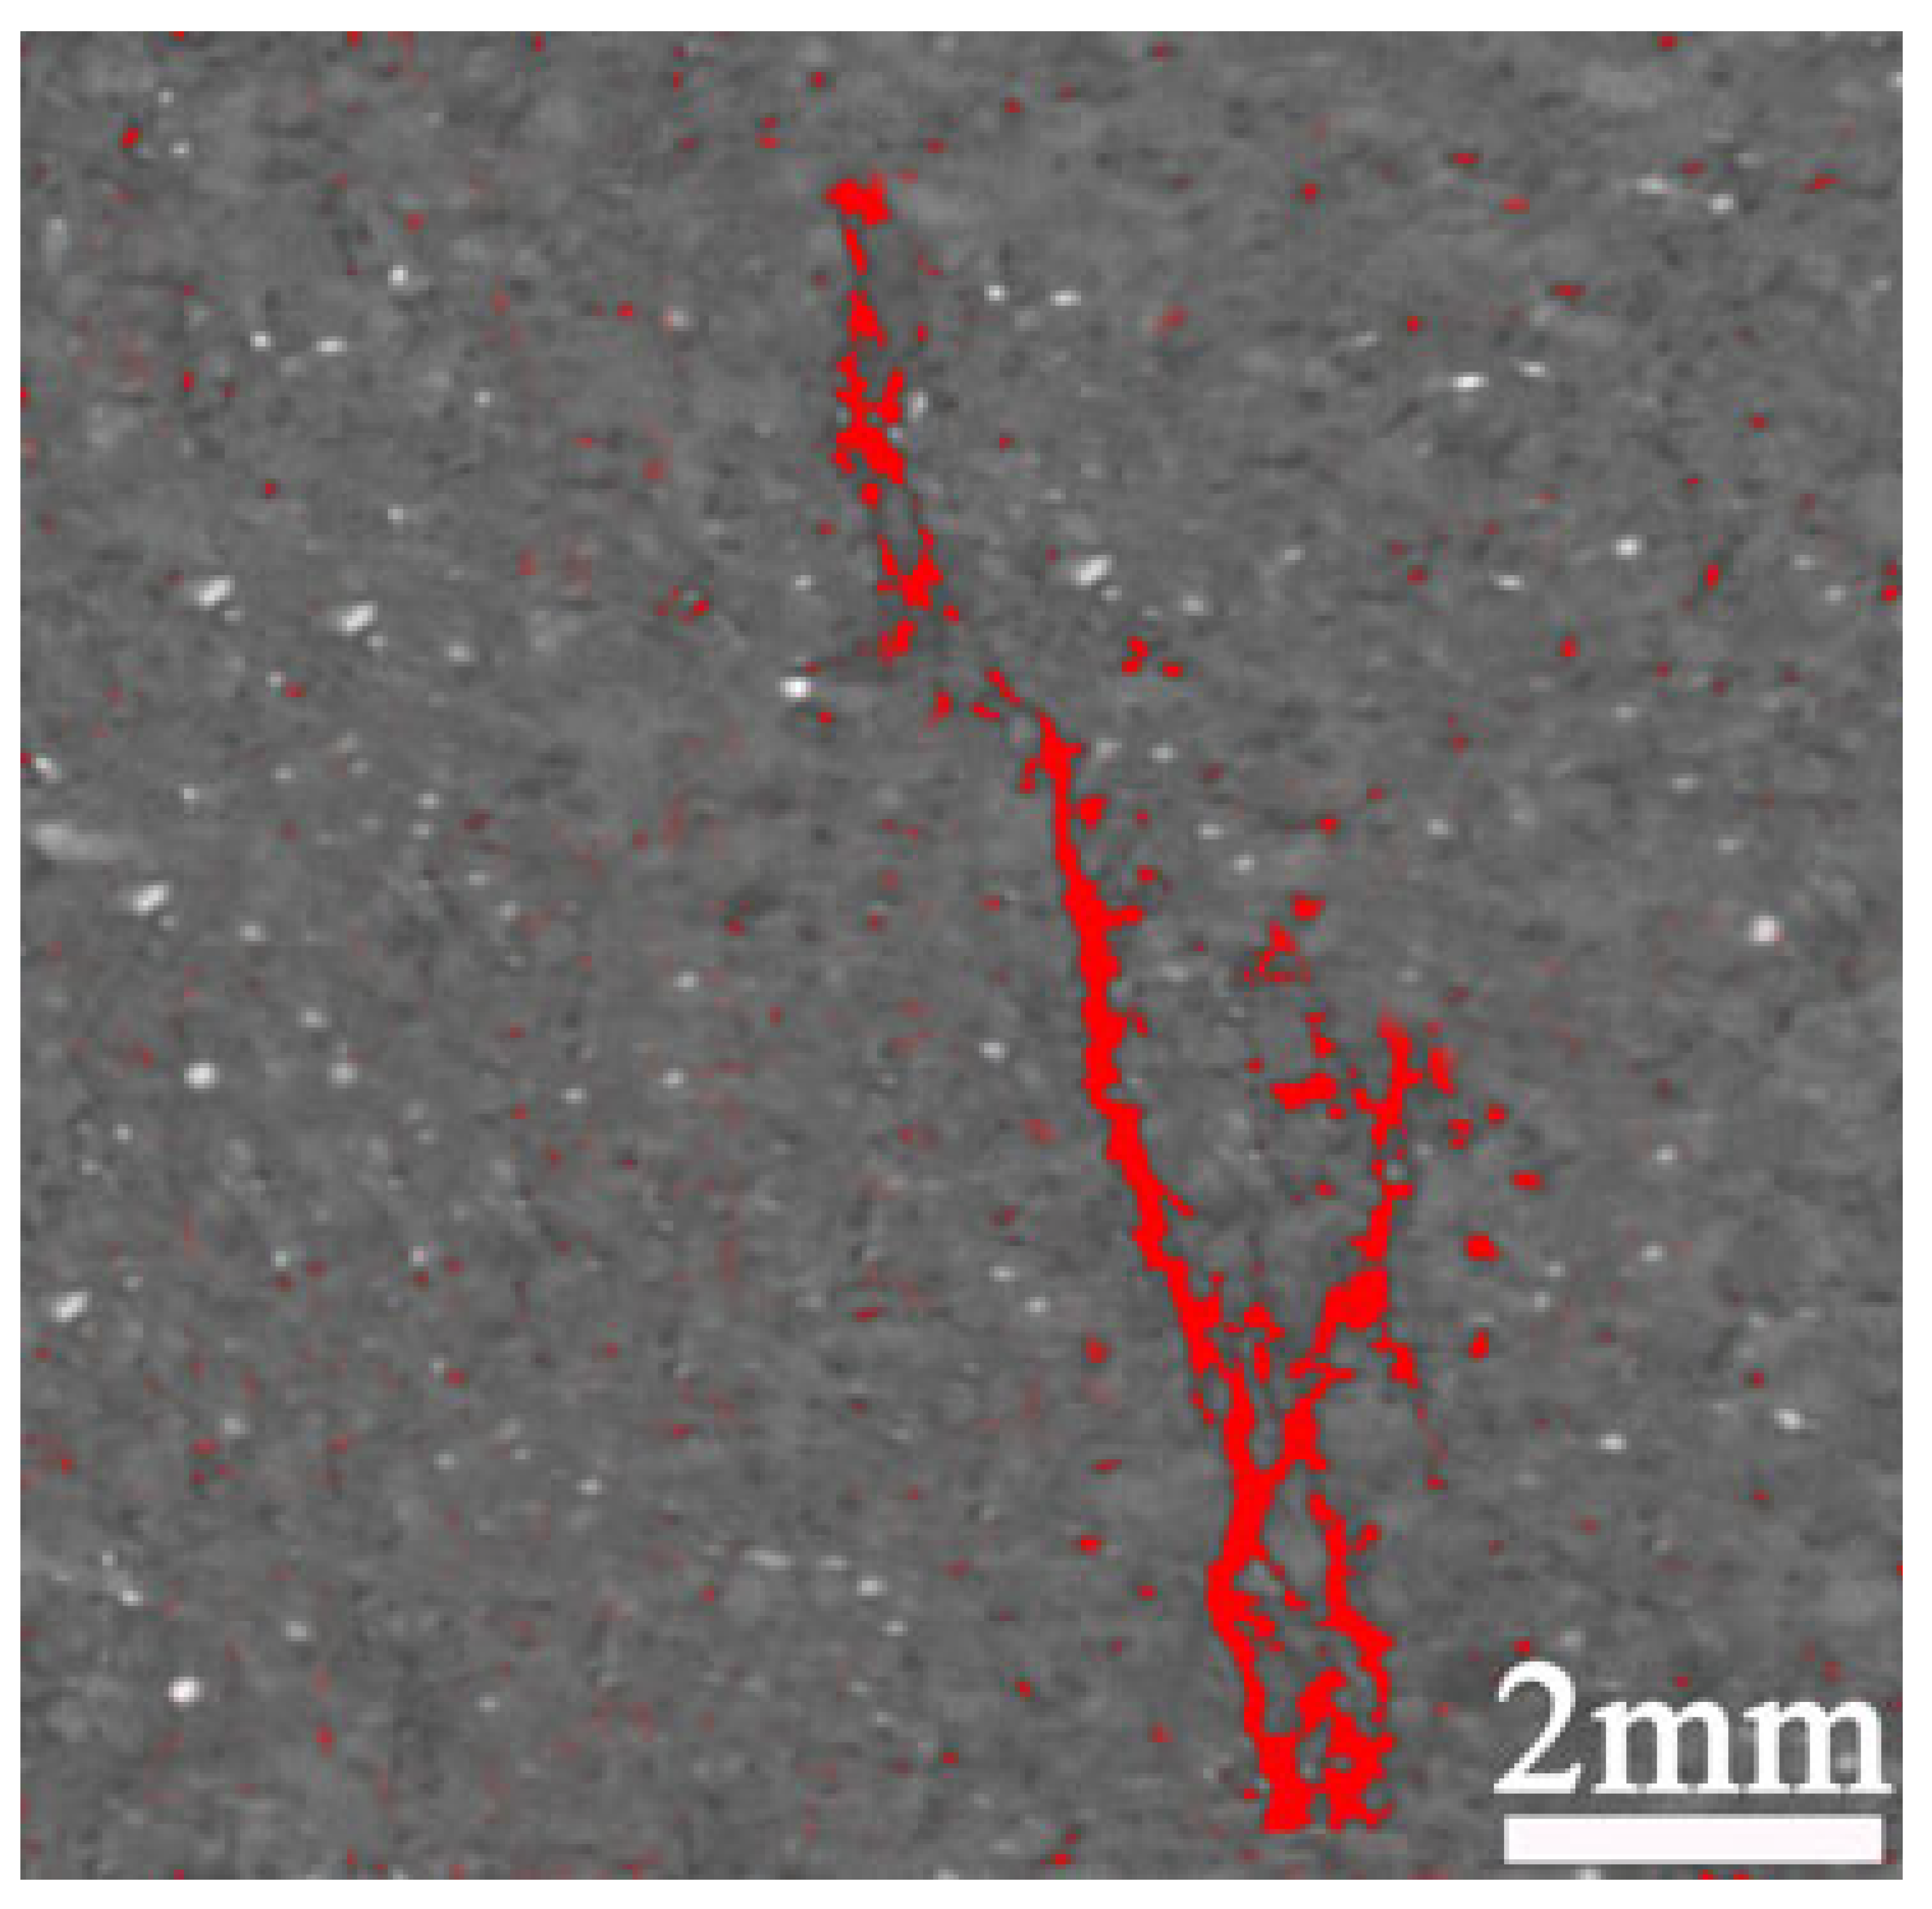
Synchronized CT real-time scanning and AE monitoring were conducted during uniaxial compression tests on Group 3 sandstone. Time-dependent stress–strain responses, AE activity patterns, and fracture evolution processes were acquired in real-time (Figure 6). The images in Table 3 display 10 mm cubic subsamples extracted from the central region of sandstone specimens at different feature points.
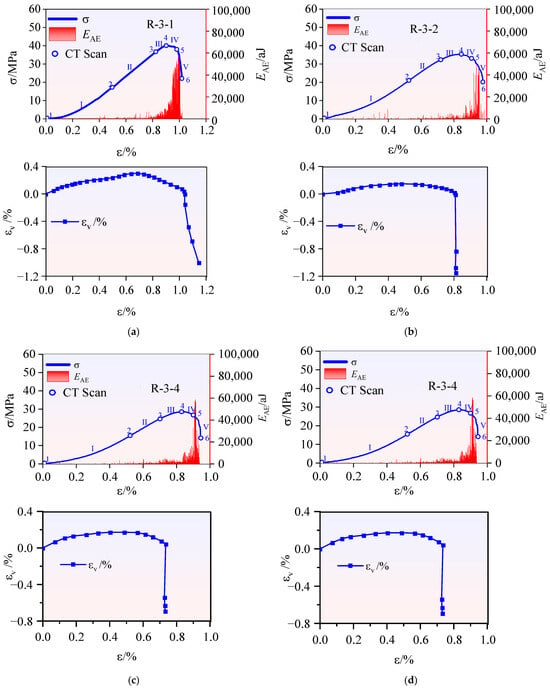
Figure 6.
Stress–strain responses and AE activity patterns during fracture development of sandstone specimens: (a) Specimen R-3-1; (b) Specimen R-3-2; (c) Specimen R-3-3; (d) Specimen R-3-4.

Table 3.
Fracture network characterization during sandstone failure evolution: CT-derived crack morphology at feature points.
Progressive fracture evolution of sandstone (Figure 6, Table 3) progresses through several distinct phases: (I–II) Initial loading: Minimal structural alteration with sparse AE activity. (Stage III) Unstable fracture initiation: Marked by volume expansion threshold (Point 3). Macrocrack nucleation occurs with exponential AE signal amplification. Peak strength attainment (Point 4) terminates Stage III. Crack coalescence develops into pervasive macrocracks with AE signal surge. Catastrophic failure ensues through brittle collapse mechanism. Pre-threshold phase: Transition from distributed microdamage to localized microcracks. Post-threshold phase: Evolution from stochastic microcracks to coalesced fracture networks. The fracture process exhibits nonlinear dynamics with critical state transitions. Critical thresholds manifest abrupt damage transitions, evidenced by AE signal discontinuities and fracture propagation patterns.
3.2. Microscopic Fracture Characteristics
Given the consistent mechanical responses demonstrated by Group 3 sandstone specimens (R-3-1 to R-3-4) in terms of stress–strain behavior, AE patterns, and fracture morphology; and considering journal space constraints, this analysis specifically examines R-3-1 and R-3-3 to elucidate mesostructural fracture mechanisms. Figure 7 graphically reconstructs the complete progressive damage stages through 4D-CT visualization.
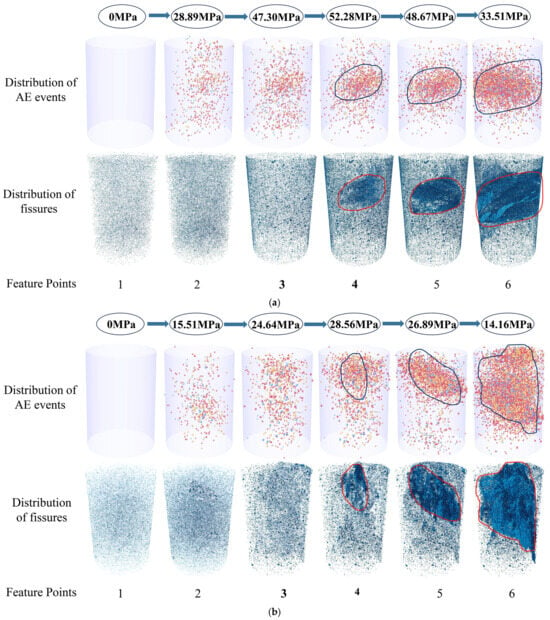
Figure 7.
Spatiotemporal evolution of AE events and crack networks during progressive damage evolution in sandstone specimens: (a) Specimen R-3-1; (b) Specimen R-3-3.
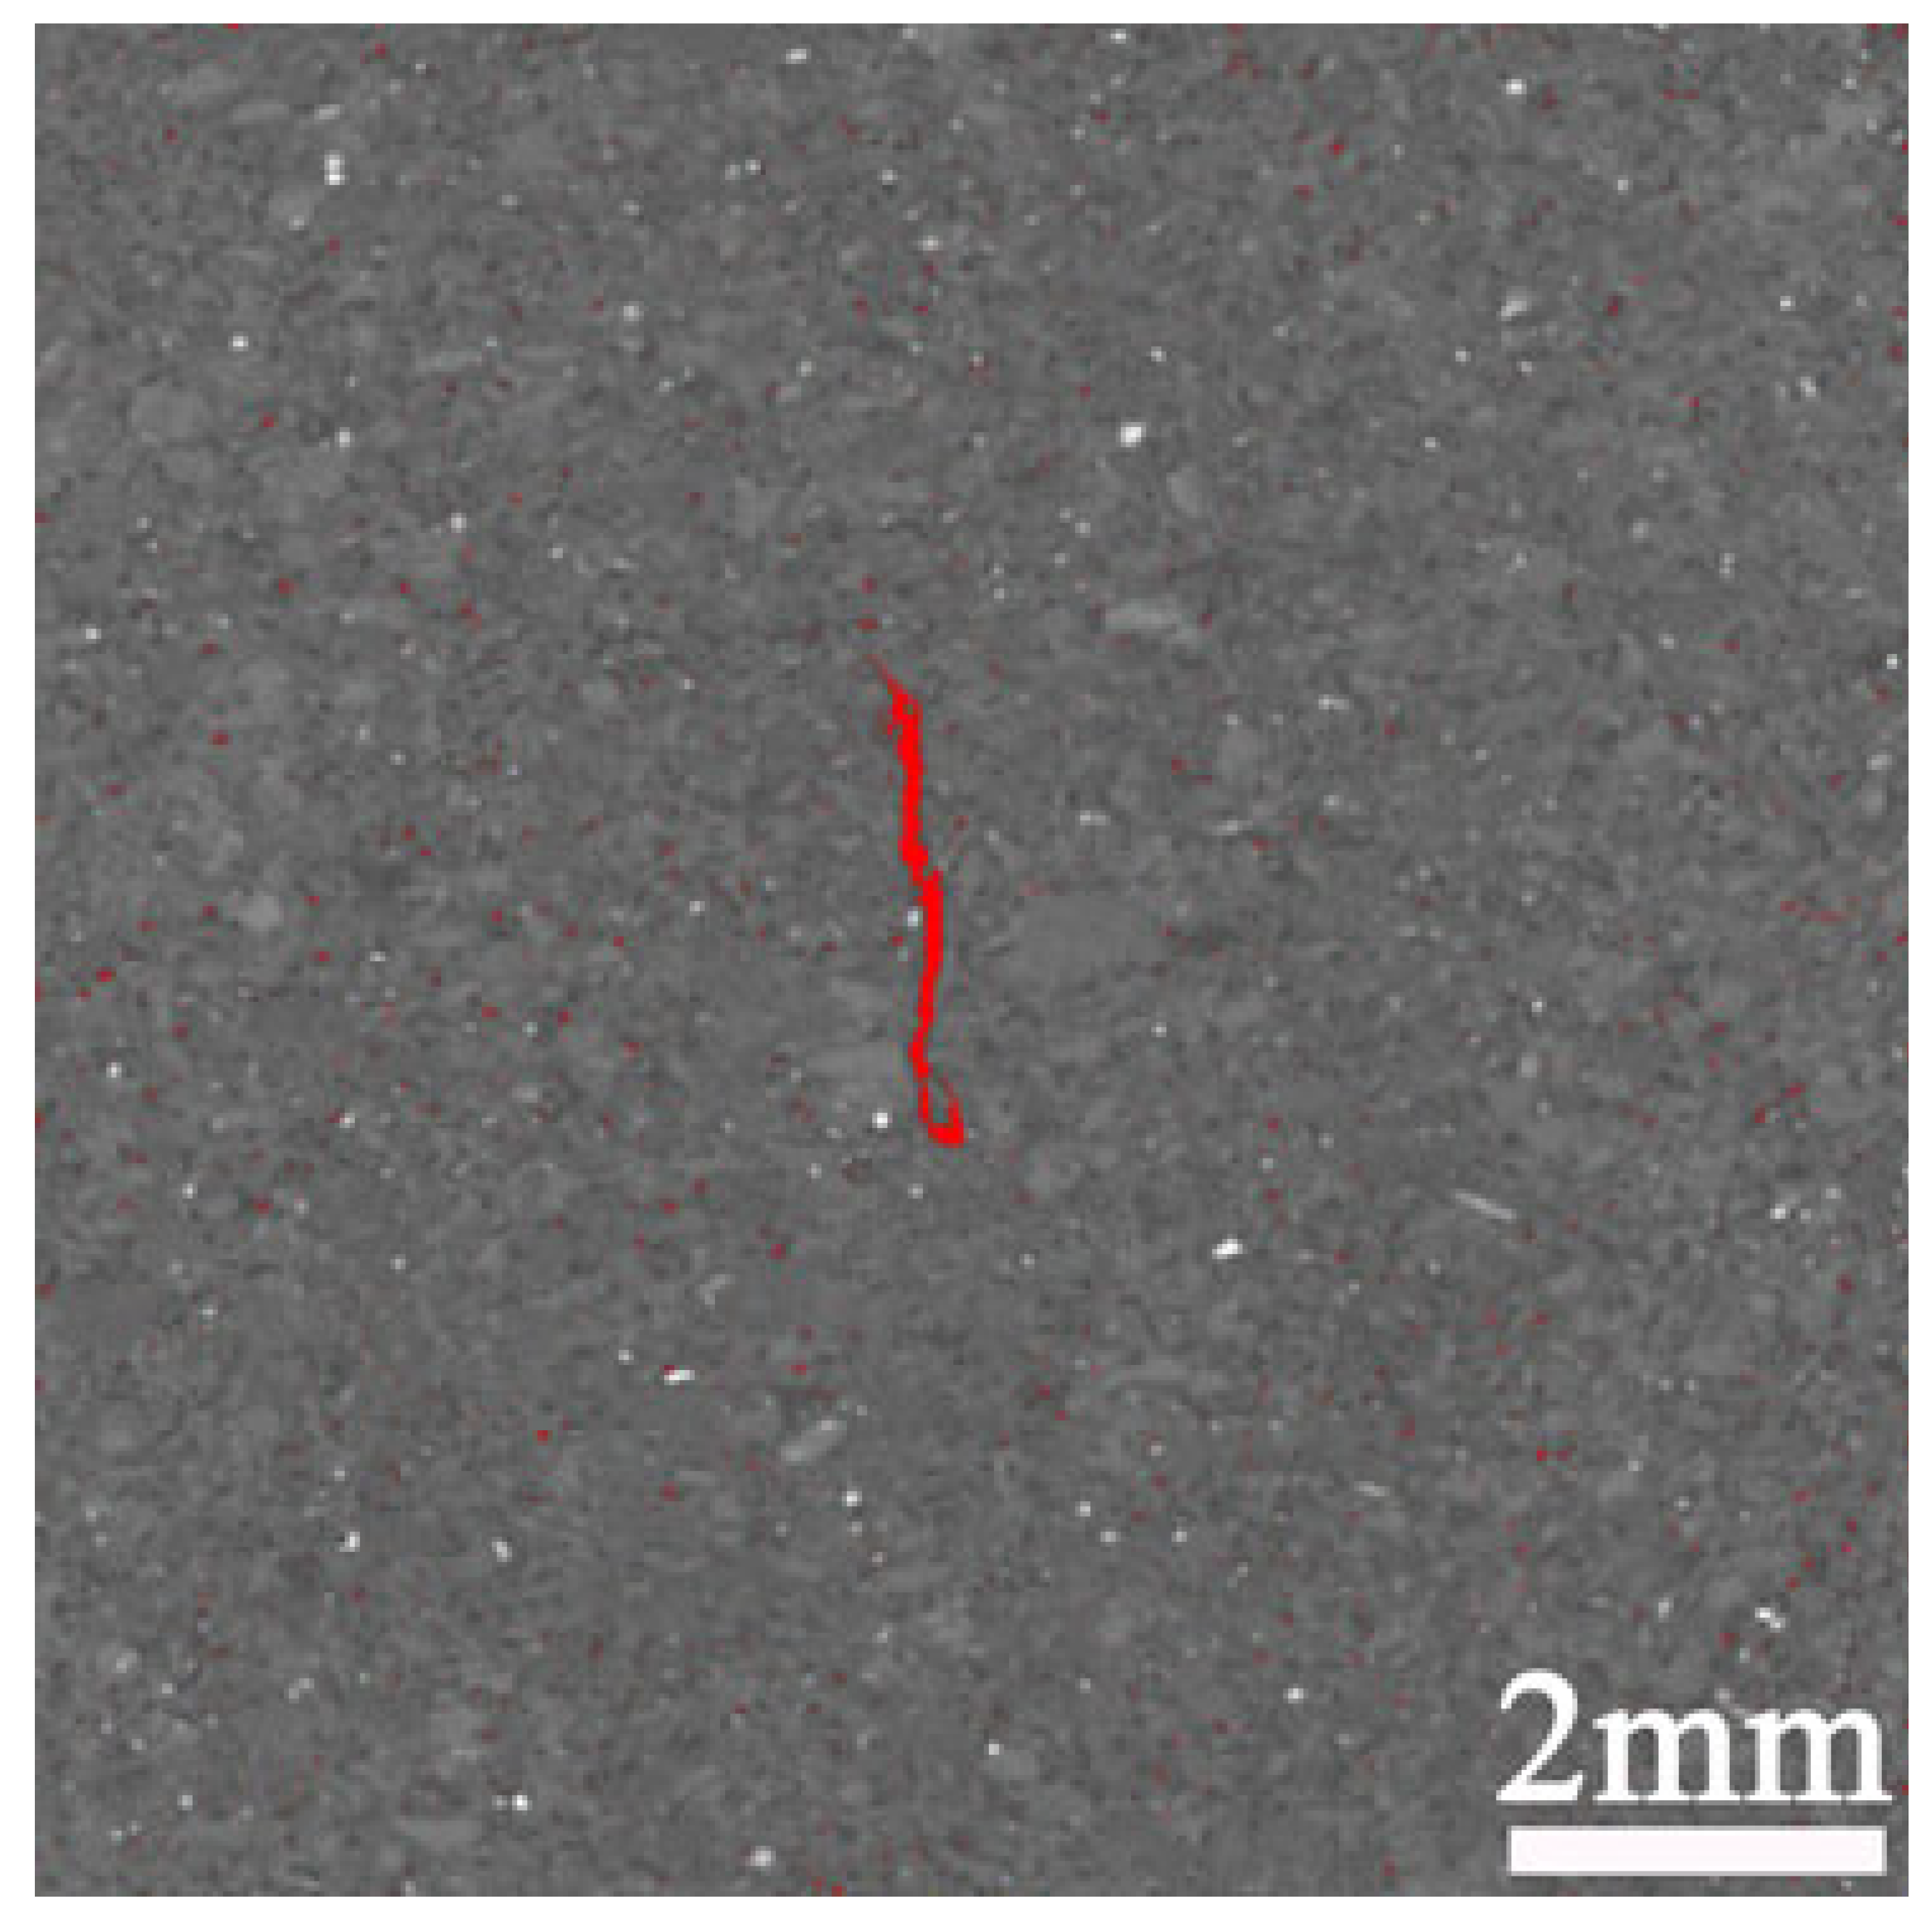
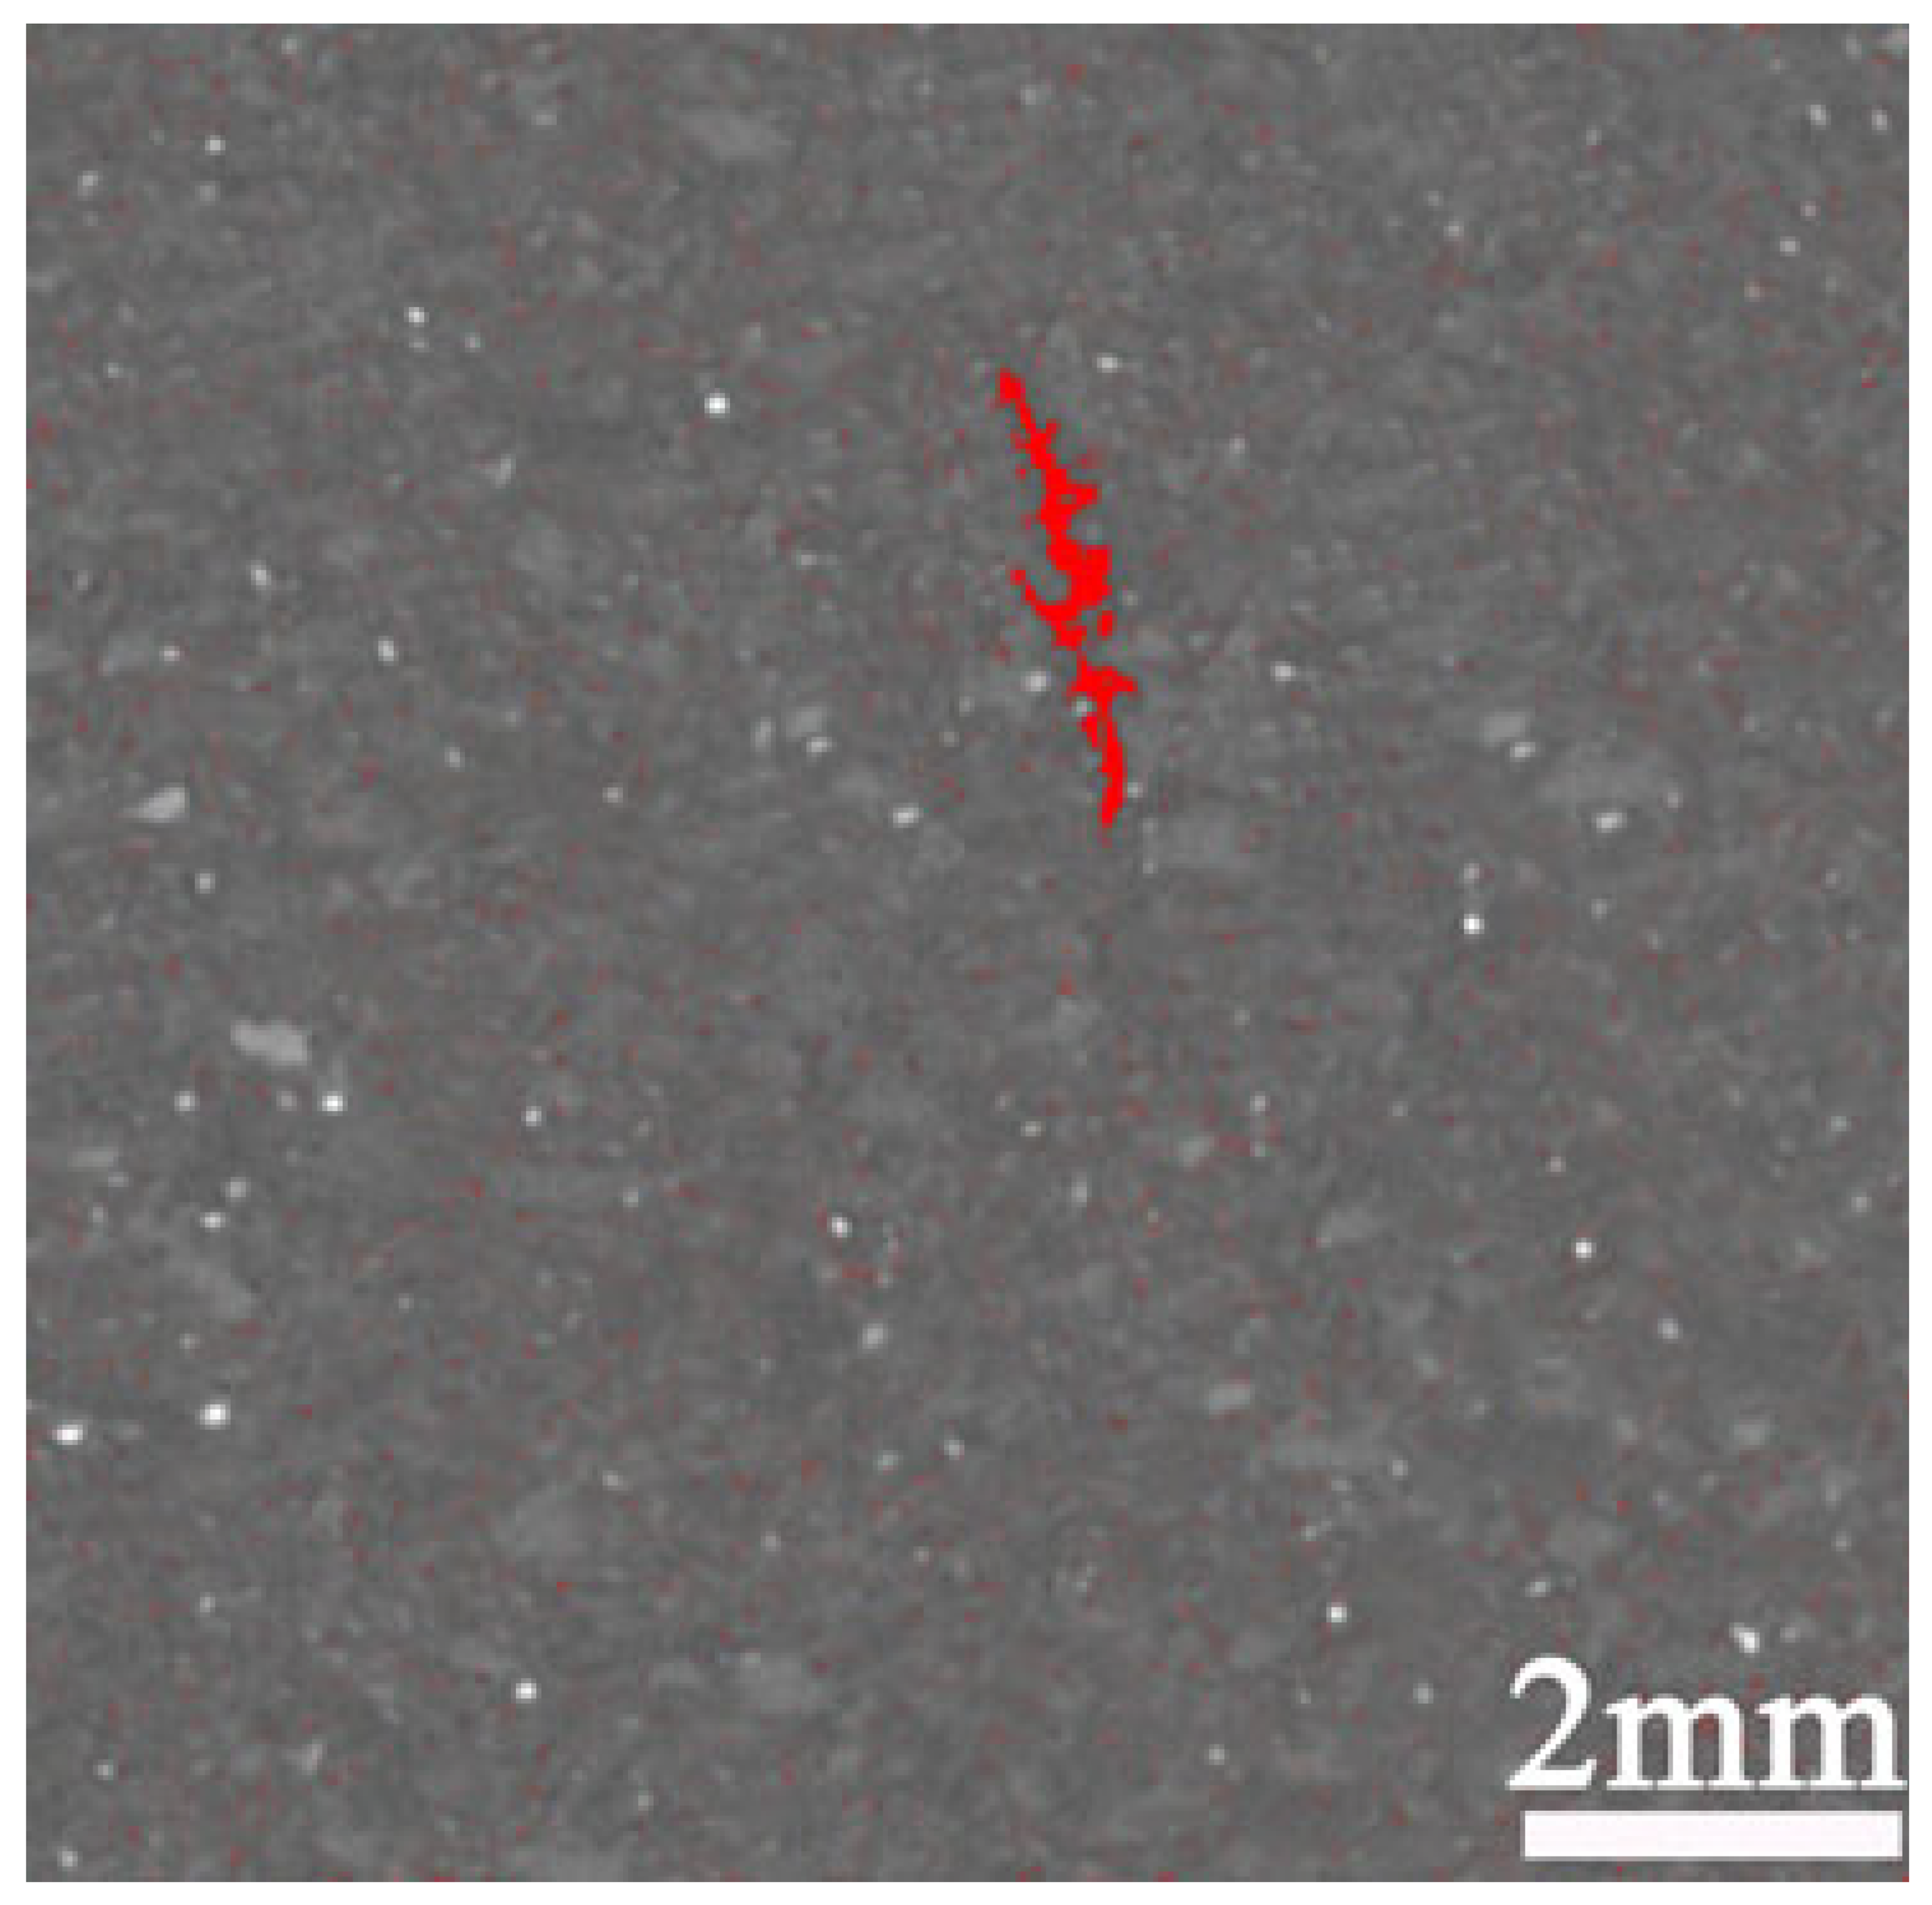
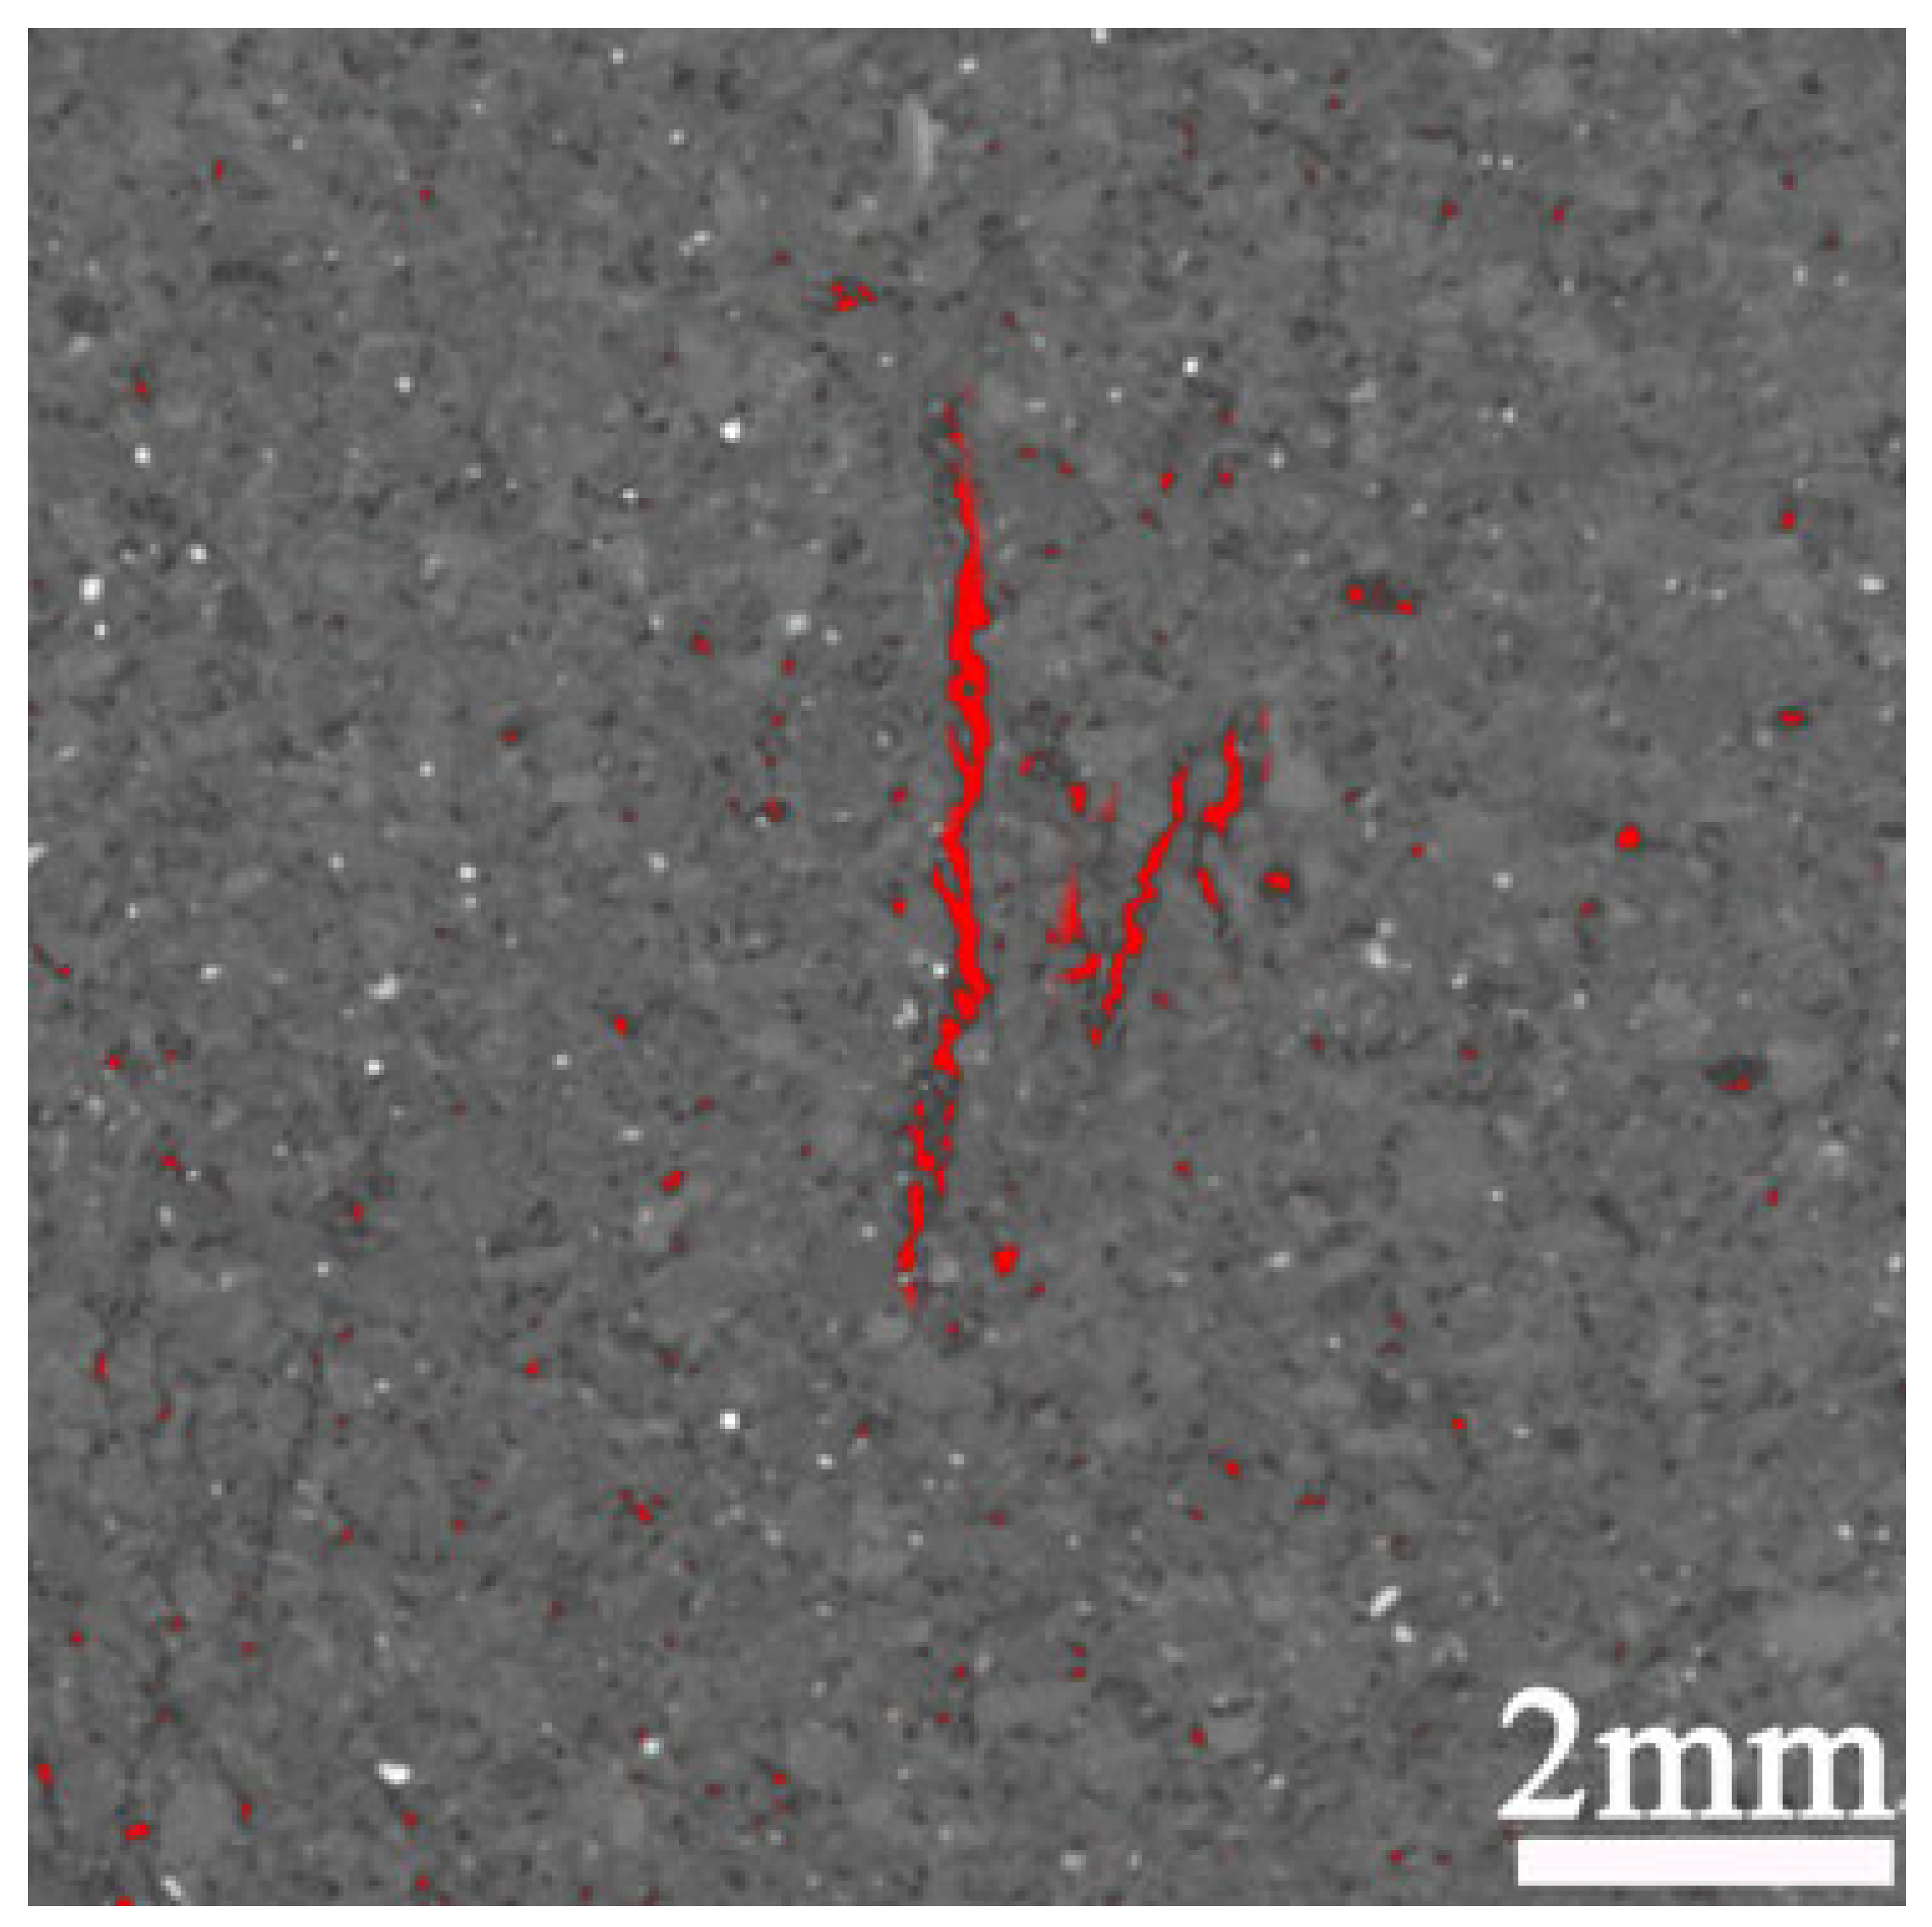
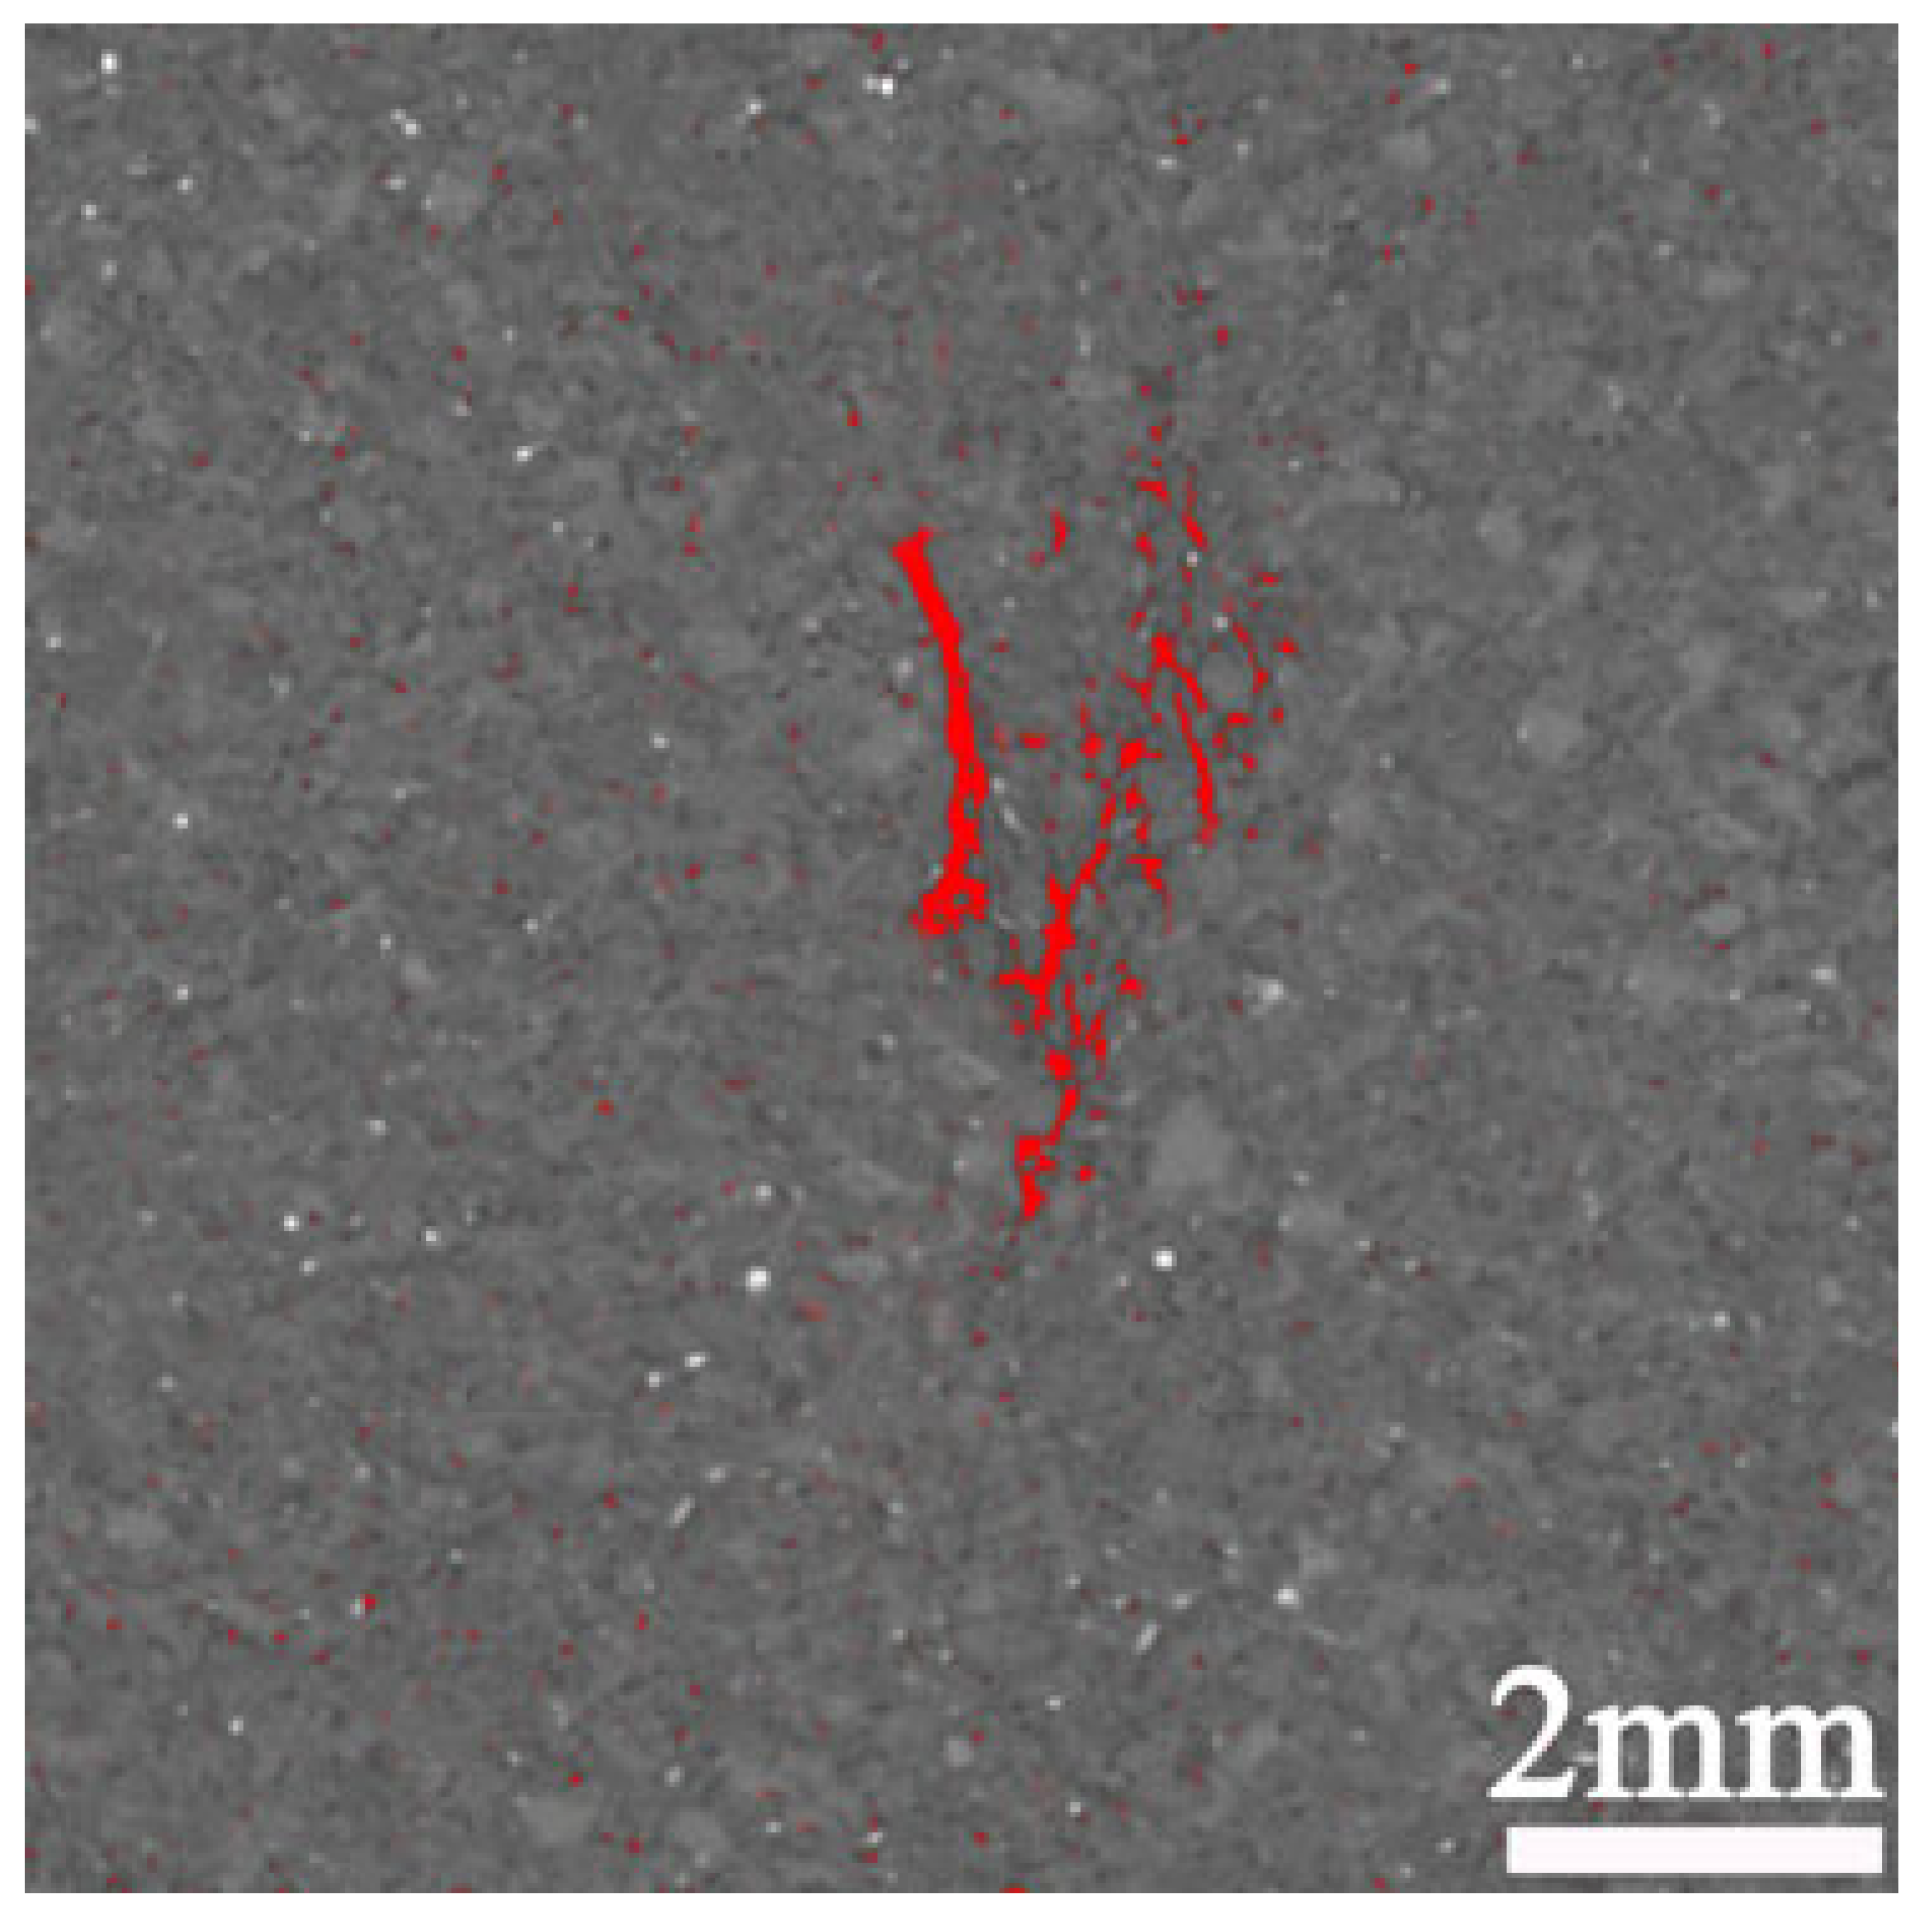
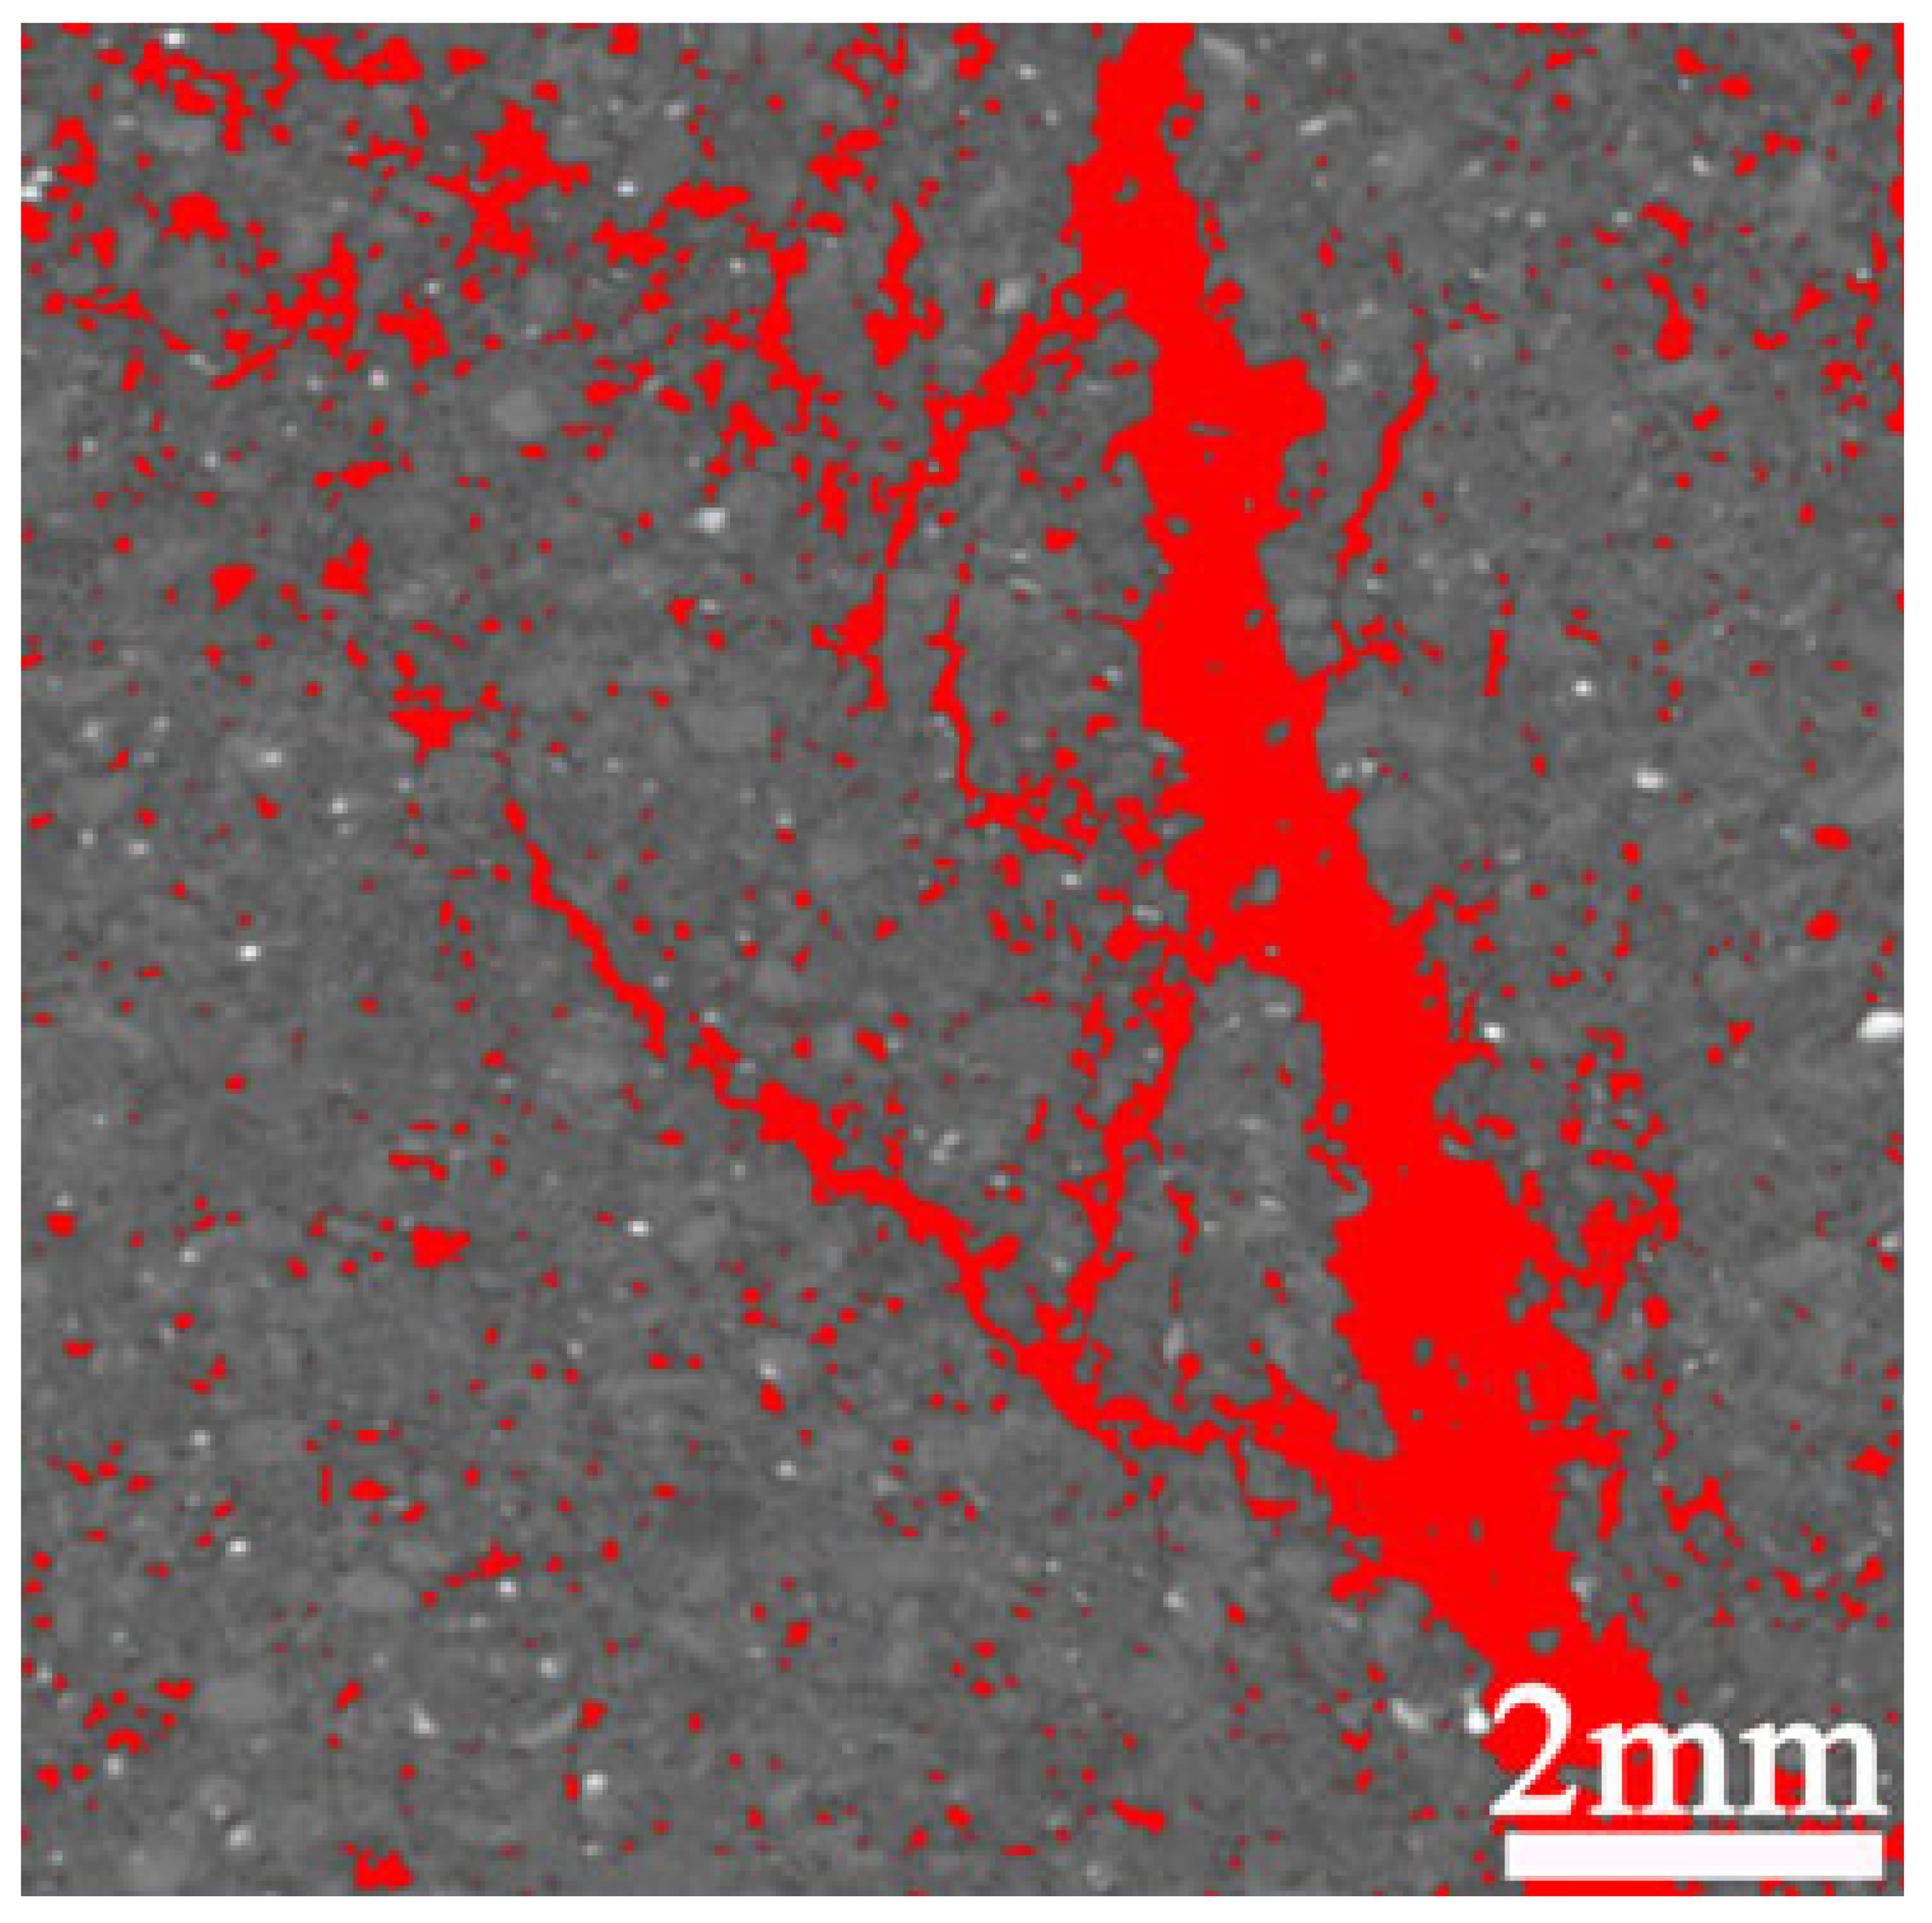
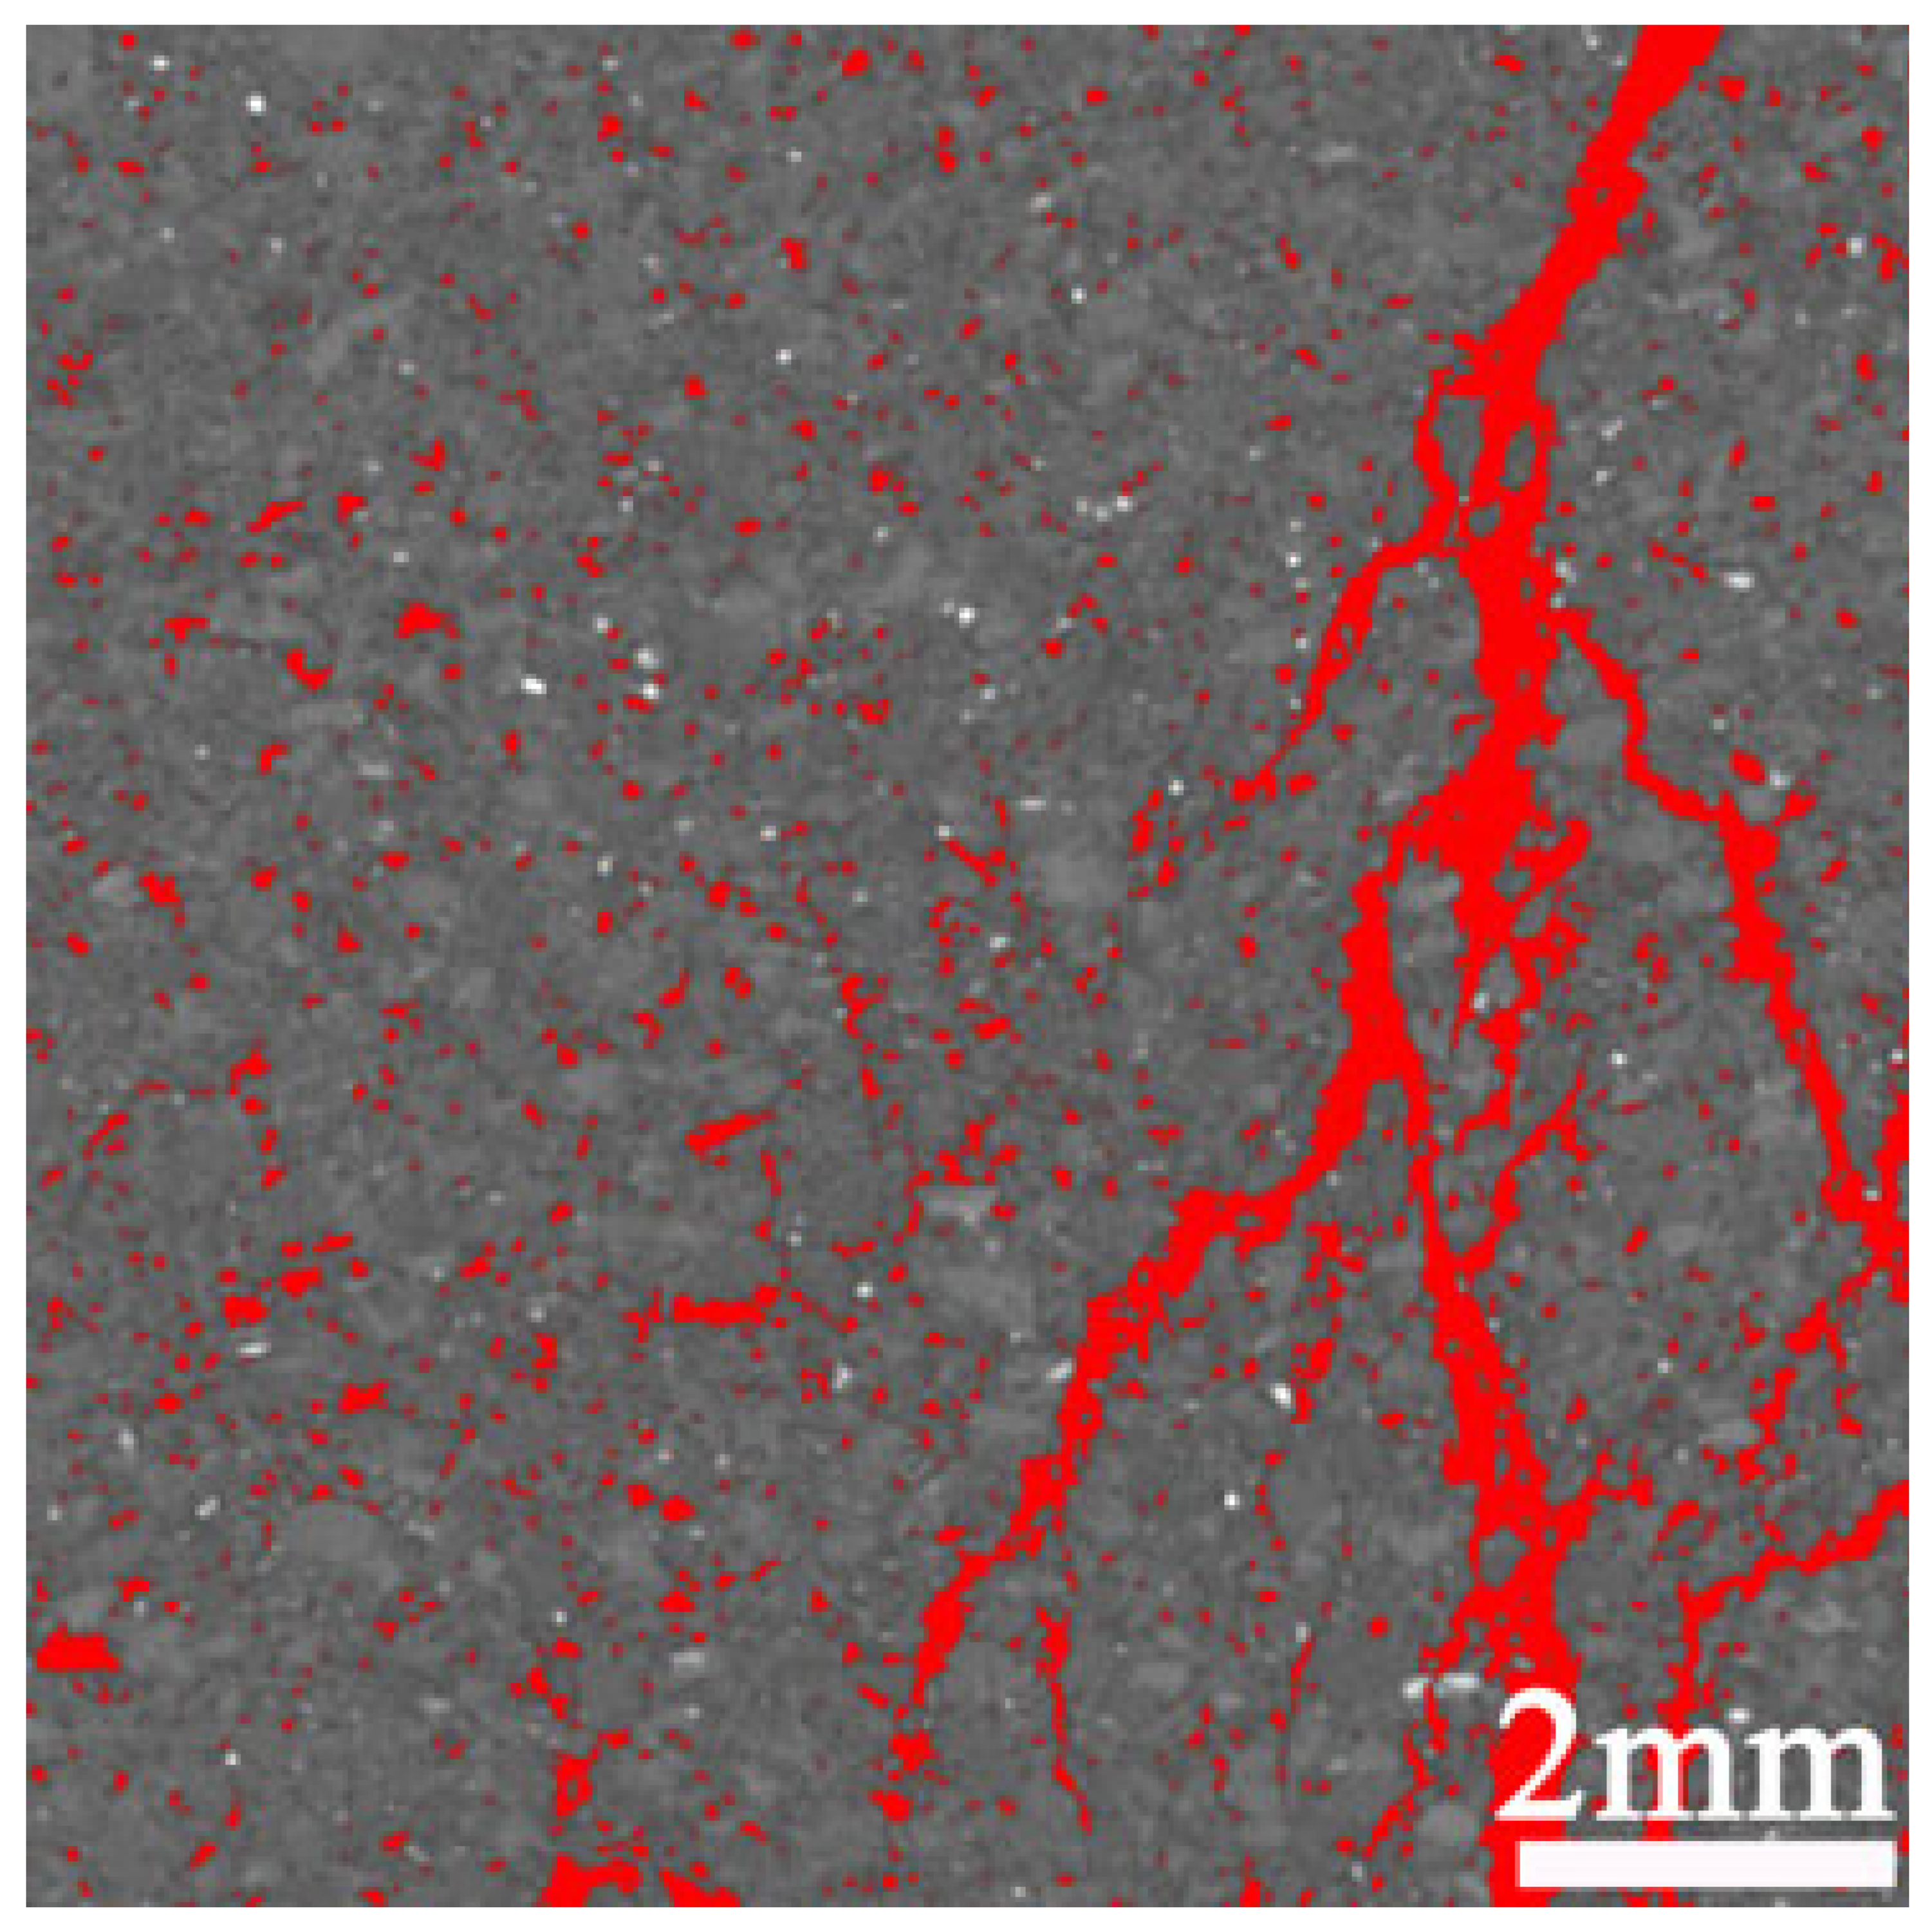
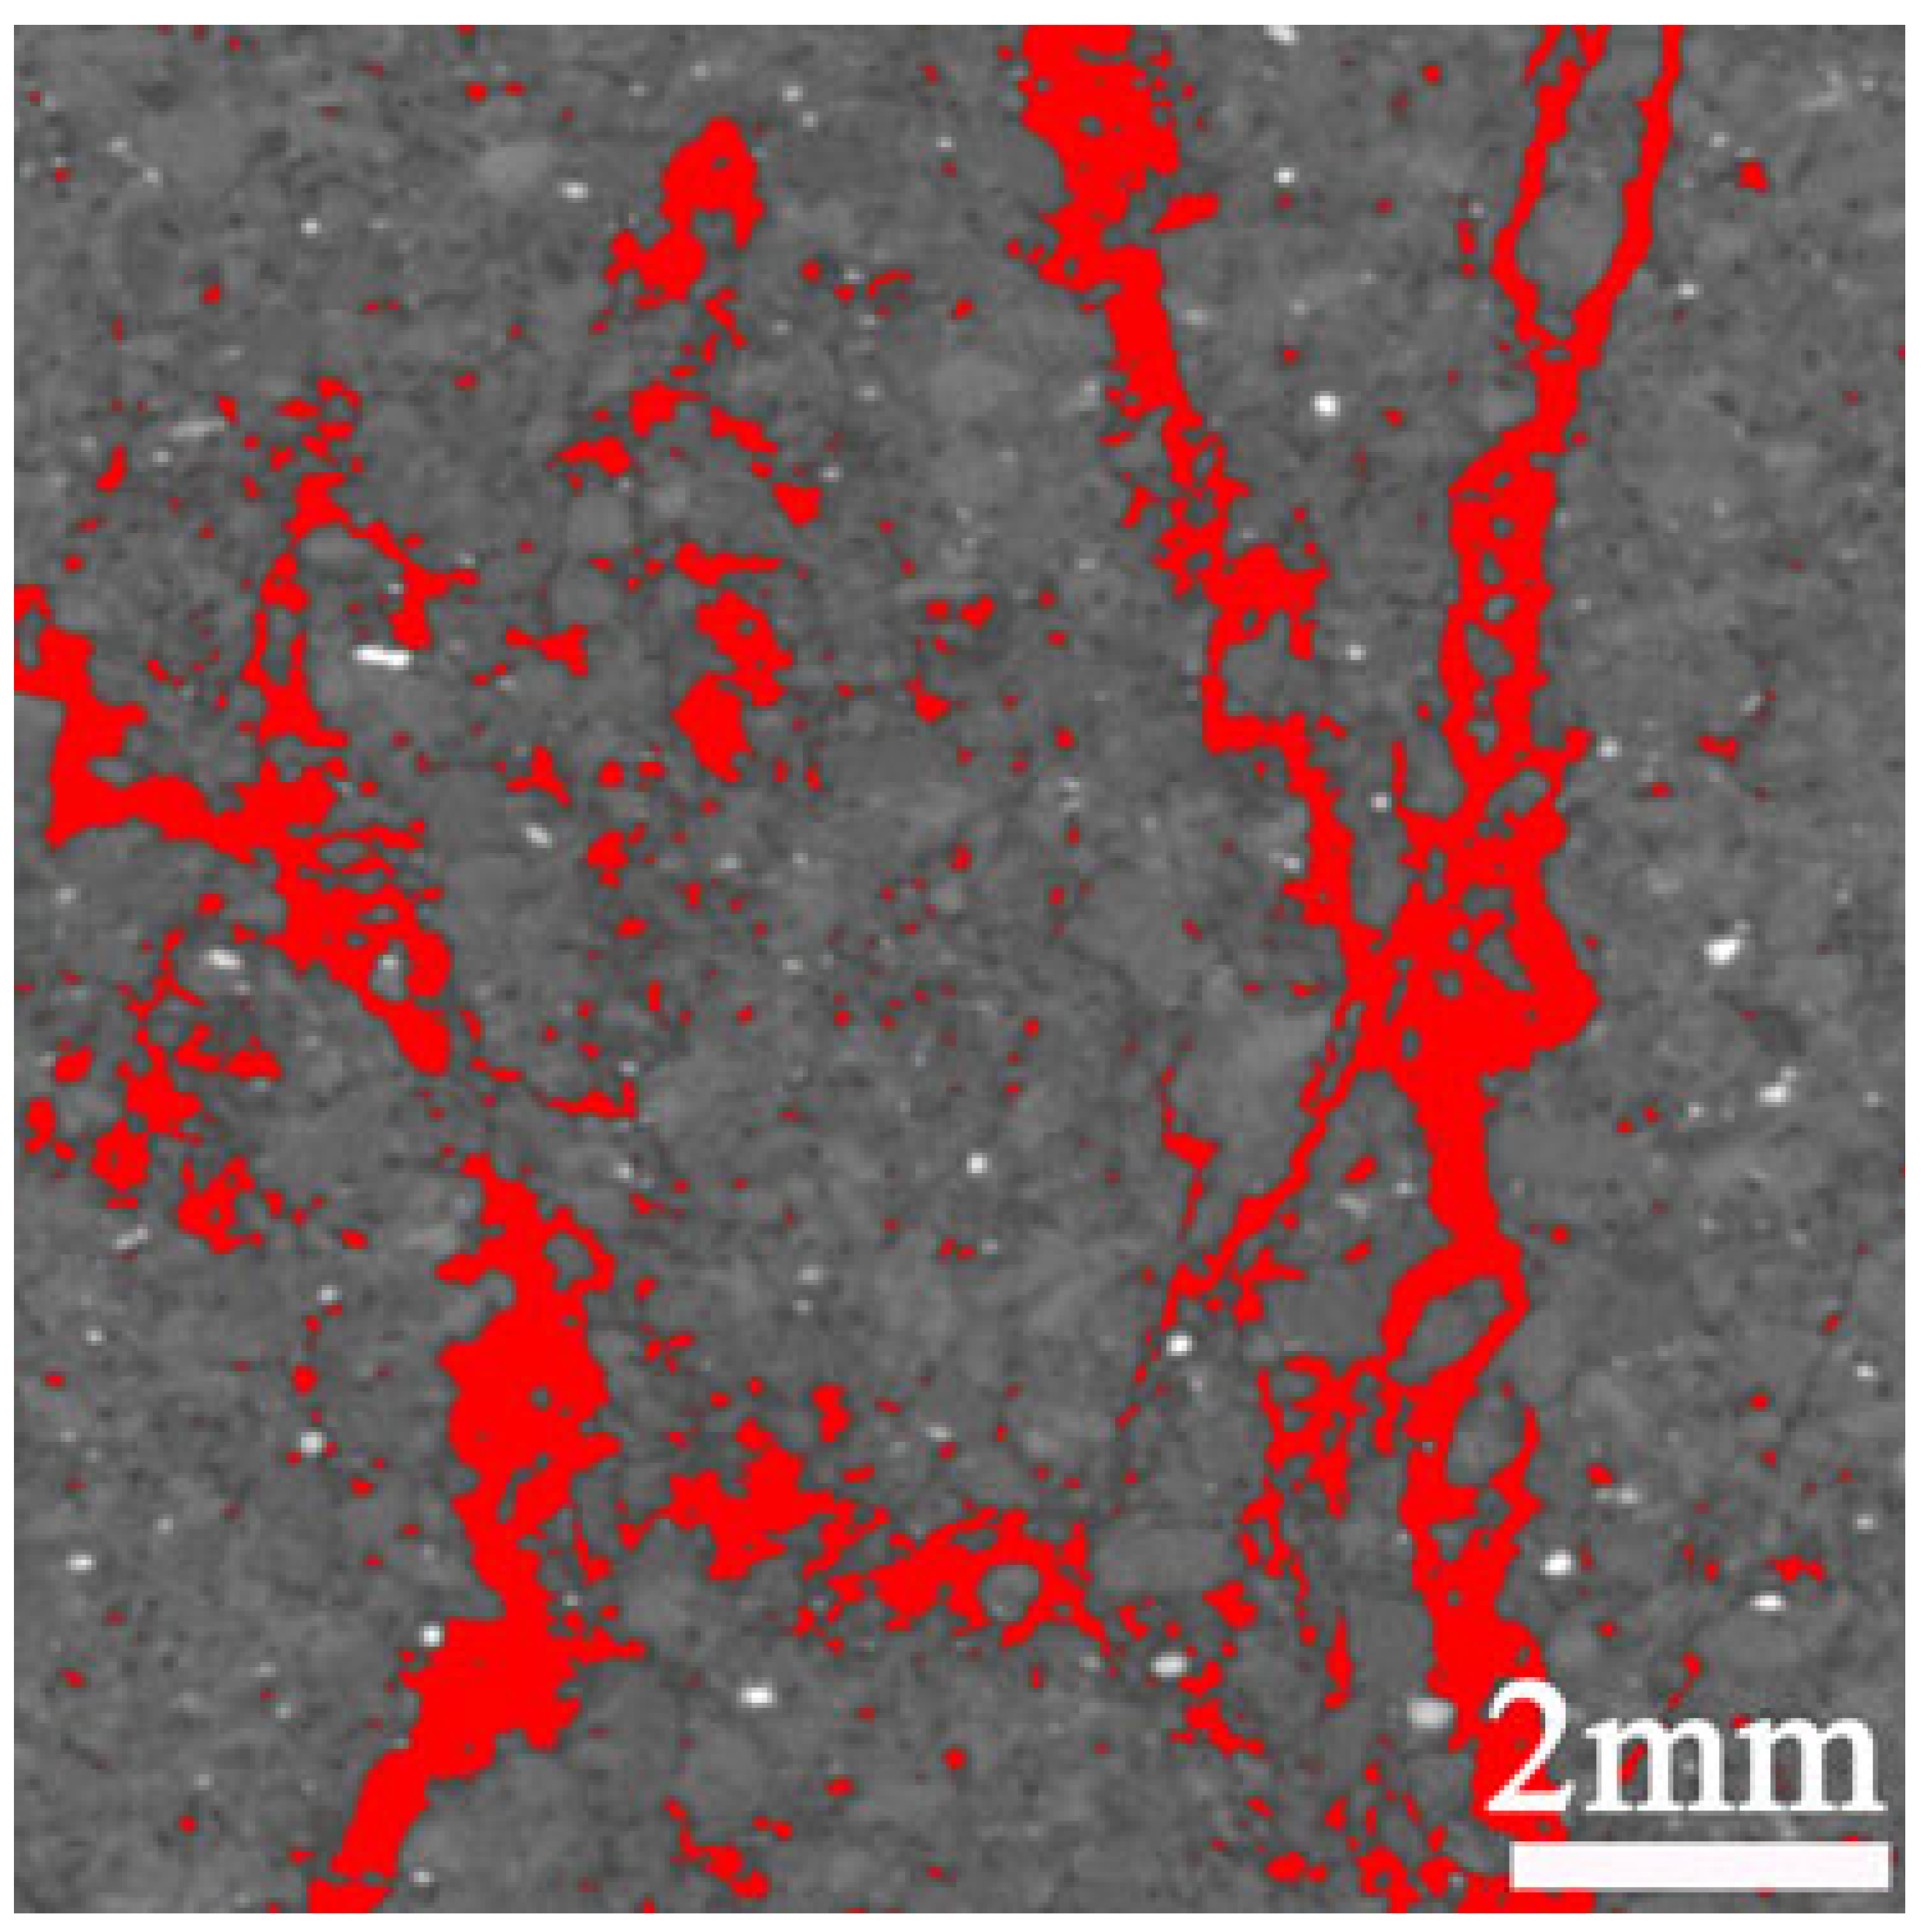
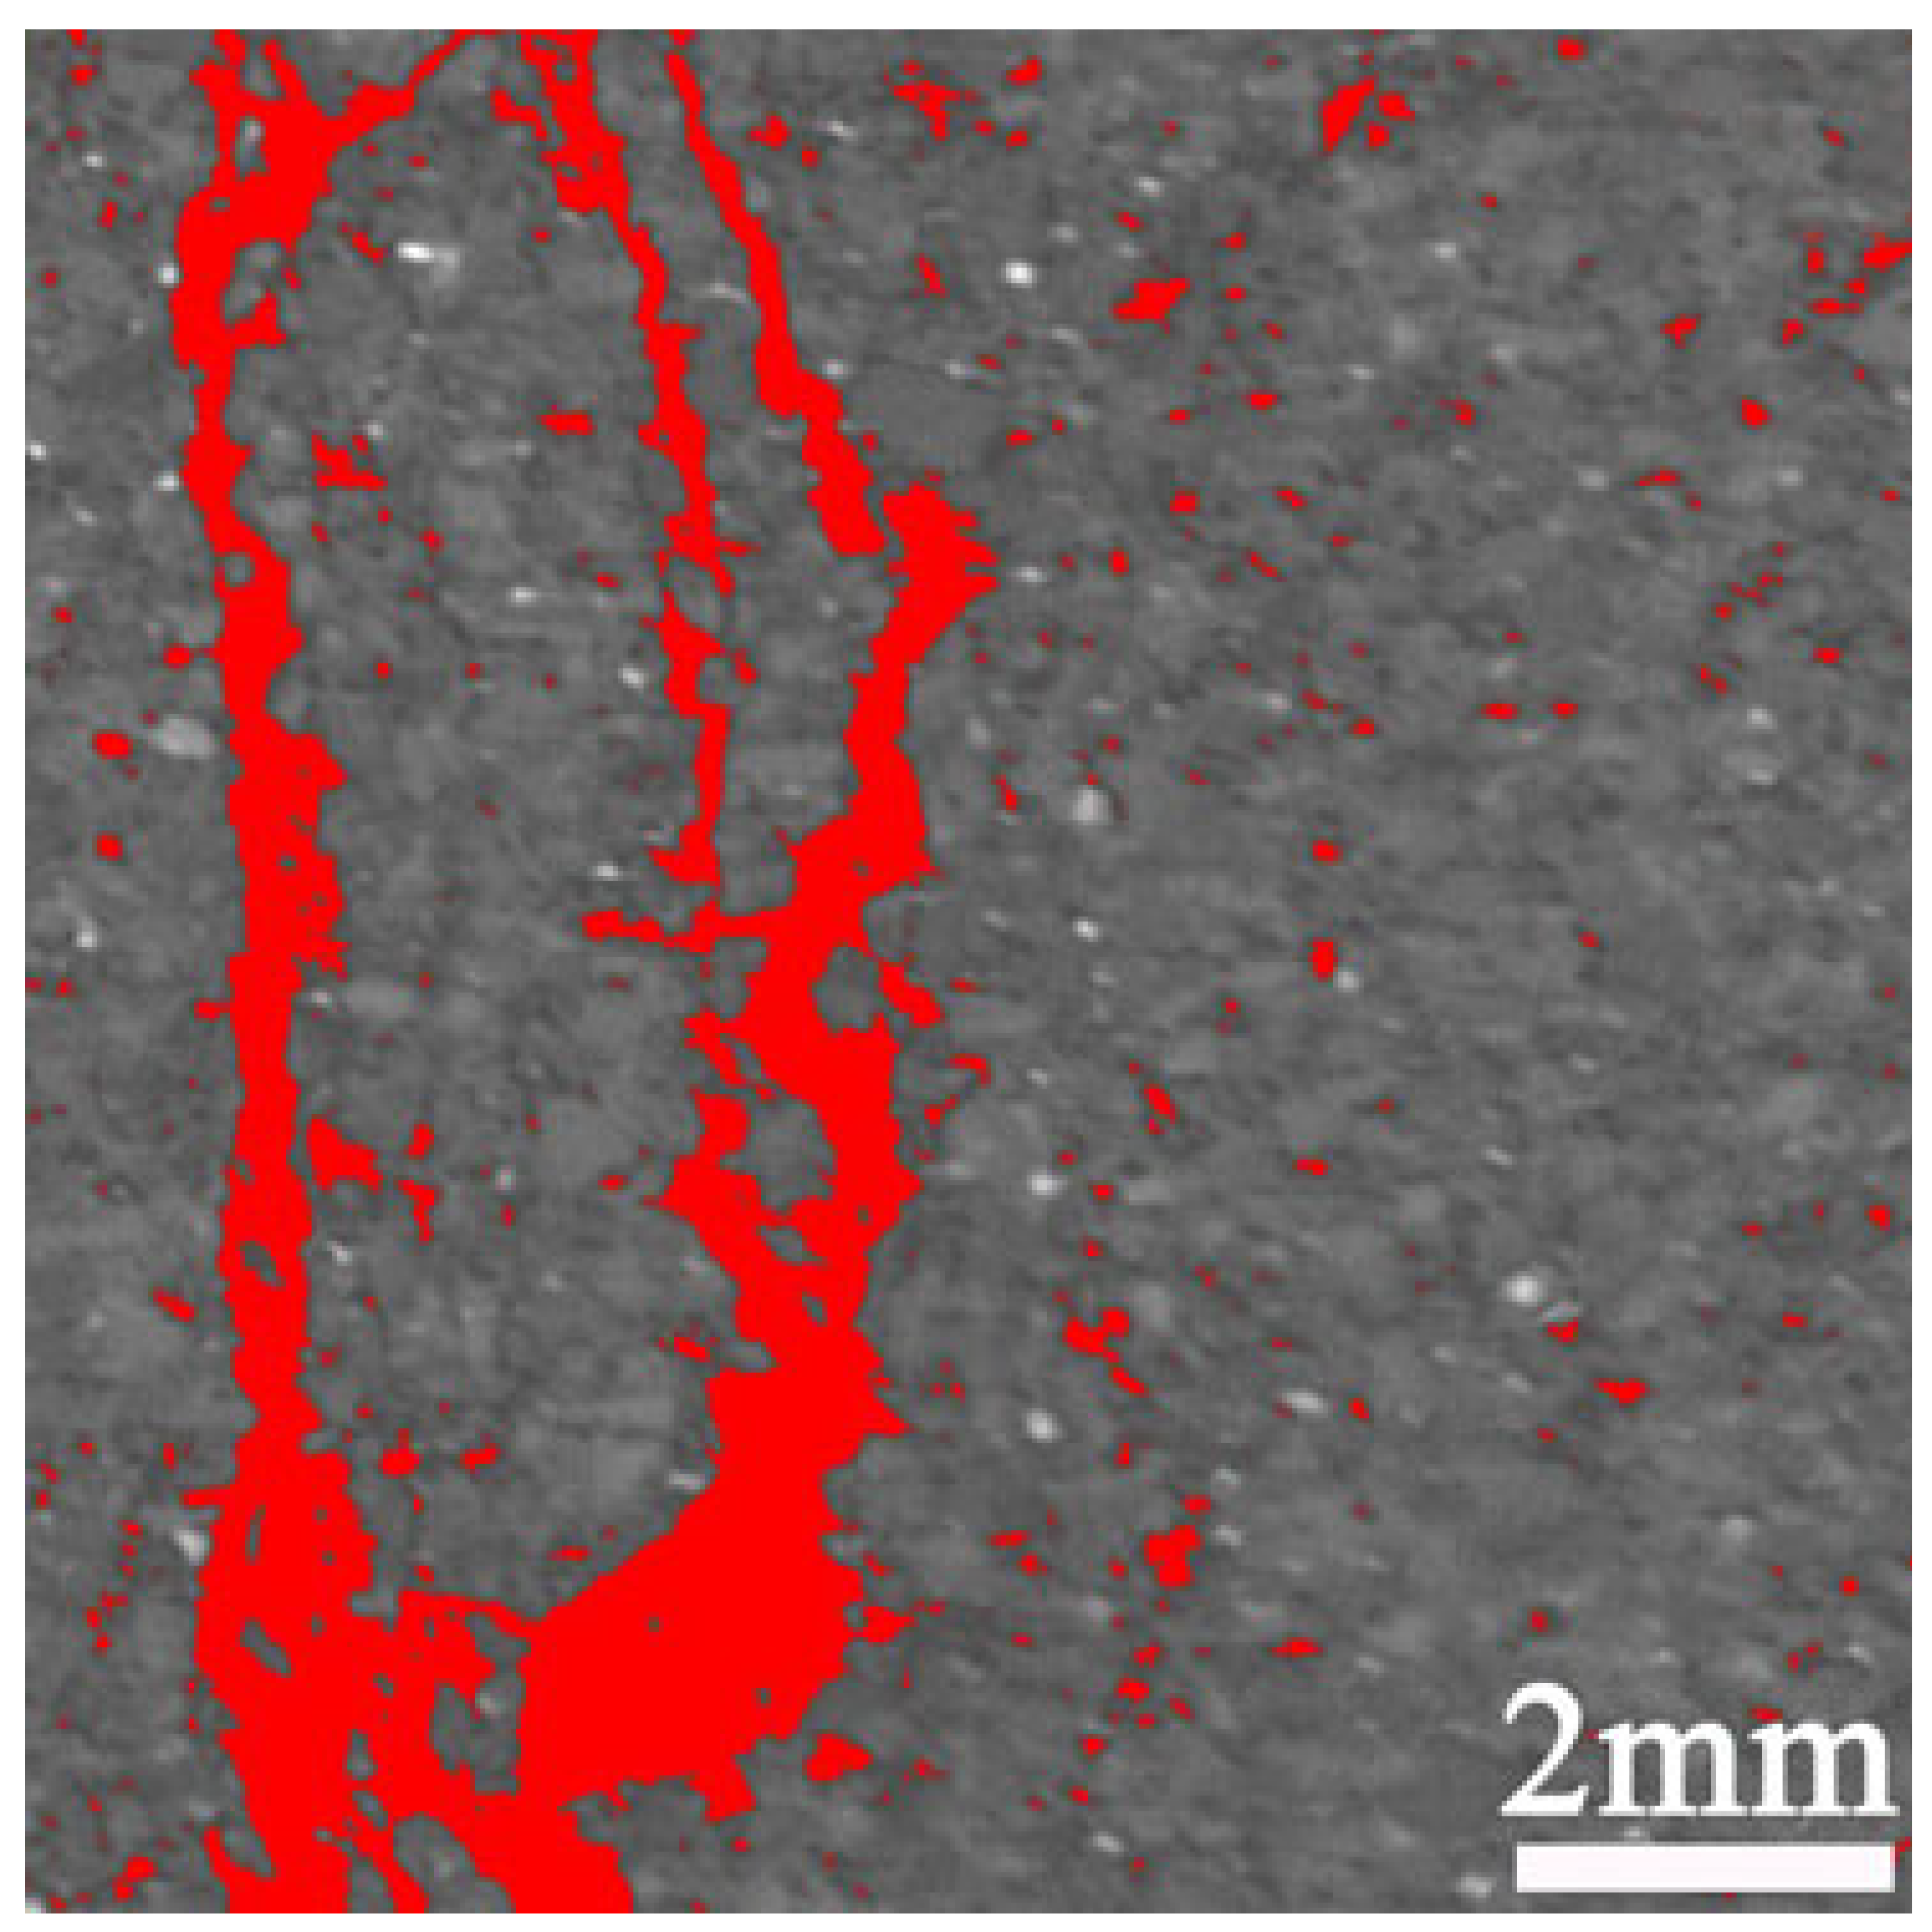
Figure 7 demonstrates the spatiotemporal transition of AE events and crack propagation, evolving from stochastic distribution to localized failure plane coalescence. During initial loading stages, AE events and pre-existing pores exhibited homogeneous dispersion across the sandstone matrix, with quasi-static damage accumulation. Post-dilation phase (Point 3): AE activity transitions to localized clustering, initiating proto-fracture plane formation. This transition arises from stress redistribution mechanisms within damaged microstructures. Stress concentrations migrate towards intact/less-damaged zones, triggering peripheral damage nucleation. Post-peak regime (Point 4): AE sources and voids coalesce along the dominant fracture trajectory. Stress intensification at the crack tip creates mechanical heterogeneity, while stress shadows develop in adjacent regions. Crack network percolation progresses through stress-driven branch connection. AE clusters and void spaces concentrate within the evolving fracture process zone. Catastrophic coalescence occurs via stress-driven crack tip fusion, culminating in global structural failure. The dilation threshold and peak strength thus constitute critical state transitions governing failure progression. These coalescence zones represent kinetic attractors in the self-organized critical system.
AE monitoring captured energy-amplitude signatures of microfractures during sandstone failure (Figure 2c). Fracture principal eigenvalues (, , ) and orientation angles (, ) were derived from CT-based 3D crack covariance matrices. Principal eigenvalues quantify spatial distribution anisotropy along orthogonal axes (X, Y, Z). Principal axis dimensions are defined as: major (), intermediate (), and minor () axes. Eigenvalue hierarchy follows > > (as defined in Figure 4b). Parameter crack flatness quantifies geometric anisotropy through aspect ratio analysis. The three-dimensional (3D) shape factor (VA-3d), quantifying pore-crack morphology complexity, is defined as follows:
where geometric descriptors are defined as surface area (), volume (), with = 1 representing spherical equivalence. In spherical coordinates, polar angle () and azimuthal angle () specify the orientation of principal eigenvector (). Axial projection angle (: 0–90°) quantifies crack alignment relative to specimen axis (). Parallel () and perpendicular () crack orientations are defined relative to specimen axes (). Transverse angular distribution (: −180° to 180°) characterizes lateral crack projection (). Integration of AE parametric evolution and crack morphological development (Figure 8) elucidates the micro-to-macro fracture progression.
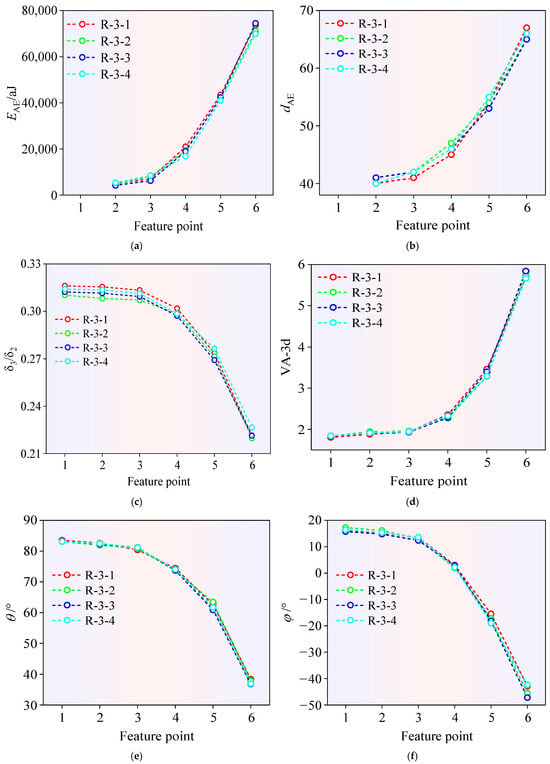
Figure 8.
Evolutionary patterns of AE signal parameters and crack morphology during the loading process of each monitoring feature point: (a) AE signal parameter ; (b) AE signal amplitude ; (c) crack morphology parameter ; (d) crack morphology parameter VA-3d; (e) crack morphology parameter ; (f) crack morphology parameter .
The fracture evolution of sandstone under loading exhibits distinct parameter evolution patterns (Figure 8). AE cumulative energy (), AE signal amplitude (), and 3D morphology factor (VA-3d) initiate accelerated growth at the dilation threshold (Point 3), followed by nonlinear escalation near peak strength (Point 4), ultimately culminating in pre-failure critical state amplification. Conversely, crack flatness () and orientation angles (, ) display progressive attenuation from Point 3 onward, with rapid deterioration emerging post-peak. Notably, crack systems demonstrate preferential axial propagation () over lateral development (), which reflects stress-aligned damage progression.
Synergistic analysis of crack morphology and AE signals reveals two critical mechanical transitions: the dilation threshold marks the onset of localized damage coalescence, while peak strength signifies percolation threshold attainment. Early-stage deformation (Points 1–2) involves quasi-static microcrack accumulation with limited AE activity. Post-dilation (Point 3 onward), both fracture network complexity and AE signal intensity escalate nonlinearly. Fracture nucleation originates from shear-activated microdefects, progressing through subcritical coalescence until post-peak autonomous propagation (Point 4+), where catastrophic failure progresses independent of external loading. These findings establish the dilation threshold and peak strength as fundamental bifurcation points governing sandstone’s failure continuum.
4. Self-Organized Criticality During Damage and Fracture
Sandstone undergoes progressive structural degradation, initiating with microcrack accumulation and culminating in macroscopic failure. This failure progression transitions the material from disordered equilibrium to self-organized critical states through spontaneous energy redistribution and discrete instability thresholds. Quantitative analysis of damage evolution provides fundamental insights into the micromechanical response mechanisms governing this transitional behavior. Systematic evaluation of AE-crack correlation patterns effectively captures internal structural responses during damage progression. This methodology elucidates self-organized criticality in AE-crack coevolution, revealing abrupt phase transitions during structural collapse [58]. Building on this foundation, the present study establishes a quantitative framework to characterize self-organized critical behavior in sandstone fracture systems.
4.1. Self-Organized Process and Two Critical Points
During uniaxial compression, damage evolution captured through real-time CT imaging and AE monitoring exhibits spontaneous localized accumulation with stochastic dispersion. This progression culminates in rapid fracture plane propagation along pre-existing damage trajectories post-critical threshold. These intrinsic features define the self-organized criticality governing sandstone fracture progression [32,59]. The transition from self-organized damage accumulation to critical instability constitutes a non-equilibrium dynamic process with progressive self-organization. Self-organized critical progression during specimen R-3-1 damage evolution is documented in Figure 9a, and volumetric strain evolution specimen R-3-1 at critical transition points of Stage III in Figure 9b.
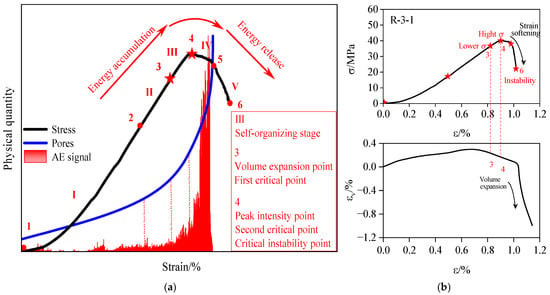
Figure 9.
(a) Self-organized critical progression during sandstone (sandstone specimen R-3-1) damage evolution: Stage I (Compression): Initial structural compaction; Stage II (Elastic): Stable deformation regime; Stage III (Yield): Self-organization phase with meta-stability; Stage IV (Meta-instability): Precursor to critical failure; Stage V (Instability): Unstable collapse; and (b) Volumetric strain evolution at critical transition points of Stage III (sandstone specimen R-3-1).
Sandstone exhibiting self-organized criticality undergoes damage progression characterized by stage-dependent critical thresholds (Figure 9). The yield phase (Stage III) represents the self-organization regime. First critical threshold (volume expansion point) initiates microcrack nucleation from distributed microdamage. Second critical threshold (peak strength) drives microcrack coalescence into macroscale fractures. During pre-yield stages (I–II), stress accumulates through quasi-static deformation. Approaching Monitoring Point 3, strain rate escalation indicates damage localization. Volumetric strain (obtained from axial and radial strain gauges) transitions from compressive to dilative, accompanied by accelerated AE-microcrack coevolution. Crack propagation persists autonomously under constant-load conditions, demonstrating autocatalytic failure. Post Stage III, the system transitions to a meta-stable configuration. At Monitoring Point 4, stress intensification triggers macrocrack percolation. Localized damage zones evolve into stress singularities, enabling instantaneous energy release. Final fracture planes emerge through catastrophic coalescence of dominant cracks. Stage III serves as the instability precursor through self-organized damage patterning. Stage IV culminates in irreversible structural collapse. Final instability (Point 6) occurs substantially later than peak strength attainment (Point 4). Damage progression transitions from disordered low-energy states to organized high-energy configurations. Energy accumulates quasi-statically during early phases, whereas post-critical energy dissipation occurs catastrophically. Material heterogeneity induces nonlinear mechanical responses, driving self-organized damage evolution. Critical thresholds emerge at self-organization maturity. Self-organization patterns provide predictive signatures for impending instability. Thus, Stage III establishes the failure precursor framework.
4.2. Power–Law Scaling Behavior Analysis
Probability distributions characterize the occurrence likelihood of discrete and continuous random variables. This framework effectively quantifies both discrete stochastic events and continuous stochastic processes. Such distributions capture the stochastic nature inherent in AE signal patterns and crack network evolution. Power–law exponents derived from AE-crack probability distributions reveal load/time-dependent damage progression in sandstone. These exponents quantify nonlinear damage dynamics, including power–law scaling transitions during structural degradation (Figure 10 and Figure 11). Elevated power–law indices correlate with enhanced nonlinearity, localized damage intensification, and spatial damage focusing. The power–law exponent functions as both damage quantification metric and evolution mechanism indicator for AE-crack systems.
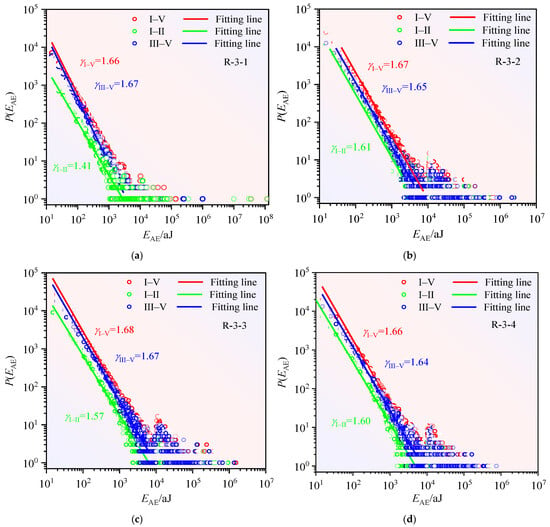
Figure 10.
AE energy probability density functions for sandstone specimens: (a) R-3-1, (b) R-3-2, (c) R-3-3, (d) R-3-4 across three loading regimes: initial (I–II), terminal (III–V), and complete (I–V).
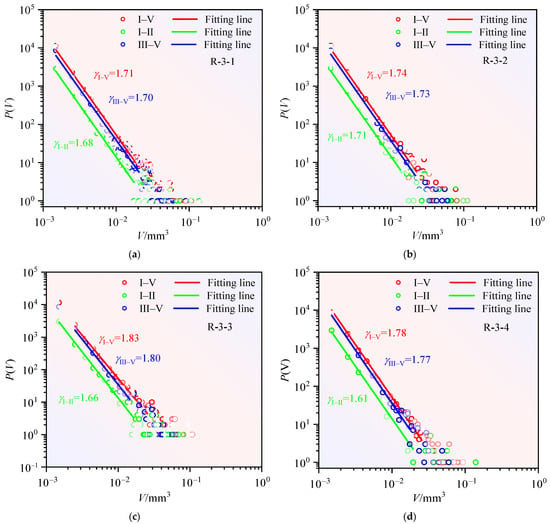
Figure 11.
Pore volume probability density functions for sandstone specimens: (a) R-3-1, (b) R-3-2, (c) R-3-3, (d) R-3-4 across three loading regimes: initial (I–II), terminal (III–V), and complete (I–V).
The sandstone fracture process is bifurcated into pre-critical (I–II) and post-critical (III–V) regimes using the first critical threshold (Monitoring Point 3) as the demarcation. The post-critical regime initiates with Stage III, characterized by autonomous damage reorganization. Probability density functions are computed for both AE energy release and pore volume evolution. The AE energy distribution is modeled through Probability Density Function , defined as follows:
where is the lower intercept of the AE energy distribution, and is the critical exponent of the AE energy distribution. The probability density distribution function of the pore volume is described by Equation (3):
where is the lower intercept of the pore volume distribution and is the critical exponent of the pore volume distribution. Figure 10 and Figure 11 present power–law distributions characterizing acoustic emission (AE) energy and pore volume evolution across three distinct loading phases: initial (I–II), terminal (III–V), and complete (I–V) regimes. Table 4 quantifies these regimes through their respective power–law exponents. Distinct probability density profiles and critical scaling exponents define each phase’s mechanical signature.

Table 4.
Power–law exponents characterizing AE energy and pore volume distributions across three loading regimes: initial (I–II), terminal (III–V), and complete (I–V).
The linearity of AE energy and pore volume probability densities in double-logarithmic coordinates (Figure 10 and Figure 11) demonstrates power–law scaling governing damage evolution during uniaxial compression. Absolute magnitudes of distribution slopes (, ) serve as power–law exponents (). Exponent values derived from histogram analysis show strong consistency with maximum likelihood estimations. This methodological agreement confirms the statistical robustness of power–law exponents (). Post-critical phase (III–V) distributions exhibit spatiotemporal continuity with complete loading history (I–V), showing negligible statistical divergence. Within equivalent measurement ranges, exponents for III–V (1.66–1.83) and I–V (1.64–1.80) regimes demonstrate quantitative equivalence, exceeding I–II values (1.41–1.71). Stage III manifests power–law acceleration through abrupt exponent escalation. Abrupt power–law modifications during self-organization constitute quantifiable precursors for impending structural failure.
Compared with stages I–II prior to the first critical point, the directionality of damage and fracture evolution in III–V stages is enhanced, and the degree of disorder is lower. In self-organized Stage III, most AE signals and pores begin to accumulate in large numbers, and the accumulated AE energy and total pore volume are comparable to those in the final failure state (Figure 6 and Figure 7). This is because with the accumulation of sandstone damage, when approaching the first critical point (volume expansion point), the cohesion force used to resist the compression deformation of the sandstone sample decreases. Friction between fracture surfaces acts to resist sandstone compression and deformation, and the weakening of friction increases the likelihood of the eventual failure of sandstone. Thus, the evolution of AE energy signal and pore structure of sandstone has self-organized critical characteristics, and it is reasonable to regard self-organized Stage III as the precursor stage of sandstone failure.
This study establishes a coupled AE-pore framework to probe self-organized criticality during sandstone fracture, where acoustic emission signatures and pore network evolution jointly quantify damage progression. The analysis highlights autonomous state transitions from mechanical equilibrium to critical instability, accompanied by power–law scaling acceleration (Figure 12 and Figure 13). Spatiotemporal expansion of damage zones exhibits progressive escalation during failure evolution. Integrating these findings with Kachanov’s continuity-damage theory [60], the dimensionless AE damage parameter is formulated as follows:
where is the effective cross-sectional area of the damaged region during sandstone loading and is the effective cross-sectional area of the final failure region. In addition, and are the number of AE events and the cumulative AE energy during sandstone loading, respectively, and and are number of AE events and the cumulative AE energy of the final failure region, respectively. The relationship between and is described by the following:
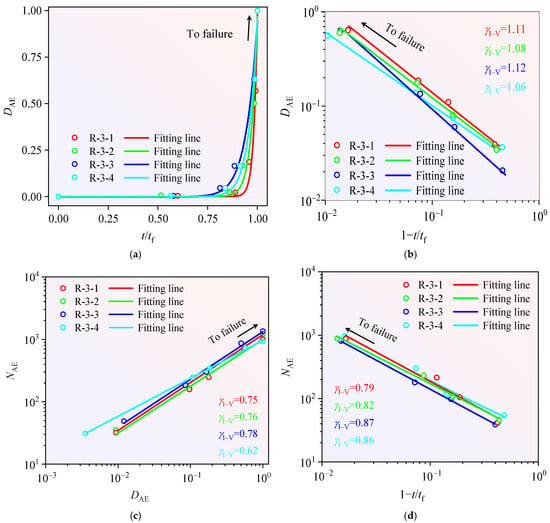
Figure 12.
Power–law scaling of acoustic emission signals during progressive loading (I–V): (a) -, (b) -, (c) - and (d) -.
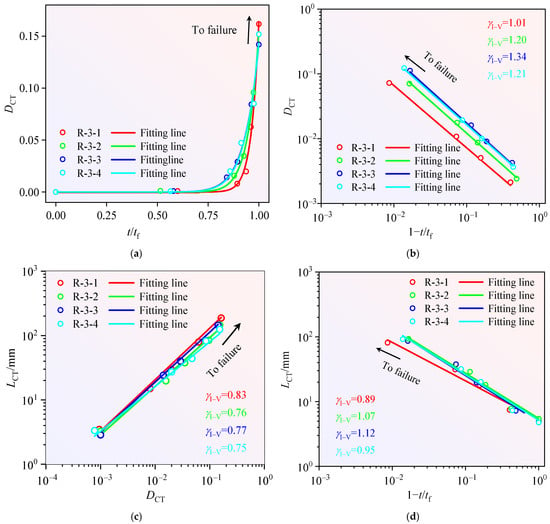
Figure 13.
Power–law scaling of pore structure during progressive loading (I–V): (a) -, (b) -, (c) - and (d) -.
The dimensionless damage variable during sandstone loading is formulated through cumulative AE energy integration, defined as follows:
Notably, represents the time of each stress stage of sandstone, the initial loading is 0, and represents the time of final failure and instability. is the normalized loading time of the sandstone sample, and is the change rate of the loading time, that is, the control parameter. When parameter is treated as a temporal scaling factor, the loading-path-independent nature of sandstone’s self-organized critical behavior during damage progression is demonstrated [58]. Figure 12 presents power–law distributions of AE parameters across all loading phases (I–V), while Table 5 and Table 6 quantify their scaling exponents for three distinct regimes: initial (I–II), terminal (III–V), and complete (I–V) stages.

Table 5.
Power–law scaling exponents () characterize AE signals evolution across three loading regimes: initial (I–II), terminal (III–V), and complete (I–V).

Table 6.
Power–law scaling exponents () characterize pore network evolution across three loading regimes: initial (I–II), terminal (III–V), and complete (I–V).
Pore network quantification was achieved through X-ray CT time-resolved imaging. Parameter , representing the dimensionless maximum microfracture scale, was derived through the following:
where is the sandstone pore volume, and is the rock volume. Sandstone damage progression exhibits crack-density dependence. A porosity-based dimensionless damage rate () is formulated as follows:
where is the porosity of the sandstone in the initial state and is the porosity under various stress stages. and are derived from 3D X-CT data. can normalize initial heterogeneity across specimens. By minimizing the variability from initial porosity differences (9.74–9.78% range), enables reliable cross-sample comparisons of damage progression. Figure 13 presents power–law distributions of sandstone pore structure parameters across all loading phases (I–V). Table 5 and Table 6 quantifies the corresponding scaling exponents for three distinct regimes: initial (I–II), terminal (III–V), and complete (I–V) stages.
Although nominally homogeneous sandstone samples were selected to minimize mechanical heterogeneity, natural sandstone inherently exhibits intrinsic heterogeneity. This inherent heterogeneity, though minimized in our experimental preparation, still plays a significant role in the damage evolution and fracture mechanisms of sandstone. Figure 12a demonstrates that parameter exhibits power–law correlation with throughout the damage-fracture progression. This correlation is quantified through power–law scaling exponent (), which relates to loading-rate dependency () as formulated:
By integrating formula (9), parameters and satisfy the following relationship:
Equation (10) and Figure 12b demonstrate that parameters and exhibit -type power–law scaling throughout the sandstone damage-to-failure continuum. Correspondingly, variables and conform to -type correlation as shown in Figure 12c. Spatial variation analysis reveals that Parameter displays fault-aligned anisotropy, Parameters and follow /-type power–law distributions, Scaling exponents yield absolute magnitudes: 0.79, 0.82, 0.87, 0.86 (Figure 12d).
Figure 13a demonstrates that parameters and exhibit co-evolutionary power–law scaling throughout the damage-fracture continuum. This scaling behavior is quantified through exponent , which correlates with loading-rate sensitivity as formulated in Equation (11):
Building upon Equation (11), the coupled parameters and are found to satisfy the relationship defined in Equation (12):
Equation (12) and Figure 13b demonstrate that parameters and exhibit -type power–law scaling throughout the sandstone damage-to-failure continuum. Correspondingly, variables and conform to -type correlation as shown in Figure 13c. Spatial variation analysis reveals: Parameter displays fault-aligned anisotropy, Parameters and follow /-type power–law distributions, Scaling exponents yield absolute magnitudes: 0.89, 1.07, 1.12, 0.95 (Figure 13d).
Throughout the entire damage-fracture continuum, structural parameters (, , , , , ) exhibit positive correlations with control parameters (, ). Fault-aligned damage divergence provides empirical validation for critical phenomena in sandstone failure mechanics. This observation confirms scaling criticality in complex rock systems approaching mechanical instability. These findings align with the scaling framework established by Lennerz-Sasenec et al. and further validate Biswas’ critical threshold model [61]. The AE-porosity coevolution demonstrates power–law scaling during damage progression. This universal scaling behavior remains invariant to sample size and structural heterogeneity. Power–law variations in fault evolution originate from AE source mechanism diversity [62]. Parameter r demonstrates strain-rate sensitivity [63], with additional dependence on: Strain energy density, Microcrack network evolution, structural reorganization.
The sandstone is in a steady state in stages I–II, and the internal parameters of the sandstone internal structure increase slowly. In stages III–V, starting from self-organized process (III), the sandstone enters the meta-unstable state from the meta-stable state through the critical instability point and then fails to reach the unstable state. In stages III–V, the very small stress disturbance is sufficient to cause the internal crack to expand to the macroscopic magnitude, which also plays a decisive role in the final failure. The damage theory in fracture mechanics states that damage in the early stage can promote fracture to form a “chain reaction” in the later stage. The power–law exponents r′III–V (0.84–1.15) of the sandstone AE signal and pore parameters in stages III–V are approximately equal to those of r′I–V (0.87–1.20) in stages I–V, and both are greater than those of r′I–II (0.71–0.85) in stages I–III. The phenomenon of power—law acceleration with increasing power exponent can be considered an indicator of the transition of the sandstone from the steady state to the unsteady state. The structural parameters of the above-mentioned sandstone failure process increase to approximately , , , and in Stage III, which is regarded as the precursor of sandstone failure after the critical phase transition. The propagation of sandstone cracks and the accumulation of AE events follows power law growth, intuitively reflecting the fracture process of the internal structure of sandstone due to stress release. Through this phenomenon, the damage fracture pattern and the critical phase transition mechanism of the self-organized critical system of sandstone can be fundamentally revealed.
During stages I–II, the sandstone maintains mechanical equilibrium with gradual escalation of internal structural parameters. The self-organization phase (Stage III) triggers a state transition sequence: metastable—meta-unstable via critical instability threshold—ultimate unstable failure. Post-critical regimes (Stages III–V) demonstrate stress sensitivity, where minor perturbations induce macroscopic crack propagation governing failure mechanisms. Fracture mechanics principles confirm that incipient damage nucleates crack cascade effects during advanced failure phases. Scaling exponents analysis reveals: r′III–V = 0.84–1.15 ≈ r′I–V = 0.87–1.20, r′III–V, r′I–V > r′I–II = 0.71–0.85. Accelerating power–law exponents provide quantifiable evidence for steady-to-unsteady state transition. Structural parameters (, , , ) reach critical thresholds during Stage III, serving as reliable precursors for post-critical failure. Crack propagation and AE energy accumulation exhibit power–law dynamics, directly correlating with stress-driven structural disintegration. This framework fundamentally elucidates damage progression patterns and self-organized critical transition mechanisms in sandstone.
5. Evolution Characteristics of the Self-Organized Process and Final Instability Stage
Sandstone damage-fracture progression exhibits distinct self-organized criticality across deformation stages. Power–law accelerated evolution of AE signals and pore networks serves as quantifiable precursors for terminal failure. However, systematic linkage between self-organized critical phase transitions and failure mechanisms requires rigorous investigation. This study characterizes critical phase transitions during self-organization and terminal instability to address this knowledge gap.
This study examines damage evolution mechanisms during Stage III (self-organization) and Stage V (terminal instability) through comparative analysis of AE signal frequency and pore density along the specimen’s longitudinal axis (Figure 14 and Figure 15).
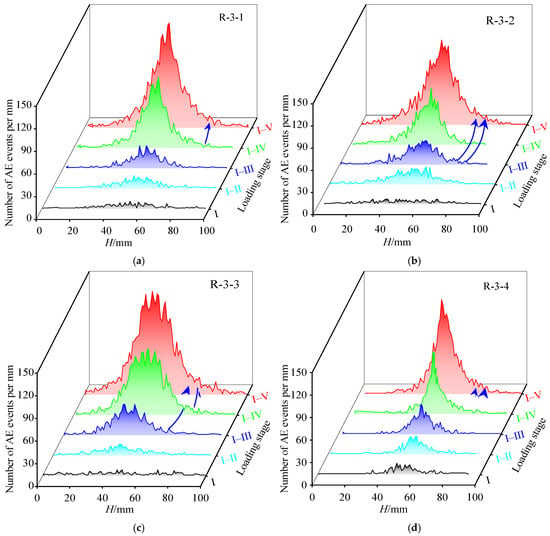
Figure 14.
Spatial distribution of AE events along the longitudinal axis in sandstone specimens: (a) R-3-1, (b) R-3-2, (c) R-3-3, (d) R-3-4 during progressive loading. (H refers to the sample length. (unit: mm)).
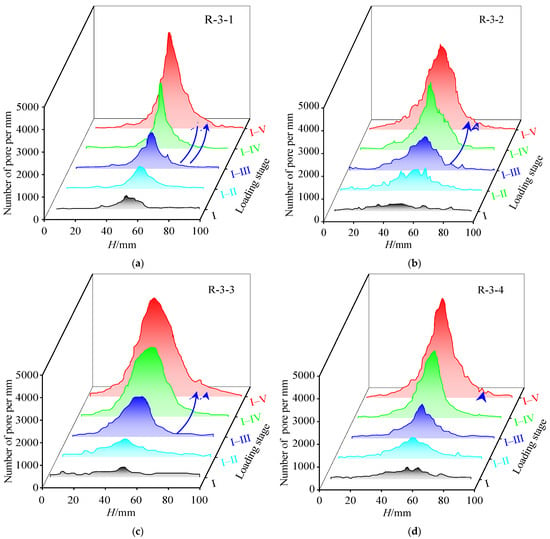
Figure 15.
Spatial distribution of pores along the longitudinal axis in sandstone specimens: (a) R-3-1, (b) R-3-2, (c) R-3-3, (d) R-3-4 during progressive loading. (H refers to the sample length. (unit: mm)).
Figure 14 and Figure 15 demonstrate that the spatiotemporal evolution patterns of AE-pore correlated damage during Stage I exhibit 5–11% only, and Stage II is only 8–17%. The spatiotemporal evolution patterns of AE-pore correlated damage during Stage III showed a significant increase in similarity (56–72%) with terminal failure zones in stage V, and the spatiotemporal evolution patterns of AE-pore correlated damage during Stage IV exhibit 85–90% similarity with terminal failure zones in Stage V based on cross-correlation analysis. This high congruence suggests that Stage III establishes the foundational geometry of eventual failure zones, as captured at Monitoring Point 3 (Figure 7). The transitional position of Stage III between critical thresholds drives stress redistribution during energy release, generating distinct stress concentration zones (central region) and stress shadow zones (specimen extremities). Stress concentration zones exhibit pore densities and AE activity, contrasting sharply with stress shadow regions. Stage III culminates in three sequential phenomena—bearing capacity threshold breach, macrocrack network percolation, and embryonic failure surface nucleation. Despite occupying merely 10% of total loading duration, Stage III accounts for 25% of cumulative microcrack formation and 28% of total AE energy release. All accelerated AE-pore coevolution zones during Stage III spatially coincide with eventual failure locations. Quantitative precursor metrics reveal AE spatial coverage ranging from 34 to 38% and pore distribution spanning 37–46% of final failure areas across specimens. The demonstrated spatiotemporal isomorphism between Stage III damage patterns and Stage V failure morphologies validates Stage III’s critical role as a deterministic failure precursor.
Through analysis of temporal AE event intervals, spatial AE event intervals, and pore spatial intervals during Stage III and the complete loading process (I–V), this study elucidates spatiotemporal evolution patterns in Stages III and V. These relationships are visually documented in Figure 16 and Figure 17.
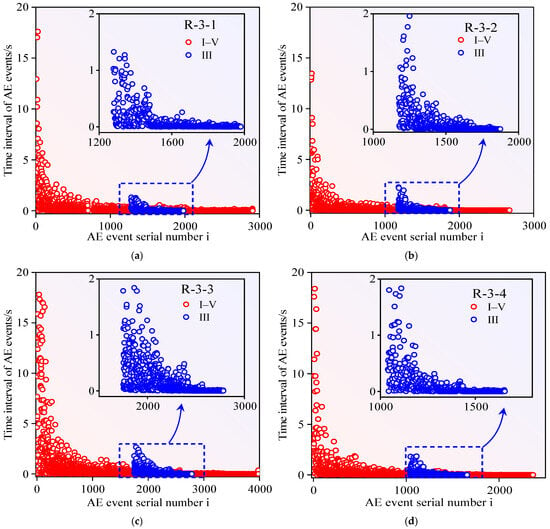
Figure 16.
Temporal evolution of AE event intervals in sandstone specimens: (a) R-3-1, (b) R-3-2, (c) R-3-3, (d) R-3-4 through Stage III (self-organization) and complete loading history (I–V).
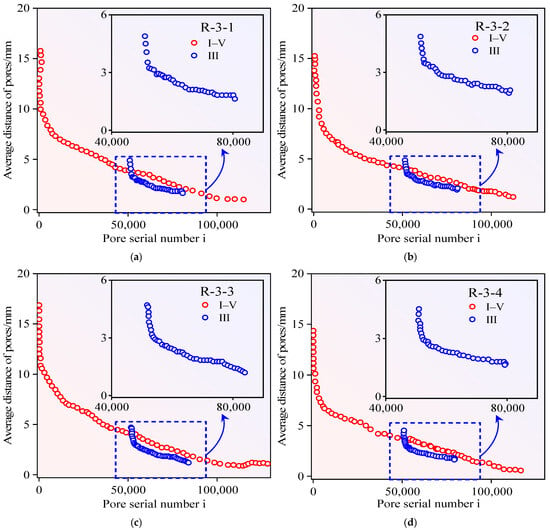
Figure 17.
Spatial evolution of pores intervals in sandstone specimens: (a) R-3-1, (b) R-3-2, (c) R-3-3, (d) R-3-4 through Stage III (self-organization) and complete loading history (I–V).
Figure 16 and Figure 17 demonstrate progressive reductions in AE temporal spacing, AE spatial clustering, and pore distribution distances across Stage III and full loading history (I–V), ultimately stabilizing at critical thresholds. Consistent parametric distributions emerge across spatial–temporal domains between Stage III and complete loading history (I–V). This trend originates from intensified structural deterioration following Stage III self-organization. AE-pore-correlated damage zones consistently localize within eventual failure boundaries (Figure 7). These observations confirm morphological congruence between Stage III precursor patterns and Stage V failure configurations. Consequently, Stage III damage progression signatures enable reliable prediction of ultimate failure surface development. This approach effectively circumvents premature misjudgments of terminal failure during the initial loading stage.
6. Discussion
6.1. Self-Organized Behavior and Critical Phase Transition Mechanism
This investigation analyzes natural rock mass weakness planes through integrated methodologies including SEM imaging, AE signal propagation analysis, and crack path mapping. These techniques collectively characterize self-organized criticality and phase transition dynamics during progressive fracture evolution. SEM results and conceptual diagram of sandstone’s (Specimen R-3-2) internal structure at four critical loading stages are presented in Figure 18. The derived conceptual framework integrating micro–macro fracture mechanics is presented in Figure 18 and Figure 19.
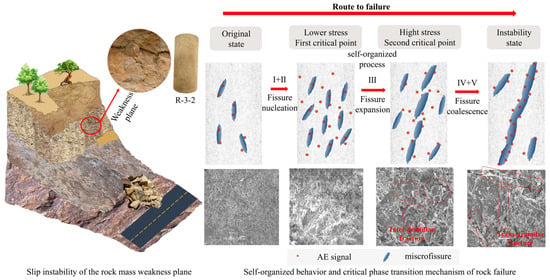
Figure 18.
Multiscale framework depicting then self-organized criticality evolution, phase transition mechanics, progressive fracturing mechanisms within rock mass weakness planes.
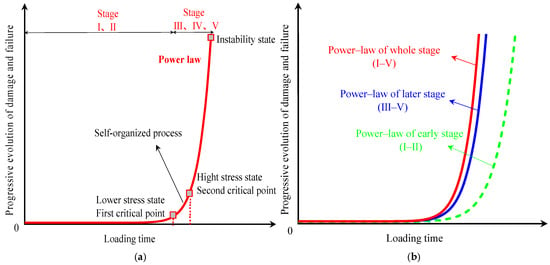
Figure 19.
(a) Progressive sandstone damage–failure continuum follows second-order power–law behavior. (b) Late-stage fracture evolution (III–V) exhibits closer alignment with complete loading history (I–V) than early-stage patterns (I–II).
Combined with the SEM results and conceptual diagram of sandstone’s (R-3-2) internal structure in Figure 18, three distinct evolutionary stages in sandstone fracturing—nucleation, propagation, and coalescence. The mechanical thresholds govern this progression. The first critical point under low-stress conditions initiates crack nucleation, while the second critical point at elevated stresses drives crack propagation. Ultimate failure enables crack coalescence. Stage III initiates at the first critical point under low-stress conditions, exhibiting minimal volumetric strain. Spontaneous structural defect reorganization induces grain boundary-aligned cracking, resulting in volumetric dilatancy. AE signals exhibit gradual intensification during nucleation, expanding crack density while reducing inter-crack spacing. Propagation phases demonstrate accelerated AE activity, amplifying both crack volume and length. Stage III culminates at the second critical point under high-stress conditions. This regime triggers crystalline particle reorientation, amorphous matrix disintegration, and micro-to-macro crack transition through coalescence. Coalescence-driven instability predominantly manifests through intergranular (IG) fracture modes. Transgranular (TG) fracture mechanisms accelerate system-wide instability via rapid crack network formation. Specifically, the sandstone initially undergoes compaction, where existing pores and microcracks begin to close and merge, increasing the contact and density of mineral particles. With increasing stress, the rock enters the elastic deformation stage, characterized by the closure of pores and the reduction in crack size, with minerals becoming more tightly packed. In Stage III, new microcracks form perpendicular to the maximum principal stress direction, expanding and linking up to increase crack density. With further loading (Stage IV), the rock enters the failure stage, where cracks rapidly interconnect and expand, forming macrocracks that propagate and eventually cause fracture. The particles within the rock undergo reorientation, and the amorphous matrix disintegrates, weakening the bonding between particles and facilitating crack propagation. Preexisting microdamage configurations dictate deformation pathways, as demonstrated by Cartwright-Taylor et al. [64]. Rock mass weakness planes nucleate deformation, governing fault geometry and spatial distribution during failure. The temporal convergence of macrofracture propagation provides reliable precursor timing for failure. SEM images mesoscopically document damage evolution. Combined macro-meso analysis reveals self-organized criticality of sandstone damage progression. These self-organization criticality principles enable predictive analysis of engineering rock mass behavior under complex loading scenarios.
Heterogeneous sandstone exhibits self-organized criticality during damage evolution. AE-crack correlated damage progression follows predictable power–law dynamics with quantifiable acceleration rates. Deformation-fracture parameters obey second-order power–law distributions (Figure 19a), characteristic of critical phase transitions. Stage I–II energy accumulation undergoes abrupt release at the first critical point, transitioning through Stage III self-organization to reach the second critical point via power–law accelerated damage propagation. Stage IV meta-instability features crack network percolation, culminating in Stage V macrocrack coalescence (Figure 19a, red trajectory). Progressive loading induces temporary deviations from critical states, yet self-regulation mechanisms restore system criticality prior to rapid terminal failure. Late-stage power–law patterns (III–V, blue) exhibit 89% similarity with complete loading history (I–V, red), compared to 62% for early-stage patterns (I–II, green) in Figure 19b. Stage III self-organization serves as the failure precursor, with power–law exponent escalation providing quantifiable early warning signals. Stage III damage zones enable 92% accurate prediction of ultimate failure geometries. Effective failure prediction requires spatiotemporal characterization of Stage III damage zones—recording their spatial coordinates, temporal emergence, and morphological signatures. The proposed conceptual framework deciphers self-organized critical phase transition mechanics governing deformation-failure processes. Spatiotemporal predictability of sandstone failure is achieved through cross-stage correlation analysis of damage evolution patterns.
This study demonstrates significant consistency with prior rock mechanics research in self-organized criticality (SOC), power–law distributions, and nonlinear dynamics. First, SOC characteristics were identified during Stage III of sandstone deformation, where damage evolution followed power–law statistics. This aligns with Bak et al.’s SOC theory [14], confirming system self-organization to critical states. Second, power–law distributions observed in AE energy release and pore volume evolution across loading stages mirror findings from Xue et al. [4] and Jiang et al. [32], and similar power–law exponents among samples suggest universality in rock fracturing. Third, nonlinear damage dynamics—manifested as accelerated AE energy, amplitude, and pore morphology growth during Stage III—correspond to Zhou et al. [3] and Xiao et al.’s studies [1] on nonlinear rock damage acceleration. However, the exponents in this study differ from earthquake-related studies, where exponents typically exceed 1.5 [65]. These variations to the specific heterogeneity of sandstone, such as its pore structure and mineral composition, which influence damage mechanisms and rates.
However, this study demonstrates unique innovations in experimental methods, data analysis, and predictive modeling, forming a sharp contrast with previous research. In experimental methods and data acquisition, this study innovatively combines real-time CT scanning and AE monitoring. This enables multi-scale dynamic observation of sandstone’s internal structure and damage evolution. Compared to studies relying solely on single techniques (e.g., AE monitoring or mechanical testing alone) [28], this approach comprehensively captures fracture morphology, distribution, and evolution. This provides deeper insights into sandstone’s SOC and fracture mechanisms. Additionally, compared to the self-organized critical behavior of experimental materials [58], this study refines the analysis of SOC stages. The self-organized phase during sandstone deformation is divided into two critical thresholds: first critical point (volumetric dilation) and second critical point (peak strength). Damage evolution between these thresholds and its SOC correlation is systematically explored. Such granular phase analysis is rarely seen in prior studies.
6.2. Limitations and Future Directions
The limitation of this study is its investigation of the self-organized critical characteristics and critical phase transition mechanisms of heterogeneous natural sandstone under uniaxial loading in a laboratory static loading environment. In particular, the predictability of sandstone failure is explored systematically to reveal the second-order power–law distribution and acceleration phenomena in the progressive damage and fracture process of sandstone. Notably, the heterogeneous sandstone failure experiments carried out in this paper are only based on open-pit coal resource mining, rock slope protection and disaster prevention projects to predict failure during loading. However, in actual engineering, relatively homogeneous rock has a first-order abrupt damage rupture pattern, and the failure process of initially damaged rock (thermal damage, tectonic faults, etc.) often presents second-order characteristics with greater accumulation. In light of this, laboratory studies have only scratched the surface of complex rock mechanics. For the complex geological environment in actual engineering, not only static, dynamic, uniaxial, and multiaxial stress state transformations but also the comprehensive effects of multiple field coupling (T-H-M-C coupling), such as temperature, seepage, stress, and chemical coupling must be considered, which significantly exacerbates the complexity and challenges of rock damage and fracture prediction.
Therefore, the study of sandstone self-organized critical characteristics and fracture predictability via real-time CT scanning and AE monitoring presented in this paper is expected to provide useful information for the subsequent study of rock failure predictability under multiple stress coordinates. Based on the above discussion, future research direction is as follows: real-time CT scanning and AE monitoring experiments should be carried out simultaneously during the loading failure experiments. Representative rock samples of various types with different initial states and multifield coupling conditions should be selected. The deformation evolution law and failure mechanism of rock with different initial internal structures should be comprehensively explored, and it should be determined whether the self-organized critical law is followed in the process of damage and failure and whether damage and failure are predictable. The study of the deformation and fracture caused by the accumulation of damage inside the sandstone provides an important foundation for the next step in future research that will focus on the exploration of the evolution mode of rock damage and its failure prediction. This will provide a solid theoretical foundation and innovative ideas for accurate assessment, early warning and scientifically valid strategies for the prevention and control of rock mass disasters.
7. Conclusions
Through systematic investigation of damage-fracture evolution in heterogeneous sandstone, this study reveals self-organized criticality and establishes predictive frameworks for failure. Four principal conclusions emerge:
- (1)
- Yield-phase critical transitions: Three phenomena exhibit abrupt changes during sandstone yielding: macromechanical responses, AE signals, and crack networks. The entire yield phase constitutes a self-organization process bounded by two critical thresholds. The initiation threshold (first critical point) denotes microdamage coalescence into microcracks, triggering volumetric expansion. The termination threshold (second critical point) marks microcrack reorganization into oriented macrocracks preceding peak strength.
- (2)
- Power–law damage progression: AE-pore evolution adheres to power–law dynamics throughout fracturing. The self-organization phase exhibits power–law exponents (r ≈ 0.84–1.15) matching complete fracture processes (r ≈ 0.87–1.20) but exceeding initial phase values (r ≈ 0.71–0.85). Exponent magnitude correlates with three damage characteristics: nonlinearity intensity, damage degree, and spatial localization. Escalating r-values during self-organization provide quantifiable early warning of impending failure.
- (3)
- Predictive damage signatures: Stage III damage patterns exhibit 85–90% similarity with terminal failure surfaces both spatially and temporally. These self-organization signatures enable reliable prediction of three failure parameters: fracture geometry, instability chronology, and damage progression trends.
- (4)
- Multistage fracture mechanics: Crack evolution progresses through three mechanistic phases: nucleation dominance at first criticality, propagation dominance at second criticality, and coalescence dominance at terminal failure. The developed conceptual model deciphers self-organized critical phase transitions through integrated analysis of AE-crack response patterns.
However, it is limited to static loading and does not fully cover complex engineering conditions. Real-world scenarios involve diverse stress states and multi-field coupling, which increase prediction complexity. Future research should use real-time CT and AE monitoring on varied rock samples under multi-field conditions. This will help understand rock deformation and failure mechanisms, check the applicability of the self-organized critical law, and explore predictability. It will provide a basis for studying rock damage evolution and failure prediction, supporting the accurate assessment and prevention of rock disasters.
Author Contributions
H.Y.: Conceptualization, Methodology, Investigation, Validation, Formal analysis, Software, Writing—Original draft preparation, Data curation. Y.S.: Conceptualization, Investigation, Supervision, Resources, Writing—Review and editing, Funding acquisition. J.R.: Methodology, Investigation. Y.C.: Methodology. All authors have read and agreed to the published version of the manuscript.
Funding
This research was financially supported by the National Natural Science Foundation of China (Grant Nos. 42277182, 42377187, 12072259, and 11972283).
Institutional Review Board Statement
Not applicable.
Informed Consent Statement
Not applicable.
Data Availability Statement
Data will be made available on request.
Conflicts of Interest
The authors declare no conflicts of interest.
References
- Xiao, P.; Li, D.; Zhao, G.; Liu, H. New criterion for the spalling failure of deep rock engineering based on energy release. Int. J. Rock Mech. Min. Sci. 2021, 148, 104943. [Google Scholar] [CrossRef]
- Kang, H.; Jiang, P.; Feng, Y.; Gao, F.; Zhang, Z.; Liu, X. Application of large-scale hydraulic fracturing for reducing mining-induced stress and microseismic events: A comprehensive case study. Rock Mech. Rock Eng. 2023, 56, 1399–1413. [Google Scholar] [CrossRef]
- Zhou, J.; Zhang, Y.; Li, C.; He, H.; Li, X. Rockburst prediction and prevention in underground space excavation. Undergr. Space 2024, 14, 70–98. [Google Scholar] [CrossRef]
- Xue, J.; Hao, S.; Wang, J.; Ke, F.; Lu, C.; Bai, Y. The changeable power law singularity and its application to prediction of catastrophic rupture in uniaxial compressive tests of geomedia. J. Geophys. Res. Solid Earth 2018, 123, 2645–2657. [Google Scholar] [CrossRef]
- Xie, H.; Gao, M.; Zhang, R.; Peng, G.; Wang, W.; Li, A. Study on the mechanical properties and mechanical response of coal mining at 1000 m or deeper. Rock Mech. Rock Eng. 2019, 52, 1475–1490. [Google Scholar] [CrossRef]
- Renard, F.; Weiss, J.; Mathiesen, J.; Ben-Zion, Y.; Kandula, N.; Cordonnier, B. Critical evolution of damage toward system-size failure in crystalline rock. J. Geophys. Res.-Solid Earth 2018, 123, 1969–1986. [Google Scholar] [CrossRef]
- Renard, F.; Cordonnier, B.; Kobchenko, M.; Kandula, N.; Weiss, J.; Zhu, W. Microscale characterization of rupture nucleation unravels precursors to faulting in rocks. Earth Planet. Sci. Lett. 2017, 476, 69–78. [Google Scholar] [CrossRef]
- Ben-Zion, Y.; Zaliapin, I. Localization and coalescence of seismicity before large earthquakes. Geophys. J. Int. 2020, 223, 561–583. [Google Scholar] [CrossRef]
- Liu, Y.; Dai, F. A review of experimental and theoretical research on the deformation and failure behavior of rocks subjected to cyclic loading. J. Rock Mech. Geotech. Eng. 2021, 13, 1203–1230. [Google Scholar] [CrossRef]
- Bouchon, M.; Durand, V.; Marsan, D.; Karabulut, H.; Schmittbuhl, J. The long precursory phase of most large interplate earthquakes. Nat. Geosci. 2013, 6, 299–302. [Google Scholar] [CrossRef]
- Zhang, J.Z.; Wu, W.T.; Zhou, X.P. On the predictability of localization instabilities of quasibrittle materials from accelerating rates of acoustic emission. Eng. Fract. Mech. 2023, 289, 109455. [Google Scholar] [CrossRef]
- Di, Y.; Wang, E.; Li, Z.; Liu, X.; Huang, T.; Yao, J. Comprehensive early warning method of microseismic, acoustic emission, and electromagnetic radiation signals of rock burst based on deep learning. Int. J. Rock Mech. Min. Sci. 2023, 170, 105519. [Google Scholar] [CrossRef]
- Askaripour, M.; Saeidi, A.; Rouleau, A.; Mercier-Langevin, P. Rockburst in Underground Excavations: A Review of Mechanism, Classification, and Prediction Methods. J. Undergr. Space 2022, 7, 577–607. [Google Scholar] [CrossRef]
- Bak, P.; Tang, C.; Wiesenfeld, K. Self-organized criticality: An explanation of the 1/f noise. Phys. Rev. Lett. 1987, 59, 381–384. [Google Scholar] [CrossRef]
- Zhou, Z.; Ullah, B.; Rui, Y.; Cai, X.; Lu, J. Predicting the failure of different rocks subjected to freeze-thaw weathering using critical slowing down theory on acoustic emission characteristics. Eng. Geol. 2023, 316, 107059. [Google Scholar] [CrossRef]
- Zhang, H.; Shi, H.; Wu, Y.; Pu, H. Numerical statistical analysis on self-organizing behavior of microfracturing events in rock failure. Int. J. Distrib. Sens. Netw. 2018, 14, 1550147718768993. [Google Scholar] [CrossRef]
- He, Z.; Wilson, S.B.; Monjezi, M.; Tran, T.T. Estimating Brazilian Tensile Strength of Granite Rocks Using Metaheuristic Algorithms-Based Self-Organizing Neural Networks. Rock Mech. Rock Eng. 2024, 57, 4653–4668. [Google Scholar] [CrossRef]
- Zhu, C.; Xu, Y.Z.; He, M.C.; Jiang, Y.J.; Karakus, M.; Hu, L.H.; Jiang, Y.L.; Ren, F.Q. Identification of failure behaviors of underground structures under dynamic loading using machine learning. J. Rock Mech. Geotech. Eng. 2025, 17, 414–431. [Google Scholar] [CrossRef]
- Ali, M.; Wang, E.; Li, Z.; Jia, H.; Li, D.; Jiskani, I.M.; Ullah, B. Study on Acoustic Emission Characteristics and Mechanical Behavior of Water-Saturated Coal. J. Geofluids 2021, 2021, 5247988. [Google Scholar] [CrossRef]
- Pham, C.; Zhuang, L.; Yeom, S.; Shin, H.S. Automatic fracture characterization in CT images of rocks using an ensemble deep learning approach. Int. J. Rock Mech. Min. Sci. 2023, 170, 105531. [Google Scholar] [CrossRef]
- Zhu, Q.; Li, D.; Han, Z.; Xiao, P.; Li, B. Failure characteristics of brittle rock containing two rectangular holes under uniaxial compression and coupled static-dynamic loads. Acta Geotech. 2021, 16, 131–152. [Google Scholar] [CrossRef]
- Zhu, C.; Xing, X.S.; He, M.C.; Tang, Z.C.; Xiong, F.; Ye, Z.Y.; Xu, C.S. Failure behavior and strength model of blocky rock mass with and without rockbolts. Int. J. Min. Sci. Technol. 2024, 34, 747–762. [Google Scholar] [CrossRef]
- Eppes, M.C.; Keanini, R. Mechanical weathering and rock erosion by climate-dependent subcritical cracking. Rev. Geophys. 2017, 55, 470–508. [Google Scholar] [CrossRef]
- Li, X.; Duan, Y.T.; Li, S.D.; Zhou, R.Q. Study on the Progressive Failure Characteristics of Longmaxi Shale under Uniaxial Compression Conditions by X-ray Micro-Computed Tomography. Energies 2017, 10, 303. [Google Scholar] [CrossRef]
- Song, Y.; Tan, H.; Yang, H.; Chen, S.; Che, Y.; Chen, J. Fracture evolution and failure characteristics of sandstone under freeze-thaw cycling by computed tomography. Eng. Geol. 2021, 294, 106370. [Google Scholar] [CrossRef]
- Tan, H.; Song, Y.J.; Yang, H.M. Energy evolution and strain localization in fractured sandstone under freeze-thaw cycling and uniaxial loading-unloading. Int. J. Rock Mech. Min. Sci. 2024, 177, 105746. [Google Scholar] [CrossRef]
- Meng, Q.; Wu, K.; Zhou, H. Mesoscopic damage evolution of coral reef limestone based on real-time CT scanning. Eng. Geol. 2022, 307, 106781. [Google Scholar] [CrossRef]
- Du, K.; Luo, X.; Liu, M.; Liu, X.; Zhou, J. Understanding the evolution mechanism and classification criteria of tensile-shear cracks in rock failure process from acoustic emission (AE) characteristics. J. Eng. Fract. Mech. 2024, 296, 109864. [Google Scholar] [CrossRef]
- Duan, D.; Zhao, Y.T.; Zhang, R.Z. Acoustic emission characterization of uniaxial compression failure characteristics of mudstone based on Micro-CT. J. Vib. Shock. 2020, 39, 163–170. (In Chinese) [Google Scholar]
- Fan, L.F.; Fan, Y.D.; Xi, Y.; Gao, J.W. Spatial failure mode analysis of frozen sandstone under uniaxial compression based on CT technology. Rock Mech. Rock Eng. 2022, 55, 4123–4138. [Google Scholar] [CrossRef]
- Jia, Z.; Xie, H.; Zhang, R.; Li, C.; Wang, M.; Gao, M.; Zhang, Z. Acoustic emission characteristics and damage evolution of coal at different depths under triaxial compression. Rock Mech. Rock Eng. 2020, 53, 2063–2076. [Google Scholar] [CrossRef]
- Jiang, D.; Xie, K.; Chen, J.; Zhang, S.; Tiedeu, W.N.; Xiao, Y.; Jiang, X. Experimental analysis of sandstone under uniaxial cyclic loading through acoustic emission statistics. Pure Appl. Geophys. 2019, 176, 265–277. [Google Scholar] [CrossRef]
- Yuan, A.; Hou, J.; Yin, Z. The force chain and acoustic emission response law for the uniaxial compression of rock. Geotech. Geol. Eng. 2020, 38, 4479–4499. [Google Scholar] [CrossRef]
- McBeck, J.A.; Aiken, J.M.; Mathiesen, J.; Ben-Zion, Y.; Renard, F. Deformation precursors to catastrophic failure in rocks. Geophys. Res. Lett. 2020, 47, e2020GL090255. [Google Scholar] [CrossRef]
- Lennartz-Sassinek, S.; Main, I.G.; Zaiser, M.; Graham, C.C. Acceleration and localization of subcritical crack growth in a natural composite material. Phys. Rev. E 2014, 90, 052401. [Google Scholar] [CrossRef]
- Lyakhovsky, V.; Sagy, A.; Kurzon, I. Simulated rupture dynamics and radiated energy on heterogeneously damaged faults. J. Geophys. Res. Solid Earth 2023, 128, e2022JB025559. [Google Scholar] [CrossRef]
- Rong, G.; Peng, J.; Yao, M.; Jiang, Q.; Wong, L.N.Y. Effects of specimen size and thermal-damage on physical and mechanical behavior of a fine-grained marble. Eng. Geol. 2018, 232, 46–55. [Google Scholar] [CrossRef]
- Schubnel, A.; Guéguen, Y. Dispersion and anisotropy of elastic waves in cracked rocks. J. Geophys. Res.-Solid Earth 2003, 108, B2. [Google Scholar] [CrossRef]
- Girard, L.; Weiss, J.; Amitrano, D. Damage-cluster distributions and size effect on strength in compressive failure. Phys. Rev. Lett. 2012, 108, 225502. [Google Scholar] [CrossRef]
- Li, J.; Liu, D.; He, M.; Guo, Y.; Wang, H. Experimental investigation of true triaxial unloading rockburst precursors based on critical slowing-down theory. Bull. Eng. Geol. Environ. 2023, 82, 65. [Google Scholar] [CrossRef]
- Yang, B.; Zhao, W.; Duan, Y. Critical damage threshold of brittle rock failure based on Renormalization Group theory. Geomech. Geophys. Geo-Energy Geo-Resour. 2022, 8, 135. [Google Scholar] [CrossRef]
- Wang, S.; Xu, Y.; Zhang, Y.B.; Yao, X.L.; Liang, P. Effects of sandstone mineral composition heterogeneity on crack initiation and propagation through a microscopic analysis technique. Int. J. Rock Mech. Min. Sci. 2023, 162, 105307. [Google Scholar] [CrossRef]
- Beroza, G.C.; Segou, M.; Mousavi, S.M. Machine learning and earthquake forecasting—Next steps. Nat. Commun. 2021, 12, 4761. [Google Scholar] [CrossRef] [PubMed]
- Segalini, A.; Valletta, A.; Carri, A. Landslide time-of-failure forecast and alert threshold assessment: A generalized criterion. Eng. Geol. 2018, 245, 72–80. [Google Scholar] [CrossRef]
- Carlà, T.; Farina, P.; Intrieri, E.; Botsialas, K.; Casagli, N. On the monitoring and early-warning of brittle slope failures in hard rock masses: Examples from an open-pit mine. Eng. Geol. 2017, 228, 71–81. [Google Scholar] [CrossRef]
- Poland, M.P.; Anderson, K.R. Partly cloudy with a chance of lava flows: Forecasting volcanic eruptions in the twenty-first century. J. Geophys. Res.-Solid Earth 2020, 125, e2018JB016974. [Google Scholar] [CrossRef]
- Ren, F.Q.; Zhu, C.; Karakus, M.; He, M.C. Rockburst mitigation mechanisms of pressure relief borehole and rock bolt support: Insights from granite true triaxial unloading rockburst tests. Eng Geol. 2024, 336, 107571. [Google Scholar] [CrossRef]
- Vu, C.C.; Amitrano, D.; Plé, O.; Weiss, J. Compressive failure as a critical transition: Experimental evidence and mapping onto the universality class of depinning. Phys. Rev. Lett. 2019, 122, 015502. [Google Scholar] [CrossRef]
- Yu, H.; Ng, K.; Grana, D.; Alvarado, V.; Kaszuba, J.; Campbell, E. A generalized power-law criterion for rocks based on Mohr failure theory. Int. J. Rock Mech. Min. Sci. 2020, 128, 104274. [Google Scholar] [CrossRef]
- Zhang, J.; Ren, F.; Ouyang, Z.; Liu, H. A Piecewise Yield Failure Criterion including the Critical State for Brittle Rock. Adv. Civ. Eng. 2020, 2020, 1612383. [Google Scholar] [CrossRef]
- Zhang, W.; Sun, X.; Yuan, W.; Liu, T.; Jin, S. Rock slope stability assessment based on the critical failure state curve for the generalized Hoek–Brown criterion. Environ. Earth Sci. 2024, 83, 168. [Google Scholar] [CrossRef]
- Liu, K.; Zhao, J. Progressive damage behaviours of triaxially confined rocks under multiple dynamic loads. Rock Mech. Rock Eng. 2021, 54, 3327–3358. [Google Scholar] [CrossRef]
- Yuan, Y.; Xu, T.; Heap, M.J.; Meredith, P.G.; Yang, T.; Zhou, G. A three-dimensional mesoscale model for progressive time-dependent deformation and fracturing of brittle rock with application to slope stability. Comput. Geotech. 2021, 135, 104160. [Google Scholar] [CrossRef]
- Zhang, X.; Li, Z.; Niu, Y.; Cheng, F.; Ali, M.; Bacha, S. An experimental study on the precursory characteristics of EP before sandstone failure based on critical slowing down. J. Appl. Geophys. 2019, 170, 103818. [Google Scholar] [CrossRef]
- Kong, X.; Wang, E.; Hu, S.; Li, Z.; Liu, X.; Fang, B.; Zhan, T. Critical slowing down on acoustic emission characteristics of coal containing methane. J. Nat. Gas Sci. Eng. 2015, 24, 156–165. [Google Scholar] [CrossRef]
- Chen, L.; Zhang, W.; Zheng, Y.; Gu, D.; Wang, L. Stability analysis and design charts for over-dip rock slope against bi-planar sliding. Eng. Geol. 2020, 275, 105732. [Google Scholar] [CrossRef]
- Fang, H.H.; Sang, S.X.; Liu, S.Q. Study of digital petrophysical analysis method based on micro-focus X-ray tomography: A case study from No.3 coal seam of Bofang mining area in southern Qinshui basin. Coal Geol. Expl. 2018, 46, 167–174. [Google Scholar]
- Vu, C.C.; Weiss, J.; Plé, O.; Amitrano, D.; Vandembroucq, D. Revisiting statistical size effects on compressive failure of heterogeneous materials, with a special focus on concrete. J. Mech. Phys. Solids 2018, 121, 47–70. [Google Scholar] [CrossRef]
- Sun, B.; Hou, S.; Xie, J.; Zeng, S. Failure prediction of two types of rocks based on acoustic emission characteristics. Adv. Civ. Eng. 2019, 2019, 5028489. [Google Scholar] [CrossRef]
- Volegov, P.S.; Gribov, D.S.; Trusov, P.V. Damage and fracture: Classical continuum theories. Phys. Mesomech. 2017, 20, 157–173. [Google Scholar] [CrossRef]
- Biswas, S.; Castellanos, D.F.; Zaiser, M. Prediction of creep failure time using machine learning. Sci. Rep. 2020, 10, 16910. [Google Scholar] [CrossRef]
- Jiang, X.; Liu, H.; Main, I.G.; Salje, E.K. Predicting mining collapse: Superjerks and the appearance of record-breaking events in coal as collapse precursors. Phys. Rev. E 2017, 96, 023004. [Google Scholar] [CrossRef] [PubMed]
- Ojala, I.O.; Main, I.G.; Ngwenya, B.T. Strain rate and temperature dependence of Omori law scaling constants of AE data: Implications for earthquake foreshock-aftershock sequences. Geophys. Res. Lett. 2004, 31, L20607. [Google Scholar] [CrossRef]
- Cartwright-Taylor, A.; Main, I.G.; Butler, I.B.; Fusseis, F.; Flynn, M.; King, A. Catastrophic failure: How and when? Insights from 4-D in situ X-ray microtomography. J. Geophys. Res. Solid Earth. 2020, 125, e2020JB019642. [Google Scholar] [CrossRef]
- Sornette, D. Critical Phenomena in Natural Sciences: Chaos, Fractals, Selforganization and Disorder: Concepts and Tools; Springer Science & Business Media: Berlin/Heidelberg, Germany, 2006. [Google Scholar]
Disclaimer/Publisher’s Note: The statements, opinions and data contained in all publications are solely those of the individual author(s) and contributor(s) and not of MDPI and/or the editor(s). MDPI and/or the editor(s) disclaim responsibility for any injury to people or property resulting from any ideas, methods, instructions or products referred to in the content. |
© 2025 by the authors. Licensee MDPI, Basel, Switzerland. This article is an open access article distributed under the terms and conditions of the Creative Commons Attribution (CC BY) license (https://creativecommons.org/licenses/by/4.0/).
