1. Introduction
Landslides represent a frequent natural hazard globally, endangering lives and infrastructure in mountainous and reservoir regions in particular [
1]. The Three Gorges Reservoir area exemplifies these challenges, where complex geological conditions and harsh environments trigger frequent landslides along the Yangtze River. In recent years, periodic water level fluctuations, extreme rainfall, and accelerated urbanization have further exacerbated the risk of landslides [
2]. Over the past decade, nearly 5000 landslides have been recorded in this region, including many highly destructive cases. Three key factors drive landslide proliferation: fragile geological structures, steep slopes, and intensive construction activities. These conditions promote slow-moving landslides that accumulate structural damage over time. Surface deformations during slope movements generate ground fissures and localized collapses. Such deformations escalate maintenance costs, while posing critical safety risks for residents. Effective landslide susceptibility mapping addresses these challenges by enabling proactive risk assessments. Advanced predictive modeling enhances early warning capabilities and supports targeted mitigation strategies, ultimately strengthening community resilience and guiding sustainable land-use planning.
Landslide susceptibility provides a critical framework for assessing regional landslide risks by synthesizing geological, topographic, and meteorological factors [
3,
4,
5,
6]. This probabilistic evaluation depends on a systematic analysis of the predisposing factors to predict landslide likelihood and spatial patterns [
7,
8,
9,
10,
11]. Three primary modeling approaches dominate current methodologies: statistical, physical, and machine learning models. Statistical models predict landslide occurrence probabilities based on historical data through statistical analysis [
12]. These models have been effectively demonstrated in regard to national and medium-scale assessments, using public datasets [
13,
14,
15]. Theoretical models, based on physical laws, simulate slope failure mechanisms through the use of mechanistic equations, achieving high precision in controlled scenarios, but requiring exhaustive geotechnical inputs that often prove impractical for regional applications [
16,
17,
18,
19]. Recent advances in data-driven machine learning techniques have revolutionized landslide prediction through the use of automated pattern recognition in high-dimensional datasets. For instance, Azarafza et al. (2021) [
20] and Nikoobakht et al. (2022) [
21] developed deep convolutional neural networks for mapping landslide susceptibility [
22]. They proposed a meta-learning approach that utilized Bayesian optimization for hyperparameter tuning, employing random forests as the predictive model. Additionally, Pradhan et al. (2023) [
23] introduced an ML-based explainable algorithm, SHapley Additive exPlanations, for landslide susceptibility modeling. Ensemble learning architectures enhance prediction reliability by strategically combining multiple models, with homogeneous and heterogeneous approaches offering distinct advantages for landslide susceptibility mapping [
24,
25]. Homogeneous ensembles (e.g., random forest, XGBoost, LightGBM, and CatBoost) employ collections of the same base algorithm, typically decision trees, to reduce variance through the use of parallel training with bootstrap aggregation (bagging) or gradient boosting [
26,
27]. While these methods excel at handling high-dimensional data and mitigating overfitting, they may exhibit limited adaptability when geological processes require fundamentally different algorithmic approaches. In contrast, heterogeneous ensembles (e.g., bagging, stacking) integrate diverse machine learning models to leverage their complementary strengths [
28,
29,
30]. Stacking, for instance, uses a meta-learner to optimally combine base model predictions, often improving performance in regard to complex, nonlinear landscapes. Despite these developments, critical gaps persist in understanding ensemble learning’s adaptability across varied geological contexts. This underscores the need for comprehensive investigations to optimize ensemble architectures for region-specific disaster risk assessments.
Landslide susceptibility modeling requires rigorous execution of three interdependent phases, namely data acquisition, predictor variable selection, and model development, all of which collectively determine prediction accuracy [
4,
31,
32]. Recent advances include explainable AI frameworks that integrate synthetic aperture radar time series, NDVI dynamics, and geoenvironmental parameters for enhanced landslide forecasting [
33]. Despite the progress made, critical methodological gaps persist. Current approaches frequently prioritize statistical collinearity analysis during variable selection, yet this focus inadequately addresses model performance optimization. Such oversights in regard to predictor selection propagate uncertainty during subsequent modeling stages, potentially omitting key geospatial parameters and compromising map reliability [
32]. Factor engineering emerges as a vital corrective strategy; a systematic framework for transforming raw data into optimized predictive features through creation, transformation, and strategic selection of relevant factors [
34,
35,
36]. While successfully applied in general machine learning domains to boost model efficiency, its implementation in geohazard prediction remains nascent. Advancing factor engineering methodologies specifically for landslide susceptibility analysis could substantially improve both prediction accuracy and operational efficiency, enabling more robust disaster mitigation frameworks.
This study introduces an integrated methodology, combining homogeneous and heterogeneous ensemble architectures with systematic factor engineering, for comprehensive landslide susceptibility assessments. The key innovations include: (1) the integration of advanced machine learning frameworks, including random forest, XGBoost, LightGBM, CatBoost, bagging, and stacking, to rigorously evaluate the relevant influencing factors through the use of multidimensional importance ranking; and (2) the utilization of factor engineering techniques to optimize model performance by identifying and prioritizing the most critical factors. The refined framework generates high-resolution susceptibility maps that improve spatial risk stratification, addressing critical gaps in regional landslide modeling, wherein previous efforts inadequately explored synergistic model combinations and factor engineering’s performance impacts.
2. Geological Background
2.1. Study Area
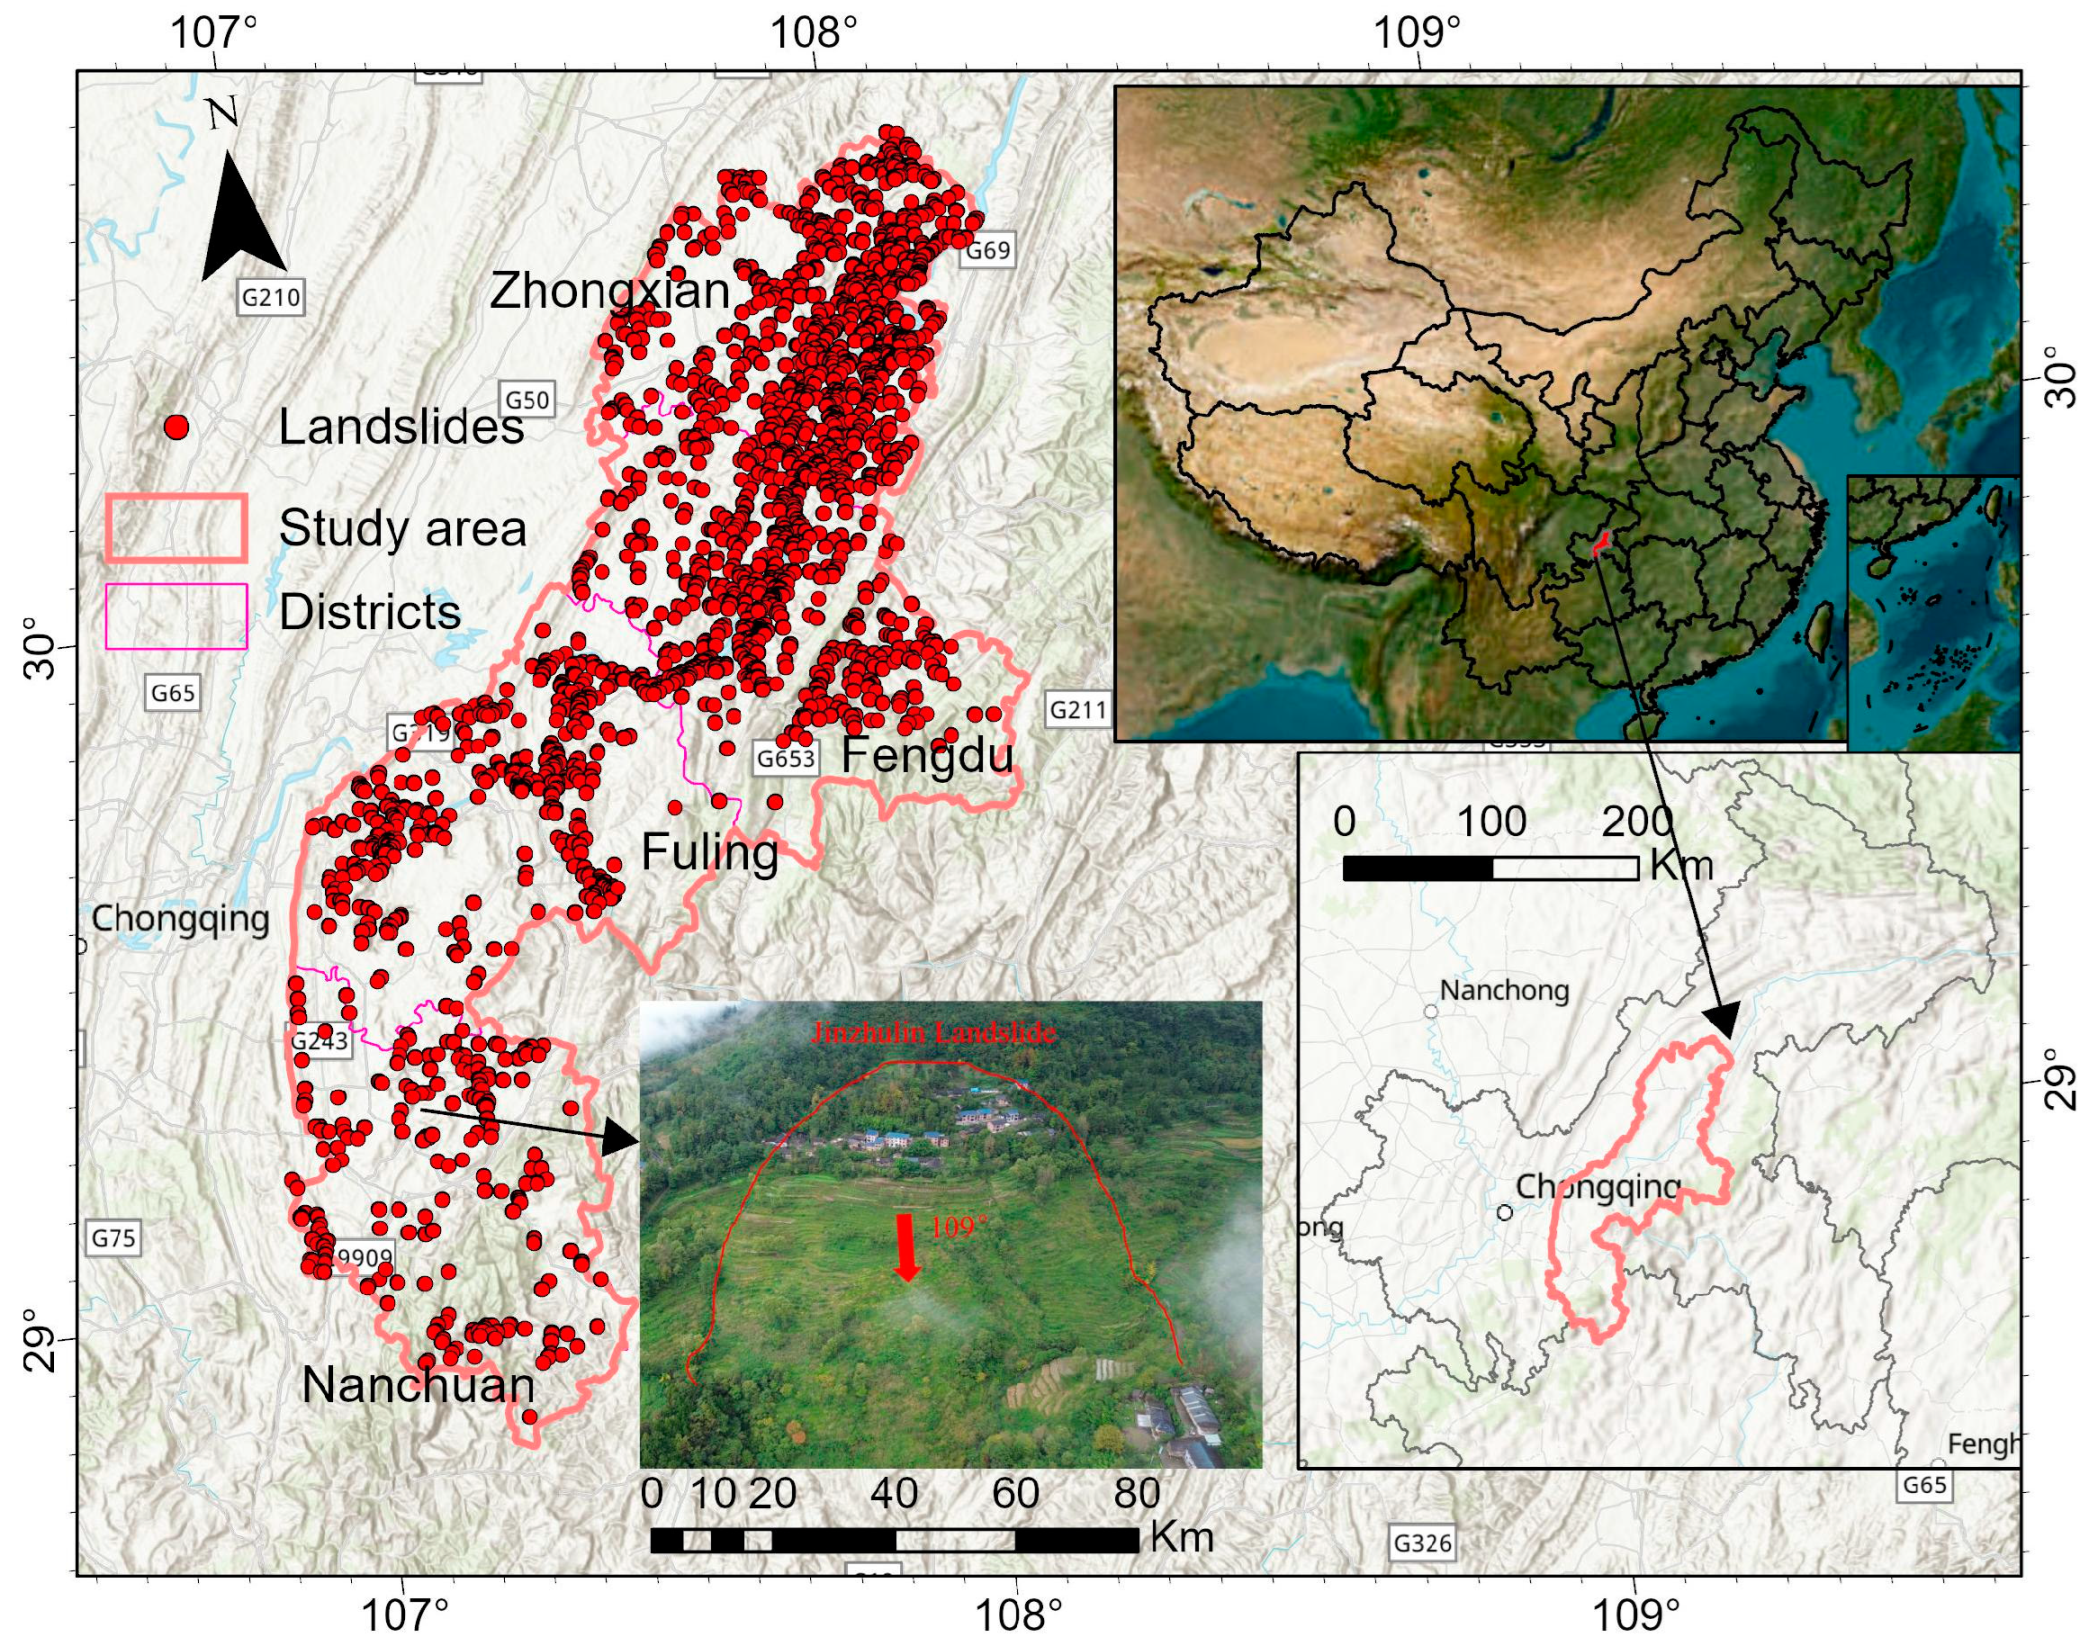
The research focuses on Chongqing’s southwestern region, within China’s Three Gorges Reservoir area (
Figure 1), spanning Fuling, Nanchuan, Zhongxian, and Fengdu districts. Positioned 172 km upstream from Chongqing’s urban core and 434 km from the Three Gorges Dam, the area straddles critical tectonic boundaries: the Sichuan basin’s fold belt to the northwest and the southeastern uplift zone, demarcated by Jinfoshan Mountain’s northern slope. The northwestern part belongs to the Sichuan Depression and the eastern Sichuan fold belt, while the southeastern part is part of the uplift fold of southeastern Sichuan. Geologically, the area is part of the Neo-Cathaysian tectonic system, with dominant orientations of NNE, NS, and NNW, as well as some arcuate structural lines. Stratigraphically, the area spans from the Cambrian of the Paleozoic to the Cretaceous of the Mesozoic, with notable gaps in the Devonian, Carboniferous, and parts of the Cretaceous. Quaternary sediments are sporadically distributed in river valleys, plains, and troughs. The Cambrian is characterized by dolomite and dolomitic limestone, the Ordovician by clastic and cracked limestone, the Silurian by limestone, the Permian by gray-to-black aluminous shale and carbonaceous shale, the Triassic by interbedded limestone, sandstone, and siltstone, and the Jurassic by brown–purple sandstone and shale. Tertiary strata are absent in the Cenozoic, while Quaternary lithology consists primarily of accumulation layers. Elevations here exceed 1400 m, presenting a deeply dissected mid-mountain landscape. The northwestern part is lower, displaying the “red layer” geomorphology of eastern Sichuan, with elevations generally between 500 and 1100 m, forming a shallow-cut low mountain landscape. Along the Chuanxiang Highway, the terrain consists of low mountains and trough basins, with elevations ranging from 500 to 800 m. The highest point in the study area is Fengchuiling of Jinfo Mountain at 2238 m, while the lowest point is Yutiaoyan in Qilong Township at 340 m, resulting in a relative height difference of 1898 m. Mid-mountains and low mountains dominate the topography, covering 50.71% and 48.07% of the area, respectively, with hills accounting for only 1.22%.
The area experiences a subtropical monsoon climate, influenced by the westerlies, the Western Pacific Subtropical High, the Southwest Vortex, and the Tibetan High. Winter is dominated by northerly airflows, while summer is influenced by the southerly monsoon, with the Pacific Subtropical High often extending westward. This results in distinct seasons, significant dry and wet periods, warm winters, hot summers, ample rainfall, and a long frost-free period. Temperatures decrease and precipitation increases from northwest to southeast, forming a distinct vertical climate. The average annual temperature is 18.1 °C, with an average annual precipitation of 1185 mm. In 2023, the annual precipitation reached 1380.8 mm, a 38.0% increase from the previous year. The study area is part of the Yangtze River basin, with abundant water resources and a well-developed hydrological network. The Yangtze River flows northwest to northeast through the area, forming an irregular “W” shape, and is supplied by primary, secondary, and tertiary rivers, as well as seasonal streams. Secondary tributaries are primarily mid-mountain and high-hill water systems, with relatively gentle gradients. The Yangtze River within the study area is approximately 134 km long, with a perennial flow rate of about 13,357 cubic meters per second. The Three Gorges Reservoir causes water levels to fluctuate between a maximum of 175 m and a minimum of 145 m, with variations in the upstream flow during dry and wet periods directly impacting reservoir regulation. These changes are a significant factor in the reactivation and deformation of water-related landslides.
2.2. Landslide Inventory and Influencing Factors
A detailed and accurate landslide inventory is essential for conducting landslide susceptibility mapping. First, it provides comprehensive spatio-temporal information about historical landslide events, enhancing the accuracy of regional historical data. This enables researchers to better understand landslide patterns, characteristics, and frequency, as well as their triggering factors, laying a solid foundation for regional landslide risk assessments. Second, landslide inventory data are fundamental for constructing susceptibility and prediction models. By analyzing historical data, researchers can identify the spatial distribution characteristics of landslides, develop precise susceptibility models, and improve the accuracy and reliability of landslide predictions. Finally, an accurate landslide inventory plays a key role in guiding mitigation measures.
Through systematic data collection and field surveys, this study established a comprehensive landslide inventory for the period 1968–2022, documenting 2028 historical events within the study area. The temporal analysis reveals a marked increase in landslide frequency between 1998 and 2010 (
Figure 2a), closely associated with the Three Gorges Reservoir impoundment project. Following the reservoir’s initial filling in 2003, accelerated water-level fluctuations induced substantial alterations to the bank stress distributions and hydrodynamic conditions, precipitating widespread slope failures. As shown in
Figure 2b, the majority of landslides cover an area of 0 to 50 × 104 m
2, while a small proportion exceeds 100 × 10
4 m
2. Regarding landslide volume, most landslides range from 0 to 500 × 10
4 m
3, with a few outliers reaching over 1000 × 10
4 m
3, and some even surpassing 1500 × 10
4 m
3 (
Figure 2c), highlighting the massive scale and high risks posed by these events. The primary triggering factors identified include rainfall and fluctuations in reservoir water levels, along with substantial contributions from human activities, such as artificial slope cutting and loading.
In regard to landslide susceptibility modeling, the selection and comprehensive analysis of influencing factors are critical in regard to the accuracy and effectiveness of the model. These factors encompass various dimensions, including topography, geology, hydrology, soil characteristics, vegetation cover, and human activities, each offering distinct contributions to the preconditioning of slope instability. By offering detailed descriptions of the geographical and environmental conditions, these factors help researchers identify and quantify the key factors that influence slope failure. Integrating multi-source data into landslide susceptibility models enables the simulation and prediction of landslide probabilities within specific regions.
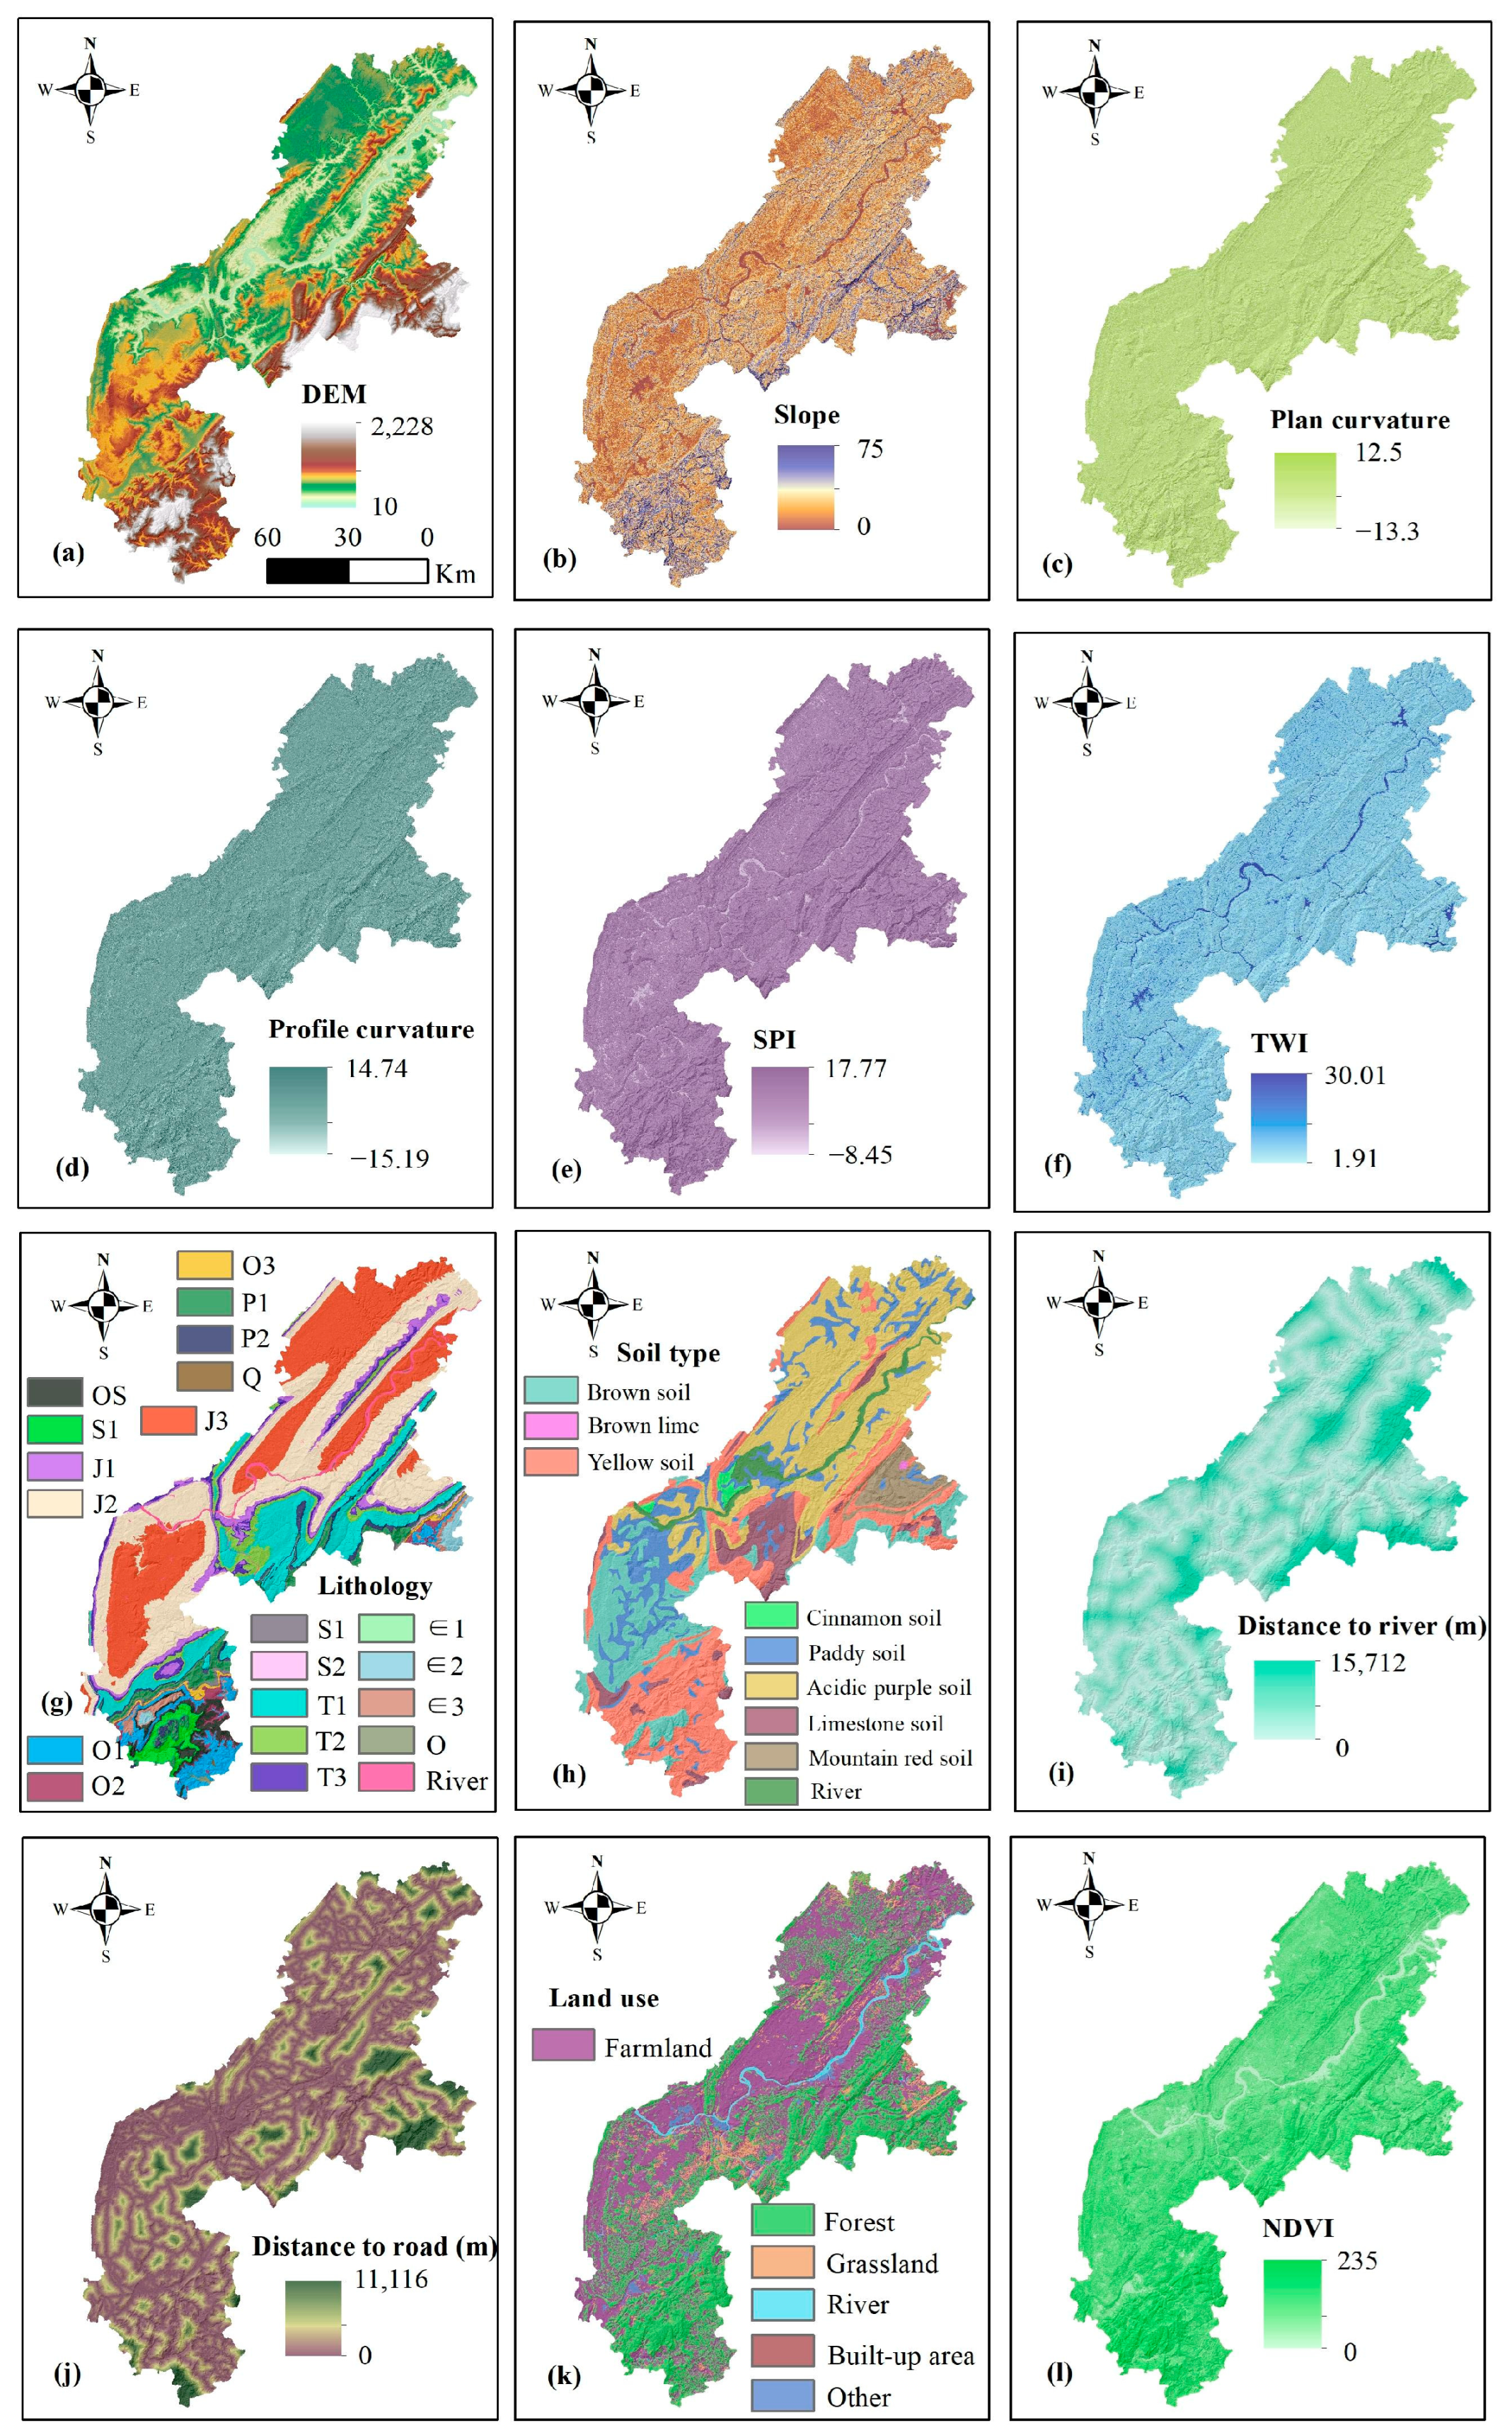
Based on literature reviews [
37,
38,
39] and data availability, this study considers the DEM, slope, plan curvature, profile curvature, the Stream Power Index (SPI), the Topographic Wetness Index (TWI), lithology, soil type, distance to the road, distance to the river, land use, and the Normalized Difference Vegetation Index (NDVI) (
Figure 3). The DEM, slope, plan curvature, and profile curvature data are derived from the ALOS Digital Elevation Model, provided by the Alaska Satellite Facility, with a spatial resolution of 12.5 m, in raster format (
Table 1).
The DEM serves as a fundamental topographic parameter in landslide analysis, governing precipitation accumulation and surface water flow dynamics. Slope, a key factor of mechanical stability, directly correlates with landslide risk; steeper slopes generally exhibit higher susceptibility. The plan curvature and profile curvature describe terrain concavity/convexity, influencing water flow convergence, sediment distribution, and surface erosion processes, all critical to landslide initiation. The Topographic Wetness Index, derived from DEM data using ArcGIS 10.6, quantifies localized soil moisture; elevated TWI values suggest higher saturation and, thus, greater landslide likelihood. The Stream Power Index reflects runoff erosive potential, indicating how precipitation and overland flows contribute to slope destabilization. The lithological data are derived from a 1:50,000 scale geological map, provided by local natural resource departments, in vector format. Lithology forms the geological foundation for landslide occurrences, as the mechanical properties and weathering characteristics of different lithological materials significantly affect slope stability. For instance, clay-rich rocks are more susceptible to landslides when saturated, while sandstone and limestone can also be vulnerable under heavy rainfall or seismic activity. The soil type data are obtained from the 1:1,000,000 scale Soil Map of China, compiled by the Nanjing Institute of Soil Research, Chinese Academy of Sciences, in vector format. The soil type directly influences landslide occurrences, with variations in permeability, water retention, and shear strength affecting soil stability. The distances to the road and the river are calculated using the Euclidean distance tool in ArcGIS and formatted as raster data. Road construction can disrupt the natural stability of the surface, increasing the risk of landslides. River erosion, on the other hand, can weaken slope support and trigger landslides. By calculating these distances, we can assess the potential impact of human activities and natural water systems on landslides. The Normalized Difference Vegetation Index (NDVI) is derived from Landsat 8 TM imagery, processed using ENVI 5.3 software, formatted as raster data. The NDVI reflects the surface vegetation cover, which plays a vital role in stabilizing soil, reducing rainfall-induced soil erosion, and surface runoff, thus lowering the risk of landslides. The land use data are sourced from the Land Use Map, based on 2020 Landsat 8 imagery, produced by the Resource and Environmental Science Data Center (RESDC) of the Chinese Academy of Sciences, formatted as raster data. Land use reflects different patterns of human activity and land use, each influencing landslide risk differently. For instance, farmland, built-up land, and forest land have varying landslide risks. Agricultural and built-up land may see reduced surface stability due to human activities, whereas forest land, with better vegetation cover, generally has lower landslide risk.
3. Methodology
A comprehensive methodological framework was adopted to enhance the accuracy and robustness of the landslide susceptibility modeling (
Figure 4). The process began with the meticulous collection and processing of data from various sources, including topographic, geological, hydrological, soil, and human activity-related factors. Next, both homogeneous ensemble models (random forest, XGBoost, LightGBM, and CatBoost) and heterogeneous ensemble models (bagging and stacking) were employed to evaluate and rank the importance of the influencing factors. This analysis involved the in-depth optimization of model performance, with critical influencing factors identified through the use of targeted feature engineering techniques. The predictive performance of the models was validated using Receiver Operating Characteristic (ROC) analysis, followed by iterative optimization through the removal of less significant factors. Finally, the optimized models were validated using ROC curves and statistical analysis, resulting in the creation of a detailed landslide susceptibility distribution map. This map delineates areas of high, medium, low, and extremely low susceptibility, providing a solid scientific foundation for developing landslide risk management and prevention strategies.
3.1. Random Forest
Random forests, established by Leo Breiman [
40], are an ensemble method that utilizes decision trees. This algorithm involves randomly sampling both instances and features from the original dataset to construct multiple decision trees, each trained on a random subset of the data. This dual randomness in selecting samples and features distinguishes random forests from traditional decision tree methods. The approach assumes that: (1) the bootstrap samples accurately represent the data distribution, (2) feature collinearity does not significantly distort the importance scores, and (3) the majority of trees capture meaningful signals rather than noise. Random forests are particularly effective for high-dimensional datasets, allowing for classification without the need for dimensionality reduction. After training, the model calculates the factor importance to assess each factor’s contribution to the predictions, helping to identify the most influential variables. Despite their high accuracy and robustness, a notable limitation of random forests is their interpretability. The complexity of visualizing and interpreting the combined results of hundreds or thousands of decision trees makes them less straightforward than single decision trees.
3.2. XGBoost
XGBoost (eXtreme Gradient Boosting) is an optimized gradient boosting algorithm that extends traditional gradient boosting decision trees (GBDTs). Designed to handle large-scale and high-dimensional data, XGBoost iteratively adds decision trees to correct the residuals of previous models and minimizes the loss function by incorporating regularization terms during each tree construction. This method assumes that additive tree structures can effectively approximate complex patterns, while regularization terms (L1/L2) suppress irrelevant features, reducing overfitting and improving the generalization ability. XGBoost excels in regard to binary classification, multi-class classification, and multi-label classification tasks, providing both class labels and probability predictions for each class. Its key advantages include the incorporation of L1 and L2 regularization to mitigate overfitting, parallel processing for efficient tree construction, and it has a built-in mechanism to handle missing values. Additionally, XGBoost employs pruning techniques to prevent overfitting and integrates cross-validation functionality to automatically determine the optimal number of iterations, significantly streamlining the model selection and tuning process.
3.3. LightGBM
LightGBM (Light Gradient Boosting Machine), developed by Ke et al. (2017) [
41], is an efficient gradient boosting framework, designed to handle large-scale data. Known for its exceptional processing speed and low memory usage, LightGBM is widely used in data science competitions and commercial applications. Building on the decision tree algorithm, LightGBM enhances efficiency and reduces memory consumption compared to frameworks like XGBoost through two key innovations. First, LightGBM employs a histogram-based decision tree algorithm, which converts continuous feature values into discrete bins, assuming that discretization preserves sufficient predictive information. Second, it utilizes a leaf-wise growth strategy with depth constraints, prioritizing the splitting of leaves with the highest gain to accelerate error reduction. This strategy assumes that local greedy splits accumulate to approximate global optima. For classification tasks, LightGBM efficiently handles both binary and multi-class problems by iteratively optimizing decision trees to minimize prediction errors. Particularly in big data environments, its rapid training capability and low memory requirements make it ideal for resource-constrained settings, while maintaining high-performance processing of large datasets.
3.4. CatBoost
CatBoost (Categorical Boosting) is a gradient boosting decision tree algorithm specifically designed to handle categorical factors effectively. It operates under three key assumptions: (1) categorical features exhibit stable target statistics, (2) ordered boosting mitigates target leakage in sequential data, and (3) symmetric trees balance computational efficiency and overfitting. These features give CatBoost a distinct advantage in tasks involving large amounts of categorical data. As an open-source machine learning library, CatBoost simplifies practical applications by directly processing datasets with categorical factors, eliminating the need for cumbersome preprocessing. To enhance performance and model accuracy, CatBoost employs several strategies. First, it uses a symmetric tree structure, where all the nodes at each level split based on the same factor. This approach accelerates training, while reducing overfitting. Second, CatBoost introduces an ordered boosting strategy, which calculates residuals for each sample using data unseen by the previous model, effectively preventing target leakage and ensuring unbiased model evaluation. Another core feature of CatBoost is its automatic handling of categorical factors. It uses a unique encoding mechanism to process categorical data, preserving the integrity of categorical information, while mitigating overfitting caused by high cardinality. CatBoost excels in regard to binary and multi-class classification tasks, demonstrating efficient and accurate performance. Notably, it can directly handle categorical data in string format without requiring one-hot encoding, offering significant convenience and efficiency in data science applications.
3.5. Heterogeneous Ensemble Strategy
This study evaluates four homogeneous ensemble models, random forest, XGBoost, LightGBM, and CatBoost, each employing distinct modeling strategies that result in unique decision boundaries. As shown in
Figure 5, random forest exhibits relatively smooth decision boundaries with clear separation lines, indicating stable performance across most regions, although occasional misclassifications may occur. XGBoost demonstrates smoother decision boundaries and superior classification performance, particularly in densely populated data regions; however, it may overfit in sparse data areas. LightGBM, characterized by more complex decision boundaries, showcases high flexibility and sensitivity to detail, enabling the capture of intricate patterns, but also increasing susceptibility to overfitting at boundaries. CatBoost’s decision boundaries resemble those of XGBoost, showing stable performance in dense regions, while effectively avoiding overfitting in sparse areas. Given the unique strengths and limitations of each model, this study proposes a heterogeneous ensemble approach. By integrating the predictions from these models, the goal is to construct an ensemble with overall superior performance. This approach is expected to deliver more accurate and robust classification results across varying data distribution conditions, combining the individual advantages of each model, while mitigating their weaknesses.
Bagging, short for bootstrap aggregating, is an ensemble learning technique, designed to enhance predictive performance by reducing model variance. The core idea of bagging is to generate multiple subsets from the original dataset through random sampling with replacement, to train a base model on each subset, and combine their predictions using averaging (for regression tasks) or voting (for classification tasks). This process aims to improve the stability and accuracy of predictions by mitigating overfitting and enhancing generalization. In this study, a bagging strategy is employed to integrate the random forest, XGBoost, LightGBM, and CatBoost models, leveraging the strengths of each to enhance classification accuracy and stability. A soft voting strategy is utilized to make the final decision in classification tasks by combining the predicted probabilities from multiple base classifiers. In regard to soft voting, each classifier outputs a probability distribution reflecting the likelihood of a sample belonging to each class. These distributions are then weighted and averaged, typically with equal weights, although adjustments can be made based on individual classifier performance. The class with the highest combined probability is selected as the final prediction. The advantage of soft voting lies in its ability to utilize the full predictive probability information from each classifier, rather than relying solely on hard classification results. This approach not only improves classification accuracy and stability, but also generates smoother decision boundaries, making it particularly effective for handling complex classification problems.
Stacking, a sophisticated ensemble learning technique, aims to construct a more effective final model by integrating the predictions of multiple diverse base models. This method employs a “meta-learner” or “second-level learner” to aggregate the predictions from various base models, creating a novel strategy that has been widely adopted in predictive tasks, particularly in competitions and complex problem-solving scenarios. The core mechanism of stacking involves using the predictions from each base model as new inputs, referred to as meta-factors, which are then analyzed by a meta-learner to produce the final prediction. The base models can include a variety of machine learning algorithms, such as random forest, XGBoost, LightGBM, CatBoost, and neural networks. The diversity of these models is a critical factor in enhancing the effectiveness of stacking, as it allows the meta-learner to capture complementary patterns and improve the overall predictive performance. In regard to the implementation of heterogeneous ensemble stacking, multiple base learners are first trained on the original training data. These base models can be of the same or different types, depending on the problem and dataset. Next, the trained base models are used to generate predictions, based on either the original training data or an independent validation set. These predictions are then treated as meta-factors and used to train the meta-learner, which learns the optimal way to combine the base model outputs. In practical applications, all base models make predictions based on new data, and these predictions are fed into the meta-learner to produce the final prediction. This approach effectively combines the strengths of multiple models, aiming to achieve higher predictive accuracy and better generalization capability.
3.6. Factor Engineering
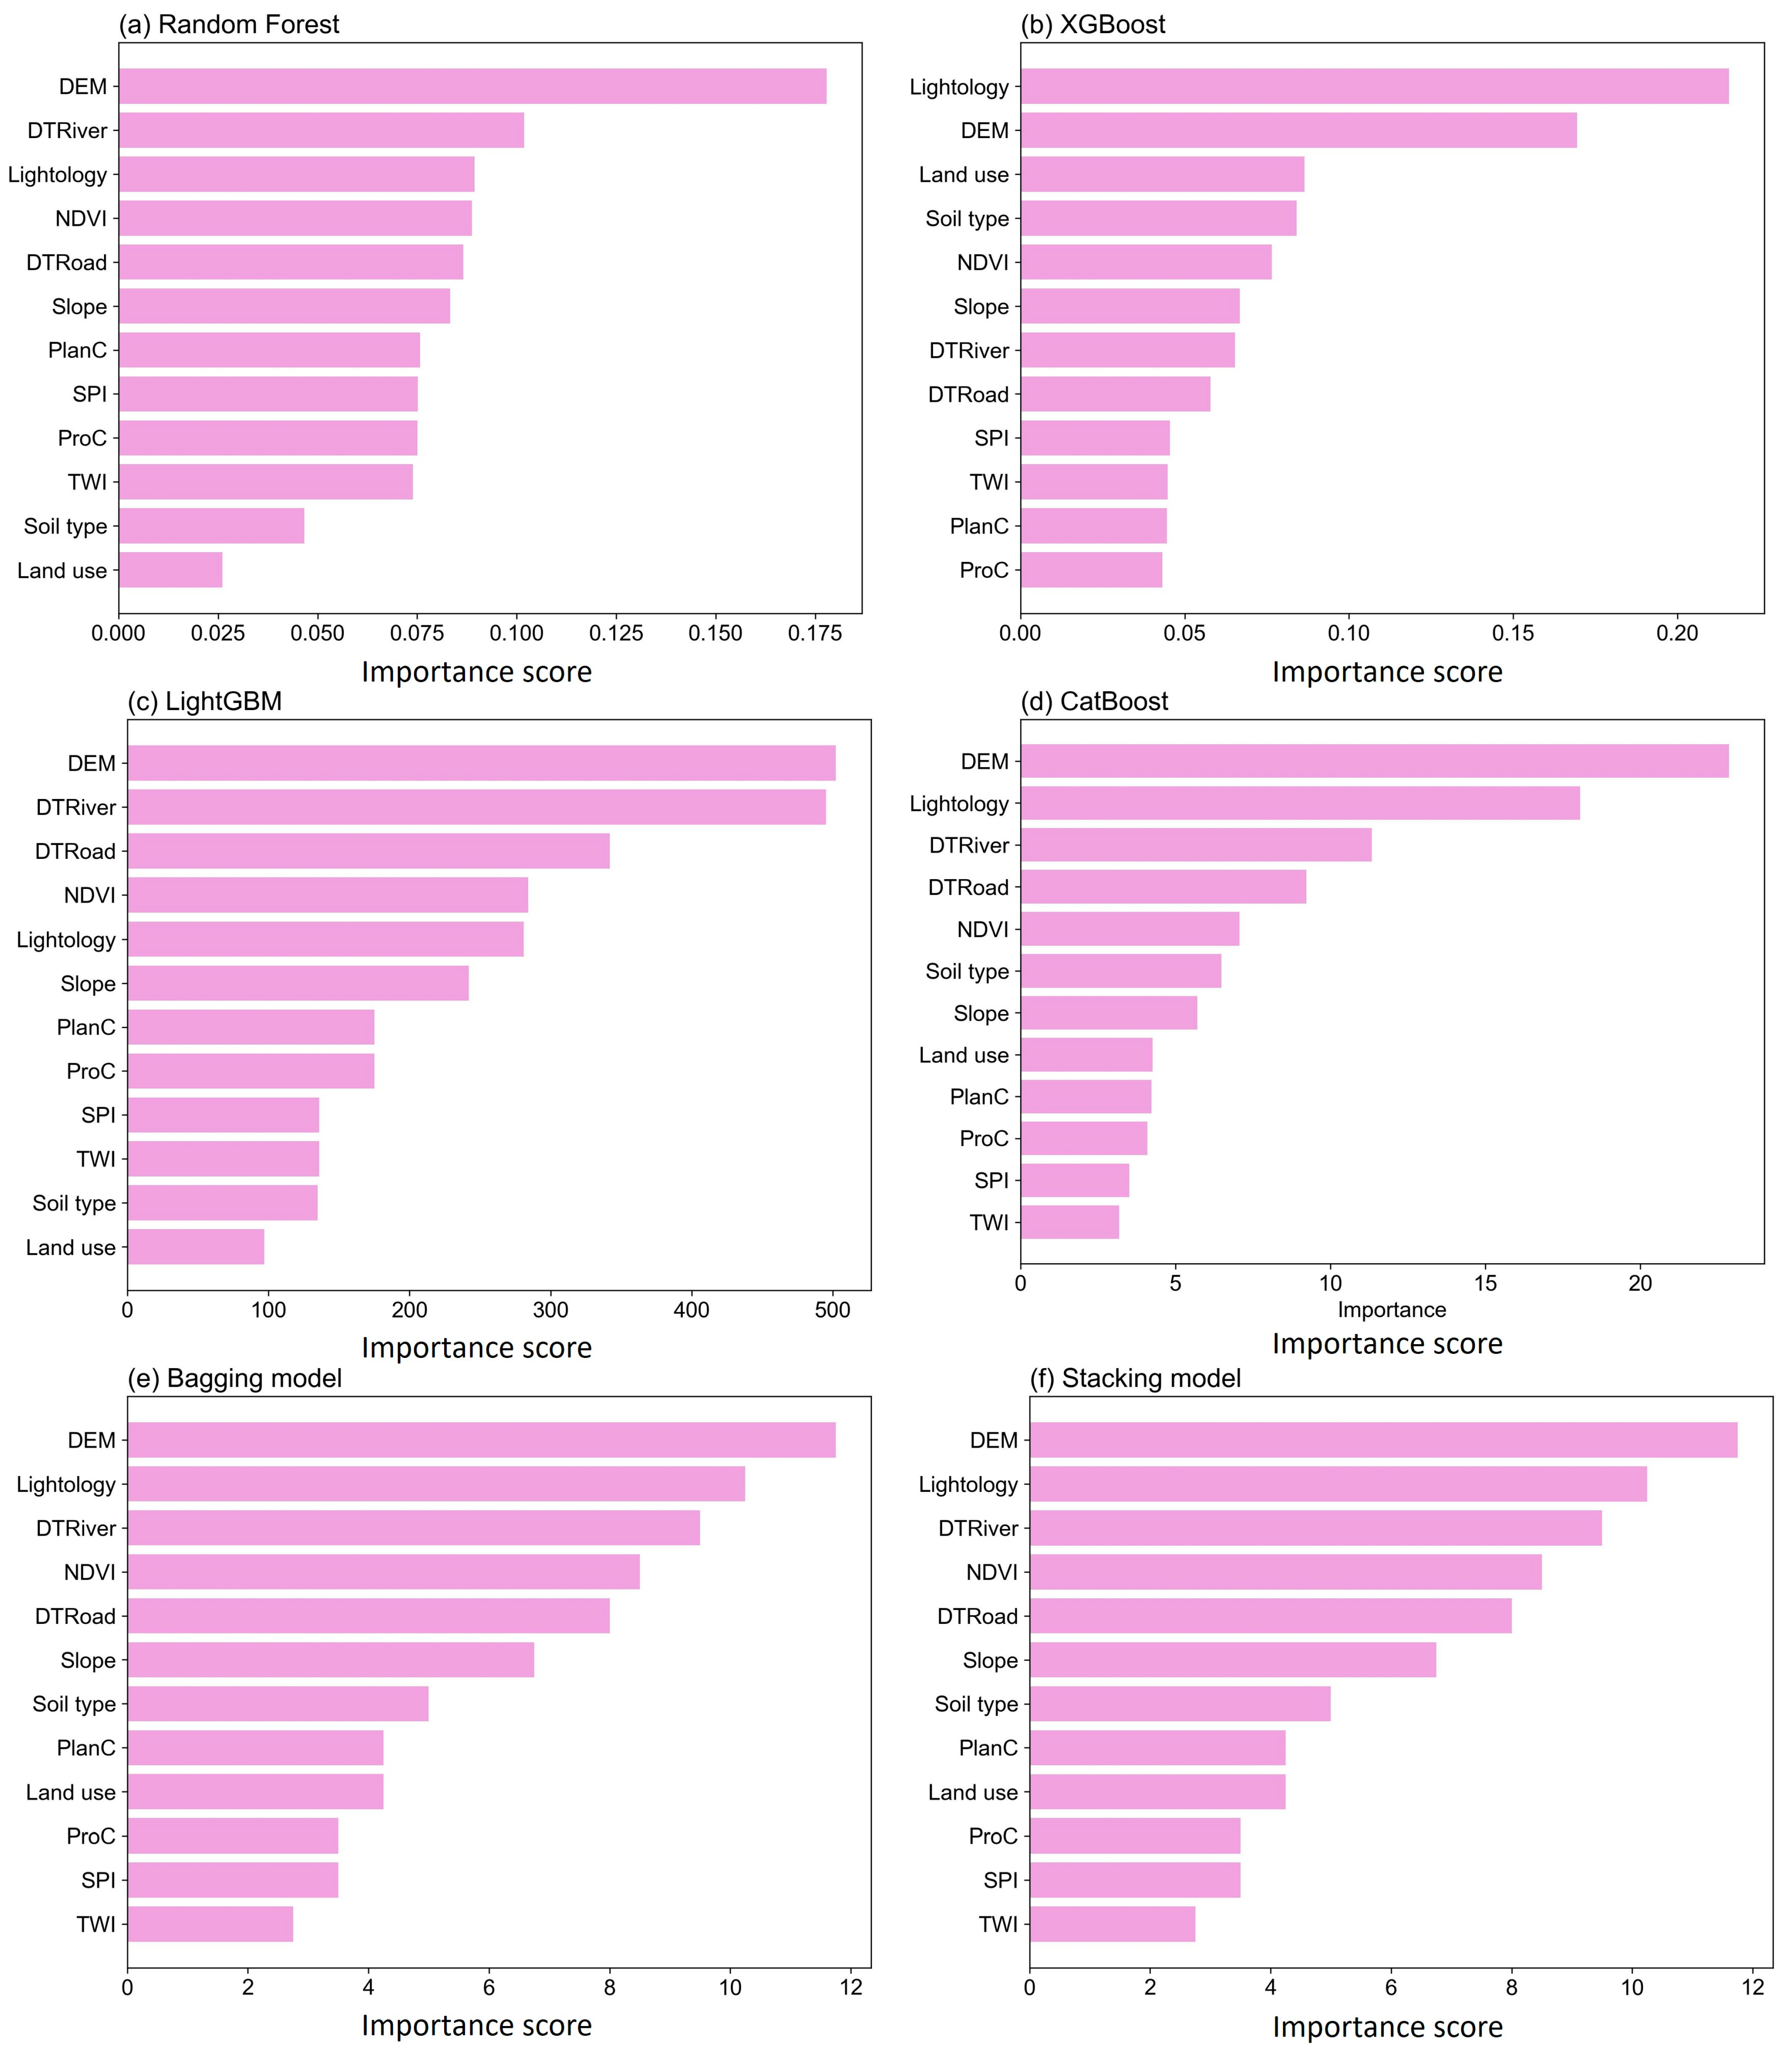
Factor engineering is a critical preprocessing step in data science and machine learning, involving the creation, selection, and transformation of factors from raw data to build more efficient and accurate predictive models. The primary goal of factor engineering is to maximize the utilization of information in the dataset, enhance model performance, simplify the model structure, and expedite training processes. In this study, a comprehensive factor engineering strategy was adopted, leveraging advanced ensemble learning models to evaluate and rank the importance of all the potential influencing factors.
This study departs from traditional factor collinearity detection methods, focusing instead on examining the performance of influencing factors across various ensemble learning models. Specifically, it explores the strategies employed by random forest, XGBoost, LightGBM, and CatBoost in evaluating and ranking factor importance. Random forest assesses factor importance by analyzing the purity gain contributed by each factor during decision tree node splits. This process typically uses Gini impurity or entropy as metrics, calculating the reduction in model error associated with each factor. The number of splits involving each factor across all the trees and the average purity gain they provide are accumulated to form a comprehensive factor importance score. XGBoost uses “gain” as its primary evaluation metric, quantifying the improvement in model performance contributed by each factor when making splits. This is specifically represented by the average reduction in the loss function following a split. Similarly, LightGBM also relies on gain to determine factor importance, but its calculation method differs slightly due to the incorporation of Gradient-based One-Side Sampling (GOSS) and Exclusive Feature Bundling (EFB) techniques, which focus on evaluating the total gain in performance improvement from each factor during splits. CatBoost employs a method similar to the aforementioned models, assessing factor importance based on the performance improvement each factor brings during splits. Additionally, it considers the frequency of factor usage across different trees to evaluate the overall contribution of each factor, thereby determining its importance ranking.
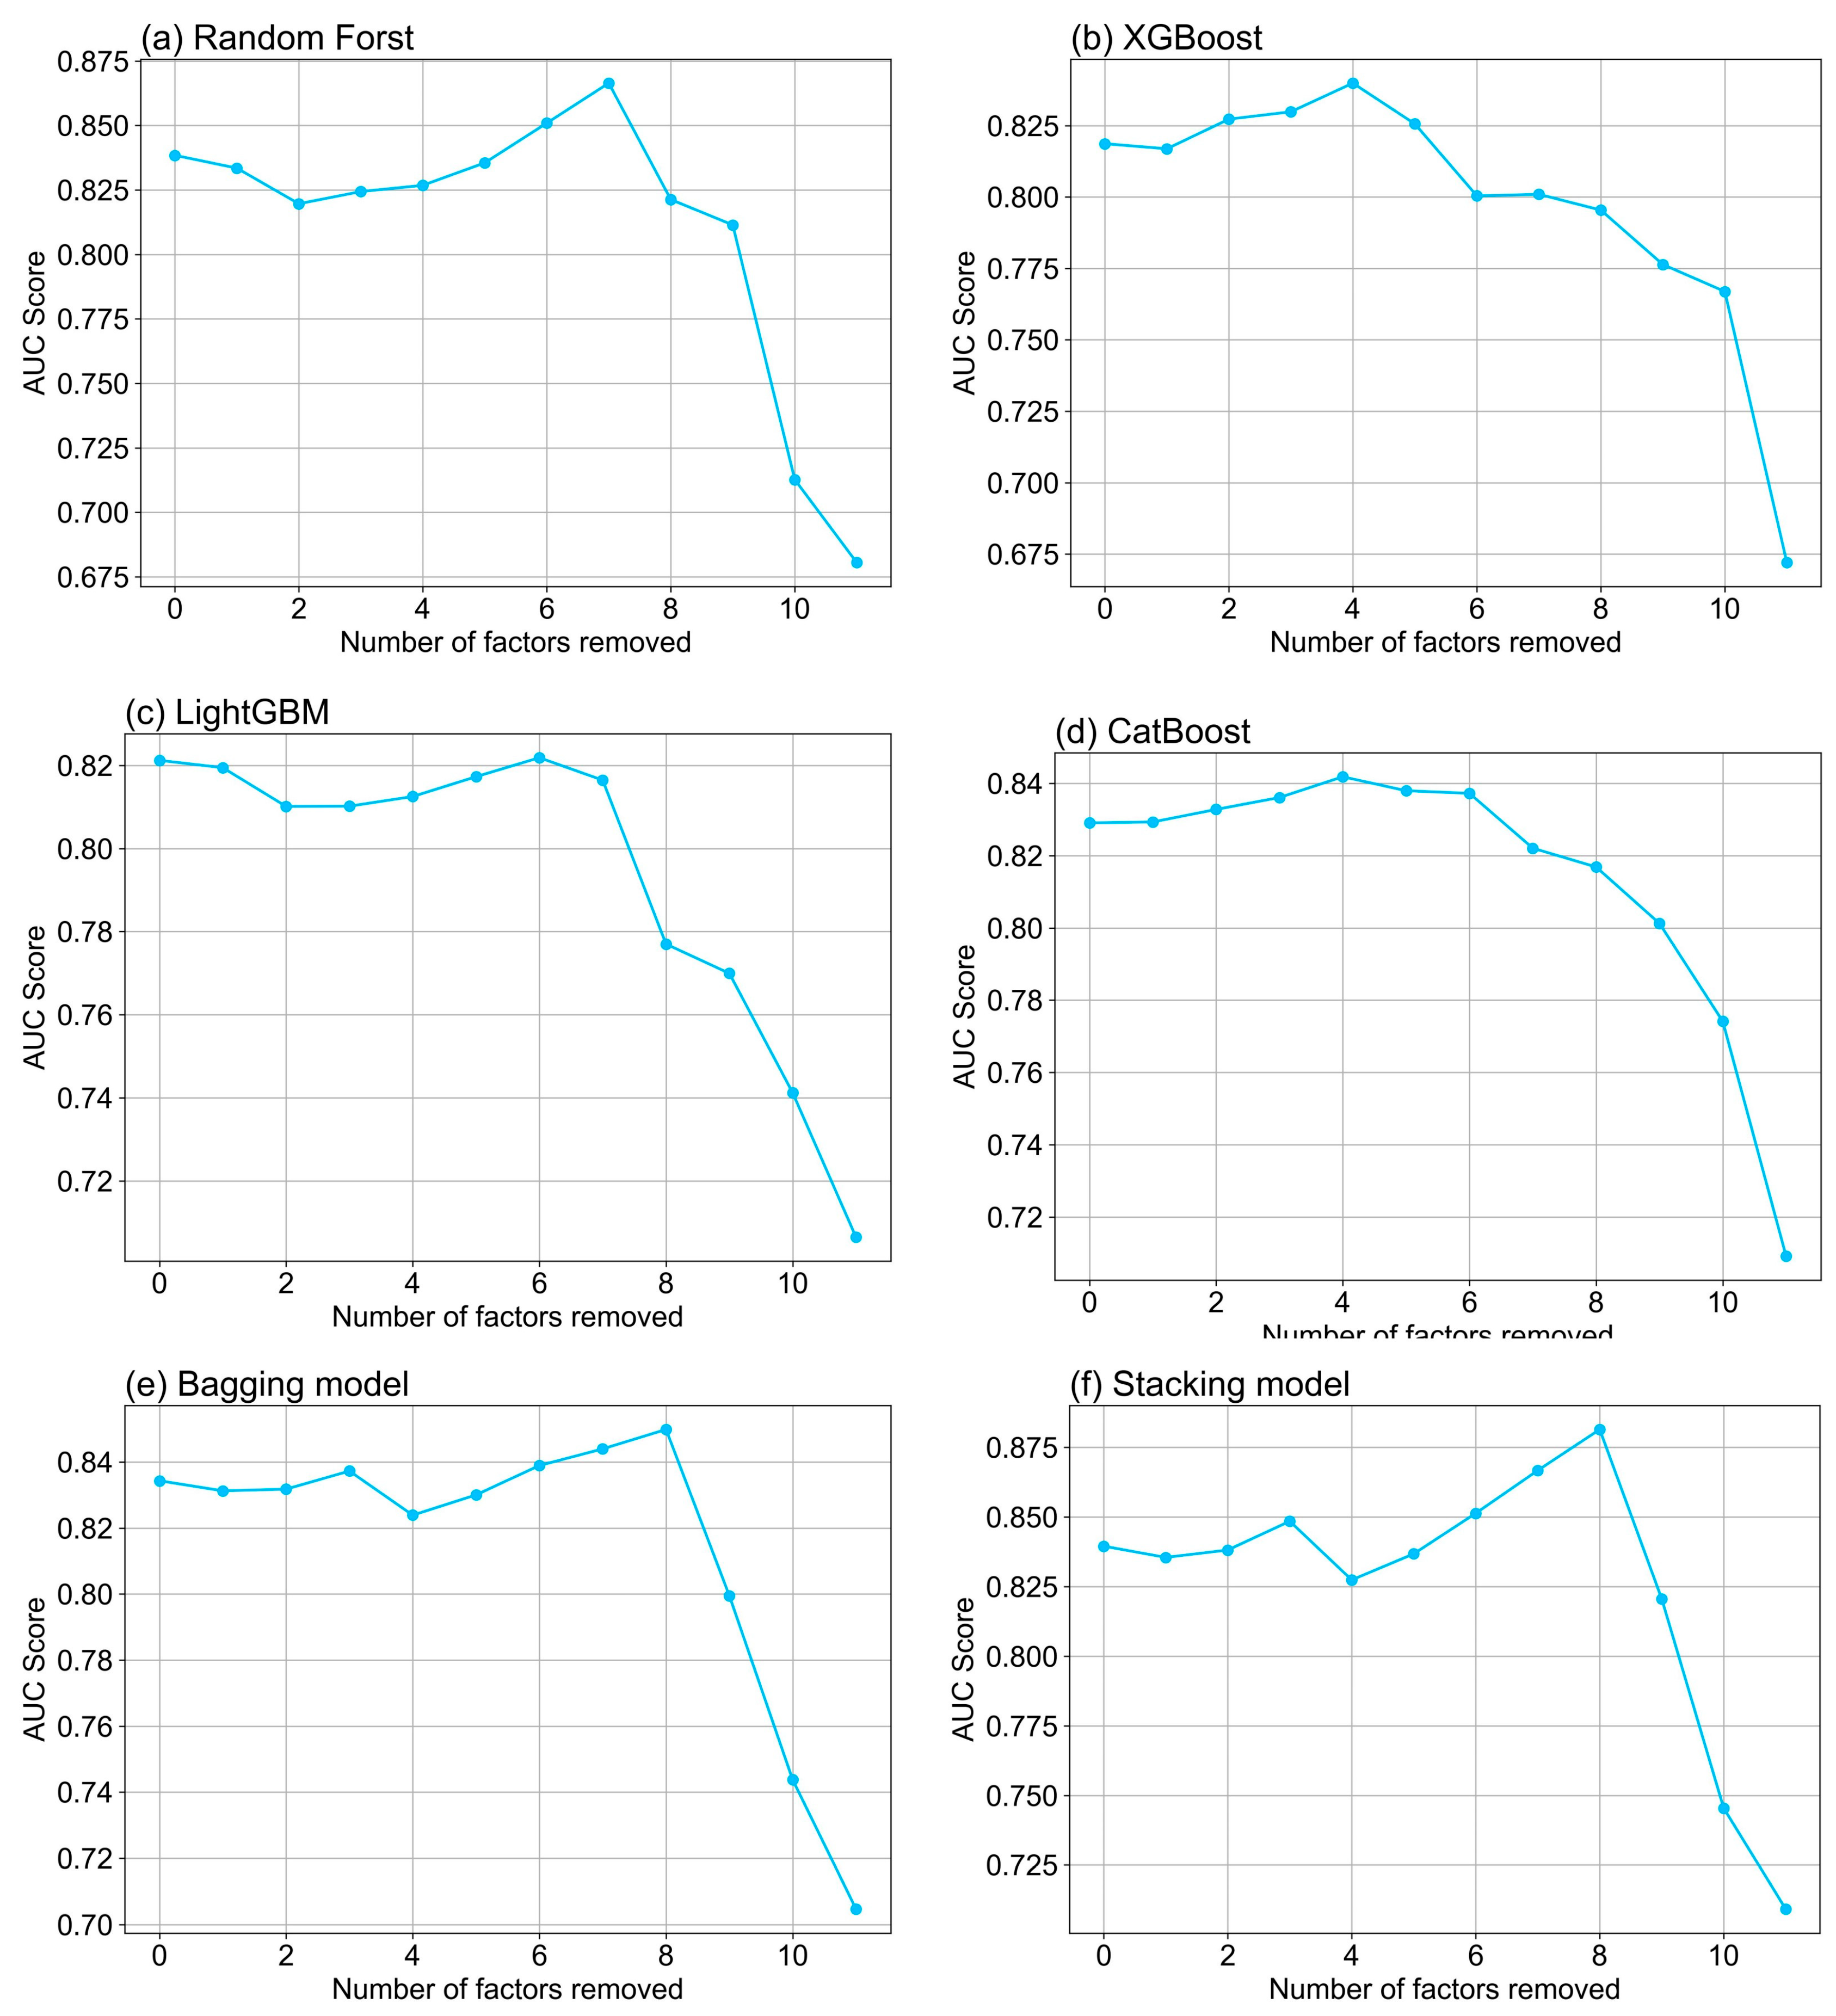
Based on the evaluation mechanisms of different models, the specific implementation steps of factor engineering in this study are as follows: (1) The dataset was independently trained using models such as random forest, XGBoost, LightGBM, CatBoost, bagging, and stacking. Each model provided factor importance scores, indicating the contribution of each factor to the prediction task. (2) By integrating the importance scores from each model, a consolidated factor importance list was created using either the average scores or more complex statistical methods. (3) Based on the importance list, the least significant factors were gradually eliminated, with the model retrained after each removal to assess its impact on prediction accuracy. (4) Model performance was compared before and after factor removal to analyze which eliminations significantly affected the outcomes. This step helps identify and exclude factors with minimal impact, simplifying the model and potentially improving efficiency. (5) A subset of factors that minimally impacted the prediction accuracy, while retaining those critical to model performance, was selected. This approach optimized the factor set, enhanced the model’s generalization capability, and improved prediction accuracy. By employing this systematic factor engineering method, machine learning models were constructed that were both efficient and accurate, demonstrating the critical role of factor engineering in improving predictive performance.
3.7. Accuracy Test
In landslide susceptibility modeling, imbalanced datasets are common, with significantly fewer landslide (positive class) samples than non-landslide (negative class) samples. The ROC curve evaluates model performance across thresholds by plotting the True Positive Rate (TPR) against the False Positive Rate (FPR). The TPR and FPR are defined as:
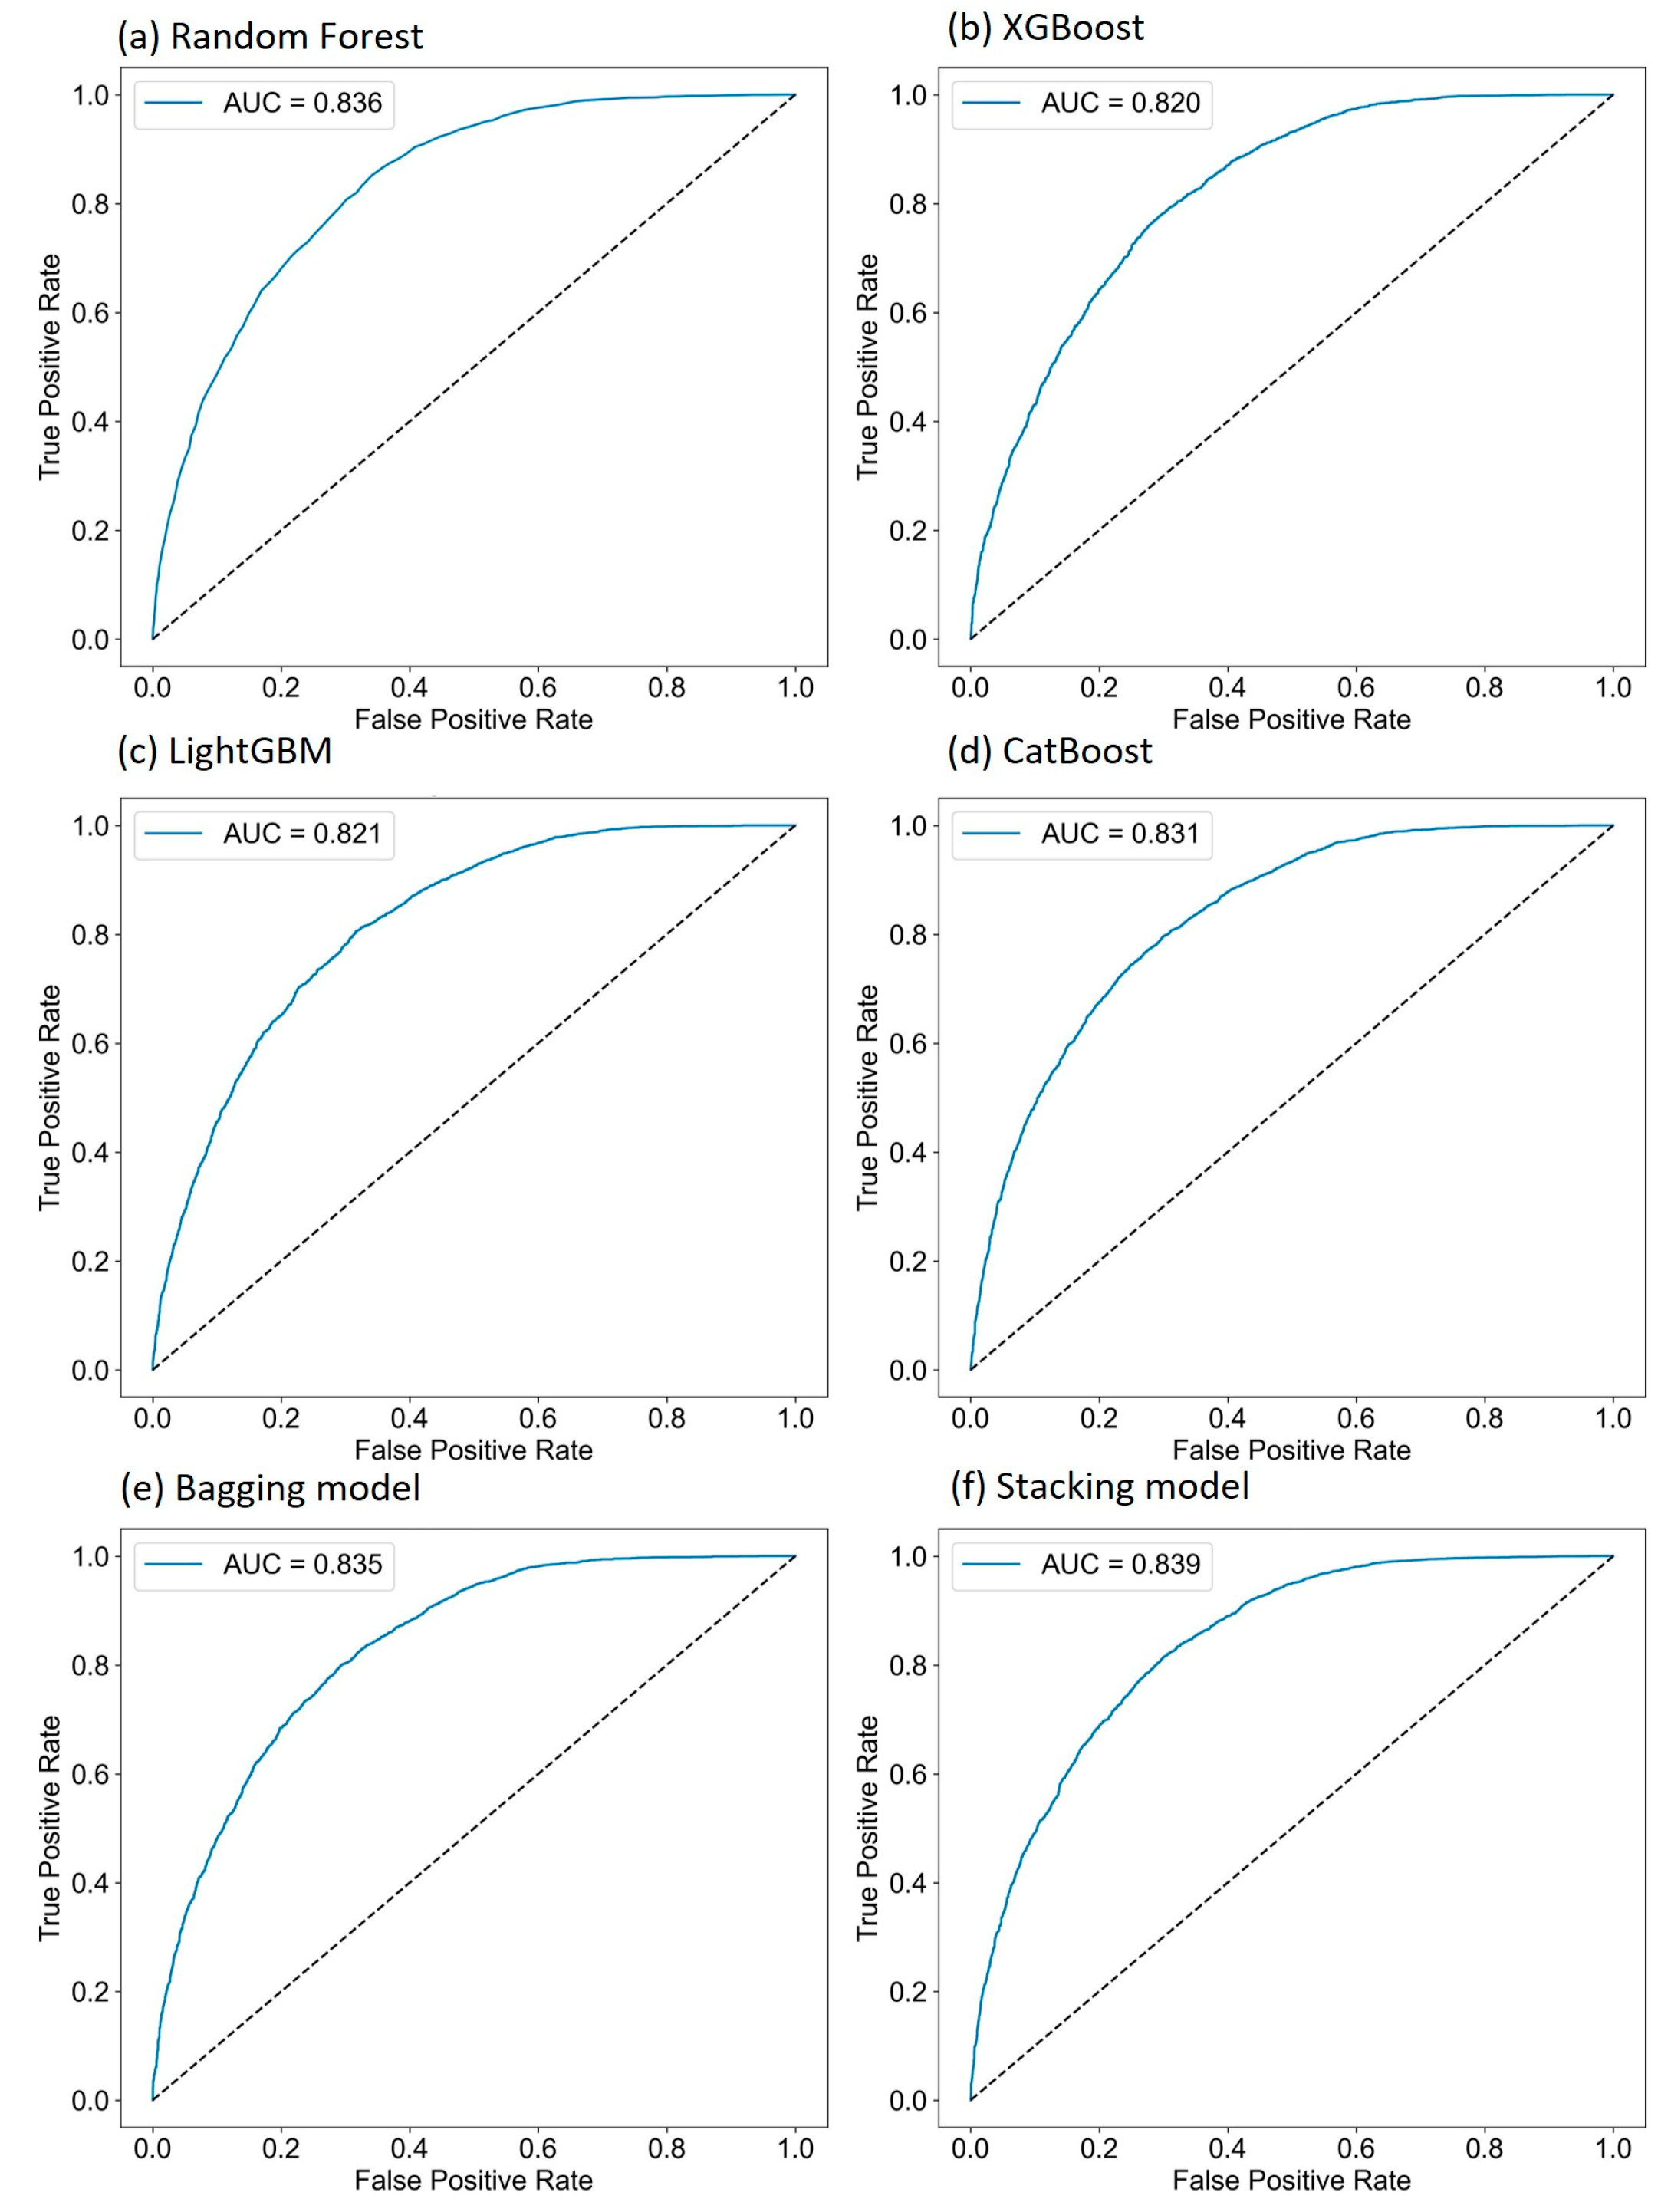
where TP, FN, TN, and FP represent the number of true positives, false negatives, true negatives, and false positives, respectively. The Area Under the Curve (AUC), ranging from 0 to 1, quantifies model performance. Higher AUC values indicate better performance, while values near 0.5 suggest random guessing, and values below 0.5 indicate predictions worse than random, requiring adjustments. The ROC curve and AUC provide an intuitive method for comparing models, making them accessible to non-experts. They are particularly useful in multi-model comparisons and cross-study evaluations, offering clear benchmarks for decision making. By analyzing the ROC curve, researchers can identify the optimal balance between sensitivity and specificity, selecting a threshold that maximizes landslide detection, while minimizing false positives. This approach ensures robust model performance in real-world applications.
5. Discussion
This study adopted an innovative approach by forgoing traditional collinearity detection methods for factors and, instead, exploring the effectiveness of different ensemble learning models in evaluating and ranking the influencing factors. Specifically, homogeneous ensemble models, namely random forest, XGBoost, LightGBM, and CatBoost, were employed alongside heterogeneous ensemble models, namely bagging and stacking, to comprehensively assess factor importance. The random forest model evaluates factor importance based on Gini impurity or entropy metrics, measuring the improvement in purity at decision tree nodes. XGBoost quantifies the contribution of factor splits to model performance using the “gain”. LightGBM utilizes Gradient-based One-Side Sampling and Exclusive Feature Bundling techniques, while CatBoost emphasizes the frequency of factor usage across multiple trees and its impact on decision making. Notably, the analysis of factor importance using heterogeneous ensemble models represents a novel strategy. In regard to the bagging and stacking models, the importance scores of the same factor from different models were combined and averaged to form a comprehensive factor importance score. The results indicate that the DEM was identified as the most critical factor across all the models, followed by lithology and the distance to the river. This finding aligns with the established understanding in landslide susceptibility research, wherein topographic features have long been recognized as fundamental determinants of slope stability. The DEM, as a comprehensive representation of terrain elevation, slope gradient, and aspect, encapsulates essential information related to gravitational forces, surface runoff, and soil erosion, all of which are key triggering mechanisms for landslides. Previous studies have shown that steeper slopes, as quantified by DEM-derived metrics, increase shear stress on soil masses, while elevation changes can influence hydrological conditions, leading to pore water pressure buildup and subsequent slope failure. Against this backdrop, our study posits a clear hypothesis: in regions characterized by complex topography and variable geological conditions, the DEM should emerge as the dominant factor in landslide susceptibility modeling due to its direct influence on multiple physical processes. The multi-model strategy employed herein, by aggregating factor importance scores from random forest, XGBoost, and other ensemble algorithms, not only enhanced the robustness of the predictions, but also reduced the risk of overfitting, thereby improving the accuracy and reliability of the results. This convergence in the findings across diverse models strengthens the validity of our hypothesis, as it demonstrates that the DEM’s influence is consistently recognized regardless of the underlying algorithmic approach used.
Furthermore, a novel method was employed to progressively remove factors deemed unimportant based on their assessed importance across different models, followed by retraining the models to explore the impact of these operations on prediction accuracy. The experimental results revealed significant performance differences among the models after the removal of certain factors, primarily due to the varying mechanisms and dependencies each model has in regard to the different factors. For instance, the random forest model relies on the collective intelligence of multiple decision trees, and the absence of certain key factors leads to a noticeable drop in performance. The XGBoost model demonstrates high sensitivity to core factors, iteratively correcting errors from previous steps, and, thus, heavily depends on the correctness of crucial factors. LightGBM, utilizing Gradient-based One-Side Sampling and Exclusive Feature Bundling techniques, is highly sensitive to the total gain of certain factors when optimizing high-dimensional data. CatBoost evaluates the frequency of factor usage across decision trees and excels in regard to handling categorical factors, but the removal of key factors also significantly impacts its performance. These findings collectively highlight the importance of meticulous factor selection and optimization for enhancing predictive performance and stability across different models. Notably, the integration of predictions from multiple base models using bagging and stacking strategies not only bolstered the robustness of the overall model, but also improved the predictive accuracy. After factor removal, these ensemble models exhibited greater resilience to fluctuations in input data and demonstrated high robustness under varying conditions. However, the post-factor removal performance varied among the ensemble models, reflecting the diversity in regard to the factor handling strategies and methodologies inherent to each base model. This variability underscores the necessity of a tailored approach to factor selection and model training, as different models may react differently to changes in the input factors. Such differences ultimately influence the overall effectiveness of landslide susceptibility assessments, emphasizing the importance of understanding model-specific behaviors when optimizing factor combinations.
In the further research conducted, the performance of different models utilizing specific combinations of factors based on the training and testing datasets was analyzed, with a detailed examination of the landslide susceptibility prediction results. This comprehensive analysis revealed significant performance disparities among the models when predicting areas of high susceptibility versus those of extremely low susceptibility. Notably, the stacking model excelled in identifying high susceptibility areas, underscoring its exceptional ability to recognize regions at elevated risk of landslides. Conversely, the XGBoost model demonstrated superior effectiveness in pinpointing extremely low susceptibility areas, highlighting its precision in accurately locating low susceptibility regions. By optimizing the factor combination techniques for each model, improvements in prediction accuracy were observed for both high and extremely low susceptibility areas across all the models. This finding suggests that meticulous factor engineering not only effectively reduces prediction uncertainty, but also significantly enhances overall model accuracy. For instance, after factor optimization, the stacking model exhibited a remarkable increase in the proportion of correctly identified high susceptibility areas, while XGBoost’s accuracy in identifying extremely low susceptibility areas also showed a notable improvement. Moreover, the analysis revealed that each model exhibited unique sensitivities and adaptive capabilities in predicting varying susceptibility levels, primarily driven by their distinct internal mechanisms and factor handling methodologies. The bagging and stacking strategies, which integrate predictions from multiple base models, demonstrated heightened robustness, particularly outperforming individual models in predicting both high and low susceptibility levels. These strategies highlighted their ability to balance the strengths of different models, resulting in improved prediction stability and accuracy. This systematic investigation of model performance illuminated the nuanced differences in how various models respond to changes in the input factors. It underscores the critical importance of meticulous factor engineering and multi-model integration strategies in enhancing prediction accuracy and stability. By leveraging the complementary strengths of individual models, ensemble approaches such as bagging and stacking provide a robust framework for improving the reliability of landslide susceptibility predictions.
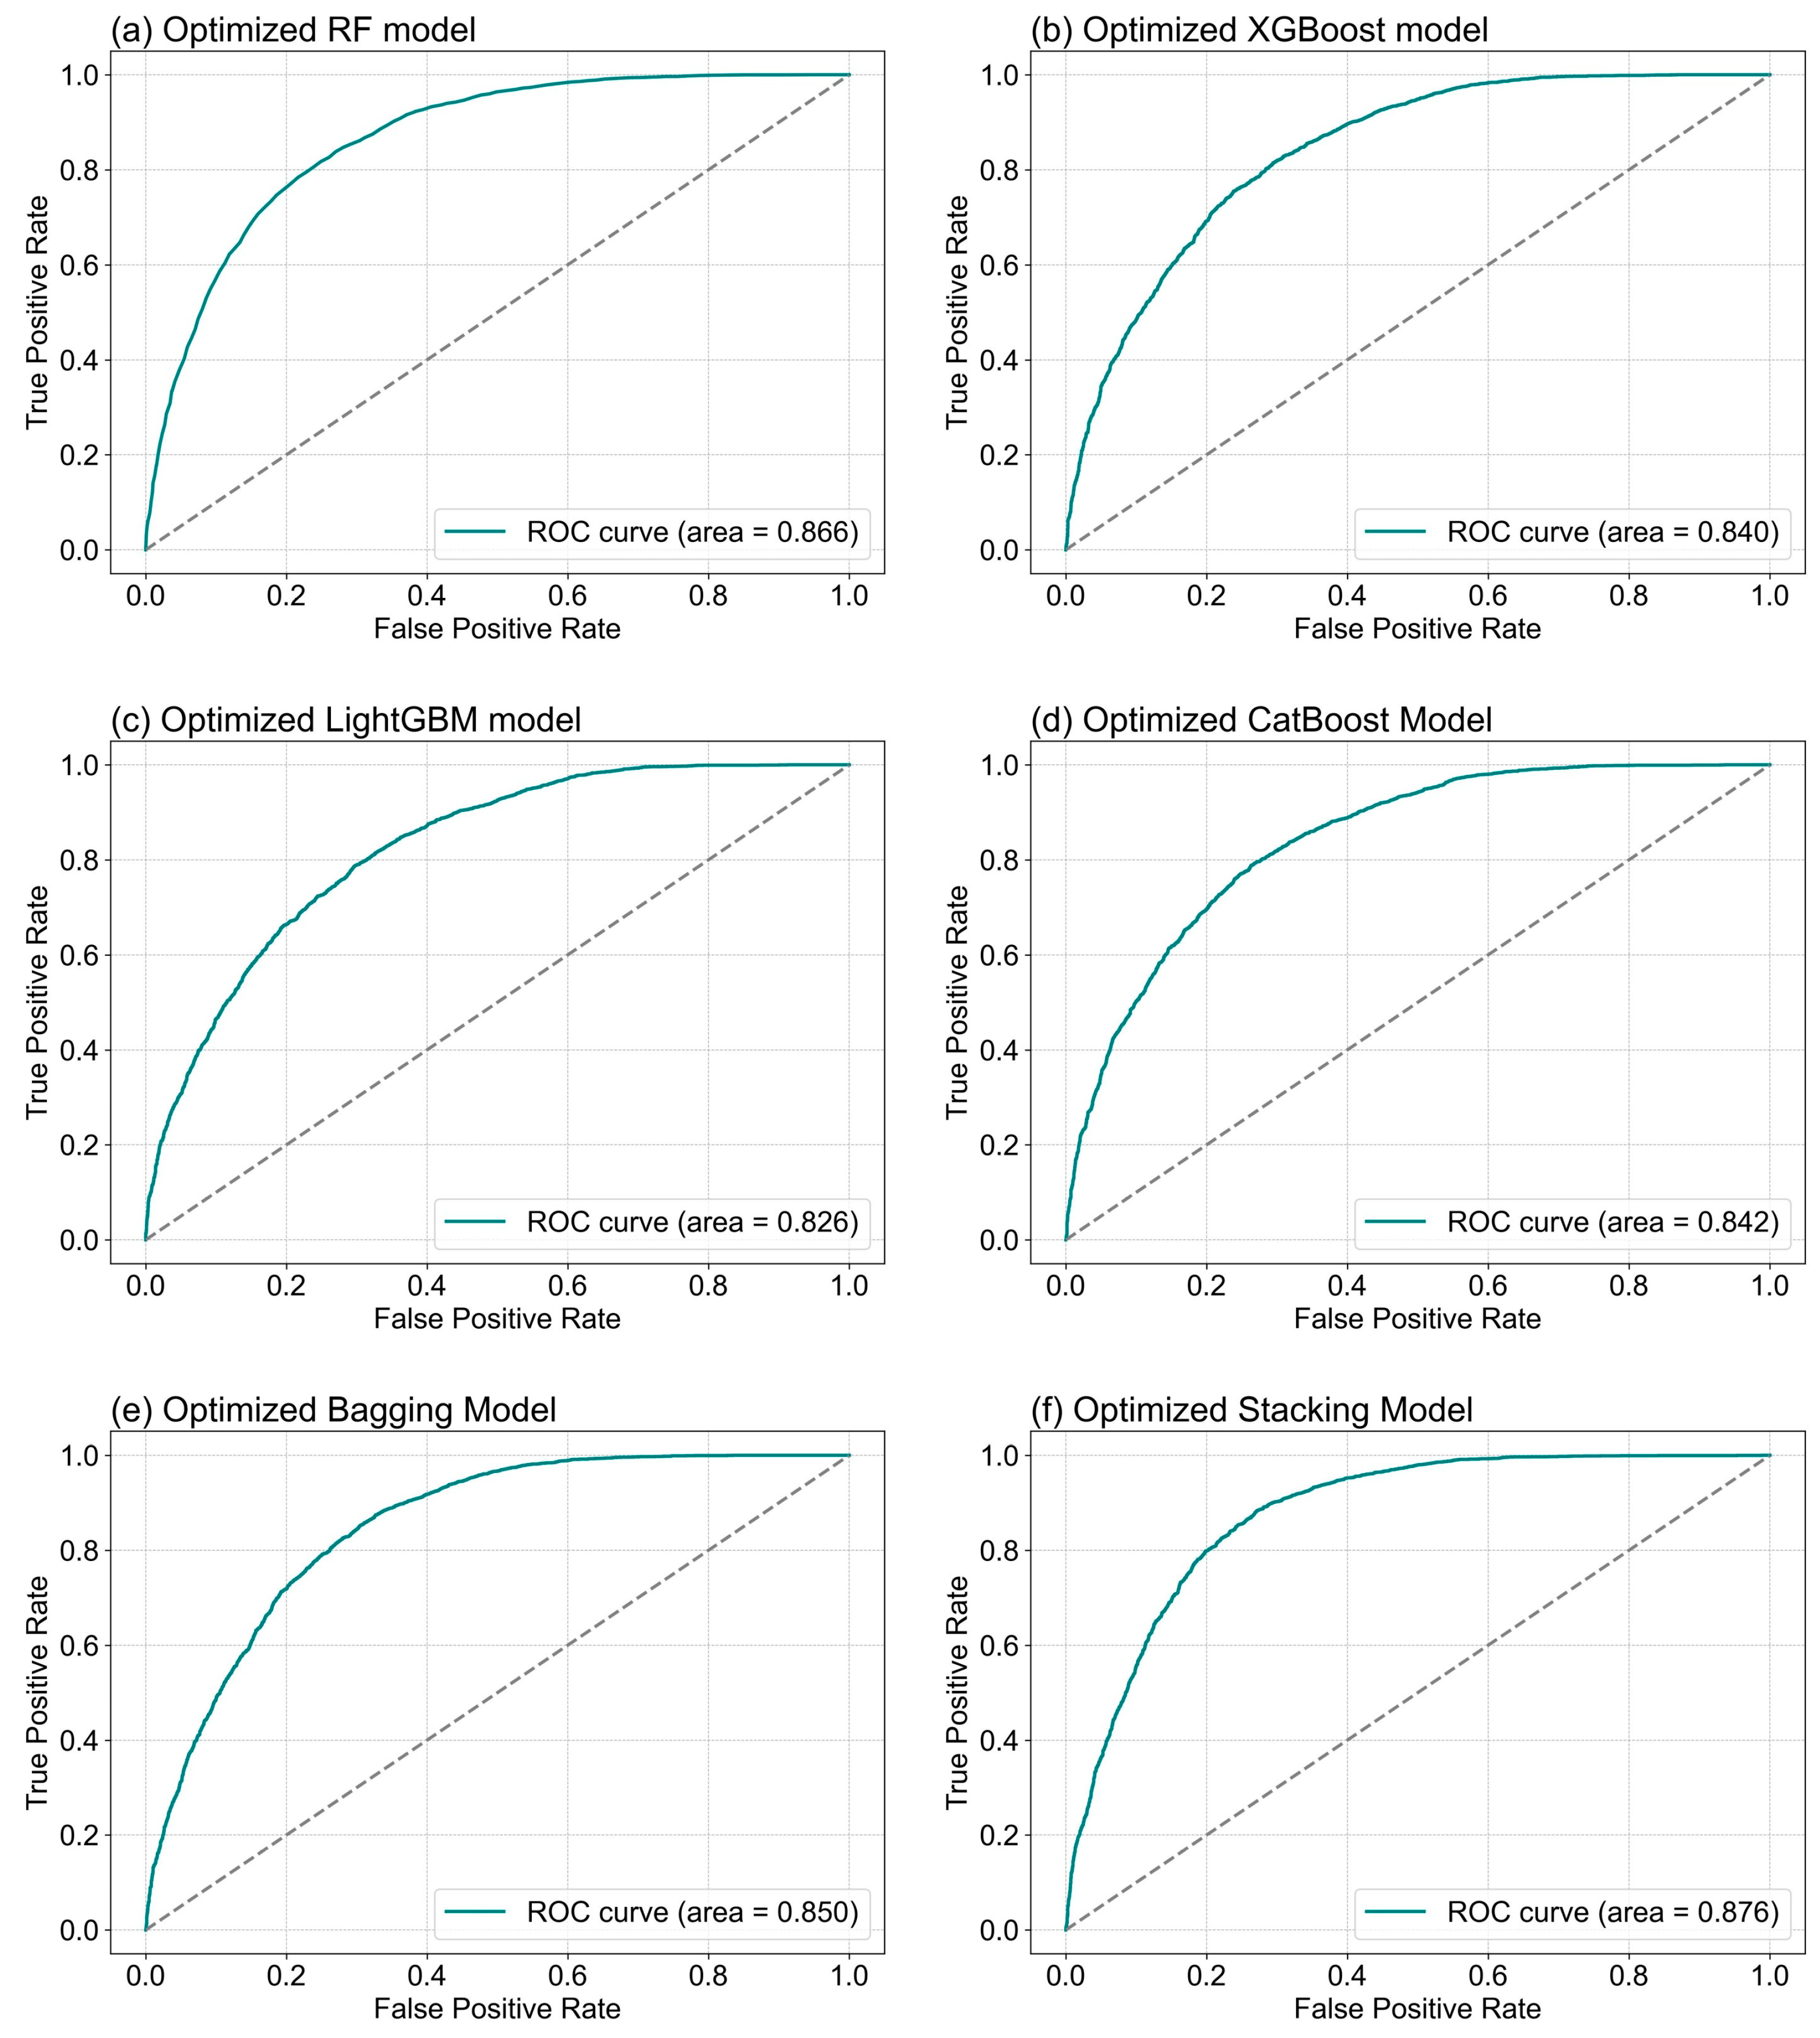
The performance comparison in
Table 2 demonstrates that our optimized stacking ensemble (AUC = 0.876) outperforms not only traditional machine learning methods (SVM = 0.813, logistic regression = 0.792) [
3], but also deep learning approaches (CNN = 0.845, DNN = 0.832) [
19,
20]. Specifically, the stacking model achieves a 3.1% higher AUC than CNN and a 4.4% improvement over DNN, highlighting its effectiveness in regard to landslide susceptibility prediction.
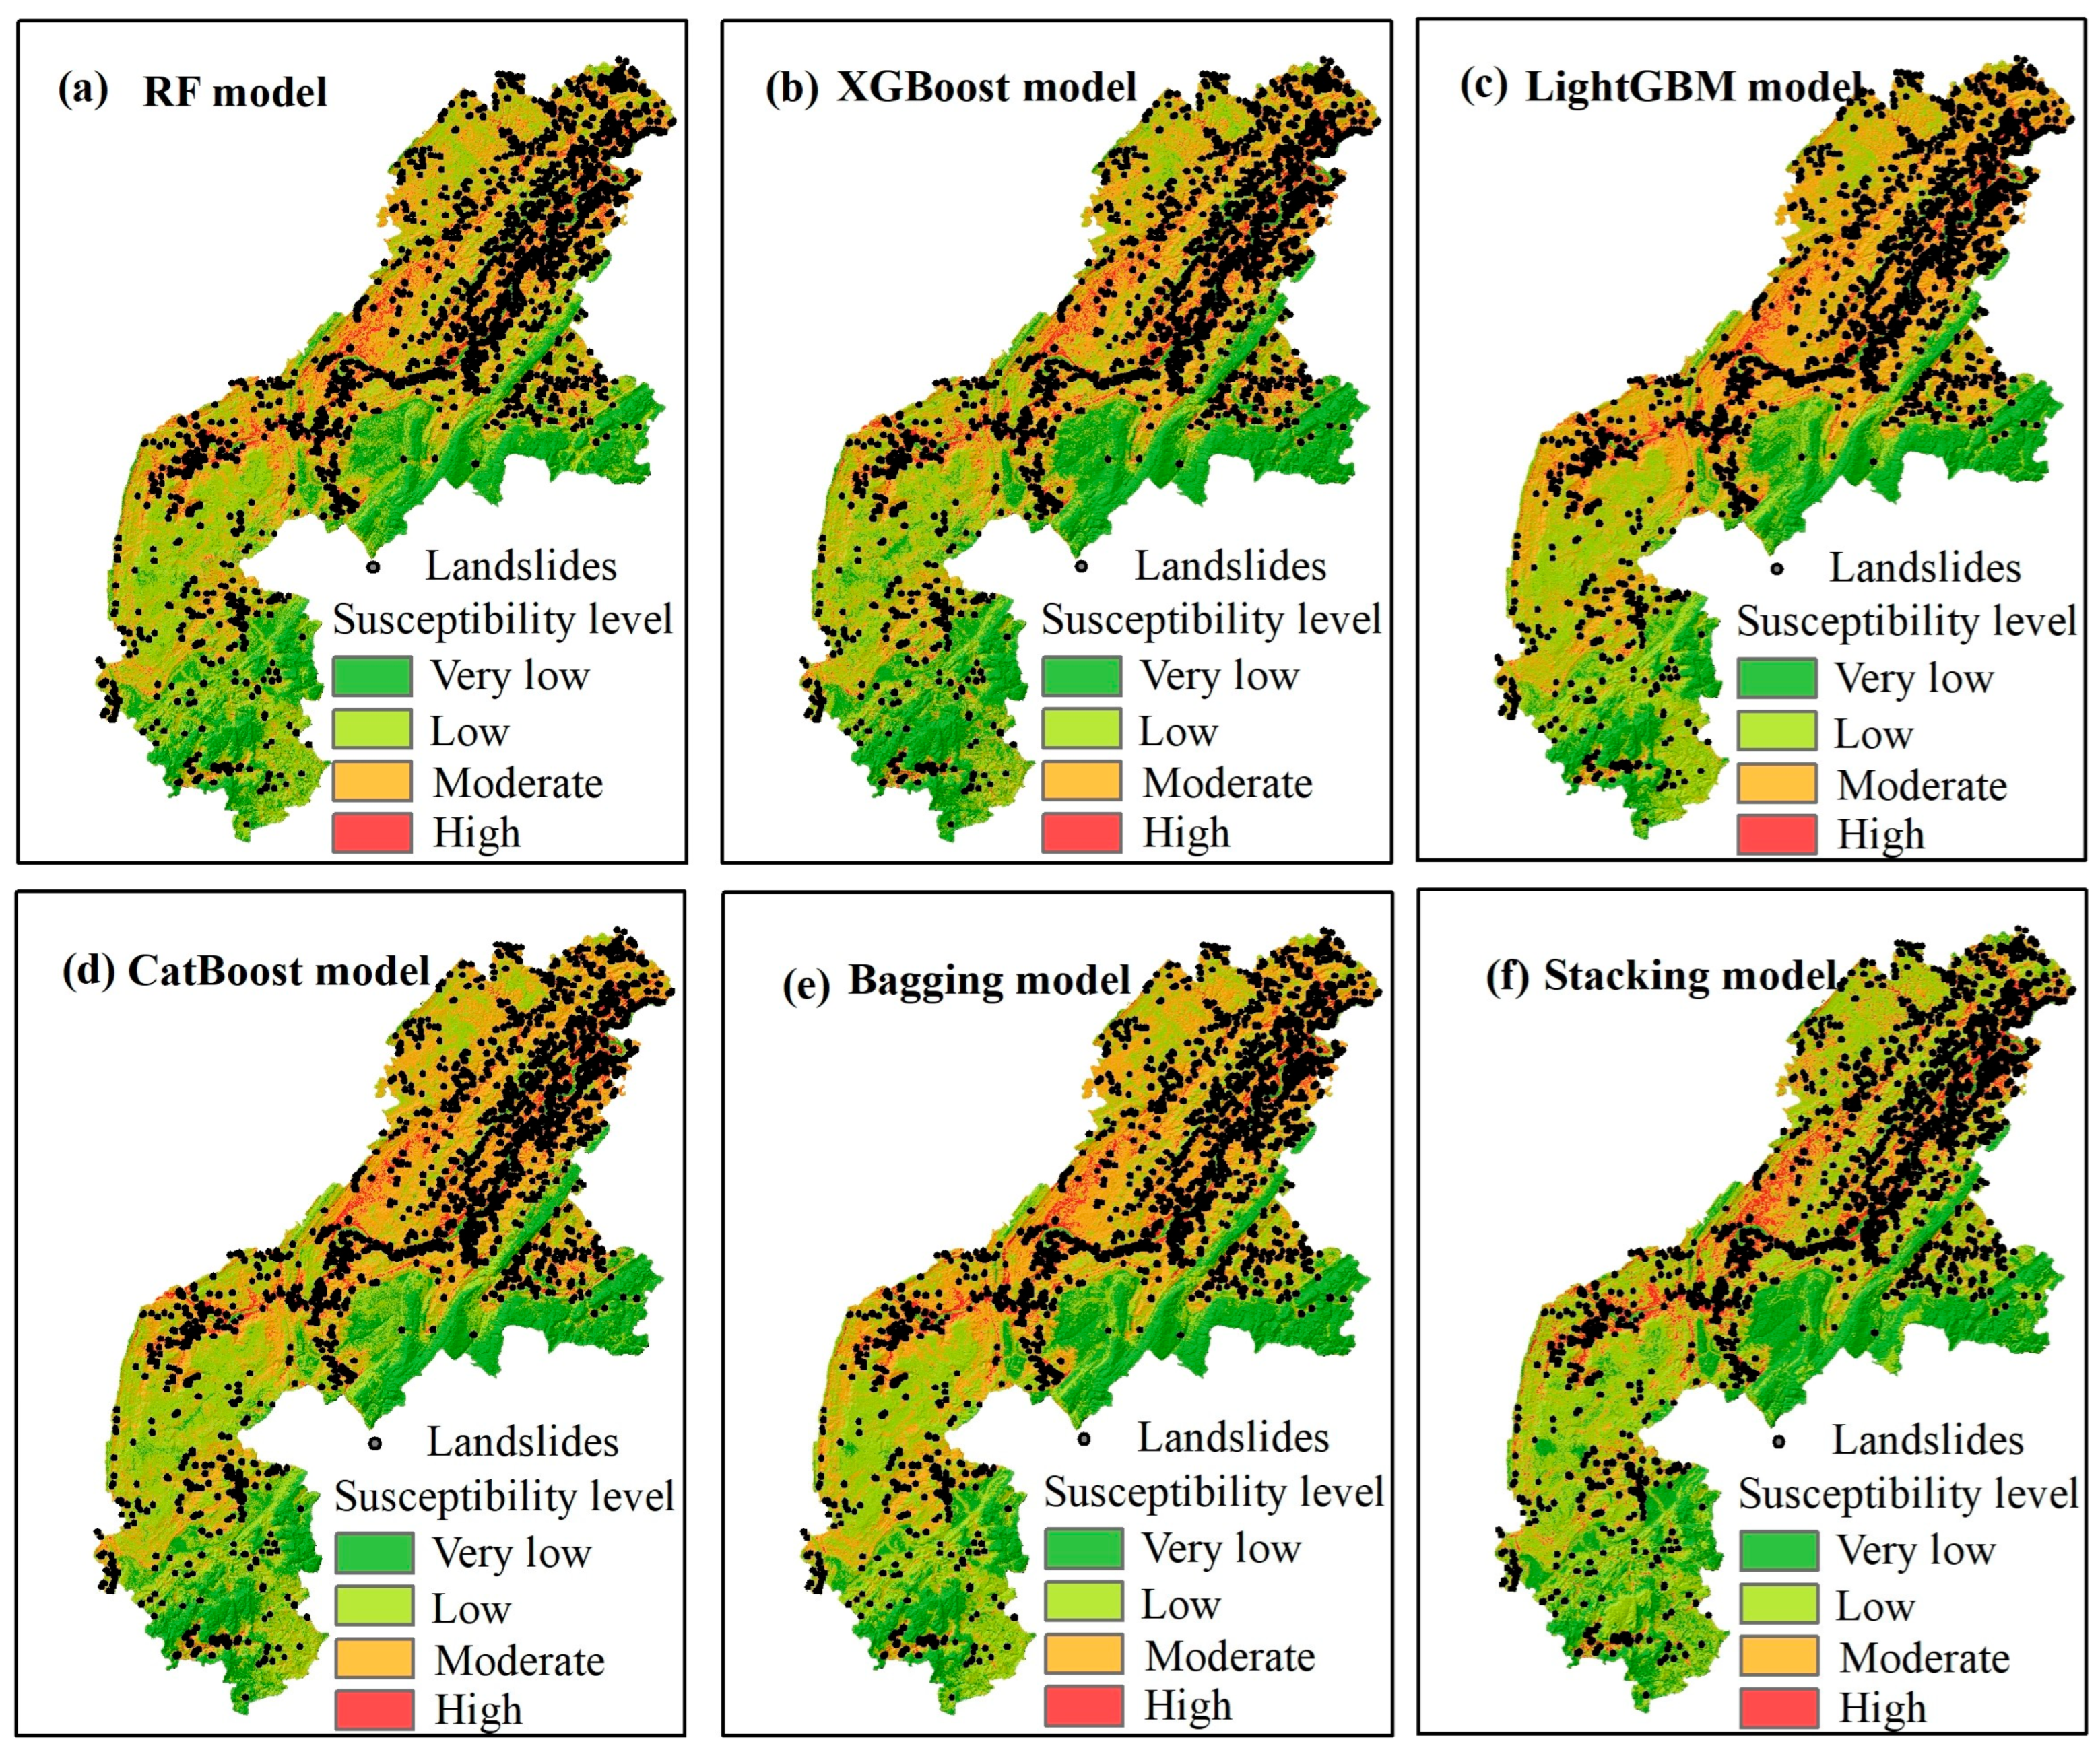
The optimized models were applied to the entire study area to create a landslide susceptibility distribution map. The results indicated that the stacking model, which integrates predictions from multiple base models, provided the most detailed distribution of susceptibility zones, clearly distinguishing between high, medium, and low susceptibility areas, with excellent performance. In the landslide susceptibility prediction for the study area, the models exhibited high consistency. Specifically, the northern region, characterized by steep terrain and concentrated rainfall, was classified as a high susceptibility area. The central region, influenced by frequent geological activities and human interventions, was also identified as a high susceptibility zone. The southwestern region, with its complex terrain and climatic conditions, was assessed as having moderate susceptibility. In contrast, the eastern and southern regions, with relatively stable geological conditions, were classified as low susceptibility areas, indicating a lower risk of landslides. From a regional distribution perspective, the northern and central areas, classified as high susceptibility zones, require focused monitoring and preventive measures. The southwestern region, as a moderate susceptibility zone, should implement appropriate protective measures to mitigate potential risks. The eastern and southern regions, classified as low susceptibility zones, are relatively safe, but should remain vigilant against potential hazards. The landslide susceptibility modeling strategy developed in this study not only improved the accuracy of landslide risk predictions, but also facilitated more effective landslide disaster prevention and mitigation efforts. This approach ensures the safety of residents and infrastructure within the region, while providing robust scientific support for the detailed delineation of landslide susceptibility zones and risk management.
Despite the promising results of this study, several limitations warrant consideration. Firstly, while a variety of ensemble learning models were employed, the selection of the factors was primarily based on the available geological and environmental data, which may not encompass all the relevant variables influencing landslide susceptibility. Consequently, if the model were applied to another region or country with different geological and climatic conditions, there is a significant risk that the predictions may be inaccurate or unreliable. This limitation arises because the model’s performance is heavily dependent on the quality and relevance of the input data; factors that are critical in one region may not hold the same importance in another. Future research should aim to incorporate additional data sources, such as socio-economic factors and data from real-time monitoring systems, to enrich the model inputs and enhance the predictive accuracy. Secondly, the models were evaluated within a specific geographical context, which may limit the generalizability of the findings to other regions. Therefore, it is essential to validate the developed models in diverse settings to assess their robustness and adaptability. Without such validation, there is a risk of misestimating landslide susceptibility, potentially leading to inadequate risk management strategies and jeopardizing safety in areas where the model is applied. Moreover, while the study emphasized the importance of factor engineering and multi-model integration, the intricate interactions between factors remain an area for further exploration. Future studies could investigate advanced techniques, such as deep learning and hybrid modeling approaches, to capture complex relationships among the factors that traditional ensemble methods may overlook. Additionally, incorporating uncertainty quantification methods could provide a more comprehensive understanding of the reliability of the predictions, enabling better informed decision making in landslide risk management. Finally, the reliance on historical data for model training and validation may introduce biases, particularly in regions with limited or inconsistent data availability. This could affect the model’s ability to generalize to future scenarios, especially under changing environmental or climatic conditions. Future research should consider integrating dynamic data sources and adaptive modeling frameworks to address these challenges and improve the model’s applicability to evolving conditions.
6. Conclusions
This study aimed to enhance landslide susceptibility modeling by integrating various machine learning models, including random forest, XGBoost, LightGBM, CatBoost, bagging, and stacking. The focus was on evaluating and ranking the importance of different influencing factors and employing advanced ensemble learning strategies to improve prediction accuracy and robustness. The methodology involved comprehensive factor importance analysis, stepwise factor elimination, and optimization of model performance. Homogeneous ensemble models (random forest, XGBoost, LightGBM, and CatBoost) and heterogeneous ensemble models (bagging and stacking) were utilized to assess and integrate the importance of each factor. The models were trained and tested using a dataset comprising factors such as the DEM, lithology, the distance to the river, the NDVI, and slope.
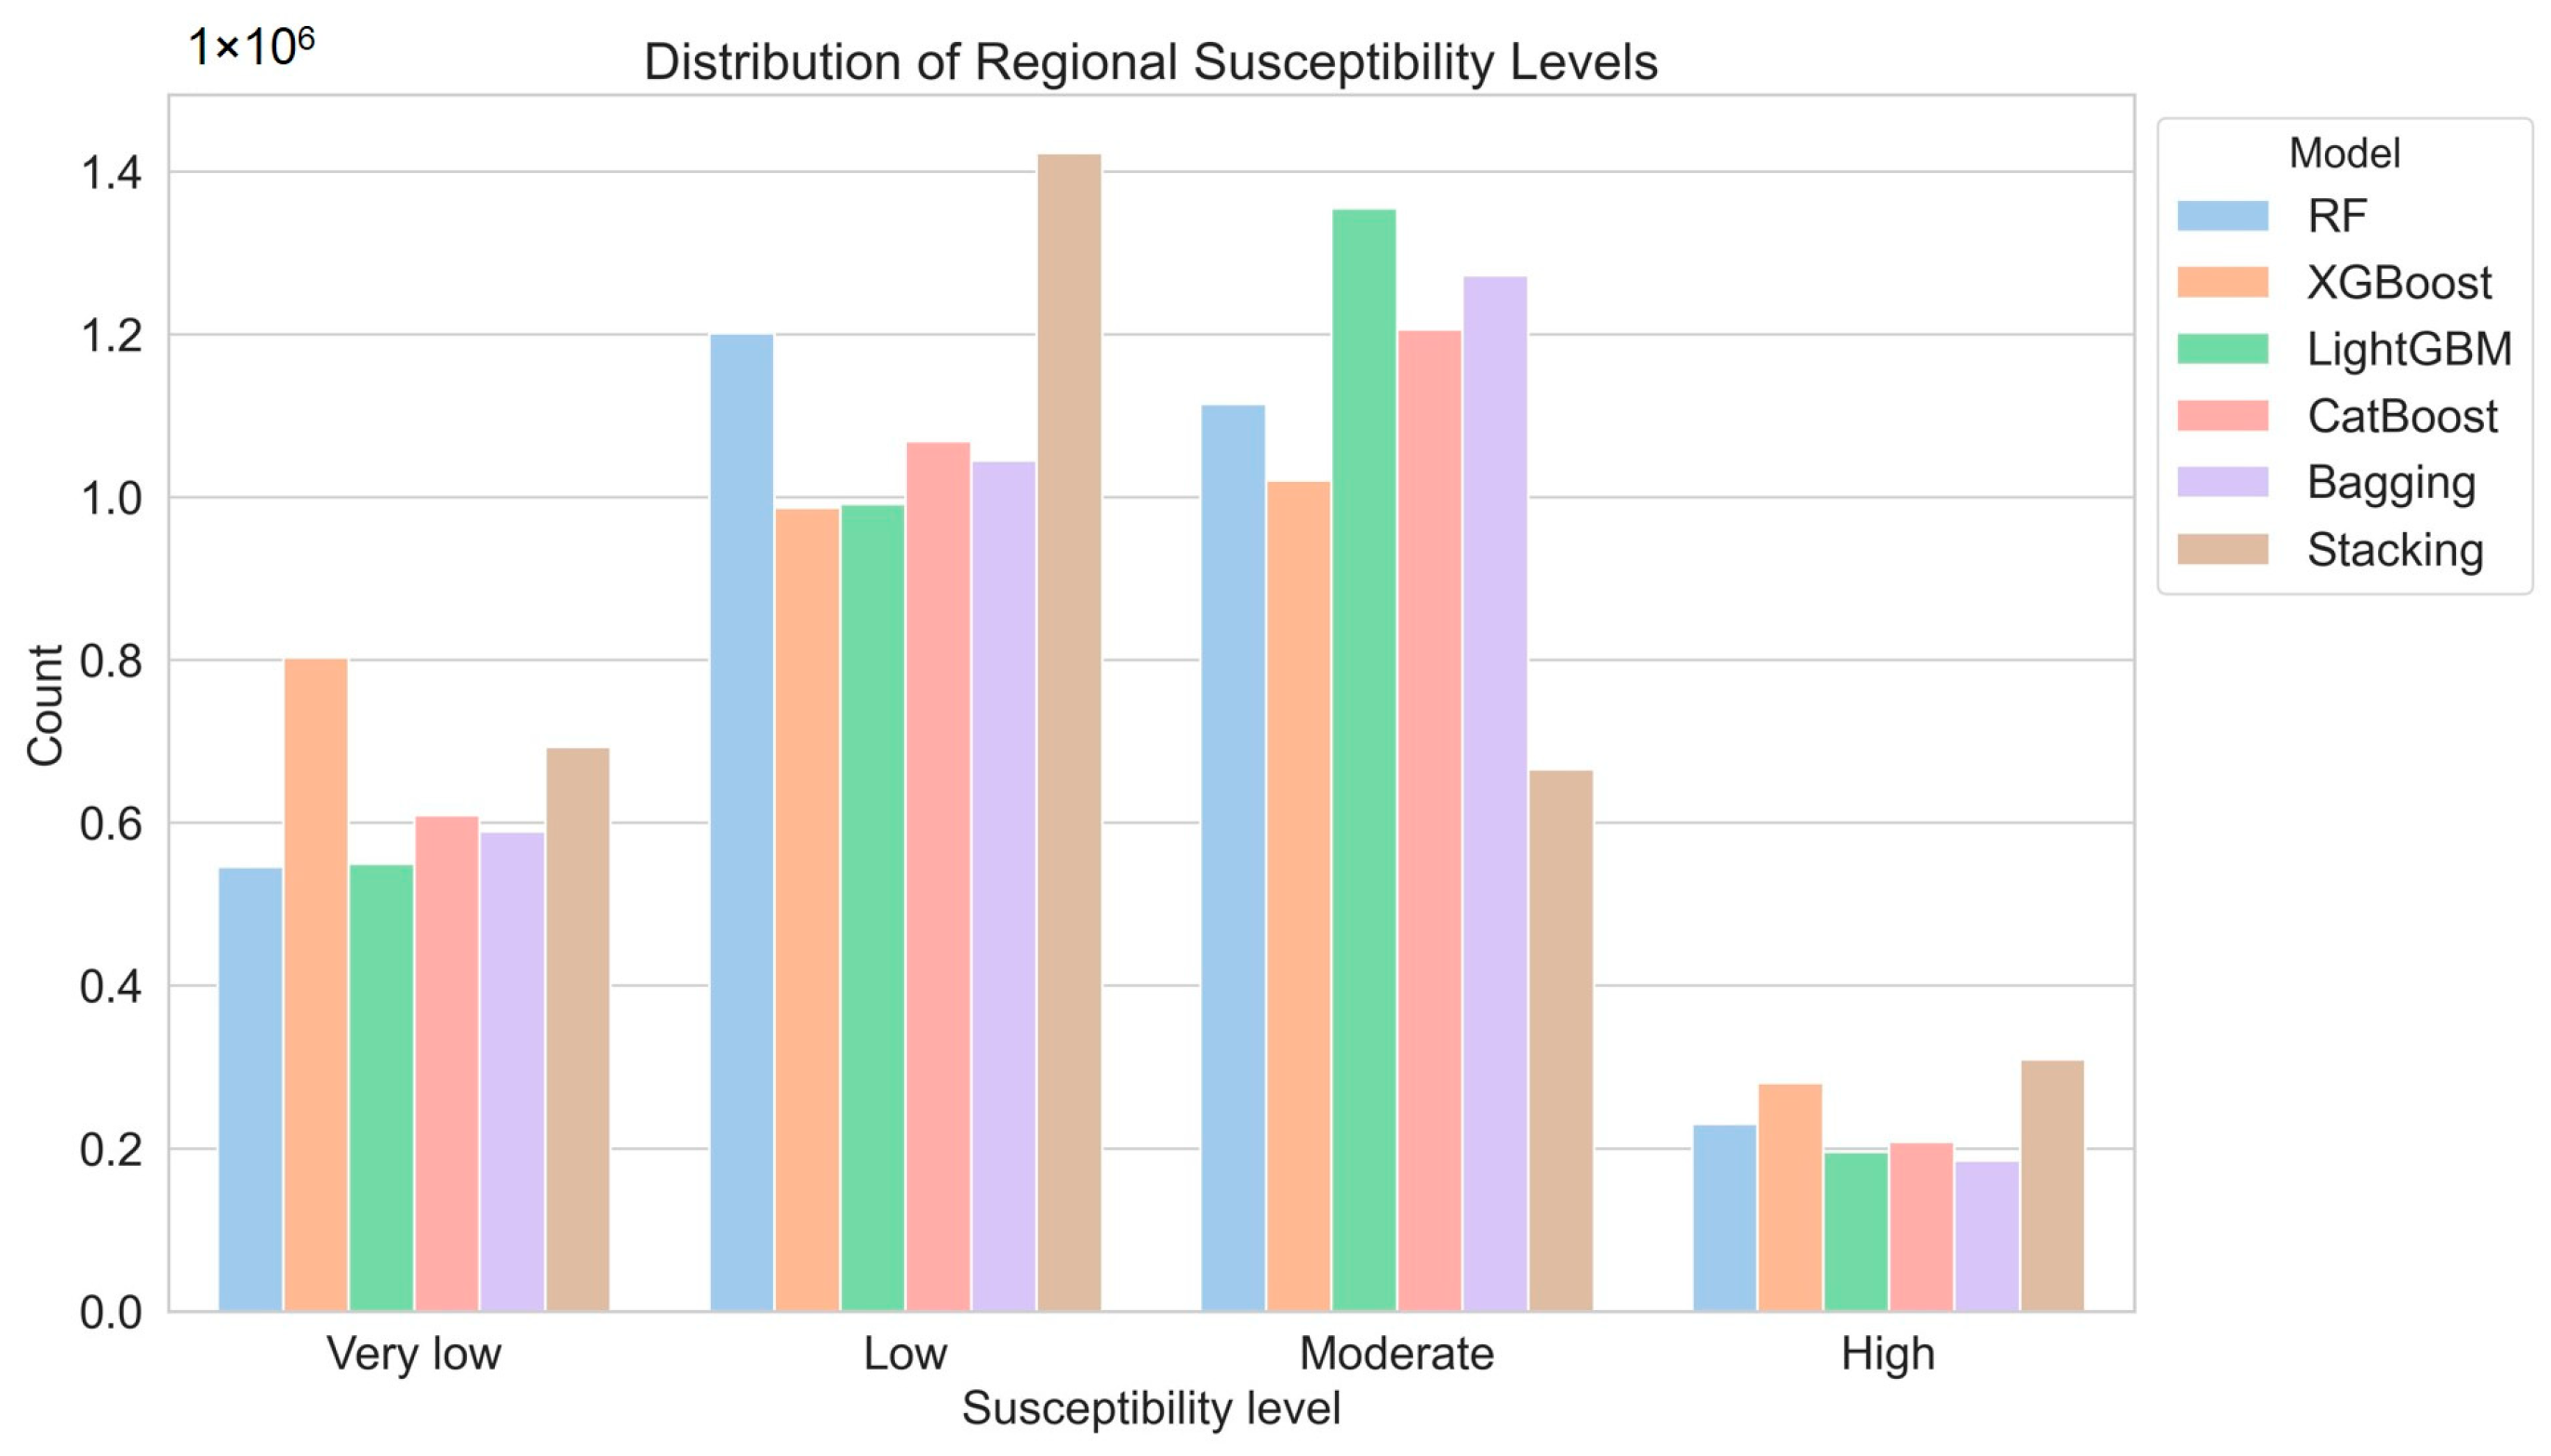
The key findings indicate that the DEM consistently emerged as the most critical factor across all the models, underscoring its pivotal role in predicting landslide susceptibility. The stacking model achieved the highest AUC value of 0.876, representing a 4.4% improvement over the other models and demonstrating superior predictive performance. The factor engineering process significantly enhanced model accuracy. For instance, the proportion of areas classified as highly susceptible by the stacking model increased to 42.54%, while the proportion classified as very low susceptibility by the XGBoost model rose from 12.96% to 13.57%. These improvements highlight the effectiveness of factor optimization in enhancing model performance. The optimized models were applied to create a detailed landslide susceptibility distribution map of the entire study area. The results indicated that the stacking model provided the most detailed distribution, clearly distinguishing between high, medium, and low susceptibility areas. The northern and central regions were classified as high susceptibility areas due to their steep terrain and concentrated rainfall, while the eastern and southern regions exhibited low susceptibility, indicating a lower landslide risk. These findings demonstrate the utility of ensemble models in producing robust and detailed landslide susceptibility maps.
In conclusion, the innovative approach of integrating multiple models and employing meticulous factor engineering strategies significantly improved the accuracy and robustness of landslide susceptibility predictions. The findings offer valuable insights for effective landslide disaster prevention and mitigation efforts, ensuring the safety of residents and infrastructure in susceptible regions. This study highlights the potential of ensemble learning techniques to enhance the reliability of landslide susceptibility assessments and provides a scientific basis for informed decision making in regard to landslide risk management.


 ,
, 


