1. Introduction
Visualizing three-dimensional (3D) structures has been a key pursuit in scientific imaging and visual arts. Various techniques, from stereoscopic photography to holography, have been used to capture and reproduce the depth and spatiality of real-world scenes. In recent years, the demand for high-resolution 3D representations of architectural landmarks and urban environments has grown significantly, driven by applications in urban planning, education, digital heritage preservation, and immersive display technologies [
1].
Among the available tools, Google Earth Studio (
https://www.google.com/earth/studio/, accessed on 1 May 2025) [
2] has emerged as a novel web-based platform capable of generating cinematic animations using satellite-derived and photogrammetrically reconstructed 3D city data [
3,
4,
5]. Despite being primarily developed for educational and media use, this resource has proven suitable for scientific visualization when paired with proper attribution and processing [
6,
7,
8]. To date, Google Earth Studio remains one of the only platforms that provides automated, browser-based access to high-resolution satellite imagery with pre-defined camera path control for generating animated visual content. While other tools, such as ArcGIS CityEngine (
https://www.esri.com/en-us/arcgis/products/arcgis-cityengine/overview, accessed on 1 May 2025) or CesiumJS (
https://cesium.com/platform/cesiumjs/, accessed on 1 May 2025) [
9], offer 3D geospatial visualization, they require advanced datasets and user expertise, making them less accessible for rapid, image-based workflows. The ease of use, global coverage, and visual coherence of Earth Studio make it a particularly suitable choice for preliminary architectural holography applications.
Google Earth Studio provides comprehensive 3D visualization of global geospatial data ranging from large cityscapes to individual structures. This enables users to navigate through virtual cameras using industry-standard animation tools to capture videos and images. When optimized, the 3D city data of Earth Studio can produce cinematic and highly photorealistic animations [
10,
11,
12]. Designed to support creators in producing media for urban and architectural contexts, Earth Studio is a vast 3D data resource coupled with robust animation tools. In this study, Earth Studio was primarily used to gather image data for hologram production. Sharing the same 3D imagery source as Google Earth [
13,
14,
15], Earth Studio is one of the world’s largest geoimagery repositories and provides a highly photorealistic digital model of the planet [
16,
17,
18,
19]. The primary technique Google employs to generate 3D data is photogrammetry, which uses aerial images captured by specialized aircrafts and satellites.
Recent investigations have extended the utility of Google Earth Studio beyond its initial application in media production, exploring its broader potential in fields such as digital heritage preservation and augmented reality prototyping. This shift is largely attributed to Earth Studio’s ability to generate visually compelling and spatially coherent 3D renderings of urban environments. These capabilities position the platform as a practical and cost-effective solution for acquiring preliminary 3D data, especially in scenarios where traditional surveying techniques are constrained or altogether inaccessible [
20,
21,
22].
Despite the growing interest in 3D visualization, no studies have explored how publicly available photogrammetric data sources, such as Google Earth Studio, could be directly integrated into holographic imaging workflows. Traditional holographic pipelines rely heavily on light detection and ranging (LiDAR) photogrammetry from on-site captures and computer-aided design (CAD)-based modeling, all of which are resource-intensive and often inaccessible to broader communities.
The CHIMERA digital holographic printer [
23] offers a powerful means of translating dense viewpoint data into high-resolution full-color holographic stereograms. However, traditional workflows for generating the necessary perspective images often require extensive photogrammetry [
24], LiDAR [
25,
26], or other time- and resource-intensive 3D modeling techniques [
27,
28].
To address this gap, this study proposes a streamlined, scalable, and cost-effective method for directly producing architectural holograms from cinematic 3D imagery rendered using Google Earth Studio. This approach minimizes the technical barriers, prevents the need for physical site access, and enables high-fidelity holographic reconstruction using existing datasets. Moreover, our methodology presents a new visualization pipeline and democratizes access to digital holography by leveraging free and readily available tools. The proposed method enables the transformation of large-scale 3D content into immersive holographic experiences, with applications spanning architecture, geospatial communication, public exhibitions, and cultural heritage. In our research work, two case studies were selected—Barcelona’s Basílica de la Sagrada Família and Paris’s Arc de Triomphe—based on their complexity, scale, and visual richness. These examples demonstrated the potential for creating rich holograms from Earth Studio’s photorealistic 3D imagery, bypassing the technical limitations of conventional 3D scanning.
2. Materials and Methods
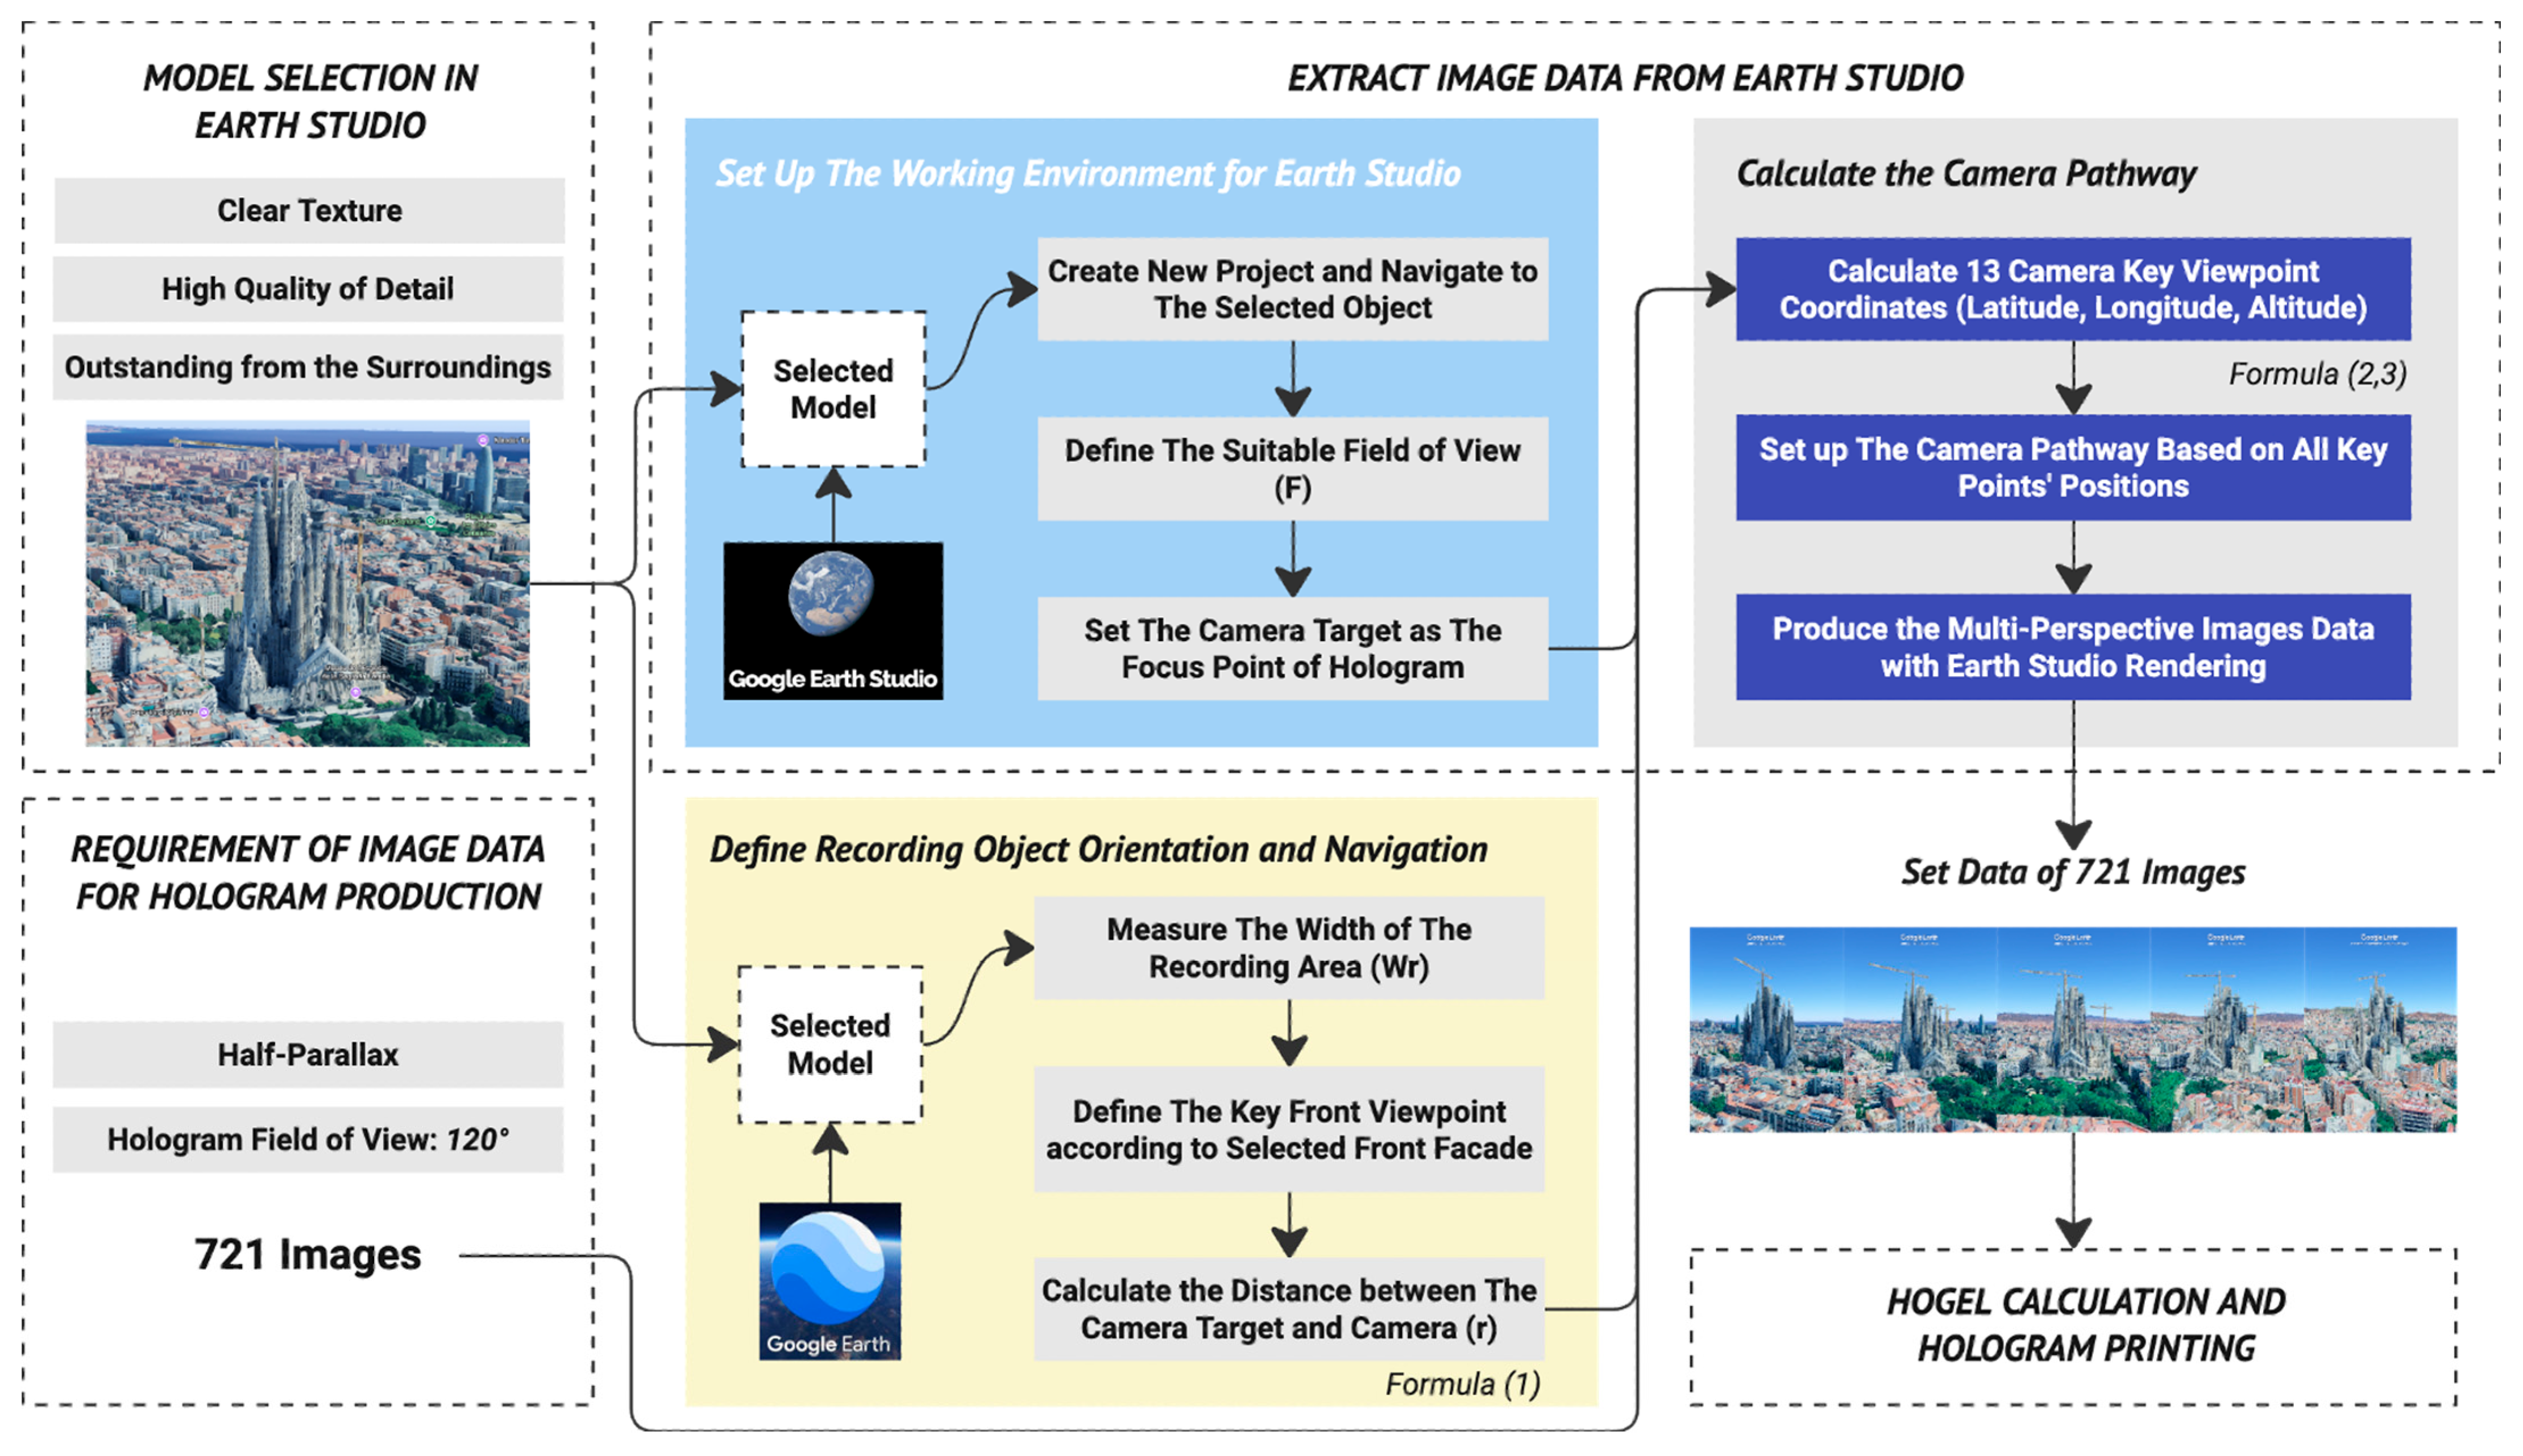
This section outlines the workflow for producing full-color half-parallax holograms of real-world architectural structures using cinematic 3D imagery from Google Earth Studio. The entire process, from model selection to hologram reconstruction, was executed with a focus on efficiency, scalability, and optical quality. An overview of this process is shown in
Figure 1.
2.1. Model Selection in Earth Studio
The first step involved the selection of appropriate 3D landmarks from Google Earth Studio’s global library of photogrammetrically reconstructed urban environments. Several selection criteria were established to ensure optimal results for holographic reconstruction. The chosen construction needed to exhibit photorealistic 3D fidelity with accurate geometry and detailed surface textures, as the quality of Earth Studio representations varied depending on the geographic region. Additionally, geometric completeness was essential; the architectural volume of each subject had to be fully modeled without occluded facades or missing sections. Finally, a clear line of sight was required; selected buildings needed to be either taller than the surrounding cityscape or situated in open areas to allow unobstructed perspective capture from a wide range of viewing angles.
2.2. Requirement of Image Data for Hologram Production
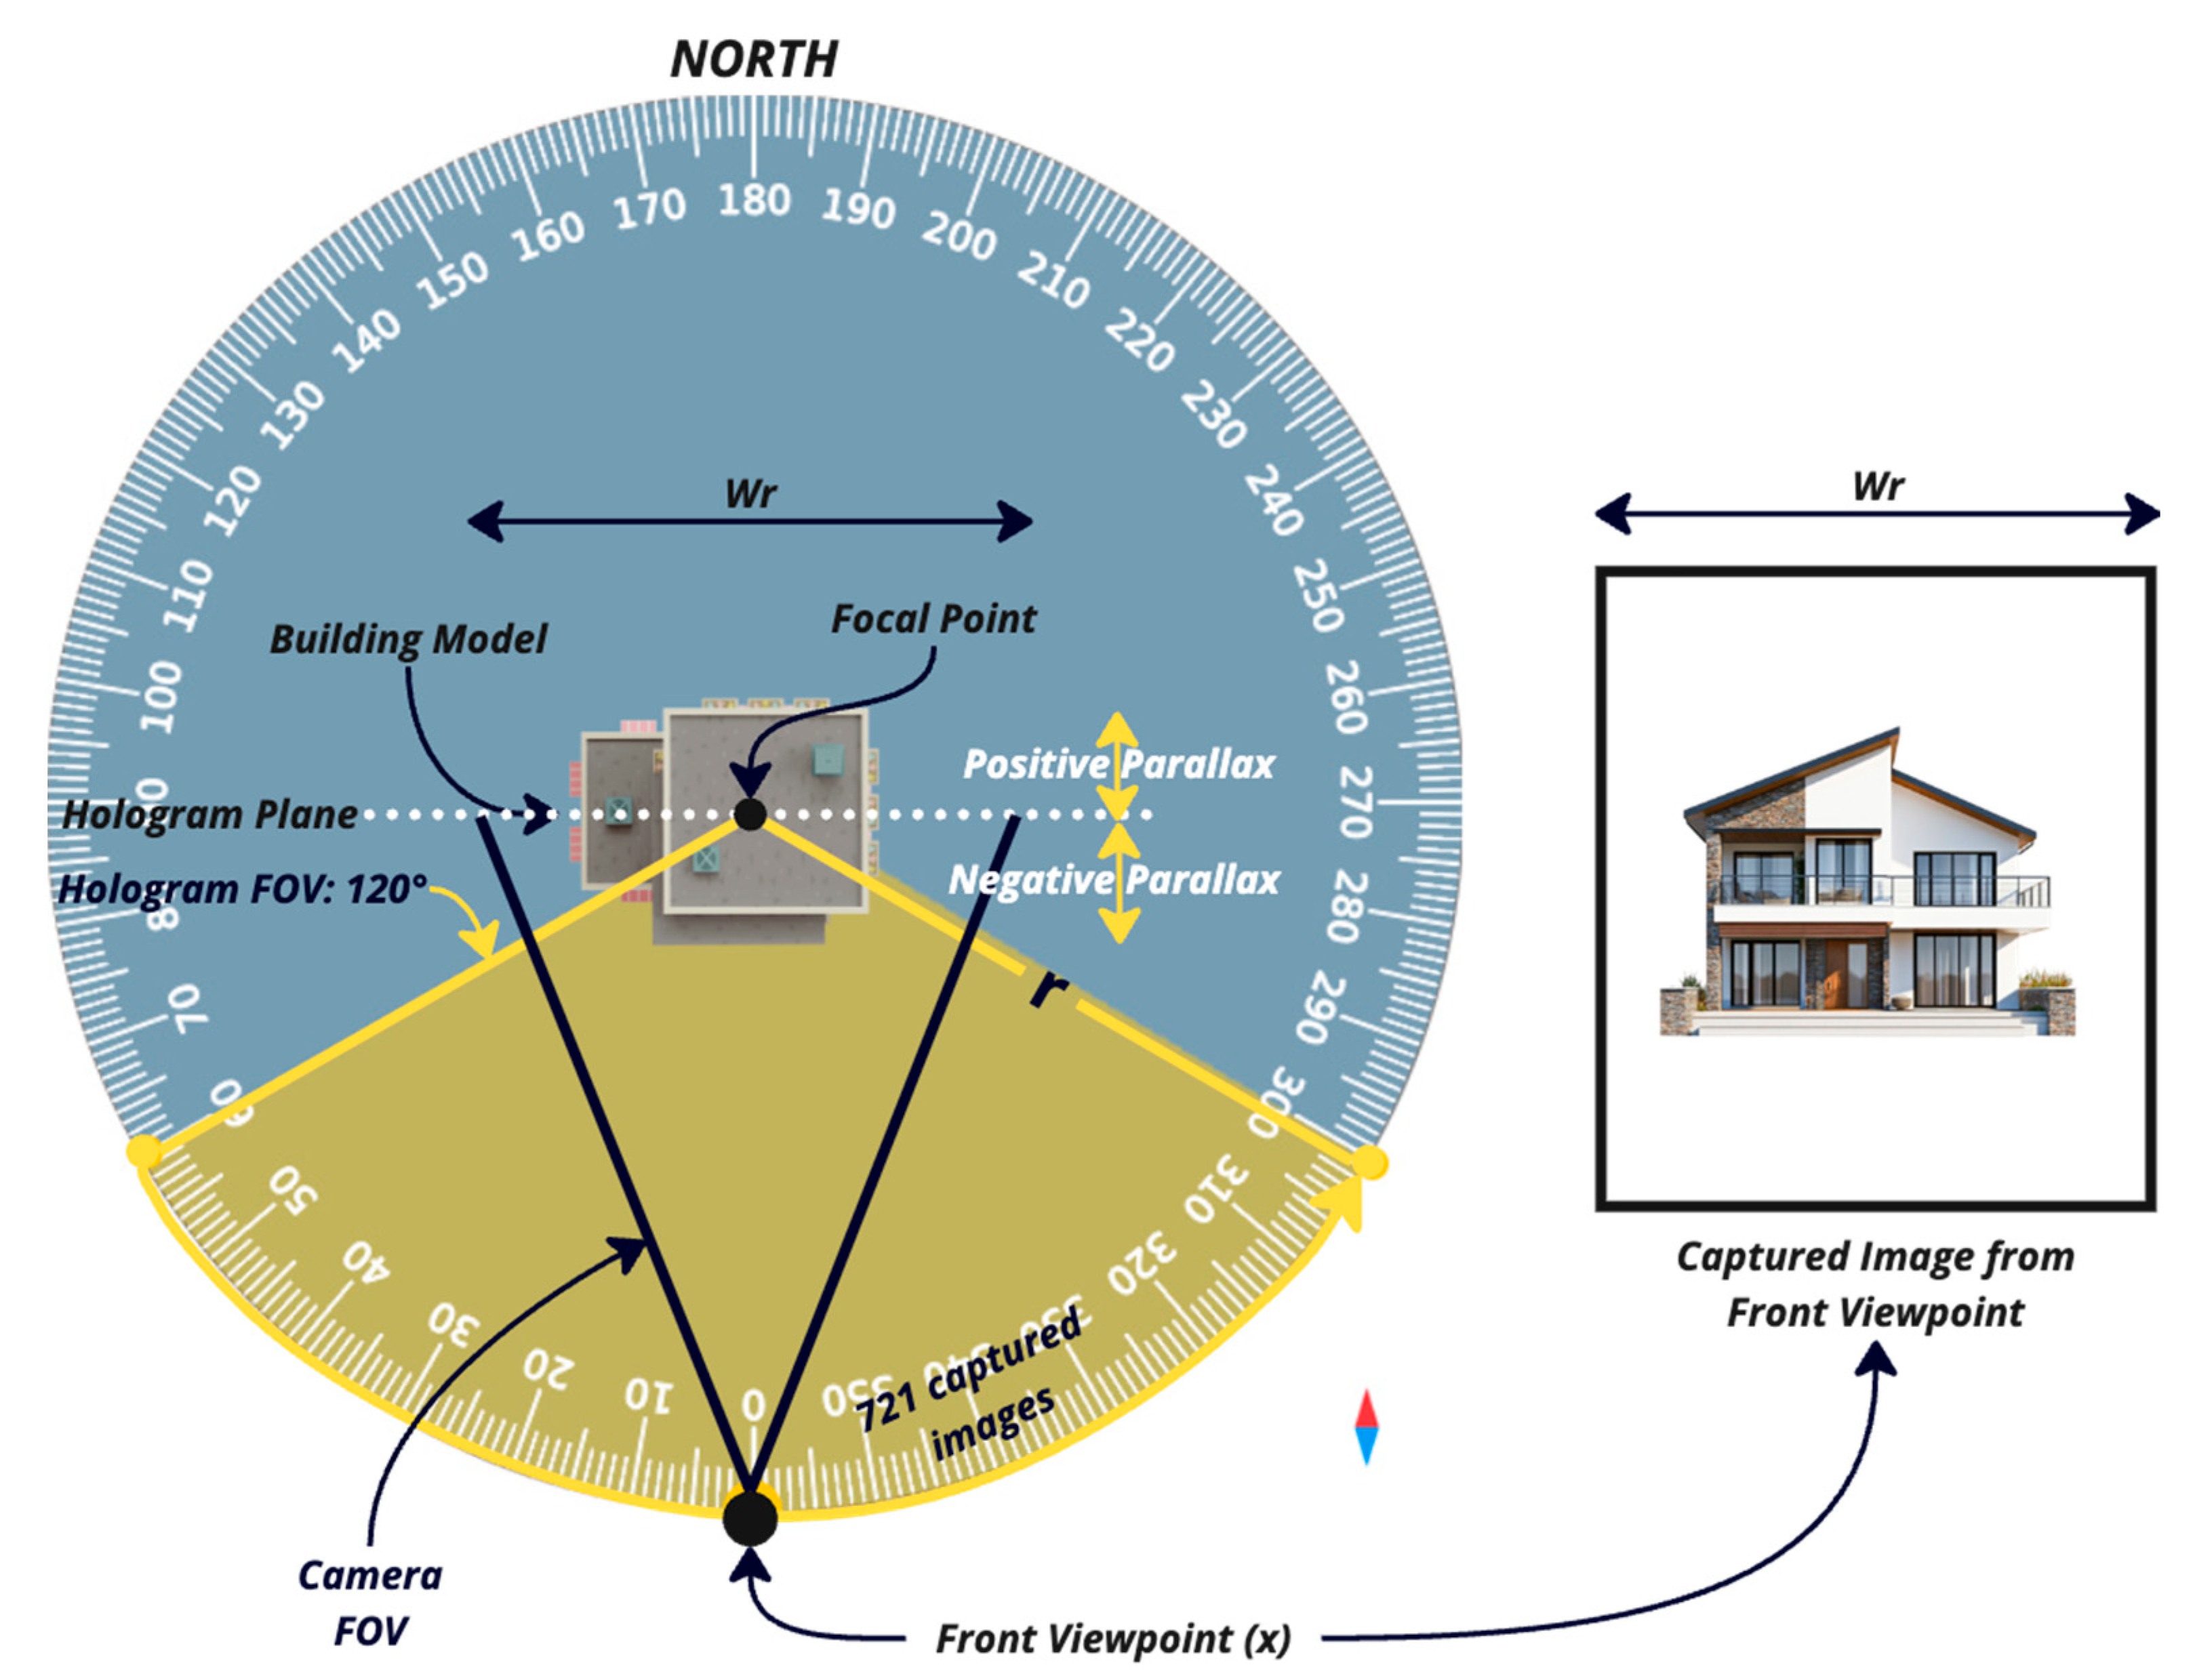
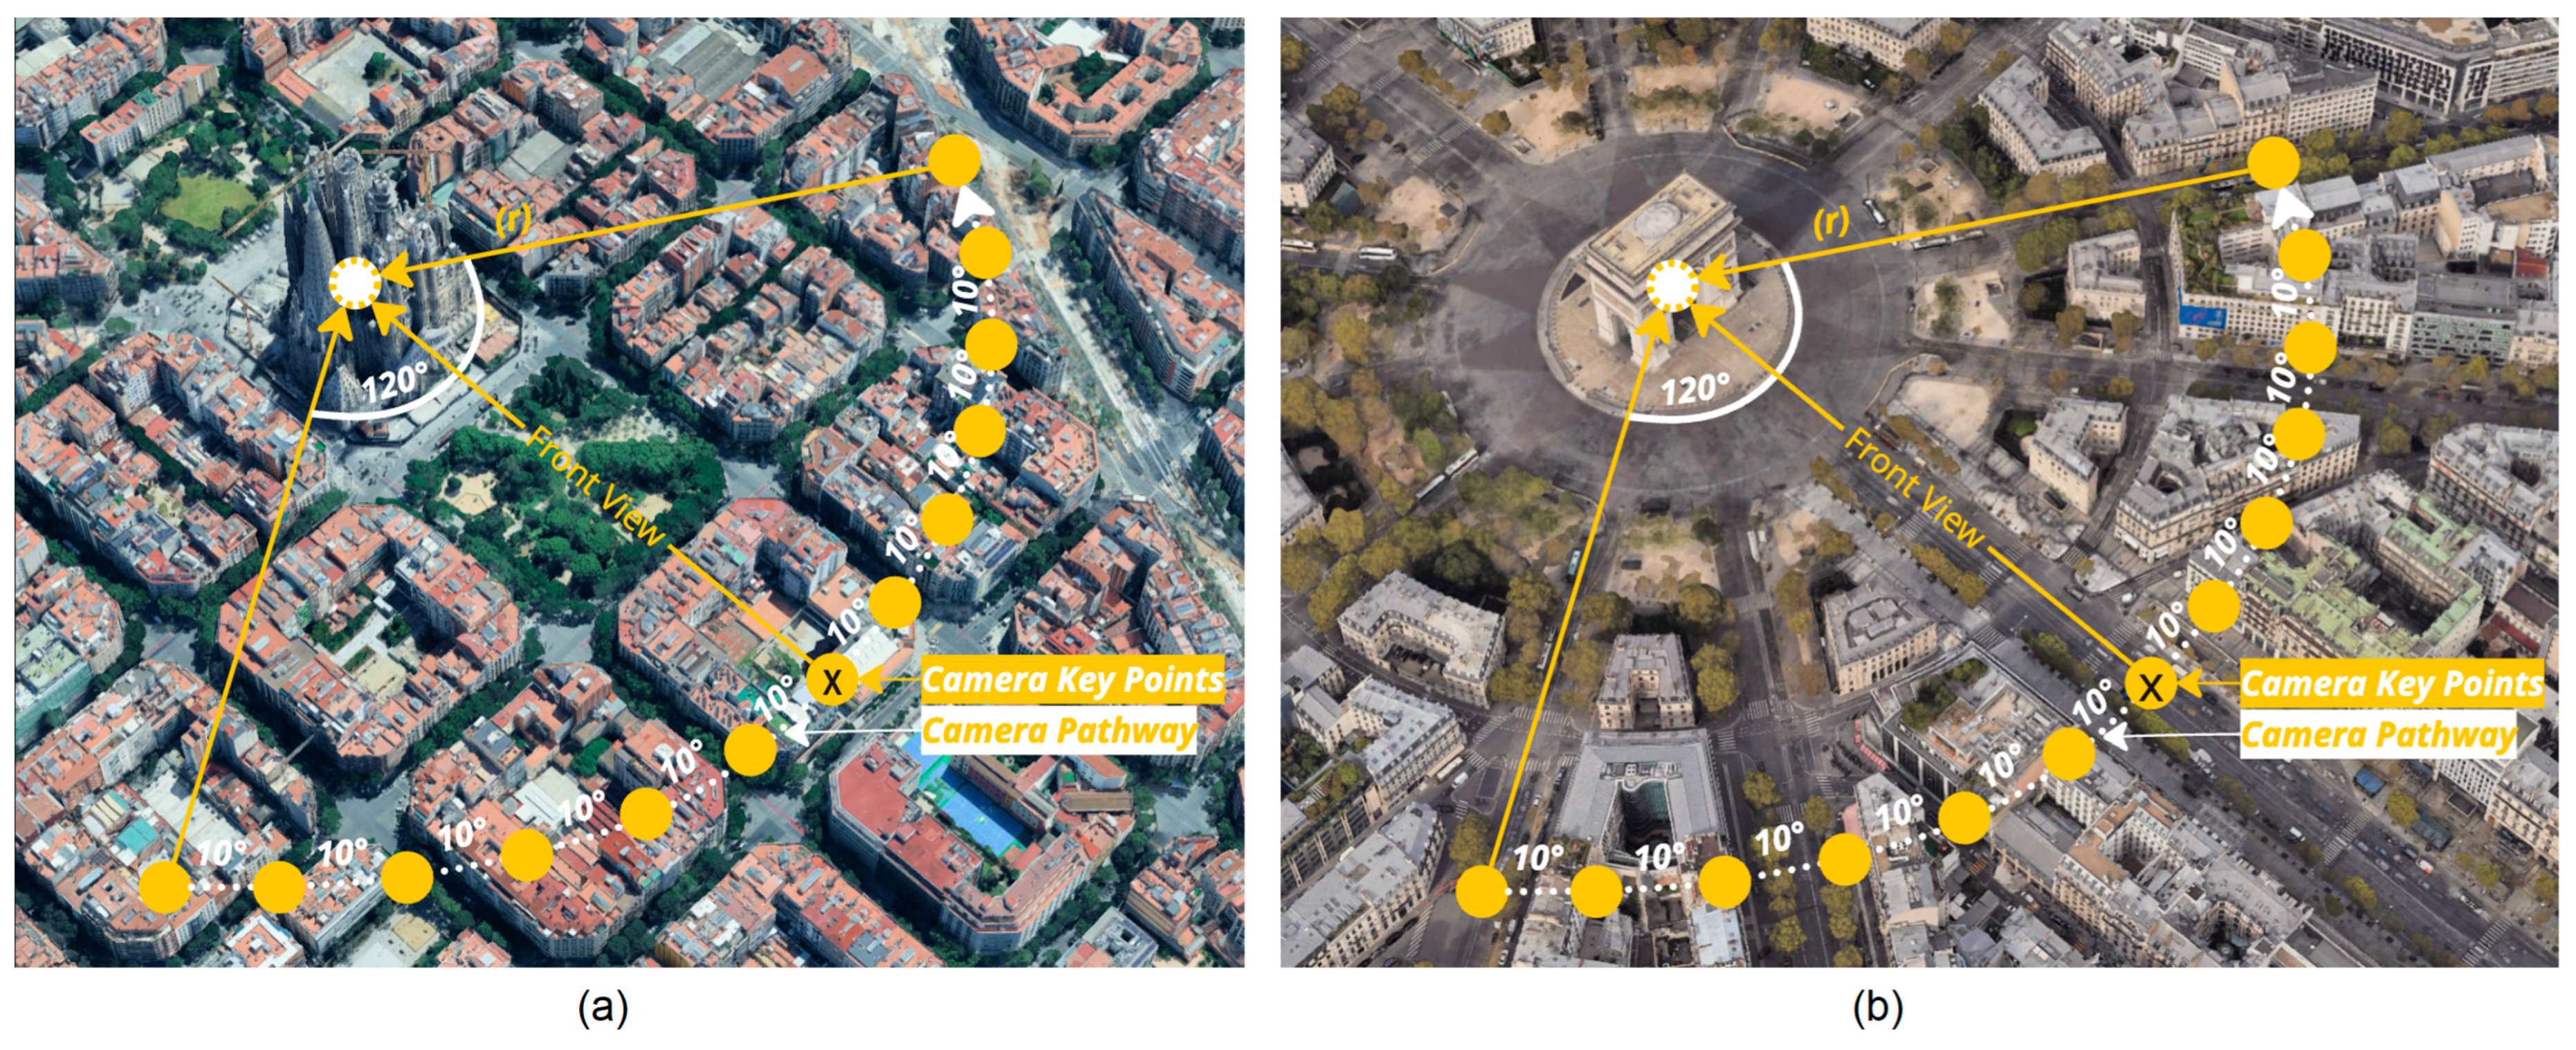
To generate sufficient data to produce a half-parallax hologram using the CHIMERA printer, 721 images must be captured from evenly distributed positions surrounding the subject, spanning a total arc of 120° for multi-perspective vision. To ensure an optimal field of view in the final hologram, buildings are carefully selected based on their unobstructed visibility within this angular range. When the available viewing angle is restricted, due to surrounding structures or urban density, the resulting parallax and effective holographic field are proportionally reduced. This resulted in a half-parallax hologram with a 120° field of view centered on the model. The axis of rotation for the 120° arc was aligned with the focal point of the camera angle, intersecting the hologram plane. Consequently, regions in front of the hologram plane facing the camera position exhibited a negative parallax effect and appeared to protrude outward in the hologram, whereas regions behind the plane displayed a positive parallax effect, creating a sense of depth extending inward. The distance (r) between the camera and focal point, or rotation radius, was determined by the specific requirements of the building or urban model that the hologram was intended to represent. This variable distance allowed for the tailoring of the parallax effect and depth perception to suit different architectural and urban contexts.
2.3. Defining Recording Object Orientation and Navigation in Google Earth
As Earth Studio lacked built-in tools for measuring distances and angles, Google Earth was used for these measurements. Google Earth was configured using the same dataset and navigation settings as Google Earth Studio. Using Google Earth, the recording angle width (Wr), optimal camera key point for viewing the building model in front view, and the distance from the camera to the target point on the building (r) were determined (
Figure 2).
The recording angle width (Wr) refers to the actual width of the area captured within a frame. Based on the frame dimensions and diagonal field of view (FOV) used by the camera on Google Earth, which is approximately 40°, the distance from the camera to the building (r) can be determined using Equation (1). This integrated calculation allows for the precise control of camera positioning in relation to the target area, ensuring consistent and accurate spatial data acquisition for 3D visualization and holographic projection in virtual urban environments. In this calculation, (a) represents the aspect ratio of the frame, which is calculated as the ratio of the width to the height of the captured frame. The equation is derived from trigonometric relationships involving the diagonal FOV and geometric conversions between the width and diagonal length, incorporating the aspect ratio and the known real-world frame width.
The heading value of the front viewpoint, measured in degrees along a 0° to 360° circular scale according to the navigation systems of Google Earth and Google Earth Studio, must be determined first. This heading is a critical reference parameter because it is used to calculate the heading values of the other viewpoints positioned along a 120° sector around the front viewpoint with the building as the center point of the arc. For example, when the front viewpoint is defined as 0° on the 360° navigation circle used in Google Earth and Google Earth Studio, the 120° sector for image data collection spans 300–60° and is centered around the target building. Similarly, if the front viewpoint is positioned at 290°, the corresponding sector extends from 230° to 350°. When the front viewpoint is set to 40°, the image acquisition sector ranges from 340° to 100°. These examples illustrate how the angular sectors are symmetrically defined around a central viewpoint in a circular coordinate system.
2.4. Extracting Image Data from Google Earth
Following the selection of suitable structures for the experiment, the next phase involved the extraction of image data using Google Earth Studio. This process began by configuring a workspace with a width and height of 1320 and 1760 pixels, respectively. The frame rate was set at 60 fps. Subsequently, the optimal field of view (F) was selected to effectively capture the structure and define a fixed camera target. In Earth Studio, the camera target ensured consistent focus on the intended subject throughout the animation. For holographic data acquisition, the target was typically positioned at the geometric center of the structure, corresponding to the final reconstruction plane of the hologram.
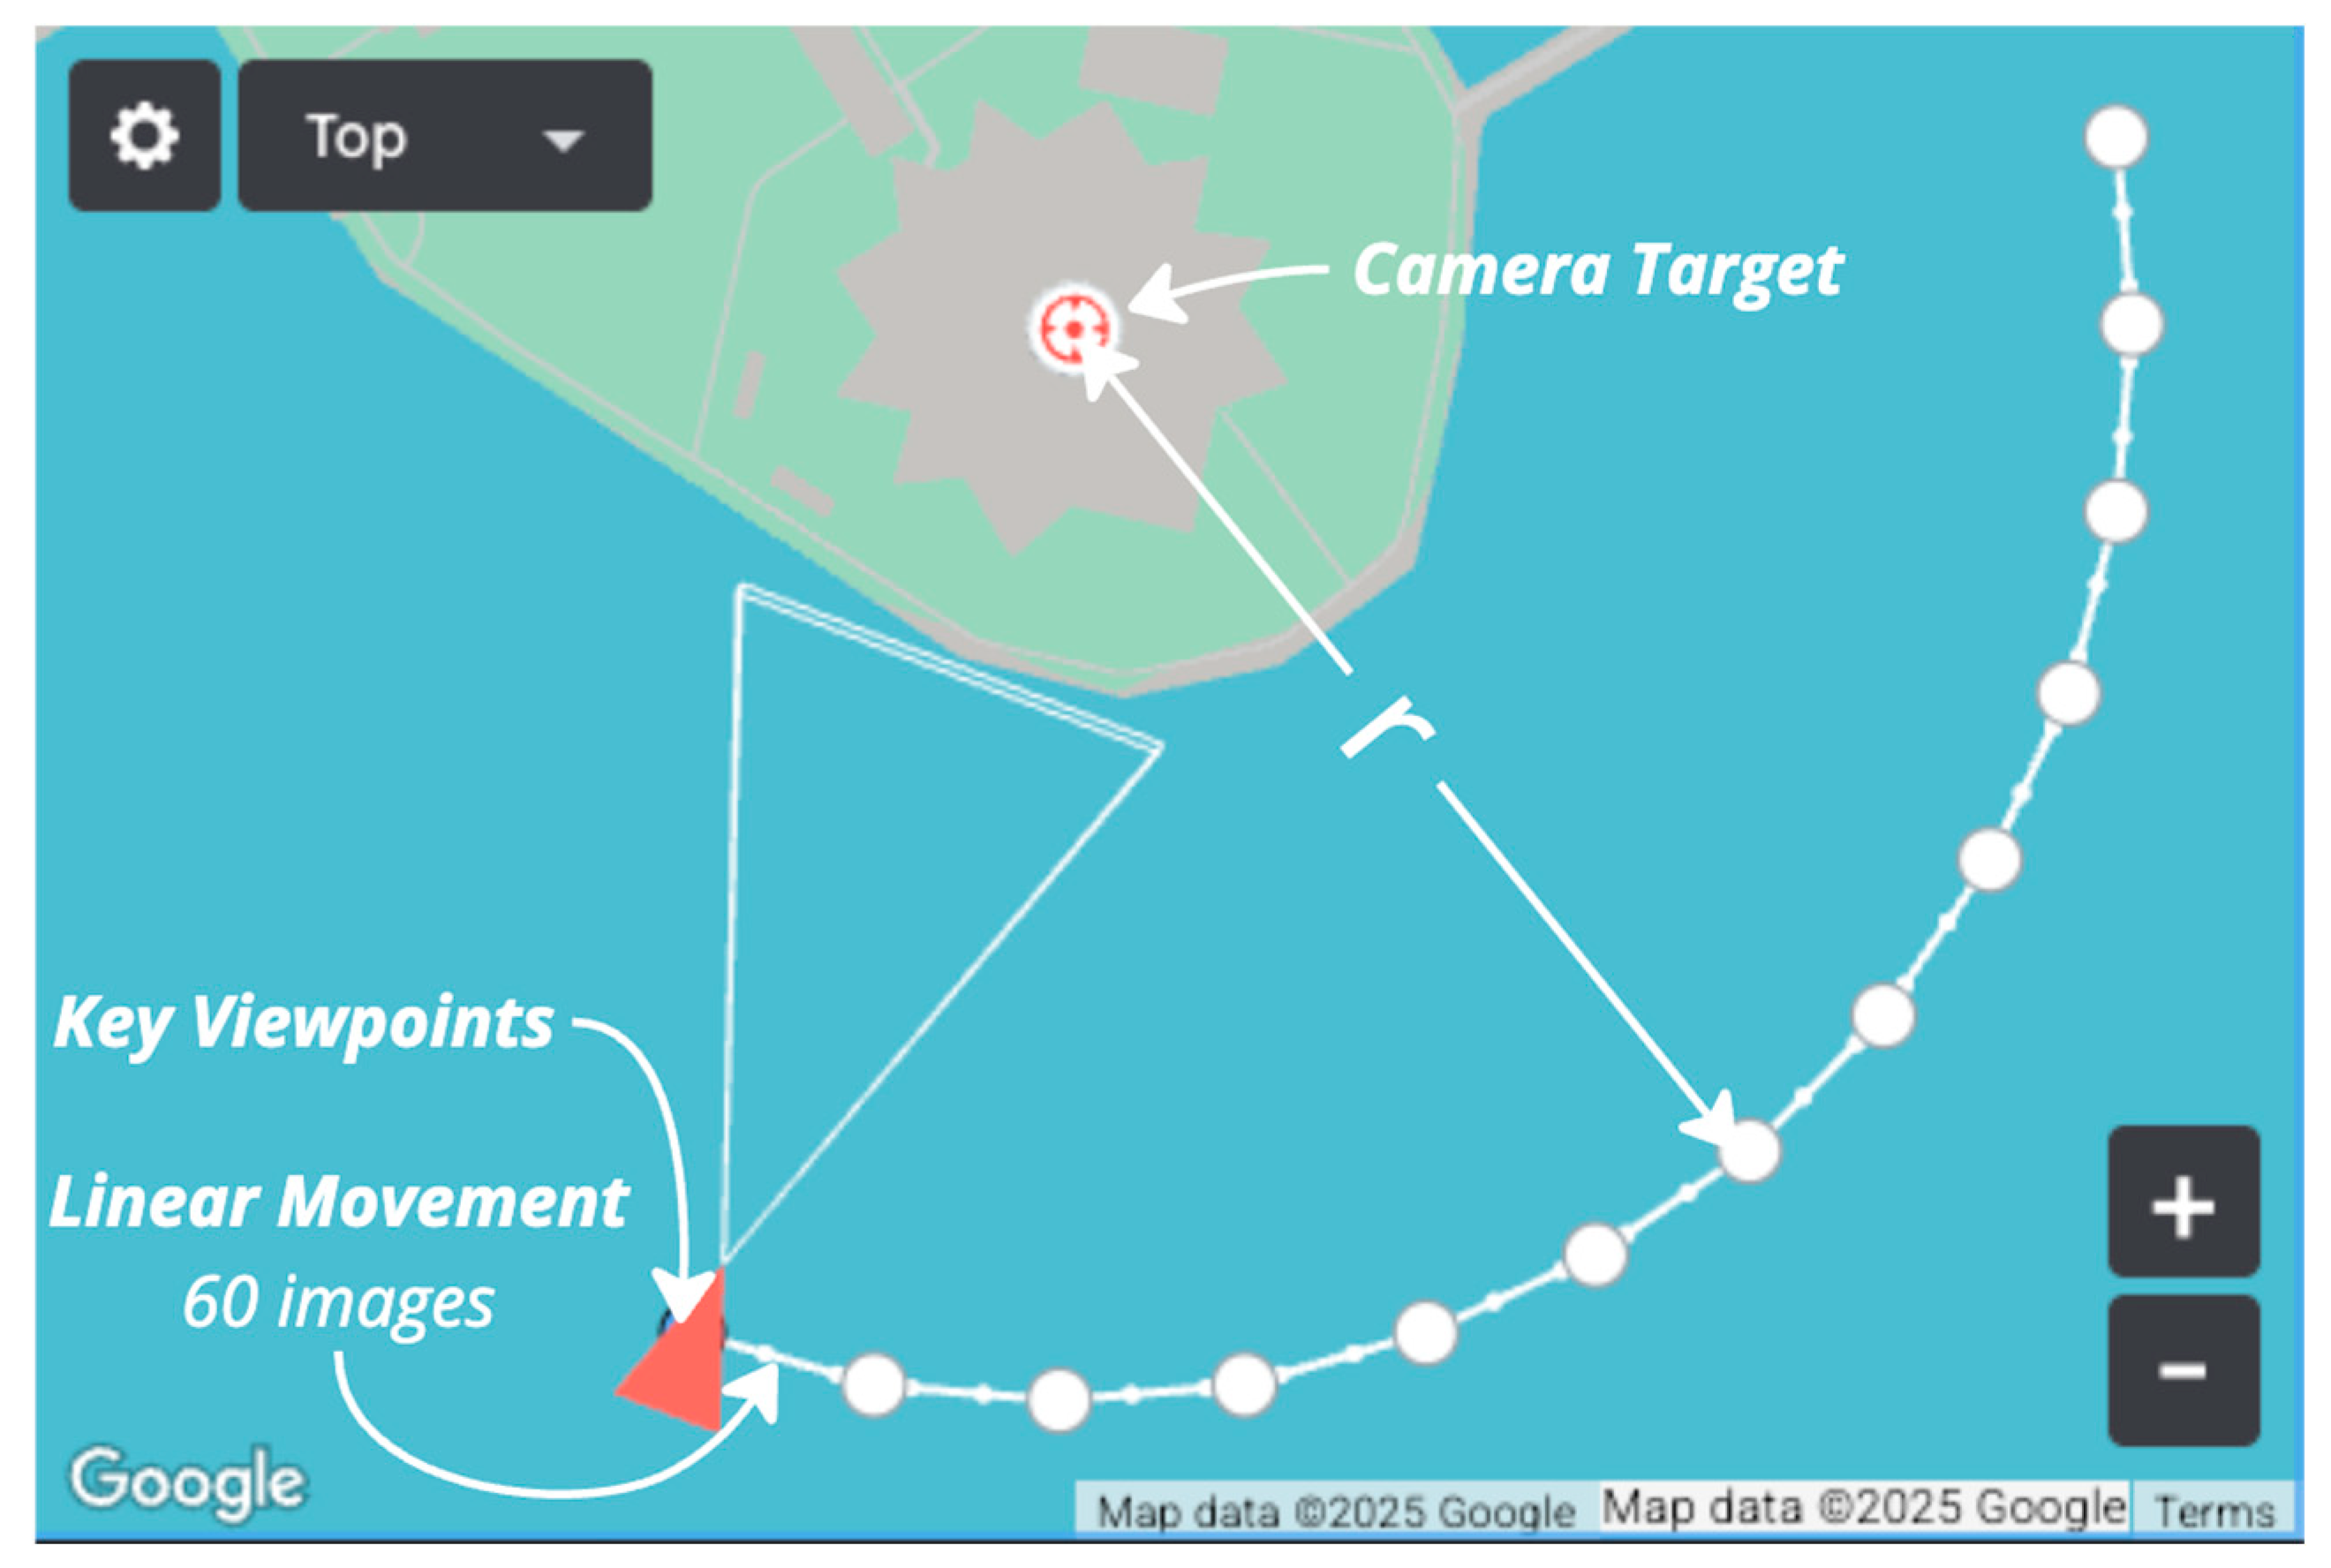
A total of 13 key viewpoints were used to define a 120° arc and their corresponding coordinates were entered into Google Earth Studio to generate the camera path for rendering. Each key point was spaced 60 frames apart, resulting in 721 rendered frames that satisfied the quantity required for CHIMERA hologram printing. Notably, when the camera transitioned between key points in Earth Studio, it followed a linear trajectory rather than a smooth arc. As a result, although the intended path formed a 120° circular arc with key viewpoints spaced at 10° intervals, the actual camera motion occurred in straight-line segments, causing slight variations in the distance (r) between the camera and target point (
Figure 3).
Nonetheless, this deviation had a minimal impact on the resulting image data. Given the relatively small angular separation between key points, the variation in distance was imperceptible to the human eye and did not affect the quality of the holographic reconstruction.
All 13 key viewpoint coordinates in Google Earth Studio could be calculated based on the camera target coordinates and radius (r), which was the distance between the camera target and all key viewpoints. Using the coordinates of the camera target, that is, latitude—
, longitude—
, and altitude—
, along with the radius (r) from the camera to the object, Equations (2) and (3) were applied to compute the latitude (
) and longitude (
) of each camera key point. The altitude (
) of all key points could be set flexibly based on the different circumstances of the area surrounding the recording objects, which implies that all key points had the same selected altitude.
Here, x is the key viewpoint of the camera position on the Google Earth Studio navigation circle, ranging around the camera target. For example, if the corresponding 120° sector extends from 260° to 20°, then the 13 key viewpoints are 260°, 270°, 280°, 290°, 300°, 310°, 320°, 330°, 340°, 350°, 0°, 10°, and 20° (
Figure 4). Additionally,
is the latitude of the key viewpoint (x),
is the longitude of the key point (x),
is the altitude of the key viewpoint (x),
is the latitude of the camera target,
is the longitude of the camera target, and r is the distance between the camera points and the camera target/radius of a 120° arc.
2.5. CHIMERA Hologram Recordings and Development
Custom in-house software was employed to process the perspective image sets and generate the corresponding hogel (holographic pixel) [
29] data required for holographic printing. Subsequently, each hogel was sequentially recorded using an RGB display system composed of three spatial light modulators (SLMs) and a 120° full-color optical printing head. The holographic information for each RGB hogel was encoded onto an Ultimate U04 silver halide plate [
30] via interference with a coherent reference beam.
The hogels measured 250 µm in size, and the system operated at a printing rate of 60 Hz, enabling high-throughput and high-resolution recording. The CHIMERA holoprinter utilized three diode-pumped solid-state (DPSS) lasers with an output power of 20 mW and wavelengths of 640 nm (red), 532 nm (green), and 457 nm (blue).
Ultimate U04 plates were developed specifically for full-color digital holography. These isopanchromatic plates exhibited uniform sensitivity across the visible spectrum and were optimized for minimal light scattering, thereby ensuring superior image fidelity and color accuracy. The development process was conducted using two safe and easy-to-handle chemical baths suitable for laboratory and production environments.
2.6. Hologram Sealing and Illumination
The final holograms were reconstructed using the same wavelengths as those used during the recording process to ensure accurate color and depth reproduction. To preserve the dimensional stability and prevent variations in emulsion thickness, such as swelling or shrinkage owing to environmental changes in humidity or temperature, a second glass plate was affixed to the hologram using an optical-grade UV-curable adhesive.
The reconstruction required a point light source that closely matched the original recording wavelength. RGB light-emitting diodes (LEDs) were particularly well-suited for this application, as their emission peaks aligned with those of the RGB lasers used in the CHIMERA recording process [
31]. For optimal display conditions, an RGB LED was positioned 50 cm from the center of the hologram at an angle of 45° to ensure uniform and effective illumination.
3. Results
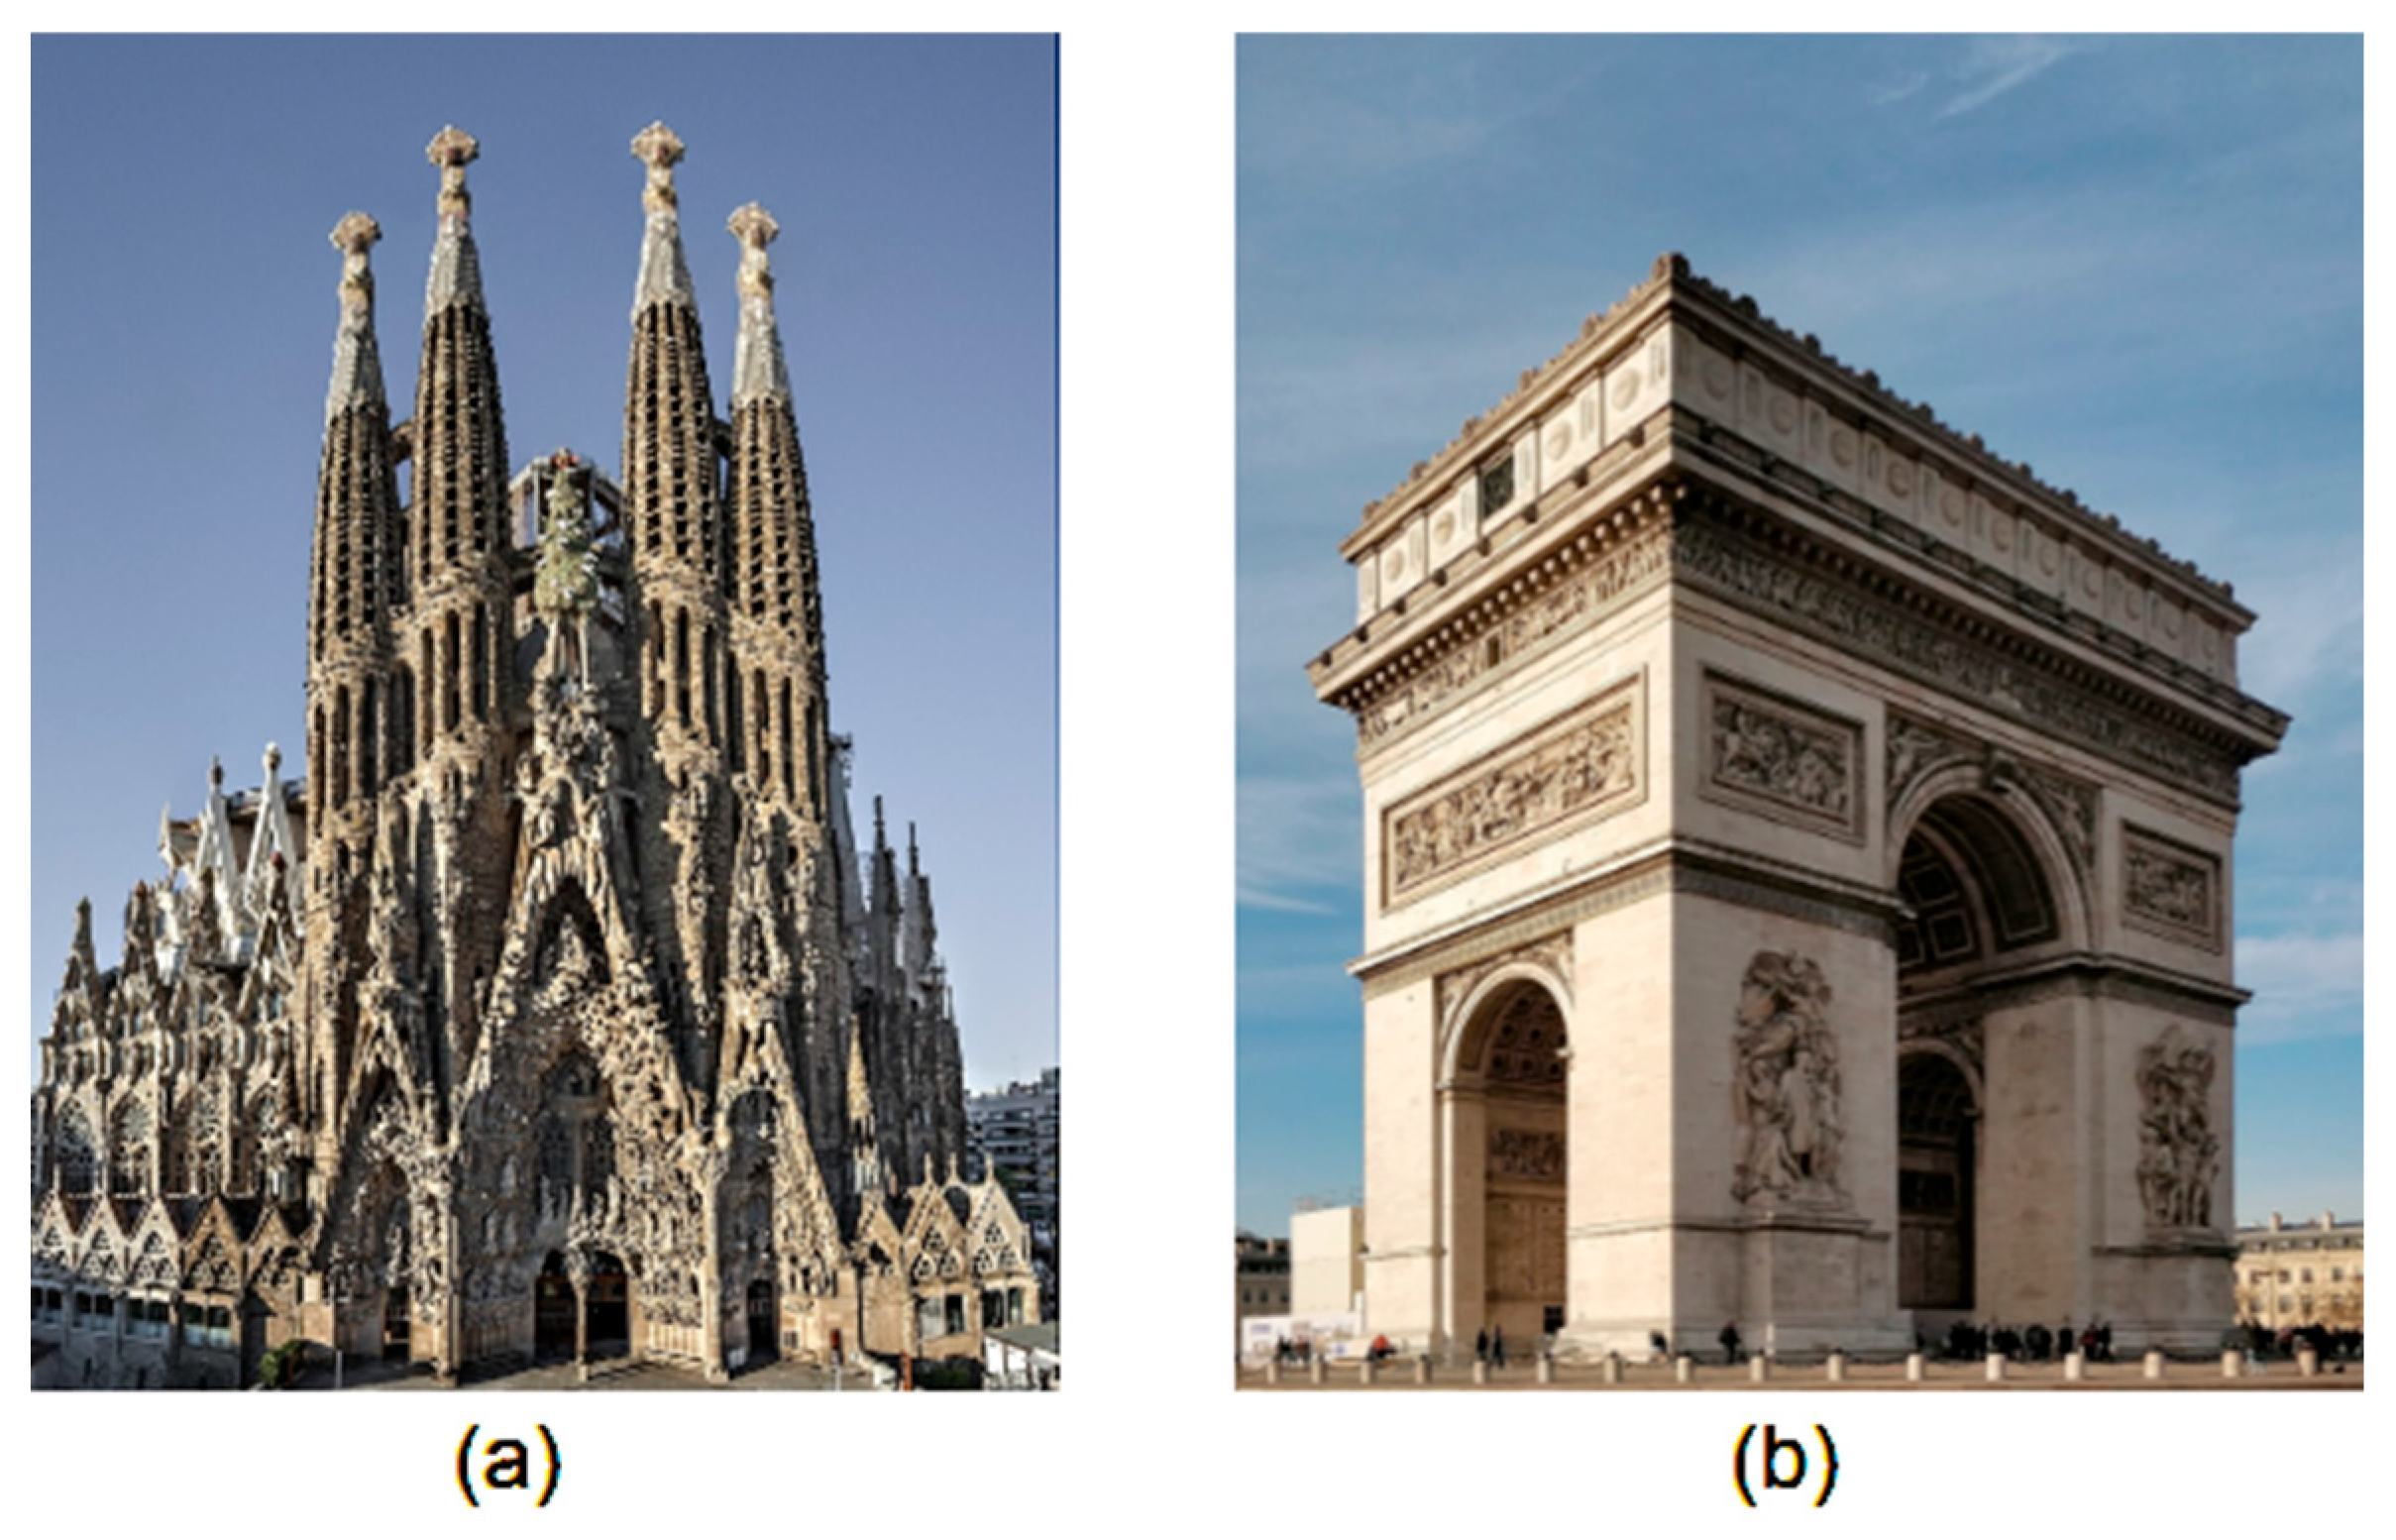
Based on the established selection criteria, two iconic sites were selected for this study: the Basílica de la Sagrada Família (Barcelona, Spain) and the Arc de Triomphe (Paris, France) (
Figure 5). These landmarks, recognizable to most people, offer rich architectural detail and complex volumetric structures and were accurately represented within the Earth Studio dataset. While no rigid criteria restricted the choice, their high level of public recognition and strong geometric presence rendered them ideal candidates for testing the fidelity and visual impact of holographic reconstructions. Initially, the entire pipeline was developed using the Sagrada Família. It was subsequently validated with the Arc de Triomphe to ensure generalizability and robustness, confirming consistent performance across different structural typologies.
The Sagrada Família, designed by renowned Catalan architect Antoni Gaudí, is a UNESCO World Heritage Site and one of the most distinctive examples of modernist architecture. Still under construction since 1882, the Basílica embodies a unique fusion of the Gothic tradition, organic symbolism, and advanced engineering. Conversely, the Arc de Triomphe, inaugurated in 1836, has been a monumental symbol of national pride, commemorating those who fought and died in France during the French Revolutionary and Napoleonic Wars. Its neoclassical design, sculptural relief, and central location at Charles de Gaulle make it one of Paris most historically and culturally significant landmarks.
For both selected sites, a central viewpoint and optimal 120° sector were identified for image capture. For the Sagrada Família in Barcelona, the Nativity Facade was selected (
Figure 6a). Located on the northeastern side of the Basílica and facing Carrer de la Marina, this facade is renowned for its highly detailed, organic forms and deeply symbolic iconography, that is, hallmarks of Antoni Gaudí’s architectural vision, which blends natural inspiration with spiritual meaning. Dedicated to the birth of Jesus Christ, the facade celebrates the themes of life, joy, and creation. It comprises three porticos, each representing the theological virtues of Faith, Hope, and Charity. The surface is adorned with intricate sculptural elements depicting biblical scenes, animals, plants, and angels, all of which evoke the divine beauty of creation. Notably, the Nativity Facade was the first to be completed and the only one Gaudí saw partially constructed during his lifetime.
In Paris, the eastern facade of the Arc de Triomphe was chosen (
Figure 6b), facing the Avenue des Champs-Élysées and viewed from Place Charles de Gaulle, with the La Défense skyline visible in the distance. This side of the monument is distinguished by two prominent relief sculptures: on the north pillar, Le Triomphe de 1810, by Jean-Pierre Cortot, celebrates Napoleon’s diplomatic and military achievements; on the south pillar, La Résistance de 1814, by Antoine Étex, symbolizes French resilience during the Allied invasion. Together, these sculptures have embodied themes of heroism, patriotism, and sacrifice, paying tribute to those who fought and died during the French Revolutionary and Napoleonic Wars. The architectural symmetry and historical gravity of this facade render it an ideal subject for volumetric holographic reconstruction.
For each of the two selected sites, a total of 13 keyframe positions—defined by their latitude and longitude—were computed using Equations (2) and (3), as shown in
Table 1 and illustrated in
Figure 7. The altitude was set to 115 m for Sagrada Família and 100 m for Arc de Triomphe, reflecting the relative elevation required for optimal image capture.
Using the defined camera trajectory, 712 high-resolution frames were rendered per site, satisfying the required number of perspective images for the CHIMERA hologram fabrication.
Videos S1 and S2 show the resulting image sequences for the Sagrada Família and Arc de Triomphe, respectively.
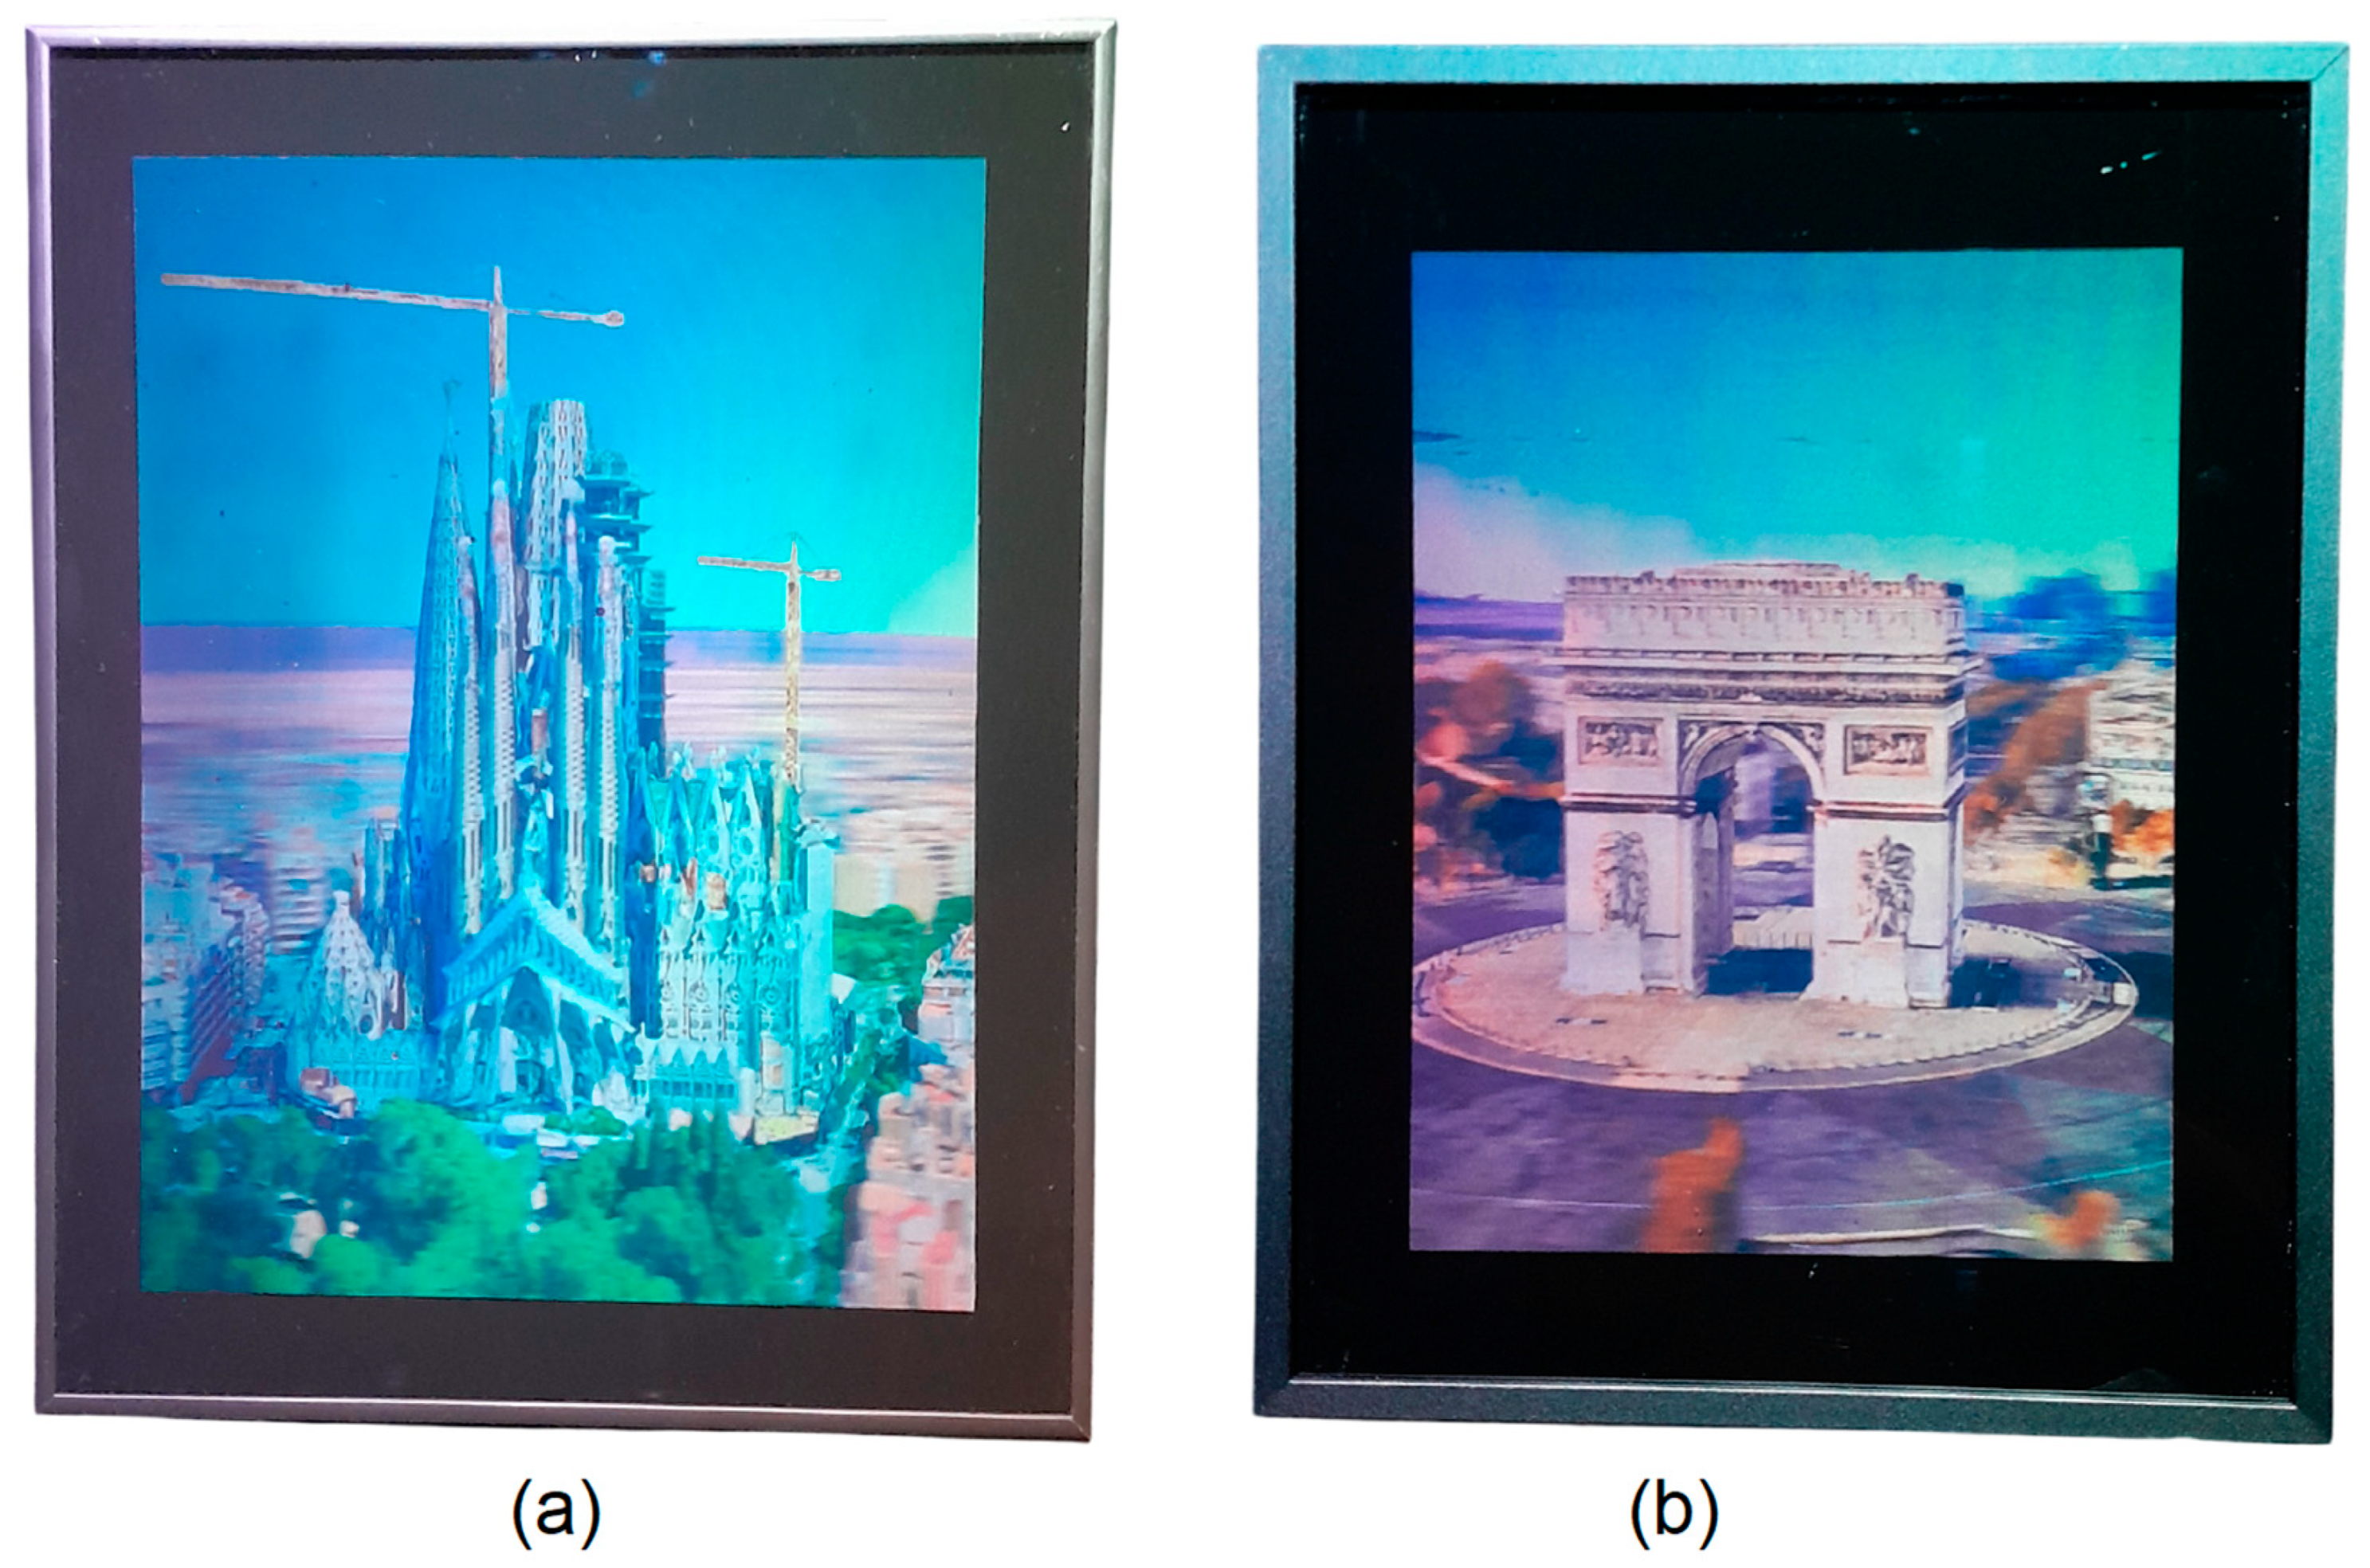
Hogels were generated from perspective images and sequentially recorded on two 15 × 20 cm U04 holographic plates using a CHIMERA holoprinter. Upon illumination with an RGB LED light source positioned 50 cm away at a 45° angle, the holograms produced a vivid, full-color, and realistic 3D reconstruction of the Sagrada Família and Arc de Triomphe, as shown in
Figure 8 and
Video S3.
4. Discussion
Our results validate the feasibility and visual quality of the proposed pipeline, which converts photogrammetrically derived 3D imagery from Google Earth Studio into immersive holographic stereograms without requiring on-site scanning or modeling. We demonstrated the feasibility of leveraging the photogrammetrically reconstructed urban environments of Google Earth Studio to create high-quality full-color digital holographic stereograms using the CHIMERA printing system. Our method addressed several critical limitations of traditional 3D data-acquisition techniques, such as the time- and labor-intensive nature of LiDAR scanning, drone photogrammetry, and manual 3D modeling.
By defining a 120° capture arc centered on the frontal axis of each building and sampling 13 key camera positions, we generated a sufficient number of parallax-rich perspective images for effective holographic printing. Each image was rendered in Earth Studio at a resolution suitable for holographic display, and the resulting 721-frame sequence was processed using custom software to generate the hogel data. Further, the use of Ultimate U04 isopanchromatic plates combined with an RGB SLM-based CHIMERA system yielded holograms with excellent color fidelity, sharpness, and parallax response. The 250 μm hogel resolution ensured that the hogel grid was imperceptible to the naked eye, contributing to a seamless visual experience. Upon reconstruction with RGB LEDs, the resulting holograms exhibited vivid 3D depth cues and realistic rendering of architectural forms, as confirmed by qualitative evaluation of both the Basílica de la Sagrada Família and the Arc de Triomphe.
A key innovation in this pipeline is the use of freely accessible global 3D datasets to produce high-resolution holograms without requiring physical data capture. Despite the original intent of Earth Studio as a cinematographic tool, its ability to lock camera targets and export frame sequences with consistent focal lengths and angular precision has proven critical for hologram generation. Furthermore, the external computation of precise camera positions using geospatial data enabled us to overcome the native limitations of Earth Studio in terms of angular control, thereby creating a reliable pipeline for consistent data acquisition.
However, certain limitations must be acknowledged. The current method only describes half-parallax holography because the camera trajectory is confined to a horizontal arc. Additional vertical viewpoints are required for full-parallax holograms. Moreover, reliance on the accuracy and completeness of photogrammetric data in Google Earth Studio implies that certain urban scenes with occlusions or incomplete geometries may lead to reduced visual quality.
In real-world scenarios, many buildings are obstructed by surrounding structures, vegetation, or urban infrastructure, which may hinder the completeness of perspective data and impact the quality of holographic reconstructions. While our method is optimized for open-sight conditions and iconic landmarks, which are typically located in areas with preserved visual access, it is not universally applicable to all urban contexts.
While the method proves particularly effective for prominent landmarks with unobstructed views, its broader applicability is constrained by the quality and completeness of publicly available 3D datasets. In dense urban environments or areas with limited visibility, issues such as occlusions, simplified geometry, or outdated textures can compromise the fidelity of the resulting holograms. To mitigate these limitations, future work should explore hybrid strategies that combine Earth Studio imagery with
Supplementary Datasets or AI-assisted scene completion, aiming to extend the utility of the workflow to more complex or partially inaccessible architectural contexts.
5. Conclusions
This study proposed a practical workflow for converting publicly accessible 3D geographic data from Google Earth Studio into high-quality digital holographic stereograms. By integrating Earth Studio rendering with CHIMERA holographic printing, we successfully reconstructed realistic holograms of iconic landmarks without the need for physical site visits or manual 3D modeling. This approach is highly scalable and democratizes access to architectural holography, making it viable for museums, educational exhibits, city planning applications, and digital heritage preservation. It offers a cost-effective and flexible alternative to traditional holography pipelines, reducing the dependence on specialized equipment or field data collection.
A key limitation of this study was the exclusive use of a horizontal viewing arc, which restricted the hologram to a half-parallax. Future extensions of this research will focus on incorporating vertical parallax, automating camera trajectory computations, and integrating AI-based enhancements to further improve the rendition of the final holograms.
Supplementary Materials
The following supporting information can be downloaded at:
https://www.mdpi.com/article/10.3390/app15116179/s1, Video S1: image sequences for the Sagrada Família; Video S2: image sequences for Arc de Triomphe; Video S3: Full-color CHIMERA holograms of Sagrada Família and Arc de Triomphe.
Author Contributions
Conceptualization, P.G.; methodology, P.G. and T.L.P.D.; software, T.L.P.D.; validation, P.G., L.H. and. S.L.; investigation, P.G., T.L.P.D., J.F.U.A. and O.M.N.; resources, L.H. and S.L.; writing—original draft preparation, P.G., T.L.P.D., J.F.U.A. and O.M.N.; writing—review and editing, P.G. and T.L.P.D.; visualization, P.G. and T.L.P.D.; supervision, P.G.; project administration, P.G.; funding acquisition, S.L. All authors have read and agreed to the published version of the manuscript.
Funding
This research was supported by a Korea Creative Content Agency (KOCCA) grant funded by the Ministry of Culture, Sports, and Tourism (MCST) in 2025 (RS-2024-00401213), MSIT (Ministry of Science and ICT), Korea, under the ITRC (Information Technology Research Center) support program (IITP-2025-II201846) supervised by the IITP (Institute for Information and Communications Technology Planning and Evaluation). The present research was conducted through the excellent researcher support project of Kwangwoon University in 2023.
Data Availability Statement
The original contributions presented in the study are included in the article/
Supplementary Materials; further inquiries can be directed to the corresponding author.
Conflicts of Interest
The authors declare no conflicts of interest.
References
- Do, T.L.P.; Coffin, M.; Gentet, P.; Hwang, L.; Lee, S. Development of a Tabletop Hologram for Spatial Visualization: Application in the Field of Architectural and Urban Design. Buildings 2024, 14, 2030. [Google Scholar] [CrossRef]
- Google Earth Studio. Available online: https://www.google.com/earth/studio/ (accessed on 7 May 2025).
- Zhao, L.; Wang, H.; Zhu, Y.; Song, M. A review of 3D reconstruction from high-resolution urban satellite images. Int. J. Remote Sens. 2023, 44, 713–748. [Google Scholar] [CrossRef]
- Sharma, S.A.; Agrawal, R.; Jayaprasad, P. Development of ‘3D City Models’ using IRS Satellite Data. J. Indian Soc. Remote Sens. 2016, 44, 187–196. [Google Scholar] [CrossRef]
- Lafarge, F.; Descombes, X.; Zerubia, J.; Deseilligny, M.-P. An Automatic 3D City Model: A Bayesian Approach Using Satellite Images. In Proceedings of the 2006 IEEE International Conference on Acoustics Speech and Signal Processing, Toulouse, France, 14–19 May 2006; p. II. [Google Scholar] [CrossRef]
- Patterson, T.C. Google Earth as a (Not Just) Geography Education Tool. J. Geography 2007, 106, 145–152. [Google Scholar] [CrossRef]
- Demirci, A.; Karaburun, A.; Kılar, H. Using Google Earth as an educational tool in secondary school geography lessons. Int. Res. Geograph. Environ. Educ. 2013, 22, 277–290. [Google Scholar] [CrossRef]
- Romero, E.; Artal-Sevil, J.S.; Mir, J.M.; Artacho, J.M. Improving learning through g suite for education. Use of ‘google universe’ apps in the classroom. In Proceedings of the INTED2018, Valencia, Spain, 5–7 March 2018; pp. 7719–7728. [Google Scholar]
- Sugianto, E.; Hosea, J.F.; Jabar, B.A.; Irwansyah, E.; Fitrianah, D. 3D Modelling Building of District Johar Baru Using ArcGIS Pro and CityEngine. Procedia Comput. Sci. 2023, 227, 623–631. [Google Scholar] [CrossRef]
- Hochstaedter, A.; Sullivan, D. Oceanography and Google Earth: Observing ocean processes with time animations and student-built ocean drifters. Geol. Soc. Am. 2012, 492, 441–451. [Google Scholar]
- Cybulski, P. Design rules and practices for animated maps online. J. Spat. Sci. 2016, 61, 461–471. [Google Scholar] [CrossRef]
- Schiewe, J.; Ehlers, M. A novel method for generating 3D city models from high resolution and multi-sensor remote sensing data. Int. J. Remote Sens. 2005, 26, 683–698. [Google Scholar] [CrossRef]
- Tooth, S. Google Earth as a resource. Geography 2015, 100, 51–56. [Google Scholar] [CrossRef]
- Butler, D. Virtual globes: The web-wide world. Nature 2006, 439, 776–778. [Google Scholar] [CrossRef] [PubMed]
- Yu, L.; Gong, P. Google Earth as a virtual globe tool for Earth science applications at the global scale: Progress and perspectives. Int. J. Remote Sens. 2012, 33, 3966–3986. [Google Scholar] [CrossRef]
- Otamendi, U.; Azpiroz, I.; Quartulli, M.; Olaizola, I.; Perez, F.J.; Alda, D.; Garitano, X. Geo-Imagery Management and Statistical Processing in a Regional Context Using Open Data Cube. In Proceedings of the 2021 IEEE International Geoscience and Remote Sensing Symposium IGARSS, Brussels, Belgium, 11–16 July 2021; pp. 5676–5679. [Google Scholar] [CrossRef]
- Kostrzewa, A. Geoprocessing of archival aerial photos and their scientific applications: A review. Rep. Geodesy Geoinform. 2024, 118, 1–16. [Google Scholar] [CrossRef]
- Guo, H. The digital earth: Understanding our planet in the 21st century. In Manual of Digital Earth; Electronic Photo Controls, Inc.: Alexandria, VA, USA, 1998; p. 843. [Google Scholar]
- Kadirova, D.; Usmanova, M.; Saidova, M.; Djalilova, G.; Namozov, N. Creating a digital model of regional relief using GIS technologies to evaluate degradation processes. E3S Web Conf. 2021, 258, 03025. [Google Scholar] [CrossRef]
- Phan, V.T.; Choo, S.Y. A Combination of Augmented Reality and Google Earth’s facilities for urban planning in idea stage. Int. J. Comput. Appl. 2010, 4, 26–34. [Google Scholar] [CrossRef]
- Luo, L.; Wang, X.; Guo, H.; Lasaponara, R.; Shi, P.; Bachagha, N.; Li, L.; Yao, Y.; Masini, N.; Chen, F.; et al. Google earth as a powerful tool for archaeological and cultural heritage applications: A review. Remote Sens. 2010, 10, 1558. [Google Scholar] [CrossRef]
- Guo, H.; Goodchild, M.F.; Annoni, A. Manual of Digital Earth; Springer Nature: Berlin/Heidelberg, Germany, 2020; p. 852. [Google Scholar]
- Gentet, Y.; Gentet, P. CHIMERA, a new holoprinter technology combining low-power continuous lasers and fast printing. Appl. Opt. 2019, 58, G226–G230. [Google Scholar] [CrossRef] [PubMed]
- Schenk, T. Introduction to Photogrammetry; The Ohio State University: Columbus, OH, USA, 2005. [Google Scholar]
- Collis, R.T.H. Lidar. Appl. Opt. 1970, 9, 1782–1788. [Google Scholar] [CrossRef] [PubMed]
- Wandinger, U. Introduction to Lidar. In Lidar: Range-Resolved Optical Remote Sensing of the Atmosphere; Weitkamp, C., Ed.; Springer: New York, NY, USA, 2005; pp. 1–18. [Google Scholar]
- Fassi, F. 3D modeling of complex architecture integrating different techniques—A critical overview. Remote Sens. Spat. Inf. Sci. 2007, 36, 5. [Google Scholar]
- Santagati, C.; Inzerillo, L.; Di Paola, F. Image-based modeling techniques for architectural heritage 3D digitalization: Limits and potentialities. Int. Arch. Photogramm. Remote Sens. Spat. Inform. Sci. 2013, 40, 555–560. [Google Scholar] [CrossRef]
- Lucente, M. Diffraction-Specific Fringe Computation for Electroholography. Ph.D. Thesis, Massachusetts Institute of Technology, Cambridge, MA, USA, 1994. [Google Scholar]
- Gentet, P.; Gentet, Y.; Lee, S.-H. Ultimate 04 the new reference for ultra-realistic color holography. In Proceedings of the 2017 International Conference on Emerging Trends & Innovation in ICT (ICEI), Pune, India, 3–5 February 2017; pp. 162–166. [Google Scholar]
- Gentet, P.; Gentet, Y.; Lee, S.H. New LED’s Wavelengths Improve Drastically the Quality of Illumination of Pulsed Digital Holograms. In Proceedings of the Digital Holography and Three-Dimensional Imaging, M3A-M4, Optical Society of America, Washington, DC, USA, 29 May–1 June 2017. [Google Scholar]
| Disclaimer/Publisher’s Note: The statements, opinions and data contained in all publications are solely those of the individual author(s) and contributor(s) and not of MDPI and/or the editor(s). MDPI and/or the editor(s) disclaim responsibility for any injury to people or property resulting from any ideas, methods, instructions or products referred to in the content. |
© 2025 by the authors. Licensee MDPI, Basel, Switzerland. This article is an open access article distributed under the terms and conditions of the Creative Commons Attribution (CC BY) license (https://creativecommons.org/licenses/by/4.0/).


 ,
, 


