Article

Risk Assessment of Heavy Rain Disasters Using an Interpretable Random Forest Algorithm Enhanced by MAML

1
School of Water Conservancy and Hydropower Engineering, North China Electric Power University, Beijing 102206, China
2
Department of Mechanical & Industrial Engineering, Concordia University, 1455 De Maisonneuve W., Montreal, QC H3G 1M8, Canada
3
State Key Laboratory for Quality and Safety of Agro-Products, Institute of One Health Science, School of Civil & Environmental Engineering and Geography Science, Ningbo University, Ningbo 315211, China
*
Author to whom correspondence should be addressed.
Appl. Sci. 2025, 15(11), 6165; https://doi.org/10.3390/app15116165
Submission received: 7 March 2025 / Revised: 2 May 2025 / Accepted: 5 May 2025 / Published: 30 May 2025
(This article belongs to the Section Civil Engineering)

Abstract

To thoroughly investigate the distribution of heavy rain disaster risks in the Beijing–Tianjin–Hebei region, this paper analyzes the spatiotemporal evolution characteristics of heavy rain disaster-inducing factors. Based on disaster system theory, we constructed a heavy rain disaster risk assessment framework from four dimensions. We improved the application of model-agnostic meta-learning (MAML) in hyperparameter optimization for the random forest (RF) algorithm, thereby developing the MAML-RF heavy rain disaster risk assessment model. This model was compared with the SCV-RF model, which is based on random search and cross-validation (SCV), to determine which model had higher accuracy. Then we introduced the SHAP (Shapley additive explanations) interpretability algorithm to quantify the impact of each risk factor. The results indicate that (1) the annual characteristics of heavy rain days and rainfall amounts show a significant upward trend over the past 17 years; (2) the MAML-RF model improved the accuracy and precision of heavy rain disaster risk simulation by 4.44% and 3.71%, respectively, and reduced training time by 27.95% compared to the SCV-RF model; and (3) the SHAP interpretability algorithm results show that the top five influential factors are the number of heavy rain days, rainfall amount, slope, drainage pipe density, and impervious surface ratio.

1. Introduction

With the accelerating impact of climate change and urbanization, the hydrological cycle has intensified. This has led to an increase in the frequency and severity of heavy rain disasters, which cause varying degrees of damage to social life and economic development [1]. Research indicates that climate change alters the spatial distribution of disaster-prone environments, expands the influence and duration of disaster-causing factors, and consequently affects the frequency, intensity, and scale of heavy rain disasters [2]. China’s “14th Five-Year Plan” for disaster prevention and mitigation highlights that ongoing urbanization and industrialization, along with the rapid development of infrastructure, urban complexes, and utility networks, are increasing the exposure, concentration, and vulnerability of disaster-bearing bodies within urban agglomerations, thereby escalating the systemic and complex nature of disaster risks [3]. Moreover, under the effects of climate change and urbanization, the risk of heavy rain and flooding disasters in China is expected to intensify [4].
Commonly used methods for assessing heavy rain disaster risk include historical disaster assessment [5], the indicator system method [6,7], the remote sensing and geographic information system (GIS)coupling method [8,9], and scenario simulation [10]. In recent years, with the rapid development of artificial intelligence, machine learning algorithms such as neural networks, support vector machines, and gradient boosting have been widely applied in disaster risk simulation, achieving high simulation accuracy [11,12]. Among these, the random forest (RF) algorithm is noted for its strong data mining capability, high simulation accuracy, and good tolerance to outliers and noise [13,14,15,16]. It is well-suited in the classification of high-dimensional data [17], offering scalability and parallelism without easily falling into overfitting, making it one of the best algorithms available. However, the performance of the RF algorithm is significantly affected by changes in hyperparameters. The methods of traditional hyperparameter selection, such as grid search and random search, rely on exhaustive or random sampling on large training datasets to select the optimal hyperparameter combination. However, they are computationally expensive, inefficient, and prone to local optima [18,19,20]. To address the hyperparameter optimization issue in RF algorithms, various studies have employed hill-climbing algorithms [21], sparrow search algorithms, slime mold algorithms [22], ensemble learning algorithms [23], and Bayesian algorithms [24]. However, these algorithms are often effective only when RF models have sufficient and evenly distributed data, which may not be the case with limited sample sizes, leading to overfitting and reduced generalization ability, simulation accuracy, and stability.
Model-agnostic meta-learning (MAML) is a meta-learning method that trains models across multiple tasks, using a dual-layer optimization mechanism of inner and outer loops to quickly adapt model hyperparameters to new tasks with minimal updates. Studies have shown that MAML exhibits excellent learning efficiency and generalization in few-shot learning and reinforcement learning [25]. MAML achieves meta-learning through second-order gradient computation of task loss functions on model parameters, but hyperparameter computation in RF algorithms is non-differentiable. Therefore, this study improves the application of MAML in RF algorithm hyperparameter optimization, constructing a MAML-RF model for heavy rain disaster risk assessment to enhance the generalization ability and simulation accuracy of the RF algorithm. Additionally, compared to a single decision tree, the RF algorithm has poorer interpretability, and its feature importance evaluation method may assign overly similar weights to correlated features during simulation, underestimating or unevenly distributing the influence of disaster risk factors. Thus, the SHAP (Shapley additive explanations) interpretability algorithm is introduced for effective model explanation and analysis.
The Beijing–Tianjin–Hebei region, significantly affected by climate change and human activities, serves as China’s political, economic, cultural, and technological hub, bearing crucial developmental responsibilities. However, frequent heavy rain events, influenced by climate change and geographical conditions, have resulted in casualties and property losses, hindering coordinated and secure development in the region. Statistics show that over the past decade, the direct economic losses and affected crop areas due to heavy rain disasters in the region have exceeded the national average. Additionally, factors such as rising sea levels and the concentration of various resources within urban clusters exacerbate potential losses from heavy rain disasters, constraining healthy and sustainable socio-economic development [26]. Therefore, it is imperative to explore the risk characteristics, influencing factors, and distribution of heavy rain disasters in the Beijing–Tianjin–Hebei region to effectively support disaster prevention, mitigation, and high-quality regional development.
Taking the Beijing–Tianjin–Hebei region as a case study, this paper analyzes the spatiotemporal evolution characteristics of regional heavy rain. Based on disaster system theory, we constructed an assessment framework from four dimensions: heavy rain disaster-inducing factors, disaster-prone environment, disaster-bearing bodies, and disaster mitigation capacity. This framework was used to establish a heavy rain disaster risk assessment system for the region. We improved the application of the MAML algorithm in optimizing RF hyperparameters to develop the MAML-RF heavy rain disaster risk assessment model. Simultaneously, we used random search and cross-validation (SCV) to optimize the RF hyperparameters, thereby constructing the SCV-RF heavy rain disaster risk assessment model. We then conducted a comparative analysis of the simulation accuracy between the MAML-RF model and the SCV-RF model, selecting the more accurate model for assessing heavy rain disaster risks in the region. A regional heavy rain disaster database is also constructed to drive the higher-accuracy model for multi-class risk simulation, and the SHAP interpretability algorithm is introduced to quantify and clarify the influence of each risk factor on the model’s risk simulation results. This assessment explores the influencing factors and dynamic distribution of heavy rain disaster risk in the study area, identifying sensitive indicators of urban heavy rain disasters to provide scientifically effective references for regional development planning and disaster management.

2. Materials and Methods

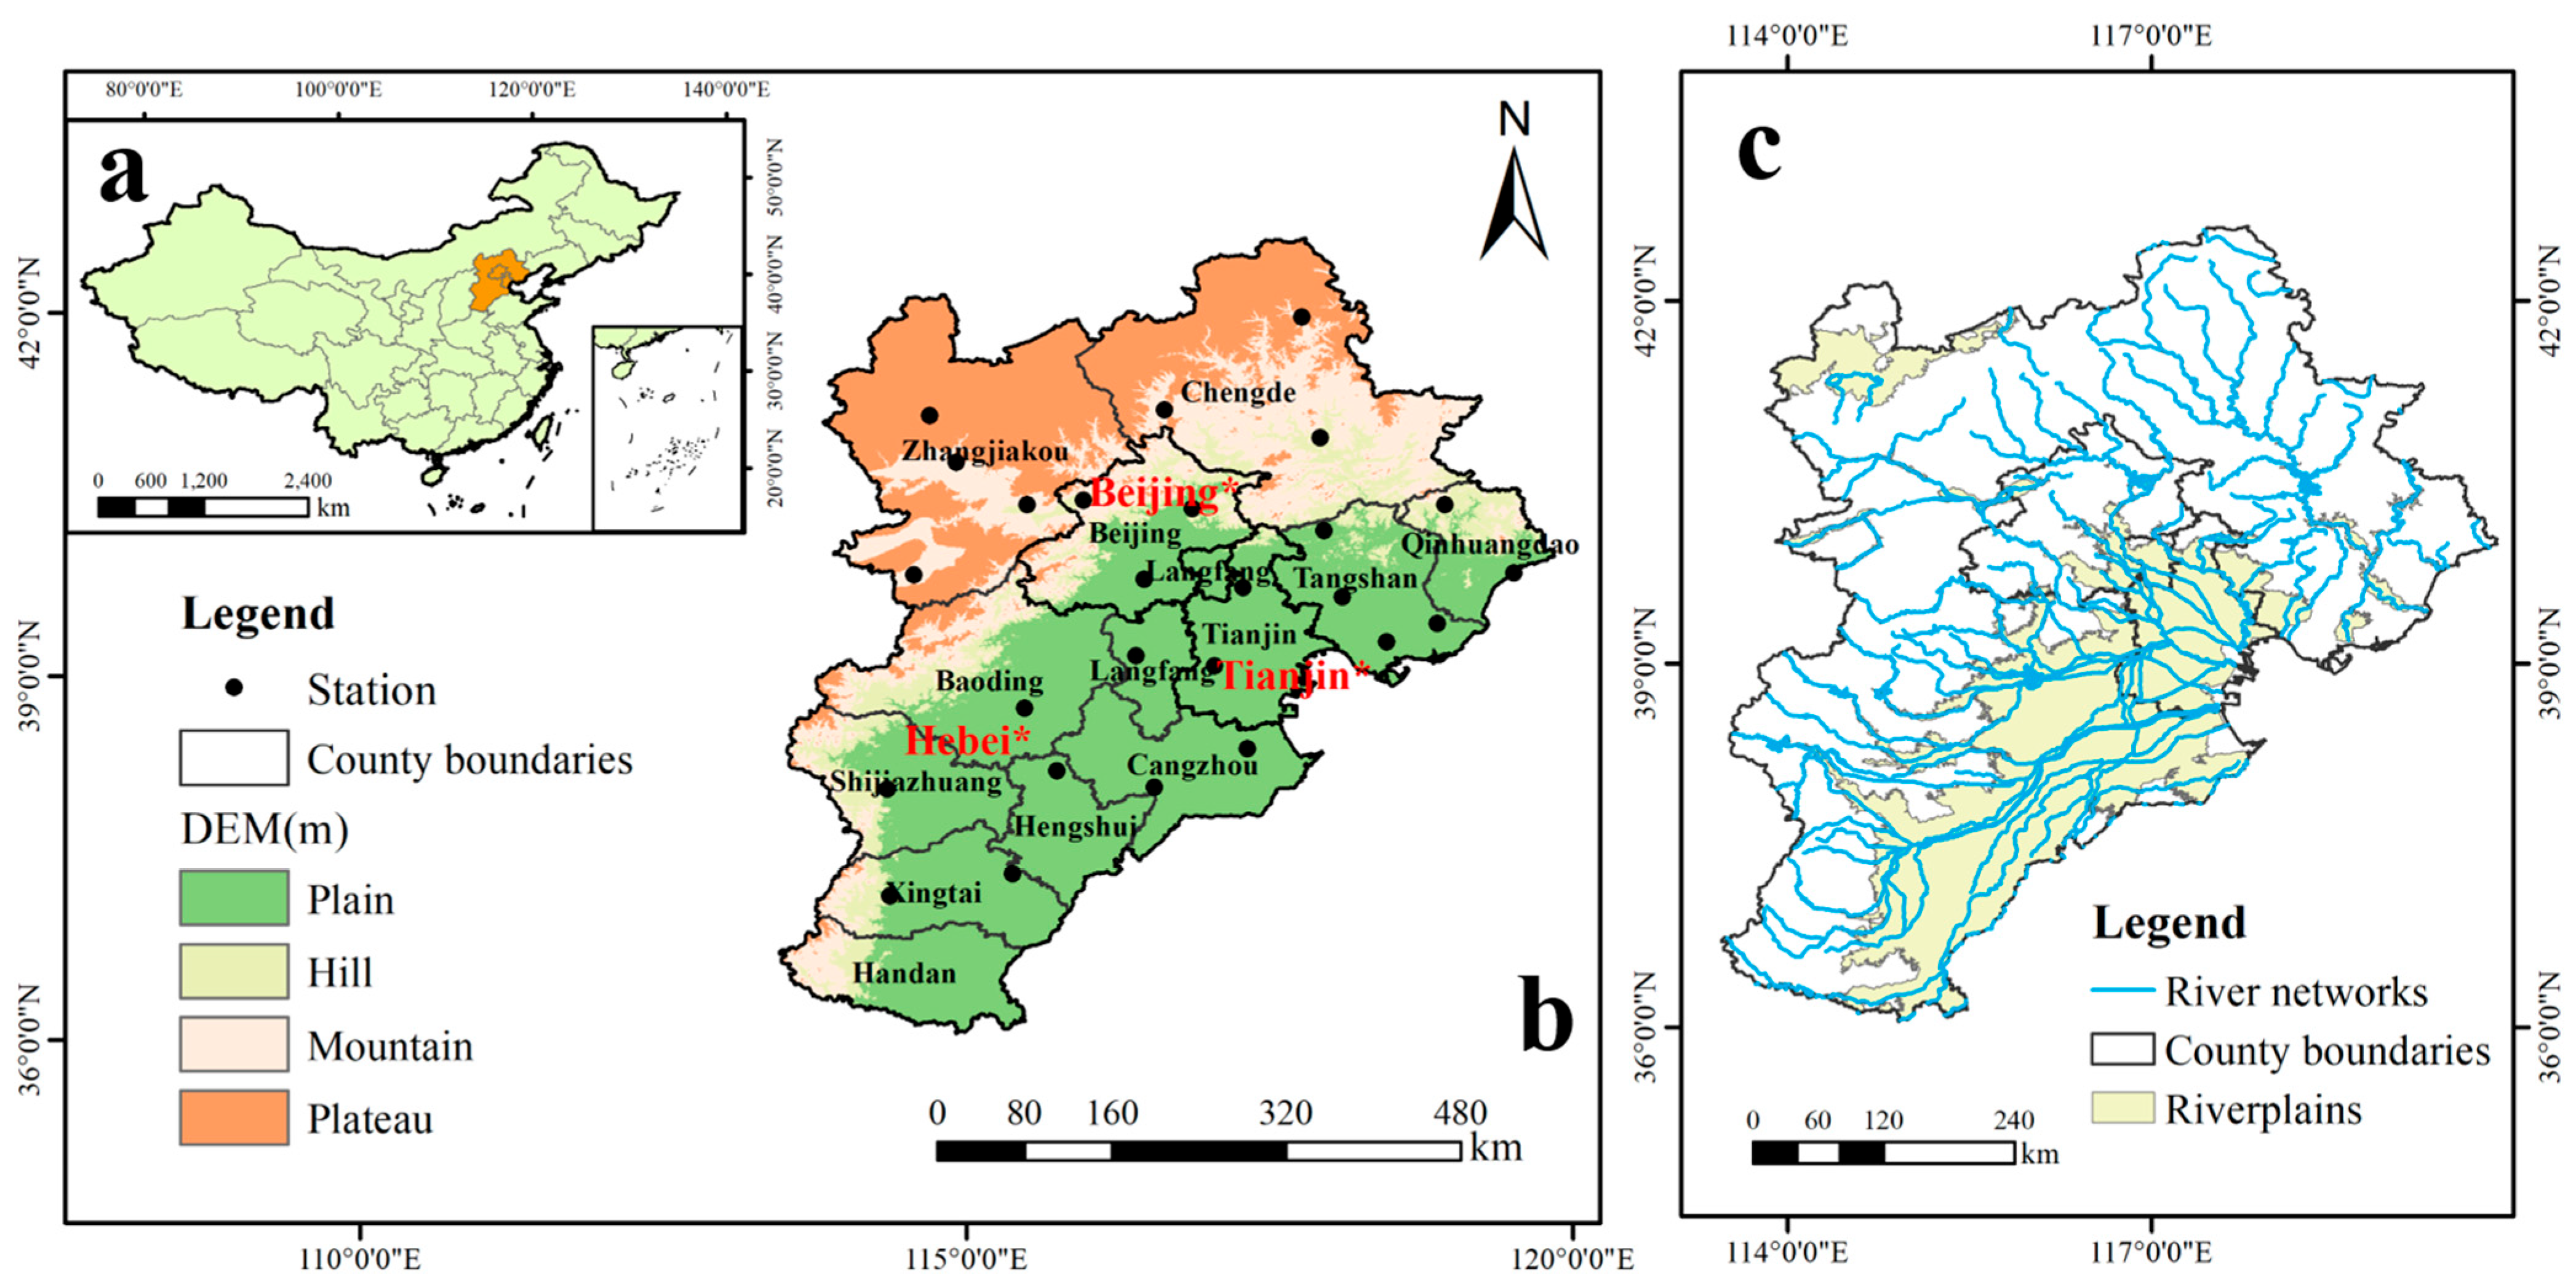
2.1. Regional Overview

The Beijing–Tianjin–Hebei region (36°05′–42°40′ N, 113°27′–119°50′ E) is located in the northern part of the North China Plain, covering a total area of 218,000 km². It is bordered by the Yanshan Mountains to the north, the Taihang Mountains to the west, and the Bohai Sea to the east [27], and encompasses Beijing, Tianjin, and 11 cities in Hebei Province. The region’s topography is characterized by higher elevations in the northwest and lower in the southeast, featuring a variety of landforms such as plateaus, plains, mountains, and hills. Most of the study area lies in China’s semi-humid zone, while the Bashang Plateau areas of Zhangjiakou and Chengde are in a semi-arid zone. The region predominantly experiences a temperate monsoon climate, with the majority of annual rainfall occurring during the summer months, accounting for 60–90% of the total rainfall. Relevant research statistics indicate that from 2011 to 2018, the gross domestic product (GDP), population, impervious surface area, and built-up area in the region increased by 55 times, 44%, 4 times, and 181%, respectively, compared to the 1980s [28]. The rapid increase in socio-economic exposure, together with climate change and regional urbanization, has contributed to an increase in economic losses associated with heavy rain disasters in recent years, as well as a rise in the affected population, from an average of 2.4386 million people from 2003–2012 to 4.8189 million people from 2011–2013.

2.2. Data Description

This study is based on the following data: (1) Precipitation data are sourced from the China Meteorological Data Service Center’s China Surface Climate Data Daily Dataset (v3.0), which provides daily precipitation observations from 20:00 to 20:00 (Beijing time, same below). This dataset has undergone strict quality control to exclude stations with missing or incomplete data, resulting in the selection of 26 meteorological stations in the region. The location distribution of these stations is presented in Figure 1. (2) Heavy rain disaster data are derived from the China Meteorological Disaster Yearbook for the years 2000–2019. (3) Slope data are obtained from the Geospatial Data Cloud’s SRTMSLOPE product. (4) Other data are sourced from provincial and municipal statistical yearbooks and the China Urban Construction Statistical Yearbook. Additionally, all data have been resampled to a uniform spatial resolution of 1 km. The river network dataset is derived from the Resource and Environment Science Data Platform of the Chinese Academy of Sciences (https://www.resdc.cn/, accessed on 22 March 2025). The floodplain dataset is derived from the Global High-Resolution Floodplain published by Nardi et al. [29].

2.3. Research Methodology and Model Construction

2.3.1. Identification of Heavy Rain Events

This study adopts the industry standard defined by the China Meteorological Administration, which classifies a precipitation event as a heavy rain if the 24-h rainfall exceeds 50 mm. Losses from heavy rain disasters are typically caused directly or indirectly by such events. Therefore, this paper focuses on precipitation events where daily rainfall is 50 mm. A day is recorded as a heavy rain day if the precipitation from 8 PM of the previous day to 8 PM of the current day exceeds 50 mm. The onset of a heavy rain event is marked when one or more meteorological stations within the study area detect heavy rain, and it is considered to end when no stations report further heavy rain. The duration from the start to the end of this event is recorded as the heavy rain process.

2.3.2. Heavy Rain Disaster Dataset

Data from the China Meteorological Disaster Yearbook for 2000–2017 were collected, and relevant data on heavy rain events and reports from various government levels were extracted to identify risk samples. A total of 96 heavy rain events were selected and categorized into 150 risk samples based on meteorological station data and the extent of disaster losses. Each sample was assigned a disaster grade according to the national standard GB/T33680-2017 [30]. A portion of the dataset is shown in Table 1, where RD represents the grade level for the duration of heavy rain, RA for the affected area, AI for the impacted crop area, RJ for direct economic losses, RS for fatalities, and FD for the comprehensive heavy rain disaster assessment index.

2.3.3. SCV-RF Model

This model uses the random search method to determine the optimal hyperparameters for the RF model, with the average accuracy from five-fold cross-validation serving as the model evaluation metric. This approach is used to construct the SCV-RF model for assessing heavy rain disaster risk in the Beijing–Tianjin–Hebei region. The process for optimizing model parameters is as follows:
  • Selection of Hyperparameters for Optimization: To balance the complexity and generalization ability of the SCV-RF model, the following hyperparameters are chosen for optimization: number of decision trees (n_estimators), maximum depth of the decision trees (max_depth), minimum number of samples required to split an internal node (min_samples_split), and minimum number of samples required at a leaf node (min_samples_leaf) [31].
  • Setting the Range for Hyperparameter Optimization: The ranges are set as follows: n_estimators [between 1, and 100], max_depth [from 1, to 20], min_samples_split [from 2, to 10], and min_samples_leaf [between 1, and 10].
  • Random Search and Model Training: Within the specified hyperparameter ranges, a set of hyperparameters is randomly sampled and evaluated for simulation accuracy using five-fold cross-validation. This random sampling and model training process is repeated 100 times, with the set of hyperparameters yielding the highest model accuracy selected as the final optimized parameters for the SCV-RF model.

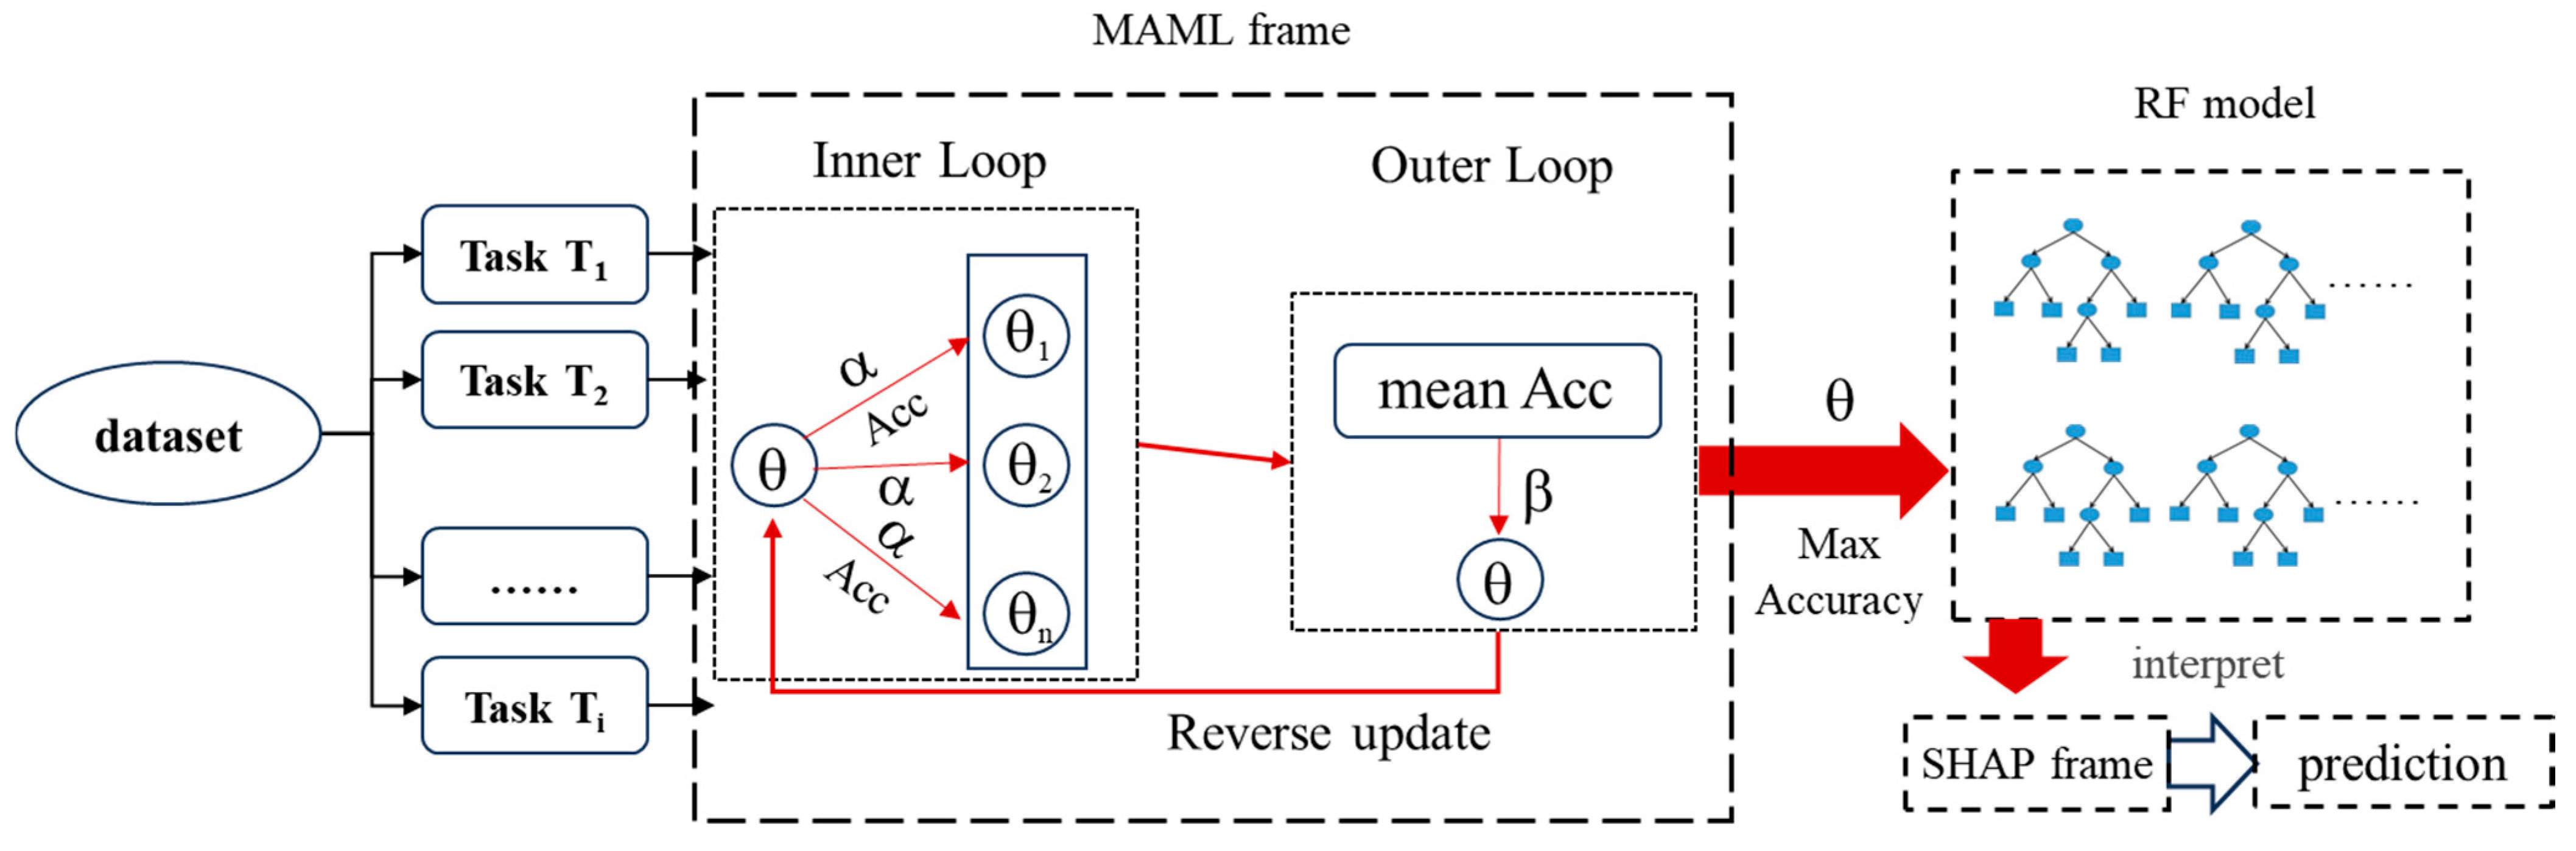
2.3.4. Improved MAML-RF-SHAP Model

Based on the MAML meta-learning framework, this study improves the application of MAML in RF algorithm hyperparameter optimization to enhance coordination and rapid adaptability between trees, thus constructing the MAML-RF model. Additionally, the sample data from the heavy rain disaster dataset are divided into 70% training and 30% testing sets, serving as input data for the MAML-RF model. The MAML hyperparameter optimization process consists of an inner and outer loop. In the inner loop, multiple tasks are randomly sampled, with 10 samples randomly selected for each task. During the inner loop, initial hyperparameters θ and a single task T i are set, and the accuracy of each task is calculated. The gradient descent of the loss function is modified to linearly decrease based on the accuracy of a single task, with α as the learning rate, resulting in new hyperparameters:
θ i = θ α A c c u r a c y ,
In the equation, θ represents the initial hyperparameters, A c c u r a c y denotes the accuracy of a single task, α is the learning rate, and θ i is the new hyperparameters obtained for a single task after the inner loop.
During the outer loop, the global initialization hyperparameters are updated based on the meta-learning rate β . The accuracy is calculated as the average accuracy of all tasks in the training set during the inner loop, and the hyperparameters θ are updated in reverse until the highest accuracy is achieved in the outer loop. The relevant calculation process is as follows:
θ θ β θ   A c c u r a c y ¯ ,
In the equation, θ represents the initial hyperparameters, and β is the meta-learning rate in the outer loop.
In the heavy rain disaster risk assessment task, there is a high correlation between several risk factors, such as the number of heavy rain days and total rainfall, and elevation and the proportion of construction land [32]. Using the algorithm’s built-in importance evaluation methods can lead to bias issues. Disaster spatial differentiation results from the synergistic effects of multiple influencing factors [33]. To delve deeper into the decision-making mechanisms of the optimal algorithm and enhance model interpretability, this study employs the SHAP interpretability algorithm. This algorithm calculates the Shapley value for each risk factor to explain the impact of each factor on the simulation results within the model. The SHAP algorithm, proposed by Lundberg and others [34], is an attribution explanation method based on game theory [35] and local interpretation. By using the SHAP algorithm, the importance of each risk factor in the machine learning model’s simulations can be more intuitively reflected, and it indirectly addresses the correlation between features, reducing errors in the importance calculations of highly correlated features inherent in the RF algorithm.
The technical roadmap of the MAML-RF-SHAP heavy rain disaster risk assessment model is shown in Figure 2. Initial hyperparameters are set, and through the inner and outer loop processes of the MAML meta-learning framework, the model hyperparameters are updated in reverse using linear descent in both loops. The hyperparameter combination that achieves the highest accuracy in the random forest algorithm is ultimately selected, and the SHAP interpretability algorithm is introduced to explain the MAML-RF model. This approach quantifies and clarifies the impact of risk factors on disaster risk and the decision-making process of the model.

2.3.5. Model Accuracy Evaluation

This paper uses a confusion matrix to evaluate the simulation accuracy of the SCV-RF and MAML-RF models. The confusion matrix is a commonly used tool for evaluating the performance of classification models. It quantifies simulation performance by constructing four metrics: true positive (TP), false positive (FP), true negative (TN), and false negative (FN) [36]. In this paper, the selected metrics for evaluating the model’s simulation accuracy are accuracy (A), precision (P), and recall (R). For multi-class classification problems, the values of P and R are calculated using the weighted method. This method involves computing P and R for each class. Then it takes a weighted average based on the sample size of each class to obtain the overall model. The specific calculation process is detailed in Formulas (3)–(5).
A c c u r a c y = i = 1 I T P ( i ) N ,
P r e c i s i o n = i = 1 I T P ( i ) i = 1 I T P ( i ) + i = 1 I F P ( i ) ,
R e c a l l = i = 1 I T P ( i ) i = 1 I T P ( i ) + i = 1 I F N ( i ) ,
In these formulas, i represents the i -th class, taking values from 1 to I , where I is 4. N is the total number of samples in the confusion matrix. TP indicates that the actual class is positive and the simulation is also positive. TN refers to cases where the actual class is negative and the simulation is negative. FP occurs when the actual class is negative but the simulation is positive. FN occurs when the actual class is positive but the simulation is negative.

3. Results

3.1. Evolution Characteristics of Heavy Rain Disaster-Causing Factors

Heavy rain is the primary meteorological driver of heavy rain disasters, and the disaster-inducing factors of heavy rain are the meteorological indicators that characterize the rainfall process. During a heavy rain event, the longer the duration, the greater and more concentrated the precipitation, the higher the potential risk of disaster. This paper considers the number of heavy rain days, rainfall amount, and rainfall contribution rate as the disaster-inducing factors of heavy rain. These are defined as follows: the number of heavy rain days is the count of days with heavy rain during the start and end of the event; the rainfall amount is the total rainfall observed at all meteorological stations during the event; and the rainfall contribution rate is the ratio of total heavy rain to total precipitation during the event. We analyze the evolution characteristics from both temporal and spatial dimensions. To understand the spatiotemporal trends of these disaster-inducing factors from 1970 to 2017, this paper analyzes their variation characteristics on both annual and seasonal scales. The specific results are as follows.

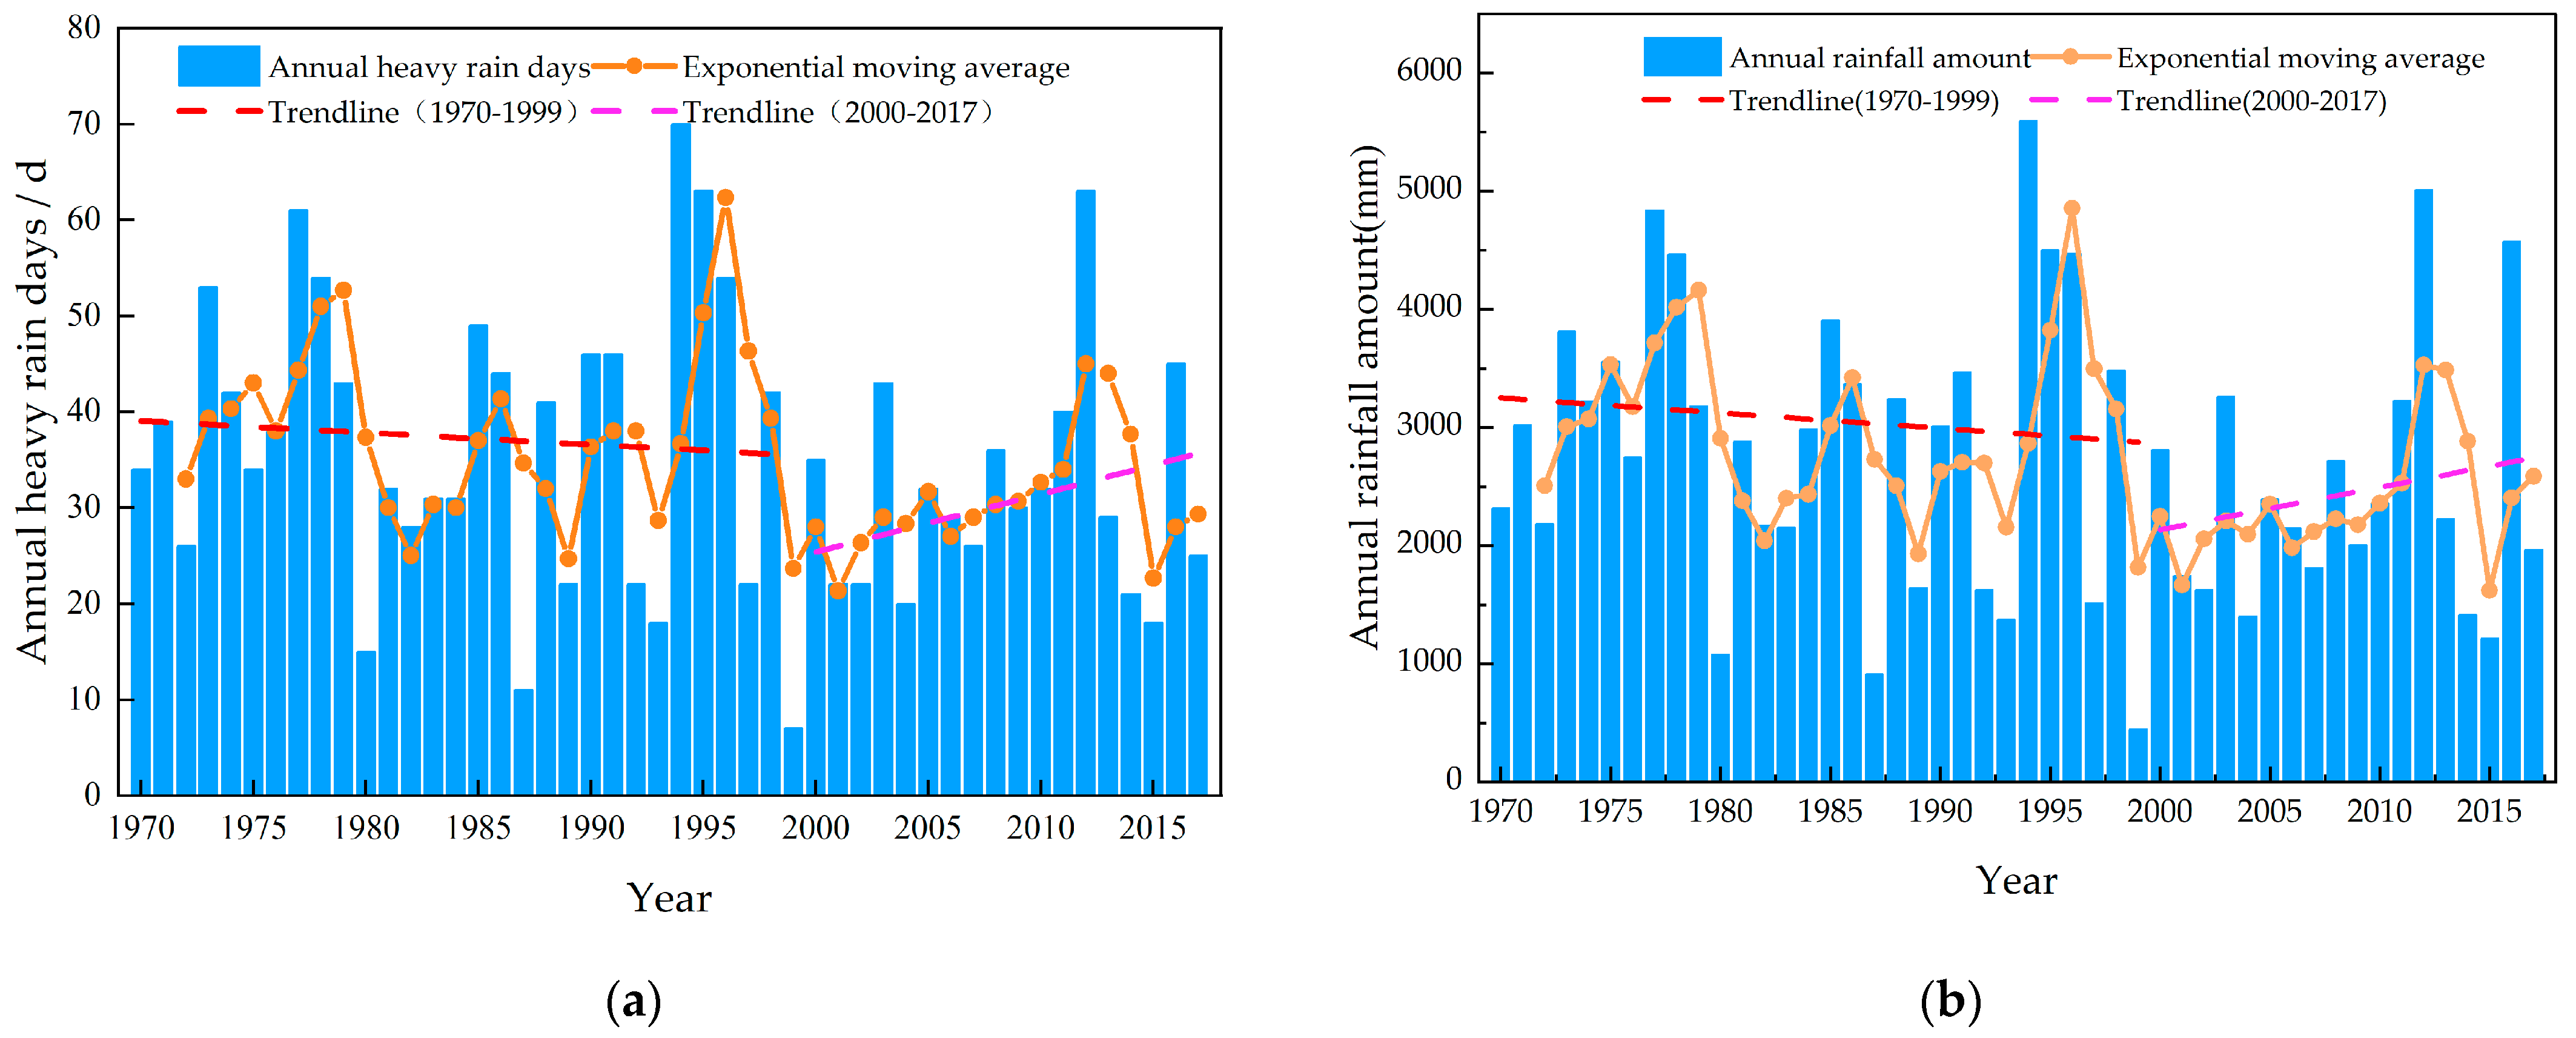
3.1.1. Trend Changes

Figure 3 shows the annual number of heavy rain days, annual rainfall amount, their three-year moving averages, and linear change trends in the region. Statistical analysis of the annual number of heavy rain days and annual rainfall amount reveals an overall decreasing trend. However, both the number of heavy rain days and rainfall amount show a significant increasing trend, with growth rates of 0.6 days per year and 35.74 mm per year, respectively.

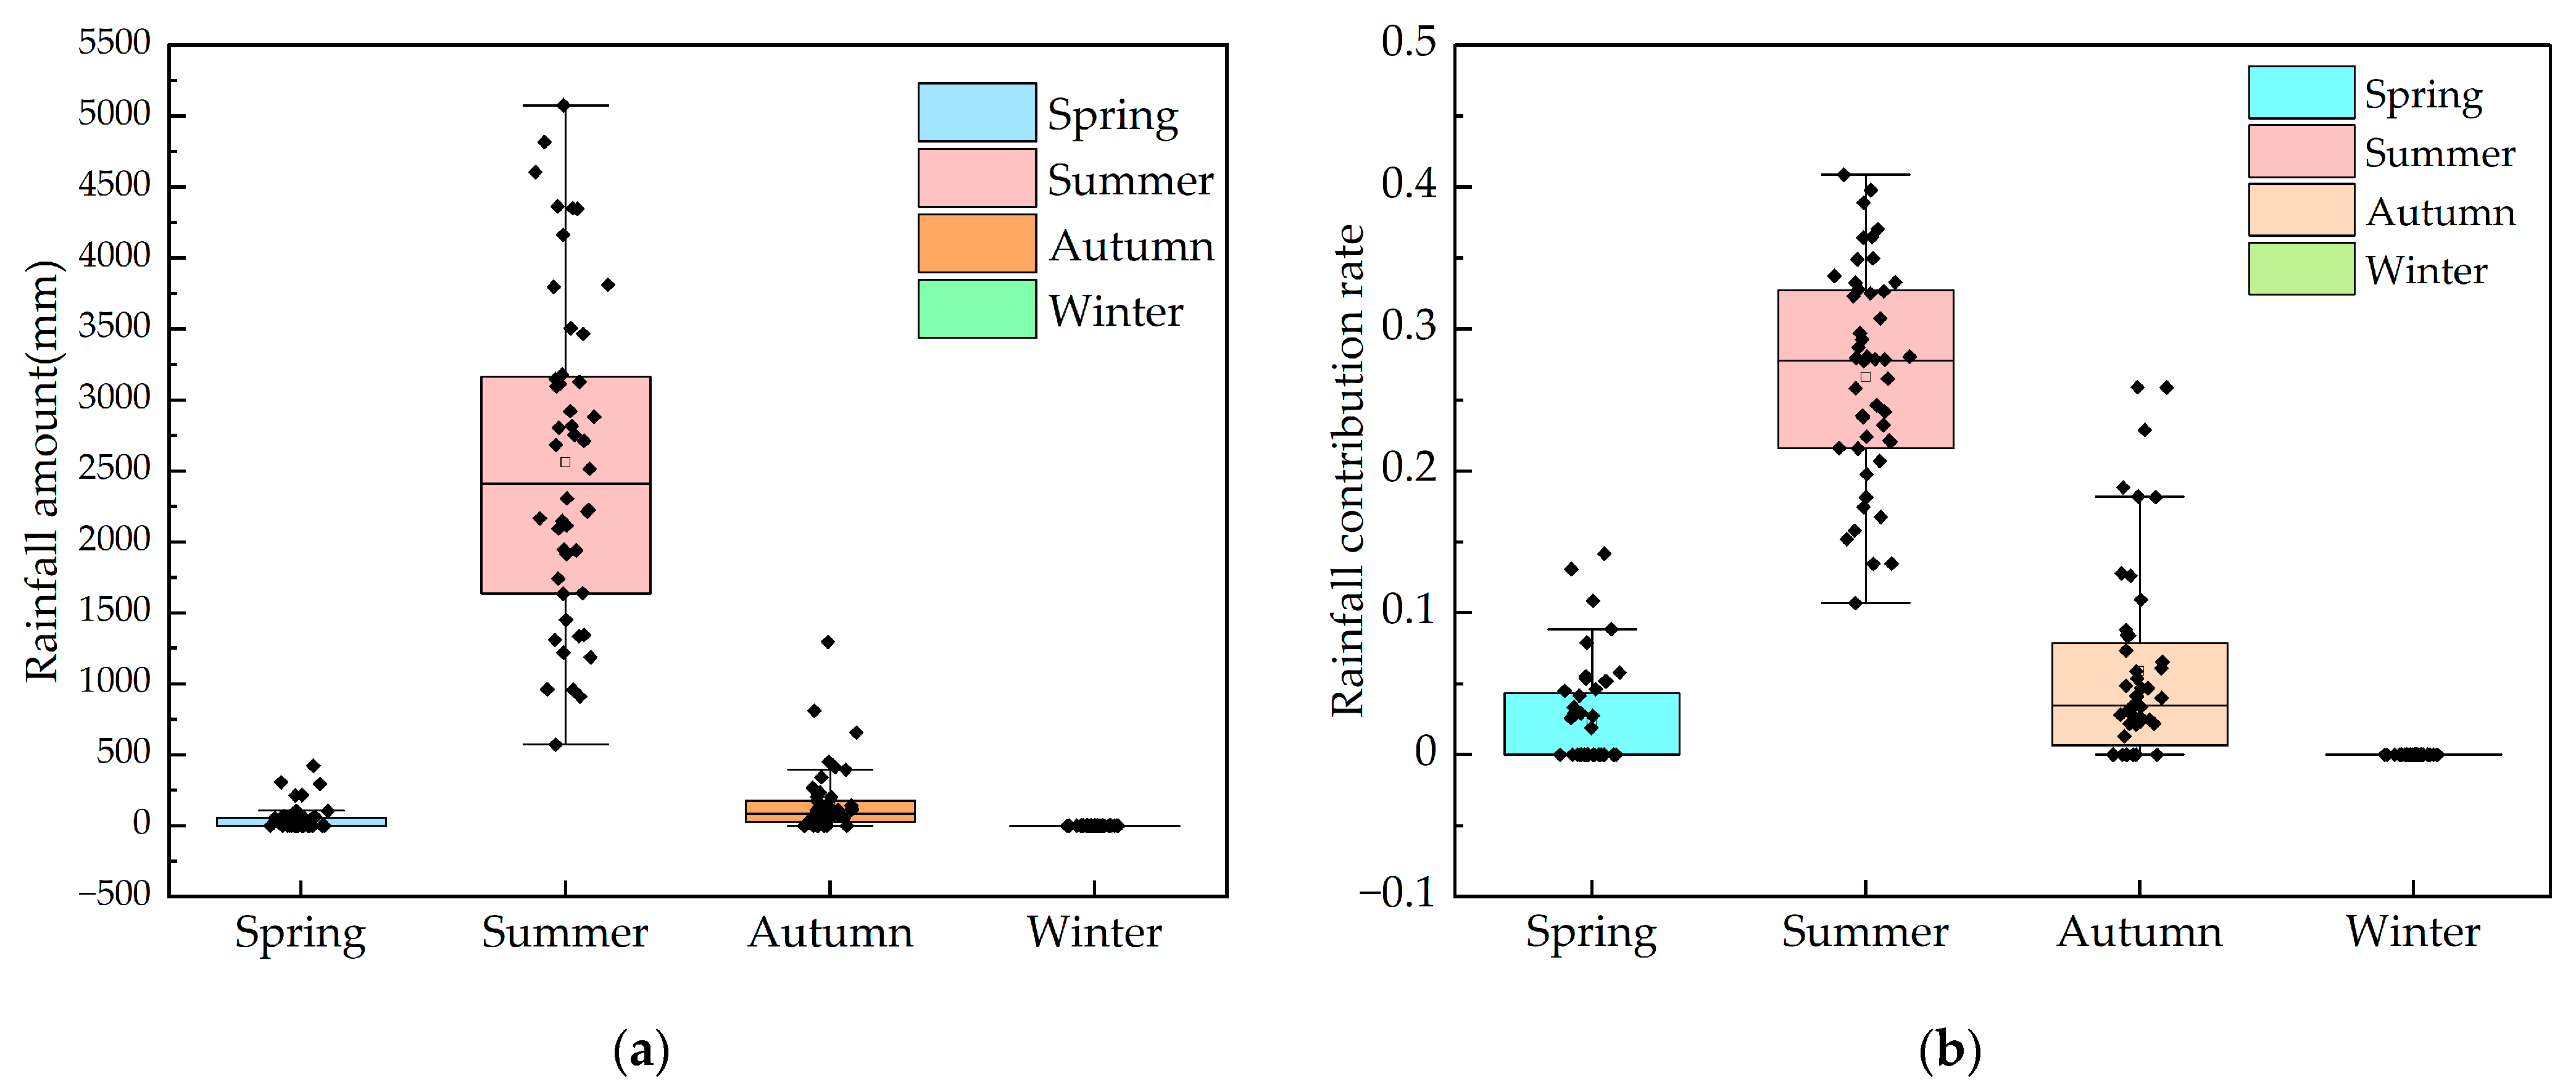
3.1.2. Intra-Annual Variation

Based on the climate conditions of the area, the year is divided into four seasons: spring (March to May), summer (June to August), autumn (September to November), and winter (December to February of the following year) [37]. The seasonal variation characteristics of rainfall amount and rainfall contribution rate are presented in Figure 4. The findings indicate that no heavy rain events occur in winter in the region. During the summer, heavy rainfall accounts for 60% to 98% of the annual rainfall amount and about 30% of the total annual precipitation. In spring and autumn, heavy rainfall accounts for approximately 15% and 20% of the total annual precipitation, respectively. Throughout the statistical period, annual rainfall amount constitutes 15% to 30% of the corresponding year’s total precipitation. Therefore, summer is the peak period for heavy rain in the study area, highlighting the need for enhanced prevention and risk forecasting of heavy rain disasters during this season.

3.1.3. Spatial Variation

The frequency of heavy rain days is defined as the ratio of the number of heavy rain days to the total number of precipitation days at each meteorological station [38], reflecting the frequency of heavy rain occurrences in a region. This paper calculates and analyzes the spatial distribution characteristics of the frequency of heavy rain days. The classification of the frequency levels of heavy rain days using the natural breaks method in ArcGIS10.8 (Esri, Redlands, CA, USA) is shown in Figure 5. The number of heavy rain days decreases from the southeast to the northwest, with significant geographical variation. High-frequency areas are located in Tangshan, Qinhuangdao, southern Chengde, Miyun District in Beijing, Tianjin, eastern Cangzhou, and Langfang. Areas with relatively high frequencies include Shijiazhuang, Baoding, Xingtai, Handan, and most of western Beijing. In the northern part of the region, specifically most of Zhangjiakou and northern Chengde, the frequency of heavy rain days is low due to the blocking effect of the Yanshan Mountains, which reduces moisture transport. The lowest frequencies are observed in Yu County and Huailai County in Zhangjiakou.
In summary, the analysis of the spatiotemporal evolution characteristics of heavy rain disaster-causing factors revealed an overall increase trend in the number of heavy rain days and total rainfall in the Beijing–Tianjin–Hebei region from 2000 to 2017. This suggests a potential increase in the risk of heavy rain disasters in the future. Furthermore, based on the spatial distribution of the frequency of heavy rain days, areas such as the southeastern part of the region experience higher frequencies of heavy rain events. Therefore, it is necessary to further investigate disaster risk factors by integrating the underlying surface conditions and socio-economic data. This will help to understand the distribution of heavy rain risks across various urban areas and provide effective support for formulating disaster prevention and mitigation measures under different scenarios.

3.2. Heavy Rain Disaster Risk Assessment

3.2.1. Risk Assessment System

Heavy rain disasters refer to natural disasters directly or indirectly triggered by regional heavy rain events, often resulting in agricultural, transportation, or other property losses and casualties [39]. They can also lead to secondary disasters such as flash floods, urban waterlogging, and landslides. The risk of heavy rain disasters is the uncertainty of potential losses or adverse impacts on society, the economy, the environment, and human life safety caused by heavy rain events. The formation of heavy rain disaster risk is influenced by multiple factors, including meteorological conditions, topographical features, land use types, and regional disaster mitigation and emergency response capabilities. Based on disaster system theory, this paper integrates regional disaster mitigation capacity with disaster-inducing factors, disaster-prone environments, and disaster-bearing bodies [40] to construct a four-dimensional assessment framework for heavy rain disaster risk. This framework systematically analyzes the characteristics of disaster risk within the region. According to relevant studies [41,42], we have selected 10 risk factors to establish a heavy rain disaster risk assessment system, with specific indicators and selection criteria as follows:
(1)
Heavy Rain Disaster-Inducing Factors: This study selects the number of heavy rain days, rainfall amount, and rainfall contribution rate as the disaster-inducing factors. The principles for their selection and the analysis of their spatiotemporal variation characteristics are detailed in Section 3.1 above.
(2)
Disaster-Prone Environment for Heavy Rain: This refers to the natural and socio-cultural environments that play a role in disasters under the influence of heavy rain. The slope of the land affects the direction and speed of surface runoff, influencing the degree of water accumulation. The steeper the slope, the shorter the time for floodwaters to gather in low-lying areas, increasing disaster risk. The extent of the impervious surface area directly affects the infiltration of surface runoff and the drainage pressure on the sewer system. Therefore, slope and impervious surface ratio are considered as risk factors for the disaster-prone environment.
(3)
Disaster-Bearing Bodies for Heavy Rain: These are the objects affected by disaster-inducing factors, primarily the population, buildings, and socio-economic aspects within a region. Thus, this paper uses population density, GDP per unit area, and land use type to describe the disaster-bearing bodies [30]. The greater the population density, GDP density, and utilization level in a region, the greater the potential loss in the event of a disaster.
(4)
Disaster Mitigation Capacity for Heavy Rain: This refers to a city’s ability to prevent and respond to disasters. The greater the density of drainage pipes, the greater the drainage capacity, and the lower the risk of heavy rain disasters. Additionally, since heavy rain disasters often accompany road collapses, leading to urban road system failures or partial paralysis, road network density is also considered an indicator of disaster mitigation capacity.
The specific heavy rain disaster risk assessment system and the data sources for risk factors are presented in Table 2.
The calculation formula for the heavy rain disaster risk index (HDRI) is as follows:
H D R I = i = 1 n W i X i
where HDRI represents the heavy rain disaster risk index, categorized into four levels: low, medium, relatively high, and high. The variable n denotes the number of risk factors, which is set at 10. W i is the weight of the i -th indicator, and X i is the risk level of the i -th indicator.

3.2.2. Risk Factor Dimensionality Reduction

Due to significant differences among the risk factors within the heavy rain disaster risk system in terms of data sources, data types, spatial resolution, and measurement units, these factors exhibit characteristics of multi-source heterogeneity. Therefore, this paper classifies each risk factor into four risk levels—Levels I, II, III, and IV—based on their impact on heavy rain disaster risk, in conjunction with relevant standards and bibliometric analysis [11,43,44,45,46,47,48,49]. Table 3 shows the classification of risk levels for each factor.

3.2.3. Model Parameter Settings

Based on the dimensionality reduction of risk factors, the sample data are divided into 70% for the training set and 30% for the test set, serving as input data for the SCV-RF model and the MAML-RF model. The model’s random seed is set to 42 to ensure the reproducibility of the results. For the MAML-RF algorithm, the initial hyperparameters are set as follows: (n_estimators = 30), (max_depth = 30), (min_samples_leaf = 10), and (min_samples_split = 10). The MAML learning rate ( α ) is set to 0.01 and the meta-learning rate ( β ) is set to 0.001. The hyperparameters that achieve the highest prediction accuracy are selected for the RF algorithm. Table 4 shows the final model hyperparameter settings.

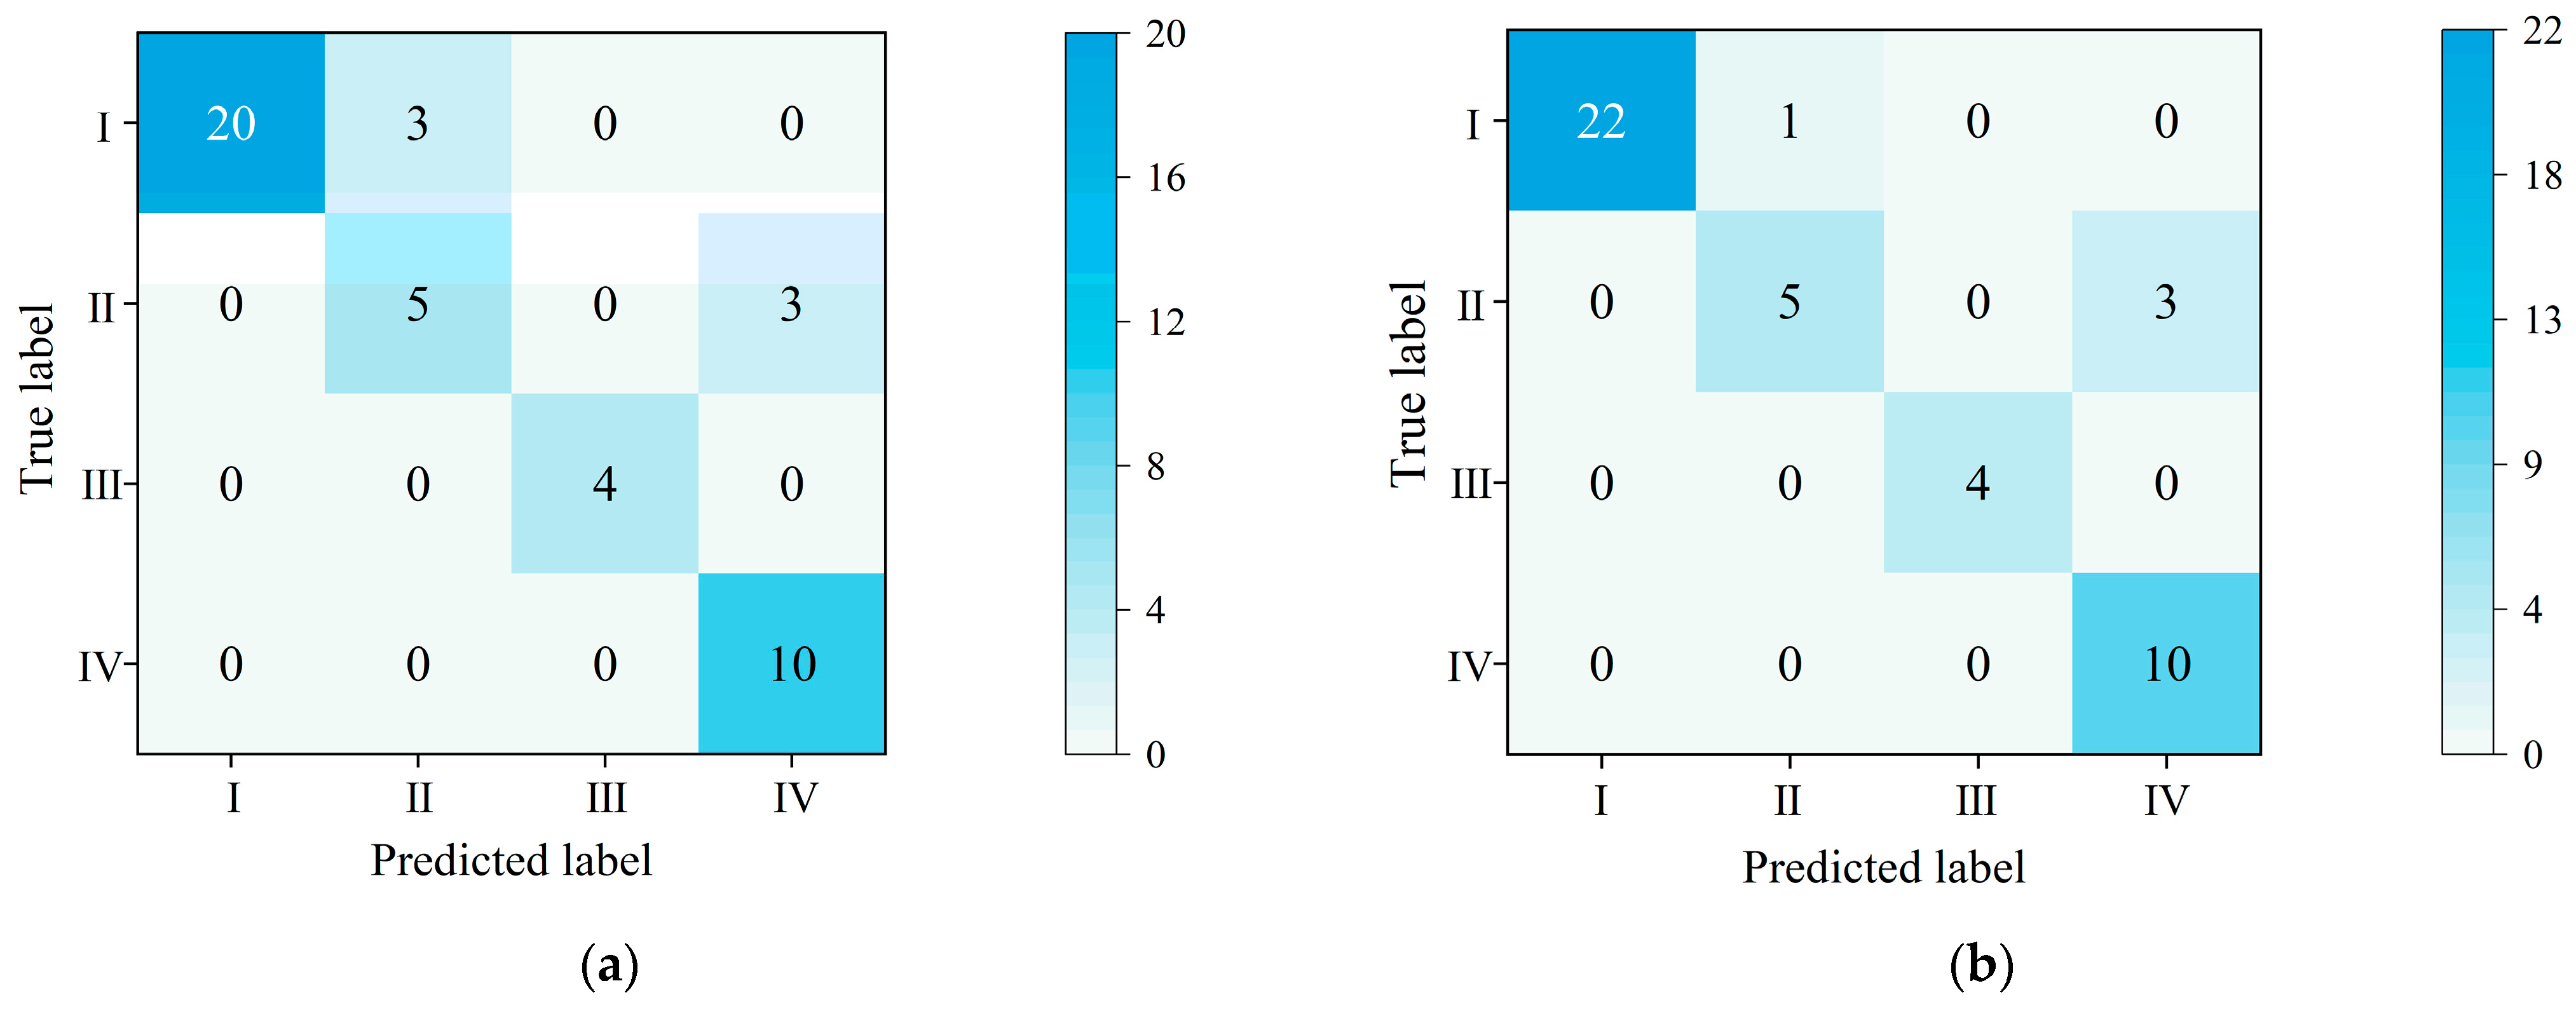
3.2.4. Model Evaluation Result

The confusion matrix is a widely used method in the machine learning and statistics, providing a structured way to meticulously present the simulation results of classification models and accurately measure the differences between simulated and actual values. The specific results of the confusion matrices for the SCV-RF model and the MAML-RF model on the test set are shown in Figure 6. According to the formulas in Section 2.3.5, the accuracy metrics for each model are calculated as shown in Table 5: The MAML-RF model achieves accuracy, precision, and recall of 91.11%, 91.91%, and 91.11%, respectively, on the test set. These figures represent improvements of 4.44%, 3.71%, and 4.44% over the SCV-RF model. The MAML-RF model reduced the time by 2.06 s compared to the SCV-RF model. This indicates that the improved MAML-RF model provides better output results in the assessment of heavy rain disaster risk in the region. It demonstrates high robustness and generalization capability, making it suitable for evaluating heavy rain disaster risks in this area. Next, the SHAP interpretability algorithm is introduced to explain the MAML-RF model and quantify the impact of risk factors on disaster risk.

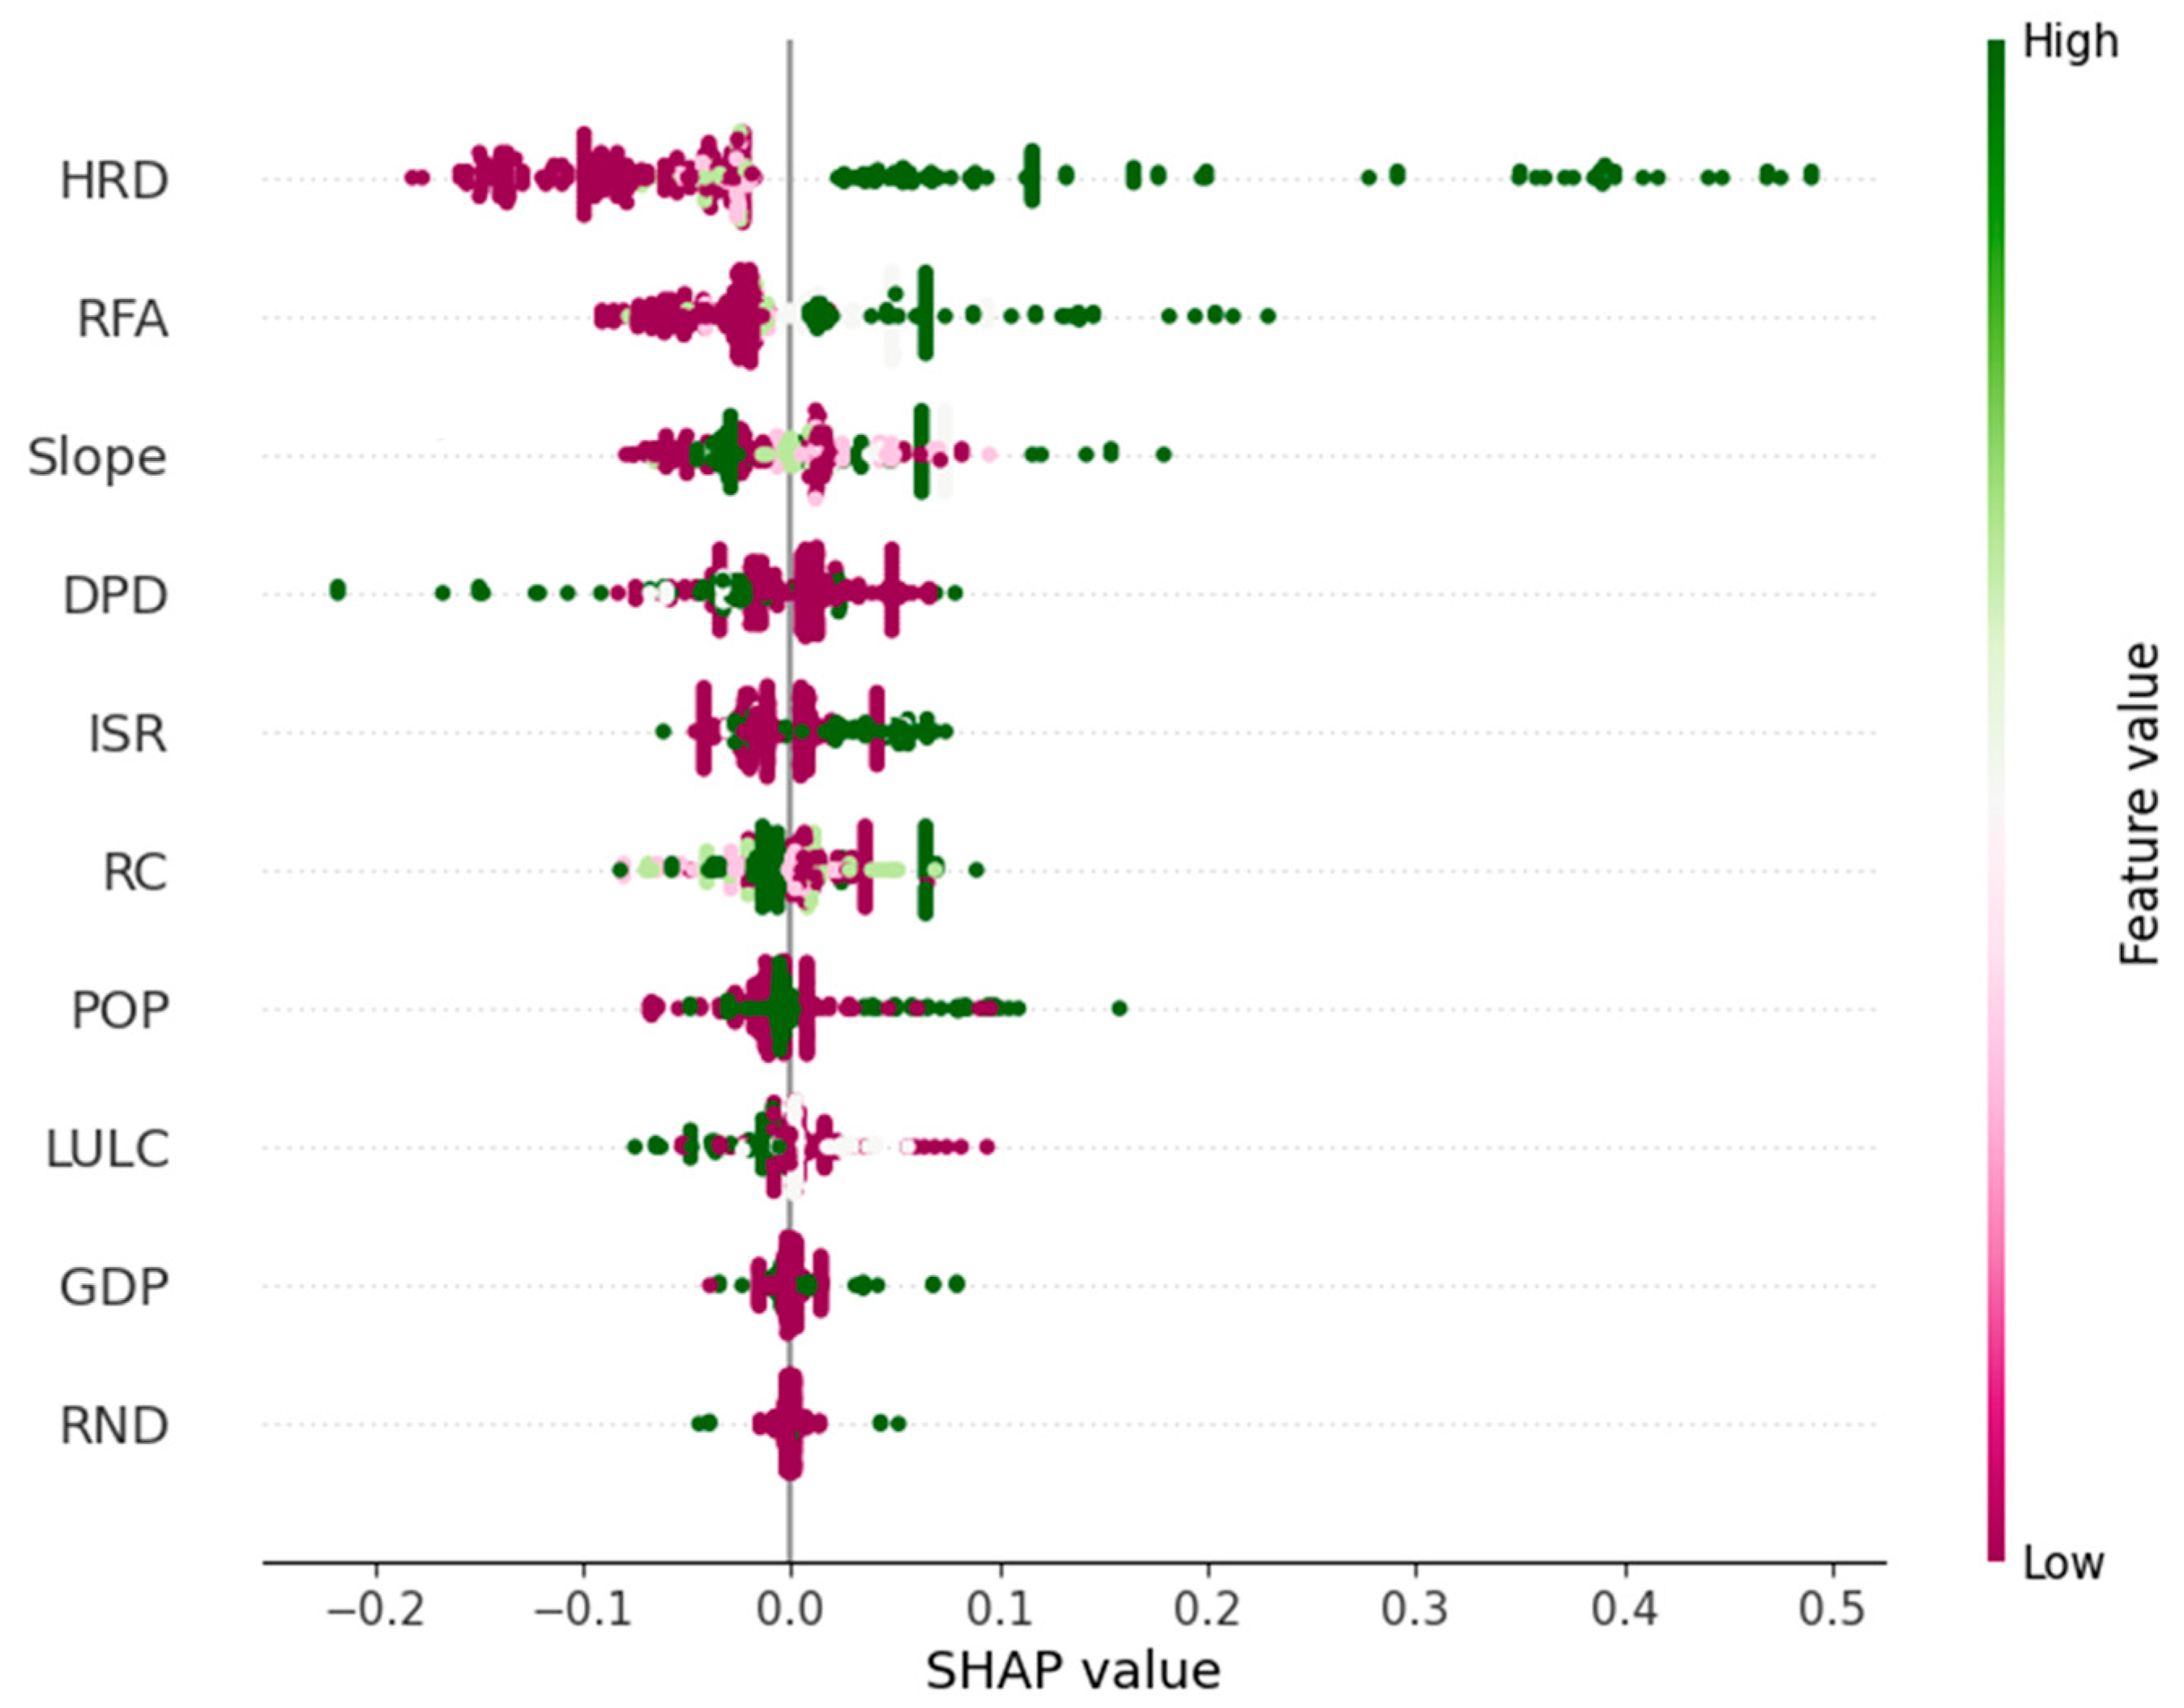
3.2.5. SHAP Algorithm Interpretation Results

To make the decision-making process of the MAML-RF model transparent and identify key influencing factors, this study employs the SHAP algorithm to calculate the Shapley values of each feature, thereby quantifying the impact of risk factors on heavy rain disaster risk. The results of the impact proportions of risk factors are presented in Table 6. Among the factors, the number of heavy rain days, rainfall amount, and slope have the greatest impact on heavy rain disasters, followed by factors such as drainage pipe density and impervious surface ratio. This is likely due to the process of surface runoff formation during heavy rain events. The longer the duration and the greater the rainfall, combined with an uneven spatial distribution of drainage pipes, results in delayed infiltration and drainage of rainwater. This leads to a series of disaster issues such as urban waterlogging, rapid river level rise, and soil erosion. The Beijing–Tianjin–Hebei region has an elevation difference of approximately 3000 m, featuring diverse terrains including plains and mountains. For instance, the Juma River’s upstream is located in the Fangshan mountainous area with an elevation exceeding 1 km, while the downstream Zhuozhou City is just over 30 m above sea level. During heavy rain, Zhuozhou City, situated downstream, directly faces the impact of high-speed, high-volume water flow from the upstream mountains. Due to its low and flat terrain and limited surface infiltration and drainage capacity, the risk of secondary disasters such as waterlogging and mudslides significantly increases in this area during heavy rain.
To further illustrate the impact of risk factors on the model’s simulation results, the global interpretation results of the SHAP algorithm for risk factors are shown in Figure 7. Each point represents a feature of a data sample, illustrating the distribution of each factor’s impact on the model’s internal output results across all samples. The vertical axis represents the risk factors, ranked from top to bottom by their impact on disaster risk. The greener a circle is, the higher the feature value of that sample; the more purple, the lower the factor value. The horizontal axis represents the SHAP value for each factor. A positive SHAP value with a green sample indicates that the feature value has a positive effect on the output result, with larger sample values exerting a greater positive influence.
The results indicate that within the four dimensions of the disaster risk system, disaster-inducing factors, disaster-prone environments, and disaster mitigation capacity have a significant driving effect on regional heavy rain disaster risk. The primary driving factors include the number of heavy rain days, rainfall amount, slope, drainage pipe density, and impervious surface ratio, with changes in these characteristics having a substantial impact on risk. Specifically, the number of heavy rain days, rainfall amount, slope, and impervious surface ratio have a significant positive effect on the simulation output, while drainage pipe density has a significant negative effect. The SHAP values for impervious surface ratio and rainfall contribution rate are concentrated between −0.2 and 0.1, indicating a weaker influence on the model simulation results. The SHAP values for population and GDP density range show little impact on the output results. However, an increase in POP implies increased losses from heavy rain disasters and heightened disaster risk. The influence of road network density on heavy rain disaster risk is not significant.

3.2.6. Risk Assessment and Validation

Based on the SHAP interpretative analysis results, the impact values of various heavy rain disaster risk factors on regional disasters were obtained (as shown in Table 6). Using ArcGIS (version 10.8, ESRI) spatial analysis software, the risk factor data were standardized into raster layers with a 1 km resolution. According to the results in Table 6, these factor data layers were spatially overlaid with their corresponding risk impact values using Formula (6) to generate a heavy rain disaster risk level zoning map. ArcGIS is a GIS software developed by the Environmental Systems Research Institute (ESRI), a company in the United States. It is widely used for spatial data management and analysis, as well as map visualization. This study utilized the Spatial Analyst and Model Builder tools in ArcGIS to conduct zoning and spatial characteristic analysis of heavy rain disaster risks in this study. Based on the analysis results in Section 2.3.1, there was a considerable increase in the number of heavy rain days and total rainfall in the region from 2000 to 2017. Therefore, four years with notable changes in regional heavy rain disaster losses during this period were selected as typical years: 2003, 2005, 2012, and 2016. Heavy rain disaster risk assessments were conducted for each of these years, using the classification function of layer properties in ArcGIS to categorize the risk levels. The resulting maps of heavy rain disaster risk levels for each year are presented in Figure 8.
The results indicate that the spatial distribution of various risk levels for heavy rain disasters in the study area exhibited significant dynamic changes during typical years. Examining the temporal and spatial trends of each risk level reveals the following:
In Figure 8a, the overall trend of heavy rain disaster risk shows a decrease from southeast to northwest. The high-risk areas for heavy rain disasters are primarily concentrated in Tangshan City, Hebei Province, covering 10.92% of the total area. This is mainly related to the relatively high rainfall contribution rate occurring in this area within the year, with a value reaching 0.62, showing the characteristics of large total rainfall and high intensity. At the same time, the northern part of the city is located on the windward slope of the Yanshan Mountains. Floods caused by heavy rain quickly flow into the urban areas of the southern plains, and the design standard of the urban drainage network is far lower than the heavy rainfall intensity. Multiple factors lead to the high-level heavy rain disaster risk in this city. Medium-risk zones are concentrated in the southern, central, and northeastern regions, forming a band-like, transitional distribution surrounding the relatively high-risk zones. The low-risk areas are primarily located in the western part of the region. In Figure 8b, the high-risk zones are mainly distributed in the flood-prone areas in the southeast of Handan City, Xingtai City, Cangzhou City, and Hengshui City in Hebei Province. This is mainly due to the low density of regional drainage pipes, with an average of 6.45 km per square kilometer, resulting in limited drainage capacity, thus causing a higher risk of heavy rain disasters. The proportion of relatively high-risk zones increases compared to Figure 8a. Medium-risk zones are distributed in the central and northeastern parts of Hebei Province, while low-risk zones remained concentrated in the northwest. In Figure 8c, medium, relatively high, and high-risk areas are concentrated in the east-central region of the study area. Affected by continuous large-scale heavy rain events, the peak daily precipitation appeared at two stations in Tangshan City, Hebei Province, both reaching more than 170 mm. The high-risk areas are mainly concentrated in Tianjin, Tangshan, Qinhuangdao, and Langfang in Hebei Province. The rainfall contribution rate of these four cities increased to 0.67 during this heavy rain event, leading to a slower infiltration rate of rainwater and a substantial increase in surface runoff, thereby aggravating the degree of heavy rain disaster losses in these areas. In Figure 8d, the high-risk zones cover 25.08% of the region, showing a clustered zoning characteristic. The high-risk areas are concentrated in Shijiazhuang City, Cangzhou City, Chengde City, and Tangshan City in Hebei Province. Affected by continuous heavy rain weather, the maximum daily precipitation in Shijiazhuang City reached 218.3 mm, and that in Cangzhou City reached 181.4 mm. These two places are located in the southern part of the North China Plain, with relatively flat terrain. The drainage pipe density is the lowest in the whole region. At the same time, the impervious surface ratio has increased by 29.49% compared with that in Figure 8c, affecting the urban runoff infiltration capacity, thus leading to an increase in heavy rain disaster risk. However, in Tangshan City during this period, factors such as the impervious surface ratio, drainage pipe density, and ecological land remained relatively stable. The main reason for the increase in disaster risk in this area is the growth of population density and GDP density, with respective average annual growth rates of 0.6% and 4.4%. Under the influence of continuous extreme rainstorm weather, the disaster risk level in this area has significantly increased. The distribution of high-risk areas fluctuates in different years, which is mainly influenced by external factors such as the occurrence of rainstorms, regional terrain, and drainage conditions. The medium-risk areas are scattered in the central and northeastern areas, while low-risk zones persisted in the west and south, but their proportion decreased to 22.71%.
Examining the changes in urban risk, in 2012, the high-risk area in Beijing reaches its peak among the four typical years, but decreases by 2016. In Tianjin, the area around the Haihe River estuary consistently remains a high-risk zone for heavy rain disasters across all four years, with high-risk areas comprising 35.2% of the city’s total area. The combined area of relatively high-risk and high-risk zones in Tangshan, Hebei Province, accounted for more than half of the city’s total area, primarily near the estuary of the Luan River (Laoting County section). According to the risk assessment results, the southern coastal areas of Qinhuangdao City continue to face a high risk of heavy rain disasters, with the total area of relatively high-risk and high-risk zones, mainly concentrates in the low-lying southern coastal regions. The spatial distribution of disaster risk in Cangzhou, Hengshui, Xingtai, and Langfang in southern Hebei Province shows that, on average, 88.62% of the high-risk zones for heavy rain disasters were located within floodplains during typical years (see Figure 1 for floodplain distribution). Notably, risk aggregation was particularly significant in areas such as the Xian County floodplain in Cangzhou and the Dongdian flood detention area in Langfang. In Chengde, northern Hebei Province, the risk of heavy rain disasters was predominantly medium to relatively high-risk, with the total area of medium and relatively high-risk zones accounting for 30–40% of the city’s total area during the four typical years. In Zhangjiakou, located in northwestern Hebei Province, low-risk zones for heavy rain disasters covered more than 80% of the city’s total area.
Overall, the spatiotemporal distribution of heavy rain disaster risk in the region has exhibited significant changes. The spatial heterogeneity of disaster risk is the result of coupling of multiple factors, including rain intensity, underlying surface conditions, disaster-bearing bodies, and regional disaster reduction capabilities. Between 2003 and 2016, the area of high-risk for heavy rain disasters within the study region increases, with the proportion of high-risk areas rising by 14.29% of the total area. Relatively high-risk and high-risk zones are concentrated in the south-central part of Beijing, southern Hebei Province cities such as Shijiazhuang, Hengshui, and Xingtai, eastern Hebei cities like Chengde and Qinhuangdao, and southern Tianjin. The proportion of medium-risk zones to the total area remains relatively stable. In Zhangjiakou, located in the northwestern plateau area, is predominantly low-risk for heavy rain disasters, with small portions in the central and southern areas classified as medium-risk.
The improved MAML-RF-SHAP model in this study demonstrated high simulation accuracy and reduced training time in assessing heavy rain disaster risk. To further verify the accuracy and reliability of the assessment results, this study conducted a comparative analysis using actual administrative district disaster data from the China Meteorological Disaster Yearbook for four typical years. According to the yearbooks, in 2003, cities severely affected by heavy rain disasters included Tangshan, Qinhuangdao, Hengshui, and Xingtai in Hebei Province [50]; in 2005, severely affected areas included Miyun District in Beijing and urban areas of Tianjin [51]; in 2012, heavy rain in Tianjin resulted in 118,000 hectares of affected crops, 14,000 hectares of total crop loss [52]; in 2016, heavy rain led to flash floods in the Taihang Mountain area of western Shijiazhuang, Xingtai, and Handan in Hebei Province, as well as severe urban waterlogging [53]. Therefore, the MAML-RF-SHAP model proposed in this paper effectively identified relatively high-risk and high-risk areas in the heavy rain disaster risk assessments for the Beijing–Tianjin–Hebei region across four typical years with varying degrees of disaster loss, aligning closely with the administrative regions recorded in the corresponding year’s meteorological disaster yearbooks.

4. Discussion

In recent years, despite increased attention and management efforts towards mitigating heavy rain disasters in the studied region, the proportion of direct economic losses from heavy rain disasters remains high relative to other meteorological disasters. We believe the reasons may include the following:
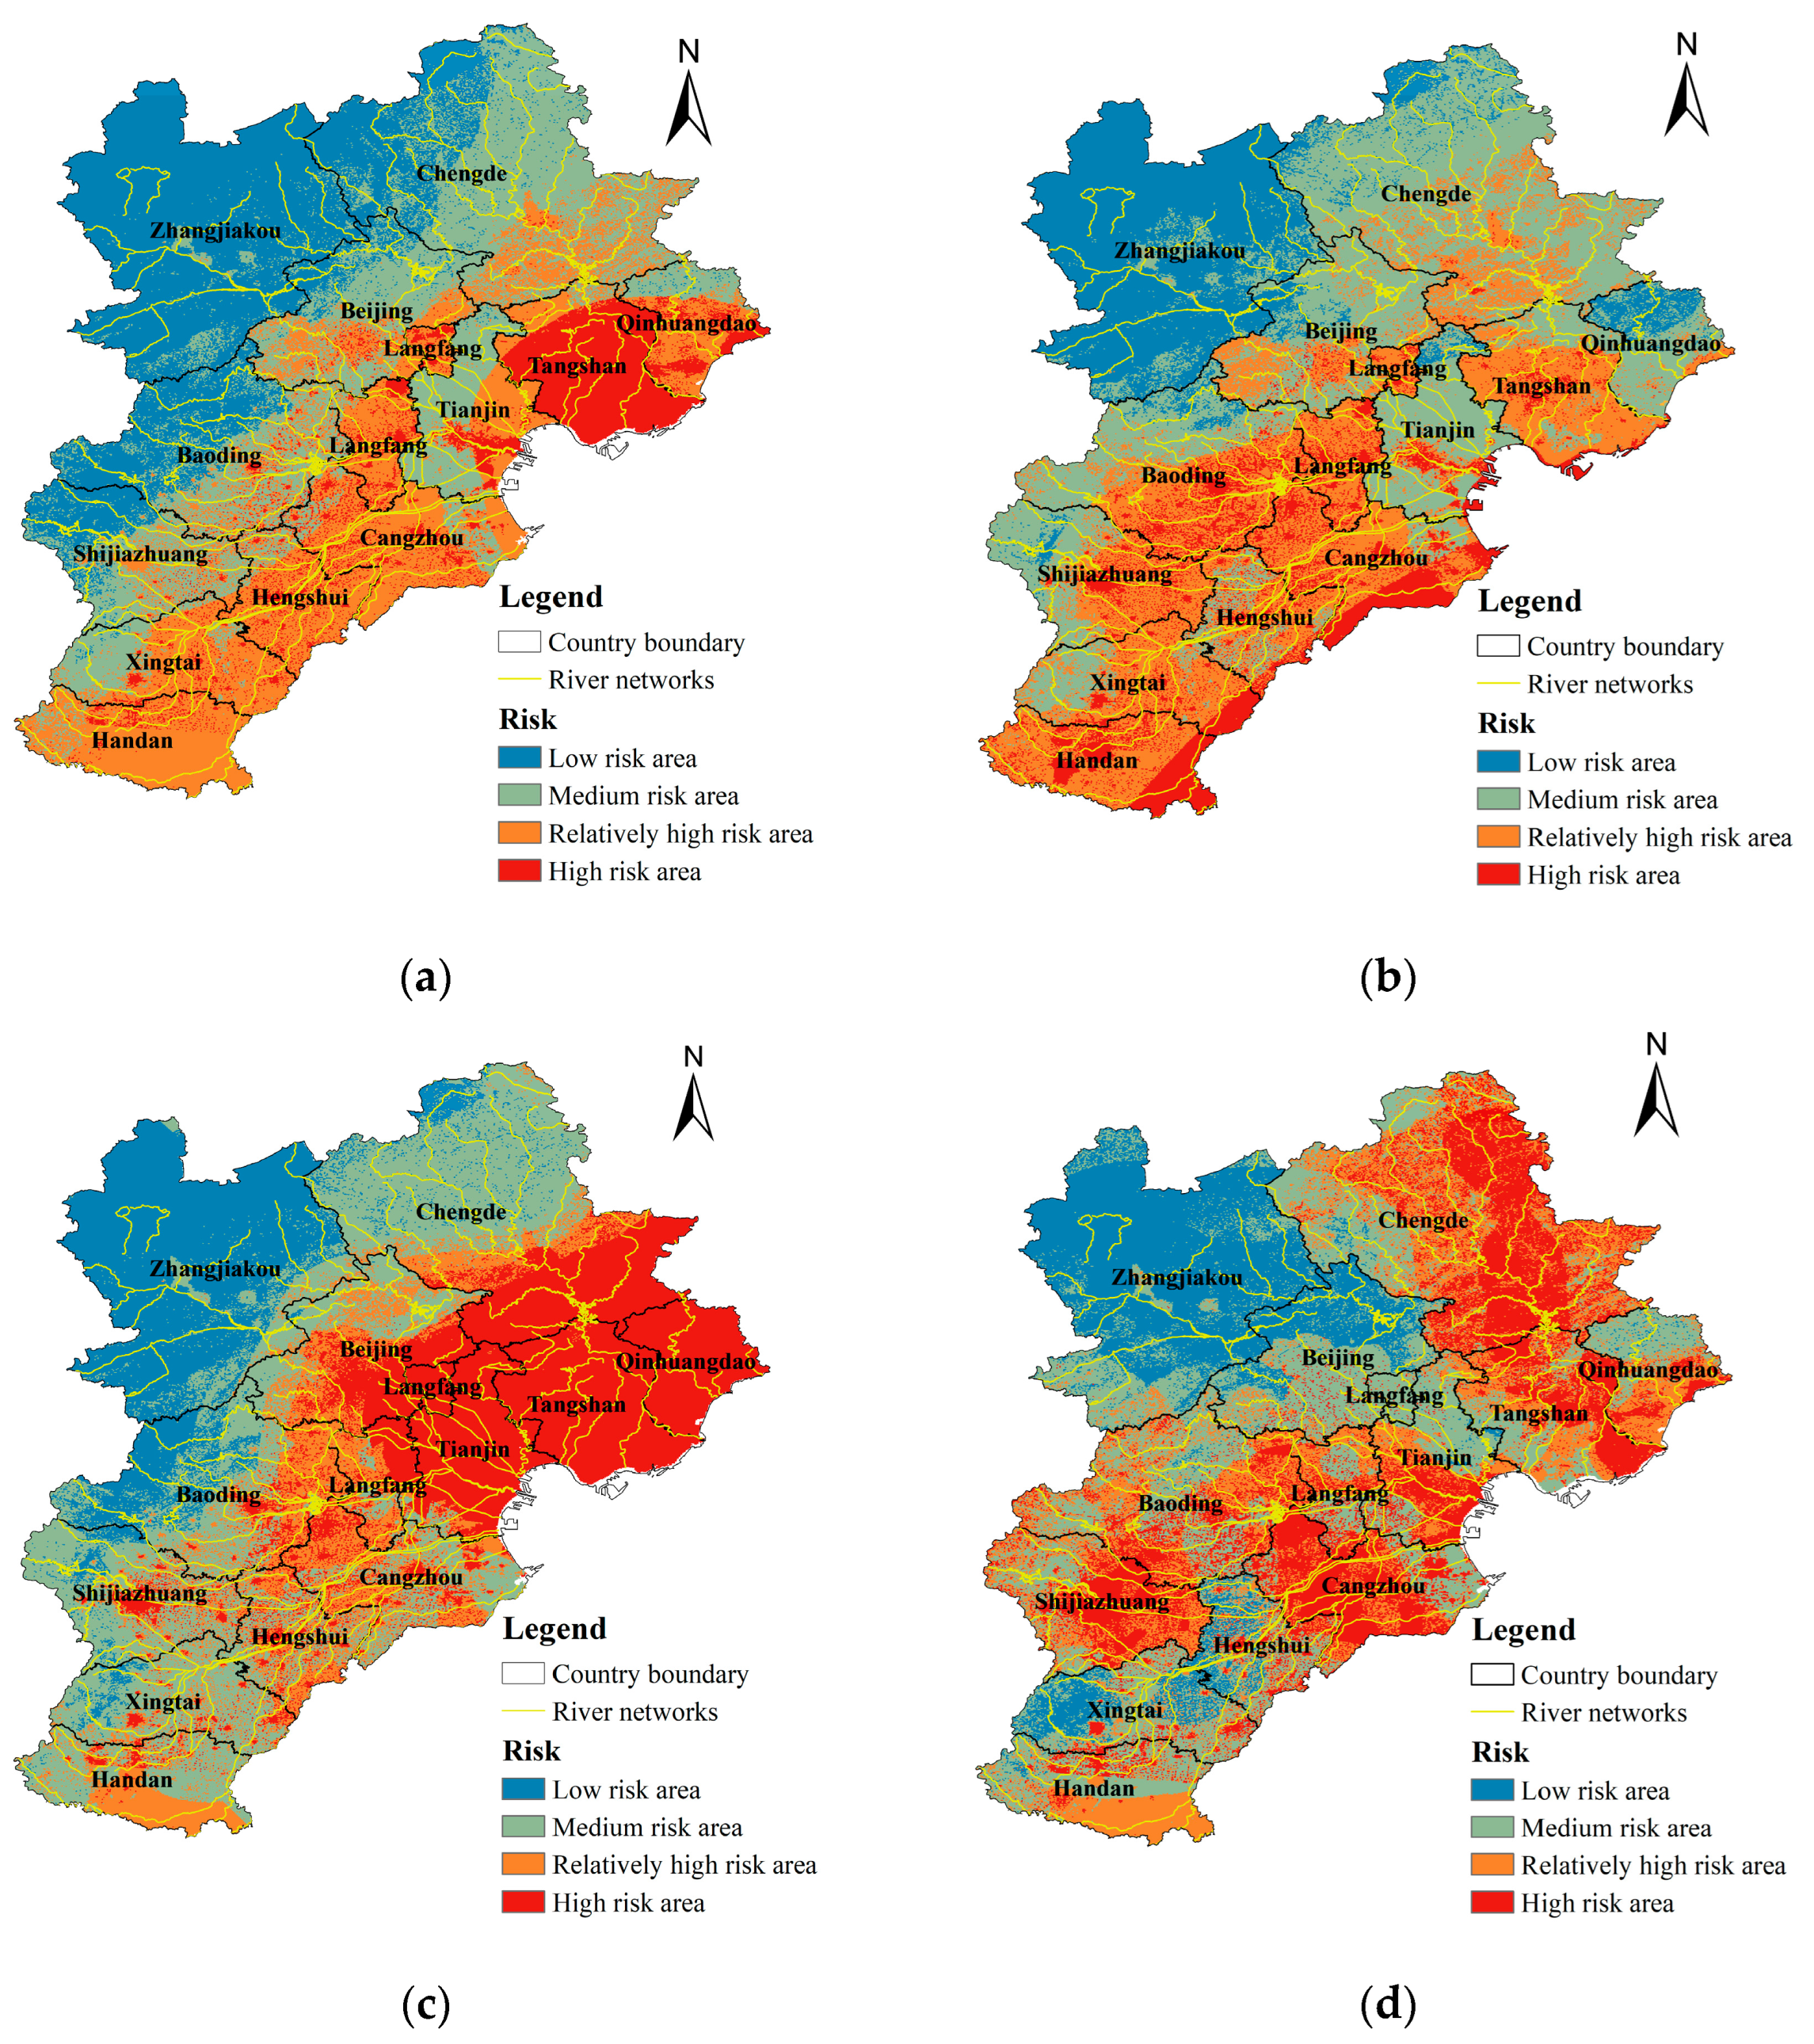
  • Between 2000 and 2010, the areas classified as relatively high and high-risk zones accounted for 40–50% of the total area, primarily located in southern and eastern Hebei Province and Beijing. This may be due to low density of drainage network construction, frequent industrial activities, high density of factory buildings, and inadequate planning, design, and management of flood control and drainage facilities during this period. These issues led to the drainage systems operating beyond capacity, with rainfall intensity in some areas exceeding the design standards of drainage pipes, resulting in widespread waterlogging and flooding of main roads, severely disrupting transportation and causing extensive heavy rain disaster losses.
  • In 2012, the Beijing–Tianjin–Hebei region experienced a three-day extreme heavy rain event. Assessment results showed that the persistent rainfall significantly impacted medium and relatively high-risk areas, which were highly concentrated in Qinhuangdao, Tangshan, Baoding in Hebei Province, Tianjin, and southeastern Beijing. These areas, located on the flat and low-lying North China Plain, suffered from inadequate planning and construction of flood control and drainage facilities, incomplete urban drainage systems, and prominent issues of drainage network aging, damage, and siltation. These factors slowed rainwater infiltration and significantly increased surface runoff, exacerbating the extent of heavy rain disaster losses. This also exposed deficiencies in the disaster prevention and mitigation systems and the collaborative control capabilities of engineering facilities in response to extreme precipitation events, causing severe disruptions to urban transportation and residents’ lives.
  • In 2016, high-risk zones in Hebei Province emerged in the foothill areas at the junction of the North China Plain and the mountains, such as western Handan, western Shijiazhuang, central Xingtai, and east-central Chengde. This may be due to the obstructive and uplifting effects of mountainous terrain, which caused intense surface runoff to form in local areas during heavy rain, quickly converging into mountain streams and leading to road collapses, landslides, and other disasters, significantly elevating the risk levels of heavy rain disasters in these regions. Additionally, based on disaster risk assessment results, high-risk zones for heavy rain disasters mainly appeared in river networks such as the Ziya New River, South Canal, and Chaobai River, as well as in southeastern floodplain areas. This spatial distribution is closely related to regional topography: on one hand, these areas are located in low-lying alluvial plains with poor drainage conditions; on the other hand, some upstream areas have mountainous terrain, where intense rainfall causes mountain floods to rapidly flow downstream, creating significant flood overlay effects. This hydrological process not only increases downstream disaster risk but also causes losses to agricultural production and other socio-economic systems.
Risk assessment results form the basis for devising measures to reduce disaster risks. To mitigate future potential risks, it is essential to proactively implement disaster prevention and mitigation measures based on the assessment results to minimize losses. Based on our analysis of heavy rain events and disasters, we suggest the following strategies to reduce risk and enhance response capabilities:
  • In urban planning and management, strengthen the construction, renovation, and risk assessment of flood control and drainage facilities to improve infrastructure quality.
  • In areas at the junction of plains and mountains, such as western Hebei, northern Beijing, and older residential areas in the study region, provide effective heavy rain warnings, develop emergency plans for different risk levels, and ensure timely relocation and disaster relief efforts. Additionally, strictly regulate river channel filling, install protective river facilities, stabilize unstable slopes, and build check dams downstream of gullies to reduce the impact of secondary disasters like landslides, thereby maximizing public safety [54].
  • Provinces and cities should enhance underground network infrastructure, expedite drainage network upgrades in urban areas, boost flood control and drainage capabilities, develop low-impact rainwater systems, and strengthen sponge city construction to better cope with future heavy rain challenges.
The choice of model is crucial to the accuracy of heavy rain disaster risk assessment. Compared with the SCV-RF assessment model, the MAML-RF model proposed in this study significantly improves simulation accuracy and training efficiency. This demonstrates that the MAML-RF model possesses practical applicability and operability, for real-world heavy rain disaster risk assessments. However, the RF algorithm can only fully leverage its ensemble learning advantages when data are abundant and evenly distributed. Due to the relatively low actual occurrence frequency of relatively high-risk and high-risk heavy rain disaster events, there is a scarcity of high-risk sample data. Therefore, future work should focus on enriching the database of heavy rain disaster loss events and increasing the number of disaster risk factors to drive more accurate simulations with the MAML-RF model, further improving the accuracy of heavy rain disaster risk simulations.

5. Conclusions

Based on the analysis of the spatiotemporal distribution of heavy rain and the characteristics of disaster occurrence in the Beijing–Tianjin–Hebei region, this paper selected ten heavy rain disaster risk factors from four dimensions of regional heavy rain disaster factors, disaster-breeding environment, disaster-bearing bodies, and disaster mitigation capacity to construct a disaster risk assessment model by using daily scale precipitation data, heavy rain historical disaster data, and social and economic data of 26 meteorological observation stations in the region. The application of the MAML meta-learning method in the hyper-parameter optimization of the random forest model was improved, so as to construct the MAML-RF assessment model, and the accuracy was compared with the SCV -RF model based on traditional random search and cross validation hyper-parameter optimization. The more accurate mode was selected to evaluate the heavy rain disaster risk in the region, the SHAP interpretability algorithm was introduced to quantify the impact of each risk factor, and risk assessment was carried out for the typical year of regional heavy rain disaster.
The results show the following outcomes:
(1)
The number of heavy rain days and the annual characteristics of heavy rain show a downward trend, but a significant upward trend from 2000 to 2017.
(2)
The MAML-RF model improved simulation accuracy, precision, and recall by 4.44%, 3.71%, and 4.44%, respectively, over the SCV-RF model, while also reducing simulation time by 2.06 s. This indicates that the improved MAML-RF model provides superior output results in assessing heavy rain disaster risk, demonstrating high robustness and generalization capability.
(3)
The introduction of the SHAP interpretability algorithm for analyzing the MAML-RF model revealed that five heavy rain disaster risk factors—number of heavy rain days, rainfall amount, slope, drainage pipe density, and impervious surface ratio—have the most significant impact on disaster risk. The driving effect of these disaster-inducing factors on heavy rain disaster risk is more pronounced compared to the disaster-prone environment, disaster-bearing body, and disaster mitigation capacity, with a cumulative influence weight reaching 0.519.
(4)
The spatiotemporal distribution of heavy rain disaster risk has exhibited significant changes. The area of high-risk within the region has increased. Relatively high-risk and high-risk areas are mainly distributed in the south-central part of Beijing, southern Hebei Province cities such as Shijiazhuang, Hengshui, and Xingtai, eastern Hebei cities like Chengde and Qinhuangdao, and southern Tianjin. The area proportion of medium-risk zones to the area remains relatively stable. Low-risk areas for the disaster are clustered in the northwestern plateau area.

Author Contributions

Conceptualization, Y.F. and Y.W.; methodology, Y.F.; software, Y.F.; validation, Y.F.; formal analysis, Y.F.; investigation, Y.W.; resources, Y.F.; data curation, Y.F.; writing—original draft preparation, Y.F.; writing—review and editing, Y.F. and Y.W.; visualization, Y.F.; supervision, Y.W.; funding acquisition, W.X. and B.H. All authors have read and agreed to the published version of the manuscript.

Funding

This research was funded by the National Key Research and Development Project (2023YFC3205701) and Guangdong Foundation for Program of Science and Technology Research (2023B0202030001).

Institutional Review Board Statement

Not applicable.

Informed Consent Statement

Not applicable.

Data Availability Statement

The data presented in this study are available on request from the corresponding author.

Acknowledgments

The author would like to acknowledge the research group members and Wenglong Wu for their assistance with manuscript preparation.

Conflicts of Interest

The authors declare no conflicts of interest.

References

  1. Wang, G.; Zhang, Q.; Yu, H.; Shen, Z.; Sun, P. Double increase in precipitation extremes across China in a 1.5 °C/2.0 °C warmer climate. Sci. Total Environ. 2020, 746, 140807. [Google Scholar] [CrossRef] [PubMed]
  2. Wang, J.; Tan, J.K. Understanding the climate change and disaster risks in coastal areas of China to develop coping strategies. Prog. Geogr. 2021, 40, 870–882. [Google Scholar] [CrossRef]
  3. Sun, Y.H.; Zhang, W. The Logical Turn and Implementation Path of Public Security System Construction in the New Era: A Study Based on the Framework of Overall Security and Emergency Response. Jianghai Acad. J. 2024, 2, 131–139. [Google Scholar]
  4. Tang, J.; Li, Y.; Cui, S.; Xu, L.; Hu, Y.; Ding, S.; Vilas, N. Analyzing the spatiotemporal dynamics of flood risk and its driving factors in a coastal watershed of southeastern China. Ecol. Indic. 2021, 121, 107134. [Google Scholar] [CrossRef]
  5. Wang, Y.J.; Zhai, J.Q.; Ge, G.; Liu, Q.F.; Song, L.C. Risk Assessment of Rainstorm Disasters in the Guangdong–Hong Kong–Macao Greater Bay Area of China during 1990–2018. Geomatics. Nat. Hazards Risk 2021, 13, 267–288. [Google Scholar] [CrossRef]
  6. Fu, H.E.; Gao, Y.J.; Feng, Y.Y.; Huang, J.Y.; Liu, Z.F. Hazard prediction of urban rainstorm and flood disasters based on GA–SVR–C model: Case study of Shenzhen City. Yangtze River 2021, 52, 16–21. [Google Scholar]
  7. Wu, M.M.; Wu, Z.N.; Ge, W.; Wang, H.L.; Shen, Y.X.; Jiang, M.M. Identification of sensitivity indicators of urban rainstorm flood disasters: A case study in China. J. Hydrol. 2021, 599, 126393. [Google Scholar] [CrossRef]
  8. Zhou, C.; Si, L.L.; Zhao, L.; Lang, Z.Q.; Fu, Z.Z. Refined evaluation of maize flood disaster based on Google Earth Engine: A case study of the “23·7” heavy precipitation process in Baoding City, Hebei Province. Chin. J. Eco-Agric. 2025, 33, 1–11. [Google Scholar]
  9. Wang, X.W.; Ning, Y.Z.; Fang, Y.J.; Yuan, P.Q.; Gao, Y.X.; Zhong, Z.W.; Chen, D.A.; Li, X.; Chen, D.S. A technique framework and implementation for rapid survey and assessment of flood disasters: A case study in the North River Basin in June 2022. Water Resour. Hydropower Eng. 2023, 54, 1–20. [Google Scholar]
  10. Zhao, Z.N.; Wang, L.R.; Wang, C.M.; Han, X.Q. Risk Distribution Characteristics of Rainstorm and Flood Disaster Based on Flood Area Model in the Xiaoma River Basin of Xingtai. J. Arid Meteorol. 2021, 39, 486–493. [Google Scholar]
  11. Chen, J.F.; Liu, L.M.; Pei, J.P.; Deng, M.H. An ensemble risk assessment model for urban rainstorm disasters based on random forest and deep belief nets: A case study of Nanjing, China. Nat. Hazards 2021, 107, 2671–2692. [Google Scholar] [CrossRef]
  12. Xie, T.; Yu, L.; Zhou, H.; Qin, W.S. Evaluation of dual-Doppler radar wind retrieval methods based on observation system simulation experiment. J. Meteorol. Sci. 2024, 44, 1140–1153. [Google Scholar]
  13. Fang, X.; Wu, X.; Zhou, C.; Wu, T.; Du, X.; Wang, W. Risk Assessment of Mountain Torrents Disaster in Jiangxi Province, China Based on Random Forest Algorithm. In Proceedings of the IGARSS 2019—2019 IEEE International Geoscience and Remote Sensing Symposium, Yokohama, Japan, 28 July–2 August 2019; pp. 9752–9755. [Google Scholar]
  14. Huang, X.; Zhao, H.; Huang, Y.; Wu, Y. Prediction model based on the Laplacian eigenmap method combined with a random forest algorithm for rainstorm satellite images during the first annual rainy season in South China. Nat. Hazards 2021, 107, 331–353. [Google Scholar] [CrossRef]
  15. Lai, C.G.; Chen, X.H.; Zhao, S.W.; Wang, Z.L.; Wu, X.S. A flood risk assessment model based on Random Forest and its application. J. Hydraul. Eng. 2015, 46, 58–66. [Google Scholar]
  16. Iverson, L.R.; Prasad, A.M.; Matthews, S.N.; Peters, M. Estimating potential habitat for 134 eastern US tree species under six climate scenarios. For. Ecol. Manag. 2008, 254, 390–406. [Google Scholar] [CrossRef]
  17. Wang, J.; Feng, J.; Yan, Z. Impact of extensive urbanization on summertime rainfall in the Beijing region and the role of local precipitation recycling. J. Geophys. Res. Atmos. 2018, 123, 3323–3340. [Google Scholar] [CrossRef]
  18. Zhang, J.; You, S.; Liu, A.; Xie, L.; Huang, C.; Han, X.; Li, P.; Wu, Y.; Deng, J. Winter Wheat Mapping Method Based on Pseudo-Labels and U-Net Model for Training Sample Shortage. Remote Sens. 2024, 16, 2553. [Google Scholar] [CrossRef]
  19. Philipp, P.; Marvin, N.W.; Anne, L.B. Hyperparameters and tuning strategies for random forest. WIREs Data Min. Knowl. Discov. 2019, 9, 3. [Google Scholar]
  20. Rui, Q.; Yu, Z.; Zhu, R. Random Forest Weighted Local Fréchet Regression with Random Objects. J. Mach. Learn. Res. 2022, 107, 1–69. [Google Scholar]
  21. Chen, X.J.; Han, X.L.; Zhang, L.; Wu, Z.H.; Ji, J. Parameter optimization of steel-concrete beam and column fiber elements based on random forest algorithm. J. Harbin Inst. Technol. 2024, 1–15. [Google Scholar]
  22. Gao, X.B.; Jia, B.; Li, G.; Ma, X.J. Coal-gangue calorific value prediction based on machine learning algorithm combined with parameter optimization. Mod. Electron. Tech. 2023, 46, 168–174. [Google Scholar]
  23. Kadam, V.; Jadhav, S. Performance analysis of hyperparameter optimization methods for ensemble learning with small and medium sized medical datasets. J. Discret. Math. Sci. Cryptogr. 2020, 23, 115–123. [Google Scholar] [CrossRef]
  24. Liu, C.H.; Zhang, W.M.; Xue, F. Research on kinematic parameters optimization of robot arm based on random forest Bayesian optimization. Manuf. Technol. Mach. Tools 2023, 727, 83–90. [Google Scholar]
  25. Shi, S.; Bao, J.; Guo, Z.; Han, Y.; Xu, Y.; Ugochi, U.; Zhao, L.; Jiang, N.; Sun, L.; Liu, X.; et al. Improving prediction of N2O emissions during composting using model-agnostic meta-learning. Sci. Total Environ. 2024, 922, 171357. [Google Scholar] [CrossRef] [PubMed]
  26. Wang, G.P.; Liu, L.Y.; Hu, Z.Y. Risk Assessment of Rainstorm and Flood Disasters at Grid-scale in Beijing-Tianjin-Hebei Metropolitan Area. J. Catastrophology 2020, 35, 186–193. [Google Scholar]
  27. Wang, W.; Miao, C.; Yu, H.; Li, C. Research on the characteristics and influencing factors of the Beijing-Tianjin-Hebei urban network structure from the perspective of listed manufacturing enterprises. PLoS ONE 2023, 18, e0279588. [Google Scholar] [CrossRef]
  28. Wang, Y.J.; Lin, X. A review of climate change and its impact and adaptation in Beijing-Tianjin-Hebei urban agglomeration. Clim. Change Res. 2022, 18, 743–755. [Google Scholar]
  29. Nardi, F.; Annis, A.; Di Baldassarre, G.; Vivoni, E.R.; Grimaldi, S. GFPLAIN250m, a global high-resolution dataset of Earth’s floodplains. Sci. Data 2019, 6, 180309. [Google Scholar] [CrossRef]
  30. GB/T 33680-2017; Grades of Rainstorm Disaster. National Technical Committee on Climate and Climate Change Standardization: Beijing, China, 2017; pp. 1–7.
  31. Contreras, P.; Orellana-Alvear, J.; Muñoz, P.; Bendix, J.; Célleri, R. Influence of Random Forest Hyperparameterization on Short-Term Runoff Forecasting in an Andean Mountain Catchment. Atmosphere 2021, 12, 238. [Google Scholar] [CrossRef]
  32. Li, Y.; Gong, S.; Zhang, Z.; Liu, M.; Sun, C.; Zhao, Y. Vulnerability evaluation of rainstorm disaster based on ESA conceptual framework: A case study of Liaoning province, China. Sustain. Cities Soc. 2021, 64, 102540. [Google Scholar] [CrossRef]
  33. Shen, R.S.; Chen, T.T.; Yang, H.Z. Risk Assessment and Driving Factors of Urban Rainstorm and Waterlogging Disasters: A Case Study of the Eight Districts of Hangzhou. Urban Planning Society of China, Hefei Municipal People’s Government. In Beautiful China, Co-construction, Co-governance and Sharing-Proceedings of the 2024 China Urban Planning Annual Conference (02 Urban Safety and Disaster Prevention Planning); Zhejiang University of Technology: Hangzhou, China, 2024; pp. 467–477. [Google Scholar]
  34. Erik, Š.; Kononenko, I. Explaining prediction models and individual predictions with feature contributions. Knowl. Inf. Syst. 2014, 41, 647–665. [Google Scholar]
  35. Meng, D.; Li, X.J.; Gong, H.L.; Qu, Y.T. Analysis of Spatial-Temporal Change of NDVI and Its Climatic Driving Factors in Beijing-Tianjin-Hebei Metropolis Circle from 2001 to 2013. J. Geo-Inf. Sci. 2015, 17, 1001–1007. [Google Scholar]
  36. Wang, J.C.; Dong, L.J. Risk assessment of rockburst using SMOTE oversampling and integration algorithms under GBDT framework. J. Cent. South Univ. 2024, 31, 2891–2915. [Google Scholar] [CrossRef]
  37. Yao, Y.; Li, X.H.; Wang, L.; Li, H. Future Projection of Rainstorm and Flood Disaster Risk in Sichuan-Chongqing Region under CMIP6 Different Climate Change Scenarios. Plateau Meteorol. 2024, 1–18. [Google Scholar] [CrossRef]
  38. Ji, Z.C.; Zhang, D.; Yu, X. Analysis of the spatiotemporal characteristics of the danger degree of the torrential rain in the Huaihe River basin. Torrential Rain Disasters 2022, 41, 580–587. [Google Scholar]
  39. Xu, H.C.; Li, C.L.; Wang, H.; Liu, M.; Hu, Y.M. Impact of land use change on the spatiotemporal evolution of the regional thermal environment in the Beijing-Tianjin-Hebei urban agglomeration. China Environ. Sci. 2023, 43, 1340–1348. [Google Scholar]
  40. Shi, P.J. Theory and Practice of Disaster Study. J. Nat. Disasters 1996, 5, 6–17. [Google Scholar]
  41. Wang, C.Q.; Wang, K.X.; Liu, D.; Zhang, L.L.; Li, M. Muhammad Imran Khan, Tianxiao Li, Song Cui, Development and application of a comprehensive assessment method of regional flood disaster risk based on a refined random forest model using beluga whale optimization. J. Hydrol. 2024, 633, 130963. [Google Scholar] [CrossRef]
  42. Cheng, C.; Fang, X.Y.; Li, M.C.; Yang, Y.H.; Gao, Y.; Zhang, S.; Yu, Y.; Liu, Y.H.; Du, W.P. Rainstorm and high-temperature disaster risk assessment of territorial space in Beijing, China. Res. Artic. 2023, 30, 3023. [Google Scholar] [CrossRef]
  43. Du, S.; Shi, P.; Anton, V.; Wen, J. Quantifying the impact of impervious surface location on flood peak discharge in urban areas. Nat. Hazards 2015, 76, 1457–1471. [Google Scholar] [CrossRef]
  44. Han, F.; Yu, J.; Zhou, G.; Li, S.; Sun, T. A comparative study on urban waterlogging susceptibility assessment based on multiple data driven models. J. Environ. Manag. 2024, 360, 121166. [Google Scholar] [CrossRef] [PubMed]
  45. Xiang, X.; Zhang, S.J.; Zhao, J.; Peng, Y.Q.; Lei, A.L.; Zhu, S.J.; Wu, H.X.; Zhao, F. Spatio-temporal evolution characteristics and influencing factors analysis of meteorological disasters in typical regions of the Yunnan-Guizhou Plateau. J. Spatiotemporal Inf. 2024, 31, 118–128. [Google Scholar]
  46. Liu, Z.; Jiang, Z.Z.; Xu, C.; Cai, G.J.; Zhan, J. Assessment of provincial waterlogging risk based on entropy weight TOPSIS–PCA method. Nat. Hazards 2021, 108, 1545–1567. [Google Scholar] [CrossRef]
  47. Guo, E.L.; Zhang, J.Q.; Ren, X.H.; Zhang, Q.; Sun, Z.Y. Integrated risk assessment of flood disaster based on improved set pair analysis and the variable fuzzy set theory in central Liaoning Province, China. Nat. Hazards 2014, 74, 947–965. [Google Scholar] [CrossRef]
  48. Li, F.; Wang, L.; Zhao, Y. Evolvement rules of basin flood risk under low-carbon mode. Part II: Risk assessment of flood disaster under different land use patterns in the Haihe basin. Environ. Monit. Assess. 2017, 189, 397. [Google Scholar] [CrossRef]
  49. Wu, X.H.; Zhao, J.Q.; Kuai, Y.; Guo, J.; Gao, G. Construction and verification of a rainstorm death risk index based on grid data fusion: A case study of the Beijing rainstorm on July 21, 2012. Nat. Hazards 2021, 107, 2293–2318. [Google Scholar] [CrossRef]
  50. China Meteorological Administration. China Meteorological Disaster Yearbook; China Meteorological Press: Beijing, China, 2004. [Google Scholar]
  51. China Meteorological Administration. China Meteorological Disaster Yearbook; China Meteorological Press: Beijing, China, 2006. [Google Scholar]
  52. China Meteorological Administration. China Meteorological Disaster Yearbook; China Meteorological Press: Beijing, China, 2013. [Google Scholar]
  53. China Meteorological Administration. China Meteorological Disaster Yearbook; China Meteorological Press: Beijing, China, 2017. [Google Scholar]
  54. Yang, J.P.; Chen, N.S.; Yang, Z.Q.; Peng, X.T.; Tian, S.F.; Huang, N. Risk amplification effect caused by main stream road bridges and culverts blockages due to debris flow. Chin. J. Geol. Hazard Control 2024, 35, 120–132. [Google Scholar]
Figure 1. Beijing–Tianjin–Hebei urban agglomeration. (a) Geographical location. (b) Administrative division and distribution of meteorological stations. (c) River and floodplains.
Applsci 15 06165 g001
Figure 2. Technical roadmap of MAML-RF-SHAP heavy rain disaster risk assessment model.
Applsci 15 06165 g002
Figure 3. The variation trend of (a) annual number of heavy rain days and (b) annual rainfall amount from 1970 to 2017.
Applsci 15 06165 g003
Figure 4. The seasonal variation of (a) rainfall amount and (b) rainfall contribution rate from 1970 to 2017.
Applsci 15 06165 g004
Figure 5. Spatial distribution map of the frequency of heavy rain days in the area.
Applsci 15 06165 g005
Figure 6. The confusion matrix of the model on the test set: (a) SCV-RF model; (b) MAML-RF model.
Applsci 15 06165 g006
Figure 7. The global interpretation diagram of SHAP algorithm for risk factors.
Applsci 15 06165 g007
Figure 8. Heavy rain disaster risk zoning grade map: (a) 2003; (b) 2005; (c) 2008; (d) 2016.
Applsci 15 06165 g008
Table 1. Historical heavy rain disaster event sample set (RD represents the grade level for the duration of heavy rain, RA for the affected area, AI for the impacted crop area, RJ for direct economic losses, RS for fatalities, and FD for the comprehensive heavy rain disaster assessment index).
IndexYearMonthDayRDRAAIRJRSFD
1201887230001
22018724110001
32017823120001
42017812110001
52017623111111
62016720241111
72016720241212
82016719241443
92016623120001
102014831111101
Table 2. Heavy rain disaster risk assessment system in the Beijing–Tianjin–Hebei region.
ObjectCriterionIndicatorAbbreviationData SourceUnit
Heavy rain
disaster risk
Disaster-causing factorsHeavy rain daysHRDhttps://m.data.cma.cn/ accessed on 12 December 2023d
Rainfall amountRFAmm
Rainfall contribution rateRC
Disaster-prone environmentSlopeSlopehttps://www.gscloud.cn/ accessed on 12 December 2023degree
Impervious surface ratioISRAnnual China Land Cover Datasetkm/km2
Disaster-bearing bodyPopulation densityPOPhttps://www.resdc.cn/ accessed on 12 December 2023P/km2
GDP densityGDPhttps://www.resdc.cn/ accessed on 12 December 2023k/km2
Land Use/Land coverLULCAnnual China Land Cover Dataset
Disaster mitigation capacityRoad network densityRNDChina Urban Construction Statistical Yearbookkm/km2
Drainage pipe densityDPDChina Urban Construction Statistical Yearbookkm/km2
Table 3. Classification of heavy rain disaster risk factors.
IndicatorIIIIIIIV
HRD0–33–55–77–15 [43]
RFA100–200200–400400–800>800 [11]
RC0–0.1750.175–0.350.35–0.525>0.525 [44]
Slope<66–1515–25>25 [45]
ISR0–0.10.1–0.20.2–0.3>0.3 [46]
POP0–300300–500500–700>700 [47]
GDP0–20002000–30003000–4000>4000 [48]
LULC4 231 75 6 8 9 [49]
RND0–33.0–4.54.5–6.0>6.0 [43]
DPD8>8–66–44–2 [43]
Table 4. Hyperparameters settings of the SCV-RF model and MAML-RF model.
HyperparameterDefinitionSCV-RFMAML-RF
n_estimatorsNumber of decision trees1412
max_depthThe maximum depth of decision tree86
min_samples_leafThe minimum number of samples of leaf nodes22
min_samples_splitThe minimum number of samples required for internal node splitting33
Table 5. Evaluation accuracy of the SCV-RF model and MAML-RF model on the training set and test set respectively.
Training SetTest Set
Evaluation accuracySCV-RFMAML-RFSCV-RFMAML-RF
Accuracy91.35%92.31%86.67%91.11%
Precision93.50%94.74%88.20%91.91%
Recall91.35%92.31%86.67%91.11%
Table 6. The weight results of heavy rain disaster risk factors on risk impact.
CriterionRisk FactorsFactor Weights
Disaster-causing factorsHRD0.302
RFA0.118
RC0.099
Disaster-prone environmentSlope0.113
ISR0.104
Disaster-bearing bodyPOP0.074
GDP0.036
LULC0.041
Disaster mitigation capacitycriterionRND0.007
DPD0.106
Disclaimer/Publisher’s Note: The statements, opinions and data contained in all publications are solely those of the individual author(s) and contributor(s) and not of MDPI and/or the editor(s). MDPI and/or the editor(s) disclaim responsibility for any injury to people or property resulting from any ideas, methods, instructions or products referred to in the content.

