1. Introduction
The implementation of modern technologies in educational processes creates space for increasing the efficiency of the educational process while simultaneously addressing the needs of the current digital generation. These tools, which can include multimedia presentations, virtual reality, or various online educational platforms, allow students not only to better understand but also to retain the lectured content. They provide educators with the opportunity to create a multisensory educational environment, as traditional educational materials are presented in interactive electronic formats [
1]. Modern technologies bring many options for teaching how to display and present information to students during the teaching process. These technologies are integrated into the presentation process, gradually pushing conventional forms of presentation into the background [
2]. At the same time, it is important to use innovative approaches and information technologies in educational processes, as modern tools increase the interactivity and accessibility of knowledge. Modern tools, techniques, and technologies enrich professional and educational presentations while supporting effective learning, thereby contributing to the dynamics and relevance of the modern educational environment [
3].
Current technologies used in education also allow for rapid feedback, continuous improvement of study materials, and the enhancement of the entire educational process. One of the more advanced technological solutions is see-through displays, which combine digital information with the real environment. Dynamic animations and high contrast help to ensure better readability and increase the attractiveness of the presented content [
4]. In addition to the visual impression, interactivity is also essential, as it increases the active involvement of the surrounding area. See-through displays are commonly used in retail [
5,
6], the automotive industry [
7,
8], and museums [
9,
10]. One of the main advantages they have, which is also important for the educational process where these displays are increasingly being used, is their ability to increase engagement and attention. This was confirmed by research conducted by Colley et al., who found that see-through signage was noticed by 46% of the people, compared to just 14% for the non-see-through version [
11]. In 2014, a study [
12] was conducted that confirmed that digital technologies overall contribute to increased student engagement, improved results, and strengthened motivation in the educational process. In 2020, a study [
13] was conducted that demonstrated that interactive displays can “consolidate and sustain collaboration and rich interaction with content in a natural and engaging way”. Research conducted with 36 participants in a two-stage experiment showed that collaborative respondents with similar visual perception on interactive displays achieved better learning outcomes than respondents working individually, which indicates a positive impact of these technologies on collaboration.
However, the effectiveness of implementing such tools depends on several factors, including the design of educational activities, the connection of technological knowledge with pedagogical content, and the overall strategy of the educational institution in the field of technology implementation [
14]. In the current educational process, one can observe the use of augmented reality, classified as a special technology and often incorporated into see-through displays, as it frequently uses them in its designs. The integration of transparent displays, especially through augmented reality (AR) technologies, offers significant advantages in mechanical engineering education by improving visualization. This helps students understand complex concepts, such as 3D mechanics, by allowing them to visualize forces and interactions in real time [
15,
16]. Studies [
17,
18,
19] suggest that AR applications improve task completion times and reduce errors in laboratory environments, with the majority of students preferring AR-based instruction over traditional methods. In comparison, transparent displays provide a similar immersive experience that allows students to interact with 3D models while maintaining awareness of their physical environment, promoting a more intuitive learning experience [
20,
21,
22].
While both see-through displays and augmented reality systems enable the superimposition of digital content onto the physical world, their mechanisms and use cases diverge significantly. See-through displays operate as passive optical overlays, typically using semi-transparent LCD or OLED panels to project predefined content in fixed spatial alignment. In contrast, AR technologies employ active spatial registration, often using computer vision, SLAM (Simultaneous Localization and Mapping), and real-time sensor fusion to dynamically map virtual elements into a continuously changing physical environment. Moreover, see-through displays do not rely on object recognition or 3D tracking algorithms and therefore impose lower computational and latency requirements, making them more suitable for structured environments like classrooms or laboratories. Both technologies encourage independent learning and offer immediate feedback, improving overall learning outcomes in engineering disciplines [
23,
24,
25]. In mechanical engineering, the integration of AR with transparent displays and deep learning has revolutionized the design and maintenance process. This combination enables the visualization of complex 3D models and simulations in real time, allowing engineers to interact with virtual prototypes overlaid on physical objects [
26].
Despite the technological progress in the field of transparent displays, further research activities are needed, particularly in the application area, with a focus on education in technical fields. Existing studies mainly focus on technical aspects, such as the calibration of optical transparent head-mounted displays [
27,
28,
29] and the use of modern technologies in education, primarily for the healthcare field [
30,
31], with marginal attention to engineering, mostly centered around virtual or augmented reality [
32,
33,
34]. This creates a need to supplement knowledge in other fields of engineering education, specifically in developing methodologies for the effective creation and implementation of specialized technologies, such as see-through displays.
The content of the presented article aims to partially fill this research gap, focusing on identifying the methodology for designing and creating content for presentation purposes using see-through displays, specifically with a focus on engineering education. The main part of the article identifies a comprehensive methodology with detailed characteristics, which is further supported by practical application in teaching, with an emphasis on computer modeling and assembly creation.
The objective of this research is to develop and validate a comprehensive methodology for designing and creating digital presentation content specifically tailored for see-through-display technologies, with a primary focus on applications in engineering education. This study aims to enhance the effectiveness of educational presentations by integrating digital visualizations with real-world physical objects, thereby improving comprehension, interactivity, and engagement. Through a structured process involving content design, 3D modeling, animation, user interface development, and additive manufacturing, the methodology guides educators in creating visually coherent and technically optimized presentations. A pilot case study in mechanical engineering education demonstrates the practical application of the methodology.
2. The Methodology for Designing and Creating Content for Presentation Purposes
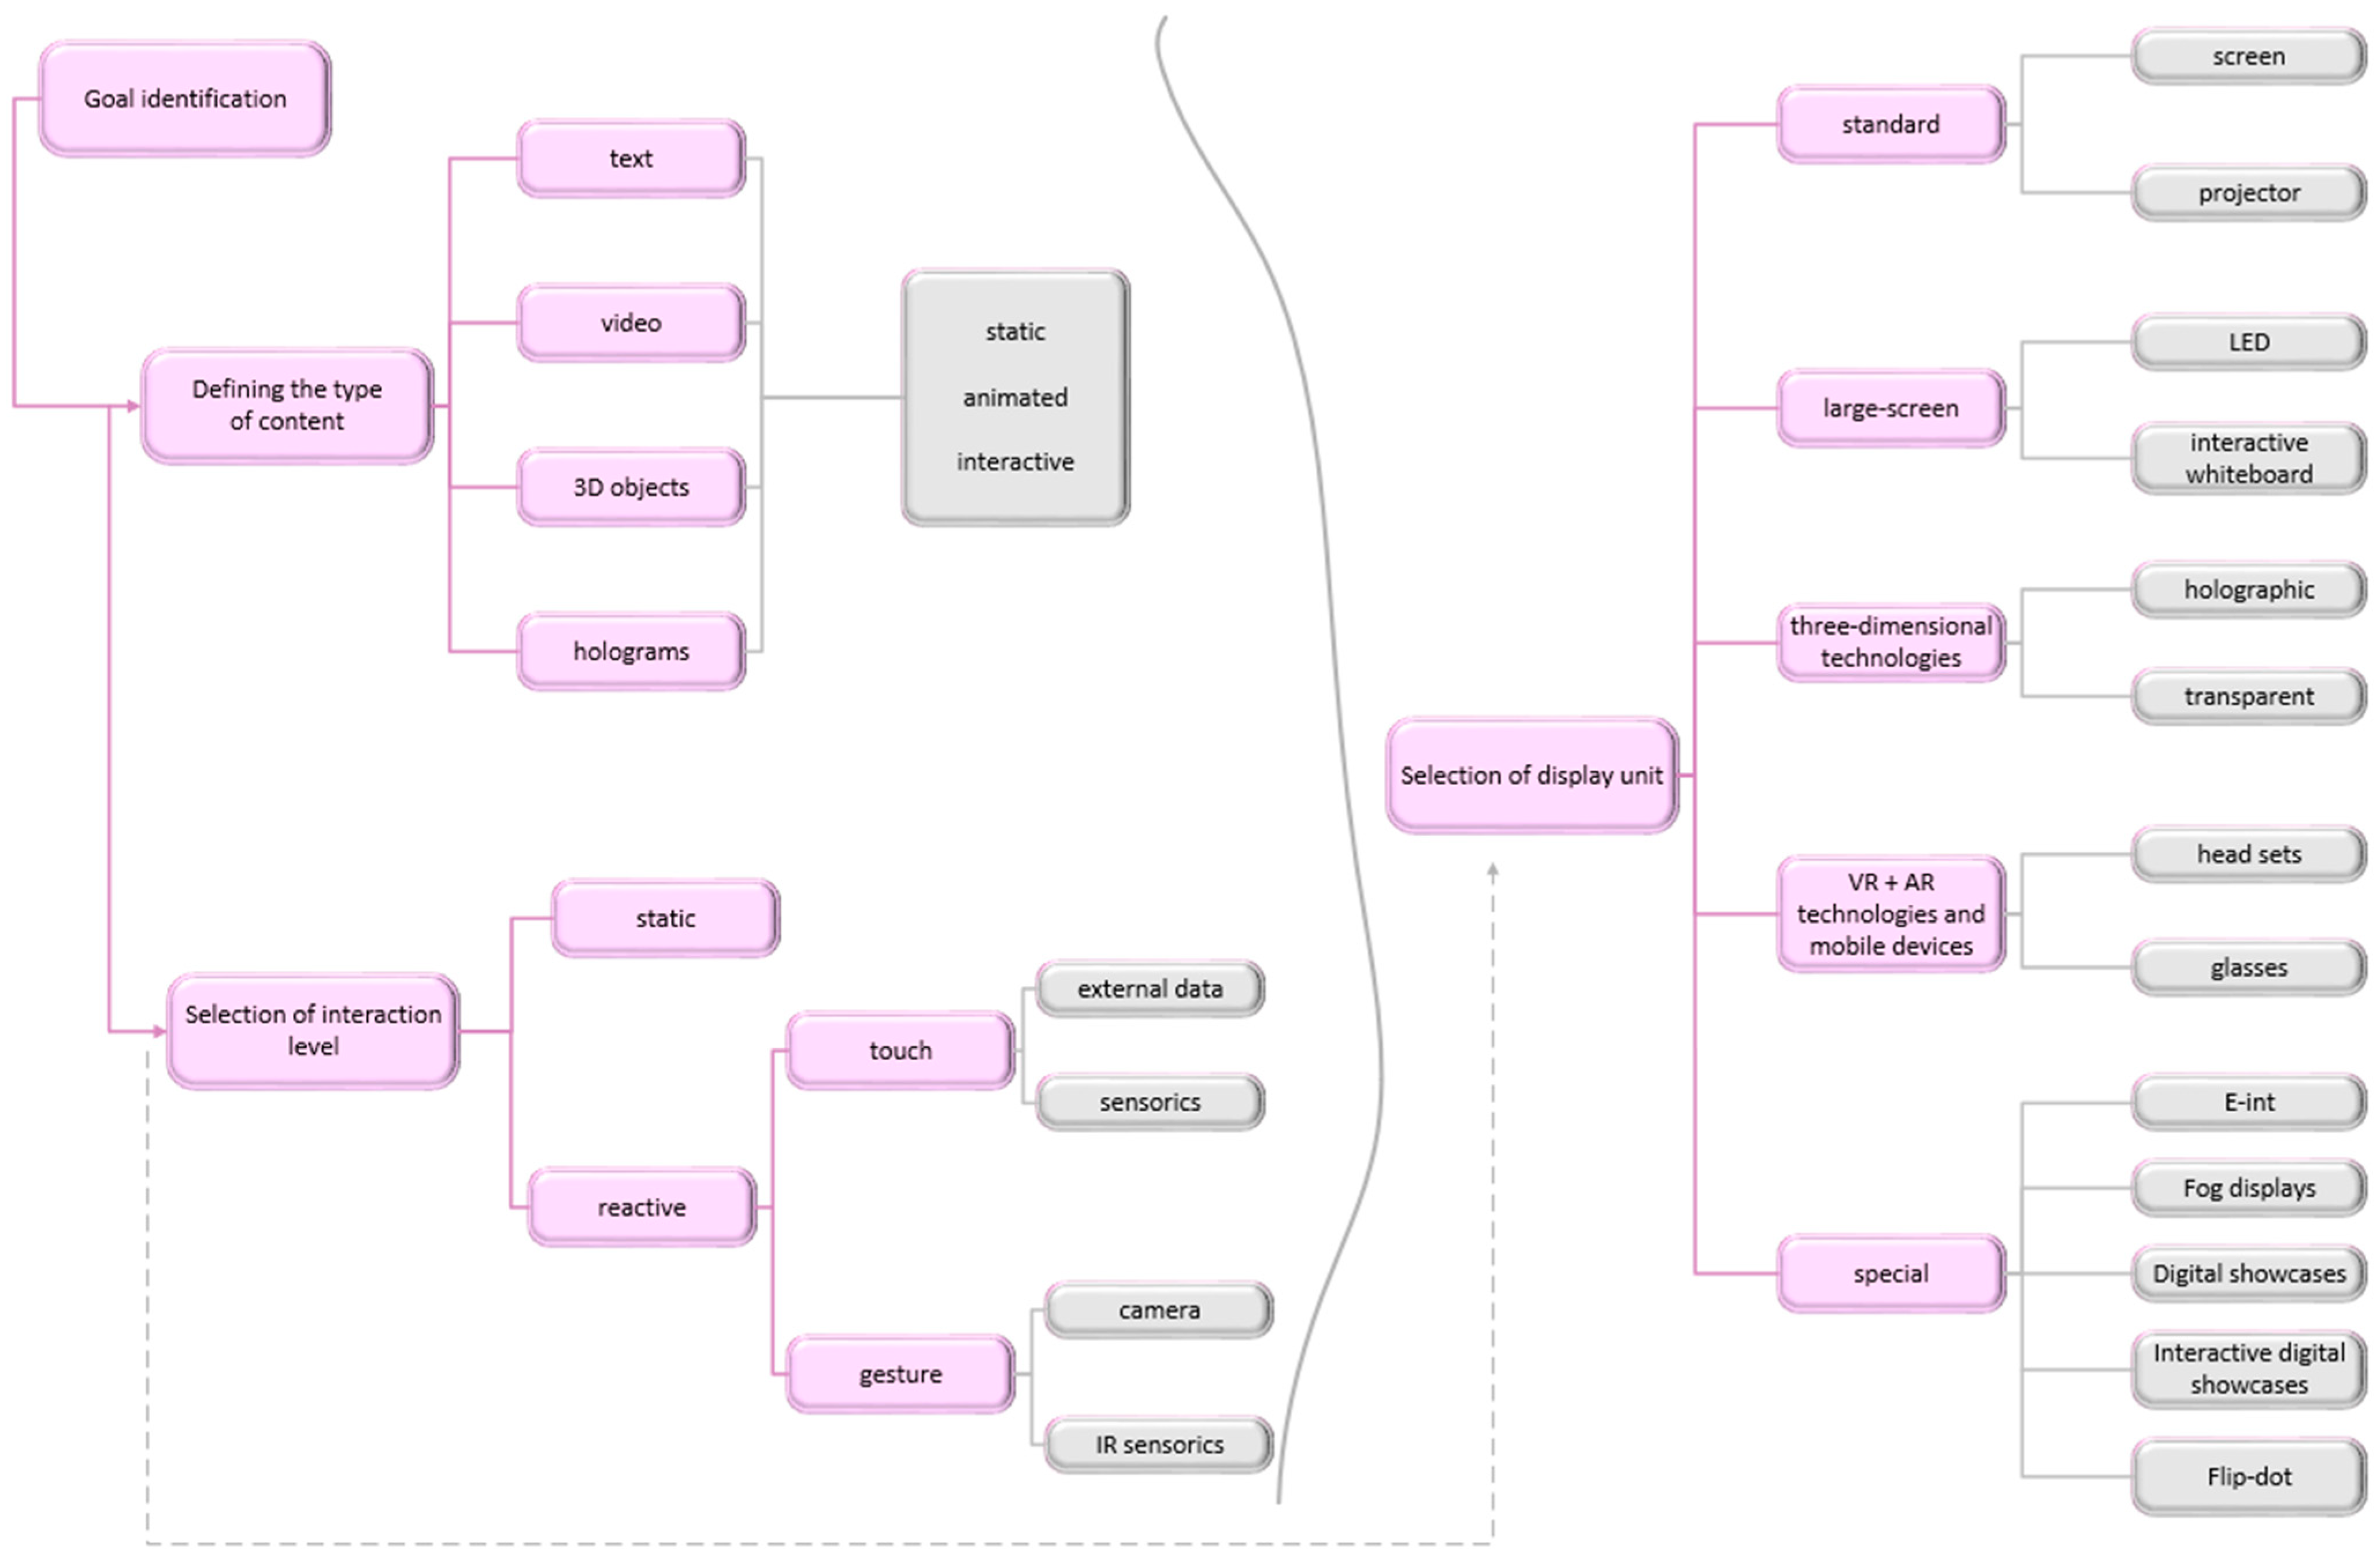
Creating content for a presentation showcase with a see-through display is a complex process that begins with determining the goal of the presentation. It is essential to clearly define what type of information the showcase will display—whether it will feature a product presentation, historical facts, technical specifications, interactive elements, or a combination of multiple content types. This decision will influence the overall visual and content concept.
The created methodology includes three primary aspects: (1) it integrates physical 3D-printed prototypes with synchronized digital animations displayed via see-through displays, offering a hybrid learning experience; (2) it presents a structured, replicable workflow from digital design through to user interface development tailored for education; and (3) it enhances student engagement and spatial understanding by aligning interactive digital visualizations with tangible models, thus addressing gaps in engineering education previously focused mainly on VR/AR or healthcare-based technologies.
Once the goal is defined, the visual concept is designed, taking into account the transparent nature of the display and its relationship with the physical environment of the showcase. Graphic elements are placed carefully in relation to the objects behind the glass, creating layering and visual depth. To achieve the desired effect, it is important to work with color contrast and the transparency of individual layers to ensure that the content remains readable while also supporting visual integration with the presented objects.
The content of the showcase is then divided into static and dynamic elements. Static elements include graphics, logos, descriptions, and visuals that remain unchanged, while dynamic elements can include animations, interactive features, and video sequences. When designing animations and moving content, it is important to consider their duration, fluidity, and how they will interact with the physical objects in the storefront. Animations should not be too fast or distracting, as this could disrupt the overall experience.
Text content must be designed to be clear and easy to read under various lighting conditions. This means choosing the right font size, contrasting background, and placing the text away from areas where it could blend in with real objects behind the display. For video sequences and animated text, special care is taken to ensure smooth transitions and synchronization with other visual elements. If the display supports interactivity, touch controls, motion sensors, or augmented reality are integrated. Interactive content must be intuitive so that visitors can easily understand how to interact with it.
After the initial stages of content design (
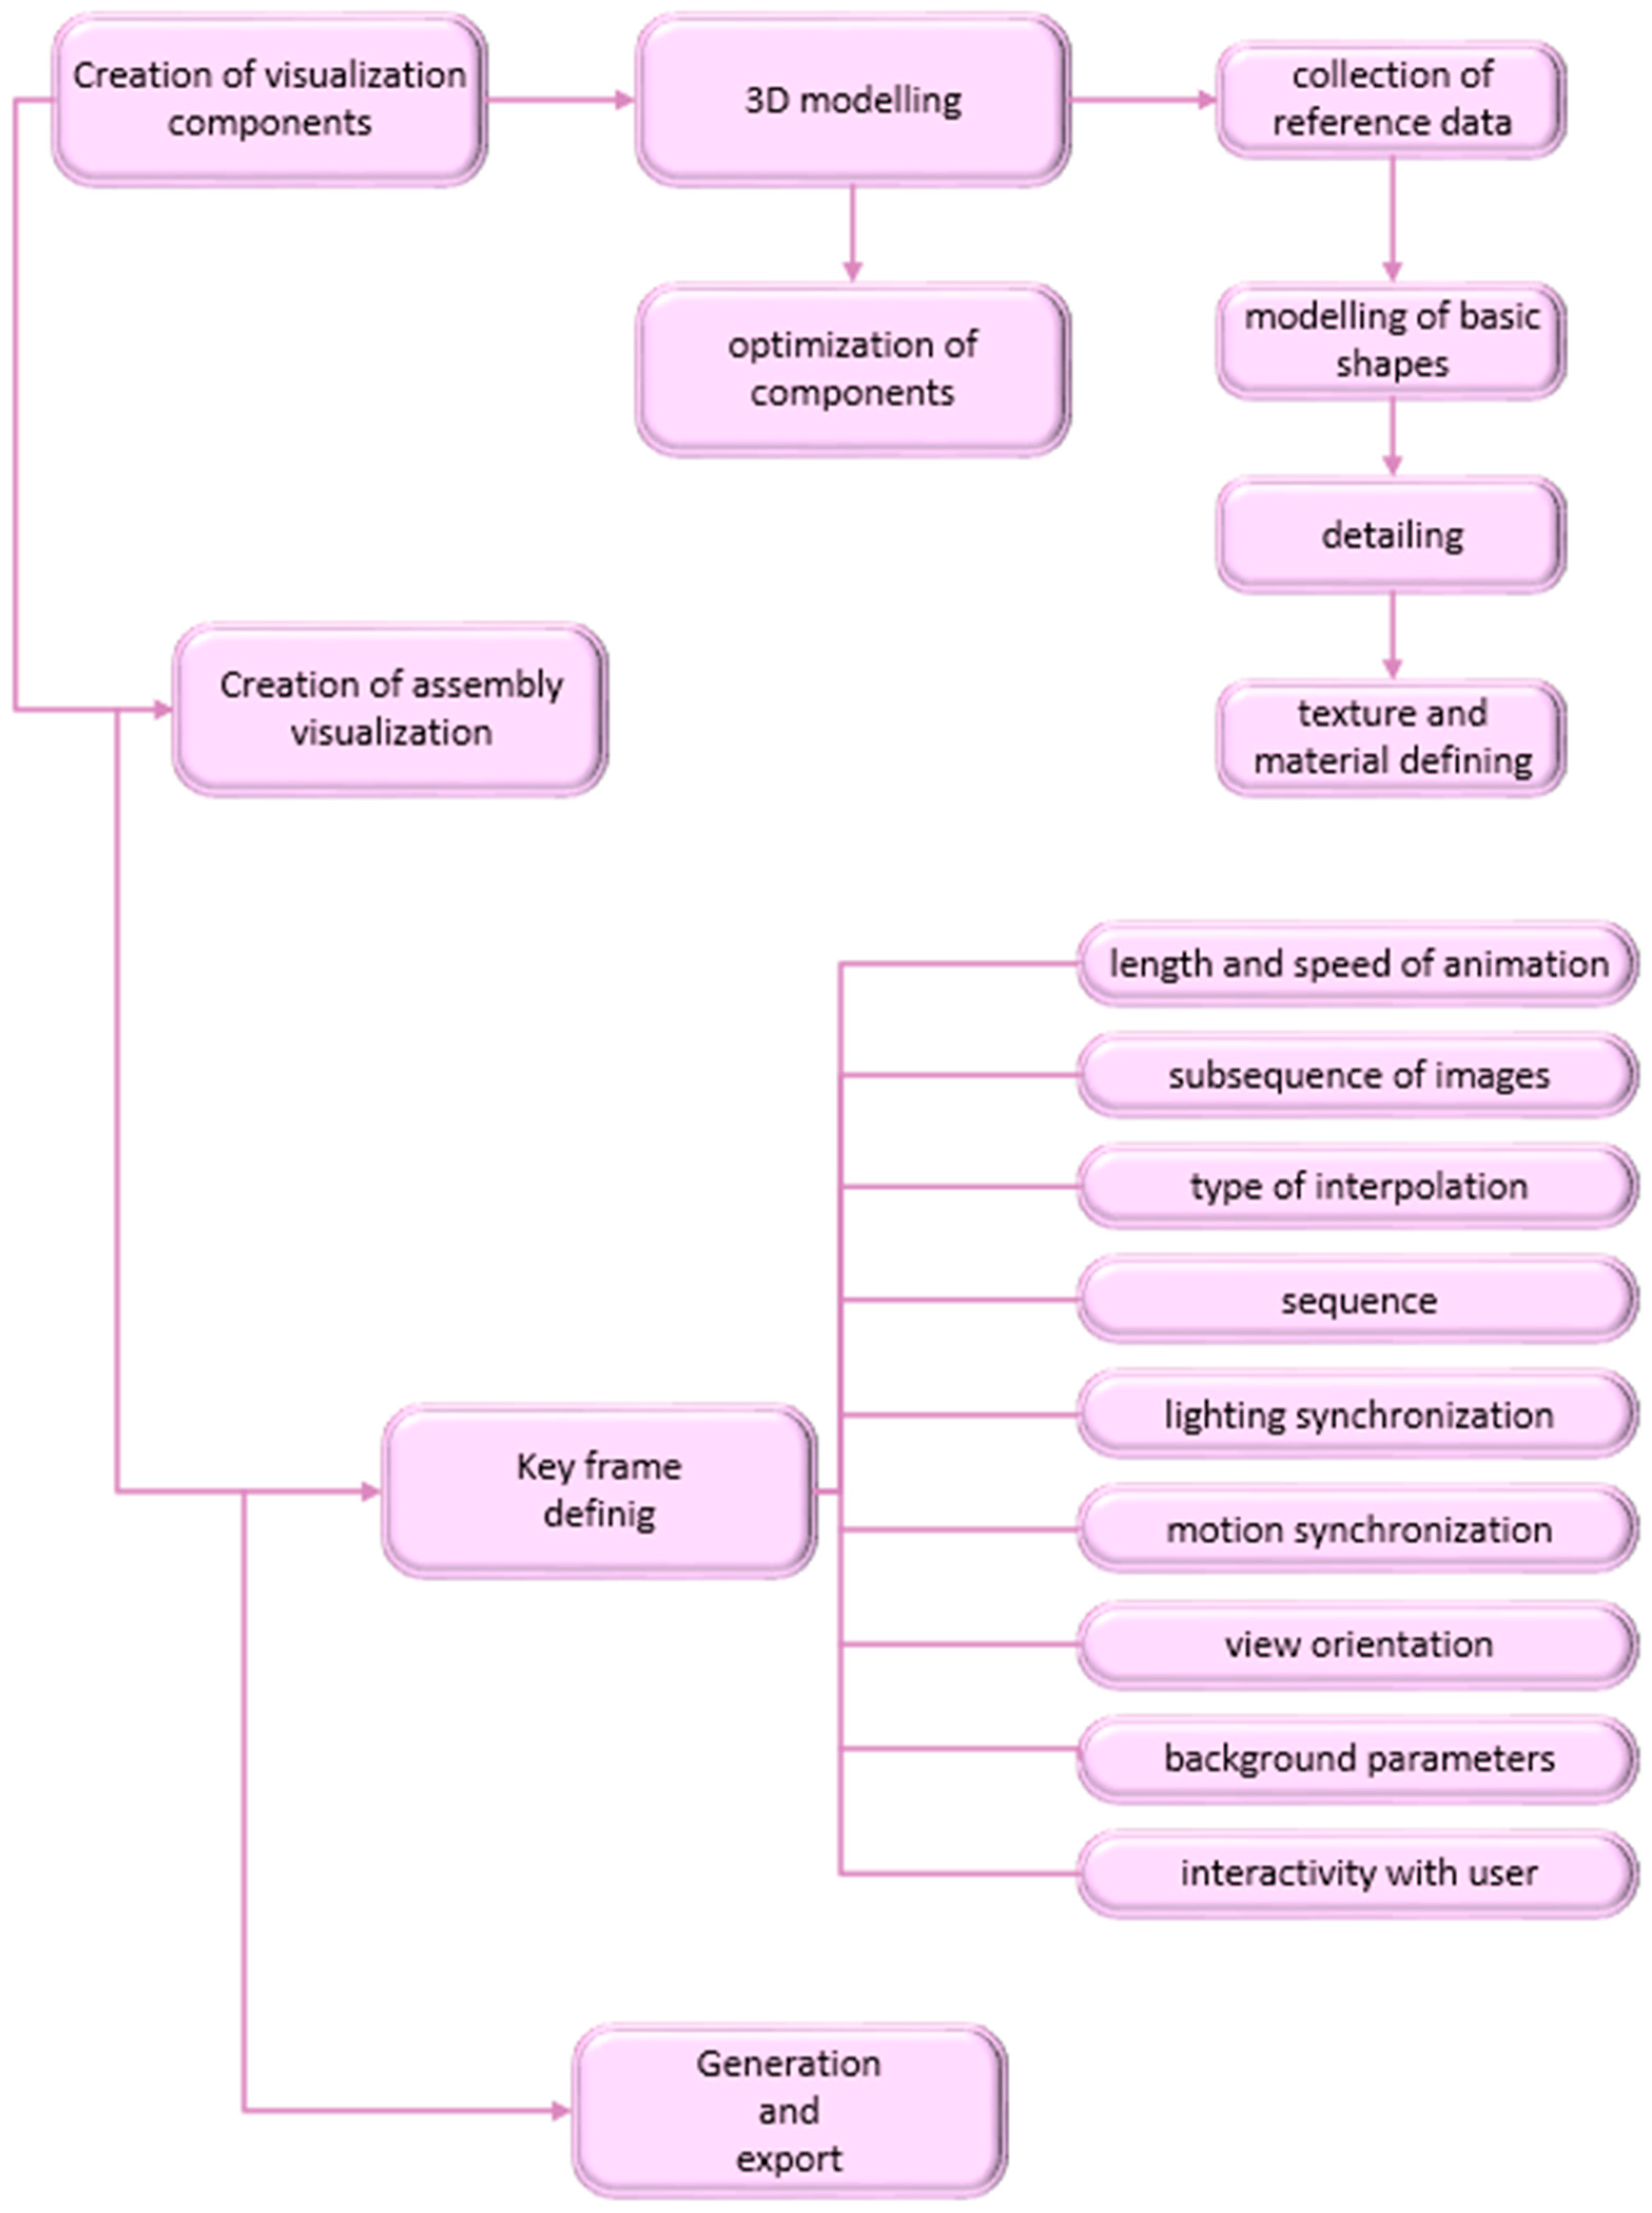
Figure 1), defining the visual concept, and preparing static and dynamic elements, the next key step is the detailed implementation and technical realization of the content in the presentation environment itself. The content generation process begins with the creation of visualization components, where the individual elements necessary for the final scene are developed. This is followed by 3D modeling, which includes collecting reference data, modeling basic shapes, adding details, and defining textures and materials while optimizing the components to improve performance and efficiency. Once the modeling phase is complete, the visualization assembly takes place, where all elements are combined into a single scene. This step involves the precise placement of objects, establishing their relationships, and creating a realistic environment using lighting and spatial effects. Great emphasis is placed on the correct layout of the composition to ensure that the resulting visualization looks natural and aesthetically pleasing. An important part of this step is also the preparation of animation, where it is determined how individual objects will move within the scene. After the assembly is complete, the key frame definition is performed, during which the length and speed of the animation, sequence of frames, interpolation type, sequences, synchronization of lighting and movement, view orientation, background parameters, and interactivity with the user are set, ensuring the desired dynamics and fluidity of the animation. Finally, the generation and export process is carried out, where the visualization is rendered in its final form and exported to the desired format, whether it is a video, interactive application, or another type of output.
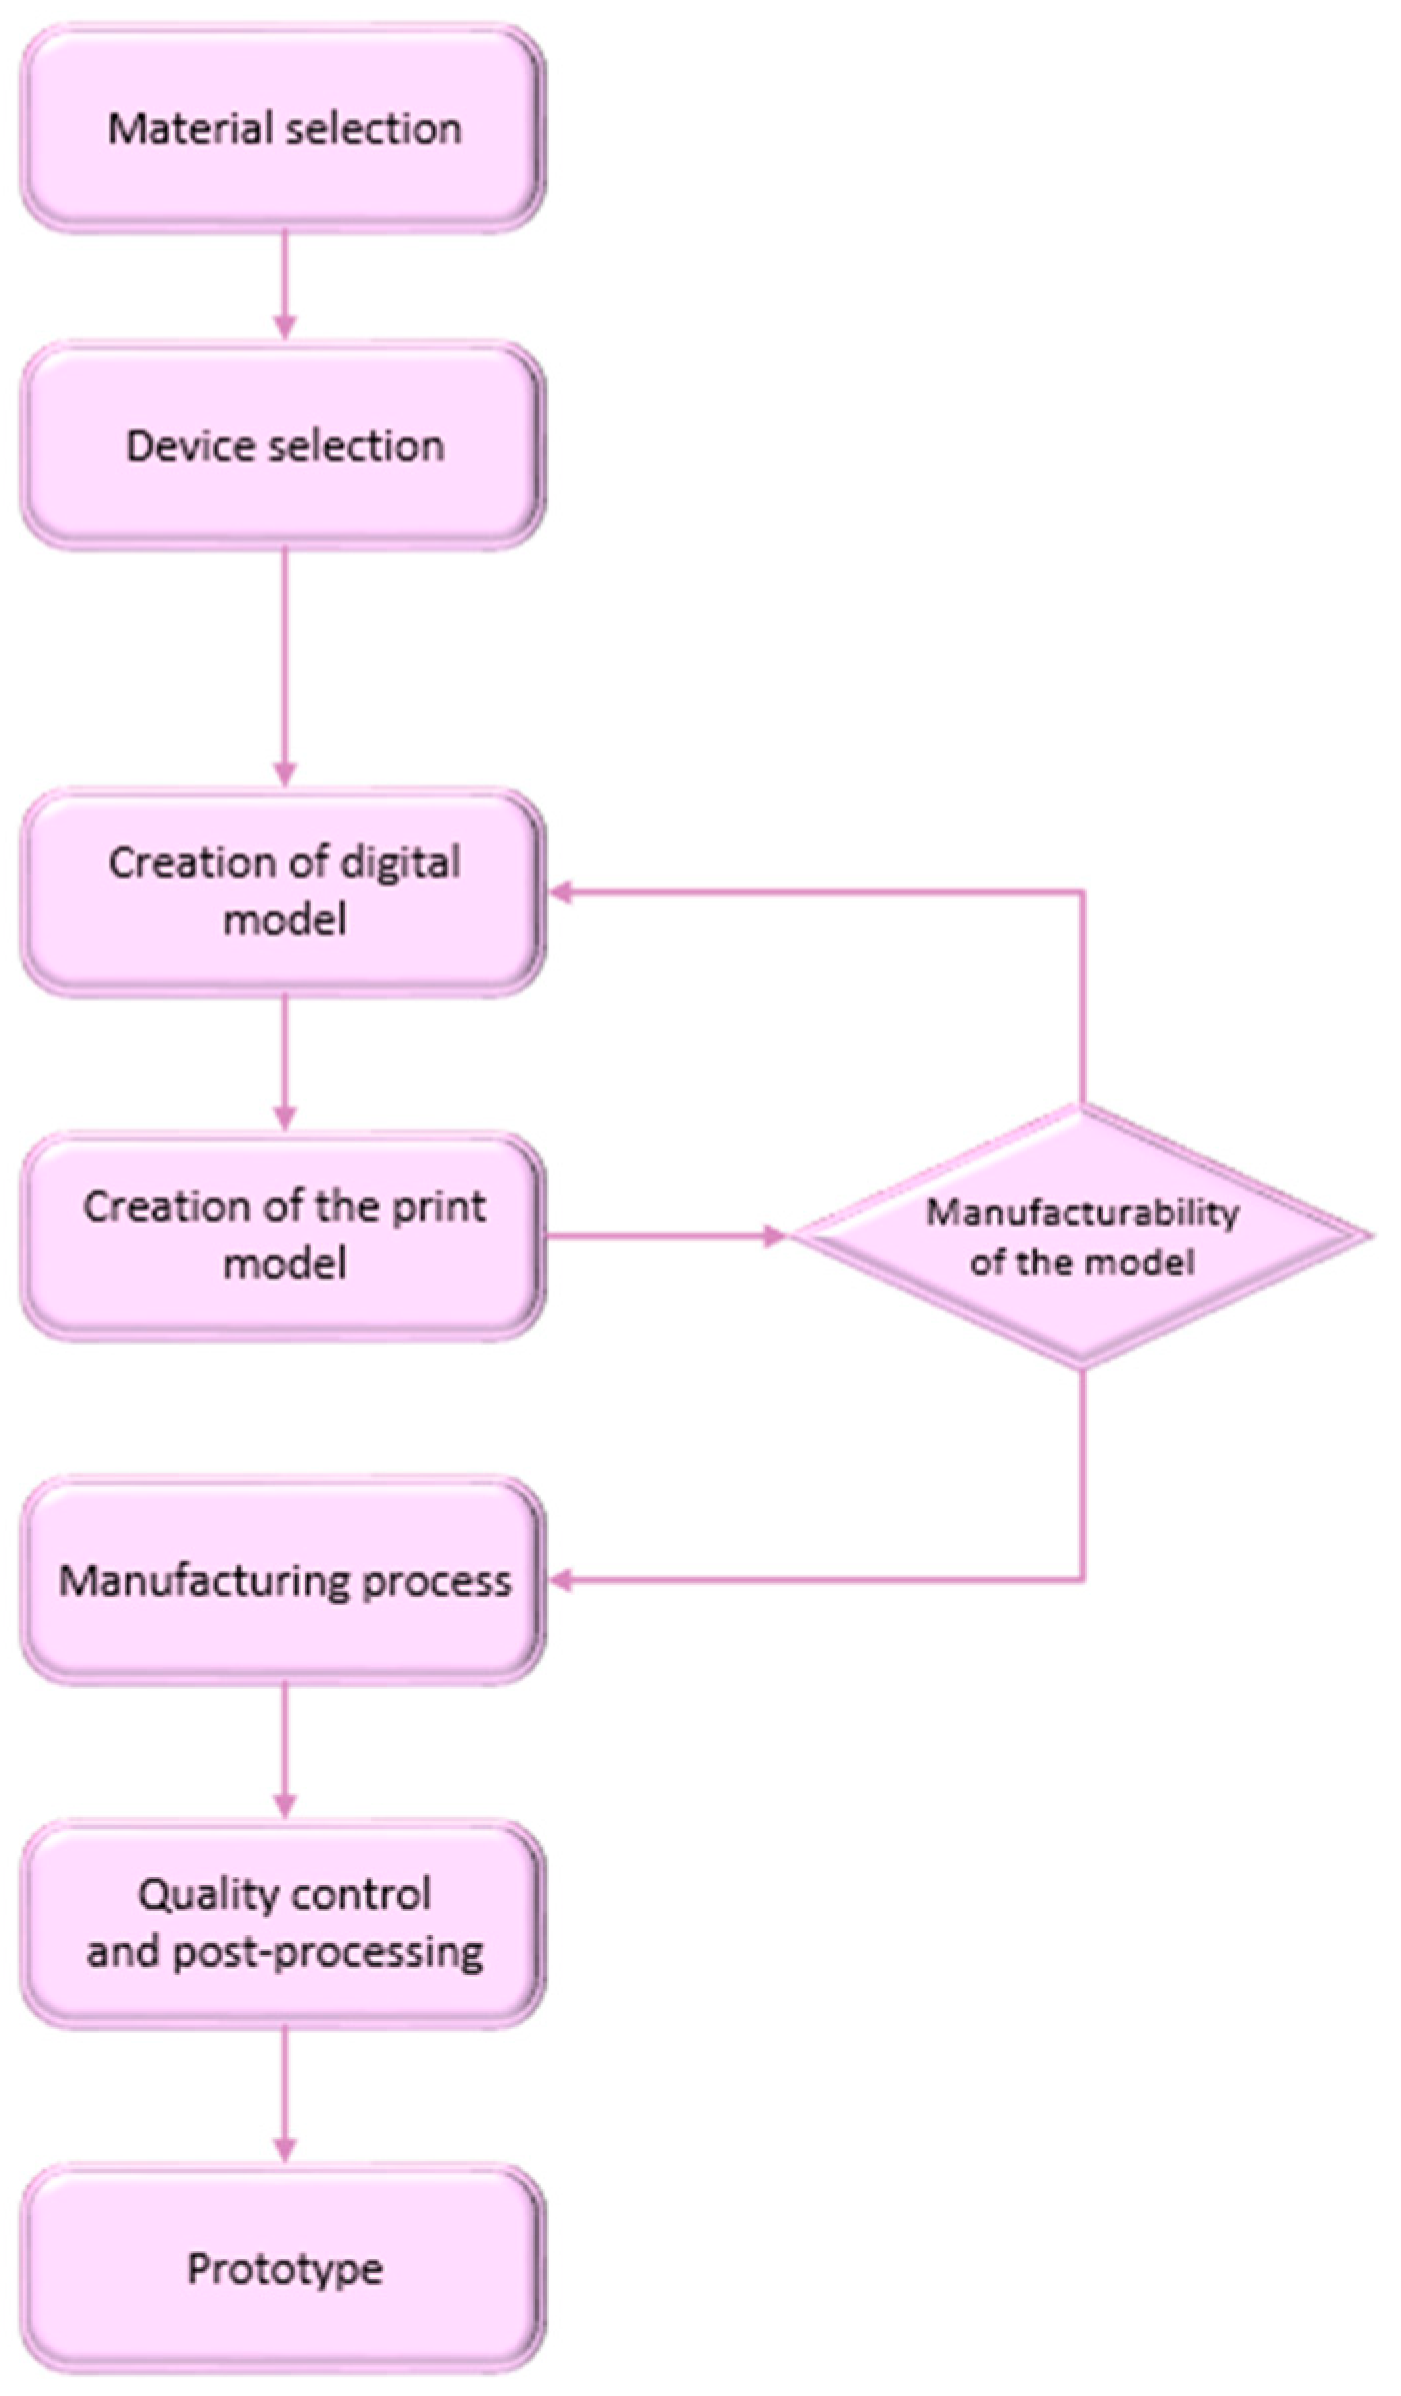
After generating and exporting to the required format (
Figure 2), the actual production of the object begins. The process of producing an object using additive technologies starts with selecting a suitable material, which affects the properties of the final product. Next, the equipment that will be used for production is selected, taking into account factors such as printing accuracy and material compatibility. In the next step, a digital model is created, which serves as the basis for designing the printing model. The manufacturability of the model is then verified with the manufacturer to ensure that the design is suitable for printing and does not contain errors. After successful verification, the production process itself begins, where the model is physically created using additive technologies, such as 3D printing. Once printing is complete, quality control and post-processing take place, where the product is cleaned, sanded, or otherwise modified to achieve the required quality. The final output of this phase is a prototype, which can be further analysed and tested.
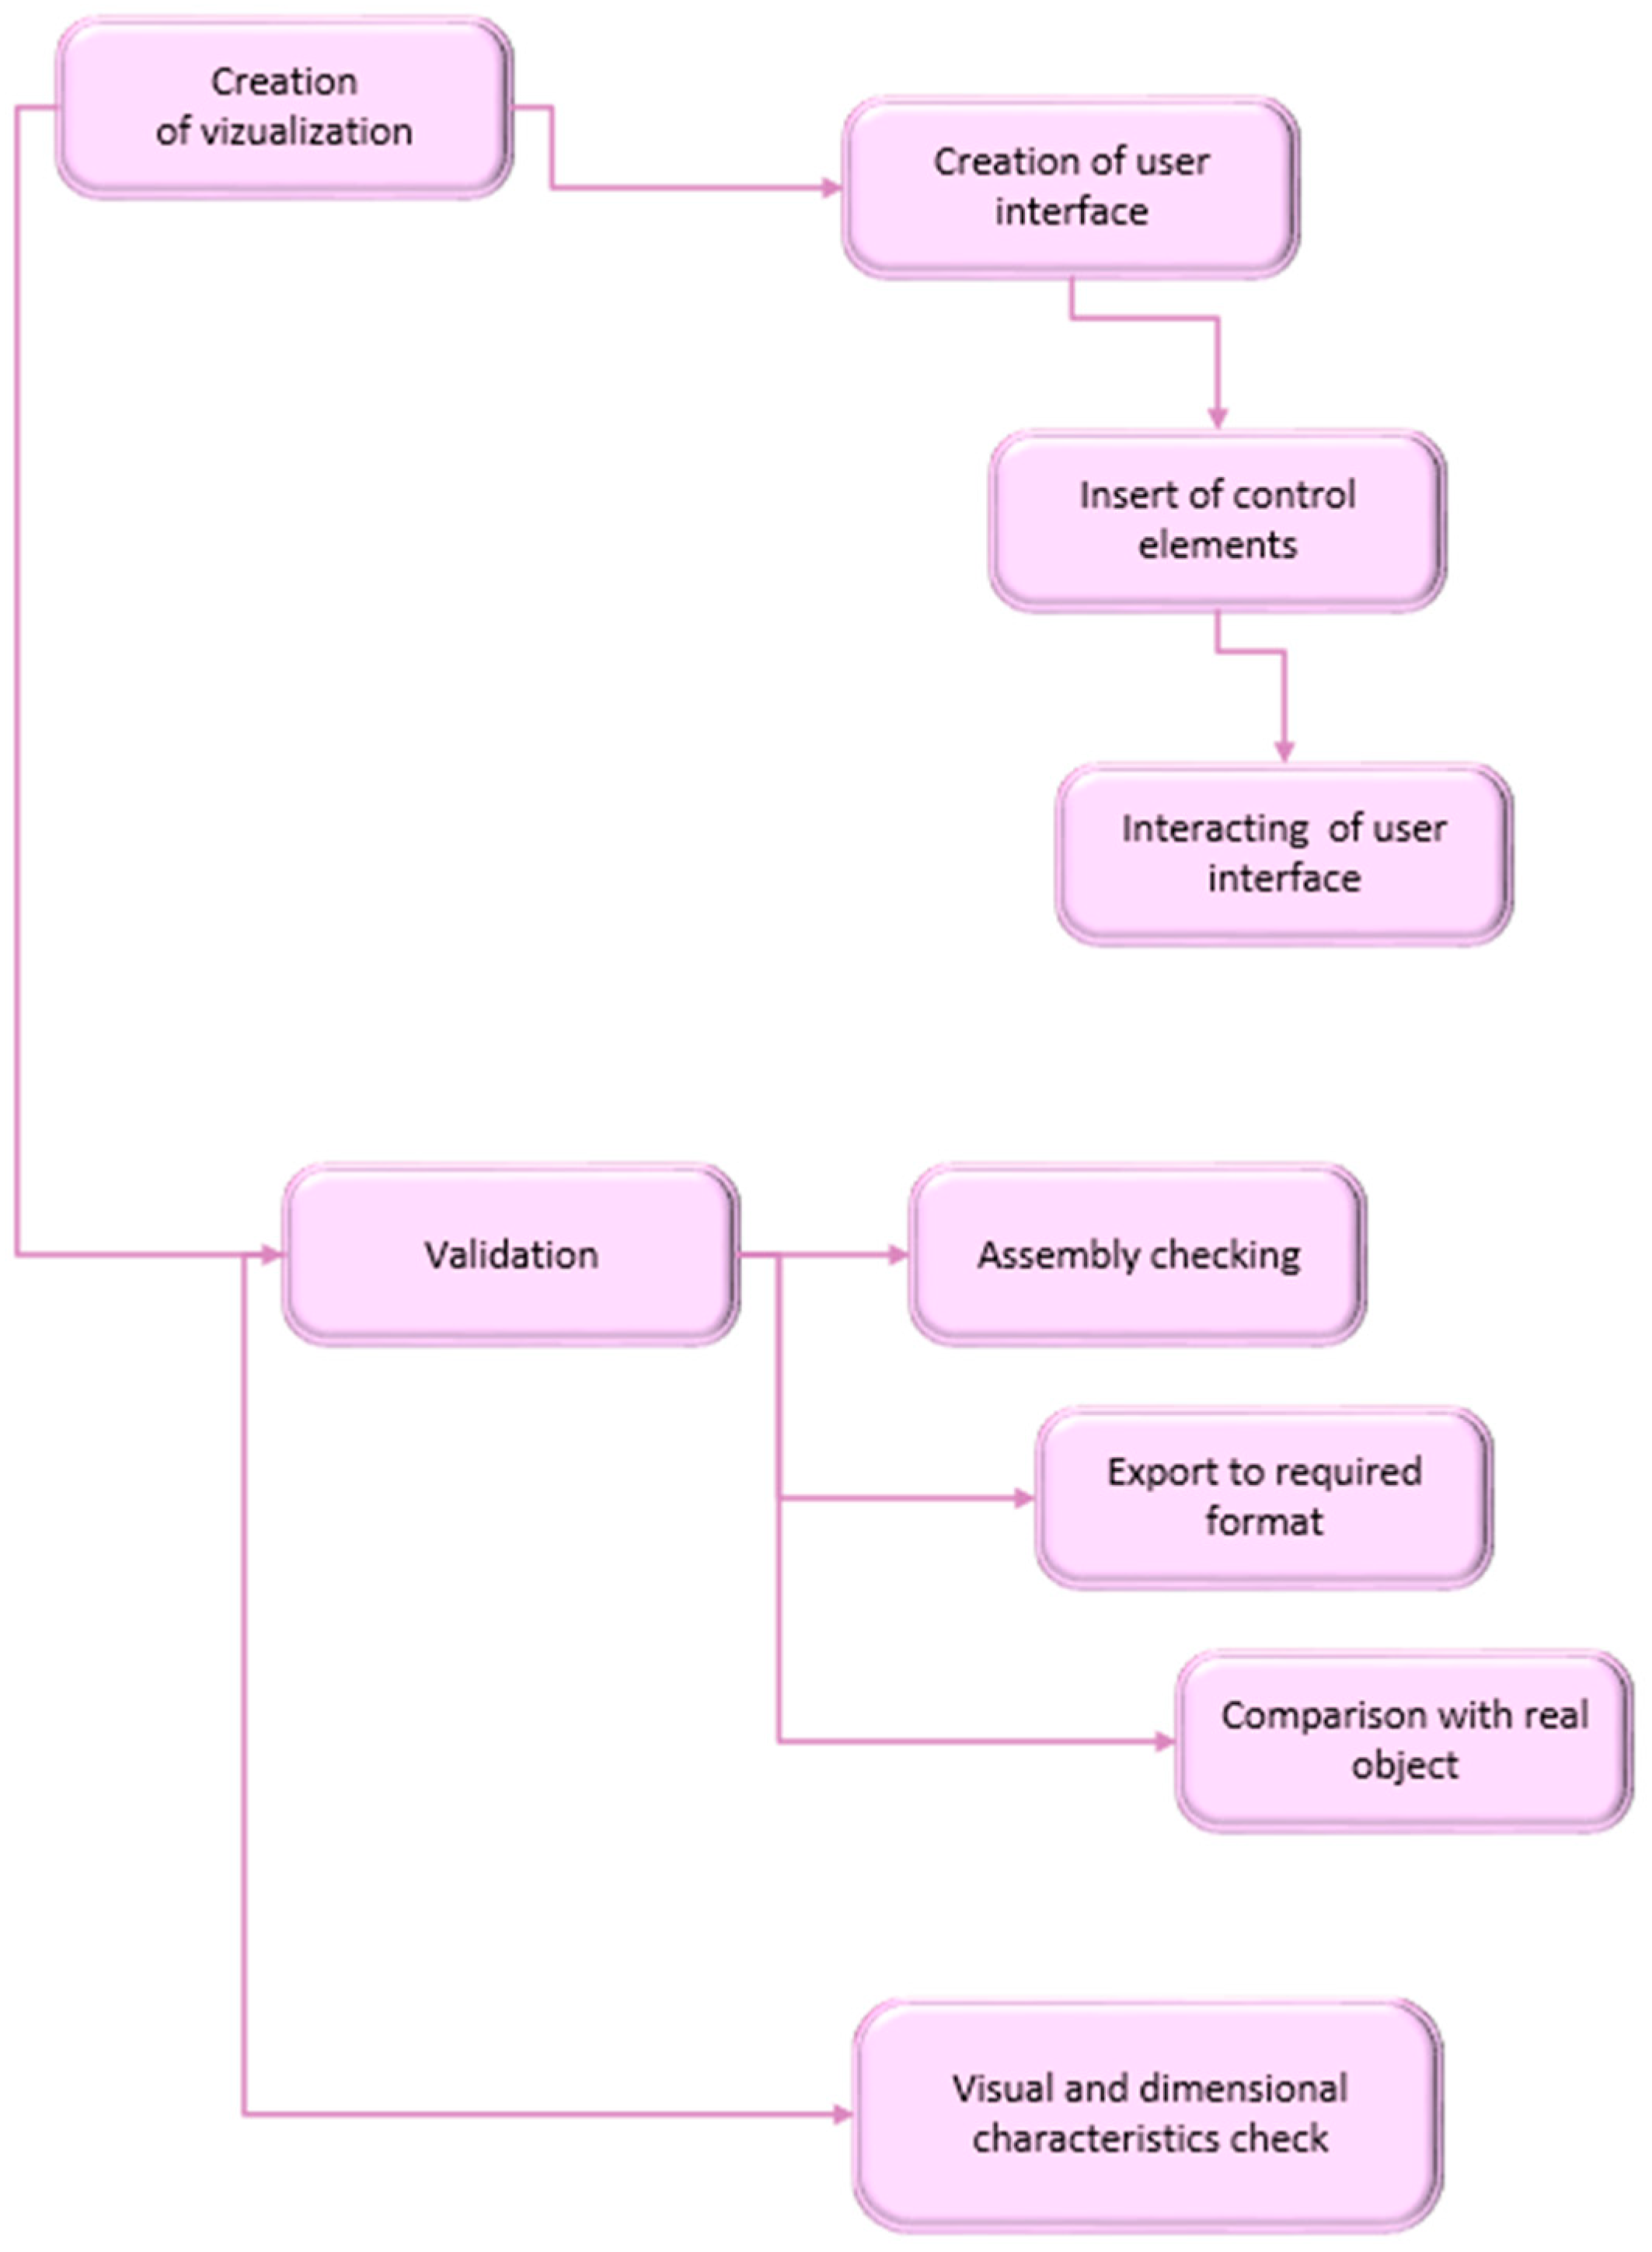
After the actual creation of the object (
Figure 3), the final phase of the sequence (
Figure 4) begins, during which the creation of the visualization and the validation process are carried out. The creation of the visualization involves a sequence in which it is necessary to ensure the development of the user interface, the insertion and adjustment of control elements, and the interaction of the user interface itself. As part of the validation, an assembly check is performed, and the model is exported to the required format for further processing. Comparison with the real object is used to verify the correspondence between the digital design and the manufactured product. Additionally, a detailed check of the visual and dimensional characteristics is carried out to ensure that the prototype meets all requirements for accuracy and quality. This process combines digital design with physical production and enables the effective implementation of complex objects with high precision. In this final phase, the correctness of the display under different lighting conditions, the smoothness of animations and interactions, and the overall synchronization of the content with the physical elements are ensured. If any deficiencies are found, the content is further refined, adjusting colors, contrasts, transparencies, or animation speeds. After successful testing, the showcase is officially deployed to its destination. In the final phase, automatic content updates are set up, and regular maintenance is scheduled to keep the presentation attractive and functional.
3. Verification of the Developed Methodology—Practical Application in Engineering Education
Based on the developed methodology, its verification was conducted in educational practice, specifically focusing on the creation of a model of a sample assembly. The generated visualizations were optimized for a specific model of the 215-TRN presentation showcase (Crystal Display Systems, Rochester, UK), which is available at the authors’ workplace. The creation of the assembly and components for generating the visualization and 3D printing of the model was carried out in the PTC Creo program (Version 9.0.6.0, PTC, Boston, MA, USA). The generated visualizations can be displayed by multiple media players, and the components are opened in the 3D Builder application. The program itself was created in the C# programming language in the SharpDevelop 5.1.0 console environment.
3.1. Defining Basic Requirements
In accordance with the literature review and the identified research gap, the goal was set to implement an educational presentation for the field of mechanical engineering using a special display unit, a see-through display, the technical specifications of which are provided in
Table 1.
Since the selected presentation showcase allows for the customization of the visualized content in real time, the practical implementation focuses on creating a program with a clear user interface that enables real-time interaction. The observer will become the user, as they will be able to influence or select from the menu what data should be displayed. The showcase is adaptable for a wide range of applications, as various types of objects can be presented in it. The user interface features easy installation and control, making it suitable for use in the educational process. The presentation showcase model, for which the interface is optimized, also includes a remote control for adjusting system settings and display parameters, such as volume control, input selection, display image mode, lighting intensity in the presentation space, and more. In line with the intention of this article, an educational visualization for a 3D object with a touch-level of interaction, implemented in an interactive exhibition showcase, will be created.
3.2. Content Generation
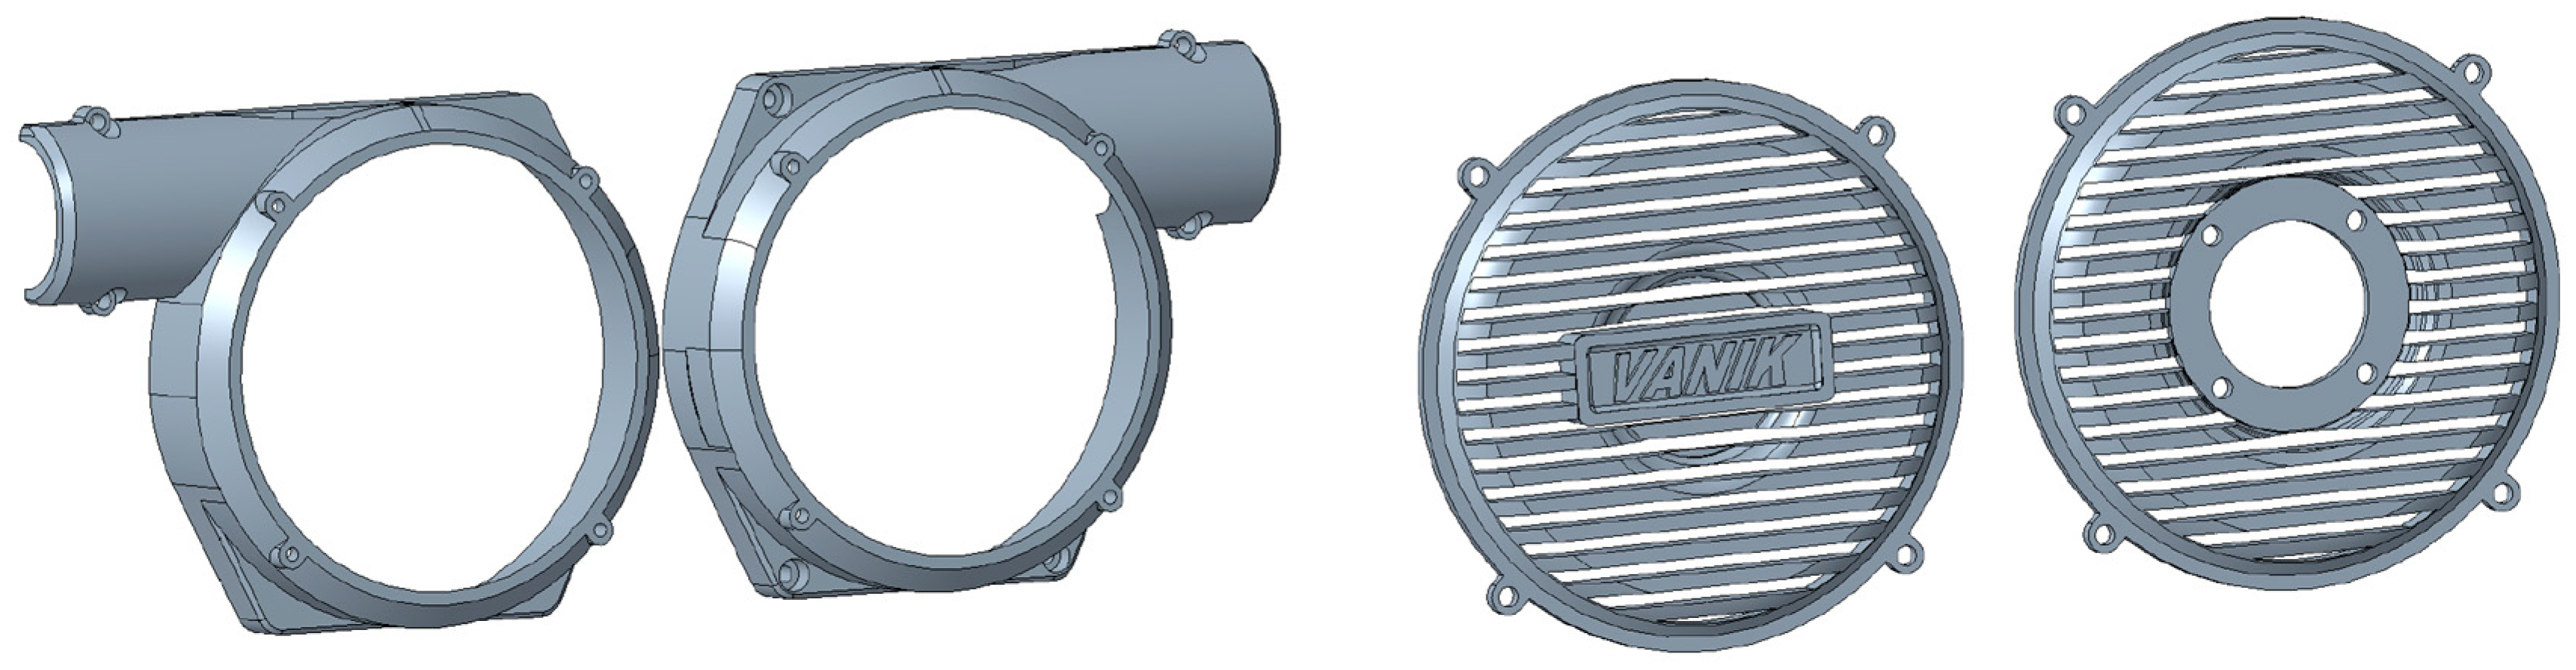
In the first step, in accordance with the proposed methodology, it is necessary to create the individual visualization components. These components were revised and optimized several times during the process of creating the presentation object to ensure the creation of a fully functional real model. The body and cover were modeled first, with the modeling of the “body” component divided into two parts—front and rear (
Figure 5). The rear part was modified as a mirror image of the front part. The modification of the rear part involved removing the countersunk holes for screws. Additionally, four holes were created around the perimeter of both components to attach the front and rear covers to the body. The parts of the second component, the cover, were created similarly. The cover had a single base, from which both parts were created through modification. Holes were created around the perimeter at the same spacing as on the previous component, ensuring the cover could be attached to the body part. In the inner part of the rear cover, a seating surface and holes for a solid connection of the electric motor housing to the cover were made.
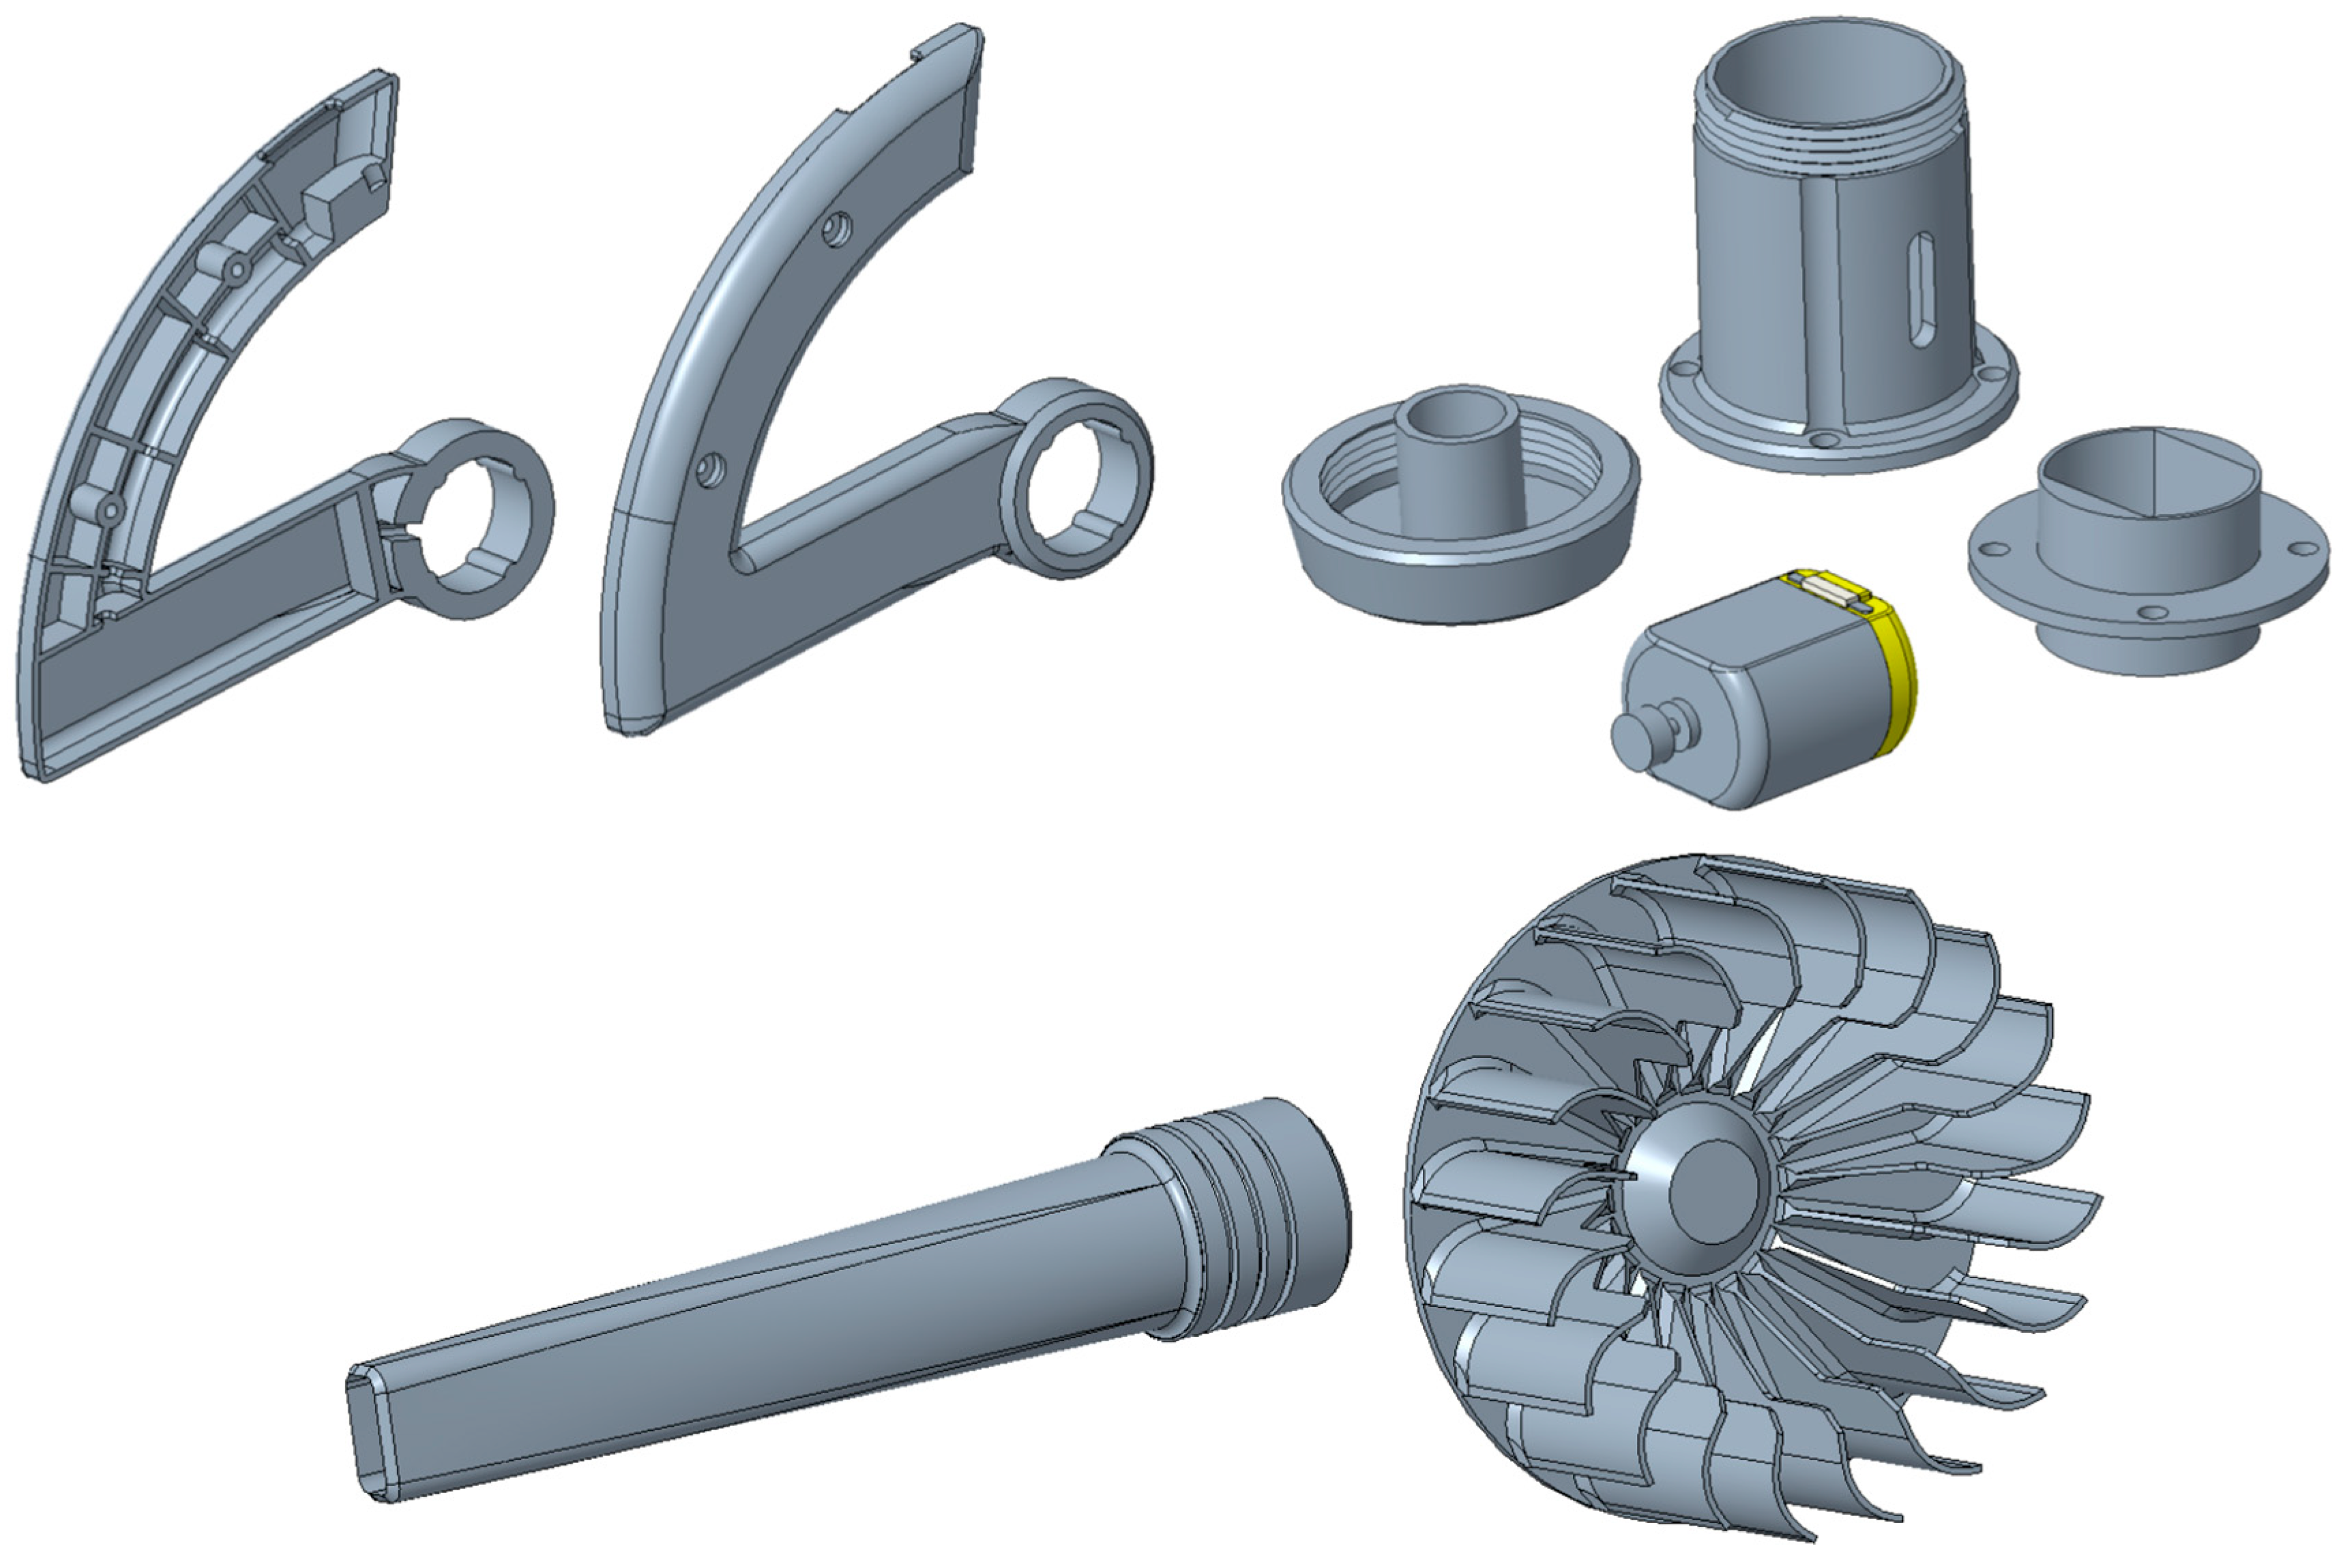
Other parts of the object were created in a similar way—the handle, tube, turbine, and parts of the engine assembly (
Figure 6).
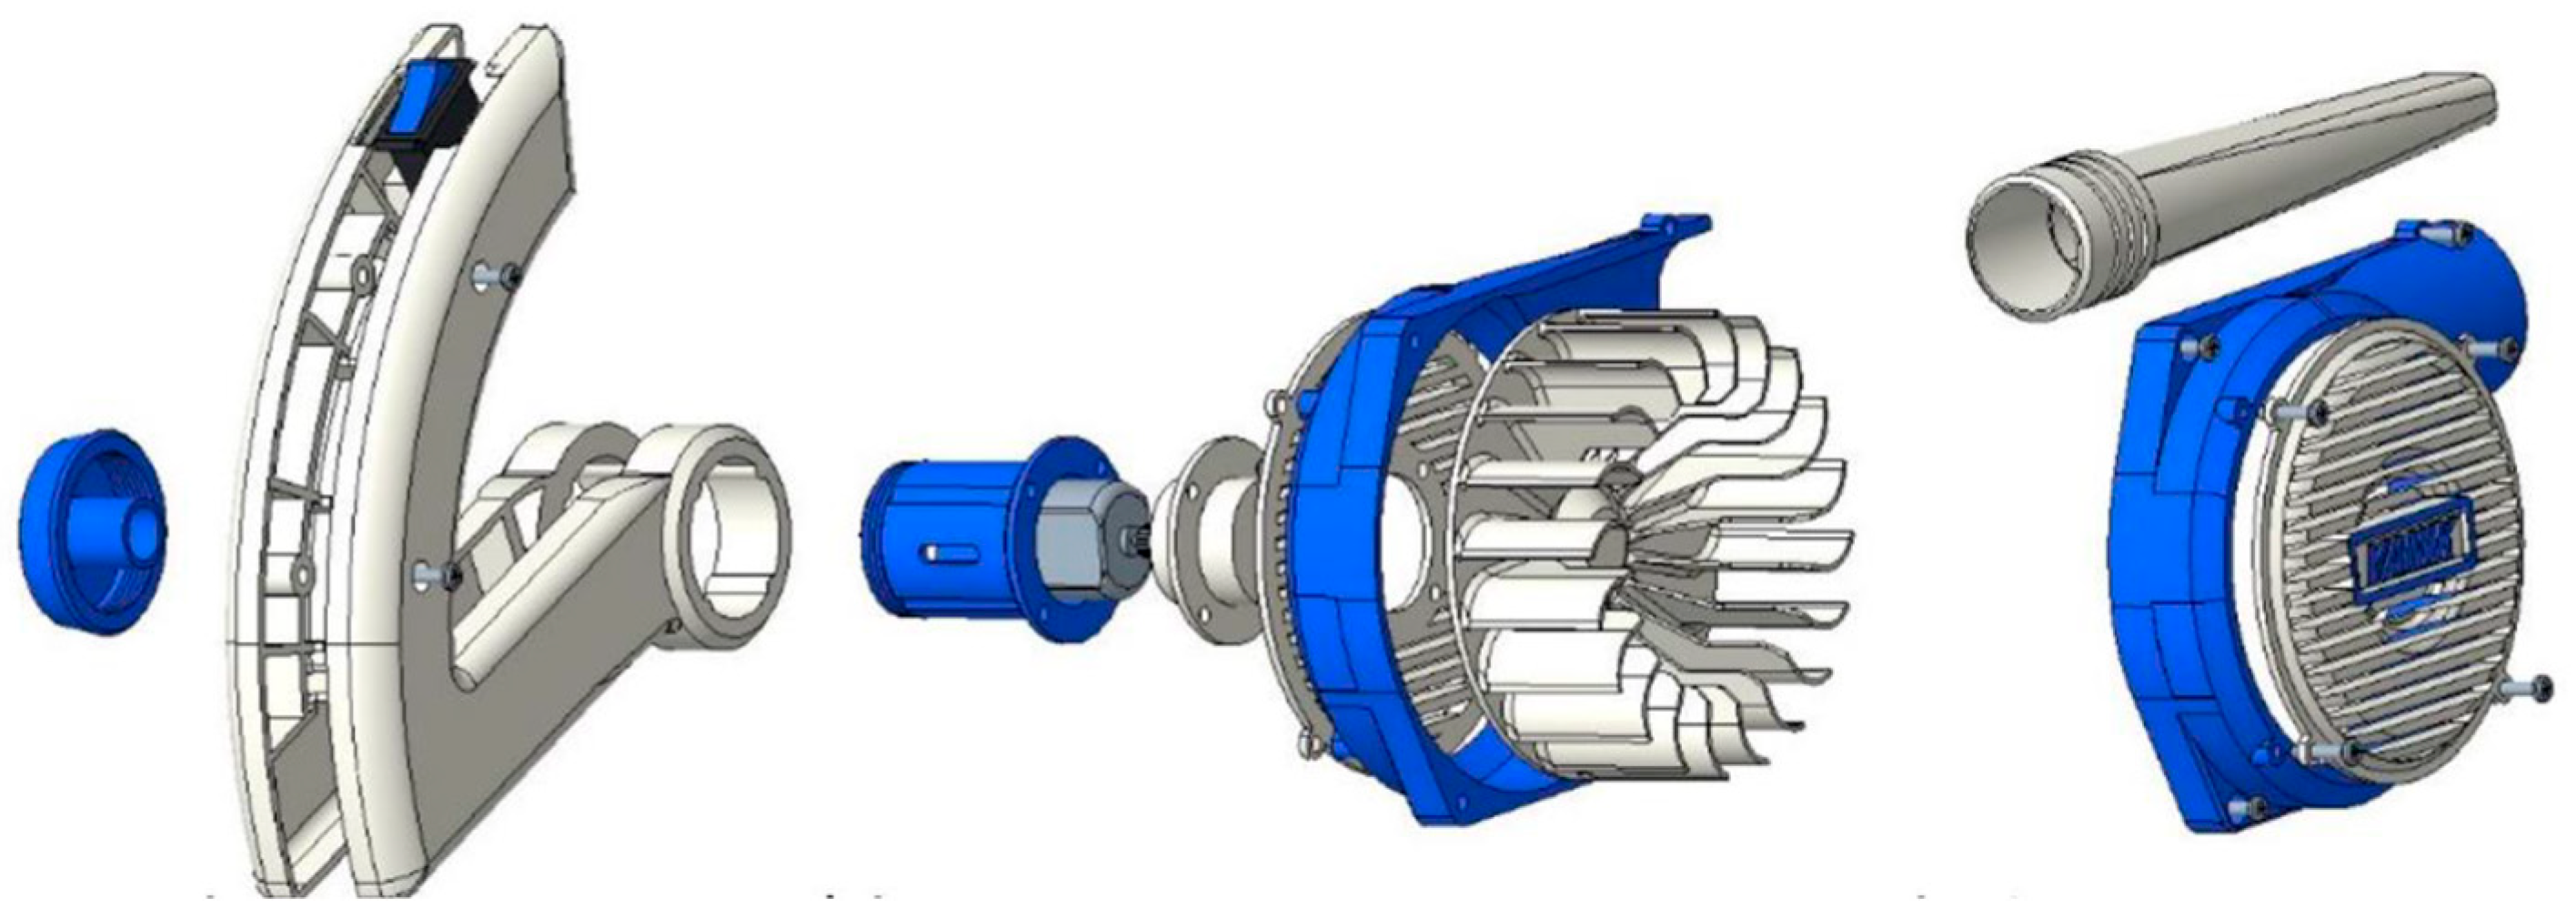
In accordance with the created sequence, the next step is to create an assembly for generating visualizations (
Figure 7). To create the assembly, all CAD models that were assembled in the previous phase and converted into the necessary subassemblies were used. These subassemblies are tightly connected, and for better clarity when creating animations, they were consolidated into a single component.
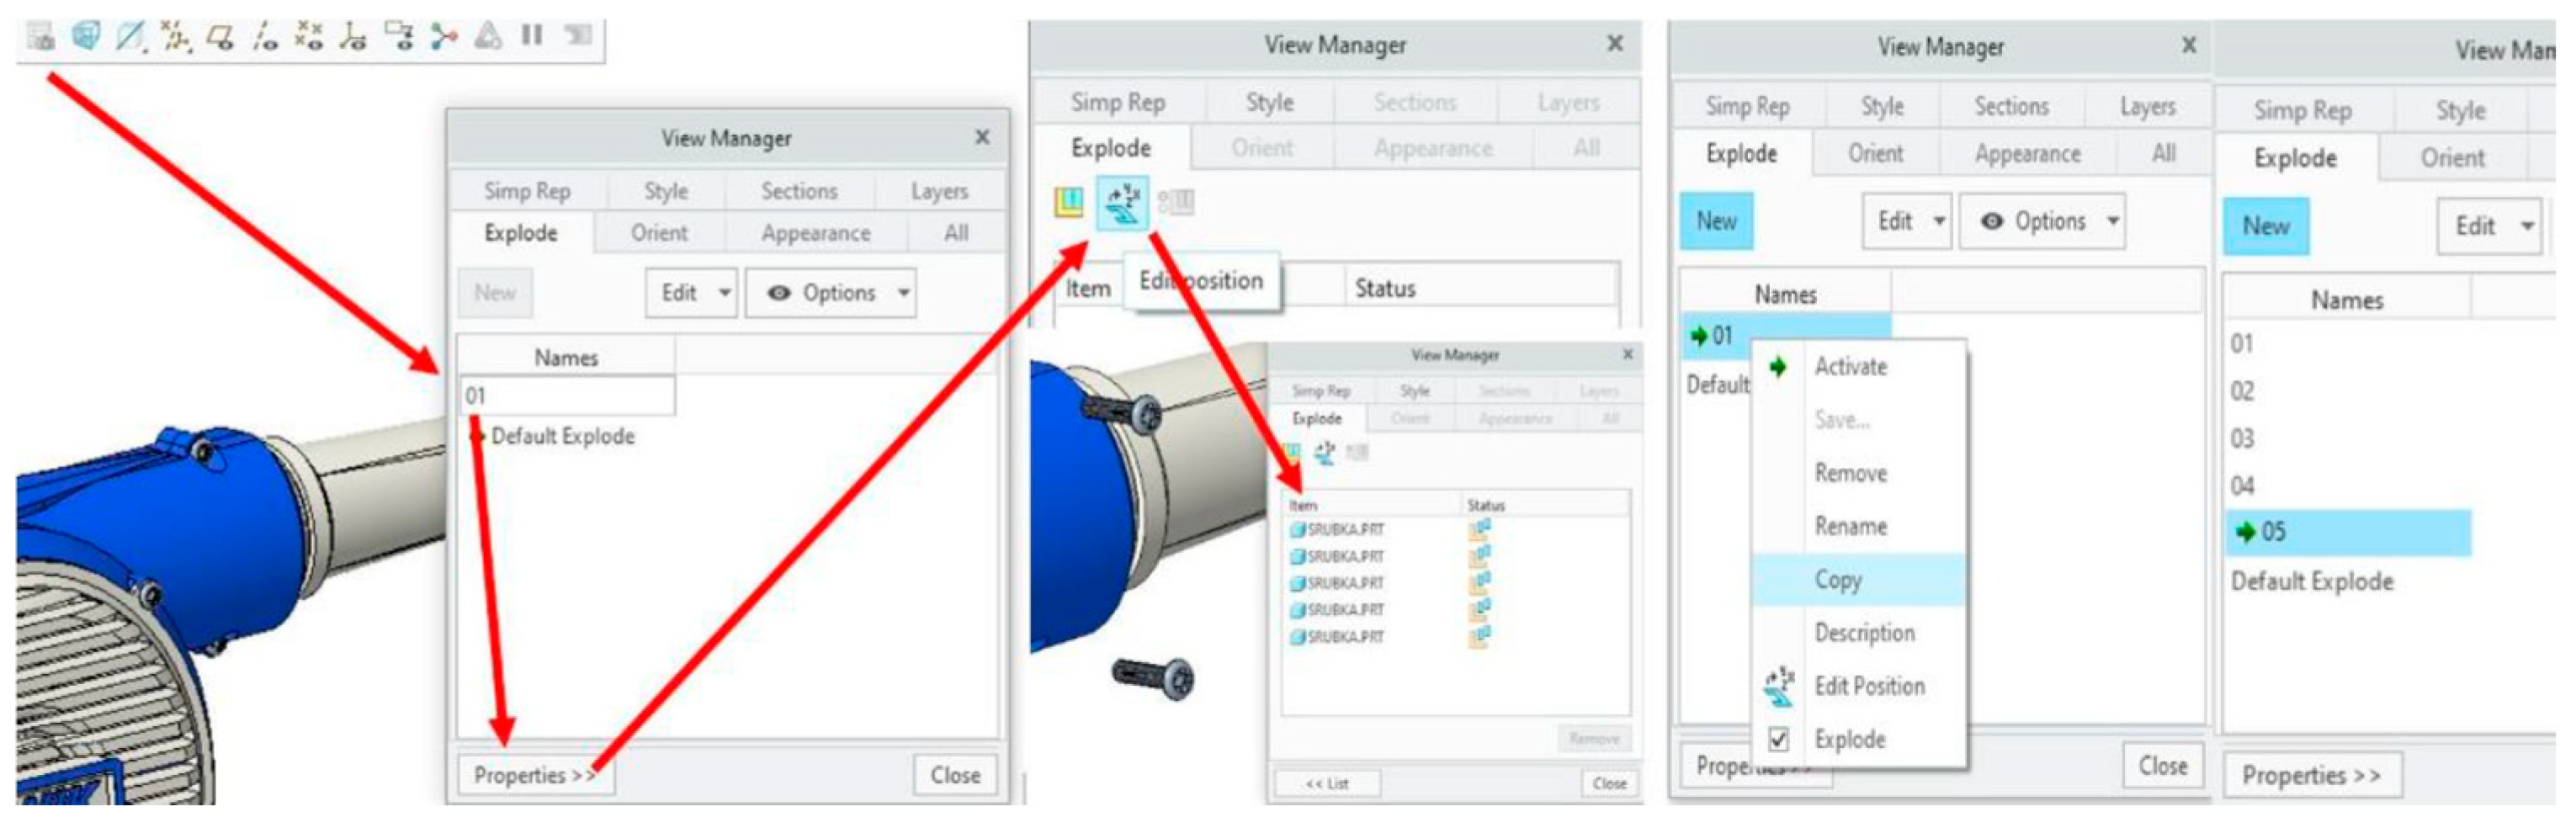
The parts of the final assembly of the object, assembled in accordance with the created sequence, were forwarded to the View Manager for the creation of the Key Frame (
Figure 8). The Key Frame stores information about how the individual components are oriented and spaced relative to each other. These data can be edited at any time for a specific Key Frame using the “edit position” option. If position editing is enabled, after selecting one or more components, it is possible to move, rotate, and shift them as needed along the x, y, and z axes. Once the component is placed in the desired position, the Key Frame is saved. The View Manager displays a list of components that were edited in the given Key Frame. A copy of the Key Frame is then created with a different numerical name, such as 01, 02, etc. The created copy contains all the changes made so far. Reactivating it will make the position editing option available, allowing you to move other components. The sequence of steps is repeated until the entire assembly is decomposed into individual components.
Before starting to create a new animation, it is checked whether all the components that make up the assembly for generating the visualization have been added to the current assembly. Then, you need to go to the Applications category, located at the top of the menu. The available modules will be displayed, including the Animation module, which is necessary for creating visualizations. In this module, individual pre-created frames are added via the Key Frame Sequence (
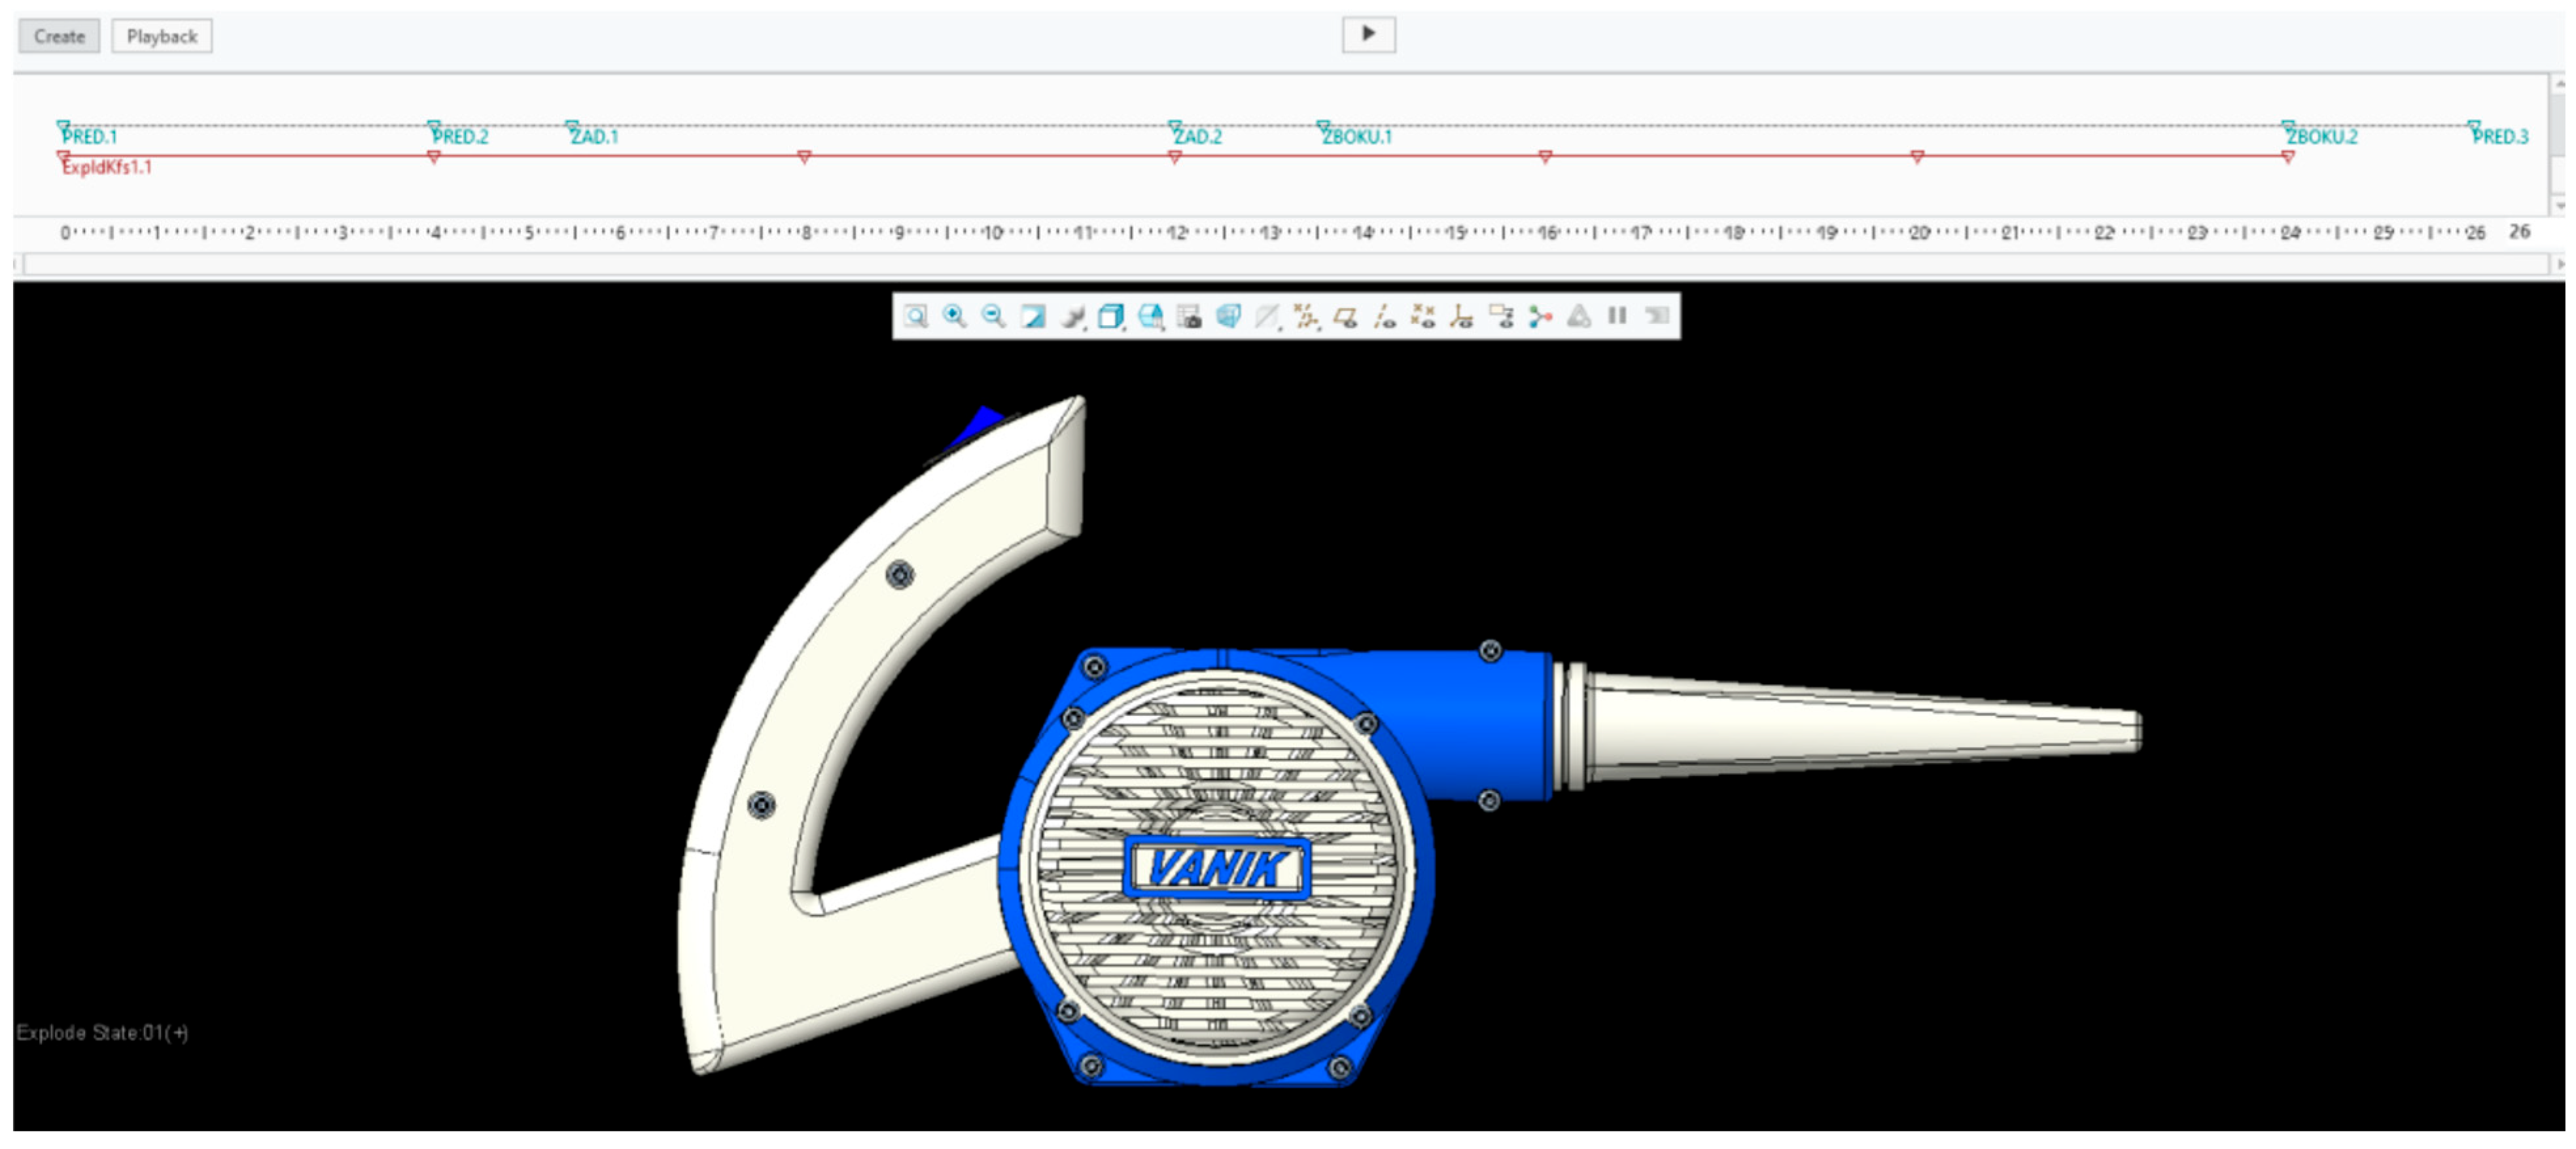
Figure 9). The arrangement occurs in the reverse order in which the components were created. The next step is to define how long it will take to change the position of the assembly between the current and the next frame. This will predetermine the minimum duration of the animation. The duration of the visualization can be manually extended as needed.
In this way, an animation with a single static camera view is created, which is not sufficient for presentation purposes. It is required that the visualization include detailed views from different angles of the components that are being attached to the assembly at that moment. It is also required that, at the end of the animation, the view of the assembly corresponds to the perspective of a person looking at the physical model of the presented object inside the presentation showcase.
The creation of the necessary views for detailed shots is ensured through the View Manager tab > Orient > New. This way, a new view is created that corresponds to the current camera view of the model. When creating the views, the requirements were considered to ensure that the size of the model in the animation closely matched the actual size of the model stored inside the showcase. This involved not only the correct orientation of the views but also the hypothetical distance of the camera from the model to ensure that the presented object in the animation was neither overly large nor insufficiently visible (
Figure 10). The saved camera views were then added to the timeline. This step creates the dynamic camera movement in the generated visualization.
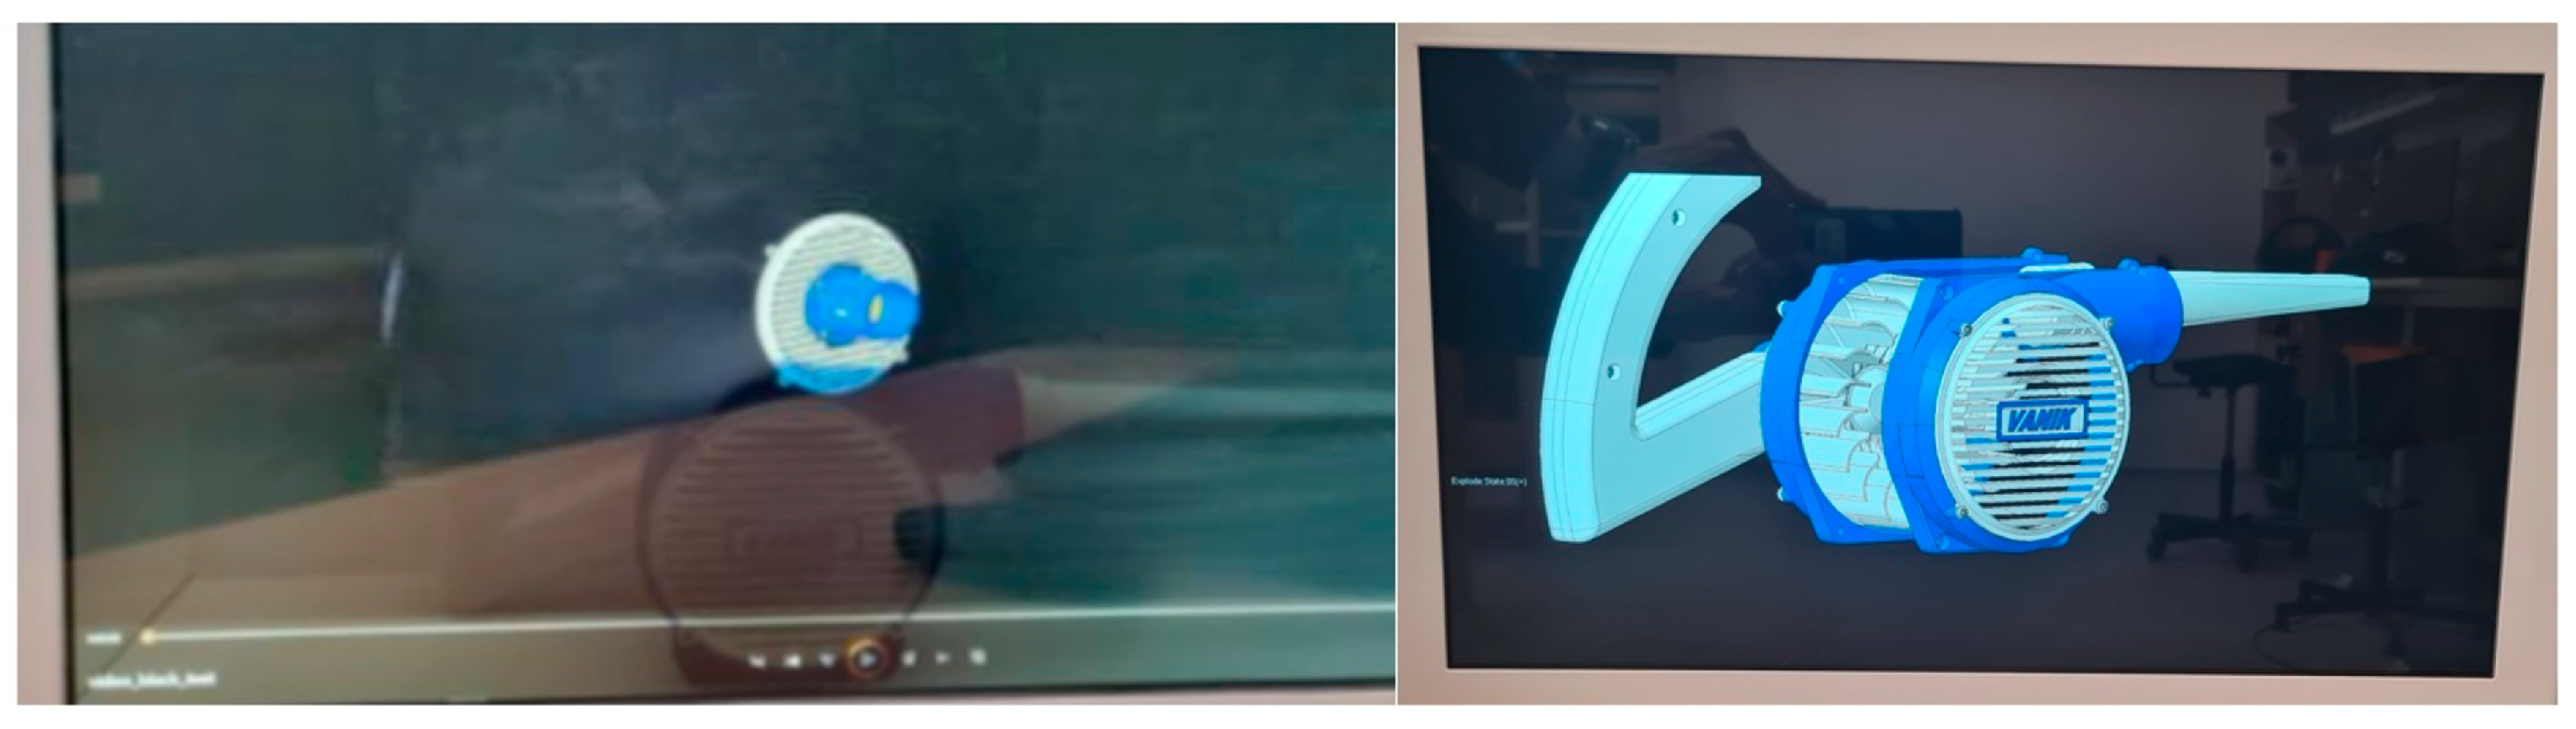
To achieve a smooth transition from the visualization to the interface of the program in which the model is stored, it is necessary for the final view of the assembly in the generated visualization to match the user’s view of the model stored inside the presentation showcase. The dimensions of the showcase allow the model to be stored in only two ways: with the front part or the rear part facing the user (
Figure 11).
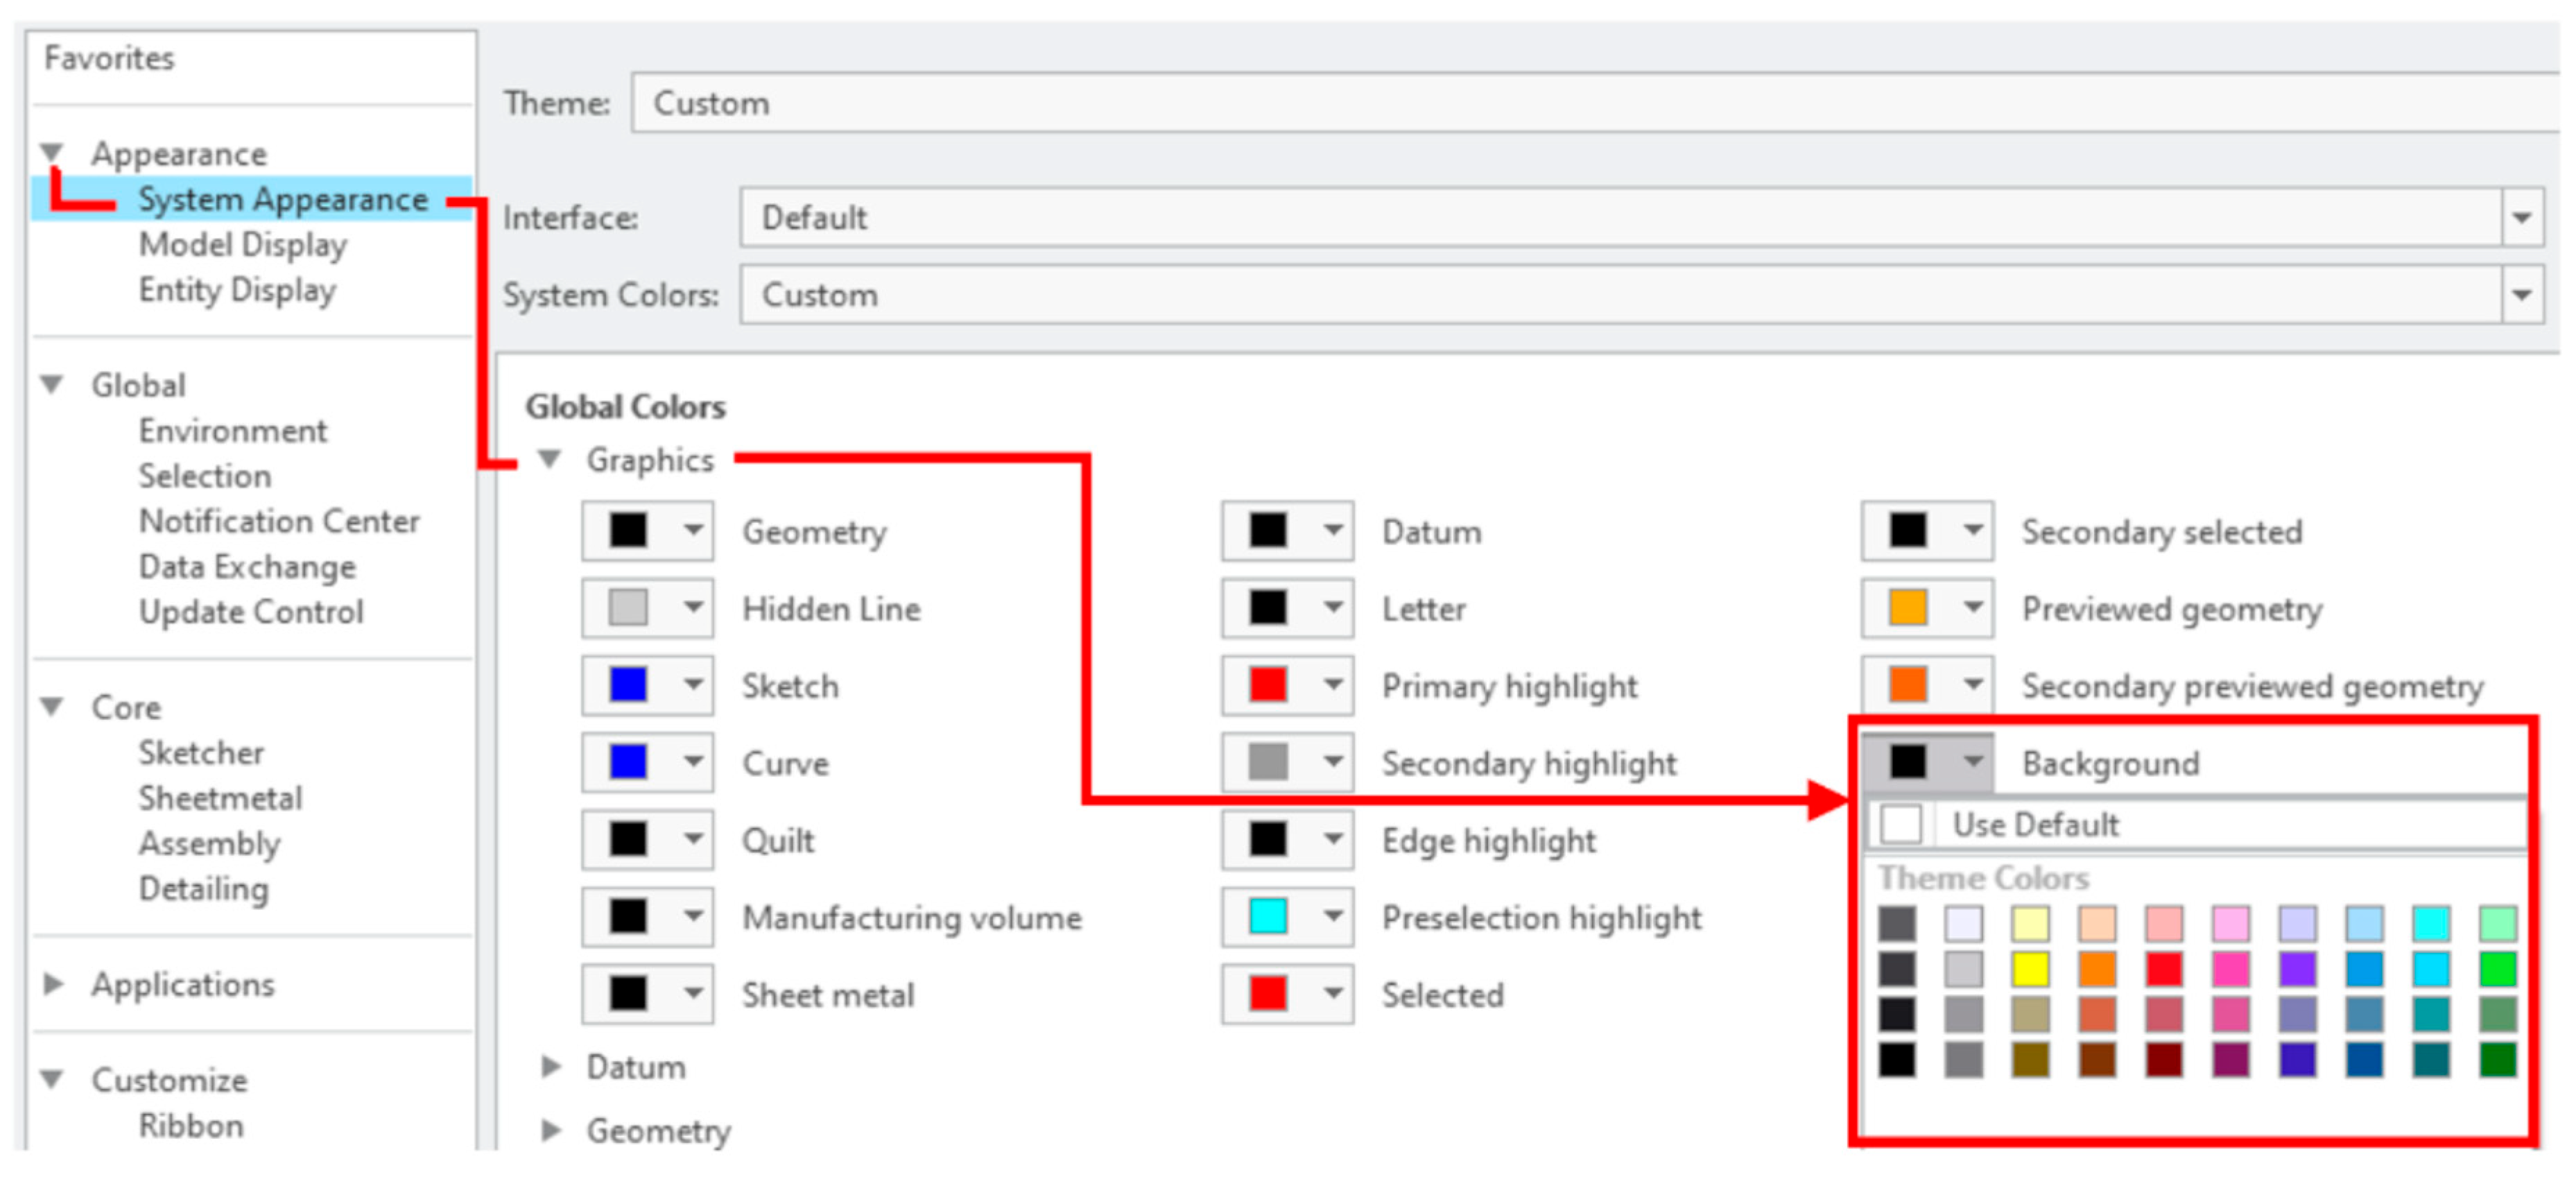
After editing the timeline to its final form, the next step is to generate the video animation. However, before that, it is necessary to change the background colour from white to black (
Figure 12). It is important to remember that the video animation will be presented on a presentation showcase, which is a non-standard display device. From the main menu, go to File > Options to open a new window, where you can access the settings environment. In the displayed window, under the subcategory Appearance > System Appearance > Graphics > Background, the background colour can be changed.
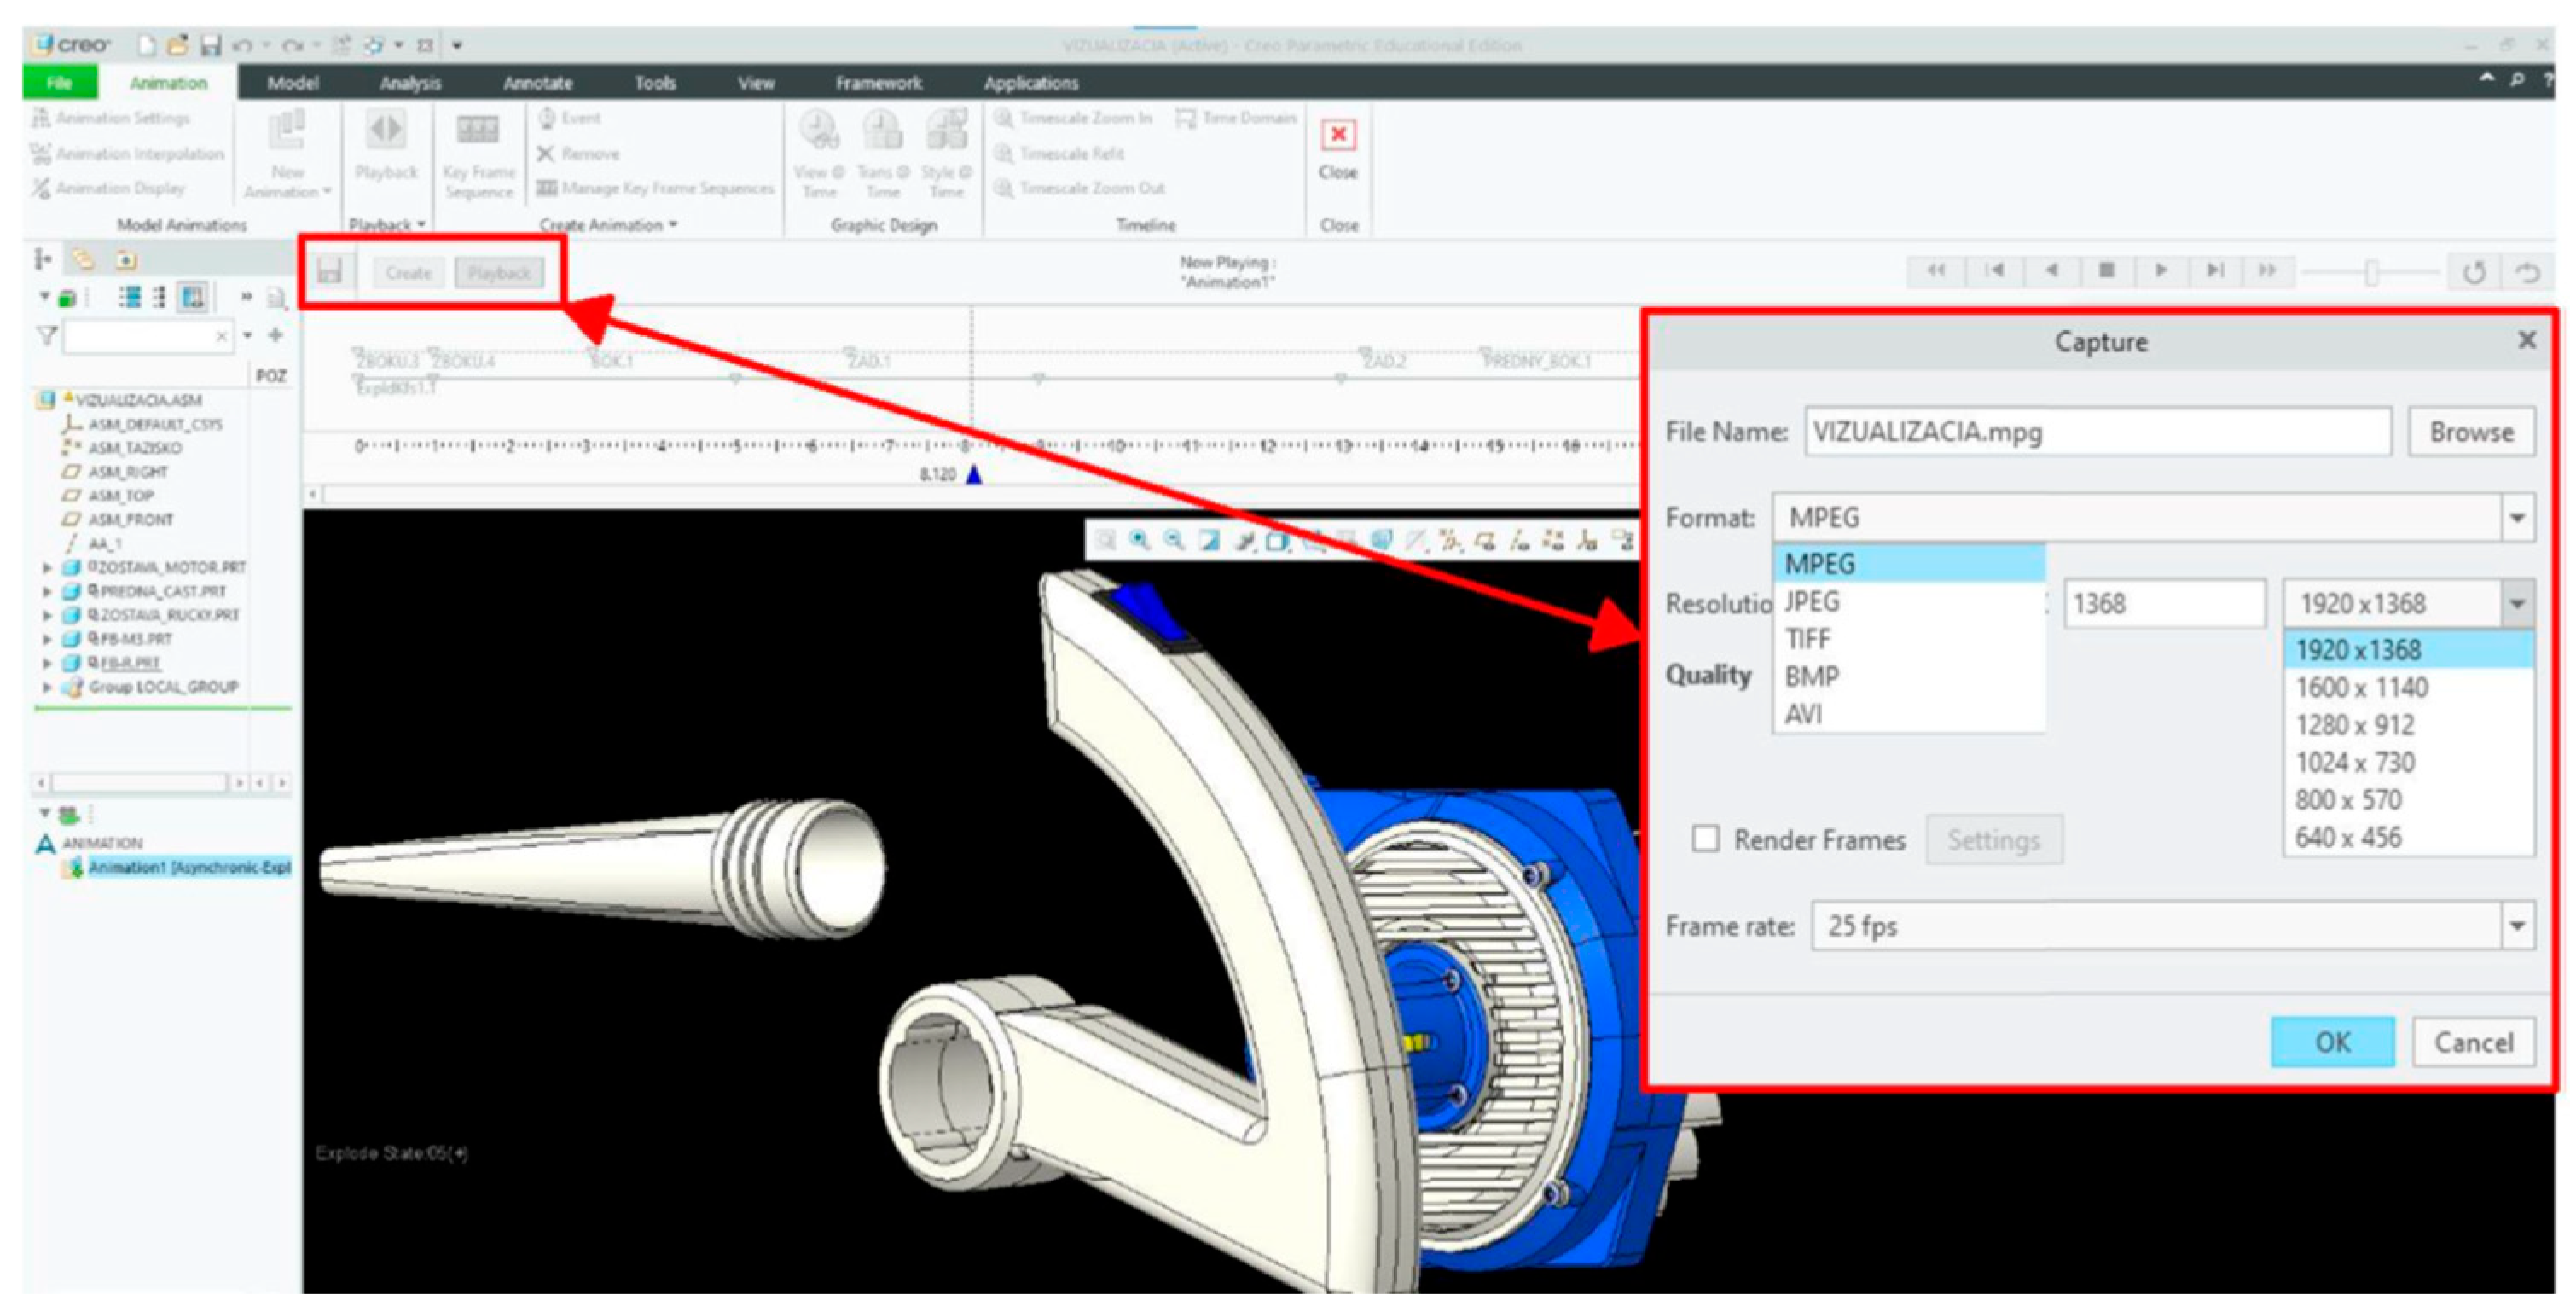
After creating the timeline with views, assembly snapshots, and the changed background, the next step is to export the prepared visualization, which is performed using the Capture command. This command is used for exporting to a video format and offers the option to edit the name of the video being created, choose the storage location on the disk, select video formats, and define the resolution in which the desired content will be generated (
Figure 13).
3.3. Object Manufacturing with Additive Technology
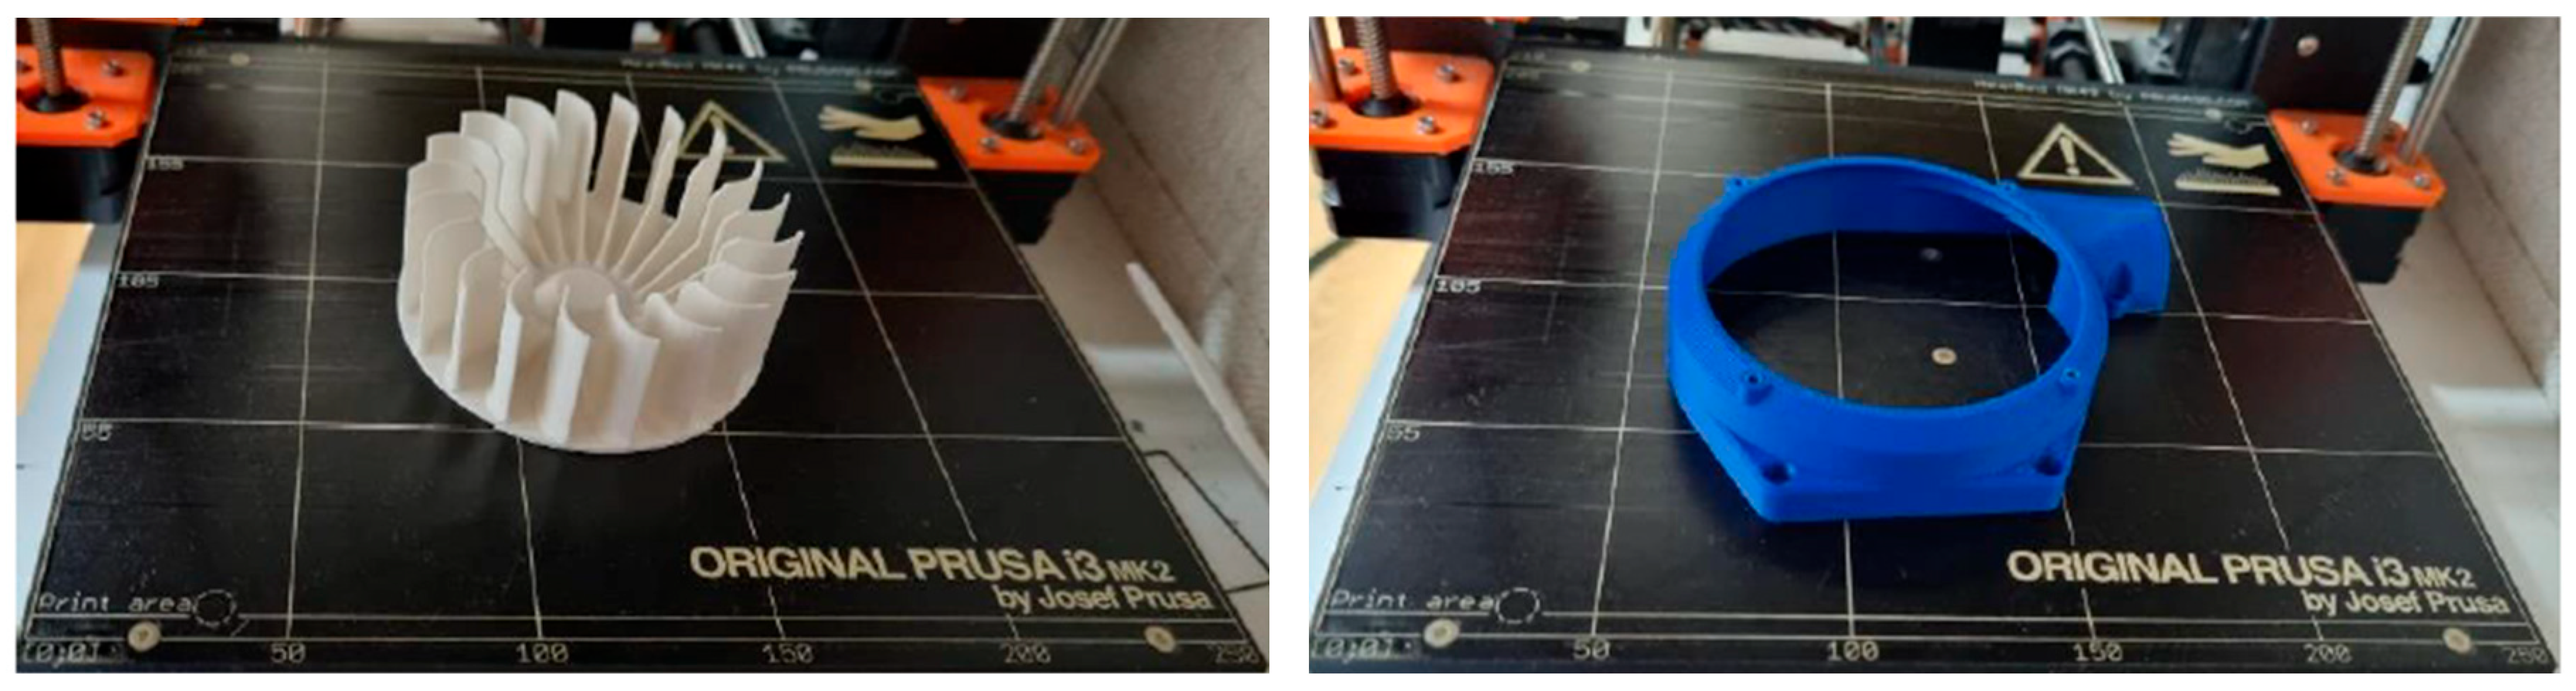
The components were produced using a PRUSA i3 MK2 3D printer (Prusa, Prague, Czech Republic) (
Figure 14). PLA filament was used for printing the parts. A combination of two colours, white and blue, was chosen to make it easier to distinguish between the individual components once the object is assembled.
The components printed on the 3D printer were then cleaned of any excess material, which had been added as support material during the 3D printing of certain parts. The object as a whole was divided into three assembly parts, which were then joined together (
Figure 15). The generated visualizations are also divided according to these parts, with the assembly process clearly shown in detail. To ensure the full functionality of the presented object, additional components such as screws, nuts, a battery, an electric motor, a switch, and wiring were required.
The electric motor was placed into the left casing, and the overall assembly of the individual parts was gradually completed.
In order to place the presentation object into the showcase in the correct orientation and statically, it was necessary to create a base that is not permanently attached to the model (
Figure 16). This base is shape-optimized so that when the model is placed onto it, unwanted rotation or displacement of the object is prevented.
In the final step, the object was placed into the presentation showcase in such a way that the size and position of the assembly in the visualization corresponded to the placement of the physical model inside the showcase. After completing the visualization, no disruptive effect occurs due to a sudden change in the position of the model relative to the visualization (
Figure 17).
3.4. Link
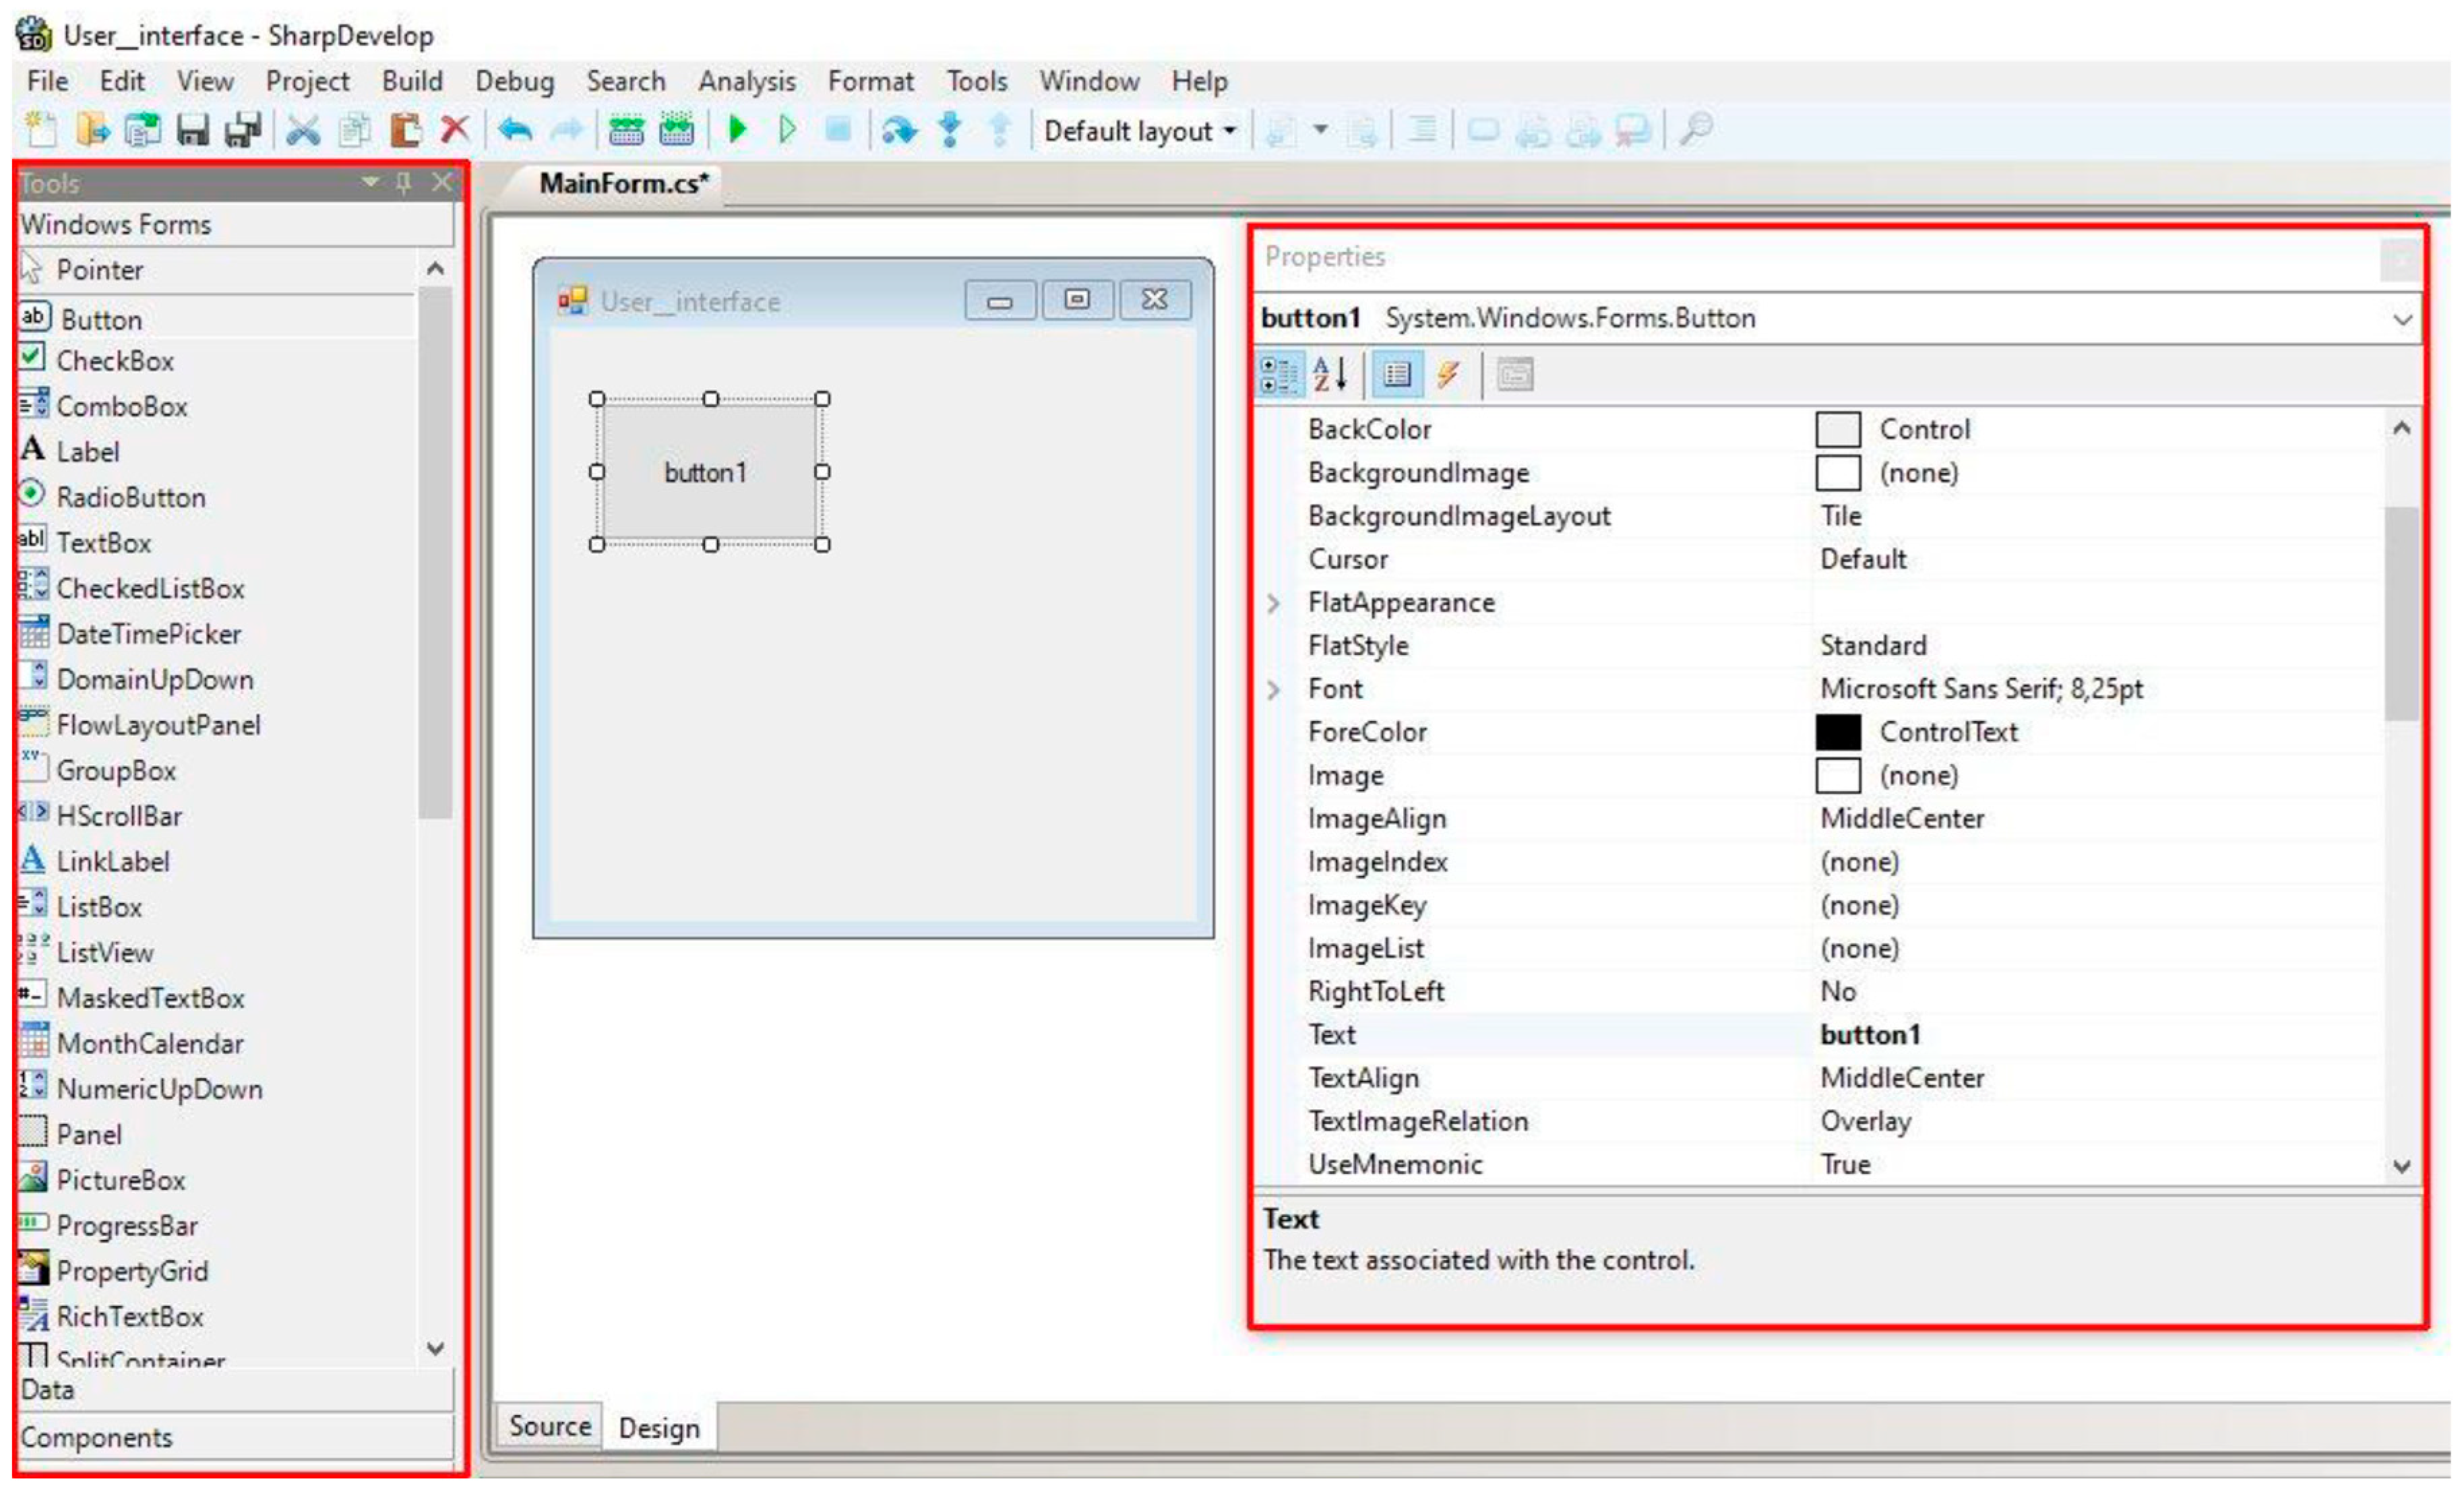
After placing the presented object, it is necessary to establish a connection through the visualization system, which was designed in the SharpDevelop environment. This is an integrated development environment (IDE) intended for software development for the .NET platform. It is an open-source project developed under the MIT licence. At the outset, a user interface is created, which is defined through Windows Forms (
Figure 18). In the Design window, control elements can be inserted into the interface template from the Windows Forms menu, such as buttons, text boxes, lists, images, and so on. The properties of the control elements, such as background colour, text size, font, and colour, can easily be adjusted in the Properties tab located on the right side of the window.
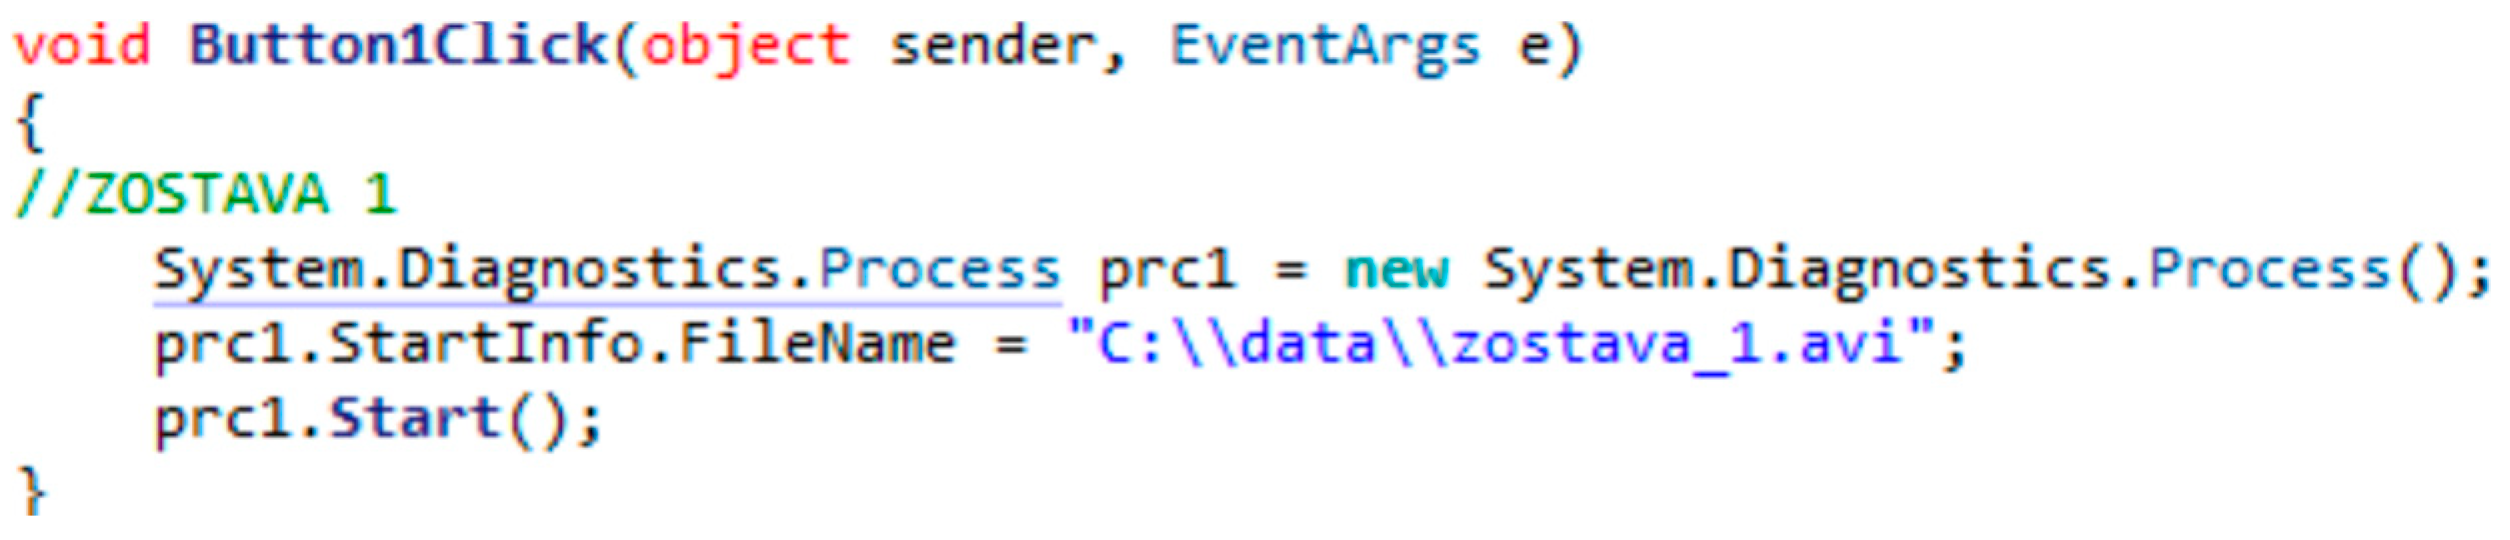
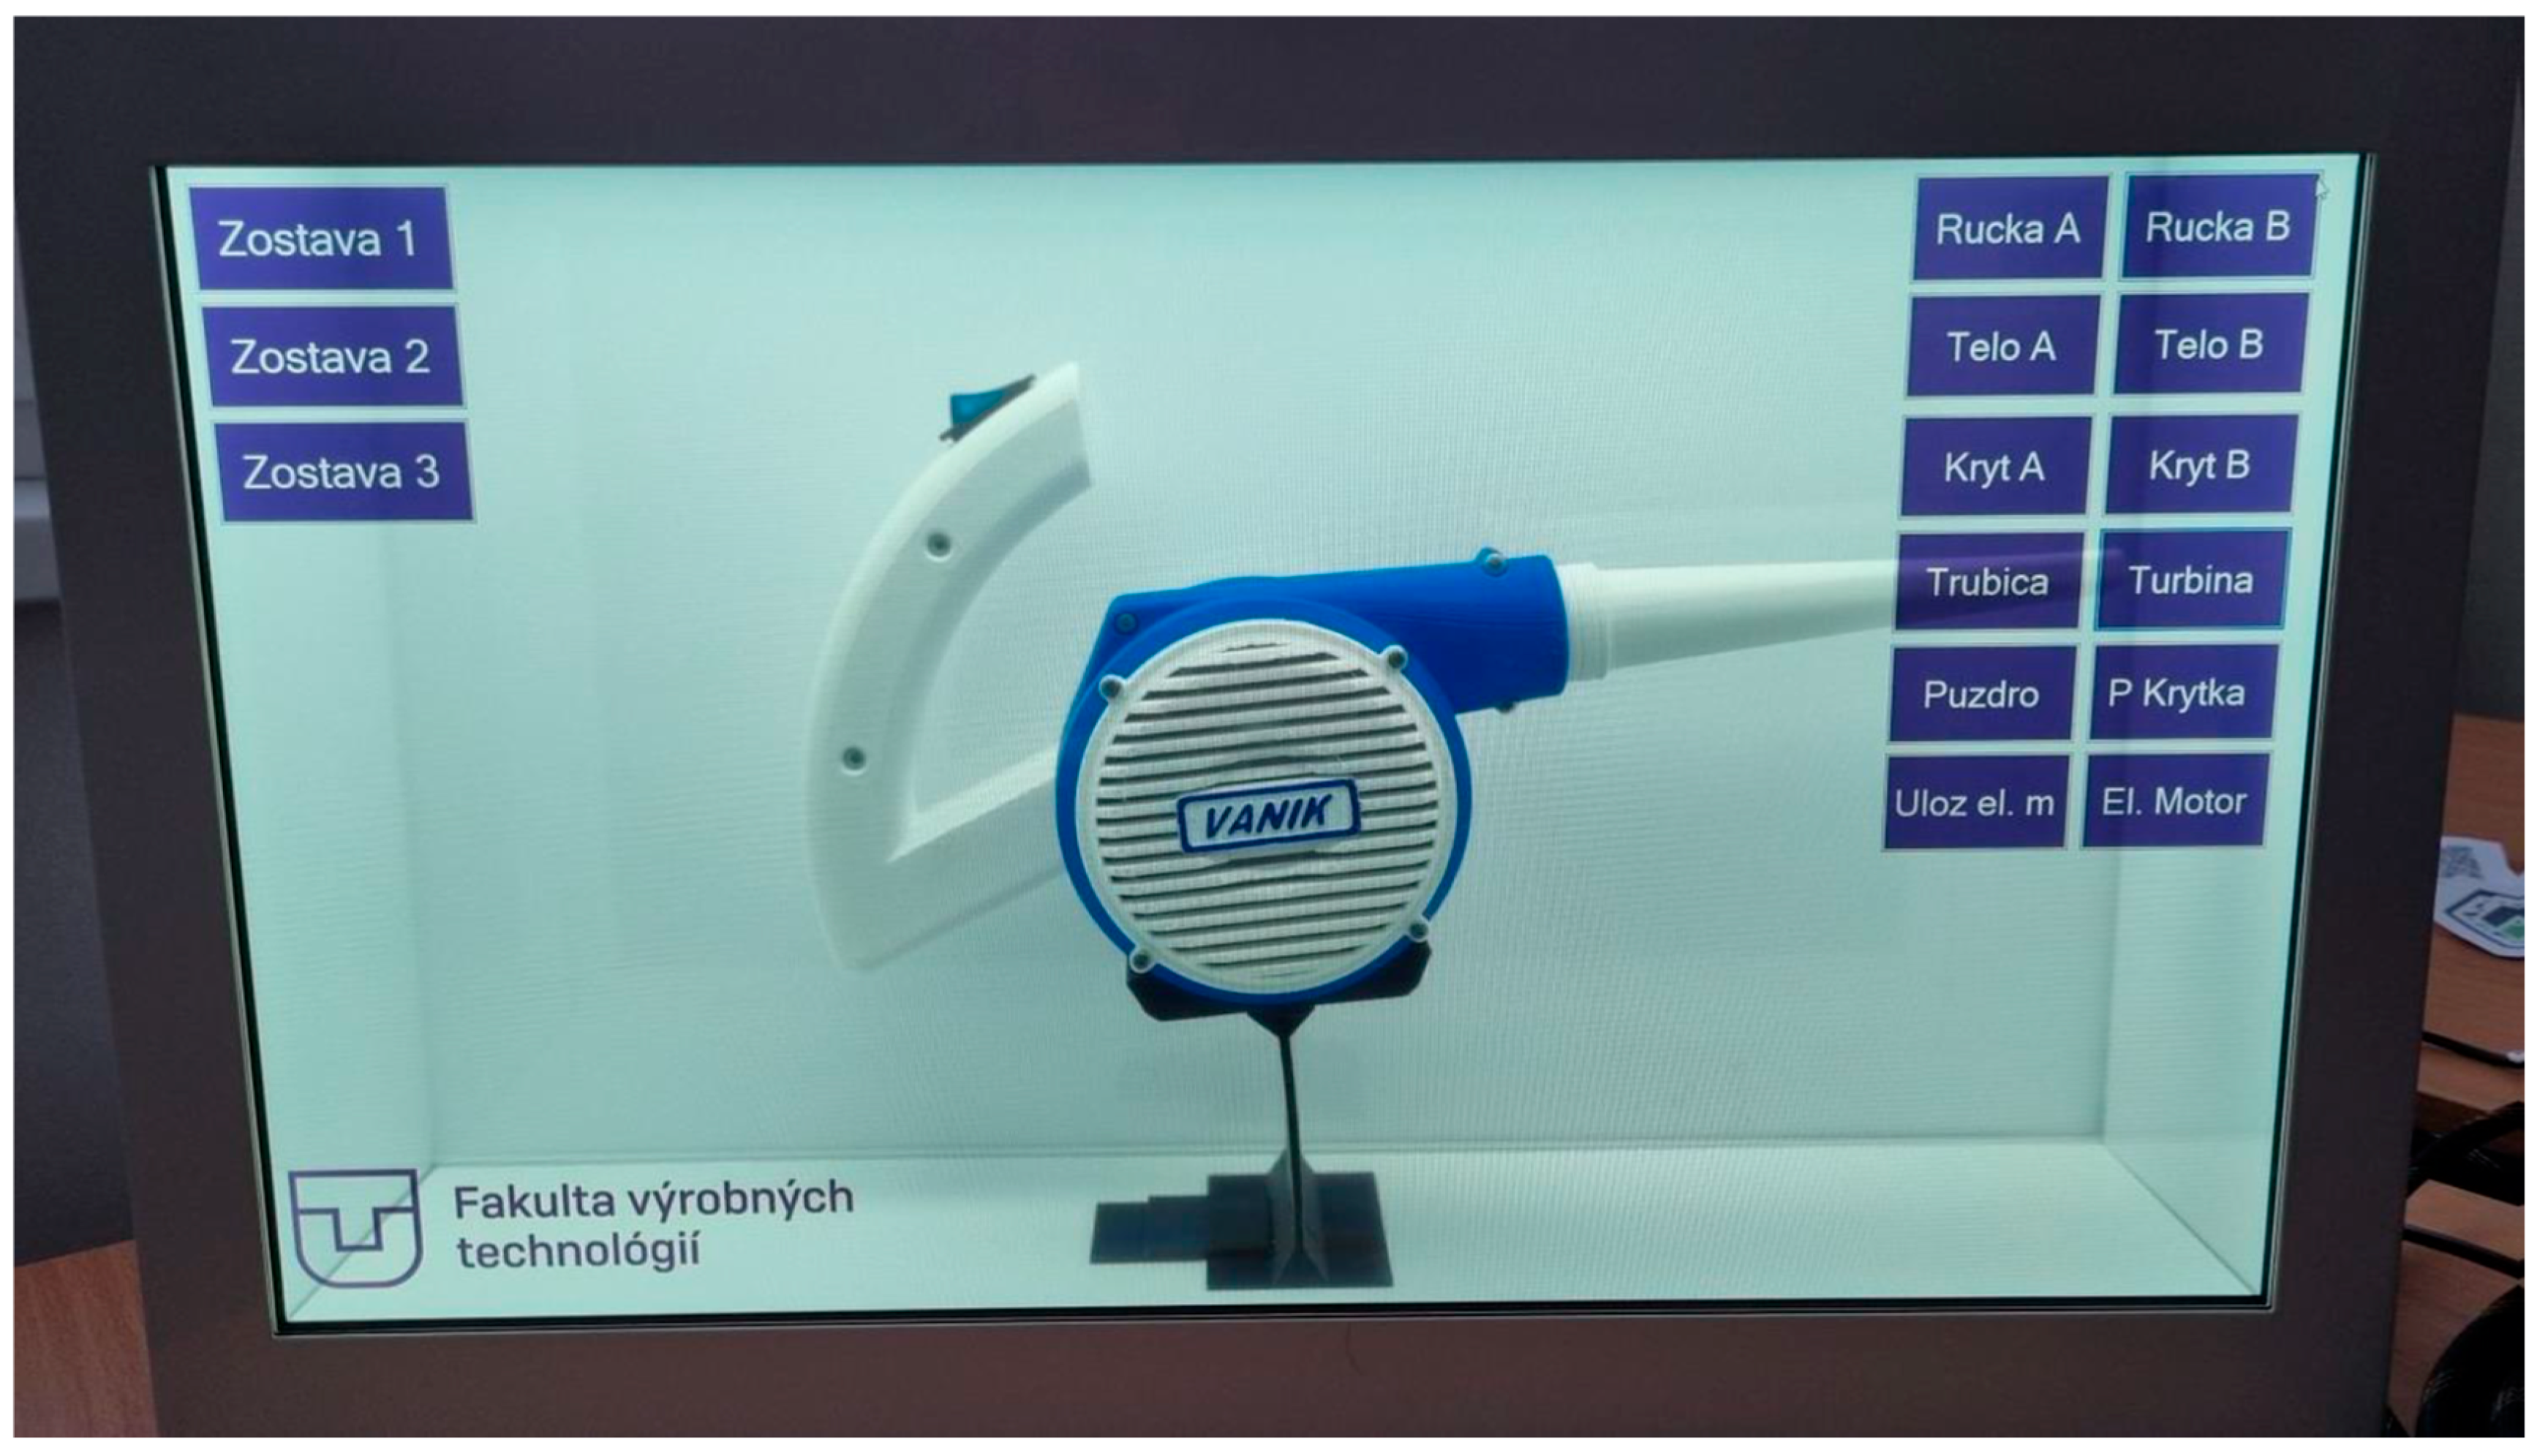
To meet the requirements, the program needs to be adapted for the presentation showcase. The showcase’s LCD panel has a resolution of 1920 × 1080 pixels. Therefore, the size of the graphic interface canvas is also set to 1920 × 1080 pixels. The background colour of the canvas is white, as the showcase renders white as transparent. This means that when the program is running, it will be possible to see through the LCD panel to the model of the presented object placed inside. The animations of the assembly of the presented object are divided into three parts and can be triggered by clicking on buttons located in the top-left corner of the showcase. In the top-right corner, buttons with the names of the individual components of the assembly are added. Each component of the assembly should be able to be opened and viewed in detail. The user interface and its functions need to interact, which is implemented through the code editor. The code placed between the brackets creates a new instance of the Process class from the System.Diagnostics namespace and assigns it to the variable prc1. It then sets the FileName property of the StartInfo object for this instance. Finally, the Start() method is called on the prc1 instance, which starts the process with the given settings (
Figure 19).
The created user interface is optimized in its final form across multiple aspects. In the SharpDevelop development environment, a neat layout of buttons was created, along with the disabling of the application display in the window (
Figure 20).
4. Future Challenges and Implementation Opportunities
The development of see-through displays is heading towards broader utilization in the fields of education, industry, and interactive presentations. Current trends suggest a shift from static visualizations to fully dynamic and interactive solutions that allow users to manipulate digital content in real time [
27]. Significant progress has also been made in the area of interactivity, where they are being combined with augmented reality (AR) and artificial intelligence (AI), thus increasing the level of personalization and adaptability of content [
15]. In education, this could mean the automatic adjustment of teaching materials according to students’ needs, personalized visualizations, and interactive simulations for technical fields. In industrial applications, the potential of these technologies lies in training, assembly, and maintenance, where they can display assembly instructions directly at the workplace.
During the implementation of the proposed methodology, several practical challenges were encountered that inform its future refinement. Aligning digital animations with the physical prototype required multiple adjustments to ensure accurate spatial correspondence and visual consistency within the transparent display environment. Additionally, lighting conditions within the display case affected readability, necessitating color and contrast optimizations. Addressing these issues in future iterations will be important for maximizing the methodology’s educational effectiveness and ensuring a seamless integration into teaching workflows.
It is important to note, however, that while augmented reality systems are increasingly being explored for such applications, see-through displays offer a more structured and technically accessible alternative. Unlike AR solutions that rely on dynamic spatial tracking and environmental mapping, see-through displays are pre-configured, hardware-defined systems that excel in repeatable, static environments such as classrooms, labs, or fixed training stations. Future research will further explore how see-through displays can serve as a pedagogically controlled subset of AR, delivering immersive visualizations without the overhead of real-time tracking. While AR and VR offer broad utility, the predictability, cost-efficiency, and reproducibility of see-through displays position them uniquely for standardized educational modules. Based on the studies analysed so far, subsequent research could focus on optimizing software solutions that will ensure greater compatibility and simpler and faster content creation for presentation purposes using see-through displays. This includes the development of new algorithms for realistic 3D model rendering, improvements in visual layer management, and simplification of the user interface for more efficient interaction with digital content. Following directly from the presented study, there is also a need to focus on the wider adoption of this technology in the educational sector through the development of methodologies that will facilitate the integration of transparent displays into teaching processes. This involves the creation of standardized educational materials, pilot testing, and evaluating their impact on educational outcomes. Building on this initial validation, future research will focus on three key areas:
Empirical user testing with students to assess the impact of the system on learning outcomes, including retention and spatial reasoning;
Development of a semi-automated toolchain to simplify content generation for educators without CAD expertise;
A comparative study evaluating this see-through display approach against traditional screen-based or VR-based teaching methods to identify advantages and limitations.
Overall, the future direction of transparent display technologies lies in their increasing interactivity, improved display quality, and broader use in practical applications, with their development closely linked to advancements in AR, AI, and digital learning systems.
5. Conclusions
Transparent display technologies represent a significant step forward in the field of digital presentations and interactive learning. This study proposed and validated a methodology for creating and implementing content for see-through displays. The integration of digital visualizations with the real environment enables more intuitive learning and a better interpretation of complex technical concepts. Pedagogically, see-through displays provide a low-cognitive-load interface that enables focused visualization of specific instructional content without the navigation or spatial interaction complexities associated with full AR systems. This makes them especially appropriate for mechanical engineering education, where the goal is often to clarify fixed relationships (e.g., component hierarchies, assembly order) rather than explore dynamic spatial mappings. In contrast, AR applications are more suitable for exploratory or situational learning contexts, where environmental interaction and spatial adaptability are central to the instructional design. While both technologies can enhance engagement, their instructional affordances differ in granularity, control, and fidelity to real-world tasks. The pilot application of the methodology in an educational setting confirmed its practical applicability and identified key factors for successful implementation, such as proper visual content processing, interactivity, and technical optimization of display systems. This study also highlighted challenges associated with integrating this technology, particularly in the development of suitable software, ensuring compatibility with existing systems and optimizing display performance under different lighting conditions. In conclusion, it can be stated that transparent displays have the potential to fundamentally change the way information is presented and taught, with their effective implementation requiring a combination of technological innovations, pedagogical strategies, and practical testing in real-world conditions.
Author Contributions
Conceptualization, J.T. and D.D.; methodology, D.D. and J.T.; software, J.T. and D.D.; validation, J.T. and D.D.; formal analysis J.T. and D.D.; investigation, J.T. and D.D.; writing—original draft preparation, D.D.; writing—review and editing, J.T. and D.D. All authors have read and agreed to the published version of the manuscript.
Funding
This research was supported by the Cultural and Educational Grant Agency of the Ministry of Education, Research, Development and Youth of the Slovak Republic, grant no. KEGA 014TUKE-4/2024, and by the Scientific Grant Agency of the Ministry of Education, Research, Development and Youth of the Slovak Republic and Slovak Academy of Sciences, grant No. VEGA 1/0302/25.
Institutional Review Board Statement
Not applicable.
Informed Consent Statement
Not applicable.
Data Availability Statement
The original contributions presented in the study are included in the article, and further inquiries can be directed to the corresponding author.
Acknowledgments
This article is supported by project DRP0200194, Moving PLastics and mAchine iNdustry towards Circularity (PLAN-C) under the Interreg Danube Region Program, co-funded by the European Union. This article was also funded by EU NextGenerationEU through the Recovery and Resilience Plan for Slovakia under the project no. 09I05-03-V02-00042.
Conflicts of Interest
The authors declare no conflicts of interest.
References
- Neo, T.K.; Neo, M. Classroom innovation: Engaging students in interactive multimedia learning. Campus-Wide Inf. Syst. 2004, 21, 118–124. [Google Scholar] [CrossRef]
- Lenz, P.H.; Le, T.T.; Mccallister, J.W.; Luks, A.M.; Fessler, H.E. Practical strategies for effective lectures. Ann. Am. Thorac. Soc. 2015, 12, 561–566. [Google Scholar] [CrossRef] [PubMed]
- Sovhira, S.; Braslavska, O.; Dushechkina, N.; Liulenko, S.; Zadorozhna, O. Training of future teachers of natural sciences for the use of information and communication technologies in their professional activities. Amazon. Investig. 2022, 11, 167–176. [Google Scholar] [CrossRef]
- Blanche, P.A.; Bigler, C.; Draper, C.; Mann, M. Holographic See-Through Displays. In Proceedings of the Digital Holography and Three-Dimensional Imaging 2019, Bordeaux, France, 19–23 May 2019; Optica Publishing Group: Washington, DC, USA, 2019; p. M3A–1. [Google Scholar] [CrossRef]
- Lecointre-Erickson, D.; Daucé, B.; Legohérel, P. The influence of interactive window displays on expected shopping experience. Int. J. Retail Distrib. Manag. 2018, 46, 802–819. [Google Scholar] [CrossRef]
- Basu, R.; Paul, J.; Singh, K. Visual merchandising and store atmospherics: An integrated review and future research directions. J. Bus. Res. 2022, 151, 397–408. [Google Scholar] [CrossRef]
- Murali, P.K.; Kaboli, M.; Dahiya, R. Intelligent in-vehicle interaction technologies. Adv. Intell. Syst. 2022, 4, 2100122. [Google Scholar] [CrossRef]
- Christmas, J.; Smeeton, T.M. Dynamic Holography for Automotive Augmented-Reality Head-Up Displays (AR-HUD). SID Symp. Dig. Tech. Pap. 2021, 52, 560–563. [Google Scholar] [CrossRef]
- Bellucci, A.; Diaz, P.; Aedo, I. A see-through display for interactive museum showcases. In Proceedings of the 2015 International Conference on Interactive Tabletops & Surfaces, Funchal, Portugal, 15–18 November 2015; pp. 301–306. [Google Scholar] [CrossRef]
- Mulholland, P.; Collins, T. Using digital narratives to support the collaborative learning and exploration of cultural heritage. In Proceedings of the 13th International Workshop on Database and Expert Systems Applications, Aix-en-Provence, France, 2–6 September 2002; pp. 527–531. [Google Scholar] [CrossRef]
- Colley, A.; Ventä-Olkkonen, L.; Alt, F.; Häkkilä, J. Insights from deploying see-through augmented reality signage in the wild. In Proceedings of the 4th International Symposium on Pervasive Displays, Saarbrücken, Germany, 10–12 June 2015; pp. 179–185. [Google Scholar] [CrossRef]
- Smeda, N.; Dakich, E.; Sharda, N. The effectiveness of digital storytelling in the classrooms: A comprehensive study. Smart Learn. Environ. 2014, 1, 6. [Google Scholar] [CrossRef]
- Sharma, K.; Leftheriotis, I.; Giannakos, M. Utilizing interactive surfaces to enhance learning, collaboration and engagement: Insights from learners’ gaze and speech. Sensors 2020, 20, 1964. [Google Scholar] [CrossRef]
- Marcelo, C.; Yot-Domínguez, C. From chalk to keyboard in higher education classrooms: Changes and coherence when integrating technological knowledge into pedagogical content knowledge. J. Furth. High. Educ. 2019, 43, 975–988. [Google Scholar] [CrossRef]
- Suhail, N.; Bahroun, Z.; Ahmed, V. Augmented reality in engineering education: Enhancing learning and application. Front. Virtual Real. 2024, 5, 1461145. [Google Scholar] [CrossRef]
- Hemme, C.L.; Carley, R.; Norton, A.; Ghumman, M.; Nguyen, H.; Ivone, R.; Menon, J.U.; Shen, J.; Bertin, M.; King, R.; et al. Developing virtual and augmented reality applications for science, technology, engineering and math education. BioTechniques 2023, 75, 343–352. [Google Scholar] [CrossRef] [PubMed]
- Guo, W. Improving Engineering Education Using Augmented Reality Environment; Springer: New York, NY, USA, 2018; pp. 233–242. [Google Scholar]
- Bernsteiner, R.; Probst, A.; Pachatz, W.; Ploder, C.; Dilger, T. Augmented reality in engineering education—A comparison of students’ and teachers’ perceptions. In Proceedings of the International Conference on Interactive Collaborative Learning, Madrid, Spain, 26–29 September 2023; pp. 207–219. [Google Scholar] [CrossRef]
- Silva, A.; Calderon, A.; Retuerto, M.; Andrade-Arenas, L. Application of augmented reality in teaching and learning in engineering programs. Int. J. Interact. Mob. Technol. 2022, 16, 112–124. [Google Scholar] [CrossRef]
- Hilliges, O.; Kim, D.; Izadi, S.; Weiss, M.; Wilson, A. HoloDesk: Direct 3D interactions with a situated see-through display. In Proceedings of the SIGCHI Conference on Human Factors in Computing Systems, Austin, TX, USA, 5–10 May 2012; pp. 2421–2430. [Google Scholar] [CrossRef]
- Gupta, C. The impact and measurement of today’s learning technologies in teaching software engineering course using design-based learning and project-based learning. IEEE Trans. Educ. 2022, 65, 703–712. [Google Scholar] [CrossRef]
- De Souza, J.; Tartz, R. Visual perception and user satisfaction in video see-through head-mounted displays: A mixed-methods evaluation. Front. Virtual Real. 2024, 5, 1368721. [Google Scholar] [CrossRef]
- Hakiki, R.; Muchson, M.; Sulistina, O.; Febriana, A. The development of learning media based on augmented reality, hologram, and ludo game on the topic of molecular shapes. Int. J. Interact. Mob. Technol. 2022, 16, 70–84. [Google Scholar] [CrossRef]
- Waskito, W.; Fortuna, A.; Prasetya, F.; Wulansari, R.E.; Nabawi, R.A.; Luthfi, A. Integration of mobile augmented reality applications for engineering mechanics learning with interacting 3D objects in engineering education. Int. J. Inf. Educ. Technol. 2024, 14. [Google Scholar] [CrossRef]
- Opriş, I.; Costinaş, S.; Ionescu, C.S.; Gogoaşe Nistoran, D.E. Step-by-step augmented reality in power engineering education. Comput. Appl. Eng. Educ. 2018, 26, 1590–1602. [Google Scholar] [CrossRef]
- Bhat, N.; Raparthi, M.; Groenewald, E.S. Augmented Reality and Deep Learning Integration for Enhanced Design and Maintenance in Mechanical Engineering. Power Syst. Technol. 2023, 47, 98–115. [Google Scholar] [CrossRef]
- Grubert, J.; Itoh, Y.; Moser, K.; Swan, J.E. A survey of calibration methods for optical see-through head-mounted displays. IEEE Trans. Vis. Comput. Graph. 2017, 24, 2649–2662. [Google Scholar] [CrossRef]
- Gil Rodríguez, R.; Bayer, F.; Toscani, M.; Guarnera, D.Y.; Guarnera, G.C.; Gegenfurtner, K.R. Colour calibration of a head mounted display for colour vision research using virtual reality. SN Comput. Sci. 2022, 3, 22. [Google Scholar] [CrossRef] [PubMed]
- Murray, R.F.; Patel, K.Y.; Wiedenmann, E.S. Luminance calibration of virtual reality displays in unity. J. Vis. 2022, 22, 1. [Google Scholar] [CrossRef] [PubMed]
- Pregowska, A.; Osial, M.; Dolega-Dolegowski, D.; Kolecki, R.; Proniewska, K. Information and communication technologies combined with mixed reality as supporting tools in medical education. Electronics 2022, 11, 3778. [Google Scholar] [CrossRef]
- Sung, H.; Kim, M.; Park, J.; Shin, N.; Han, Y. Effectiveness of virtual reality in healthcare education: Systematic review and meta-analysis. Sustainability 2024, 16, 8520. [Google Scholar] [CrossRef]
- Sriadhi, S.; Hamid, A.; Sitompul, H.; Restu, R. Effectiveness of augmented reality-based learning media for engineering-physics teaching. Int. J. Emerg. Technol. Learn. 2022, 17, 281–293. [Google Scholar] [CrossRef]
- Vásquez-Carbonell, M. A systematic literature review of augmented reality in engineering education: Hardware, software, student motivation & development recommendations. Digit. Educ. Rev. 2022, 41, 249–267. [Google Scholar] [CrossRef]
- Ivanova, G.; Ivanov, A.; Zdravkov, L. Virtual and augmented reality in mechanical engineering education. In Proceedings of the 2023 46th MIPRO ICT and electronics convention (MIPRO), Opatija, Croatia, 22–26 May 2023; pp. 1612–1617. [Google Scholar] [CrossRef]
Figure 1.
The methodology for designing and creating content for presentation purposes using see-through displays—definition of basic requirements.
Figure 1.
The methodology for designing and creating content for presentation purposes using see-through displays—definition of basic requirements.
Figure 2.
The methodology for designing and creating content for presentation purposes using see-through displays—generation of content.
Figure 2.
The methodology for designing and creating content for presentation purposes using see-through displays—generation of content.
Figure 3.
The methodology for designing and creating content for presentation purposes using see-through displays—object manufacturing with additive technology.
Figure 3.
The methodology for designing and creating content for presentation purposes using see-through displays—object manufacturing with additive technology.
Figure 4.
The methodology for designing and creating content for presentation purposes using see-through displays—links.
Figure 4.
The methodology for designing and creating content for presentation purposes using see-through displays—links.
Figure 5.
CAD model of body (left) and covers (right).
Figure 5.
CAD model of body (left) and covers (right).
Figure 6.
CAD models of components to produce presentation object.
Figure 6.
CAD models of components to produce presentation object.
Figure 7.
Assembly parts for creating visualization.
Figure 7.
Assembly parts for creating visualization.
Figure 8.
Illustration of Key Frame creation process.
Figure 8.
Illustration of Key Frame creation process.
Figure 9.
Illustration of arranging frames in order on the timeline.
Figure 9.
Illustration of arranging frames in order on the timeline.
Figure 10.
View orientation at the end of the visualization.
Figure 10.
View orientation at the end of the visualization.
Figure 11.
Comparing the size of the model in the visualization with the real object.
Figure 11.
Comparing the size of the model in the visualization with the real object.
Figure 12.
Illustration of a sequence for modifying the background colour for exporting a visualization.
Figure 12.
Illustration of a sequence for modifying the background colour for exporting a visualization.
Figure 13.
Defining parameters for generating the required content.
Figure 13.
Defining parameters for generating the required content.
Figure 14.
Illustration of components manufactured using additive technology.
Figure 14.
Illustration of components manufactured using additive technology.
Figure 15.
Illustration of assembly of the object for presentation purposes.
Figure 15.
Illustration of assembly of the object for presentation purposes.
Figure 16.
A manufactured pad to ensure the position of the presented object is maintained.
Figure 16.
A manufactured pad to ensure the position of the presented object is maintained.
Figure 17.
Placing the object in the presentation showcase space.
Figure 17.
Placing the object in the presentation showcase space.
Figure 18.
Creating a graphical interface using Windows Forms.
Figure 18.
Creating a graphical interface using Windows Forms.
Figure 19.
Illustration of code structure for launching visualization.
Figure 19.
Illustration of code structure for launching visualization.
Figure 20.
User interface with the presented object placed.
Figure 20.
User interface with the presented object placed.
Table 1.
Basic specifications of a presentation showcase with see-through display.
Table 1.
Basic specifications of a presentation showcase with see-through display.
| Model | LCD-215-TRN |
|---|
| Display | 21.5″ |
| Resolution | 1920 × 1080 px |
| Touch panel | Yes |
| LCD dimensions | 475 × 267 mm |
| Viewing angles | 89/89/89/89° |
| Connectors | 2× USB/2× HDMI/VGA |
| Display transparency | 15% |
| LED lighting | Yes |
| Disclaimer/Publisher’s Note: The statements, opinions and data contained in all publications are solely those of the individual author(s) and contributor(s) and not of MDPI and/or the editor(s). MDPI and/or the editor(s) disclaim responsibility for any injury to people or property resulting from any ideas, methods, instructions or products referred to in the content. |
© 2025 by the authors. Licensee MDPI, Basel, Switzerland. This article is an open access article distributed under the terms and conditions of the Creative Commons Attribution (CC BY) license (https://creativecommons.org/licenses/by/4.0/).


