Article

Correlation of Optical Constants and Morphologies with Mueller Matrix for Micro-Rough Surfaces

Changchun Institute of Optics, Fine Mechanics and Physics, Chinese Academy of Sciences, Changchun 130033, China
*
Author to whom correspondence should be addressed.
Appl. Sci. 2025, 15(11), 6149; https://doi.org/10.3390/app15116149
Submission received: 2 May 2025 / Revised: 27 May 2025 / Accepted: 28 May 2025 / Published: 29 May 2025

Abstract

This paper focuses on the coupling relationships between the optical constants (n: refractive index; k: extinction coefficient) and Mueller matrix elements, as well as between the morphological parameters (σ: root mean square roughness; τ: correlation length) and Mueller matrix elements, of randomly micro-rough surfaces. The electromagnetic response of randomly micro-rough surfaces was simulated by the finite-difference time-domain method, so that the rough surfaces’ reflection coefficients of incident light in the p and s directions could be obtained. According to the formula for the Jones-to-Mueller matrix conversion, we obtained a 4 × 4 Mueller matrix of rough surfaces. The simulation method was validated with experimental results measured by Mueller matrix spectroscopic ellipsometry. It was found that the Mueller matrix element m12 has great potential to invert the optical constants of the rough surfaces, whose refractive indices, n, and extinction coefficients, k, are in the ranges of 0 ≤ n ≤ 4 and 0 ≤ k ≤ 10, respectively. The Mueller matrix element m34 is proportional to the morphological parameters σ/λ (λ: incident wavelength) or σ/τ. Moreover, the expressions (S + β2) ∝ σ/λ and (S + β2) ∝ σ/τ can be applied to predict the morphologies of rough surfaces within morphological parameter ranges of 0.003 ≤ σ/λ ≤ 0.015 and 0.125 ≤ σ/τ ≤ 0.75. This research signifies a key step toward the ability to invert the morphological parameters or optical constants of micro-rough surfaces through a Mueller matrix.

1. Introduction

Rough solid surfaces refer to solid samples whose surfaces are imperfect no matter how well they are polished [1]. A 4 × 4 Mueller matrix comprising 16 elements contains information about anisotropy and depolarization. Therefore, the Mueller matrix is usually utilized to investigate rough surfaces. Nee et al. [2] used the Mueller matrix to obtain the polarization characteristics in the specular reflection direction of a rough surface. Bruce et al. [3] obtained the Mueller matrix of a randomly rough surface under specific morphological parameters through the Kirchhoff approximation method. Song et al. [4] used six polarization states of incident light, calculated their scattering polarization states, and obtained a rough surface Mueller matrix through combination. Jiang et al. [5] found that m34 and m43 are key elements in the Mueller matrix that can be used to identify materials with rough surfaces. Bian et al. [6] investigated the interplay between incident wavelength, angle of incidence, roughness parameters, and the contributions of diffuse and specular reflections utilizing the Mueller matrix of rough surfaces.
The roughness of surfaces can significantly influence the precision of optical constants, which are measured by spectroscopic ellipsometry (SE) based on the Fresnel equation [7,8,9,10]. In order to reduce this influence, the effective medium approximation (EMA) is usually applied to model the rough surfaces of solid materials [11,12,13]. However, the EMA model may cause a large deviation in the SE data analysis since it only accounts for the height irregularities of rough surfaces but neglects the effect of lateral irregularities on electromagnetic scattering from rough surfaces [14]. Liu et al. [15] proposed a novel inversion method without using the EMA to extract optical constants from SE parameters for solid materials with micro-rough surfaces based on the first-principles calculations of Maxwell’s equations and the Levenberg–Marquardt optimization algorithm. This method does indeed have wider applicability and higher precision than the EMA model, but it also has a defect in that non-unique inversion may occur. The Mueller matrix with 4×4 elements of rough surfaces of solid materials can be used to develop more relations with optical constants to avoid this non-uniqueness.
The morphologies of randomly rough surfaces are closely connected with remote sensing [16,17], target identification [18,19], and the Synthetic Aperture Radar imaging technique [20,21]. Normally, the root mean square (rms) roughness, σ, and correlation length, τ, representing height and lateral irregularities, respectively, are utilized to characterize the morphologies of rough surfaces. Currently available metrology tools, such as scanning electron microscopy (SEM), atomic force microscopy (AFM), and transmission electron microscopy (TEM), are mostly suitable for the measurement of the morphologies of randomly rough surfaces [22]. These instruments have the advantages of being reliable and having high resolution, but they also have defects like working slowly or destructively. A 4 × 4 Mueller matrix associating the Stokes vectors of incident electromagnetic waves with emergent ones can fully reflect the morphological information of rough surfaces [23,24,25]. Compared with scanning tools, the method of directly deducing the morphologies of rough surfaces utilizing a Mueller matrix has attractive merits, such as being low-cost, time-saving, and non-destructive and allowing for in situ measurements.
In this work, we utilized the finite-difference time-domain (FDTD) method, which can simulate electromagnetic responses to obtain the reflection coefficients of randomly micro-rough surfaces for incident light in the p and s directions, respectively. Then, we calculated the 4 × 4 Mueller matrix of rough surfaces according to the formula used for the Jones-to-Mueller matrix conversion. The simulation method was validated with experimental results measured by Mueller matrix spectroscopic ellipsometry (MMSE). The relationships between the refractive index, n, the extinction coefficient, k, the relative roughness, σ/λ, the correlation length, σ/τ, and the Mueller matrix elements of randomly micro-rough surfaces were discussed. The aim of this study was to investigate methods of measuring optical constants accurately and inverting the morphologies of randomly rough solid surfaces directly.
The remainder of this paper is structured as follows: the model, simulation method, and experimental verification are presented in Section 2; the results and discussion are provided in Section 3; and Section 4 concludes this paper.

2. Theoretical Background

2.1. Gaussian-Distributed Randomly Micro-Rough Surface Model

In practical applications, rough surfaces demonstrate spatially heterogeneous profiles that statistically conform to the classification of Gaussian-distributed randomly rough surfaces. These surfaces are quantitatively defined by two fundamental parameters: the root mean square roughness, σ, representing the standard deviation of the height distribution, and the correlation length, τ, describing the distance above which the heights of two points are statistically uncorrelated. For Gaussian-distributed randomly rough surfaces, the corresponding autocorrelation function is as follows [26]:
H p H p + q = σ 2 exp q 2 / τ 2
where H ( p ) represents the height at position p , q is a spatial vector, and q denotes its magnitude.
In ellipsometry characterization, the term “rough surface” operationally refers to micro-rough surfaces satisfying the Rayleigh criterion for optical smoothness [27]:
4 π σ c o s θ / λ   <   π / 2
where θ is the incident angle and λ denotes the wavelength of incident light. Consequently, this work focuses exclusively on micro-rough surfaces with relative roughness σ/λ < 1/8.

2.2. Simulation Method and Jones–Mueller Matrix Conversion

FDTD is a robust numerical method, which can be used to directly solve the differential Maxwell equations in the time domain to accurately calculate the electromagnetic response [1]. The FDTD method scales with high efficiency on a parallel-processing CPU-based computer and performs especially well for three-dimensional geometrical structures. The detailed algorithm of FDTD has been published [28,29].
The Jones vector basically describes the electric fields which are simulated by FDTD [1,30] in this work. A Jones matrix is defined as a 2 × 2 matrix, which is associated with incident and exit electric vectors in the p and s directions. Consequently, if we aim to acquire the 4 × 4 Mueller matrix of rough surfaces via the simulation method, it is necessary to derive the formula for the conversion from the Jones matrix to the Mueller matrix. The specific steps to perform the matrix conversion can be found in Ref. [31]. If the sample is non-depolarizing, the 4 × 4 Mueller matrix M takes the following form [32]:
M = 1 2 ( r p p 2 + r s p 2 + r p s 2 + r s s 2 ) 1 2 ( r p p 2 + r s p 2 r p s 2 r s s 2 ) R e ( r p p r p s * + r s p r s s * ) I m ( r p p r p s * + r s p r s s * ) 1 2 ( r p p 2 + r s p 2 + r p s 2 + r s s 2 ) 1 2 ( r p p 2 r s p 2 r p s 2 + r s s 2 ) R e ( r p p r p s * r s p r s s * ) I m ( r p p r p s * r s p r s s * ) R e ( r p p r s p * + r p s r s s * ) R e ( r p p r s p * r p s r s s * ) R e ( r p p r s s * + r p s r s p * ) R e ( r p p r s s * r p s r s p * ) I m ( r p p r s p * + r p s r s s * ) I m ( r p p r s p * r p s r s s * ) I m ( r p p r s s * + r p s r s p * ) I m ( r p p r s s * r p s r s p * )
where rxy (x, y = p, s) represents the amplitude reflection coefficient of x-polarized light induced by the incident y-polarization and r x y is the complex conjugate number of rxy. Re (∙) and Im (∙) show the real and imaginary parts of a complex number, respectively.

2.3. NSC Descriptions of Mueller Matrix Elements

The parameters in the NSC representation are the associated ellipsometry parameters, which can be used to replace the Mueller matrix elements with electric vectors. This makes it possible to analyze the correlation of optical constants and morphological parameters with Mueller matrix elements and explore methods to accurately measure optical constants and deduce the morphologies of rough solid surfaces. The Mueller matrix, ML, of a sample is given by [33]
M L = 1 N α p s C s p + ζ 1 S s p + ζ 2 N α s p 1 α s p α p s C s p + ζ 1 S s p + ζ 2 C p s + ξ 1 C p s + ξ 1 C + β 1 S + β 2 S p s + ξ 2 S p s + ξ 2 S + β 2 C β 1
where
N = ( 1 γ 2 γ s p 2 γ p s 2 ) / D
D = ( 1 + γ 2 + γ s p 2 + γ p s 2 ) = 2 / ( 1 + N )
S = 2 γ sin ( Δ ) / D
C = 2 γ cos ( Δ ) / D
S s p = 2 γ s p sin ( Δ s p ) / D
C s p = 2 γ s p cos ( Δ s p ) / D
S p s = 2 γ p s sin ( Δ p s ) / D
C p s = 2 γ p s cos ( Δ p s ) / D
α s p = 2 γ s p 2 / D
α p s = 2 γ p s 2 / D
β 1 = ( D / 2 ) ( C s p C p s + S s p S p s )
β 2 = ( D / 2 ) ( C s p C p s S s p C p s )
ζ 1 = ( D / 2 ) ( C C p s + S S p s )
ζ 2 = ( D / 2 ) ( C C p s S C p s )
ξ 1 = ( D / 2 ) ( C C s p + S S s p )
ξ 2 = ( D / 2 ) ( C C s p S C s p )
where Δxy and γxy (x, y = p, s) represent the phase difference and the tangent function of the amplitude ratio (ψ) of x-polarized light induced by the incident y-polarization, respectively.
The NSC representation for anisotropic samples requires seven parameters constrained by the following relation [33]:
N 2 + S 2 + C 2 + S p s 2 + C p s 2 + S s p 2 + C s p 2 = 1

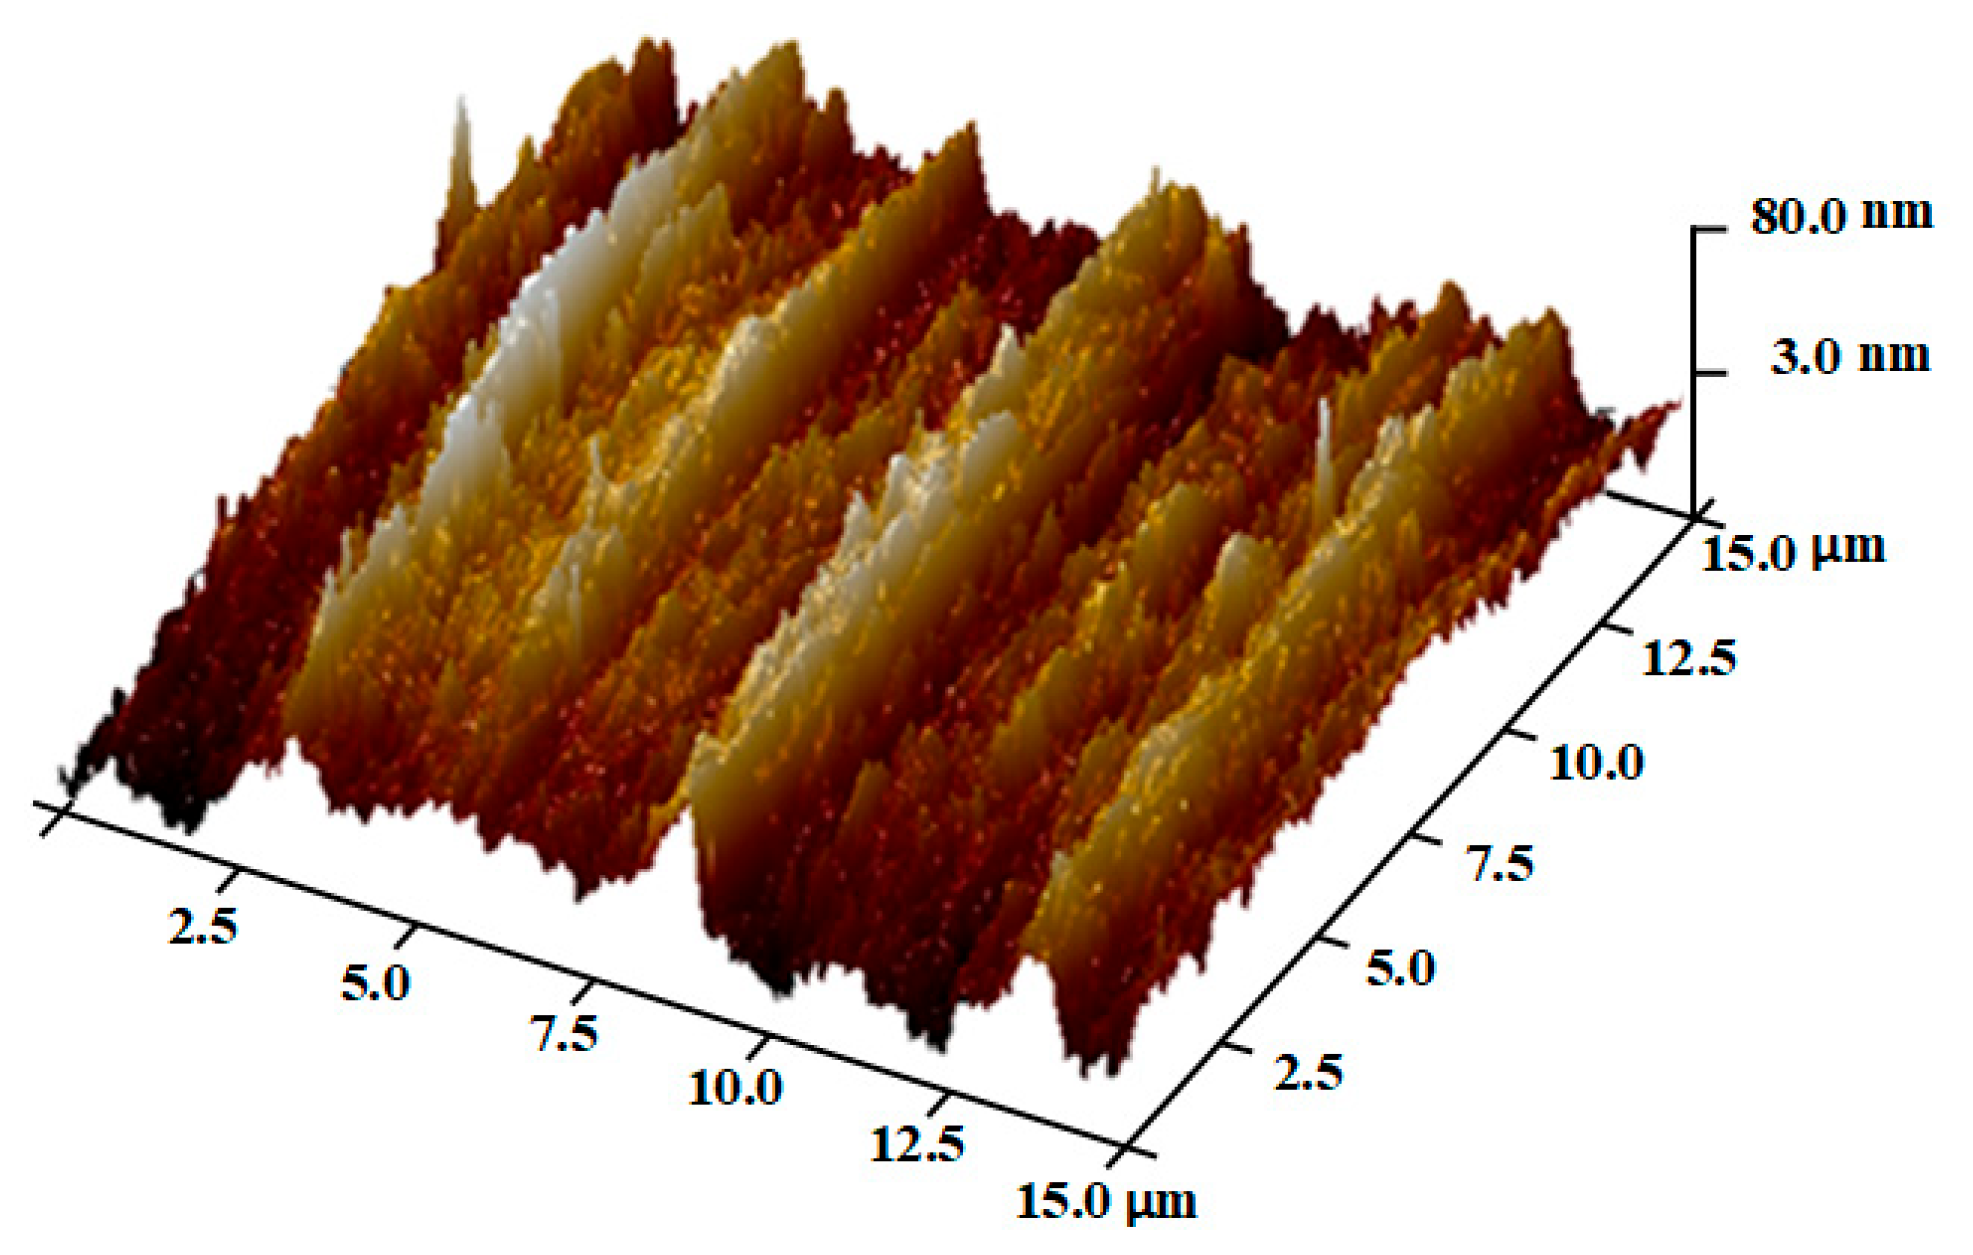
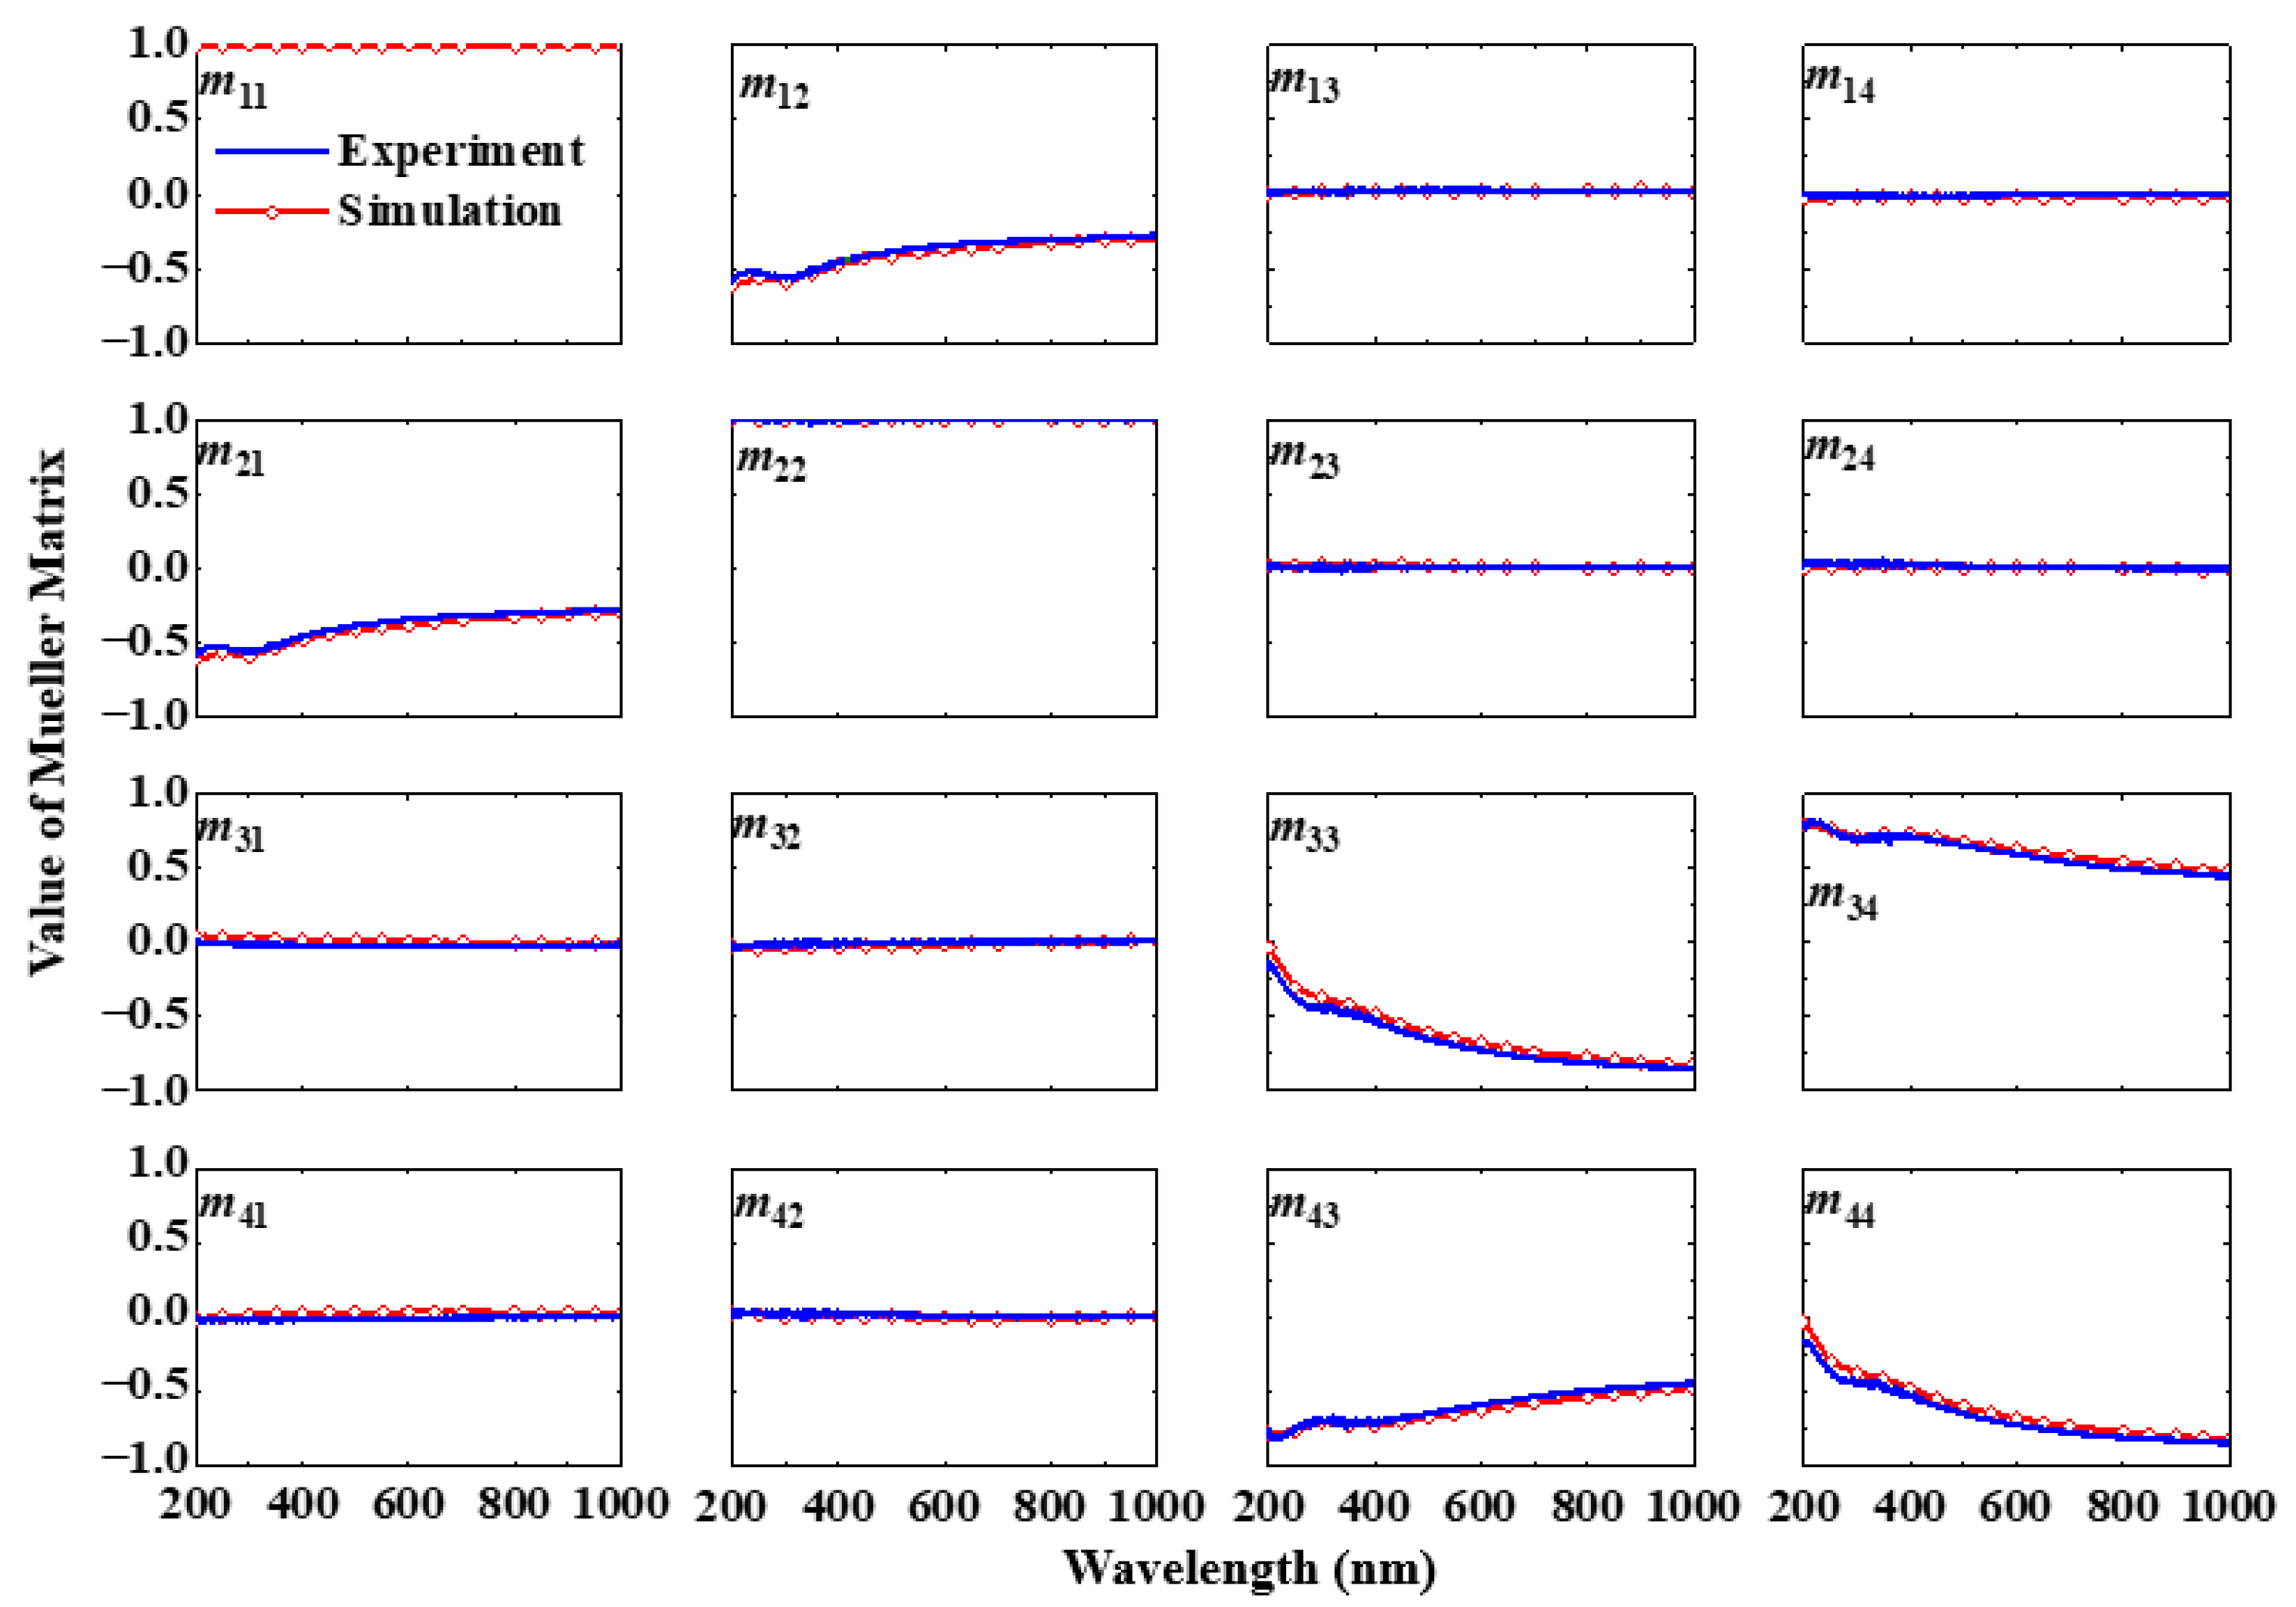
2.4. Experimental Verification of the Simulation Method

We conducted an experimental validation of the simulation method on a nickel alloy rough surface. The surface geometrical morphology was scanned by AFM, as shown in Figure 1, which was obtained from our previous work [11]. More details of the sample can be found in the literature [11].
A commercial MMSE (ME-L, manufactured by Wuhan E-optics Technology Co., Ltd., Wuhan, China) was adopted to measure the Mueller matrix of the sample. The incident wavelength, λ, was in the range of 200 nm ≤ λ ≤ 1000 nm, and the spot diameter was 200 μm. The incident and azimuthal angles were fixed at θ = 55° and φ = 30°, respectively.
The Mueller matrix calculated by simulation is perfectly non-depolarizing, while the experimental Mueller matrix has depolarization effects induced by many factors. In order to perform the experimental verification of the FDTD method, we need to convert the Mueller matrix measured in the experiment to a non-depolarizing one. The following expression can be used for the conversion [34]:
M = M S 1 ρ M D / ρ
where MS, M, and MD represent the experimental, non-depolarizing, and totally depolarizing Mueller matrices, respectively. Here, MD is defined by [34]
M D = 1 0 0 0 0 0 0 0 0 0 0 0 0 0 0 0
The parameter ρ can be solved by the following expressions [34]:
ρ = ( d 2 + e ) 1 / 2 d
e = ( m 22 m 12 m 21 ) / 3
f = ( m 22 m 12 m 21 ) 2 + ( m 13 m 23 ) 2 + ( m 14 m 24 ) 2 + ( m 31 m 32 ) 2 + ( m 41 m 42 ) 2 + ( m 34 m 43 ) 2 + ( m 33 + m 44 ) 2
By associating Equations (23)–(26) with Equation (22), we can obtain the non-depolarizing Mueller matrix from the one measured.
A comparison of the measured and simulated Mueller matrix elements of the actual sample with a rough surface is shown in Figure 2. The results of the measurements and simulations are displayed by green solid lines and pink dotted lines, respectively. The range of the vertical coordinates of all elements is −1 ≤ y ≤ 1. Because the surface of the sample is micro-rough, we can observe that the values of the off-diagonal elements are so small that they are nearly equal to zero. It can be seen that the simulated results agree well with the experimental results, as measured by MMSE.

3. Results and Discussion

3.1. The Relationships Between Optical Constants and Mueller Matrix Elements

This section discusses the variation in the Mueller matrix elements with the optical constants of rough surfaces and compares the Mueller matrix elements of rough surfaces with those of smooth surfaces under varying optical constants.

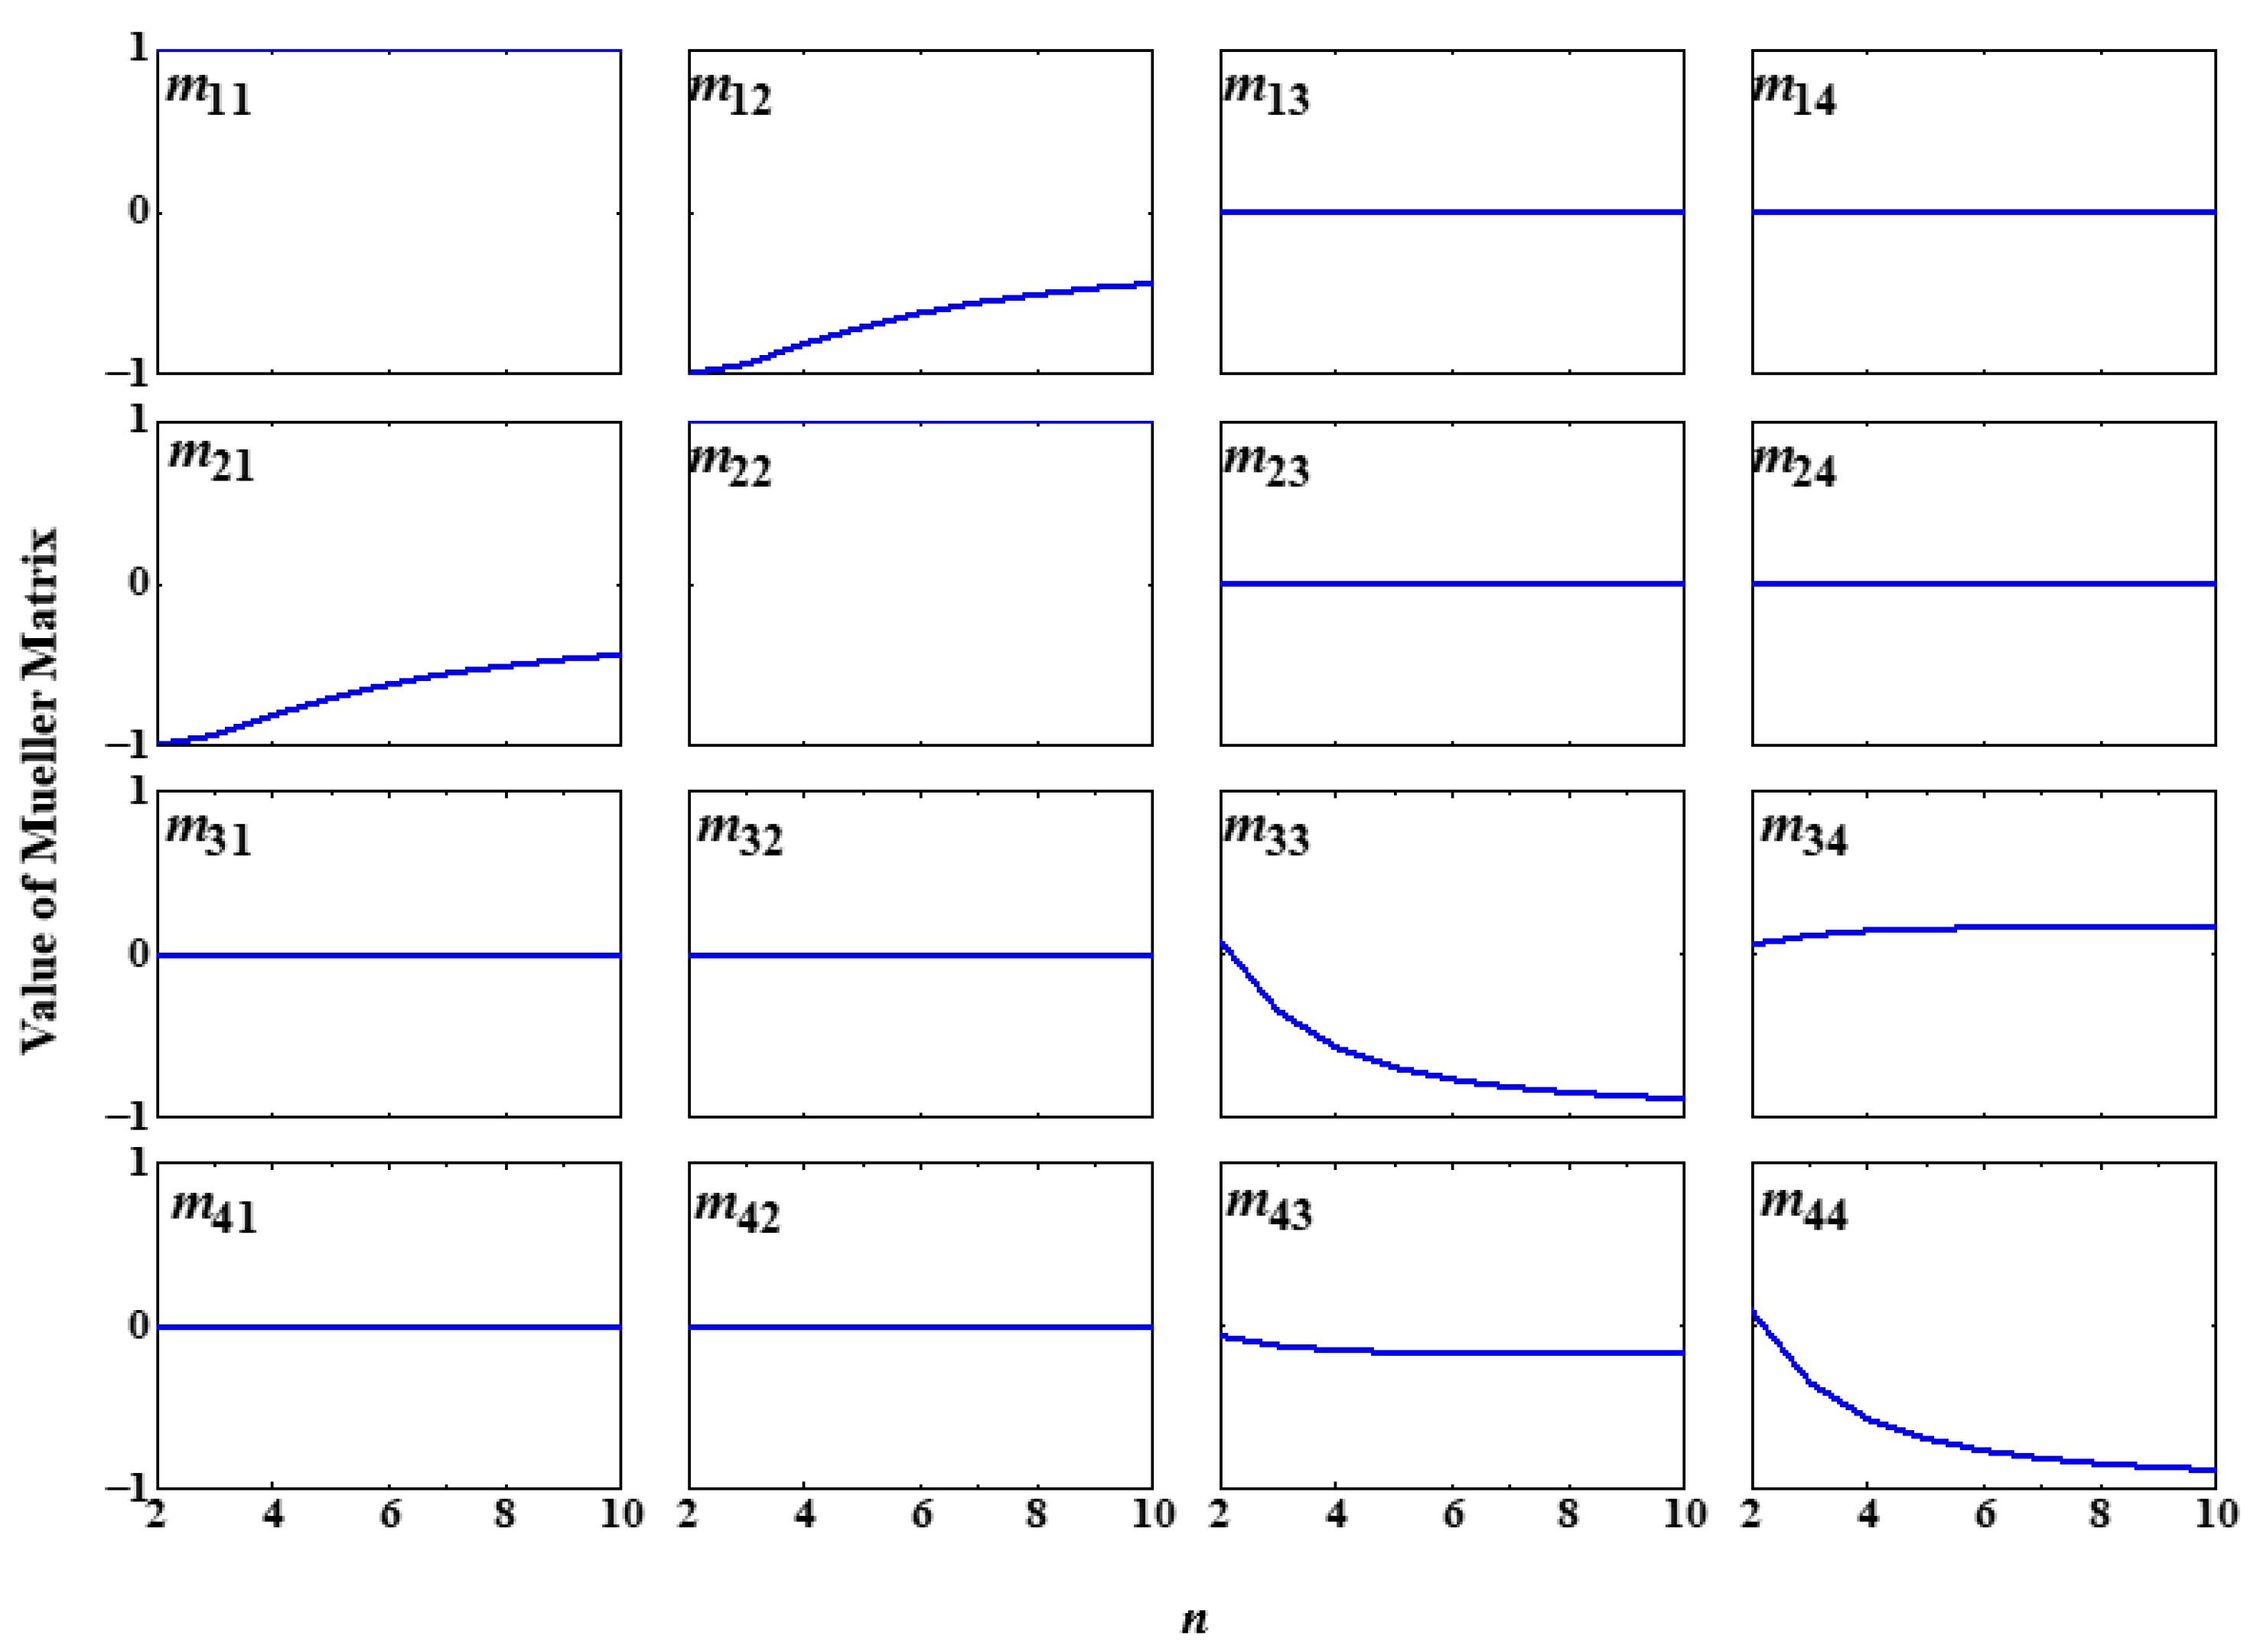
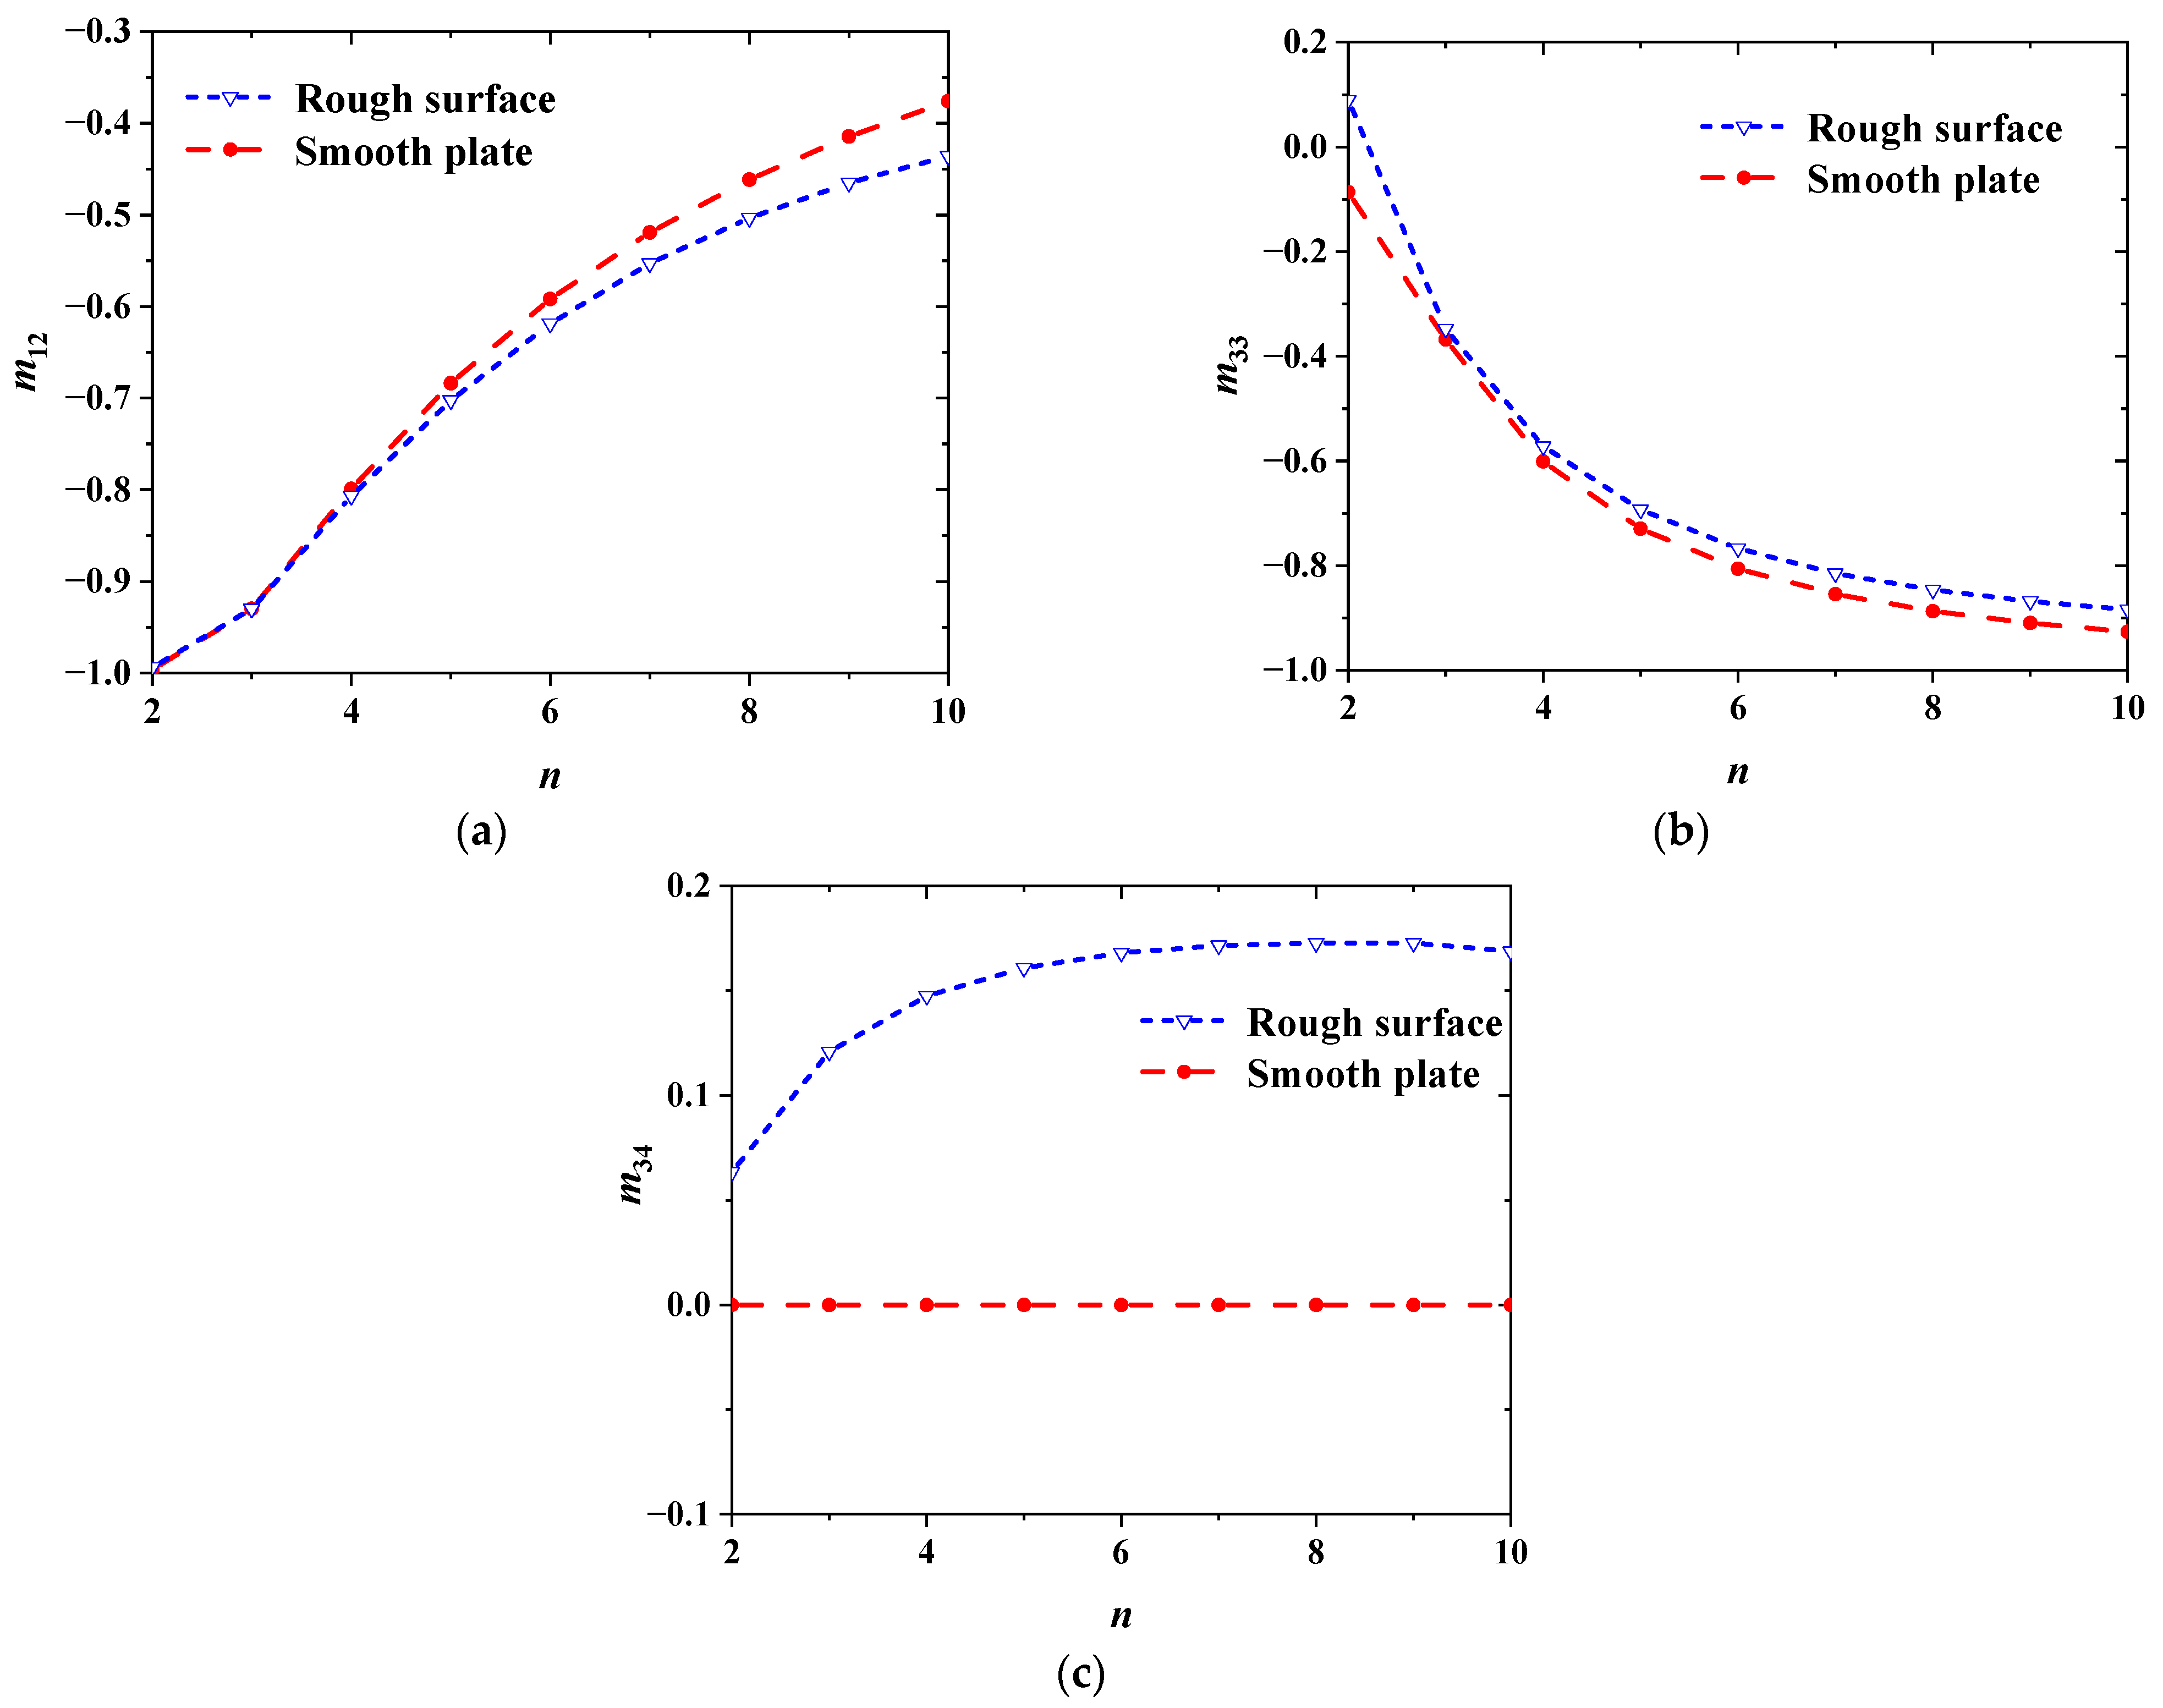
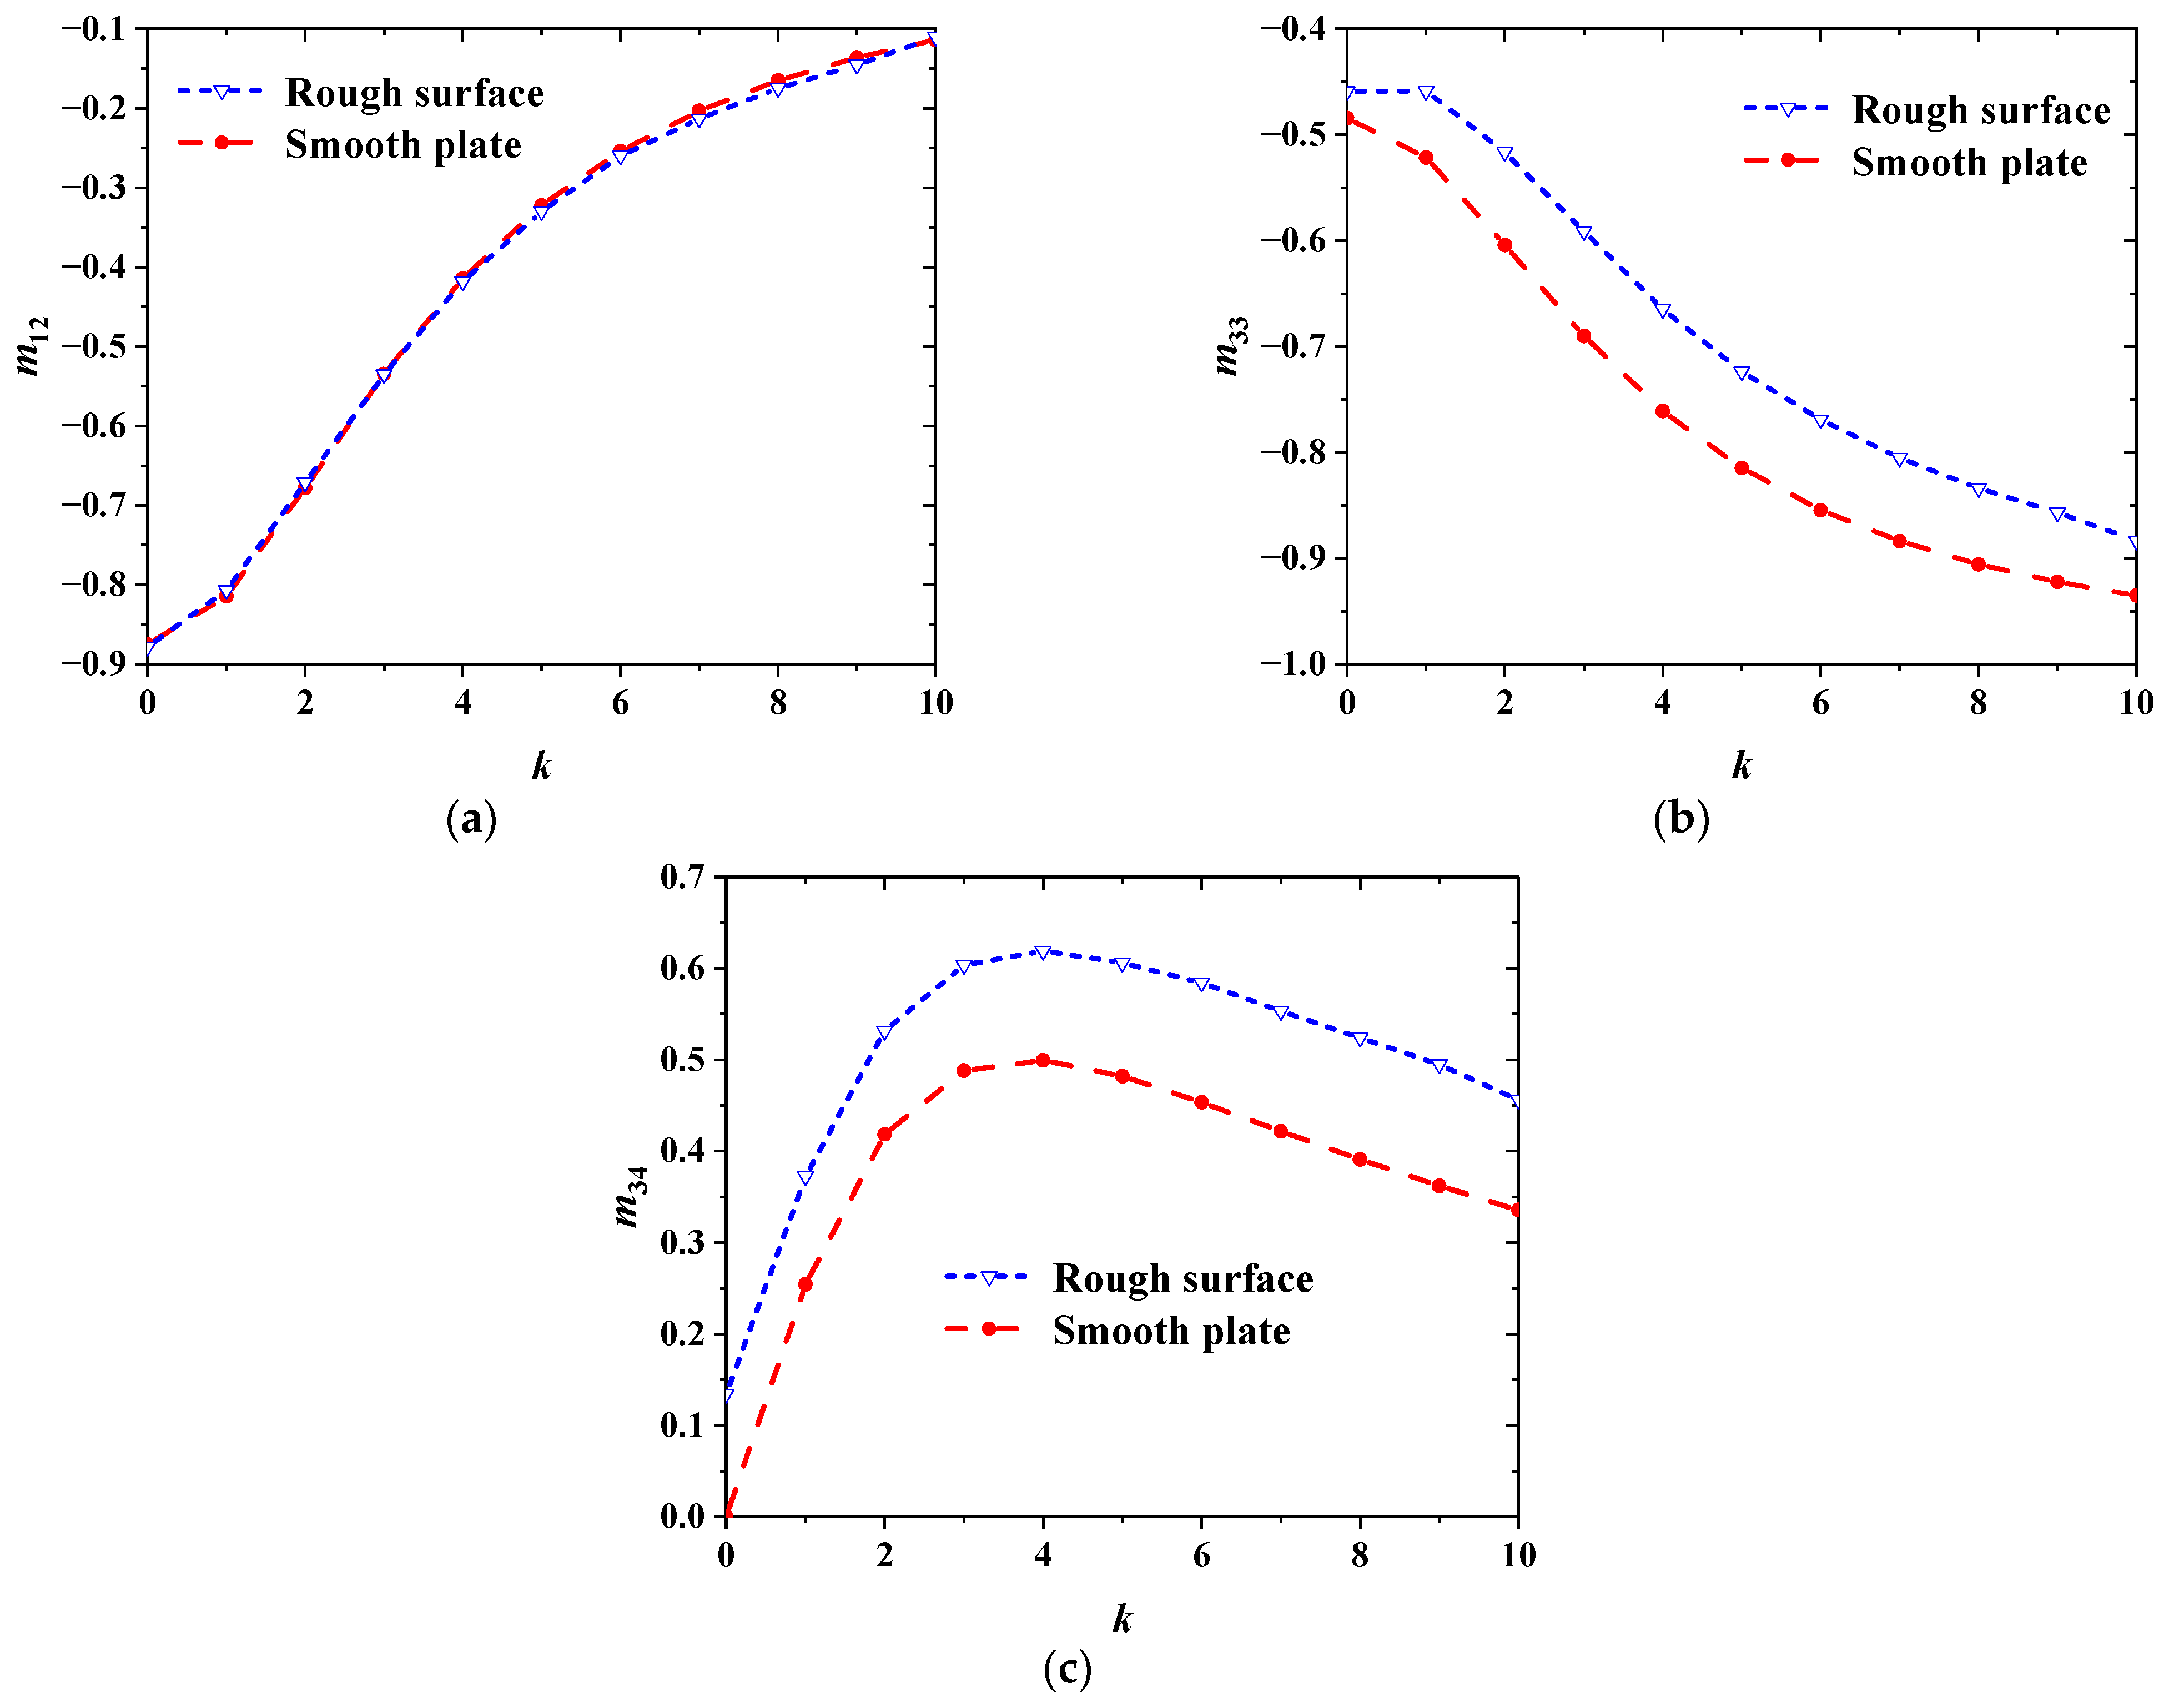
3.1.1. The Relationships Between the Refractive Index and Mueller Matrix Elements

Figure 3 shows the variation in Mueller matrix elements with the refractive index, n, increasing from 2 to 10, while the extinction coefficient, k, remains unchanged at 0. The morphological parameters of randomly rough solid surfaces are as follows: σ = 0.05 μm and τ = 0.1 μm. The wavelength, λ, of the incident light is 6 μm, and the incident angle, θ, is set to 65°. Compared with the main diagonal elements, the values of the off-diagonal elements are so small that they can be neglected. The surfaces that we simulated are randomly micro-rough surfaces (relative roughness σ/λ = 0.0083), and the root mean square (rms) roughness, σ, and correlation length, τ, are much smaller than the wavelength, λ, of the incident light. Therefore, randomly micro-rough surfaces can be considered isotropic, and we can only discuss the main diagonal elements. It can be seen that the values of the Mueller matrix elements m12 and m21 are the same, and both of them increase as n increases from 2 to 10. The values of m34 and m43 are mutually opposite, resulting in inversely related curves. In addition, m33 and m44 are identical. It is worth noting that the values of m22 remain unchanged at 1.
Through the above analysis, we find that not all Mueller matrix elements are independent. Here, we only need to discuss the sensitivities of three elements that are independent of rough surfaces.
Figure 4 illustrates the comparisons of the m12, m33, and m34 elements of rough surfaces and those of smooth plates, whose optical constants are the same as those of rough surfaces. As shown in Figure 4a, the curve correlating with m12 of rough surfaces is coincident with that of smooth plates when n ≤ 4, while the difference between them increases as n increases from 4 to 10. This indicates the Mueller matrix element m12 is not sensitive to rough surfaces until n increases to 4. The specific expression of m12 in the NSC representation in Equation (4) is as follows [24]:
m 12 = N α p s = ( γ 2 + γ s p 2 γ p s 2 1 ) / ( γ 2 + γ s p 2 + γ p s 2 + 1 )
We find that the value of m12 only depends on the amplitude ratios of polarized light. Therefore, the amplitude ratios of polarized light induced by rough surfaces change little until n exceeds 4. Figure 4b shows that the m33 curves of rough surfaces and smooth plates changing with n follow the same trend, and m33 is the least sensitive to rough surfaces within the refractive index range of 3 ≤ n ≤ 4. From Figure 4c, it can be observed that the differences in m34 between the two types of surfaces increase as n increases.

3.1.2. The Relationships Between the Extinction Coefficient and Mueller Matrix Elements

Figure 5 illustrates the variation in Mueller matrix elements with the extinction coefficient, k, increasing from 0 to 10, while the refractive index remains unchanged at n = 3.42. The parameters σ, τ, λ, and θ are all the same as those in Section 3.1.1. It can be seen that the values of m12 and m21 are the same, and they both increase with increasing k. m33 and m44 are the same too. However, m34 and m43 are negatives of each other. It is worth noting that the values of m22 remain unchanged at 1.
Figure 6 depicts the comparisons of the m12, m33, and m34 elements of rough surfaces and those of smooth plates, whose optical constants are the same as those of the rough surfaces. Figure 6a shows the curve correlating with m12 of rough surfaces is perfectly coincident with that of smooth plates. That means that m12 is not sensitive to rough surfaces, and from Equation (27), we know that the amplitude ratios of polarized light induced by rough surfaces remain unchanged as k changes within the studied range. Figure 6b shows that m33 of the Mueller matrix for both randomly rough surfaces and smooth surfaces gradually decreases with increasing extinction coefficient, k. Notably, the decreasing rates of m33 for these two surface types are nearly identical, resulting in a nearly constant difference between their m33 values as k increases from 4 to 10. Figure 6c shows that the difference between m34 of the Mueller matrix for randomly rough surfaces and smooth surfaces remains nearly constant as k increases from 4 to 10.

3.2. The Relationships Between Morphological Parameters and Mueller Matrix Elements

This section discusses the effects of morphological parameters on the Mueller matrix elements of randomly rough solid surfaces and the effects of extinction coefficients on the trend of Mueller matrix elements changing with morphological parameters.

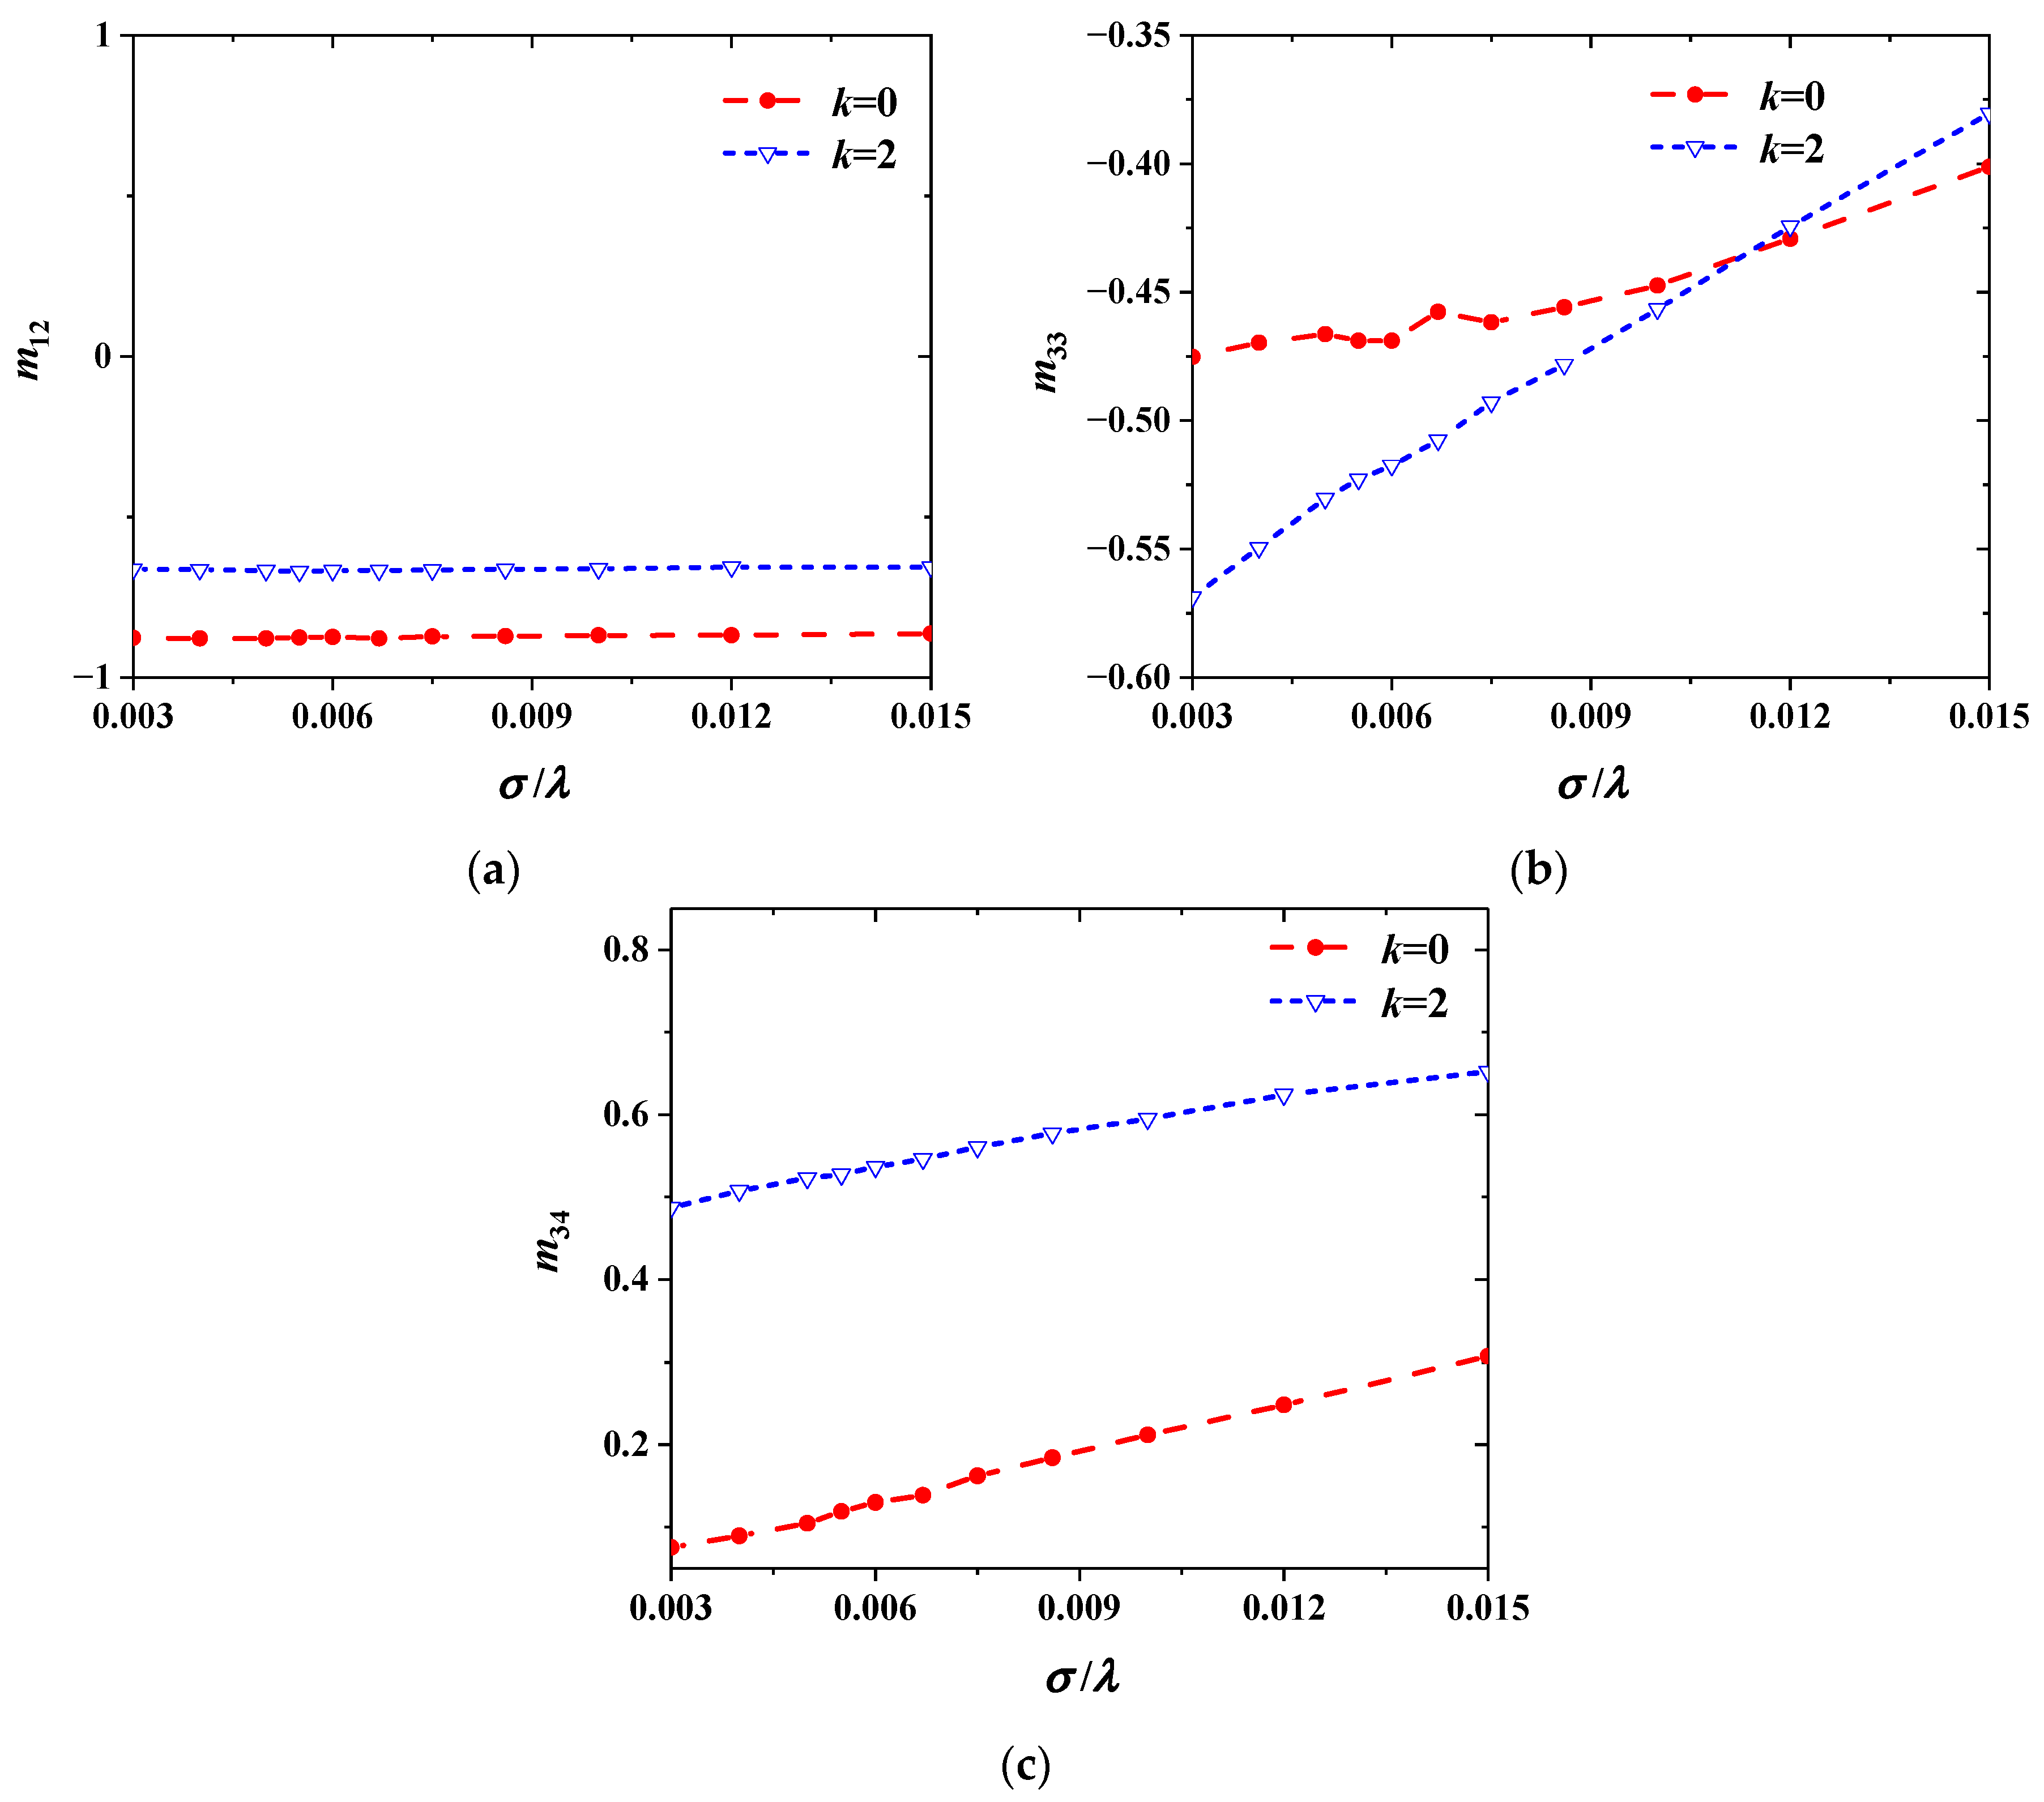
3.2.1. The Relationships Between Relative Roughness and Mueller Matrix Elements

Relative roughness, σ/λ, is usually used to describe the degree of roughness of solid surfaces. Figure 7 shows the Mueller matrix elements changing with σ/λ. The morphological parameters and optical constants of randomly rough solid surfaces are as follows: σ = 0.06 μm, τ = 0.08 μm, n = 3.42, and k = 2. An incident angle, θ, of 65° is selected, and the incident wavelength range is 4 μm ≤ λ ≤ 20 μm. Studying all the Mueller matrix elements, it is obvious that the curve of each element varying with σ/λ is approximately linear. The values of m12 and m21 are the same, and both of them remain unchanged as σ/λ increases. The specific expression of m21 in the NSC representation in Equation (4) is as follows:
m 21 = N α s p = ( γ 2 γ s p 2 + γ p s 2 1 ) / ( γ 2 + γ s p 2 + γ p s 2 + 1 )
By combining this with Equation (27), we see that m12 and m21 are only influenced by the amplitude ratios of polarized light. That is to say, the effect of relative roughness on the amplitude ratios is negligible. In addition, the values of m33 and m44 are also identical, and both of them increase linearly as σ/λ increases. m34 and m43 are the negative of each other, and m34 increases linearly with σ/λ, while m43 decreases correspondingly. m22 remains unchanged at 1.
The extinction coefficient is set to k = 0, while the other parameters remain unchanged, as shown in Figure 7. Figure 8 shows the variation in the Mueller matrix elements with σ/λ for two material types. An extinction coefficient, k, of 0 is selected, and the other parameters remain unchanged, as shown in Figure 7. A comparison of two kinds of materials’ Mueller matrix elements changing with σ/λ is shown in Figure 8. It can be seen from Figure 8a that the m12 element of both rough surfaces remains constant as σ/λ increases. This indicates that the effect of relative roughness on amplitude ratios is unrelated to the material composition of the surfaces. As shown in Figure 8b, the m33 element of surfaces with different extinction coefficients increases linearly with σ/λ, and the slopes of the curves depend on k. Hence, the dependence of m33 on σ/λ is related to the intrinsic properties of the materials. Figure 8c shows that the m34 element of randomly rough surfaces with a k value of 0 and 2 increases linearly with σ/λ, and the slopes of the two curves are identical. This implies that the effect of σ/λ on m34 is independent of the extinction coefficient, k, of rough surfaces, which can be used to deduce the root mean square roughness (rms), σ, of randomly rough surfaces. Combining this with Equation (4), we can obtain the following expression:
( S + β 2 ) σ / λ
Therefore, the σ of rough surfaces may be deduced by m34, which can be measured by an ellipsometer.

3.2.2. The Relationships Between Correlation Length and Mueller Matrix Elements

The lateral dimension of randomly rough surfaces is characterized by the correlation length, τ, while the ratio of rms roughness to correlation length, σ/τ, is typically used in practice. Figure 9 shows that the Mueller matrix elements of rough surfaces change as σ/τ increases from 0.125 to 0.75. Here, σ is fixed at 0.05 μm, with only τ varying. An incident angle θ = 65°, an incident wavelength λ = 4 μm, and an extinction coefficient k = 0 are selected, and the refractive index, n, is the same as that of silicon. For m22, m33, m34, m43, and m44, Figure 9 exhibits the same trend as Figure 7. It is clear that the values of m12 and m21 are the same, and both of them remain unchanged as σ/τ increases. Combining this with Equations (27) and (28), we conclude that the effect of the correlation length on amplitude ratios is also negligible.
Extinction coefficients of k = 0, k = 2 and k = 4 are selected, with the other parameters remaining unchanged, as shown in Figure 9. Figure 10 shows the variation in the Mueller matrix elements of three material types with σ/τ. From Figure 10a, we can conclude that the effect of rough surfaces’ morphologies on amplitude ratios is minimal and material-independent. As shown in Figure 10b, the m33 element of rough surfaces increases linearly with σ/τ for k = 2 and k = 4, and the slopes of these curves are identical but differ from those of surfaces with k = 0. Therefore, the presence or absence of absorptivity in the material will affect the relationship between m33 and σ/τ. Figure 10c shows that m34 increases linearly with σ/τ for randomly rough surfaces with k = 0, 2, and 4, exhibiting identical slopes. This demonstrates that the relationship between m34 and σ/τ is independent of k. Combining this with Figure 6c, we observe that the effects of σ/τ on m34 are independent of k within an extinction coefficient range of 0 ≤ k ≤10. This can be used to deduce the correlation length, τ, of randomly rough surfaces. By combining this with Equation (4), we derive the following expression:
( S + β 2 ) σ / λ
Therefore, the τ of rough surfaces may be deduced by m34, which can be measured by an ellipsometer.

4. Conclusions

In this work, the electromagnetic responses of randomly micro-rough solid surfaces changing with optical constants and morphological parameters are simulated by the FDTD method, and the reflection coefficients of the surfaces with incident light in the p and s directions are obtained. Then, the Mueller matrix is calculated in the form of a Jones–Mueller matrix conversion. The simulation method is validated with the experimental results, which are measured by MMSE. The Mueller matrix of micro-rough surfaces has three independent elements, and the effects of optical constants and morphological parameters on them are specifically investigated. We find that the Mueller matrix element m12 is insensitive to rough surface morphologies when the optical constants lie within the ranges 0 ≤ n ≤ 4 and 0 ≤ k ≤ 10. There may exist a functional relationship between the optical constants of such surfaces and m12, suggesting m12’s potential value for inverting optical constants. The morphological parameters σ/λ and σ/τ are proportional to the Mueller matrix element m34, and the expressions (S + β2) ∝ σ/λ and (S + β2) ∝ σ/τ can be obtained within morphological parameter ranges of 0.003 ≤ σ/λ ≤ 0.015 and 0.125 ≤ σ/τ ≤ 0.75. And the ratio (sensitiveness to rough surfaces) does not change with k, so m34 has the potential to predict the morphologies of rough solid surfaces. The Mueller matrix element m33 can be regarded as a function of several variables, including n, k, σ, and τ, which is more complicated, requiring further in-depth research.
In summary, exploring the correlation of optical constants and morphological parameters with Mueller matrix elements for randomly rough surfaces is a complex process. This study lays the foundation for developing a new method to invert the optical constants and morphologies of rough surfaces with a Mueller matrix.

Author Contributions

Conceptualization, M.H.; methodology, M.H.; software, M.H.; validation, F.J.; formal analysis, M.H.; investigation, M.H.; resources, F.J.; data curation, M.H.; writing—original draft preparation, M.H.; writing—review and editing, F.J.; visualization, M.H.; supervision, F.J.; funding acquisition, F.J. All authors have read and agreed to the published version of the manuscript.

Funding

This work was funded by the National Natural Science Foundation of China under grant number 62205334.

Institutional Review Board Statement

Not applicable.

Informed Consent Statement

Not applicable.

Data Availability Statement

The data presented in this study are available on request from the corresponding author.

Acknowledgments

We would like to thank Jun Qiu from the Harbin Institute of Technology for guidance on simulation and experimental methods.

Conflicts of Interest

The authors declare no conflicts of interest.

References

  1. Qiu, J.; Ran, D.F.; Liu, Y.B.; Liu, L.H. Investigation of ellipsometric parameters of 2D microrough surfaces by FDTD. Appl. Opt. 2016, 55, 5423–5431. [Google Scholar] [CrossRef] [PubMed]
  2. Nee, S.F. Polarization of specular reflection and near-specular scattering by a rough surface. Appl. Opt. 1996, 35, 3570–3582. [Google Scholar] [CrossRef] [PubMed]
  3. Bruce, N.C.; Sant, A.J.; Dainty, J.C. The Mueller matrix for rough surface scattering using the Kirchhoff approximation. Opt. Commun. 1992, 88, 471–484. [Google Scholar] [CrossRef]
  4. Song, B.; Cao, C.; Feng, Z.; Wu, Z.; Yu, C.; Wei, R. Investigation polarimetric scattering of light from the randomly rough surface based on the calculation of the Mueller matrix. Opt. Express. 2023, 31, 24796–24809. [Google Scholar] [CrossRef]
  5. Jiang, Y.X.; Li, Z. Mueller matrix of laser scattering by a two-dimensional randomly rough surface. J. Quant. Spectrosc. Radiat. Transf. 2022, 287, 108225. [Google Scholar] [CrossRef]
  6. Bian, S.; Cui, C.; Arteaga, O. Quantitative characterization of roughness and polarization on very rough surfaces using spectroscopic ellipsometry. Measurement 2025, 251, 117173. [Google Scholar] [CrossRef]
  7. Goto, D.; Hijikata, Y.; Yagi, S.; Yaguchi, H. Differences in SiC thermal oxidation process between crystalline surface orientations observed by in-situ spectroscopic ellipsometry. J. Appl. Phys. 2015, 117, 095306. [Google Scholar] [CrossRef]
  8. Nee, S.F.; Bennett, H.E. Quantitative characterization of rough Si02 surfaces by infrared ellipsometry. Curr. Dev. Opt. Eng. II SPIE 1987, 818, 34–45. [Google Scholar]
  9. Ohlídal, I.; Franta, D.; Nečas, D. Improved combination of scalar diffraction theory and Rayleigh–Rice theory and its application to spectroscopic ellipsometry of randomly rough surfaces. Thin Solid Films 2014, 571, 695–700. [Google Scholar] [CrossRef]
  10. Serényi, M.; Lohner, T.; Petrik, P.; Zolnai, Z.; Horváth, Z.E.; Khánh, N.Q. Characterization of sputtered and annealed niobium oxide films using spectroscopic ellipsometry, Rutherford backscattering spectrometry and X-ray diffraction. Thin Solid Films 2008, 516, 8096–8100. [Google Scholar] [CrossRef]
  11. Huang, M.J.; Guo, L.; Jiang, F.Y. Regime Map of the Effective Medium Approximation Modelling of Micro-Rough Surfaces in Ellipsometry. Sensors 2024, 24, 1242. [Google Scholar] [CrossRef] [PubMed]
  12. Fujiwara, H.; Koh, J.; Rovira, P.I.; Collins, R.W. Assessment of effective-medium theories in the analysis of nucleation and microscopic surface roughness evolution for semiconductor thin films. Phys. Rev. B 2000, 61, 10832. [Google Scholar] [CrossRef]
  13. Kim, T.J.; Ghong, T.H.; Kim, Y.D.; Aspnes, D.E.; Klein, M.V.; Ko, D.S.; Kim, Y.W.; Elarde, V.C.; Coleman, J.J. Investigation of effective-medium approximation, alloy, average-composition, and graded-composition models for interface analysis by spectroscopic ellipsometry. J. Appl. Phys. 2007, 102, 2328. [Google Scholar] [CrossRef]
  14. Liu, Y.B.; Qiu, J.; Liu, L.H. Applicability of the effective medium approximation in the ellipsometry of randomly micro-rough solid surfaces. Opt. Express 2018, 26, 16560–16571. [Google Scholar] [CrossRef]
  15. Liu, Y.B.; Qiu, J.; Liu, L.; Cao, B.Y. Extracting optical constants of solid materials with micro-rough surfaces from ellipsometry without using effective medium approximation. Opt. Express 2019, 27, 17667–17680. [Google Scholar] [CrossRef]
  16. He, S.; Hua, M.; Zhang, Y.; Du, X.; Zhang, F. Forward modeling of scattering centers from coated target on rough ground for remote sensing target recognition applications. IEEE Trans. Geos. Remote Sens. 2023, 62, 1–17. [Google Scholar] [CrossRef]
  17. Chen, J.; Quan, W.; Cui, T.; Song, Q.; Lin, C. Remote sensing of absorption and scattering coefficient using neural network model, development, validation, and application. Remote Sens. Environ. 2014, 149, 213–226. [Google Scholar] [CrossRef]
  18. Wang, S.; Xue, L.; Yan, K. Numerical calculation of light scattering from metal and dielectric randomly rough Gaussian surfaces using microfacet slope probability density function based method. J. Quant. Spectrosc. Radiat. Transf. 2017, 196, 183–200. [Google Scholar] [CrossRef]
  19. Liang, Y.; Guo, L.X.; Wu, Z.S. The fast EPILE combined with FBM for electromagnetic scattering from dielectric targets above and below the dielectric rough surface. IEEE Trans. Geos. Remote Sens. 2011, 49, 3892–3905. [Google Scholar] [CrossRef]
  20. Aghababaee, H.; Sahebi, M.R. Incoherent target scattering decomposition of polarimetric SAR data based on vector model roll-invariant parameters. IEEE Trans. Geos. Remote Sens. 2016, 54, 4392–4401. [Google Scholar] [CrossRef]
  21. Comite, D.; Ahmad, F.; Amin, M.G.; Dogaru, T. Detection of low-signature targets in rough surface terrain for forward-looking ground penetrating radar imaging. In Proceedings of the 49th Asilomar Conference on Signals, Systems and Computers, Pacific Grove, CA, USA, 8–11 November 2015; pp. 80–84. [Google Scholar]
  22. Liu, S.; Du, W.; Chen, X.; Jiang, H.; Zhang, C.W. Mueller matrix imaging ellipsometry for nanostructure metrology. Opt. Express 2015, 23, 17316–17329. [Google Scholar] [CrossRef] [PubMed]
  23. Guo, Y.H.; Zeng, N.; He, H.H.; Yun, T.L.; Du, E.; Liao, R.; He, Y.H.; Ma, H. A study on forward scattering Mueller matrix decomposition in anisotropic medium. Opt. Express 2013, 21, 18361–18370. [Google Scholar] [CrossRef] [PubMed]
  24. Collins, R.W.; An, I.; Fujiwara, H.; Lee, J.; Lu, Y.; Koh, J.; Rovira, P.I. Advances in multichannel spectroscopic ellipsometry. Thin Solid Films 1998, 313, 18–32. [Google Scholar] [CrossRef]
  25. Shu, J.; Lai, J.; Wang, C.; Bian, B.; Li, Z. Describing the depolarization characteristic of rough surface by M11/M00 of Mueller matrix. In Proceedings of the International Conference on Optical Instruments and Technology, Advanced Sensor Technologies and Applications, Shanghai, China, 19–21 October 2009; Volume 7508, pp. 193–199. [Google Scholar]
  26. Bergström, D.; Powell, J.; Kaplan, A.F.H. A ray-tracing analysis of the absorption of light by smooth and rough metal surfaces. J. Appl. Phys. 2007, 101, 113504. [Google Scholar] [CrossRef]
  27. Sylvain, M. Diffuse reflection by rough surfaces: An introduction. C. R. Phys. 2005, 6, 663–674. [Google Scholar] [CrossRef]
  28. Sullivan, D.M. Electromagnetic Simulation Using the FDTD Method; John Wiley & Sons: Hoboken, NJ, USA, 2013. [Google Scholar]
  29. Taflove, A.; Hagness, S. Computational Electrodynamics. In The Finite-Difference Time-Domain Method; Artech House: Boston, MA, USA, 2005. [Google Scholar]
  30. Stover, J.C. Optical Scattering, Measurement and Analysis, 2nd ed.; SPIE Press: Washington, USA, 1995. [Google Scholar]
  31. Fujiwara, H. Spectroscopic Ellipsometry, Principles and Applications; John Wiley & Sons: Hoboken, NJ, USA, 2007. [Google Scholar]
  32. Azzam, R.M.A.; Bashara, N.M.; Ballard, S.S. Ellipsometry and Polarized Light; Springer: Berlin/Heidelberg, Germany, 1978. [Google Scholar]
  33. Jellison, G.E. Data analysis for spectroscopic ellipsometry. In Handbook of Ellipsometry; Springer: Berlin/Heidelberg, Germany, 2005; pp. 237–296. [Google Scholar]
  34. Chen, C.; An, I.; Ferreira, G.M.; Podraza, N.J.; Zapien, J.A.; Collins, R.W. Multichannel Mueller matrix ellipsometer based on the dual rotating compensator principle. Thin Solid Films 2004, 455, 14–23. [Google Scholar] [CrossRef]
Figure 1. Morphology of the nickel alloy rough surface scanned by AFM, which was obtained from the literature [11].
Applsci 15 06149 g001
Figure 2. Comparison of the measured and simulated Mueller matrices of the sample. The wavelengths vary from 200 nm to 1000 nm. The incident and azimuthal angles are fixed at θ = 55° and φ = 30°, respectively.
Applsci 15 06149 g002
Figure 3. The Mueller matrix of randomly rough surfaces as a function of the refractive index. The extinction coefficient remains unchanged at k = 0 and the morphological parameters are as follows: σ = 0.05 μm and τ = 0.1 μm. The incident wavelength and angle are fixed at λ = 6 μm and θ = 65°, respectively.
Applsci 15 06149 g003
Figure 4. Comparison of the independent Mueller matrix element (a) m12; (b) m33; (c) m34 of rough surfaces and smooth plates as a function of the refractive index.
Applsci 15 06149 g004
Figure 5. The Mueller matrix of randomly rough surfaces as a function of the extinction coefficient. The refractive index remains unchanged at n = 3.42, and the morphological parameters are as follows: σ = 0.05 μm and τ = 0.1 μm. The incident wavelength and angle are fixed at λ = 6 μm and θ = 65°, respectively.
Applsci 15 06149 g005
Figure 6. Comparison of the independent Mueller matrix element (a) m12; (b) m33; (c) m34 of rough surfaces and smooth plates as a function of the extinction coefficient.
Applsci 15 06149 g006
Figure 7. The Mueller matrix of randomly rough surfaces as a function of the relative roughness, σ/λ. The rms roughness remains unchanged at σ = 0.06 μm, and the wavelengths are varied from 4 μm to 20 μm. The optical constants are as follows: n = 3.42 and k = 2. The correlation length and incident angle are fixed at τ = 0.08 μm and θ= 65°, respectively.
Applsci 15 06149 g007
Figure 8. The independent Mueller matrix element (a) m12; (b) m33; (c) m34 of randomly rough surfaces as a function of the relative roughness, σ/λ, at different extinction coefficients, k.
Applsci 15 06149 g008
Figure 9. The Mueller matrix of randomly rough surfaces as a function of the ratio of rms roughness to correlation length σ/τ. The rms roughness remains unchanged at σ = 0.05 μm, and the correlation length, τ, is varied from 0.067 μm to 0.4 μm. An extinction coefficient k = 0 is selected, and the refractive index, n, is the same as that of silicon. The incident wavelength and angle are fixed at λ = 4 μm and θ = 65°, respectively.
Applsci 15 06149 g009
Figure 10. The independent Mueller matrix elements (a) m12; (b) m33; (c) m34 of randomly rough surfaces as a function of the ratio of rms roughness to correlation length, σ/τ, at different extinction coefficients, k.
Applsci 15 06149 g010
Disclaimer/Publisher’s Note: The statements, opinions and data contained in all publications are solely those of the individual author(s) and contributor(s) and not of MDPI and/or the editor(s). MDPI and/or the editor(s) disclaim responsibility for any injury to people or property resulting from any ideas, methods, instructions or products referred to in the content.

