
Analysis of Selected Methods of Computer-Aided Design for Stage Structures


Abstract
1. Problem Description
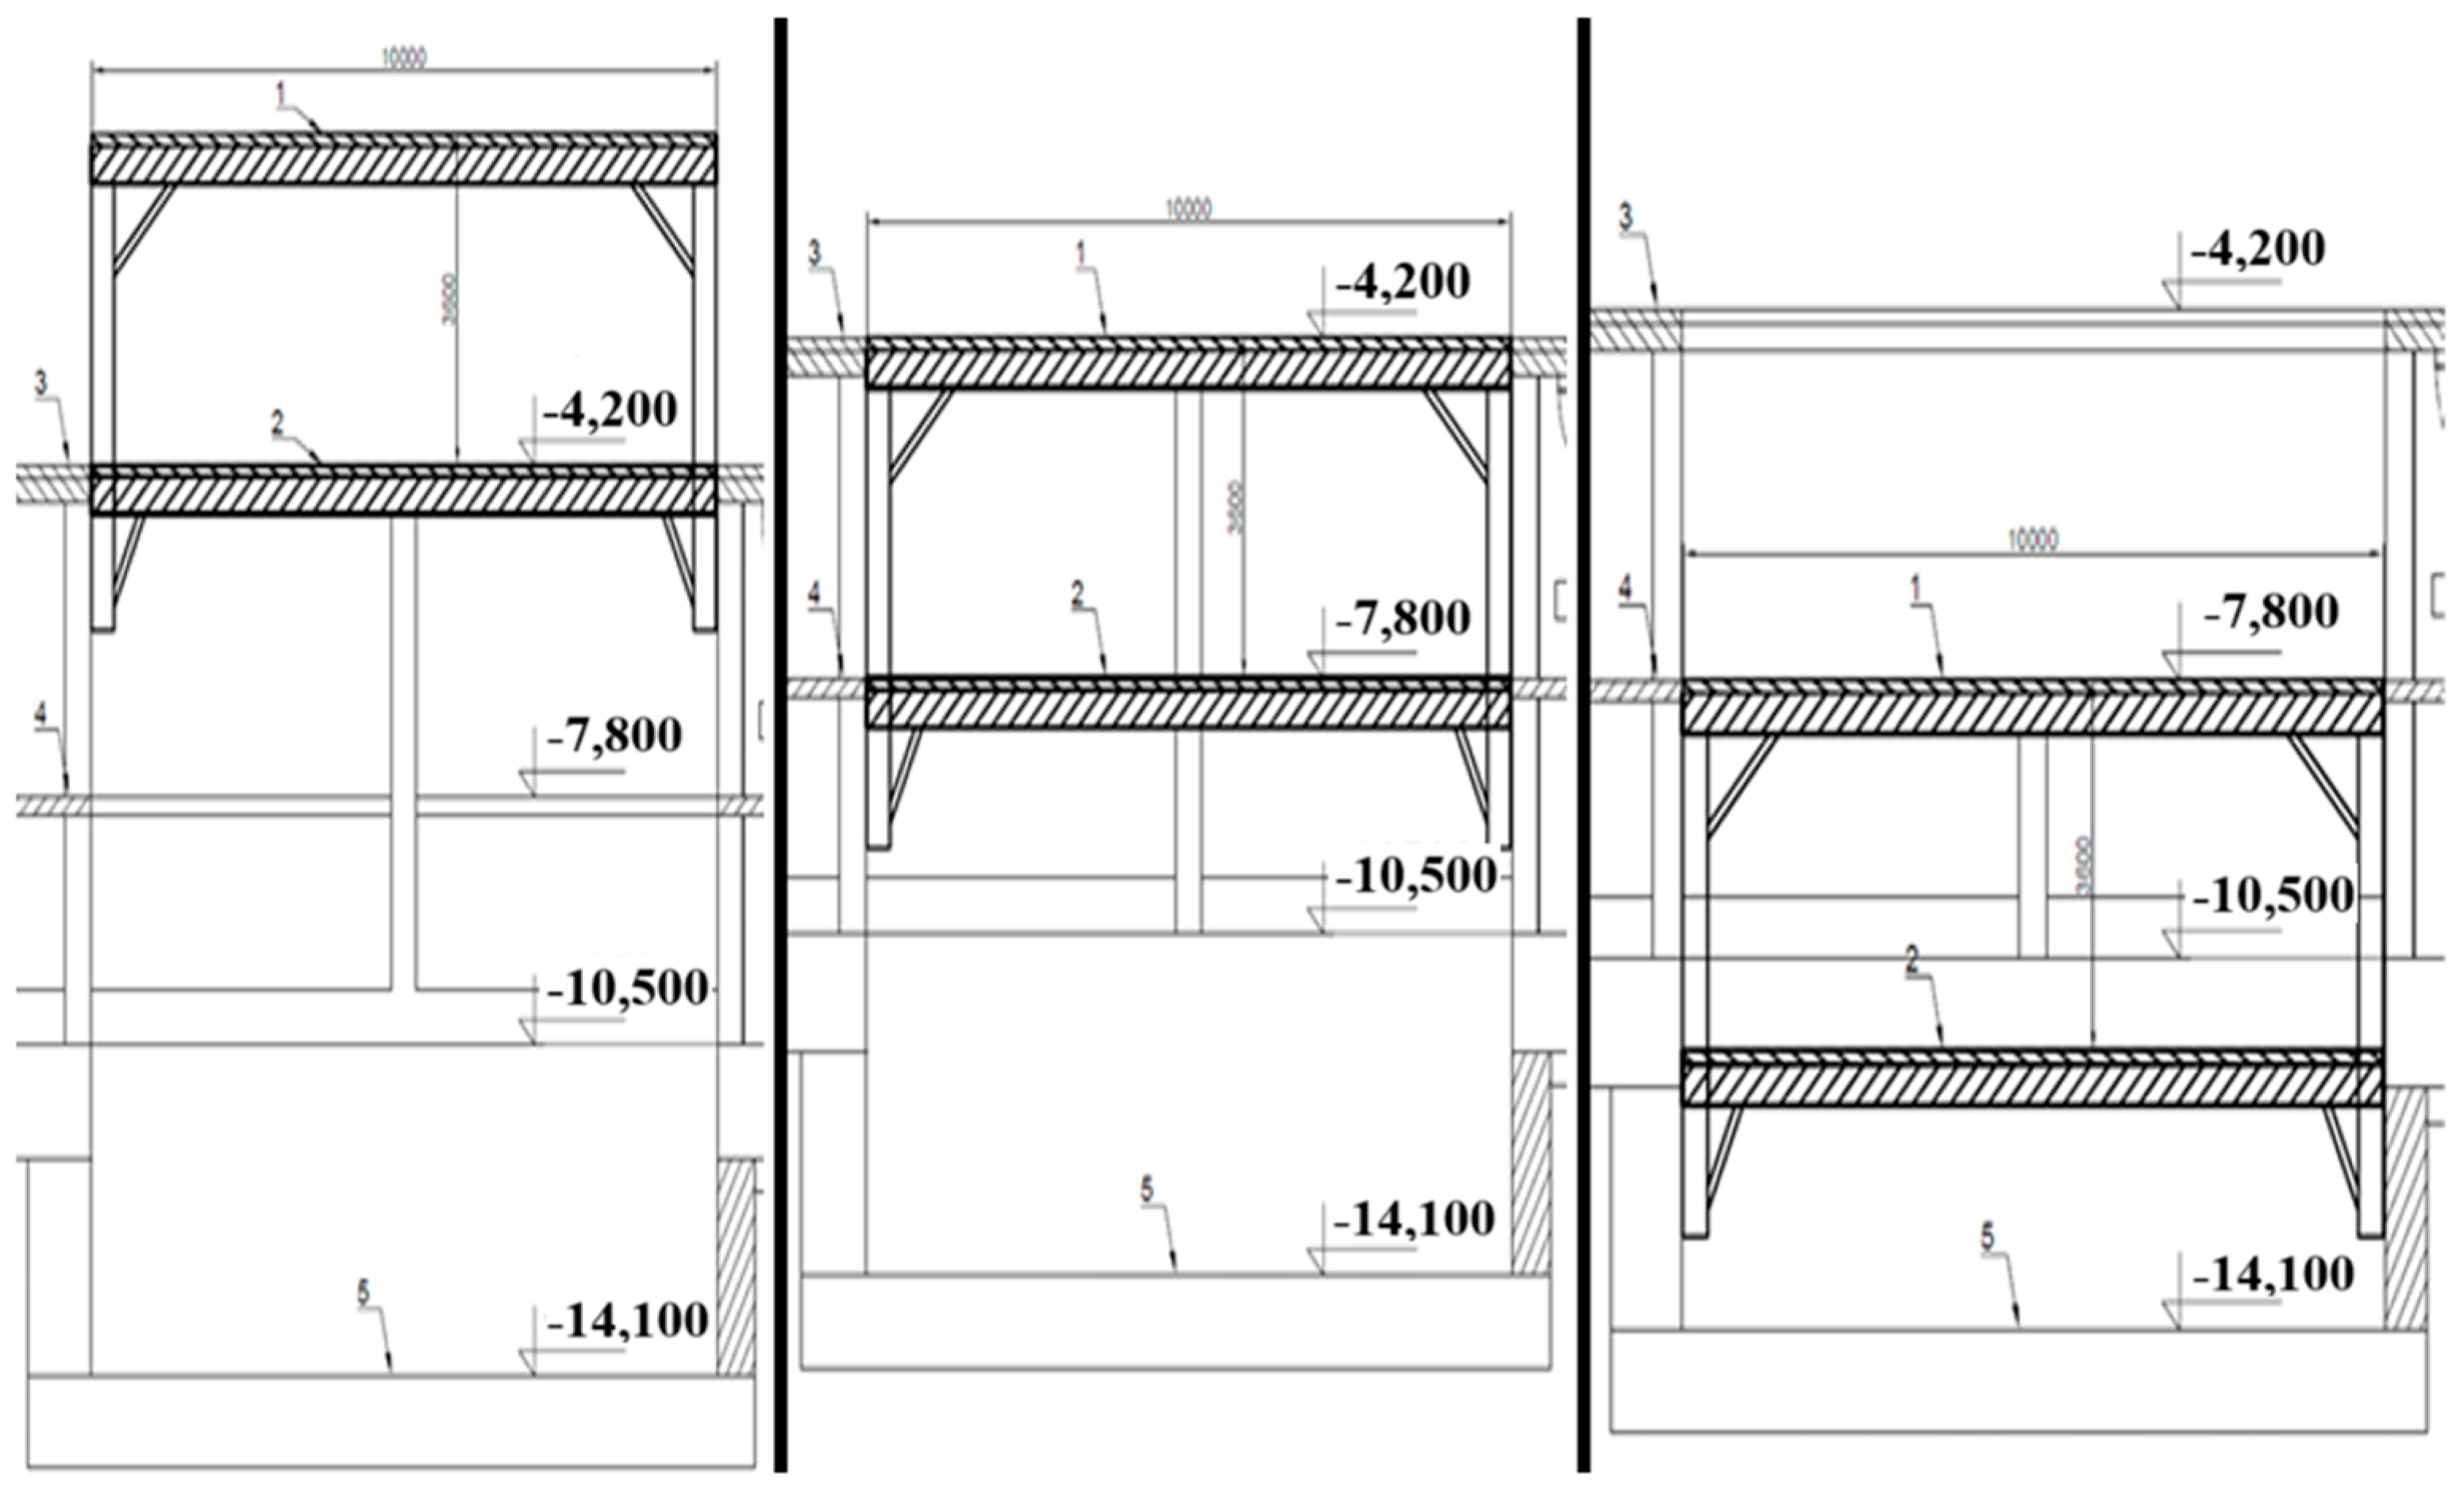
2. Construction Project
- (a)
- platform dimensions: 3.0 × 10.0 m (two-level construction adjusted to the opening in the scene),
- (b)
- distance between platforms: 3.6 m,
- (c)
- load capacity of the platform: 500 kg/m2,
- (d)
- load-bearing capacity: 250 kg/m2,
- (e)
- support: crane rails,
- (f)
- lifting height: 7.2 m.
- (g)
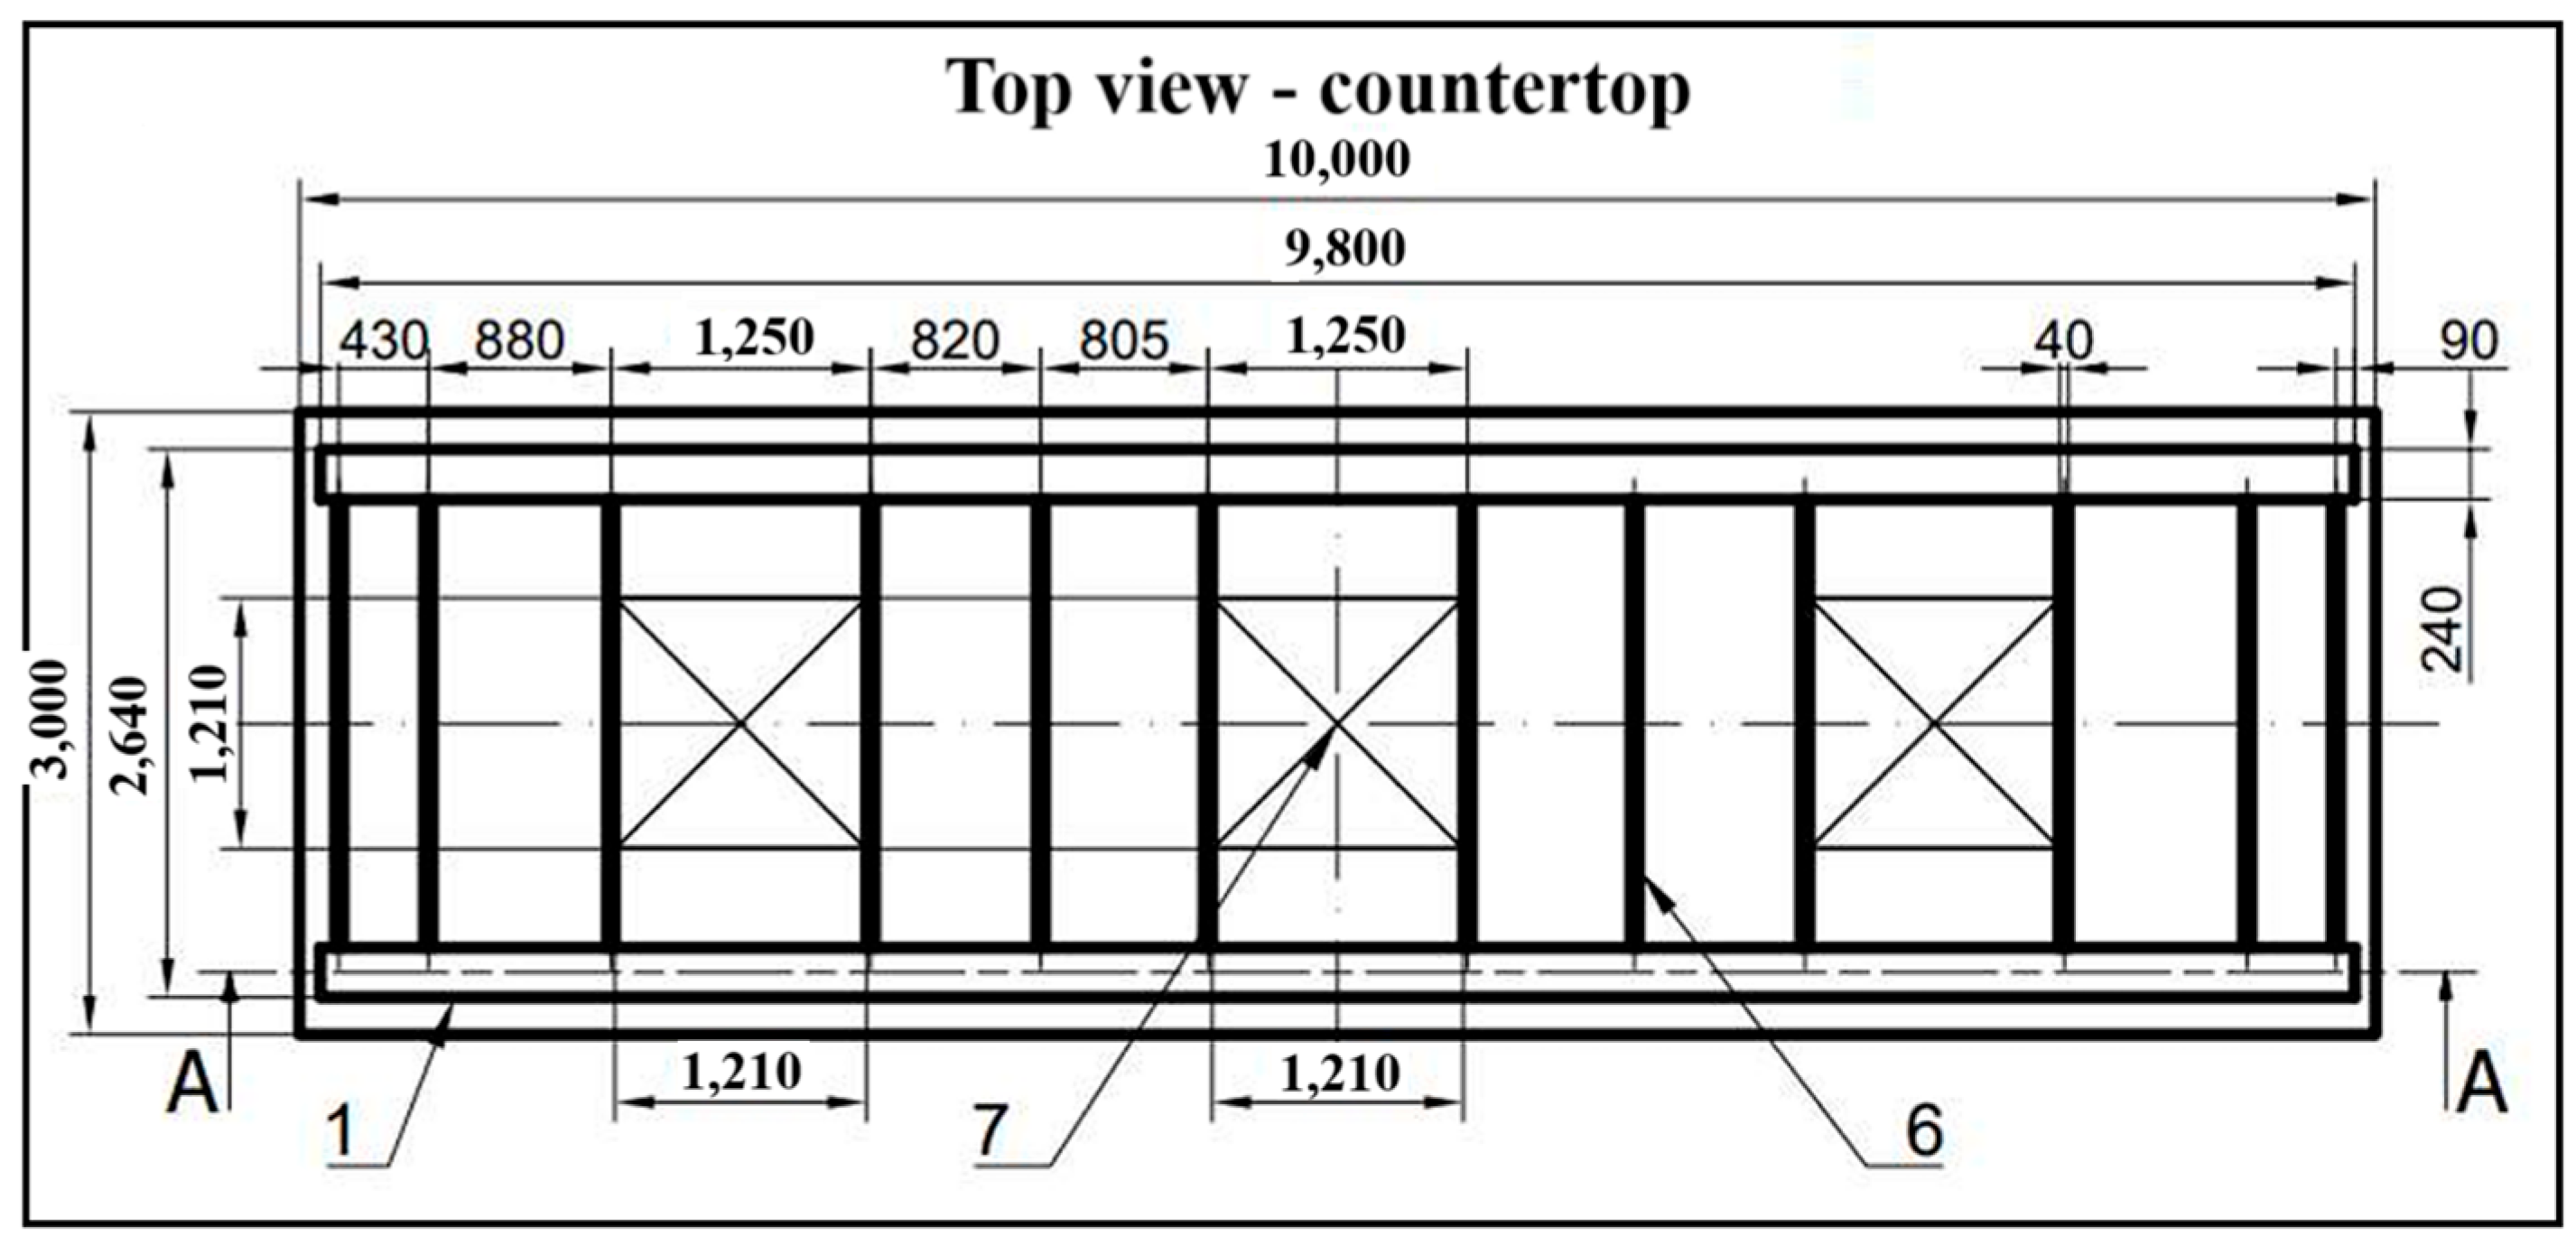
- number and size of personnel trapdoors: 3 pcs., 1210 × 1210 mm,
- (h)
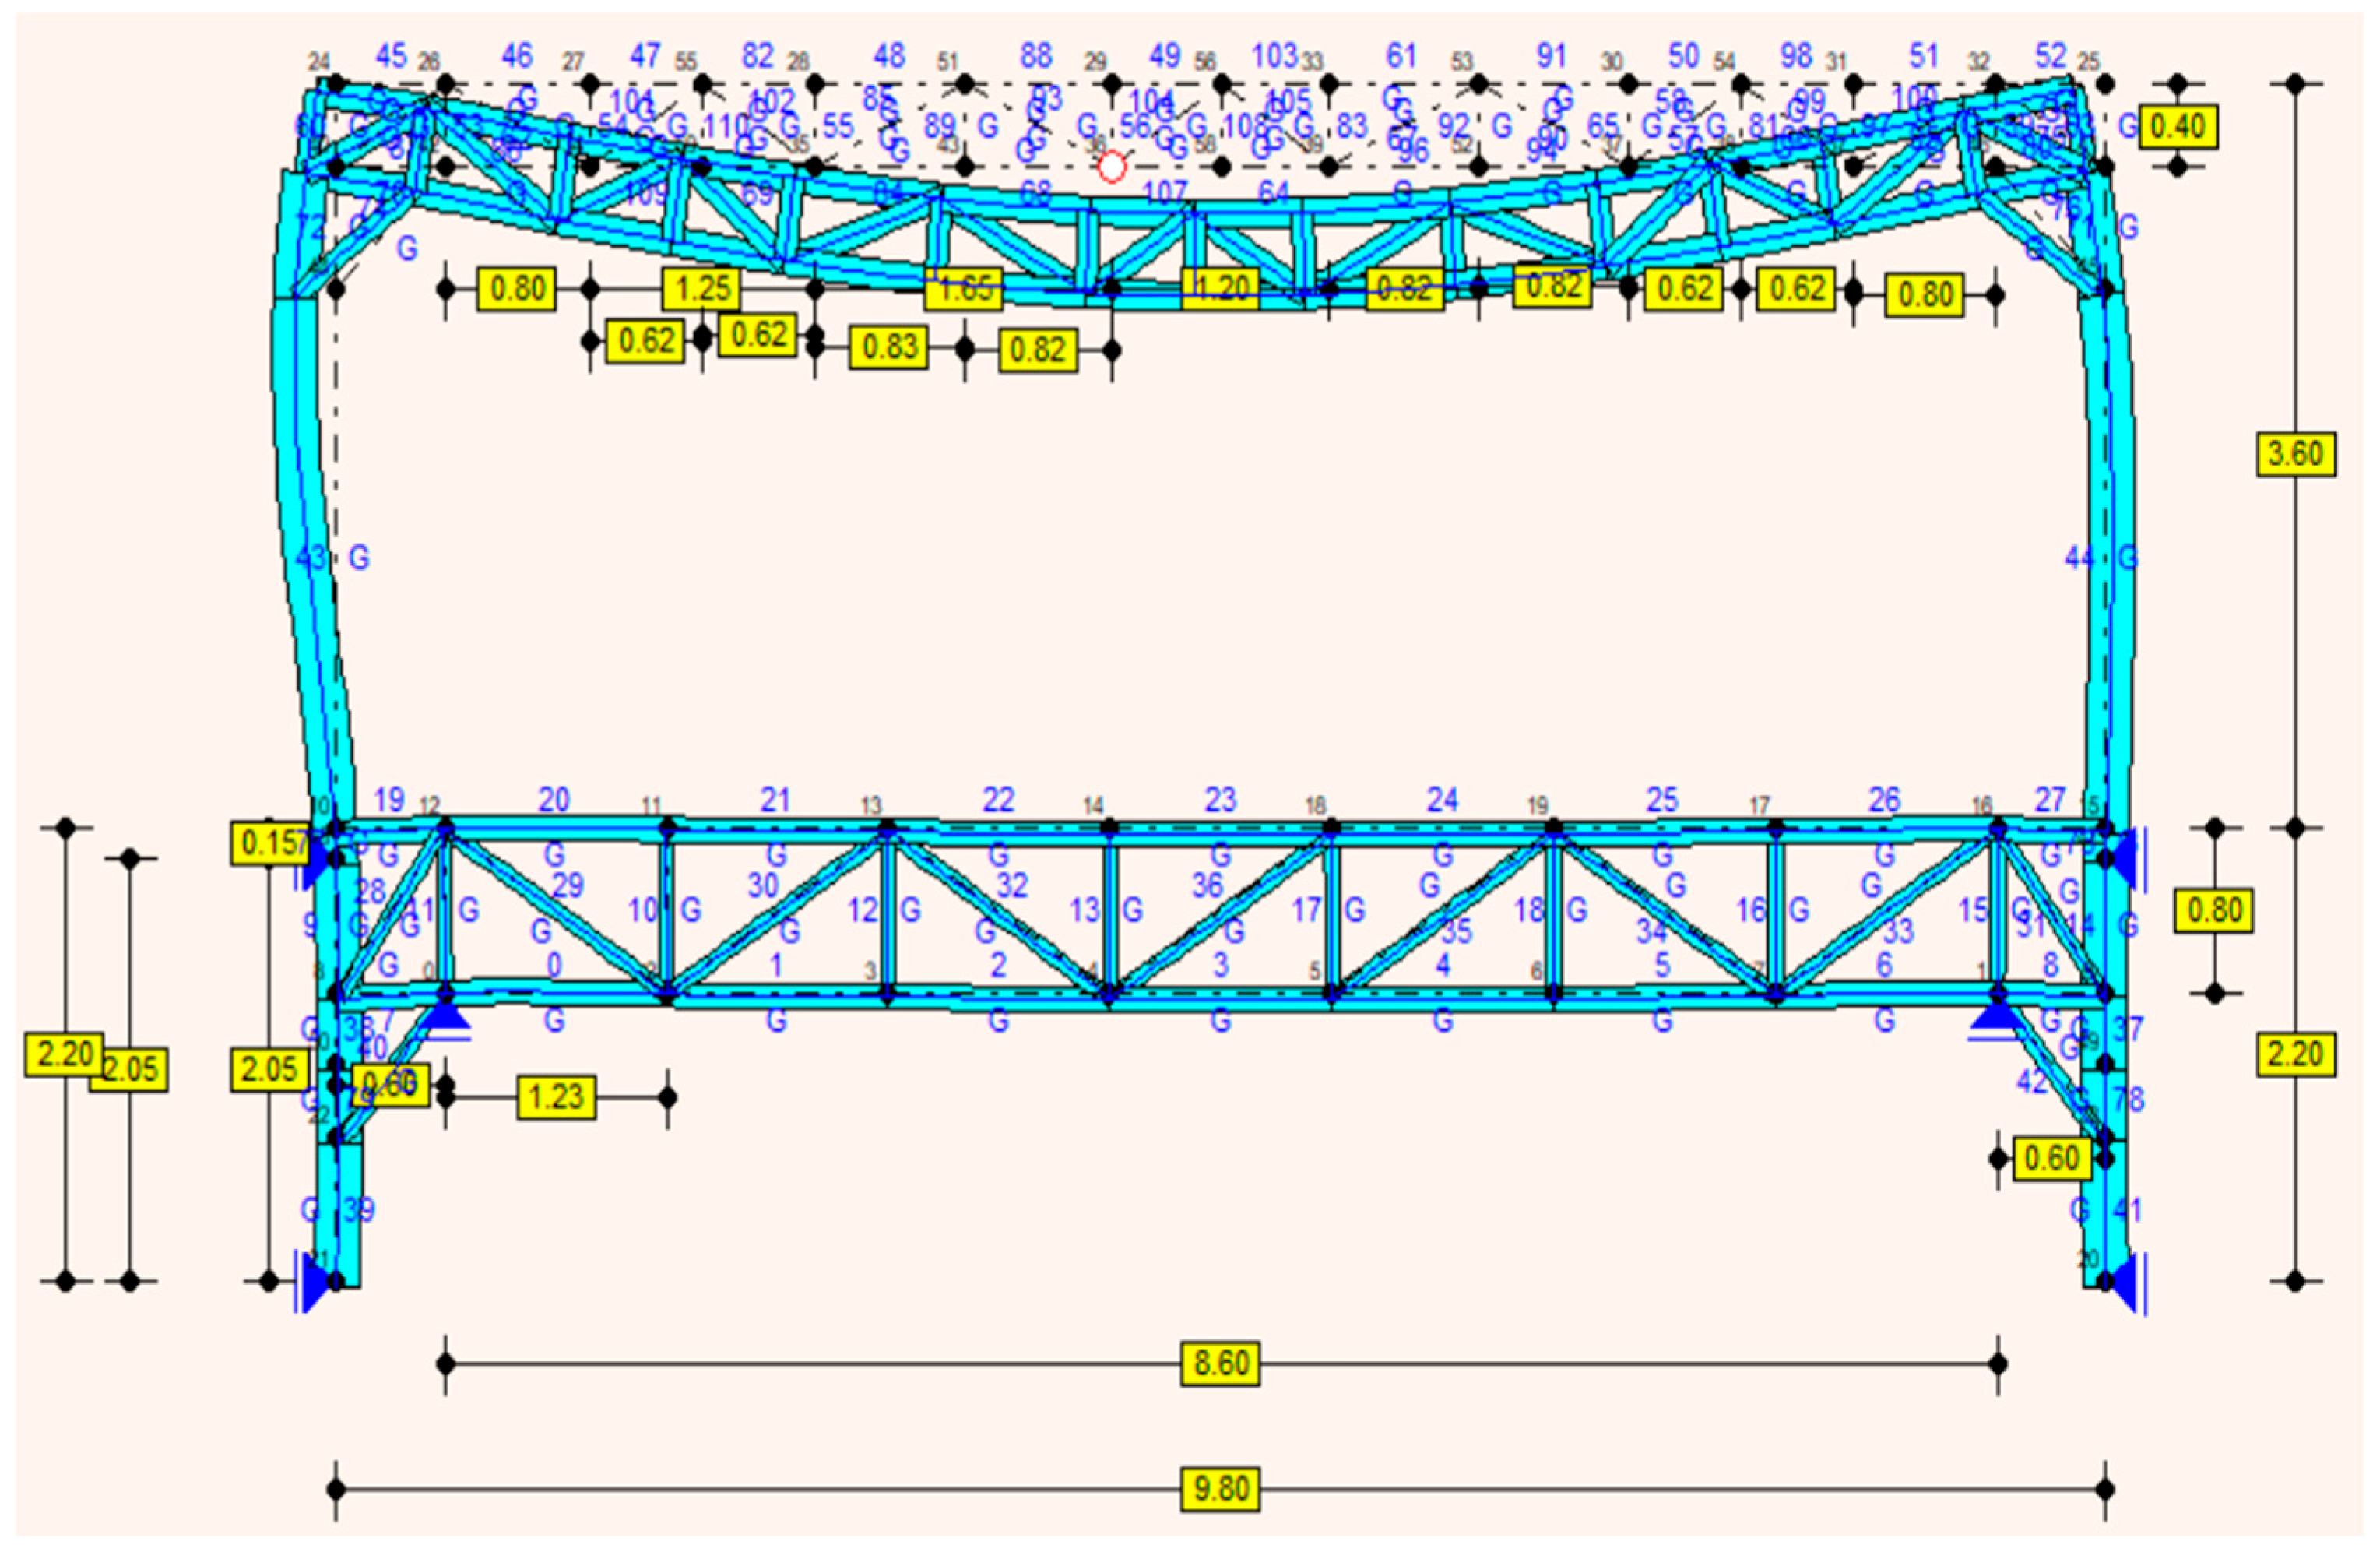
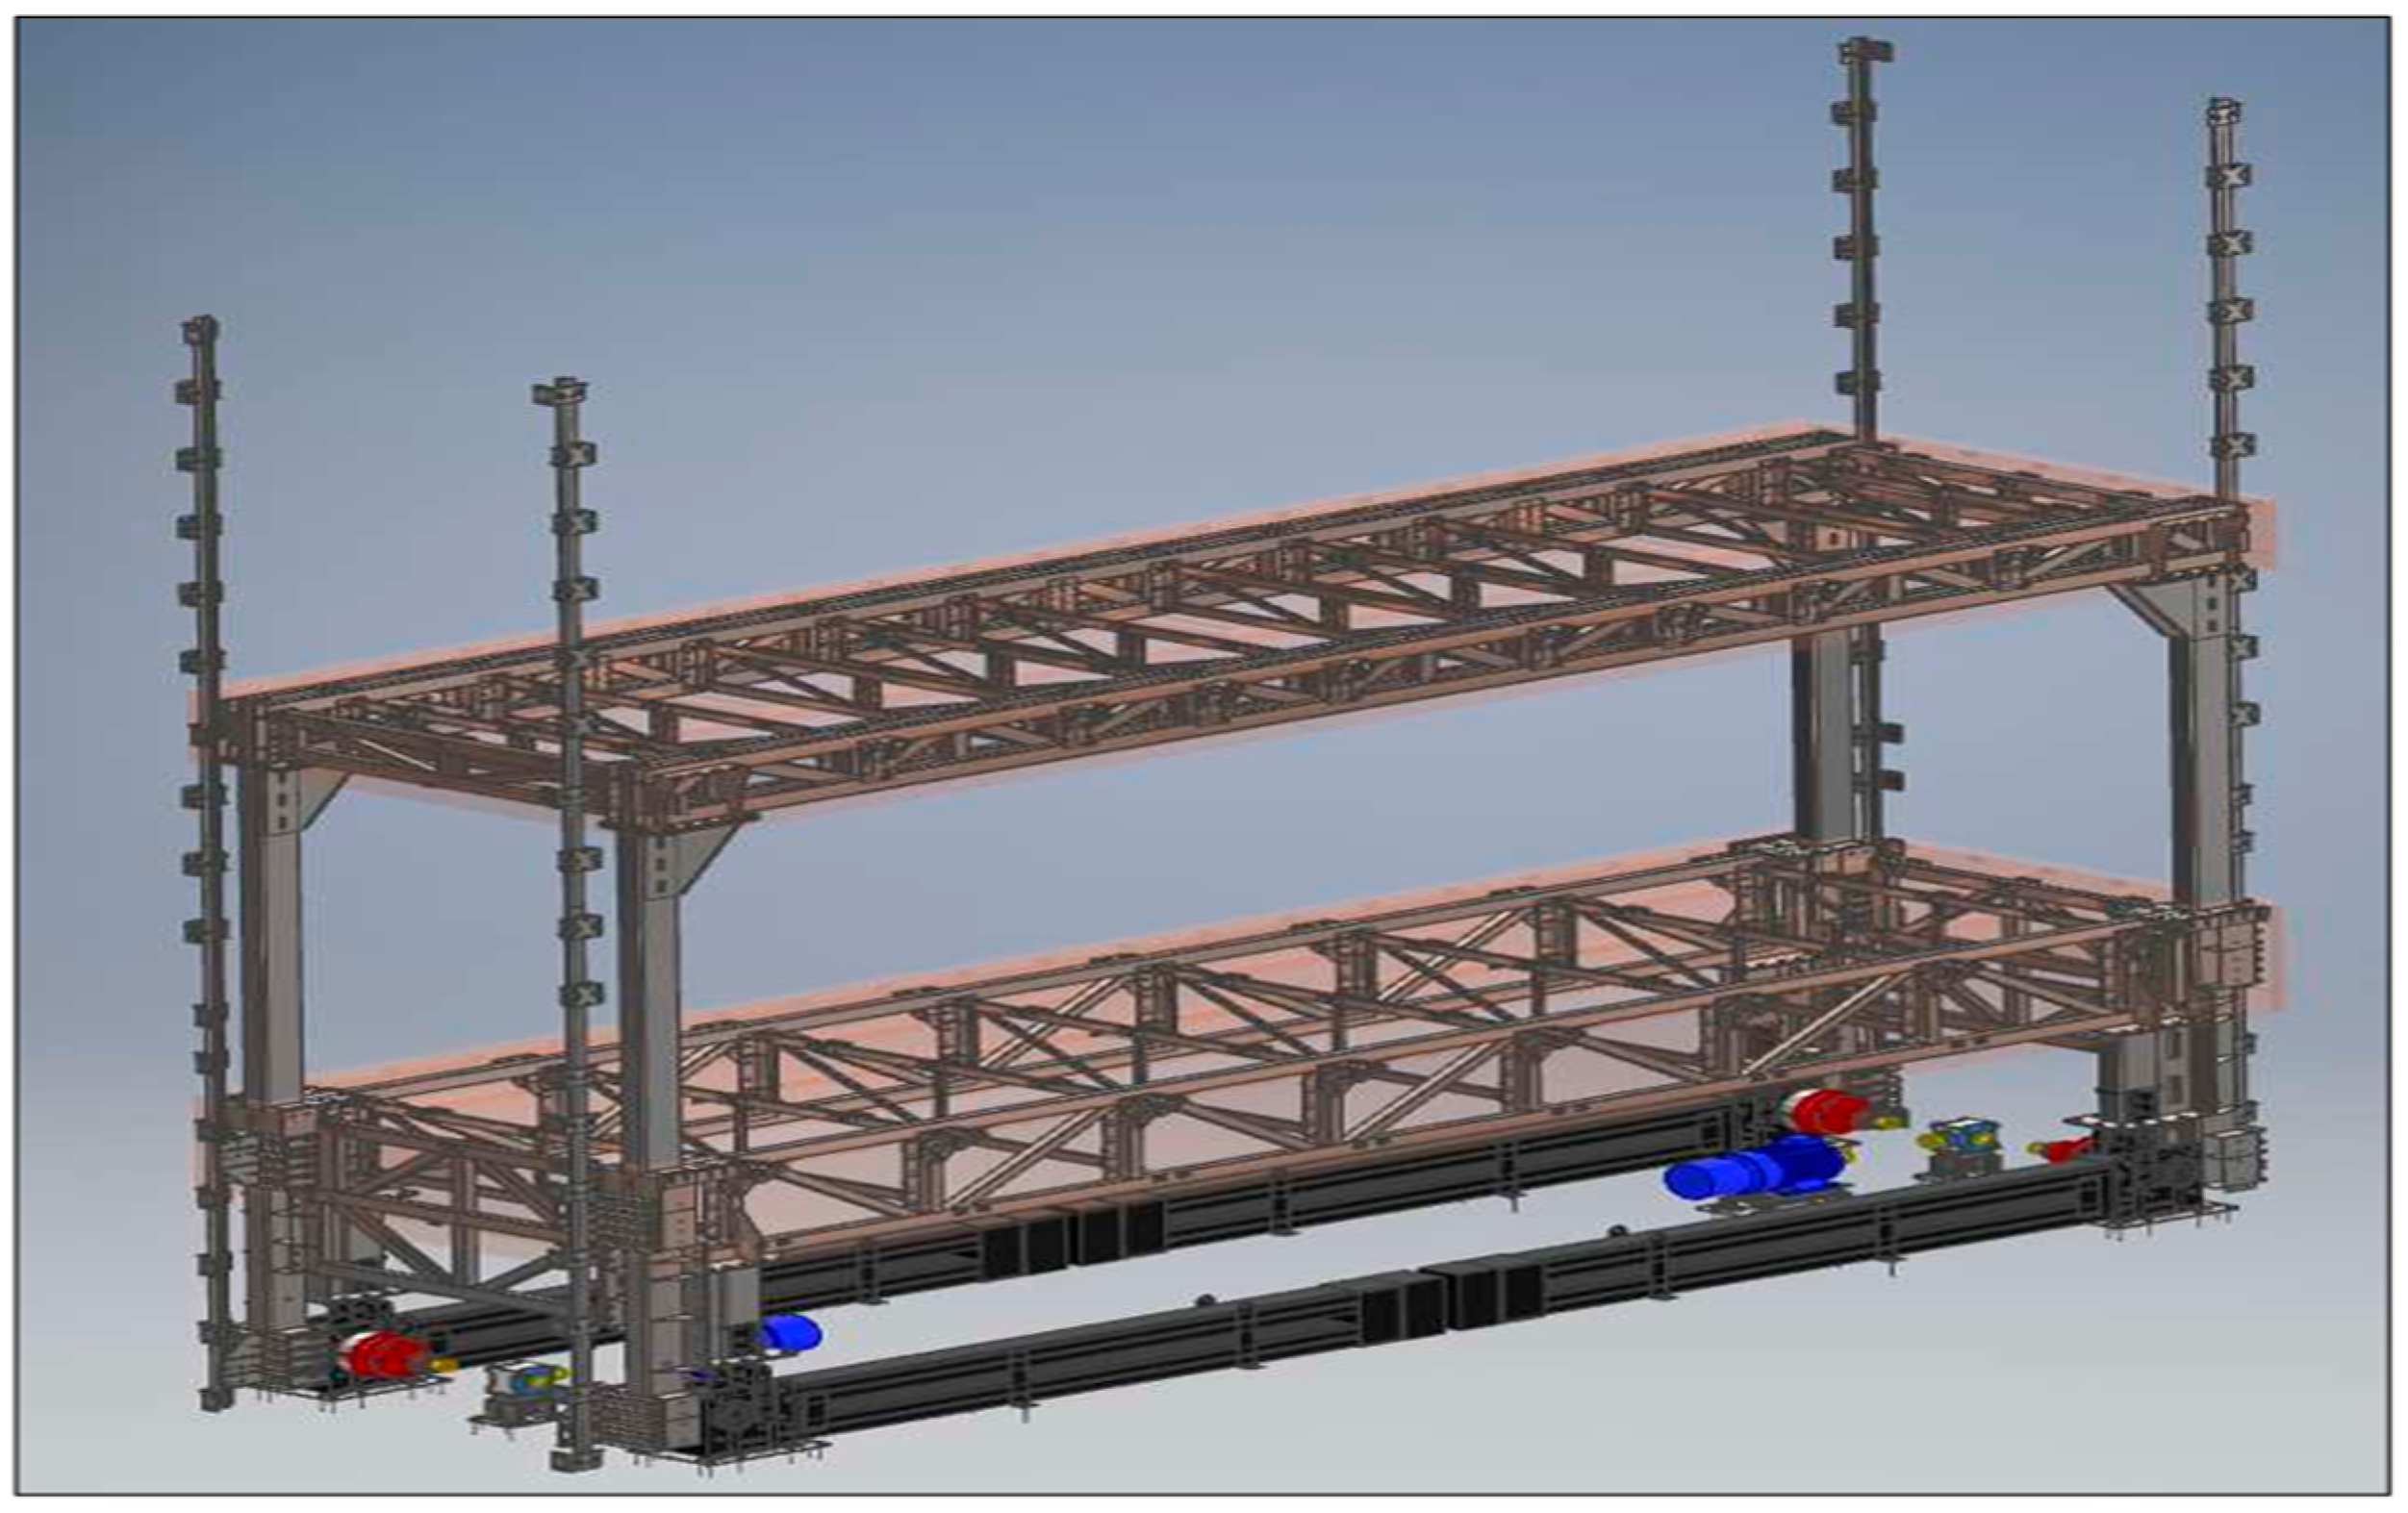
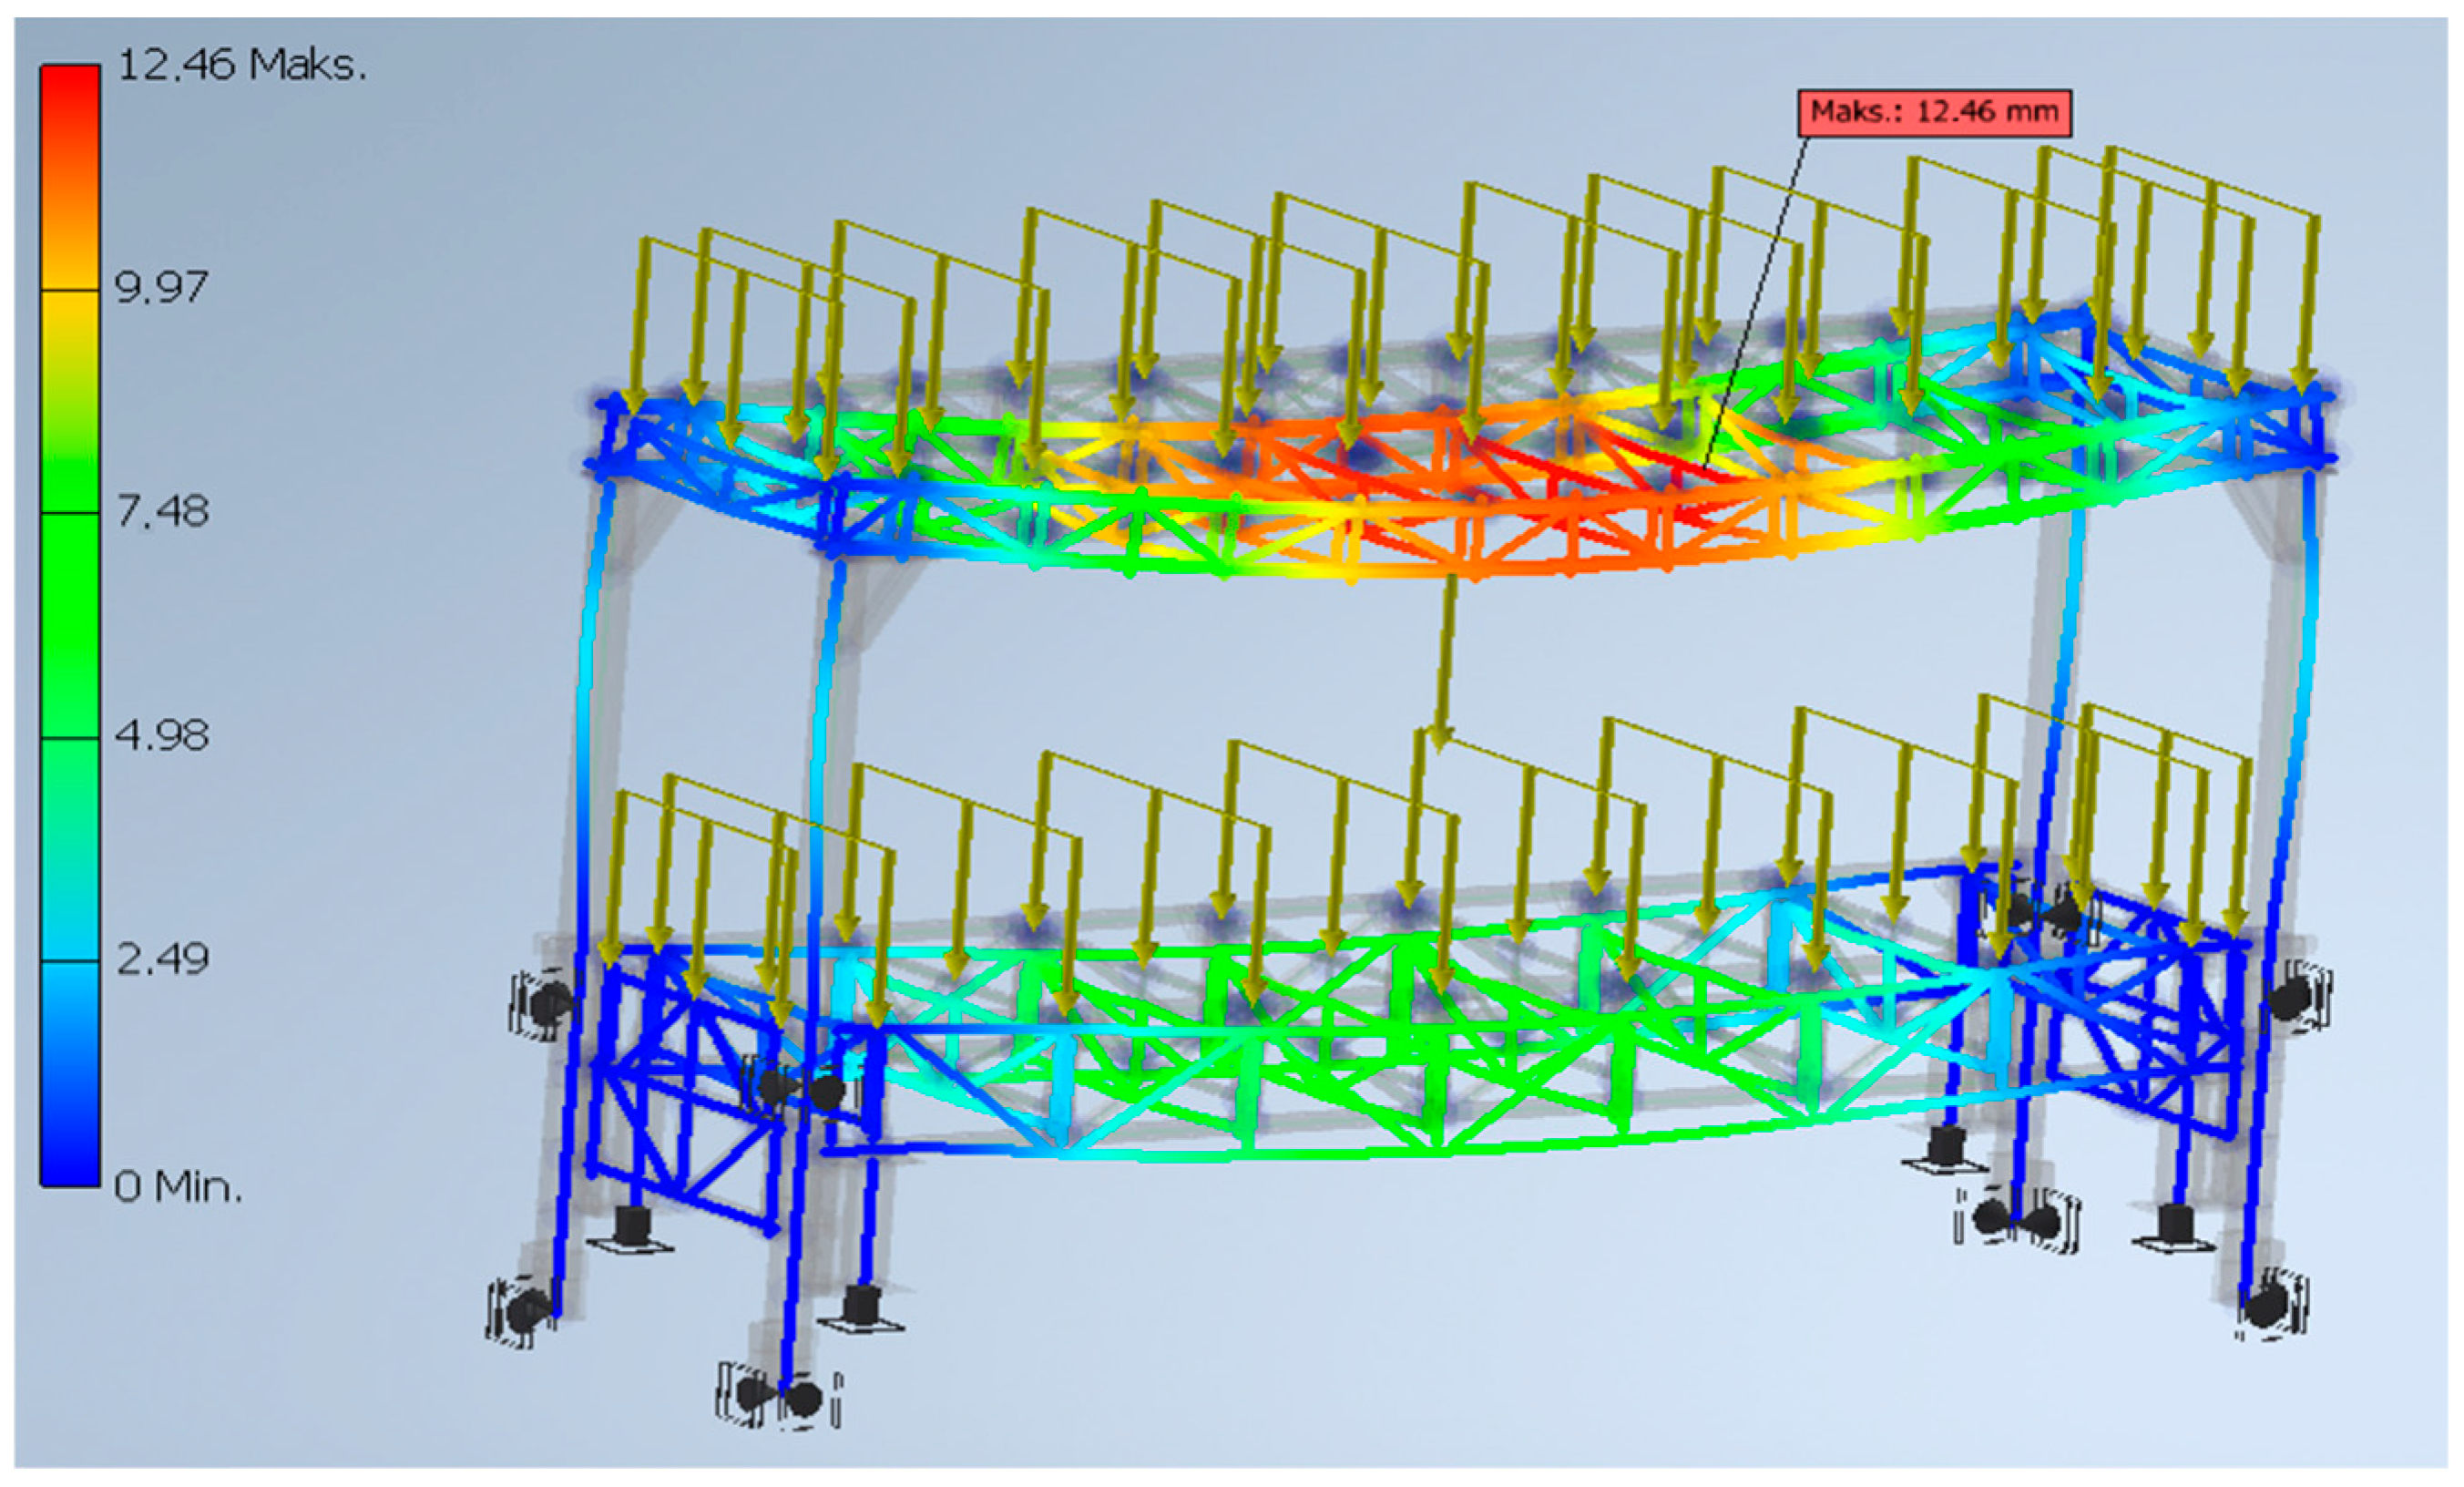
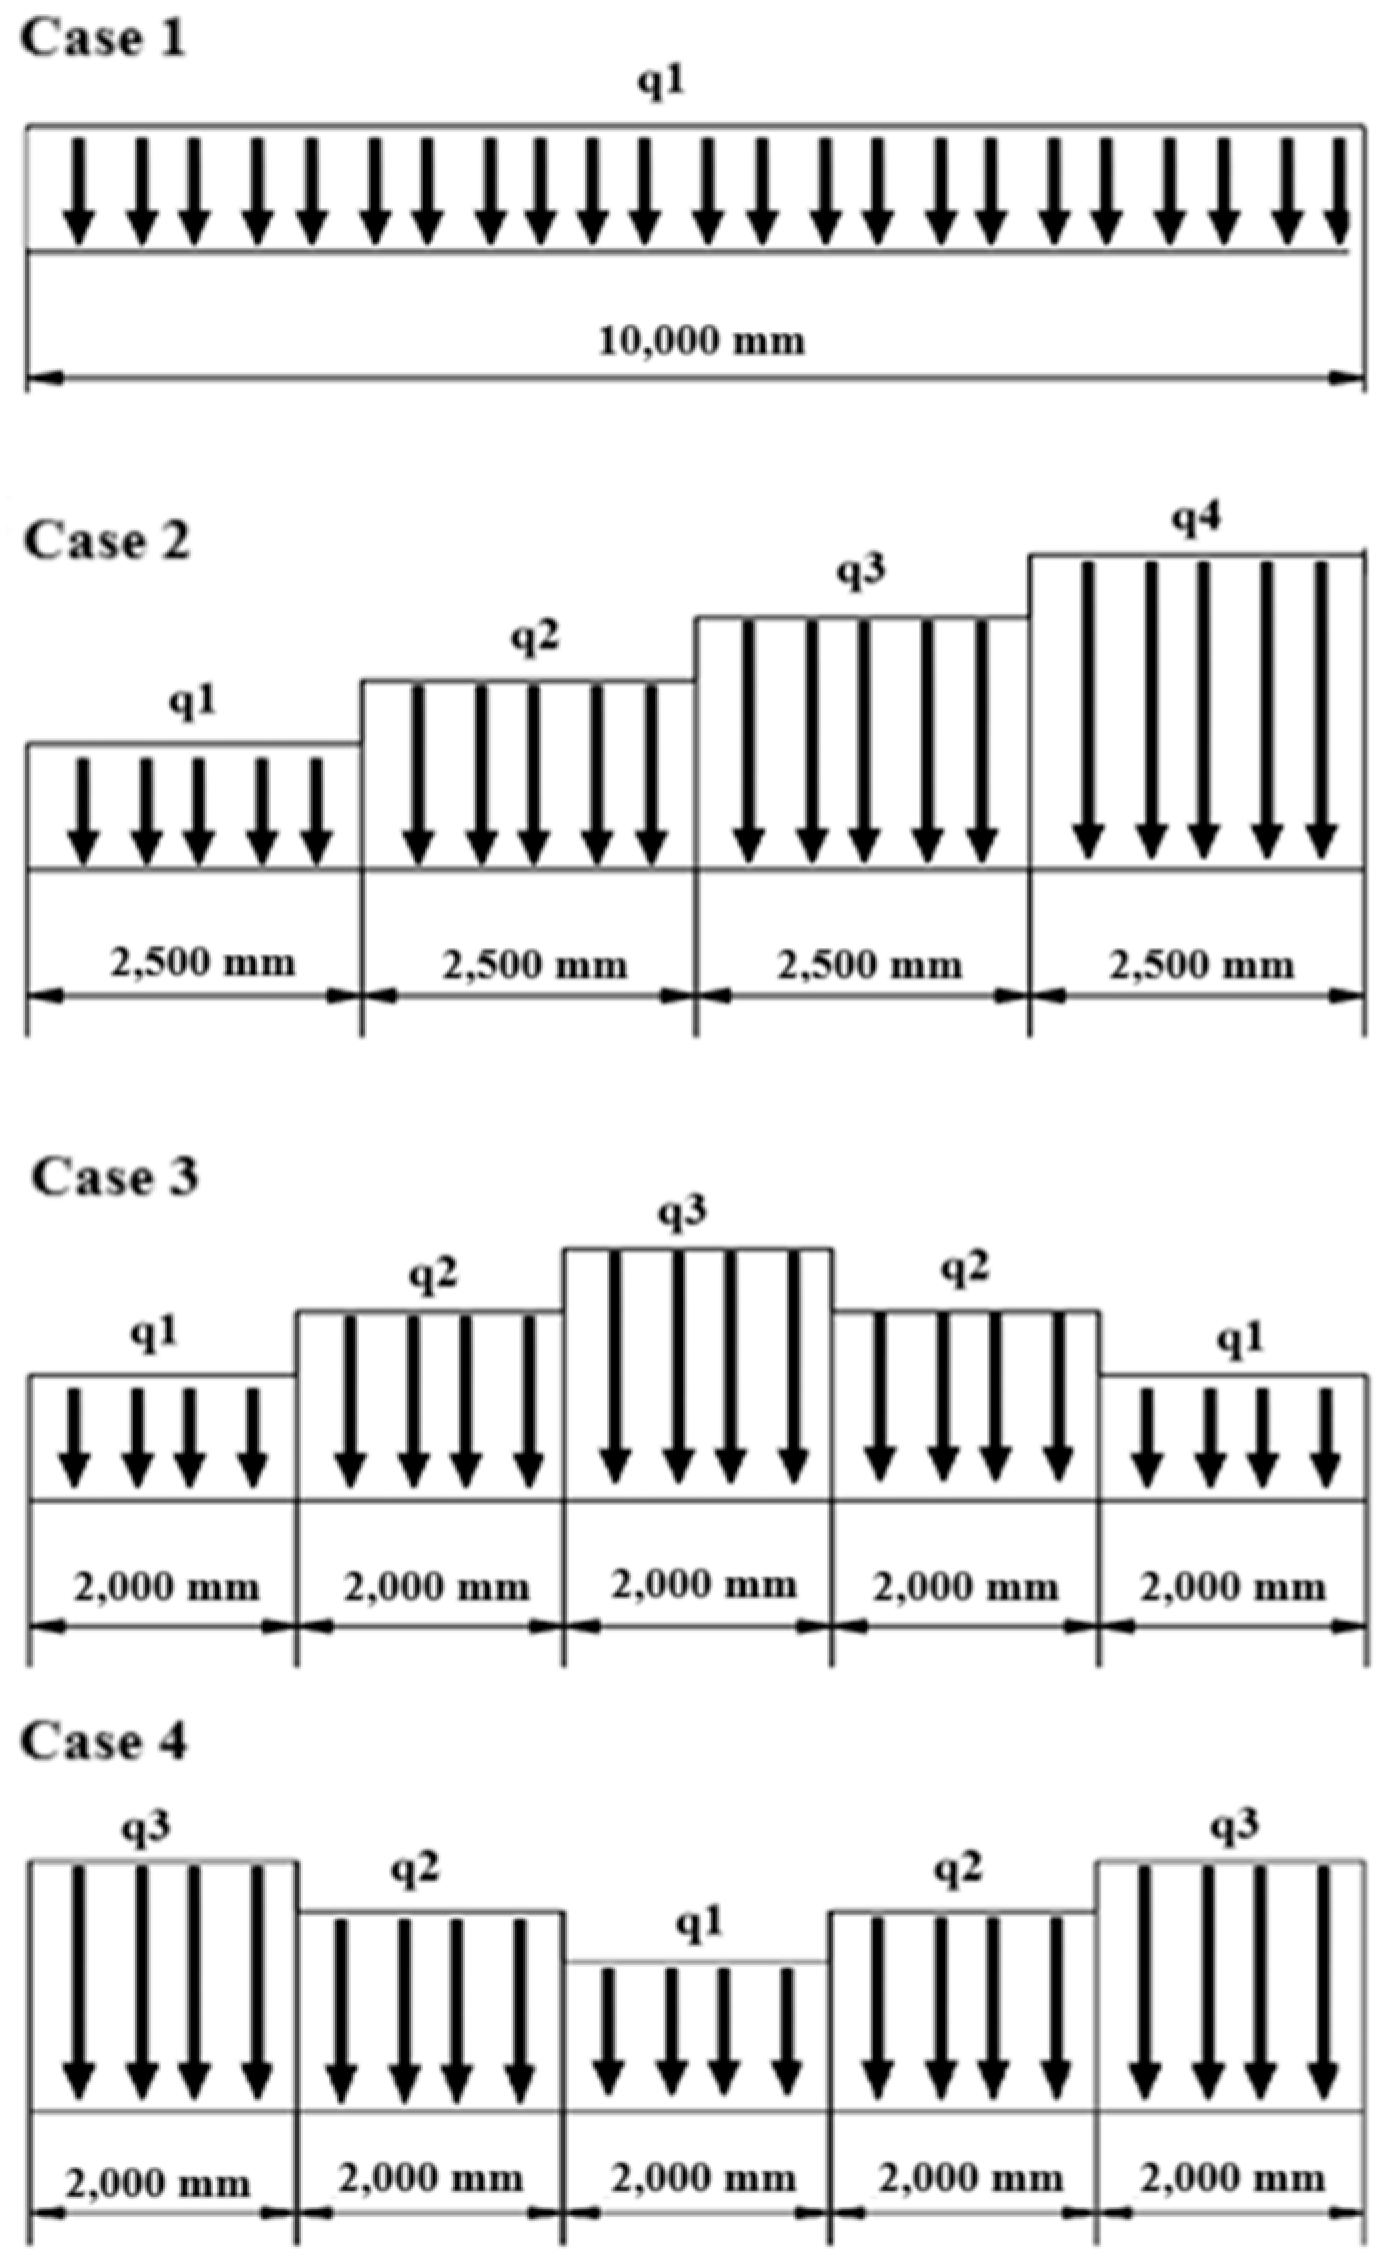
3. Testing and Analysis of the Load-Bearing Structure of a Scenic Trapdoor
4. Conclusions
Author Contributions
Funding
Institutional Review Board Statement
Informed Consent Statement
Data Availability Statement
Conflicts of Interest
References
- McComb, C.; Cagan, J.; Kotovsky, K. Lifting the Veil: Drawing insights about design teams from a cognitively-inspired computational model. Des. Stud. 2015, 40, 119–142. [Google Scholar] [CrossRef]
- Kazhnabieva, B.A.; Karzhaubayeva, S.K.; Janguzhinova, M.E.; Karamoldaeva, D.O. KEY ISSUES OF TECHNICAL MODERNIZATION OF THE KAZAKHSTAN THEATRE STAGE AND TECHNICAL EQUIPMENT, QazBSQA Bulletin; Architecture and Design: Tokyo, Japan, 2023; Volume 87, pp. 35–45. [Google Scholar]
- Avendaño, J.I.; Zlatanova, S.; Domingo, A.; Pérez, P.; Correa, C. Utilization of BIM in Steel Building Projects: A Systematic Literature Review. Buildings 2022, 12, 713. [Google Scholar] [CrossRef]
- Gutowski, T.; Cooper, D.; Sahni, S. Why We Use More Materials. Philos. Trans. A Math. Phys. Eng. Sci. 2017, 375, 20160368. [Google Scholar] [CrossRef] [PubMed]
- Liu, Y.F.; Luo, S.S.; Wang, H. Research on a Complete Set of Technologies for Assembled Residential Buildings with Steel-Structure Based on House Type Modularization and Component Standardization. IOP Conf. Ser. Earth Environ. Sci. 2021, 719, 022063. [Google Scholar] [CrossRef]
- Navaratnam, S.; Ngo, T.; Gunawardena, T.; Henderson, D. Performance Review of Prefabricated Building Systems and Future Research in Australia. Buildings 2019, 9, 38. [Google Scholar] [CrossRef]
- Kwon, J. Assessment of fire protection systems in proscenium theaters. Case Stud. Fire Saf. 2014, 2, 9–15. [Google Scholar] [CrossRef]
- Wibawa, L.A.N. DESAIN DAN ANALISIS TEGANGAN STRUKTUR CRANE KAPASITAS 10 TON MENGGUNAKAN METODE ELEMEN HINGGA. J. Muara Sains Teknol. Kedokt. Dan Ilmu Kesehatan 2020, 4, 201–210. [Google Scholar] [CrossRef]
- Grösel, B. Bühnentechnik: Mechanische Einrichtungen; Vulkan-Verlag GmbH: Essen, Germany, 2007. [Google Scholar]
- Rusiński, E.; Czmochowski, J.; Smolnicki, T. Zaawansowana Metoda Elementów Skończonych w Konstrukcjach Nośnych; Oficyna Wydawnicza Politechniki Wrocławskiej: Wrocław, Poland, 2000. [Google Scholar]
- Zienkiewicz, O.C. Metoda Elementów Skończonych; Arkady: Warsaw, Poland, 1972. [Google Scholar]
- Gerdemeli, I.; Kurt, S. Design and finite element analysis of gantry crane. Key Eng. Mater. 2014, 572, 517–520. [Google Scholar] [CrossRef]
- Chan, J.; Dow, S.P.; Schunn, C.H.D. Do the best design ideas (really) come from conceptually distant sources of inspiration? Des. Stud. 2015, 36, 31–58. [Google Scholar] [CrossRef]
- Sung, J.; Jin, S.H.; Saxena, A. Robobarista: Object Part Based Transfer of Manipulation Trajectories From Crowd-Sourcing in 3D Pointclouds. arXiv 2015, arXiv:1504.03071. [Google Scholar]
- PN-EN 10027-1:2007; Stainless Steel in Building Structures—Advantages and Examples of Application. Available online: https://bibliotekanauki.pl/articles/402159 (accessed on 16 May 2025).
- ASTM A36; Standard Specification for Carbon Structural Steel. Available online: https://store.astm.org/a0036_a0036m-19.html (accessed on 16 May 2025).
- Blicharski, M. Inżynieria Materiałowa: Stal, Warszawa; Wydawnictwo Naukowe PWN: Warszawa, Poland, 2010. [Google Scholar]
- Ciurej, H. Analiza Wrażliwości Konstrukcji Prętowych w Liniowej Statyce; Wydawnictwo Politechniki Krakowskiej: Kraków, Poland, 2015. [Google Scholar]
- Falkowski, J. Wytrzymałość Materiałów; Wydawnictwo Naukowe PWN: Warszawa, Poland, 2006. [Google Scholar]
- Gabryszewski, Z. Teoria Sprężystości i Plastyczności; Poznań University of Technology: Poznań, Poland, 2001. [Google Scholar]
- Jaskulski, A. Autodesk Inventor Professional 2021 PL/2021+/Fusion 360 Metodyka Projektowania; Helion: Everett, WA, USA, 2020. [Google Scholar]
- DIN 56950-1:2012-05; Entertainment Technology—Machinery Installations—Part 1: Safety Requirements and Inspections. Available online: https://webstore.ansi.org/standards/din/din569502012?srsltid=AfmBOoqNEy6AycafG9mZJftavqoIBKcdIan6kPyffhESePTrvDxIrcPD (accessed on 16 May 2025).
- Zamorowski, J. Modelowanie i Analiza Stalowych Konstrukcji Prętowych; Wydawnictwo Naukowe PWN: Warszawa, Poland, 2022. [Google Scholar]
- Żmuda, J. Projektowanie Konstrukcji Stalowych cz.1: Dźwigary Kratownicowe, Słupy, Ramownice; Wydawnictwo Naukowe PWN: Warszawa, Poland, 2016. [Google Scholar]
- Żmuda, J. Projektowanie Konstrukcji Stalowych cz.2: Belki, Płatwie, Węzły i Połączenia, Ramy, Łożyska; Wydawnictwo Naukowe PWN: Warszawa, Poland, 2016. [Google Scholar]


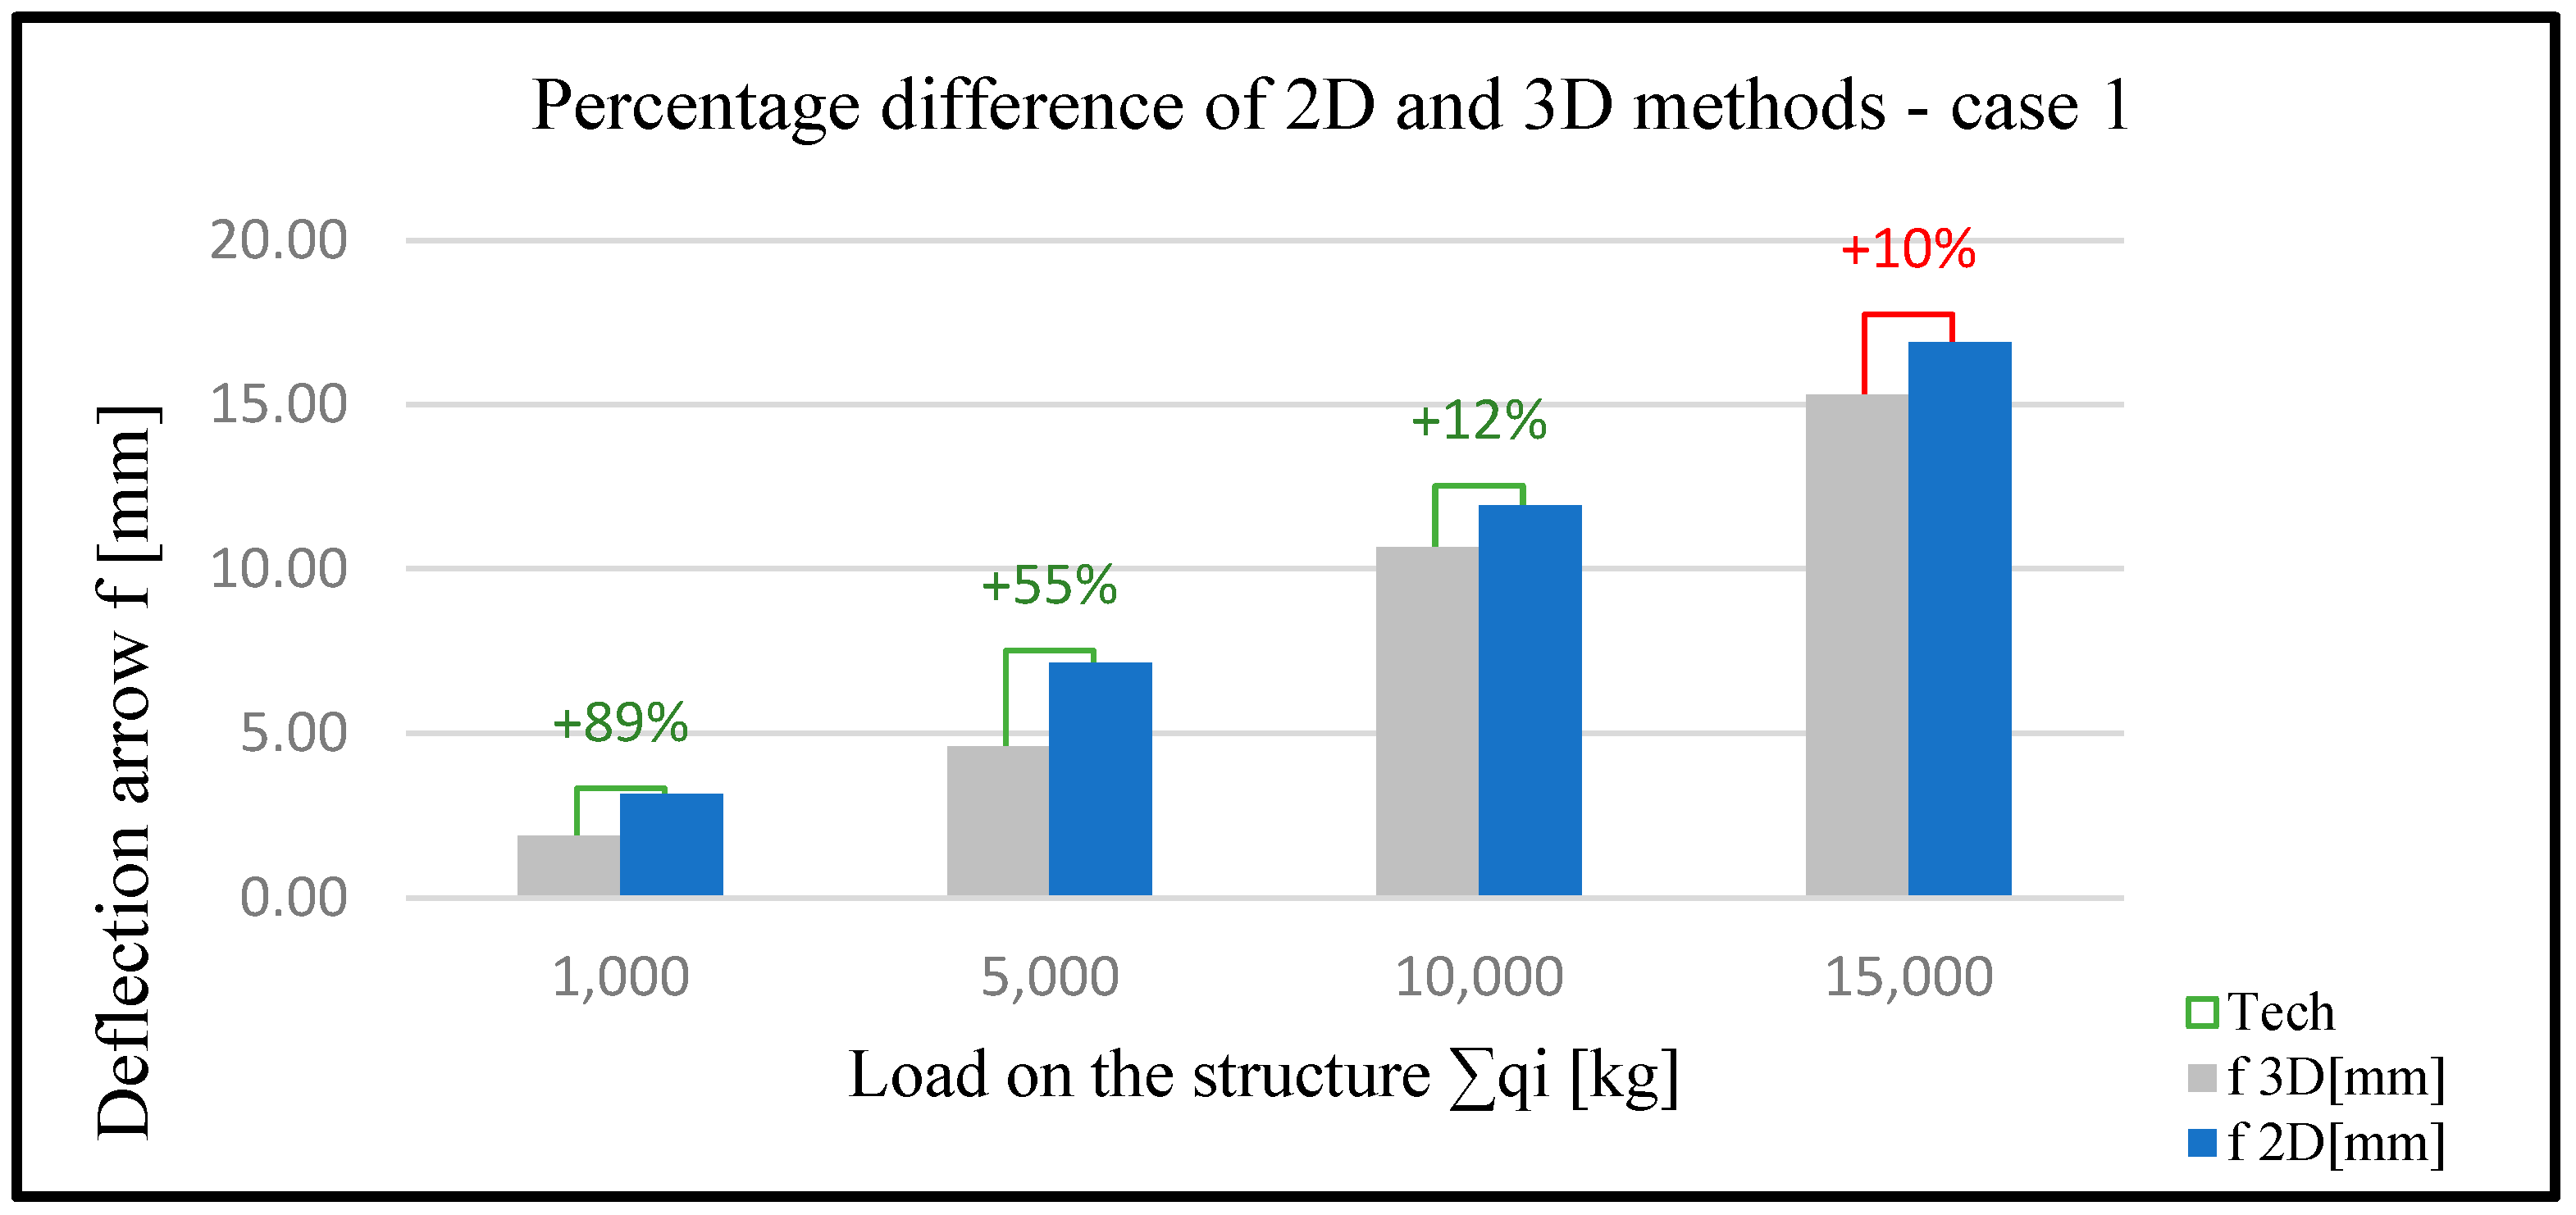
| Load Results | |||||
|---|---|---|---|---|---|
| Case 1 | |||||
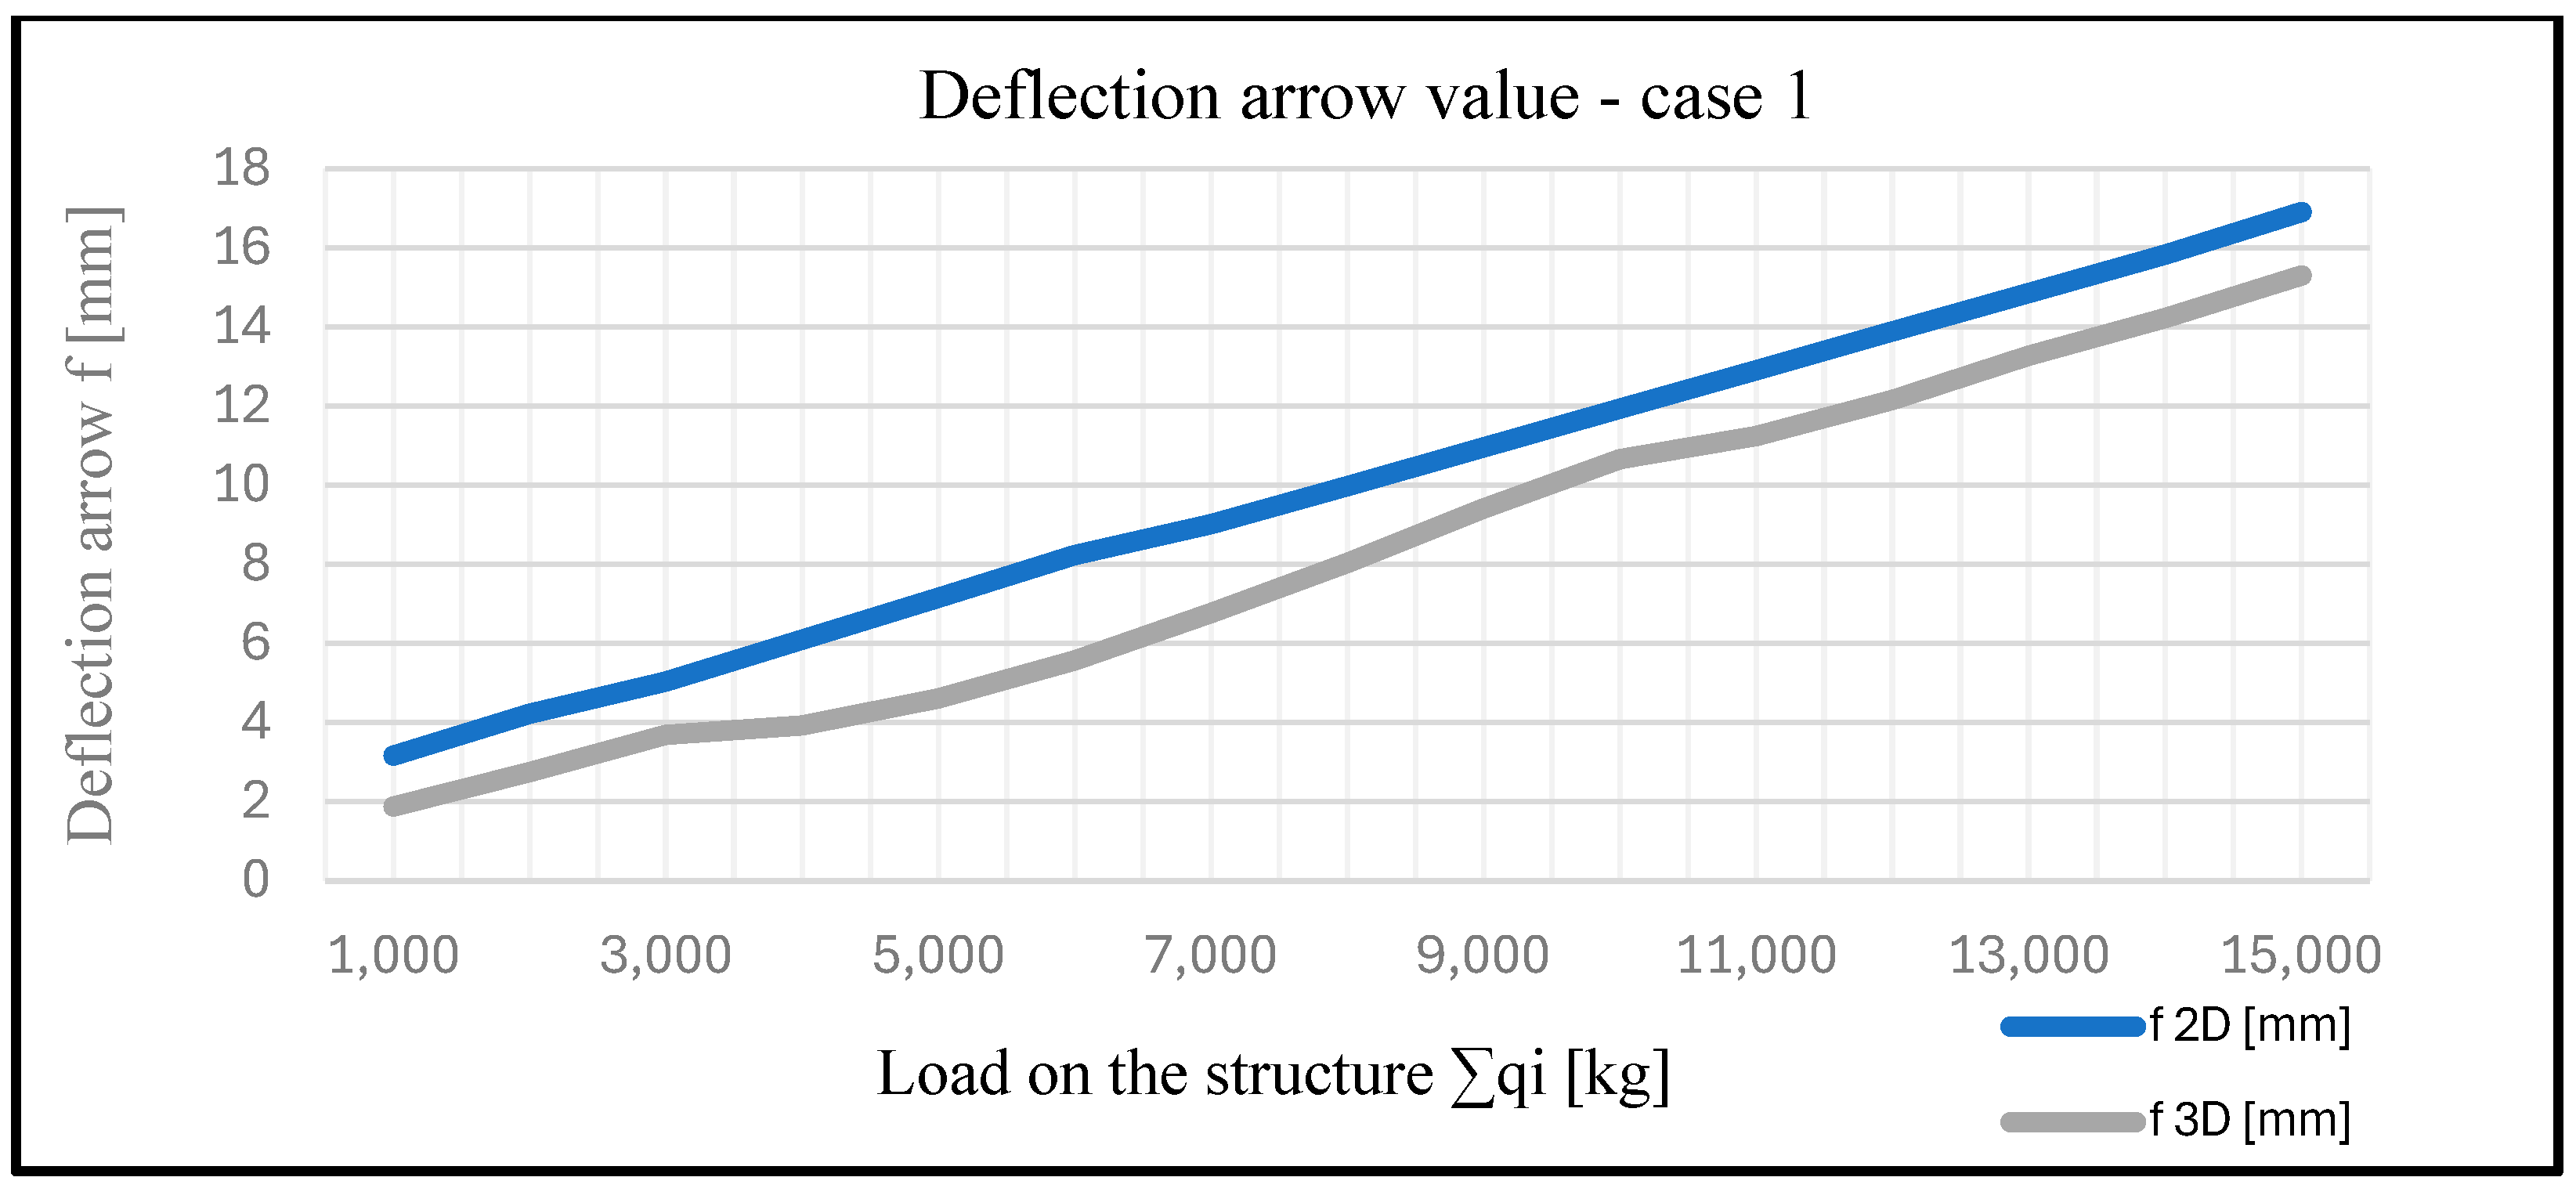
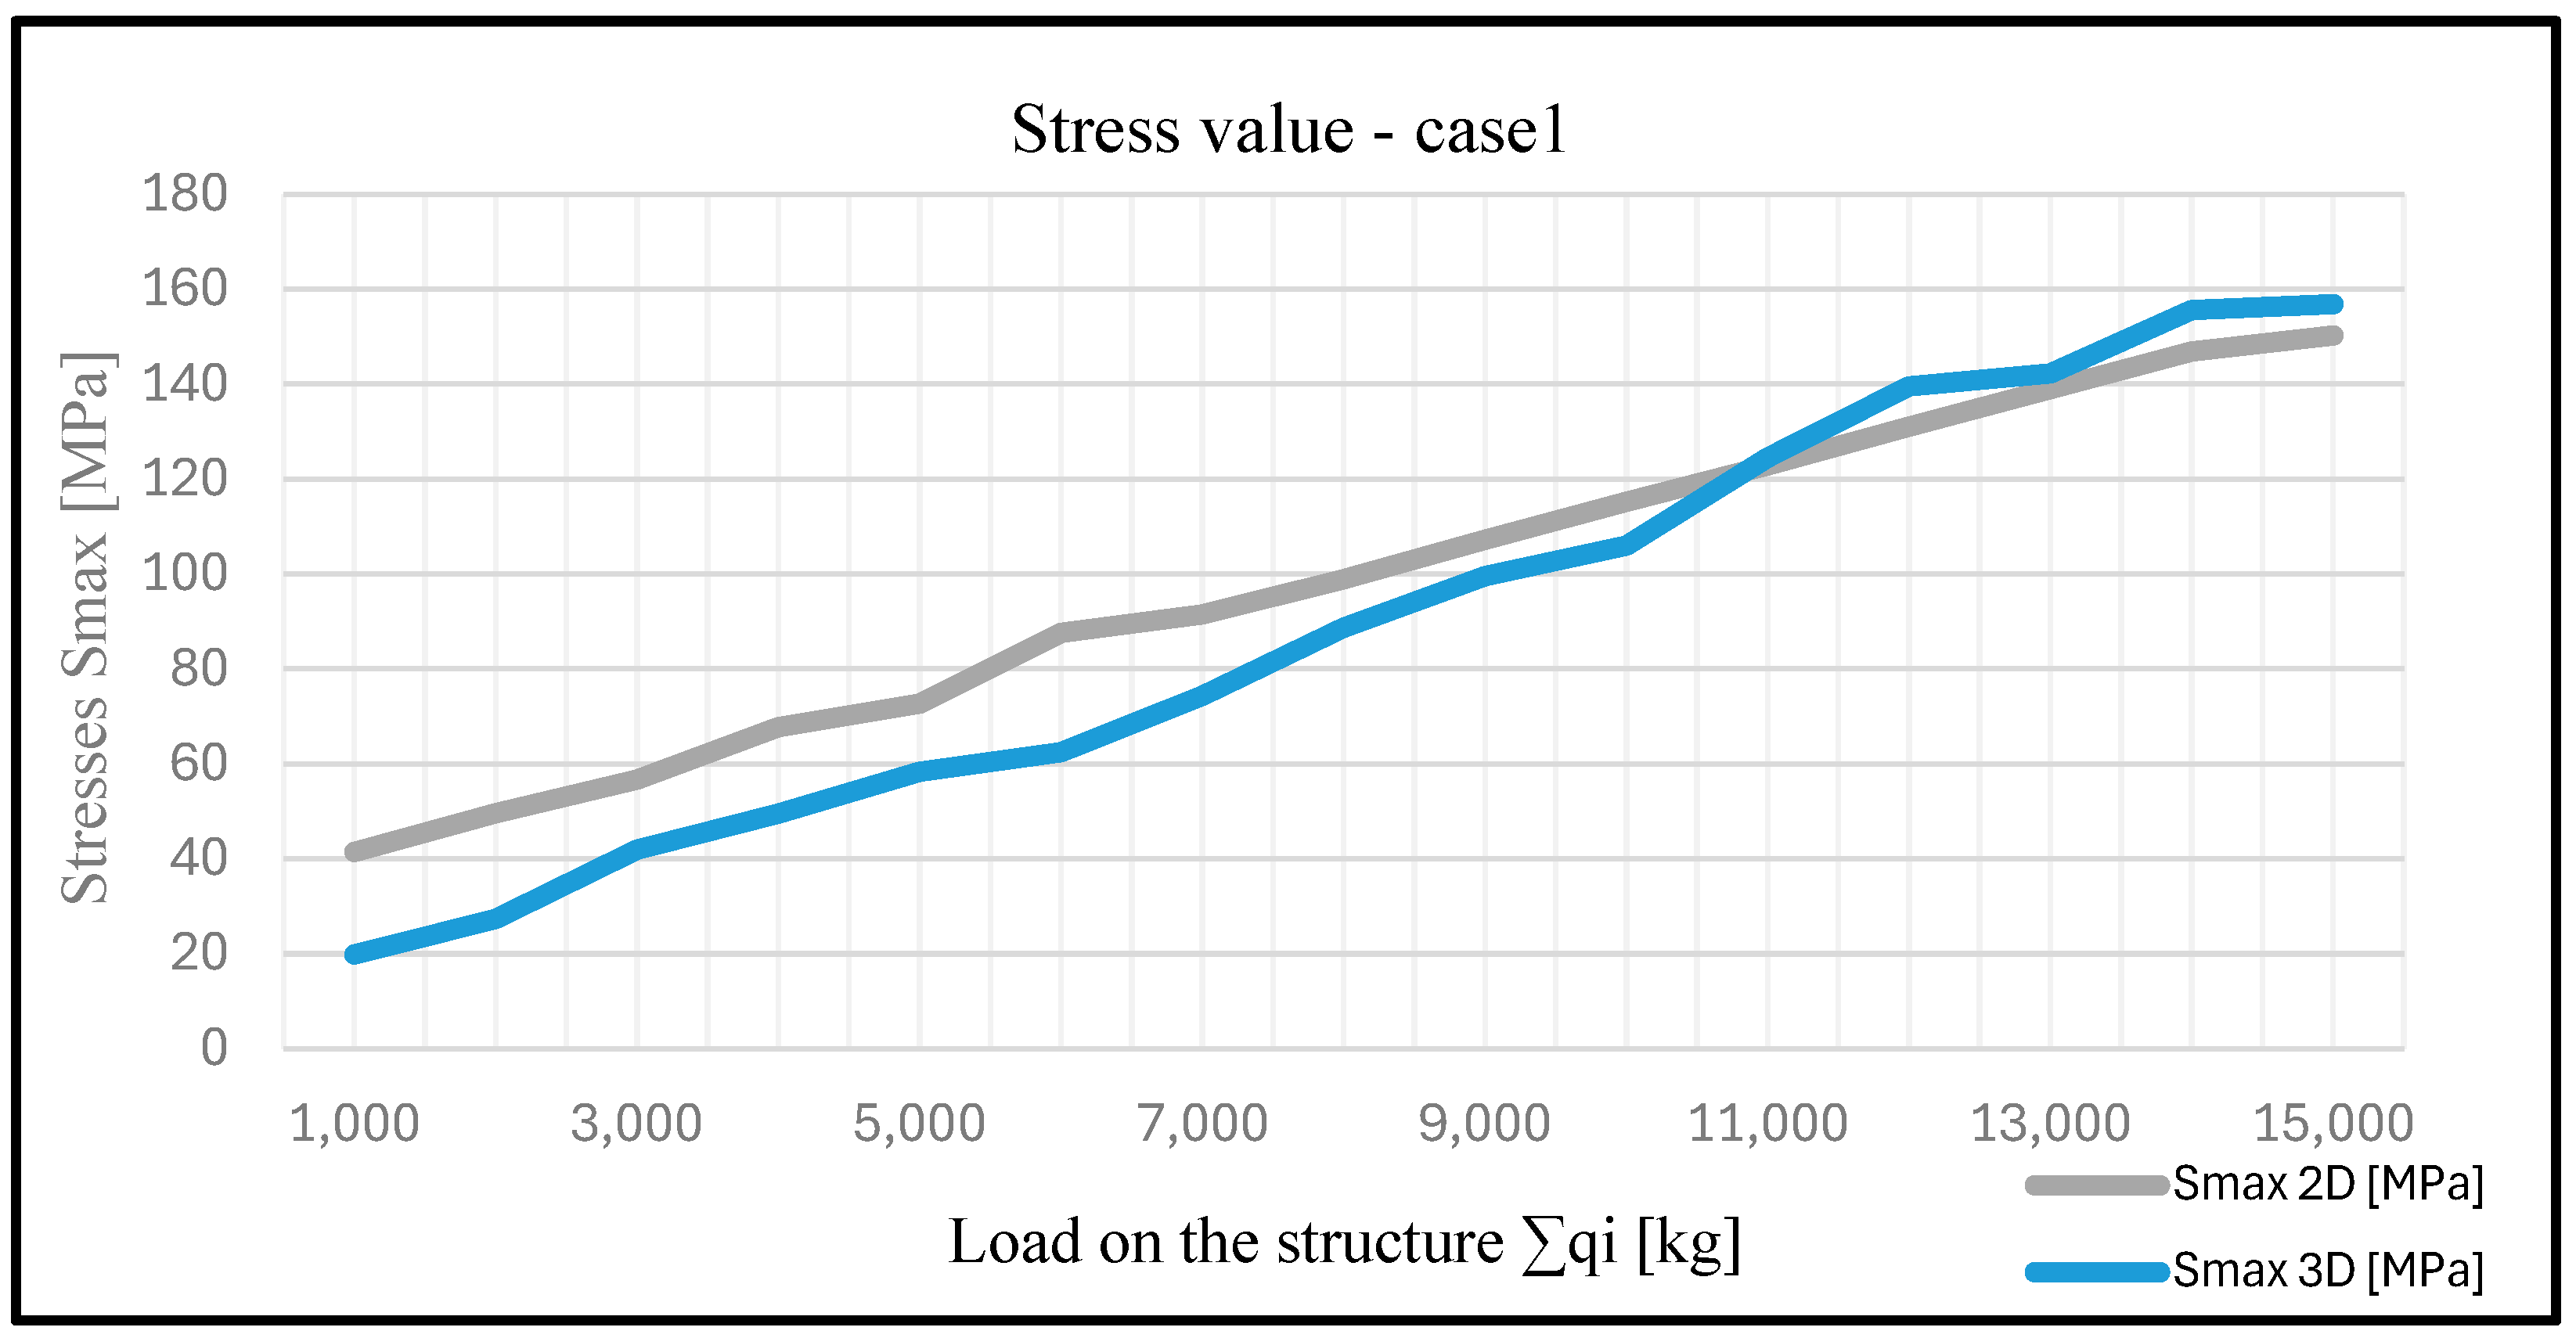
| q1 [kg] | ∑qi [kg] | f 2D [mm] | f 3D [mm] | Smax 2D [MPa] | Smax 3D [MPa] |
| 1000 | 1000 | 3.16 | 1.88 | 41.49 | 19.88 |
| 2000 | 2000 | 4.22 | 2.74 | 49.61 | 27.34 |
| 3000 | 3000 | 5.03 | 3.68 | 56.7 | 41.98 |
| 4000 | 4000 | 6.09 | 3.92 | 67.7 | 49.5 |
| 5000 | 5000 | 7.15 | 4.6 | 72.65 | 58.36 |
| 6000 | 6000 | 8.23 | 5.56 | 87.63 | 62.45 |
| 7000 | 7000 | 9.01 | 6.764 | 91.46 | 74.37 |
| 8000 | 8000 | 9.97 | 8.03 | 98.9 | 88.71 |
| 9000 | 9000 | 10.95 | 9.4 | 107.23 | 99.6 |
| 10,000 | 10,000 | 11.93 | 10.65 | 115.21 | 106 |
| 11,000 | 11,000 | 12.9 | 11.24 | 122.88 | 124.5 |
| 12,000 | 12,000 | 13.88 | 12.15 | 131.04 | 139.51 |
| 13,000 | 13,000 | 14.85 | 13.26 | 138.96 | 142.3 |
| 14,000 | 14,000 | 15.82 | 14.21 | 146.88 | 155.6 |
| 15,000 | 15,000 | 16.9 | 15.3 | 150.27 | 156.9 |
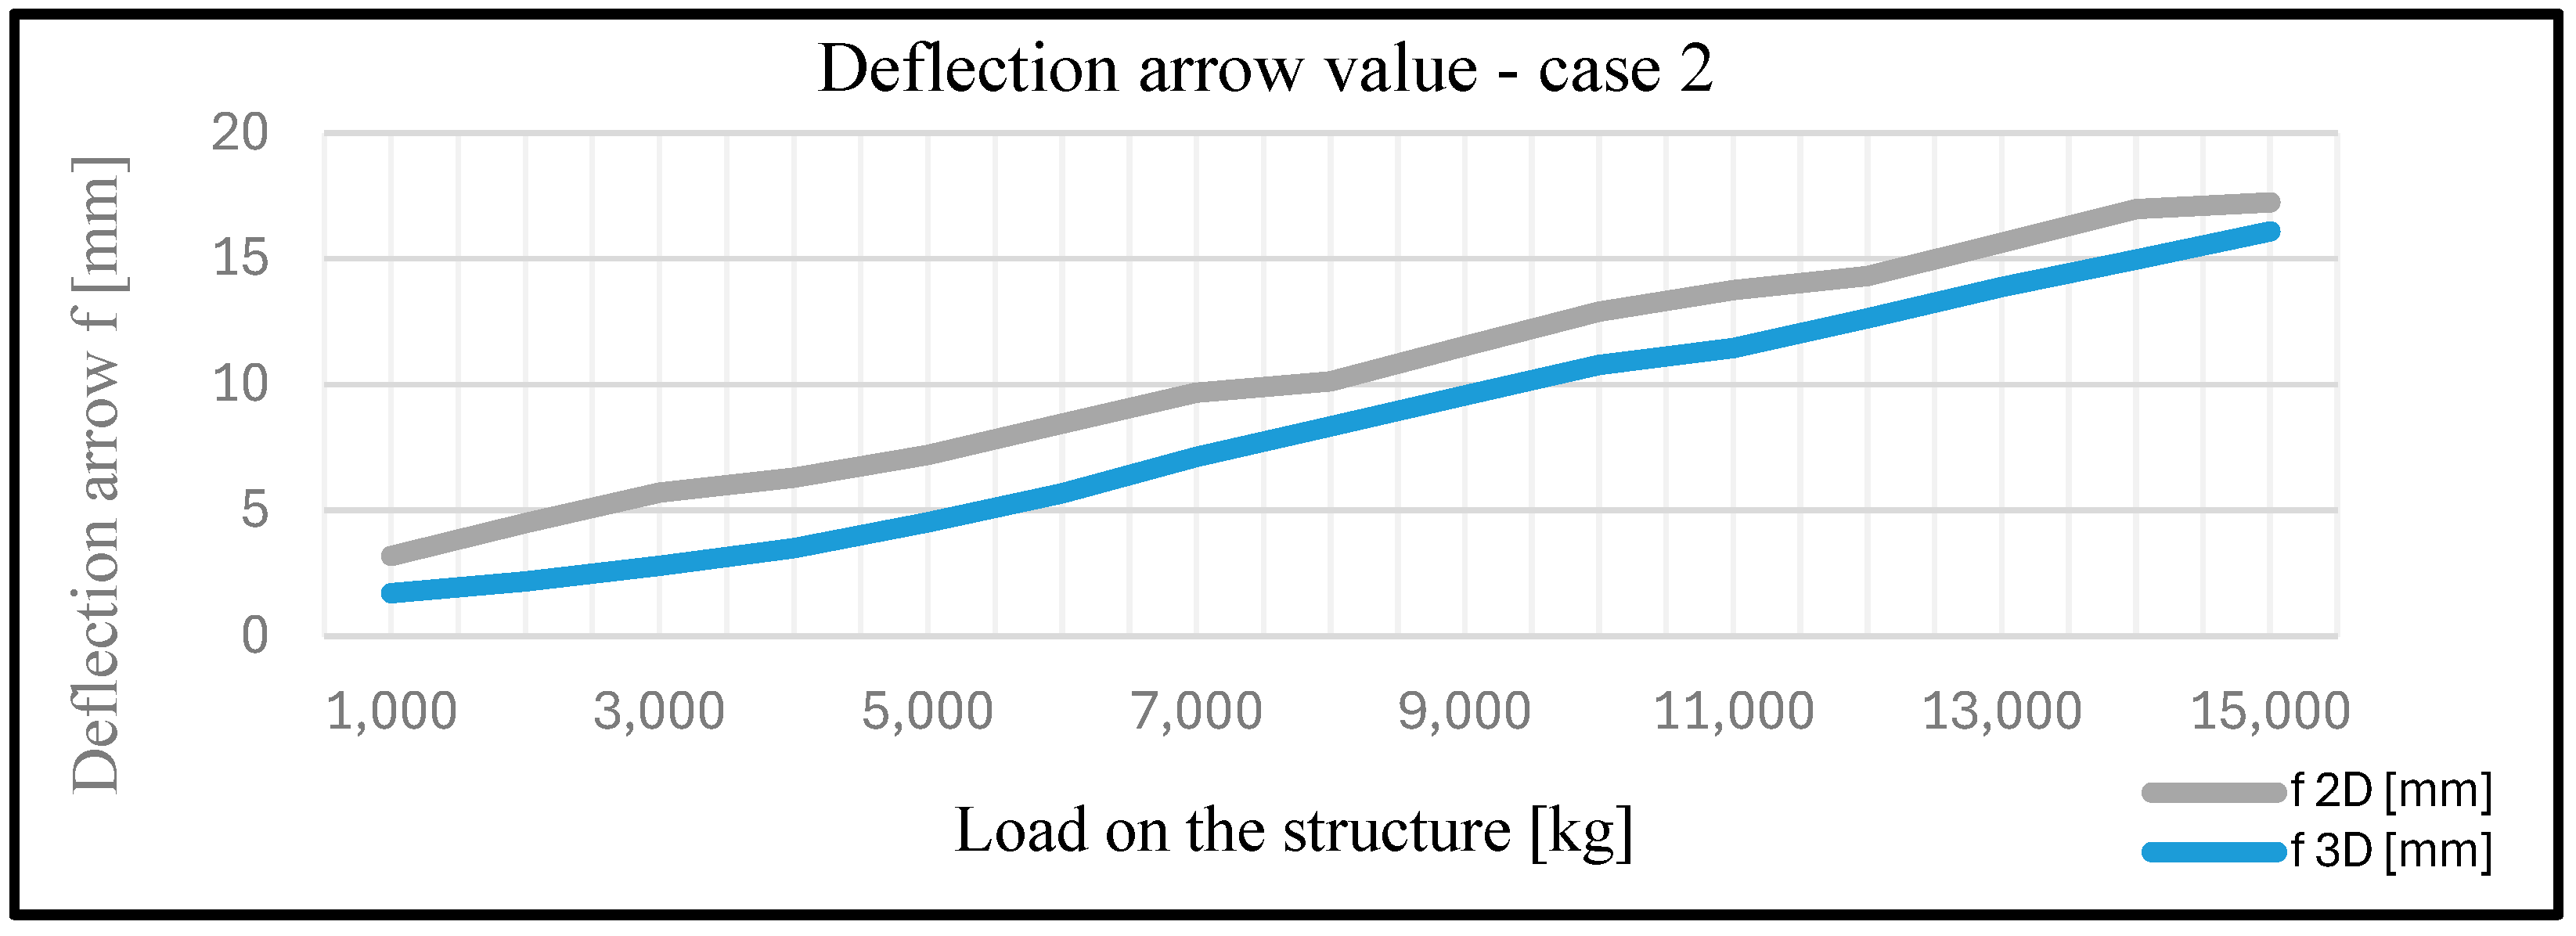
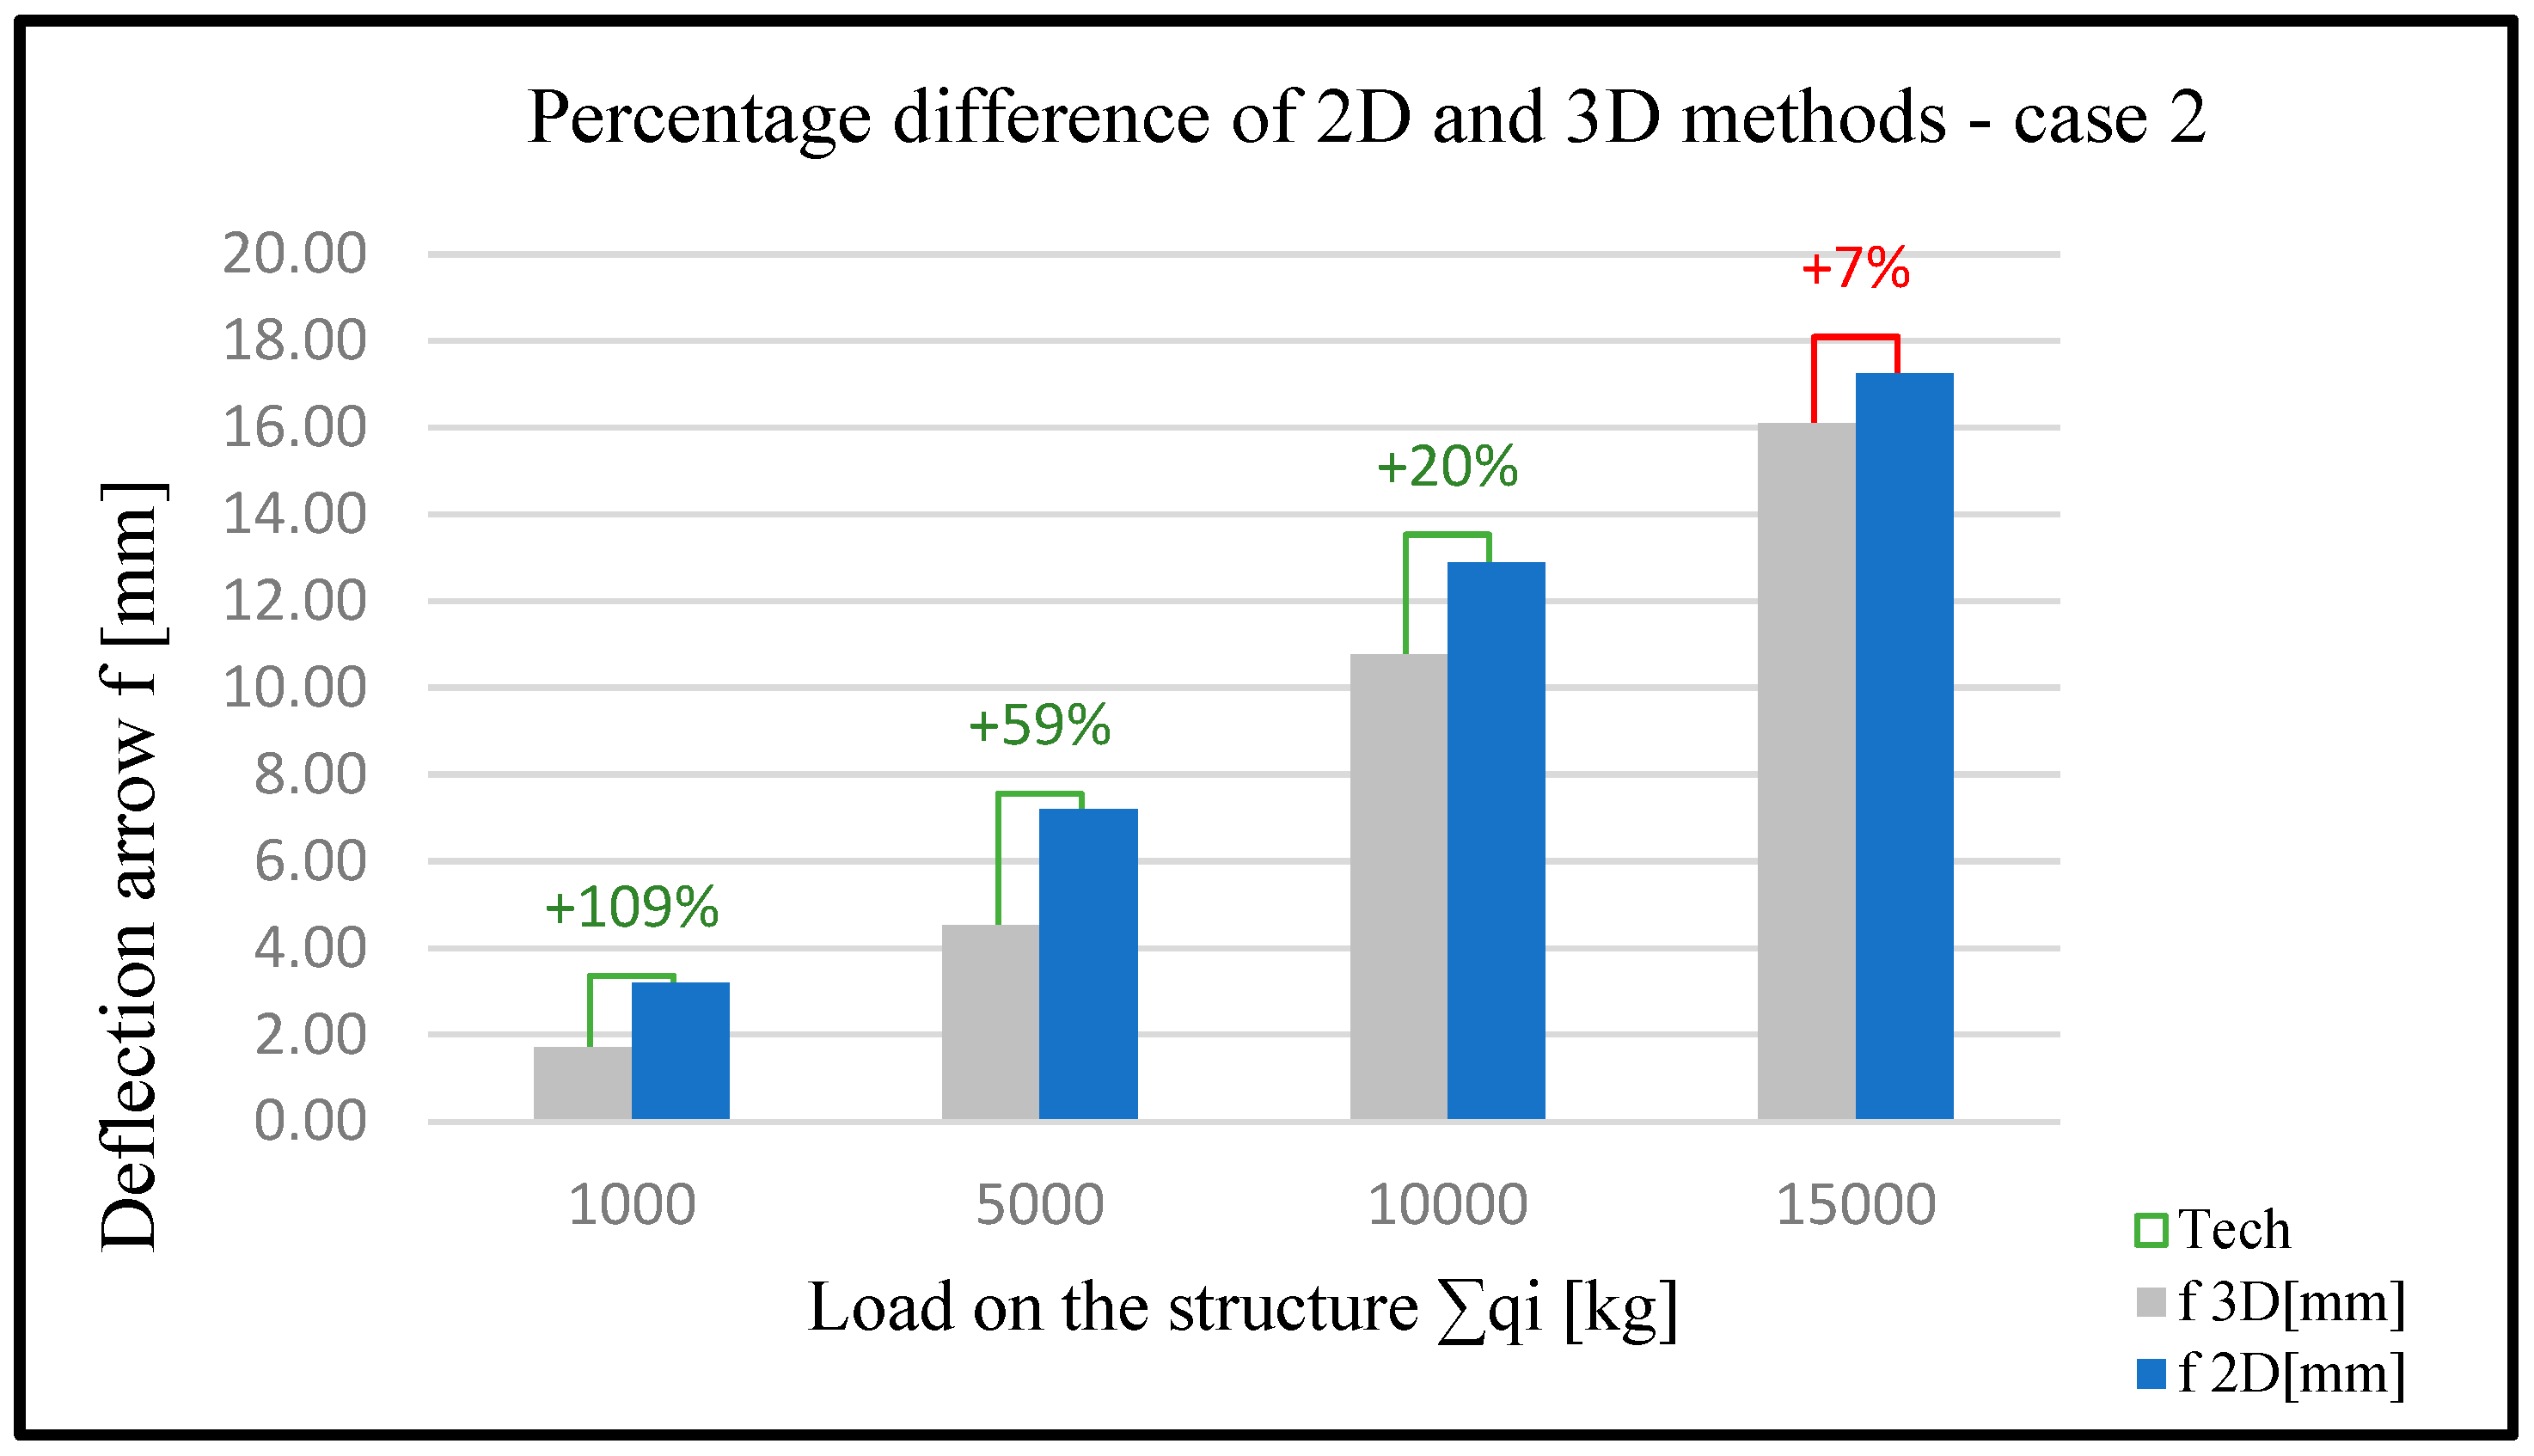
| Load Results | ||||||||
|---|---|---|---|---|---|---|---|---|
| Case 2 | ||||||||
| q1 [kg] | q2 [kg] | q3 [kg] | q4 [kg] | ∑qi [kg] | f 2D [mm] | f 3D [mm] | Smax 2D [MPa] | Smax 3D [MPa] |
| 100 | 200 | 300 | 400 | 1000 | 3.2 | 1.71 | 40.47 | 18.31 |
| 200 | 400 | 600 | 800 | 2000 | 4.5 | 2.18 | 50.16 | 29.6 |
| 300 | 600 | 900 | 1200 | 3000 | 5.7 | 2.8 | 61 | 36.2 |
| 400 | 800 | 1200 | 1600 | 4000 | 6.3 | 3.49 | 67.51 | 40.02 |
| 500 | 1000 | 1500 | 2000 | 5000 | 7.2 | 4.52 | 74.81 | 47.71 |
| 600 | 1200 | 1800 | 2400 | 6000 | 8.45 | 5.67 | 83.15 | 60.45 |
| 700 | 1400 | 2100 | 2800 | 7000 | 9.67 | 7.12 | 88.64 | 75.12 |
| 800 | 1600 | 2400 | 3200 | 8000 | 10.12 | 8.34 | 95.2 | 90.36 |
| 900 | 1800 | 2700 | 3600 | 9000 | 11.53 | 9.56 | 100.38 | 105.67 |
| 1000 | 2000 | 3000 | 4000 | 10,000 | 12.89 | 10.78 | 106.7 | 120.89 |
| 1100 | 2200 | 3300 | 4400 | 11,000 | 13.76 | 11.45 | 110.68 | 134.9 |
| 1200 | 2400 | 3600 | 4800 | 12,000 | 14.31 | 12.63 | 120.94 | 145.37 |
| 1300 | 2600 | 3900 | 5200 | 13,000 | 15.64 | 13.87 | 135.57 | 155 |
| 1400 | 2800 | 4200 | 5600 | 14,000 | 16.98 | 14.96 | 145.83 | 160.11 |
| 1500 | 3000 | 4500 | 6000 | 15,000 | 17.24 | 16.1 | 152.33 | 166.8 |
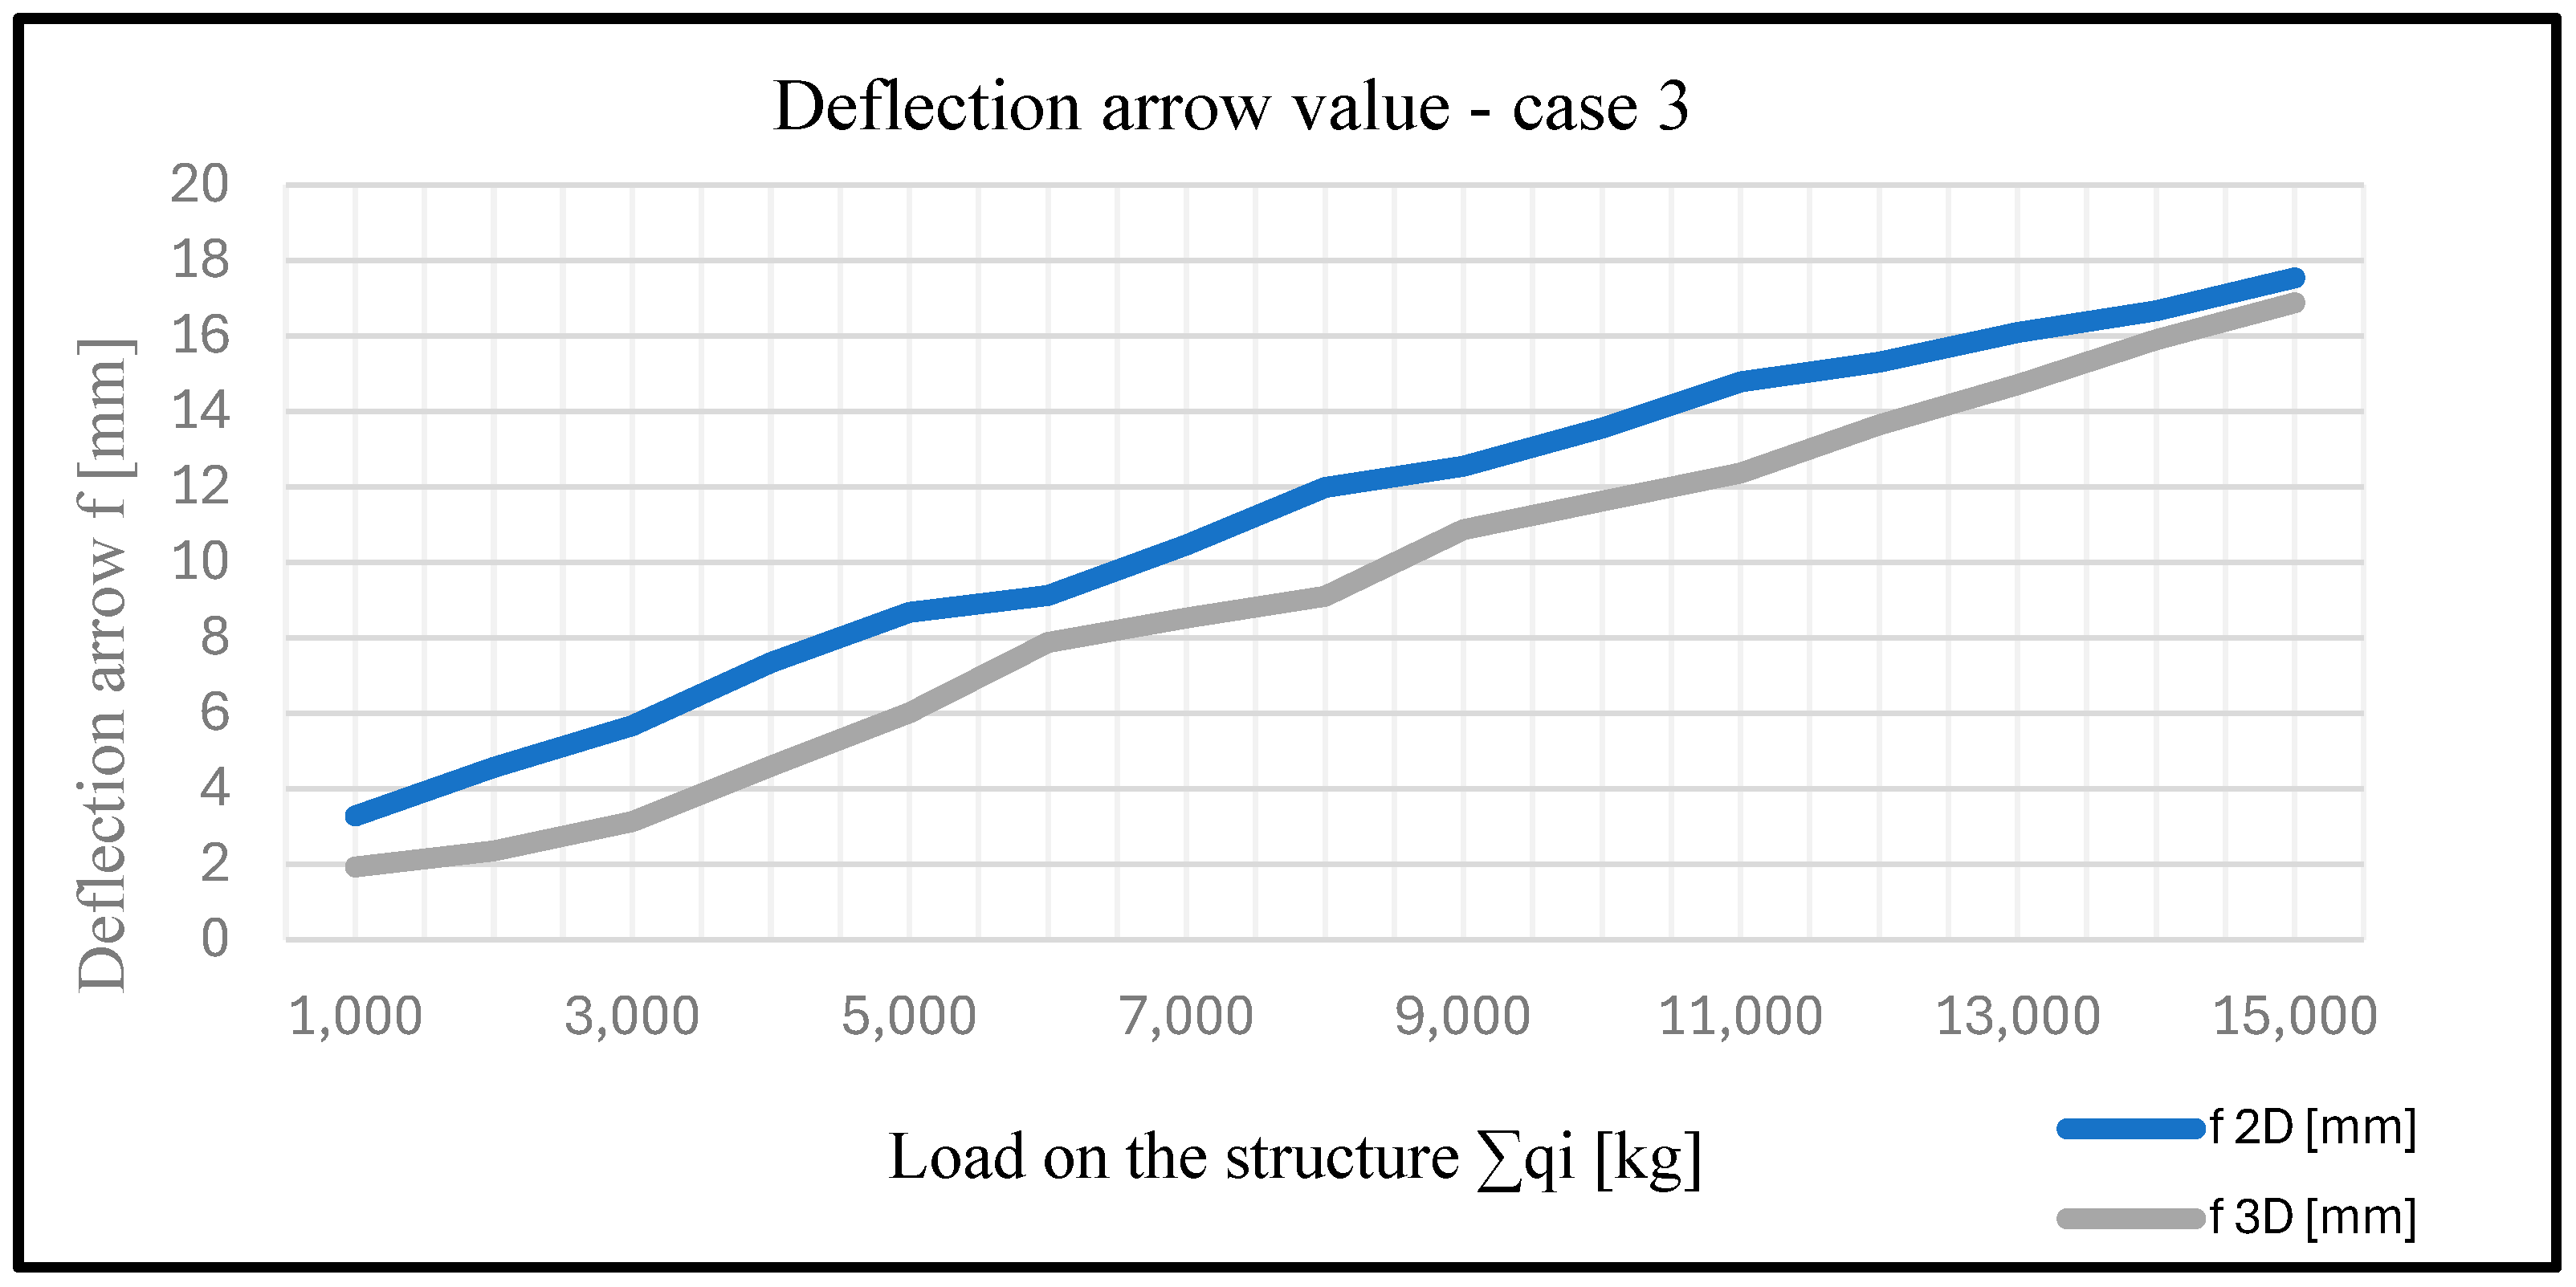
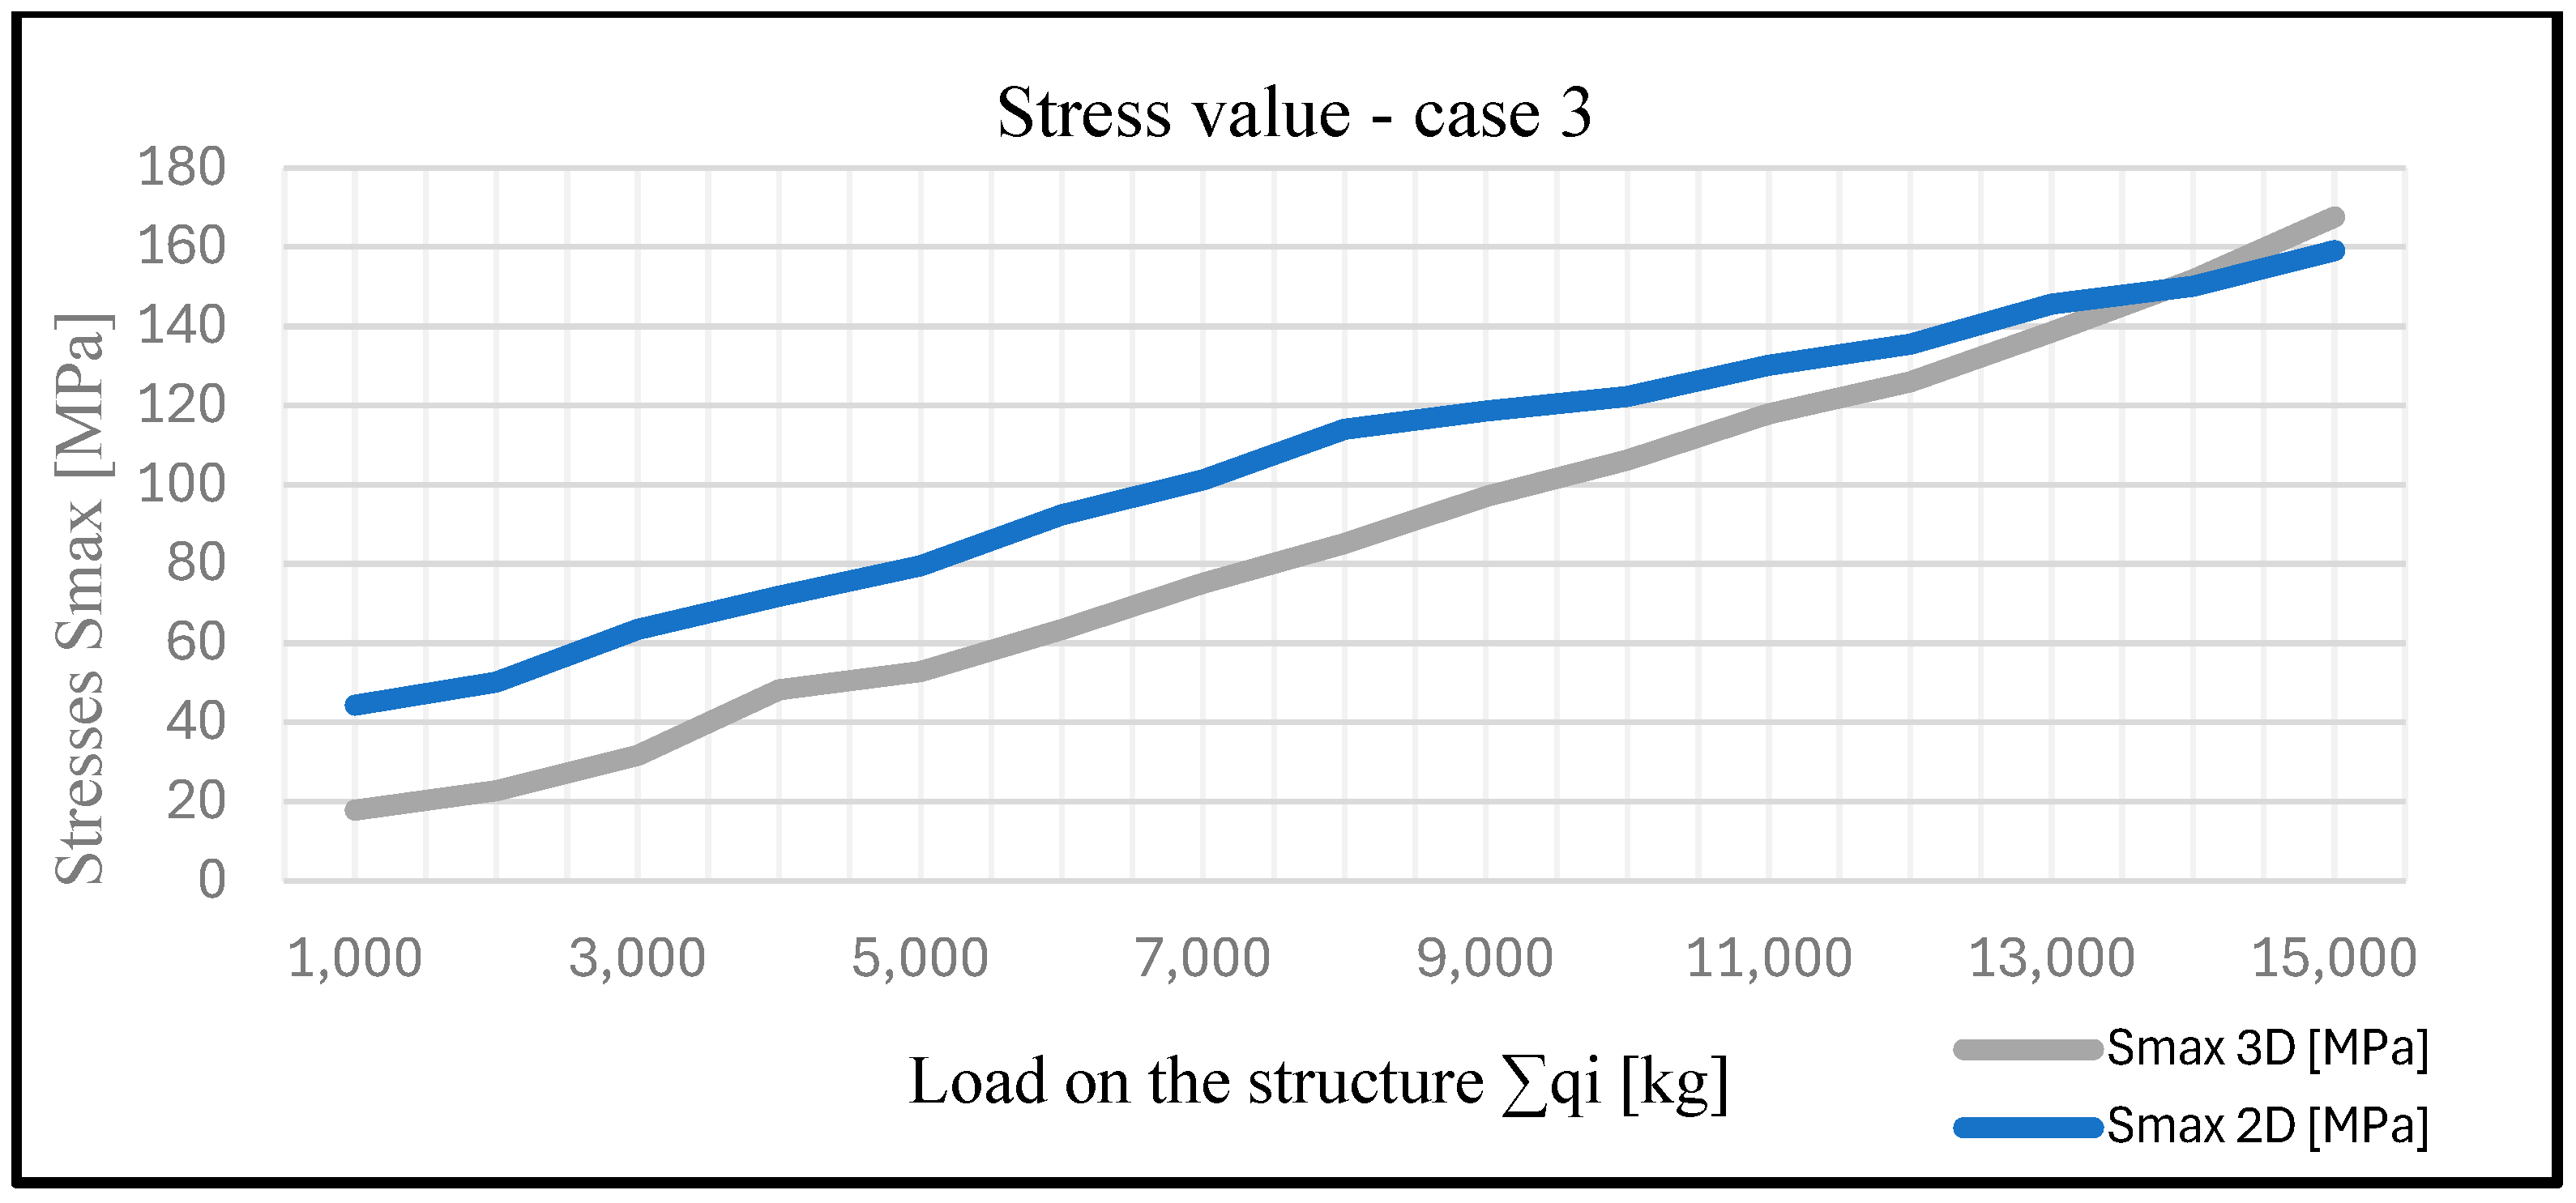
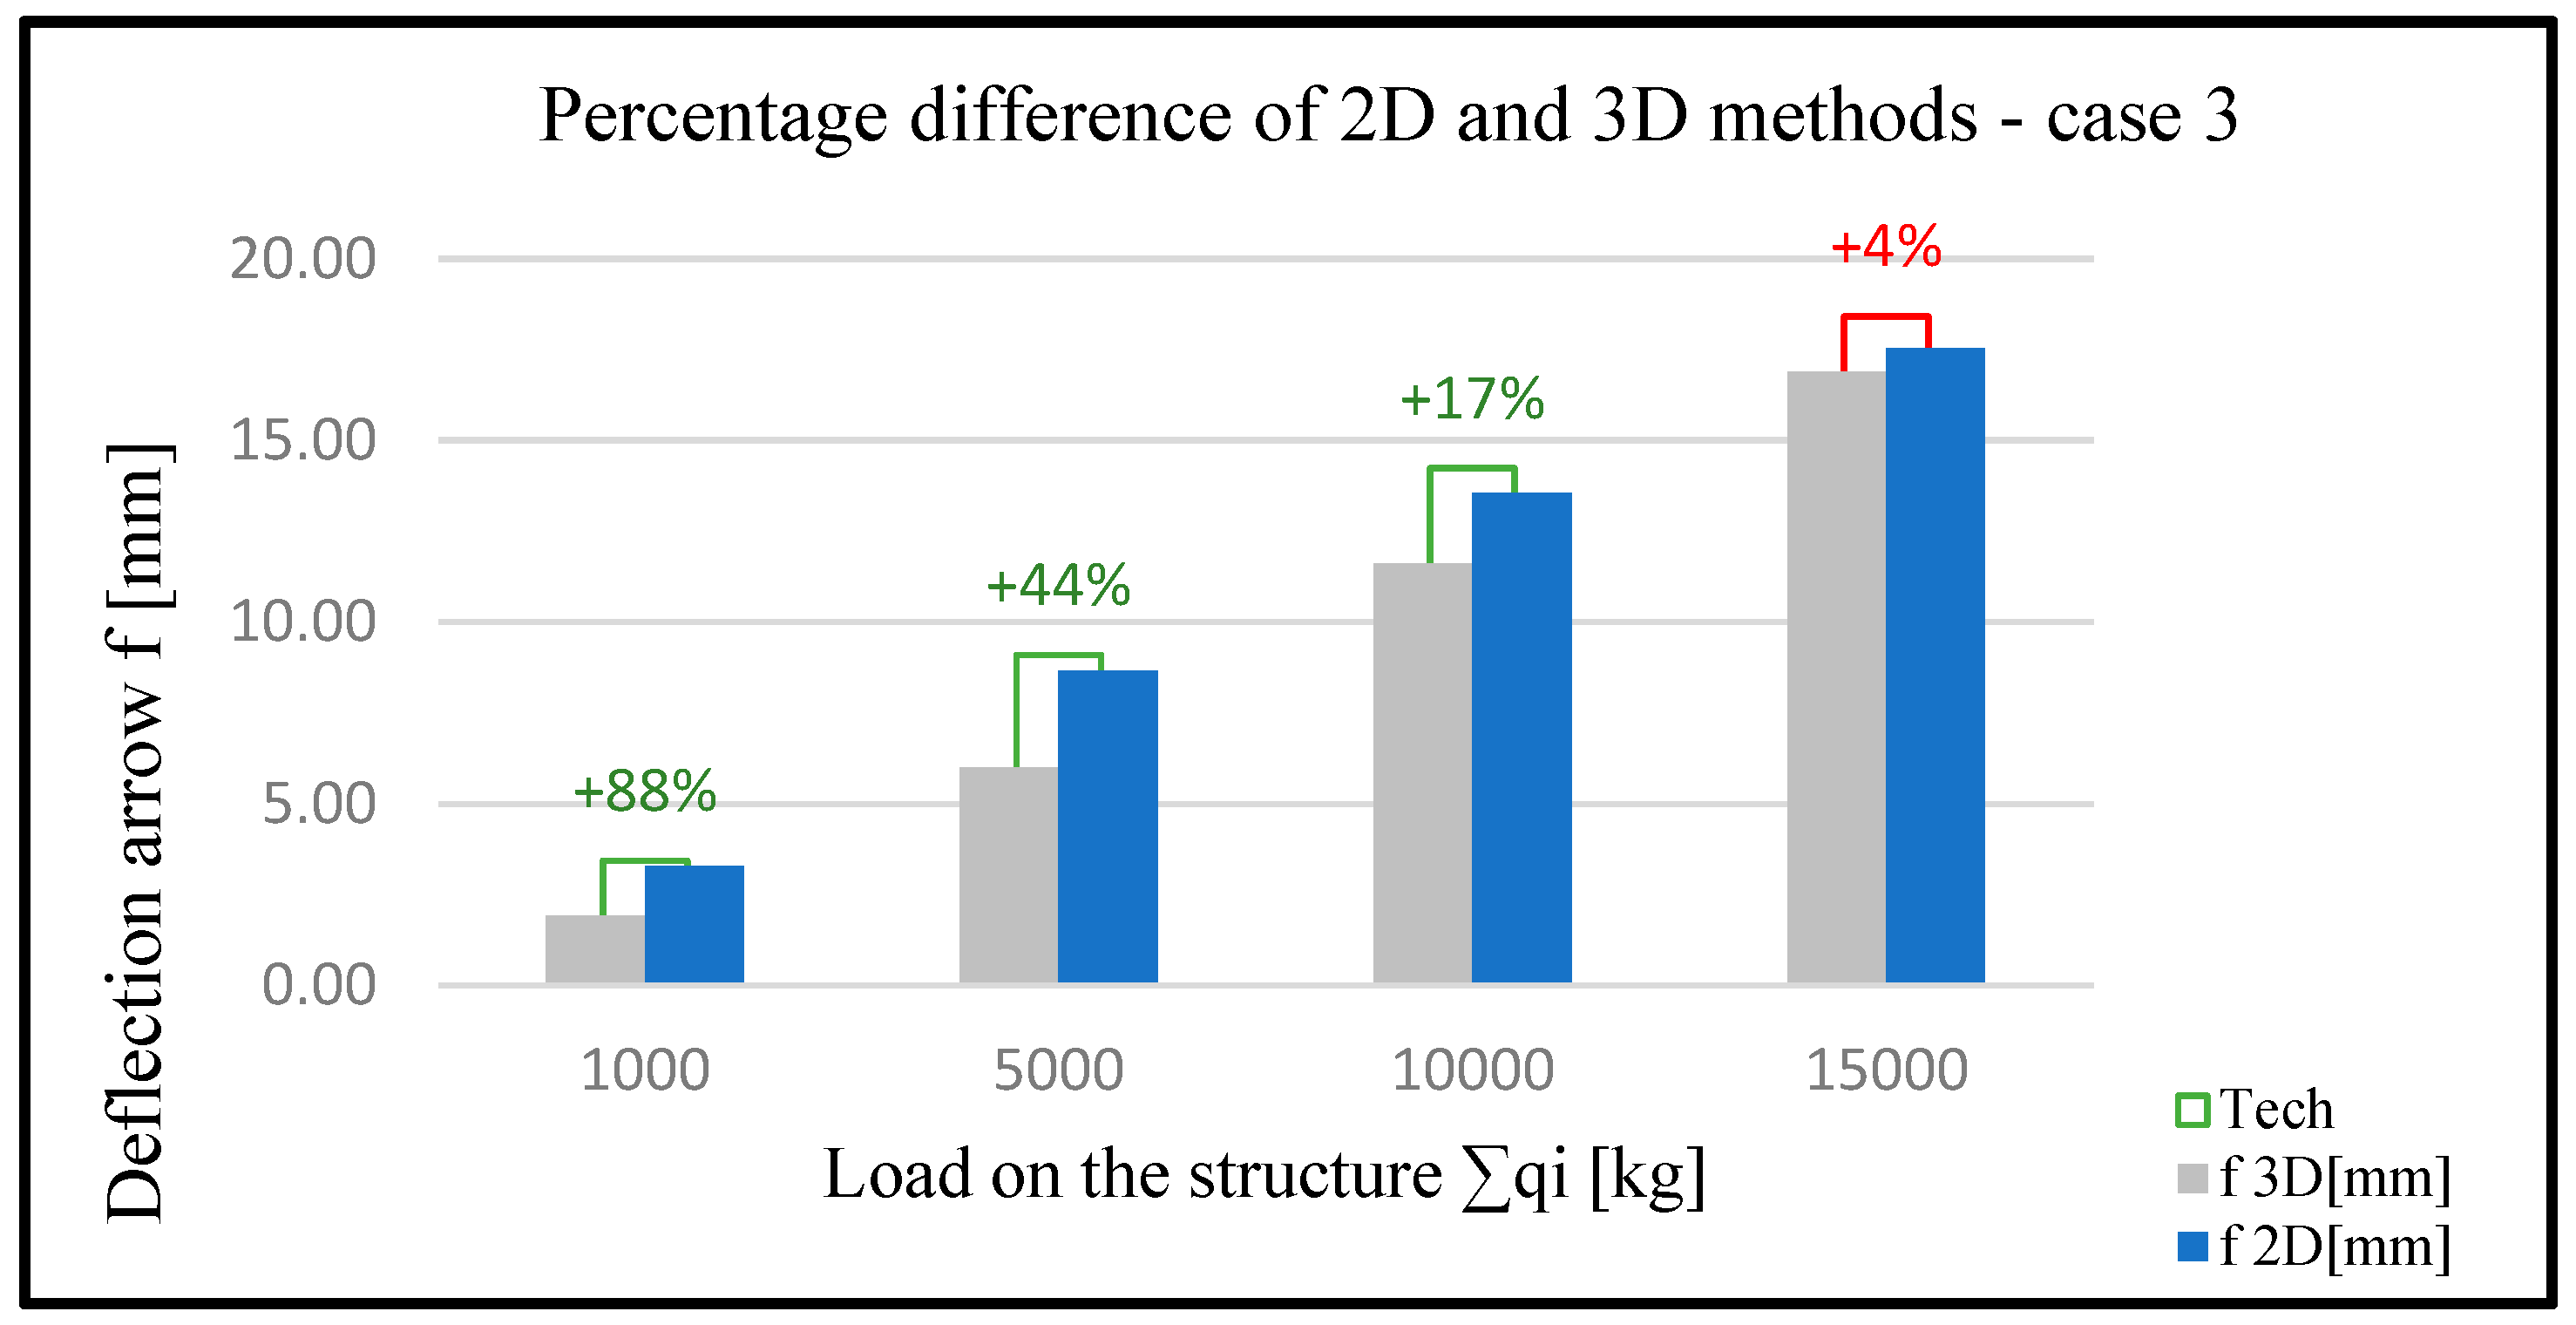
| Load Results | |||||||
|---|---|---|---|---|---|---|---|
| Case 3 | |||||||
| q1 [kg] | q2 [kg] | q3 [kg] | ∑qi [kg] | f 2D [mm] | f 3D [mm] | Smax 2D [MPa] | Smax 3D [MPa] |
| 100 | 200 | 400 | 1000 | 3.28 | 1.93 | 44.39 | 17.85 |
| 200 | 400 | 800 | 2000 | 4.56 | 2.35 | 50.12 | 22.68 |
| 300 | 600 | 1200 | 3000 | 5.67 | 3.13 | 63.45 | 31.6 |
| 400 | 800 | 1600 | 4000 | 7.34 | 4.6 | 71.8 | 48.19 |
| 500 | 1000 | 2000 | 5000 | 8.67 | 6.01 | 79.48 | 52.83 |
| 600 | 1200 | 2400 | 6000 | 9.12 | 7.87 | 92.39 | 63.46 |
| 800 | 1200 | 3000 | 7000 | 10.46 | 8.52 | 101.23 | 75.08 |
| 1000 | 1500 | 3000 | 8000 | 11.98 | 9.1 | 114 | 85.14 |
| 1000 | 2000 | 3000 | 9000 | 12.55 | 10.86 | 118.64 | 97.03 |
| 1000 | 2000 | 4000 | 10,000 | 13.56 | 11.62 | 122.25 | 106.2 |
| 1100 | 2200 | 4400 | 11,000 | 14.78 | 12.37 | 130.11 | 117.84 |
| 1200 | 2400 | 4800 | 12,000 | 15.3 | 13.64 | 135.45 | 125.96 |
| 1300 | 2600 | 5200 | 13,000 | 16.09 | 14.71 | 145.62 | 138.5 |
| 1400 | 2800 | 5600 | 14,000 | 16.67 | 15.9 | 150.12 | 151.71 |
| 2000 | 3000 | 5000 | 15,000 | 17.54 | 16.88 | 159.2 | 167.67 |
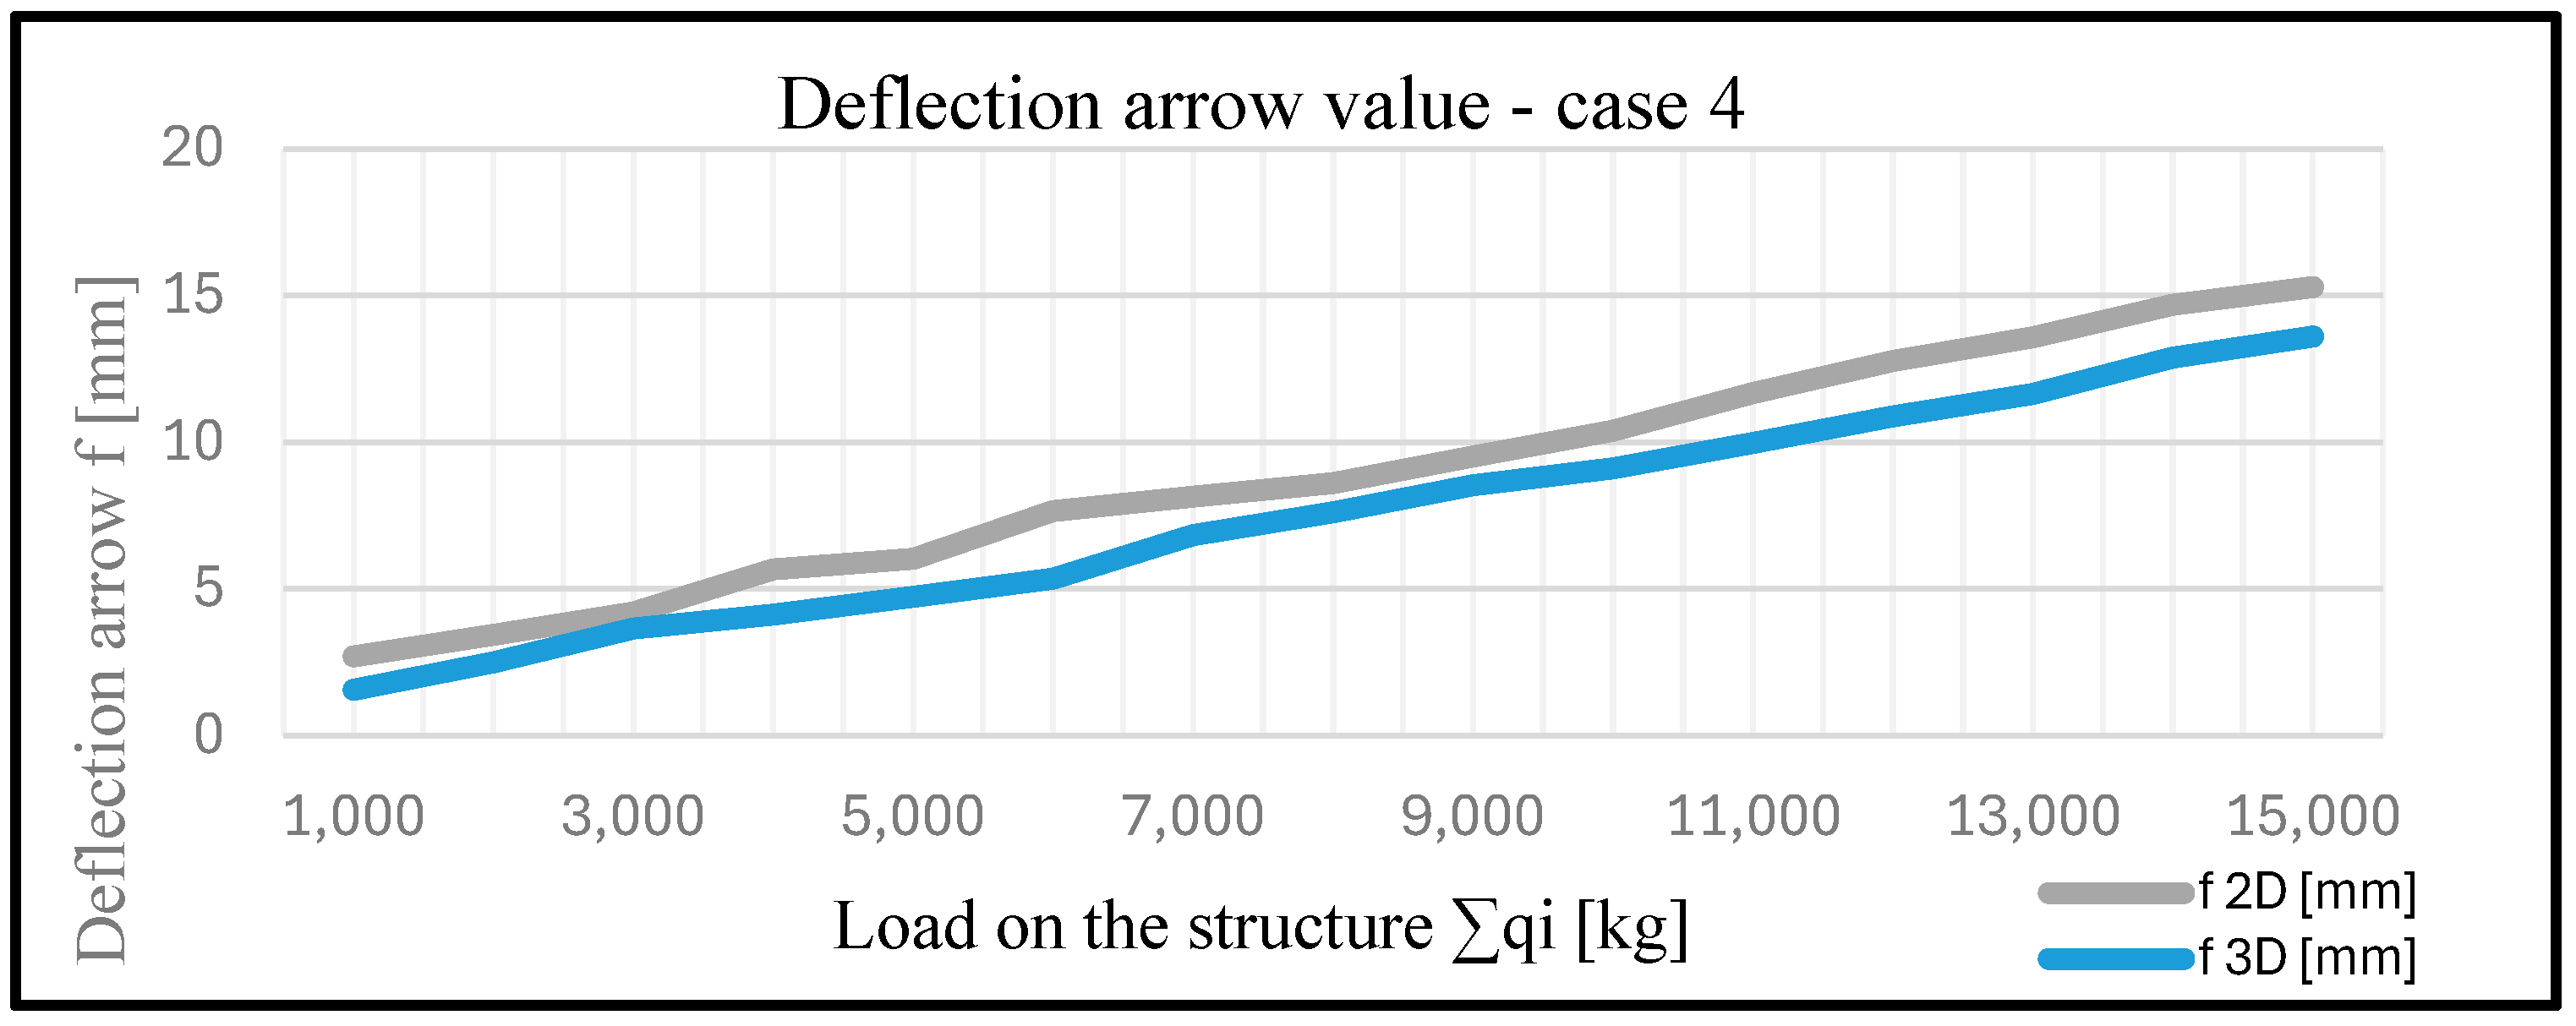
| Load Results | |||||||
|---|---|---|---|---|---|---|---|
| Case 4 | |||||||
| q1 [kg] | q2 [kg] | q3 [kg] | ∑qi [kg] | f 2D [mm] | f 3D [mm] | Smax 2D [MPa] | Smax 3D [MPa] |
| 100 | 200 | 250 | 1000 | 2.7 | 1.56 | 35.64 | 15.24 |
| 200 | 400 | 500 | 2000 | 3.43 | 2.5 | 43.05 | 19.7 |
| 300 | 600 | 750 | 3000 | 4.19 | 3.65 | 50.86 | 24.65 |
| 400 | 800 | 1000 | 4000 | 5.66 | 4.12 | 58.04 | 30.15 |
| 500 | 1000 | 1250 | 5000 | 6.02 | 4.72 | 65.38 | 48.64 |
| 600 | 1200 | 1500 | 6000 | 7.65 | 5.34 | 70.2 | 55.12 |
| 800 | 1400 | 1700 | 7000 | 8.14 | 6.82 | 76.9 | 64.63 |
| 1000 | 1600 | 1900 | 8000 | 8.6 | 7.61 | 82.5 | 77.5 |
| 1100 | 1800 | 2150 | 9000 | 9.5 | 8.53 | 90.65 | 88.67 |
| 1200 | 1900 | 2500 | 10,000 | 10.38 | 9.1 | 98.6 | 103.5 |
| 1300 | 2250 | 2600 | 11,000 | 11.67 | 9.97 | 108.6 | 112.58 |
| 1400 | 2400 | 2900 | 12,000 | 12.76 | 10.87 | 111.48 | 120.65 |
| 1500 | 2500 | 3250 | 13,000 | 13.57 | 11.64 | 119.34 | 131.49 |
| 1600 | 2600 | 3600 | 14,000 | 14.68 | 12.88 | 127.98 | 137.27 |
| 2000 | 2750 | 3750 | 15,000 | 15.28 | 13.6 | 138.65 | 144.5 |
Disclaimer/Publisher’s Note: The statements, opinions and data contained in all publications are solely those of the individual author(s) and contributor(s) and not of MDPI and/or the editor(s). MDPI and/or the editor(s) disclaim responsibility for any injury to people or property resulting from any ideas, methods, instructions or products referred to in the content. |
© 2025 by the authors. Licensee MDPI, Basel, Switzerland. This article is an open access article distributed under the terms and conditions of the Creative Commons Attribution (CC BY) license (https://creativecommons.org/licenses/by/4.0/).
Share and Cite
Wyrąbkiewicz, S.; Zastempowski, M.; Burczyński, J.; Gajewski, M. Analysis of Selected Methods of Computer-Aided Design for Stage Structures. Appl. Sci. 2025, 15, 6146. https://doi.org/10.3390/app15116146
Wyrąbkiewicz S, Zastempowski M, Burczyński J, Gajewski M. Analysis of Selected Methods of Computer-Aided Design for Stage Structures. Applied Sciences. 2025; 15(11):6146. https://doi.org/10.3390/app15116146
Chicago/Turabian StyleWyrąbkiewicz, Szymon, Marcin Zastempowski, Jurand Burczyński, and Maciej Gajewski. 2025. "Analysis of Selected Methods of Computer-Aided Design for Stage Structures" Applied Sciences 15, no. 11: 6146. https://doi.org/10.3390/app15116146
APA StyleWyrąbkiewicz, S., Zastempowski, M., Burczyński, J., & Gajewski, M. (2025). Analysis of Selected Methods of Computer-Aided Design for Stage Structures. Applied Sciences, 15(11), 6146. https://doi.org/10.3390/app15116146