Abstract
A person’s sense of comfort while sitting depends on numerous physical and psychological parameters. This study investigated the impact of different office chair seat and back designs on the user’s ability to assess differences in thermal comfort during office work tasks. Eighty-two healthy subjects assessed their thermal sensation, moisture perception, and thermal comfort on six chair models using questionnaire. The chairs varied in backrest design (mesh vs. PUR foam) and seat materials. Assessments were conducted in air-conditioned workplaces over three weeks. The results showed an overall neutral thermal sensation (mean rating of 4.12 on a seven-point scale), with warmth being more pronounced in the buttocks and thighs than in the back, alongside variations observed in seven of the fifteen indicators. The comfort of both the backrest and seat was crucial for overall thermal comfort, as was the perception of humidity among different chair models. The relationships between thermal sensation, humidity, and comfort differed by chair’s design. This study confirms the complexity of thermal comfort in seat and backrest design, highlighting the importance of localized thermal sensations in chairs, while demonstrating that application of subjective ratings can demonstrate differences between chairs. Future research should address methodological limitations, incorporate objective measurements, and explore seasonal variations and adaptive thermal comfort.
1. Introduction
It is common knowledge that prolonged sitting (or standing) represents a certain effort for the body. It is a bit strange that after some effort or standing for a long time, a person needs to sit down to rest, even though we know that this causes an unnatural posture for our body. Working while sitting on an office chair puts extra strain on the body, both physically and mentally, and when we consider thermal comfort, the problem becomes more pronounced. Kroemer and Kroemer [1] consider thermal comfort in office chairs crucial for ergonomics, productivity, health, and well-being, as it directly influences the physical and psychological states of office workers.
The question arises whether, and in what way, different designs of office chairs’ seats and backrests affect the participants’ sense of thermal comfort while performing usual daily work tasks.
Thermal comfort and thermal sensation are distinct but related concepts. Thermal sensation is a part of thermal comfort and serves as a sensory input that informs the subjective experience of comfort or discomfort. It is the immediate perception of temperature, such as feeling hot or cold, which is primarily based on signals from warm and cold receptors in the skin [2,3,4]. This perception is influenced by various factors, including air temperature, humidity, and individual differences, such as clothing and metabolic rate [5,6,7,8,9]. According to Hedge et al. [10] office chairs influence thermal comfort because of their impact on the heat exchange between the human body and the environment. The design and material of office chairs can influence the thermal insulation they provide, which in turn affects the user’s thermal perception and comfort [11]. Chairs with different insulation values, such as foam, mesh, and gel, have been studied to understand their impact on thermal comfort, although no significant differences were found under controlled conditions [10].
However, the choice of chair can still play a role in individual thermal perception, which is essential for maintaining comfort and reducing fatigue [9]. Rînjea et al. [12] found that health and well-being are affected by thermal comfort, as inappropriate thermal conditions can lead to thermal stress.
Thermal comfort is defined as the condition of mind that expresses satisfaction with the thermal environment, which include ambient temperature, air humidity, and ventilation, and it plays a role in both health and productivity, particularly in office environments where individuals spend time engaged in sedentary activities [6,13,14,15,16,17]. The thermal assessment of office chairs is important for improving occupant comfort and reducing energy consumption in office environments [18]. By optimizing the thermal properties of office chairs, it is possible to enhance user satisfaction and achieve significant energy savings [18,19].
The human body regulates heat through a complex interplay of physiological and behavioral mechanisms [1]. Psychological and physiological factors, such as individual preferences, age, sex (which further emphasizes the need for adaptable ergonomic solutions in office environments), and acclimatization, can modify perceptions of thermal comfort [4,20]. The body’s heat balance is maintained by ensuring that the heat produced through metabolism is equal to the heat lost to the environment, a concept central to Fanger’s heat balance model, which integrates physiological processes such as the sweat rate and skin temperature to predict thermal comfort [5].
1.1. Thermal Comfort in the Context of Office Chair
The interaction between a user’s body and a chair affects comfort, which is influenced by factors such as contact area, posture, and duration of sitting. The thermal comfort of a user is closely linked to the temperature at the interface between the body and the chair, with studies indicating that comfort is often achieved when the seat pan temperature is lower than the user’s body temperature [21].
The effects of seat materials on heat retention, dissipation, and moisture management are influenced by the thermal properties and structure of the material. For instance, foam materials have low thermal conductivity, allowing them to quickly accumulate heat and act as insulators. This characteristic can lead to a rapid increase in skin temperature within a short period. Despite their insulating properties, foam cushions may allow some air circulation due to their open-cell structure which can help in moisture dissipation, although this effect might not be significant without frequent movement [22,23]. Gel materials, known for their higher thermal conductivity, can conduct heat away from the body more efficiently, potentially enhancing thermal comfort by reducing heat retention. Mesh chairs, with lower insulation values, may offer better heat dissipation due to their structure, which allows for more airflow than solid materials [10].
In contrast, materials like leatherette may trap moisture, increasing the risk of discomfort and skin-related issues [10,23,24]. Infrared thermography studies [25] have shown that different chair materials can lead to varying heat retention and dissipation rates. The use of advanced materials and technologies, such as thermoelectric devices in heated/cooled chairs, can actively regulate the surface temperature of the chair, providing a more consistent thermal environment and enhancing comfort in both warm and cool conditions [26].
The need for ergonomic design, including features like adjustable armrests and lumbar support, that adapts to different positions and activities by promoting proper posture and reducing musculoskeletal strain, can affect the body surface available for heat exchange and user’s thermal comfort [21,25,27,28]. The sitting posture and contact area between the body and chair can modify the effective thermal insulation of the chair, as they affect the distribution of heat and pressure, potentially leading to discomfort if not properly managed [9]. The duration of sitting is another important aspect, as prolonged sitting can lead to discomfort. Movements or posture changes are often a response to discomfort and can be influenced by the thermal properties of the seating surface [21,25]. Gender differences have also been noticed, with women generally perceiving environments as cooler than men, which may affect their comfort levels differently during prolonged sitting [10].
1.2. Subjective Thermal Comfort: Affecting Factors and Assessments
Subjective assessment tools, such as the Predicted Mean Vote (PMV) and Thermal Sensation Vote (TSV), are important in the study of thermal comfort by capturing individual perceptions and experiences. The subjective assessment of thermal comfort in sedentary participants has been explored through scoping reviews that categorize studies based on parameters such as thermal sensation and comfort, effects of fatigue, and other related aspects [14]. Some other subjective tools, such as the “positive and negative affect schedule”, are used to assess emotional responses to thermal environments, highlighting the psychological dimensions of thermal comfort [29].
Thermal comfort is fundamentally defined as a state of mind that expresses satisfaction with the thermal environment, as outlined in ISO 7730 [30], which is inherently subjective and varies significantly among individuals owing to differences in metabolism, acclimatization, habits, and expectations. The subjectivity of thermal comfort makes it challenging to create a universally satisfactory thermal environment [4] and testing methods. Subjective evaluations may include scales for body moisture, comfort, and sweat levels, with participants providing feedback at regular intervals during the experiments [8,29]. In some studies, subjective data were collected through comfort/discomfort questionnaires, which were converted into quantitative indices using scales ranging from high discomfort to high comfort [28]. Fanger’s model, which includes the PMV-PPD index, provides a quantitative approach to evaluating indoor thermal environments [31]. In contrast, the TSV, which uses a 7-point scale ranging from cold to hot, is employed to directly capture individuals’ thermal sensations and comfort levels in various settings, including field studies and experimental conditions [29]. This scale allows for a more immediate and personal assessment of thermal comfort, reflecting the subjective nature of thermal perception.
Thermal comfort assessment when sitting on office chairs is a complex and intricate process that largely depends on the worker’s subjective assessment and numerous other physical and psychological parameters.
The objectives of this study were to investigate whether and what the impact of different designs of office chair seats and backrests is on participants’ assessment of differences in thermal sensations at their workplace. This study took into account the office climate and wearing clothes made of natural materials, whereby the thermal characteristics of chairs and clothing, temperature fluctuations in the room, the mood of the subjects, and their daily habits are excluded.
To achieve this, a survey of subjective assessments of thermal comfort was conducted using a questionnaire with a seven-point scale.
2. Materials and Methods
The research was conducted at the participants’ workplaces in three different companies, all located in Zagreb (Republic of Croatia), over a period of five months.
2.1. Participants
The study involved healthy individuals with normal height, age, habits, and occupations. The criteria for selecting participants were as follows: performing office work and not having a diagnosis of lumbar pain. All participants participated in the study voluntarily, without any compensation, and could withdraw at any time without giving a reason.
A total of 82 healthy subjects (52 females and 30 males) aged 19–64 years participated in the research. The data of the participants are presented in Table 1. Each participant in this study had 15 working days to evaluate thermal comfort on six office chairs. To minimize the influence of usual worker clothing [32], the participants were asked to wear cotton underwear and light linen or cotton clothing.

Table 1.
Subjects’ anthropometric data (male and female).
2.2. Chair Samples
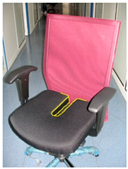
Six office chair models were used in this study (Table 2). The samples were selected according to the principles of ensuring proper body support in the working posture and a design that enables a proper and comfortable sitting posture as a precondition for comfort. In addition, attention was paid to compliance with contemporary EN 1335-1 [33] regarding dimensions.
Table 2.
Samples: the chairs’ codes and seat and backrest characteristics.
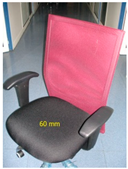
The cover material composition of all seats was 100% polyester, and the seat thickness was either 55 mm (models LS and MA) or 60 mm. The chair backrests were made with a breathable mesh cover (100% polyester, five models) and one model of molded polyurethane foam (PUR 3046). All the seats and backrests were made of non-hygroscopic materials.
Prior to the measurement, the height of the seats and armrests was adjusted to each participant and according to their table height, corresponding to basic ergonomic criteria.
2.3. Methods
One common method for the subjective assessment and evaluation of thermal comfort across different body areas is a seven-point thermal sensation scale, similar to the one presented in ISO 7730, which ranges from “cold” to “hot”. The questionnaire presented by Cengiz and Babalık [8] was used.
When the participants were introduced to the samples, they were informed that each model differed in seat design, making it unique. No other details or differences were provided. Each participant sat on each sample for two working days according to a predetermined schedule. The first day was used to adjust the chair to the participant and accustom the participant to the chair. On the second day, after at least six hours of sitting on a particular sample, the participants filled out a questionnaire. The participants were not asked to sit according to predetermined instructions, but to behave naturally and normally at their workplace. Participants sat in their usual sitting positions (Figure 1) and completed the thermal comfort assessment questionnaire only once per chair.
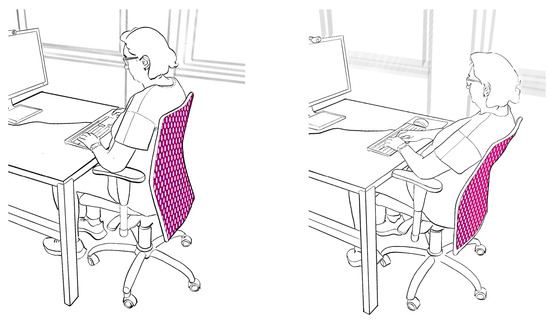
Figure 1.
Typical sitting positions that users took during the experiment, (left) upright sitting (e.g., administrative work), (right) reclined sitting (e.g., developer work) (drawings by Z. Vlaović).
Measurements were carried out in three different air-conditioned spaces at a mean temperature of 23.4 °C and relative humidity of 34.2% throughout the trial period. During the experiment, the temperature and humidity of each space were measured. The participants recorded the temperature and %RH values when they completed the questionnaire for a particular chair for the particular work space. Table 3 shows the combined overall temperature and humidity data for all work spaces at the time of the thermal assessment of each chair sample.
Table 3.
Temperature and relative humidity in work spaces during the assessment of a particular chair (combined data).
The questionnaire (Table 4) on thermal comfort consisted of four sections:
Table 4.
Thermal comfort questionnaire.
- (1)
- Seven-point thermal sensation scale for ten body regions (indicators T1–T10);
- (2)
- Four-point scale for moisture in two body regions (T11, T12);
- (3)
- Three-point scale for thermal comfort on two chair parts (T13, T14), and;
- (4)
- Four-point scale for participants’ sweating level (T15).
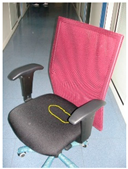
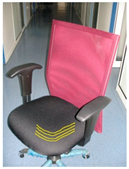
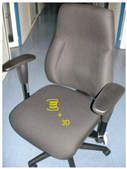
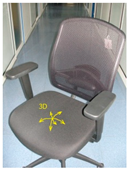
Figure 2 shows the points corresponding to the approximate parts of the body (indicators) that the users focused on when filling out the questionnaire. The pictures were an integral part of the questionnaire.
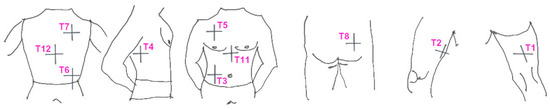
Figure 2.
Illustration of the position of the body warmth (T1–T8) and body moisture (T11–T12) indicators as a guide for users when filling out the questionnaire (drawing by B. Iliev).
3. Results and Discussion
3.1. Subjective Assessments of Thermal Sensation
Table 5 and Table 6 presents the subjective assessments of the thermal indicators (coded T1–T15) for each chair.
Table 5.
Subjective assessments for thermal indicators on ten body regions.
Table 6.
Subjective assessments for moisture, thermal comfort on chair, and level of sweating.
Assessments of the thermal sensation while sitting in chairs and performing daily work tasks yielded neutral results. Most respondents answered questions about the feeling of warmth in certain areas of the body and head (T1–T10) with a score of 4 (neutral) on the scale.
The overall average values of the thermal and moisture indicators for all the chairs are shown in Figure 3. In other words, each column presents the mean value of all chairs for a particular thermal indicator (T1–T15). A slightly higher average warmth rating was observed on the buttocks (T8, 4.48) and under the thighs (T1, 4.28), but it was also slightly lower than the average on the back (T7, 3.98). The overall average score of the responses was 4.12 (Figure 3, purple line).
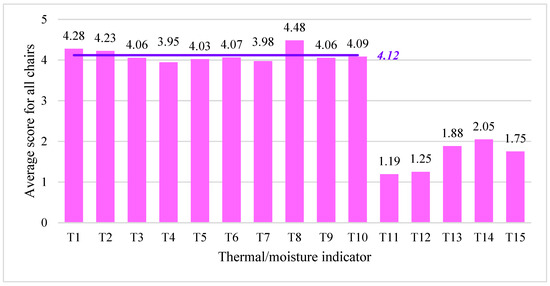
Figure 3.
Overall average value of thermal/moisture indicators for all chairs.
The mean values of the subjective assessments of the thermal sensation of the seating according to the chair models are shown in Figure 4. This chart shows the inter-relationships of the mean values of each indicator’s assessment for each chair.

Figure 4.
Mean values of assessments of thermal/moisture indicators for each chair.
The LS chair stood out at points T7 and T8 (back and buttocks). Recall that the LS chair was the only one with a PUR foam backrest, whereas the other chairs had mesh. For all chairs, the lowest score corresponds to the feeling of “cold”, and the highest score was given to the feeling of “warm”. The mean score for the back on the LS chair was 4.59, whereas for the other chairs (with mesh) it was very uniform and ranged from 3.80 to 3.93 (Table 5).
The seats all had the same cover material (100% polyester) but different combinations of polyurethane (PUR) foams. The ratings ranged from “cold” to “hot”, representing the full range of the 7-point scale, with the LS and MA models having the smallest range, from “slightly cool” to “hot”. The average rating for the sensation of warmth on the buttocks (T8) for the LS model was 4.83, while for the others, it ranged from 4.28 (BS) to 4.55 (MA).
The responses to the questions about the thermal comfort on the backrest (T13) and seat (T14) were in line with the previous analyses and the points related to these indicators. Although the ratings range around the “medium” of the 3-point scale, the thermal comfort of the seat is expectedly higher, with an average rating of 2.05. The highest ratings were given to the LS and RS seats (2.08), but no other seats were rated lower than 2 (medium). The thermal comfort of the backrest was rated with an average rating of 1.88, which is expected considering the design, with the highest rating given to the LS model (2.00) and the other backrests not receiving ratings lower than 1.8.
When we look at the responses regarding the feel of body moisture on the front and back torso and the degree of sweating (Table 5), they are in the lower range of the 4-point scale. The moisture ratings on the front torso (T11) and back torso (T12) were 1.19 and 1.25, respectively, and the average rating for the level of sweating (T15) was 1.75. The lowest sweat rating was given to the BS chair (1.71), and the highest ratings were given to the LS and RS chairs (1.78 and 1.79, respectively). This result coincided with the ratings of the thermal comfort of the seats and led to the conclusion that it was indeed warmer to sit on these seats.
3.2. Testing Differences in Thermal Assessment Results
To test whether the chairs differed in terms of the assessment of their thermal characteristics, a non-parametric Kruskal–Wallis test was performed, since the normal distribution of responses was not met as an assumption for conducting a one-way ANOVA test. The answers are divided into six groups, according to which chair they refer to. The analysis examined 15 different thermal indicators (T1–T15), likely representing various aspects of thermal and moisture performance that contribute to overall sitting comfort in office environments. The Kruskal–Wallis test did not indicate which of the tested chairs differed (paired test), but only the existence of differences between them in the tested estimates. Table 7 shows the values of the test statistics and the corresponding p-values.
Table 7.
Kruskal–Wallis test results of differences between chairs.
Among tested indicators, seven demonstrated statistically significant differences (T3, T4, T6, T7, T8, T10 and T12). These findings suggest that certain body regions are more sensitive to temperature changes caused by chair design or environmental factors. The most striking differences emerged in the back region (T7), which showed an exceptionally high value of test statistic (46.53). This pronounced variation likely stems from the fundamental difference between the mesh backrest designs (allowing greater airflow) and the foam backrest design in the LS model. The significantly higher test statistic value for this indicator suggests that the backrest material and design profoundly affect the thermal sensation at the back.
Side-body thermal perception (T4) also demonstrated substantial variation, with a test statistic value of 23.39. This finding is particularly interesting because it relates to how the backrest design of the chair interfaces with the user’s lateral body regions. This significant variation may reflect the differences in how each chair model constrains or facilitates airflow at the sides of the torso. Given the close proximity of this indicator, the subjects likely associated this feeling with warmth around the kidneys.
Waist-level thermal sensation (T6) showed significant differences potentially reflecting the various backrest designs and their contact with the lower back region. Similarly, bottom thermal perception (T8) exhibited significant variation, likely influenced by the diverse seat constructions, from specialized anatomical designs (BS and IS) to technology-enhanced structures (LS and MA).
Stomach thermal sensation (T3) also demonstrated significant differences, although to a lesser degree than the aforementioned regions. This variation might be related to the influence of different seat designs on posture, which in turn affects abdominal compression and the resulting thermal sensation. Torso back (T12) as a moisture indicator showed significant variations across the chair models. The torso back moisture sensation demonstrated greater variation, which aligns with the substantial differences observed in the back thermal perception (T7). This correlation suggests that the backrest design influences both temperature and moisture management, with a breathable mesh likely providing better moisture dissipation than foam.
In contrast to the indicators that showed significant differences, most thermal indicators (T1, T2, T5, T9, T11, T13, T14, and T15) did not demonstrate statistically significant variations across the test conditions. Backrest comfort, seat comfort, and sweat levels exhibited relatively low test statistic values. This suggests that, while specific thermal sensations vary significantly, overall comfort perceptions and sweat accumulation remain relatively consistent across different chair designs.
3.3. Correlations of Thermal Comfort Indicators with Comfort and Discomfort Scales
Thermal comfort assessments for this study were conducted as part of an investigation on the general comfort and discomfort of sitting on office chairs, using the Chair Evaluation Checklist (CEC-14) developed by Helander and Zhang [34]. The values obtained for comfort and discomfort scales were extracted and thermal comfort indicators were correlated with them.
Table 8 presents Pearson correlation coefficients (r) for the relationships between the selected thermal indicators and the comfort and discomfort scales. This structure allows for the identification of meaningful relationships between specific thermal sensations and overall comfort perceptions.
Table 8.
Correlations of thermal comfort indicators with comfort and discomfort scales (CEC-14).
The most significant finding was the consistent, strong positive correlation between backrest thermal comfort (T13) and overall comfort across all the chair designs. This relationship was highly significant for every chair type, with correlation coefficients ranging from 0.401 (BS) to 0.617 for the LS chair. Similarly, seat thermal comfort (T14) demonstrated significant positive correlations with overall comfort across all chair types, with the LS chair exhibiting the strongest relationship (0.513). These findings establish that fundamental support elements, specifically backrest and seat comfort, transcend specific design variations as primary comfort determinants.
A consistent pattern emerged regarding moisture perception and comfort ratings. Torso back moisture perception (T12) showed significant negative correlations with comfort for the LS (−0.266) and RS (−0.247) chairs, indicating that increased moisture in the back-contact area diminishes comfort. The relationship between moisture and discomfort was more striking. Torso front moisture (T11) was significantly correlated with discomfort for multiple chair designs, especially IS (0.342), KS (0.254), and LS (0.323). Similarly, torso back moisture (T12) showed significant positive correlations with discomfort for the IS (0.363) and LS (0.342). These relationships demonstrate that a higher moisture perception in both the front and back torso areas contribute substantially to seating discomfort.
The analysis confirmed a consistent relationship between comfort and discomfort ratings. Both backrest thermal comfort (T13) and seat thermal comfort (T14) showed significant negative correlations with discomfort across almost all chair types, with the strongest negative correlations for backrest thermal comfort observed in the BS, MA, and RS chairs. This validates the measurement scales and confirms that comfort and discomfort are distinct, yet complementary entities [35].
Based on the given results, it can be noted that this study revealed predominantly neutral thermal sensations on the chairs. The overall mean thermal rating was 4.12 on a seven-point scale, indicating generally acceptable thermal conditions during the experiment. Notably, specific body regions exhibited varying thermal responses: higher warmth ratings were recorded at the buttocks and under thighs; the back region showed slightly cooler ratings on average; and significant variations were observed between the mesh and foam backrests. The data suggests that users experienced differences in thermal sensations, primarily due to the mesh construction of the backrest. Therefore, the backrest material may play a role in the overall perception of the chair’s thermal comfort. On the other hand, the seat materials did not cause such drastic differences.
Correlation analysis revealed that backrest and seat thermal comfort were the most consistently important factors determining the overall comfort across all chair designs. However, the specific patterns of correlation between thermal sensations, moisture perceptions, and comfort/discomfort varied significantly among the chair designs, reflecting their unique construction features. Moisture perception was negatively correlated with comfort and positively correlated with discomfort.
These findings show the complexity of thermal comfort in seating design and emphasize the importance of considering both overall support and localized thermal sensations when designing ergonomic chairs.
Researching office chairs using subjective methods is not new in itself, but this research demonstrates a different approach in trying to obtain answers about the thermal comfort of sitting on office chairs during daily use in an office environment. This study differs from existing studies in that it was conducted in real workplaces rather than in controlled laboratory conditions, that it was conducted with a relatively large number of subjects, and that most of the chairs were uniform in appearance, thereby preventing the influence of visual impression on the perception of thermal comfort.
It should be emphasized that the subjects were not aware of the type, combination, and quality of the material in the seat they were sitting on. Such research conditions enabled honest responses from subjects, because they do not have an “objective basis” for prejudice, but are based on the actual experience and perception of the chair user. Here, we can highlight an interesting result: considering the differences in the responses shown in Figure 4, where it is visible that all chairs are equally rated slightly below neutral, the indicator T7 stands out from the “average” for the LS chair model. This difference suggests the thesis that the subjects were potentially influenced by the visual impression, and that they might have subconsciously assessed the comfort and other characteristics of the LS chair believing that a chair with a “full volume” of seat and backrest should be warmer to sit on than chairs with breathable and cooler mesh elements (all the others). It is the fact that of the six chairs used in the study, five had a combination of mesh backrest and PUR foam seat, which, although of different characteristics, were potentially not recognized in terms of quality by the subjects. Given the complexity of the problem, this is just a hypothesis for some future research in which combinations of different materials should be used on seats and backrests (such as PUR foam vs. mesh, mesh vs. mesh, PUR vs. PUR or gel, recycled materials, etc.).
Several methodological limitations and conceptual gaps were identified, which require consideration for a comprehensive understanding of the limitations of the study and opportunities for improvement for future research:
- Uncontrolled environmental factors (lack of monitoring of localized variations in airflow patterns around the workplace, potential differences in radiant temperature from surrounding surfaces, possible variations in HVAC performance across different office zones, etc.) could influence thermal perception beyond chair design effects alone.
- The gender distribution (52 women, 30 men) introduces potential bias, especially considering the well-documented gender differences in thermal perception.
- Clothing insulation values were not standardized or measured, individual layering differences were not controlled, and thermal history or prior activity levels before assessments were not accounted for.
- Temporal limitations with a relatively short exposure period provide only a snapshot rather than a longitudinal understanding of comfort, do not account for potential seasonal acclimatization impacts, and lack assessment of how thermal perceptions might evolve throughout the workday.
- Incorporation of thermal imaging to visualize the temperature distribution at the body-chair interfaces. The integration of objective measurements with subjective assessments provides deeper insights into heat transfer mechanisms.
- Including greater differences in the design of the seat/backrest and the materials used, which, in addition to the visual ones, will further increase the differences between the chairs.
4. Conclusions
This study examined the impact of the office chair seat and backrest design on thermal comfort during work tasks in participants’ actual workplaces, taking into account the office environment and clothing from natural materials, while excluding certain physical conditions (such as the thermal characteristics of the chairs and clothing, fluctuations in room temperature, the subjects’ mood, and their daily habits).
The study expands the understanding of thermal comfort in office settings by quantifying subjective thermal perceptions across available chair designs. The findings highlight the importance of backrest material selection in managing thermal comfort, with mesh designs demonstrating higher thermal regulation compared with foam. The measurement technique employing 15 distinct thermal indicators offers a comprehensive evaluation framework for assessing the thermal performance of office seating.
The identified limitations suggest several directions for future research. Some of these include controlled laboratory studies with standardized environmental conditions and clothing, long-term field studies examining adaptive thermal comfort in different seasons, the integration of objective physiological measurements with subjective assessments, as well as investigations into newly available eco-friendly materials and designs incorporated into different types of office chairs.
For future chair designs, the strong correlations between seat/backrest thermal comfort and overall comfort suggest these should remain primary design considerations, while the varying thermal and moisture correlations indicate that material selection should be tailored to address specific comfort requirements for different body regions.
Despite certain limitations and shortcomings of the study, by systematically addressing thermal comfort considerations, manufacturers can enhance the overall sitting experience, potentially improving user satisfaction, reducing discomfort during prolonged sitting, and supporting workplace productivity through improved physical well-being. In addition, the presented method can help when deciding on the selection of a potential work chair, as it offers a simple way to check expected user satisfaction.
Author Contributions
Conceptualization, Z.V. and D.D.; methodology, Z.V.; validation, Z.V., B.I. and D.D.; formal analysis, Z.V., B.I. and D.D.; investigation, Z.V.; resources, Z.V.; data curation, Z.V.; writing—original draft preparation, Z.V.; writing—review and editing, B.I. and D.D.; visualization, Z.V.; supervision, B.I. and D.D. All authors have read and agreed to the published version of the manuscript.
Funding
This research did not receive any external funding.
Institutional Review Board Statement
The study was conducted in accordance with the Declaration of Helsinki, and approved by the Ethics Committee of University of Zagreb Faculty of Forestry and Wood Technology (protocol code EP08-24/25, date of approval 9 April 2025).
Informed Consent Statement
Before the start, the research procedure and questionnaire, the research duration, and the method of data storage were explained orally to the participants, so they could withdraw at any time without explanation. Consent to participate in the research was an integral part of the questionnaire.
Data Availability Statement
All relevant data are included in this paper. The raw data supporting the conclusions of this article will be made available by the authors upon request.
Acknowledgments
The authors express their gratitude to all the participants who participated in the research voluntarily and without compensation.
Conflicts of Interest
The authors declare no conflicts of interest.
References
- Kroemer, A.D.; Kroemer, K.H.E. Office Ergonomics, 2nd ed.; CRC Press: Boca Raton, FL, USA; Taylor & Francis Group, LLC: Abingdon, UK, 2017; ISBN 9781498747943. [Google Scholar]
- Nakamura, M.; Yoda, T.; Crawshaw, L.I.; Yasuhara, S.; Saito, Y.; Kasuga, M.; Nagashima, K.; Kanosue, K. Regional Differences in Temperature Sensation and Thermal Comfort in Humans. J. Appl. Physiol. 2008, 105, 1897–1906. [Google Scholar] [CrossRef] [PubMed]
- Zhang, Y.; Zhao, R. Relationship between Thermal Sensation and Comfort in Non-Uniform and Dynamic Environments. Build. Environ. 2009, 44, 1386–1391. [Google Scholar] [CrossRef]
- Yang, W.; Lin, Y.; Fatourehchi, D. Thermal Comfort. In Routledge Handbook of High-Performance Workplaces; Routledge: London, UK, 2024; pp. 62–78. ISBN 9781040042441. [Google Scholar]
- Djongyang, N.; Tchinda, R.; Njomo, D. Thermal Comfort: A Review Paper. Renew. Sustain. Energy Rev. 2010, 14, 2626–2640. [Google Scholar] [CrossRef]
- Velt, K.B.; Daanen, H.A.M. Thermal Sensation and Thermal Comfort in Changing Environments. J. Build. Eng. 2017, 10, 42–46. [Google Scholar] [CrossRef]
- Kim, Y.; Shin, Y.; Cho, H. Influencing Factors on Thermal Comfort and Biosignals of Occupant—A Review. J. Mech. Sci. Technol. 2021, 35, 4201–4224. [Google Scholar] [CrossRef]
- Cengiz, T.G.; Babalık, F.C. An On-the-Road Experiment into the Thermal Comfort of Car Seats. Appl. Ergon. 2007, 38, 337–347. [Google Scholar] [CrossRef]
- Rupp, R.F.; Kazanci, O.B.; Toftum, J. Effect of Sitting Posture on the Thermal Insulation of Modern Office Chairs. Energy Build. 2023, 297, 113426. [Google Scholar] [CrossRef]
- Hedge, A.; Saito, M.; Jagdeo, J. Does Ergonomic Chair Design Affect Thermal Comfort? Proc. Hum. Factors Ergon. Soc. Annu. Meet. 2005, 49, 793–795. [Google Scholar] [CrossRef]
- Vlaović, Z.; Domljan, D.; Župčić, I.; Grbac, I. Thermal Comfort While Sitting on Office Chairs–Subjective Evaluations. Drv. Ind. 2012, 63, 263–270. [Google Scholar] [CrossRef]
- Rînjea, C.; Chivu, O.R.; Darabont, D.-C.; Feier, A.I.; Borda, C.; Gheorghe, M.; Nitoi, D.F. Influence of the Thermal Environment on Occupational Health and Safety in Automotive Industry: A Case Study. Int. J. Environ. Res. Public Health 2022, 19, 8572. [Google Scholar] [CrossRef]
- Fayyaz, M.; Farhan, A.A.; Javed, A.R. Thermal Comfort Model for HVAC Buildings Using Machine Learning. Arab. J. Sci. Eng. 2022, 47, 2045–2060. [Google Scholar] [CrossRef]
- Costa, D.; Guedes, J.C.; Baptista, J.S. Experimental Assessment of Thermal Sensation and Thermal Comfort of Sedentary Subjects: A Scoping Review. Int. J. Occup. Environ. Saf. 2020, 4, 80–88. [Google Scholar] [CrossRef]
- Hedge, A.; Sakr, W.; Agarwal, A. Thermal Effects on Office Productivity. Proc. Hum. Factors Ergon. Soc. Annu. Meet. 2005, 49, 823–827. [Google Scholar] [CrossRef]
- Wu, T.; Cui, W.; Cao, B.; Zhu, Y.; Ouyang, Q. Measurements of the Additional Thermal Insulation of Aircraft Seat with Clothing Ensembles of Different Seasons. Build. Environ. 2016, 108, 23–29. [Google Scholar] [CrossRef]
- Cheberiachko, I.M.; Stolbchenko, O.V.; Yurchenko, A.A.; Luts, I.O. Defining the Level of Human Comfort in the Office Environment by Thermal Factor. Nauk. Visnyk Natsionalnoho Hirnychoho Universytetu 2022, 1, 69–75. [Google Scholar] [CrossRef]
- Shahzad, S.; Calautit, K.; Wei, S.; Tien, P.W.; Calautit, J.; Hughes, B. Analysis of the Thermal Comfort and Energy Performance of a Thermal Chair for Open Plan Office. J. Sustain. Dev. Energy Water Environ. Syst. 2020, 8, 373–395. [Google Scholar] [CrossRef]
- Chadwick, D.; Dowell, B.; Stumpf, B.; Caruso, J.; Béhar, Y. The Attributes of Thermal Comfort-Ergonomic Criteria for the Design of the “Breathable” Work Chair, Solution Essay; Herman Miller Inc.: Zeeland, MI, USA, 2013. [Google Scholar]
- Erlandson, T.; Cena, K.; De Dear, R.; Havenith, G. Environmental and Human Factors Influencing Thermal Comfort of Office Occupants in Hot—Humid and Hot—Arid Climates. Ergonomics 2003, 46, 616–628. [Google Scholar] [CrossRef]
- Kumar, A.R.; Fredericks, T.K.; Butt, S.E. Using a Psychophysical Approach to Identify a User’s Self Selected Thermal Comfort on a Task Chair. Int. J. Ind. Ergon. 2015, 46, 36–43. [Google Scholar] [CrossRef]
- Liu, Z.; Yuan, Y.; Liu, M.; Cascioli, V.; McCarthy, P.W. Investigating Thermal Performance of Different Chairs at the User-Seat Interface by a Temperature Sensor Array System While Participants Perform Office Work. J. Tissue Viability 2018, 27, 83–89. [Google Scholar] [CrossRef]
- Hsu, T.W.; Yang, S.Y.; Liu, J.T.; Pan, C.T.; Yang, Y.S. The Effect of Cushion Properties on Skin Temperature and Humidity at the Body-Support Interface. Assist. Technol. 2018, 30, 1–8. [Google Scholar] [CrossRef]
- Liu, Z.; Cascioli, V.; Heusch, A.I.; McCarthy, P.W. Studying Thermal Characteristics of Seating Materials by Recording Temperature from 3 Positions at the Seat-Subject Interface. J. Tissue Viability 2011, 20, 73–80. [Google Scholar] [CrossRef] [PubMed]
- Sales, R.B.C.; Pereira, R.R.; Aguilar, M.T.P.; Cardoso, A.V. Thermal Comfort of Seats as Visualized by Infrared Thermography. Appl. Ergon. 2017, 62, 142–149. [Google Scholar] [CrossRef] [PubMed]
- Pasut, W.; Zhang, H.; Arens, E.; Kaam, S.; Zhai, Y. Effect of a Heated and Cooled Office Chair on Thermal Comfort. HVAC&R Res. 2013, 19, 574–583. [Google Scholar] [CrossRef]
- Raja, I.A.; Nicol, F. A Technique for Recording and Analysis of Postural Changes Associated with Thermal Comfort. Appl. Ergon. 1997, 28, 221–225. [Google Scholar] [CrossRef]
- Califano, R.; Naddeo, A.; Coccaro, C. Comfort Seat Design: Thermal Sensitivity of Human Back and Buttock. Int. J. Ind. Ergon. 2020, 78, 102961. [Google Scholar] [CrossRef]
- Li, G.; Liu, C.; He, Y. The Effect of Thermal Discomfort on Human Well-Being, Psychological Response and Performance. Sci. Technol. Built Environ. 2021, 27, 960–970. [Google Scholar] [CrossRef]
- CEN EN ISO 7730; Ergonomics of the Thermal Environment Analytical Determination and Interpretation of Thermal Comfort Using Calculation of the PMV and PPD Indices and Local Thermal Comfort Criteria. Committee for Standardization (CEN): Brussels, Belgium, 2005.
- Fan, G.; Chen, Y.; Deng, Q. Thermal Comfort. In Personal Comfort Systems for Improving Indoor Thermal Comfort and Air Quality; Wang, F., Yang, B., Deng, Q., Luo, M., Eds.; Springer: Singapore, 2023; pp. 1–23. [Google Scholar]
- Bartels, V.T. Thermal Comfort of Aeroplane Seats: Influence of Different Seat Materials and the Use of Laboratory Test Methods. Appl. Ergon. 2003, 34, 393–399. [Google Scholar] [CrossRef]
- CEN EN 1335-1; Office Furniture-Office Work Chair-Part 1: Dimensions-Determination of Dimensions. European Committee for Standardization (CEN): Brussels, Belgium, 2000.
- Helander, M.G.; Zhang, L. Field Studies of Comfort and Discomfort in Sitting. Ergonomics 1997, 40, 895–915. [Google Scholar] [CrossRef]
- Zhang, L.; Helander, M.G.; Drury, C.G. Identifying Factors of Comfort and Discomfort in Sitting. Hum. Factors 1996, 38, 377–389. [Google Scholar] [CrossRef]
Disclaimer/Publisher’s Note: The statements, opinions and data contained in all publications are solely those of the individual author(s) and contributor(s) and not of MDPI and/or the editor(s). MDPI and/or the editor(s) disclaim responsibility for any injury to people or property resulting from any ideas, methods, instructions or products referred to in the content. |
© 2025 by the authors. Licensee MDPI, Basel, Switzerland. This article is an open access article distributed under the terms and conditions of the Creative Commons Attribution (CC BY) license (https://creativecommons.org/licenses/by/4.0/).