Abstract
Aflatoxin M1 (AFM1), a toxic metabolite of aflatoxin B1 (AFB1), is commonly found in cow’s milk (CM) when dairy cattle consume contaminated feed. Chronic exposure to AFM1 poses serious health risks, particularly for children. This study aimed to quantify AFM1 levels in commercial CM available in Mexico and assess the associated carcinogenic risk across six age groups. A total of 23 milk samples were collected between March and July 2023 from supermarkets and convenience stores. AFM1 was measured using high-performance liquid chromatography (HPLC). Estimated daily intake (EDI), carcinogenic risk index (CRI), and Monte Carlo simulations (MCS) to model exposure were employed. AFM1 was detected in all samples, with 80% exceeding the legal limits set by Mexican and European regulations. The highest CRI values were observed in children aged 1–4 years (CRI > 5 × 10³), indicating an elevated risk. There were no statistically significant differences in AFM1 concentration among different milk or thermal treatments. A cluster analysis revealed patterns related to AFM1 content, price, and processing methods. The widespread detection of AFM1 raises a public health concern, especially for vulnerable populations. This underscores the need for targeted regulatory strategies and improved control of aflatoxins in the dairy production chain.
1. Introduction
Cow’s milk (CM) ranks among the most extensively consumed food products globally, attributable to its nutritional benefits and availability to all demographic groups. It serves as a principal source of high-quality protein, essential vitamins, and readily absorbable calcium [1,2]. Nevertheless, despite its nutritional importance, milk presents potential health risks as a medium for foodborne contaminants, notably aflatoxin M1 (AFM1). AFM1 is a hydroxylated metabolite of aflatoxin B1 (AFB1) produced in the liver of dairy cattle subjected to feed contaminated with Aspergillus flavus and Aspergillus parasiticus [3,4]. In addition, climatic conditions, insufficient feed storage, and inadequate quality control measures significantly contribute to the contamination of animal feed with AFB1, particularly in tropical and subtropical regions [5,6]. The AFM1 is excreted into milk and dairy products, where it can persist despite pasteurization and ultra-high temperature (UHT) treatments [7,8]. AFM1 has been classified by the International Agency for Research on Cancer (IARC) as a Group 1 human carcinogen, attributed to its genotoxic, immunosuppressive, and mutagenic properties [3]. Chronic exposure to AFM1 is associated with an elevated risk of hepatocellular carcinoma, particularly among populations with high consumption of milk and limited dietary diversity [9,10]. A significant inverse correlation has been established between the risk of carcinogenicity and body weight, particularly among children from birth to 26 months of age in Nepal who were chronically exposed to aflatoxins. This reinforces that lower body mass predisposes individuals to a higher relative exposure [11].
Evidence suggests that the toxic effects of AFM1 are more pronounced in pediatric populations than adults, attributable to their lower body weight, greater milk consumption, and the development of physiological systems with limited capacity to metabolize and excrete toxins [10,12,13]. Prolonged exposure to AFM1 during the early years of life has been associated with hepatocellular damage, immunosuppression, altered nutrient absorption, and growth retardation [14,15]. Furthermore, even low-dose exposure may impede protein synthesis and liver enzyme functionality, potentially leading to long-term developmental disorders [16,17].
The presence of AFM1 in milk and dairy products has been widely reported in several countries using various analytical approaches. In Greece, Maggira et al. (2021) compared commercial enzyme-linked immunosorbent assay kits with a high-performance liquid chromatography with fluorescence detection (HPLC-FLD) method developed to analyze AFM1 in raw milk, underlining the importance of selecting context-specific analytical procedures [18]. Similarly, Kolarič and Šimko (2023), in Slovakia, validated an HPLC-FLD method with pretreatment in an immunoaffinity column that met the analytical performance criteria established by European standards [19]. In Hungary, routine monitoring of AFM1 in both raw and processed milk was conducted using commercial test kits, highlighting the need for continuous monitoring along the entire dairy production chain [20].
In the Latin American context, Quevedo-Garza et al. (2018) investigated AFM1 levels in liquid milk sold in Monterrey, Mexico, reporting concentrations that exceeded European regulatory limits [21]. Additionally, other studies have documented the presence of AFM1 in raw, pasteurized, and UHT milk samples throughout Mexico [22,23,24,25,26,27]. In particular, Álvarez-Díaz et al. (2022) reported concentrations of AFM1 exceeding the national regulatory threshold of 0.5 μg/L in commercially available dairy products [22,28]. These results underscore the significance of region-specific risk assessments and the necessity of continuous monitoring in various dairy markets.
While this study emphasizes the issue of AFM1 contamination in commercial milk in Mexico, it is essential to note that AFM1 contamination in dairy products has been extensively documented globally, underscoring its international significance. Researchers have reported elevated detection rates of AFM1, frequently surpassing established regulatory limits. This evidence affirms that AFM1 contamination is not restricted to particular regions but represents a pervasive issue associated with feed contamination, unsatisfactory storage conditions, and climatic influences [29,30,31,32,33]. Consequently, local evaluations like the one presented in this study are crucial for delineating exposure risks within specific national contexts. These studies provide essential data regarding prevalence; a paucity of research assesses the carcinogenic risk of AFM1 based on age-specific consumption patterns, which is vital for informing regulatory and public health strategies [34,35]. Therefore, accurate quantification necessitates using highly sensitive and reliable analytical techniques, such as HPLC-FLD, which is esteemed for its precision and reproducibility in detecting AFM1 [36,37]. In addition to quantification, the carcinogenic risk index (CRI) estimation provides a more comprehensive perspective by incorporating AFM1 concentrations alongside actual consumption patterns and body weight across diverse population groups [10,38]. This methodology aids in prioritizing regulatory actions and meaningfully assessing public health risks. Consequently, this study aimed to quantify the levels of AFM1 present in various brands of CM sold in Mexico and evaluate the cancer risks associated with its consumption among different age groups.
2. Materials and Methods
2.1. Chemicals and Reagents
The analytical standard of AFM1 at a 100 μg/mL concentration in acetonitrile (ACN) was procured from Sigma-Aldrich, located in St. Louis, MI, USA. HPLC-grade ACN and methanol were acquired from J.T. Baker, Center Valley, PA, USA. Ultrapure water was generated utilizing a Milli-Q system from Millipore, Burlington, MA, USA. All chemicals employed in this study were of analytical or chromatographic grade.
2.2. Sample Collection
Between March and July 2023, 23 samples of commercial CM (A–W) were collected in supermarkets and convenience stores in Pachuca, Hidalgo, Mexico. Selected brands of pasteurized milk (A–E), UHT (F–W), where the E, U, V samples are organic milk, which are nationally distributed and commercially available in several regions. Table S1 provides detailed characteristics of the milk, including sample ID, classification, production site, origin, certification, and price. All CM samples were transported, refrigerated, and stored at 4 °C until analysis.
2.3. Preparation of Standard Solution
A stock solution (1 µg/mL) was prepared from a standard concentration of AFM1 (100 µg/mL). The stock solution was diluted in ACN to obtain working stock solutions of a standard calibration curve of 0.01–0.5 µg/mL.
2.4. Aflatoxin M1 Extraction
The liquid–liquid AFM1 extraction (LLE) employed was adapted from previously reported procedures [39,40], with the following modifications. Five milliliters of each CM were utilized; 1 g of NaCl was incorporated to facilitate the samples’ dissolution, followed by adding 3.8 mL of ACN. The resultant mixture was subsequently vortexed utilizing a Vortex® stirrer (S1-0256, Scientific Industries, Alcobendas, Madrid, Spain) at maximum speed for 1 min and permitted to rest for 15 min. Thereafter, it underwent centrifugation (Avanti J-E, Beckman Coulter Life Sciences, Nyon, Vaud, Switzerland) at 6000 rpm for 7 min at a temperature of 4 °C. The supernatant was subsequently collected, and 5 mL of deionized water and 2 mL of chloroform were incorporated, followed by homogenization. The mixture was again subjected to centrifugation under identical conditions as previously described. The organic phase was dried under reduced pressure employing a rotary evaporator (R-300, BÜCHI® Labor Technik, Essen, North Rhine-Westphalia, Germany). Finally, the CM was reconstituted with 400 µL of the mobile phase and filtered through a 0.45 µm polytetrafluoroethylene membrane (Sigma-Aldrich®, St. Louis, MI, USA).
2.5. Chromatographic Analysis of Aflatoxin M1
For the separation, identification, and detection of AFM1, an HPLC-FLD (LC-20AD) was utilized. This system comprised a solvent supply unit, an automatic sampler (model: SIL-20AC XR, Shimadzu Corporation, Kyoto, Japan), a fluorescence detector (RF-20A XS), a column heater (CTO-20A), a degassing unit (DGU-20A 5R), and a communication module (model: CBM-20A, Shimadzu Corporation, Kyoto, Japan). The separation was conducted utilizing a reverse phase C18 column (dimensions: internal diameter 4.6 mm, length 250 mm, particle size 5 µm, pore size 120 Å; ODS HypersilTM®, Thermo Fisher Scientific, Powai, Mumbai, India, maintained at 30 °C, and a mobile phase consisting of water and ACN (60:40, v/v), operated under isocratic conditions at a flow rate of 0.4 mL/min and an injection volume of 5 µL. the total run time was 15 min injection. AFM1 was detected at an excitation wavelength of 365 nm and an emission wavelength of 435 nm. The chromatographic data were processed using LabSolutions® software, version 5.87.1 (Shimadzu Corporation, Kyoto, Japan).
2.6. Reliability and Analytical Effectiveness of the Method
The analytical procedure for quantifying AFM1 in milk was validated in accordance with the guidelines established by the International Council for Harmonization. This validation considered the following parameters: linearity, limit of detection (LOD), limit of quantification (LOQ), selectivity, precision, and recovery [41]. Linearity was evaluated by constructing a calibration curve from standard solutions of AFM1 in acetonitrile, which spanned a concentration range of 0.01 to 0.5 μg/L. Duplicate calibration points were prepared, and the determination coefficient (R2) to assess the linear response was used. The LOD and LOQ were computed based on the standard deviation of the intercept point (Sy) and the slope (b) of the calibration curve, utilizing the following equations:
LOQ = 3.3 × Sy/b
LOQ = 10 × Sy/b
Selectivity was evaluated by analyzing blank CM samples subjected to the identical liquid–liquid extraction (LLE) procedure outlined in Section 2.4 to ensure the absence of retention time interference peaks associated with AFM1. Accuracy was ascertained through the calculation of the relative standard deviation from three repeated injections of CM. Recovery was assessed by supplementing a previously analyzed CM sample with a quantifiable baseline concentration of AFM1 and a predetermined amount of standard solution (1.0 μg/L). The spiked CM underwent triplicate processing employing uniform extraction and quantification methods. To compute the recovery of the introduced standard, the native concentration was deducted from the total measured value. Subsequently, the recovery rate was established utilizing the following equations:
where Cnative = initial concentration of AFM1 in the unfortified CM; Cadded = known concentration of the standard spiked; and Cmeasured = final concentration determined after spiking.
Theoretical total concentration = Cnative + Cadded
Recovered standard = Cmeasured − Cnative
Recovery (%) = (Cmeasured − Cnative/Cadded) × 100
2.7. Risk Assessment for Exposure to Aflatoxin M1
2.7.1. Estimated Daily Intake
The estimated daily intake (EDI) of AFM1 was calculated to determine the amount of AFM1 ingested per unit of body weight each day, using the following equation:
where C = mean concentration of AFM1 in milk (µg/L); IR = daily milk intake (L/day); and BW = average body weight of the exposed individual (kg).
EDI = C × IR/BW
Age groups were defined according to national food risk assessment guidelines and WHO population classifications: 1–2 years, 3–4 years, 5–9 years, 10–19 years, 20–59 years, and >60 years. Body weight (BW) and intake rate (IR) for each group were derived from the Encuesta Nacional de Salud y Nutrición (ENSANUT) (2022), Norma Oficial Mexicana-031-SSA2-1999, and World Health Organization growth standards [42,43,44]. Population-weighted averages were calculated from national anthropometric data, considering sex-specific differences (Table 1). Milk intake rates were based on national averages reported for liquid milk consumption by age group, with a value of 0.5 L/day for young children, adjusted proportionally for older groups as reported in ENSANUT, 2022 [42]. These values were utilized to stratify exposure levels by age and sex, allowing for a more accurate assessment of the dietary risk associated with the intake of AFM1 through CM. The concentration of AFM1 was determined through chromatographic analysis of commercial CM samples.

Table 1.
Characteristics of age groups and estimated daily intake of aflatoxin M1.
2.7.2. Monte Carlo Simulation for Estimating Carcinogenic Risk Index
To account for the variability and uncertainty associated with exposure to AFM1 through milk consumption, a Monte Carlo simulation (MCS) was performed to estimate the CRI across different age groups of the Mexican population. The simulation was based on the following equation, derived from the European Food Safety Authority (EFSA) (2020) and Kuiper-Goodman (1990) [10,38]:
where EDI = estimated daily intake of AFM1 (µg/kg bw/day); EF = exposure frequency (days/year, assumed to be 365); ED represents exposure duration in years, defined by age group; CSF, or cancer slope factor for AFM1, is 0.04 (µg/kg bw/day)−1, as proposed by Kuiper-Goodman (1990) [38] and endorsed by the EFSA (2020) [10]; and AT = averaging time for carcinogens (25,550 days = 70 years × 365 days).
CRI = EDI × EF × ED × CSF/AT
The AFM1 concentration was modeled using a triangular distribution based on experimental data: minimum: 0.02 µg/L; maximum: 7.62 µg/L; and mean: 1.26 µg/L. The triangular distribution of AFM1 was used for 10,000 iterations in each age group for simulation details. For each iteration, a random value of the AFM1 concentration was generated and used to calculate the EDI and CRI. The simulation produced descriptive statistics for CRI: mean CRI, 95 percentile (P95) CRI, and maximum CRI.
2.8. Cluster Analysis
A hierarchical clustering analysis was performed to investigate patterns among commercial CM samples based on four variables: AFM1 concentration (μg/L), retail price (MXN/L–Mexican peso per liter), type (regular or organic), and heat treatment (pasteurized or UHT). Before the clustering process, the dataset underwent standardization utilizing Z-scores to mitigate the effects of scale differences among the variables. The clustering procedure employed the minimum variance method of Ward, with Euclidean distance serving as the similarity metric. This multivariate technique facilitated the identification of natural groupings predicated upon similarities in pollution levels, pricing, and production characteristics. All analyses were conducted utilizing Minitab® 17 Statistical Software State College, PA, USA.
2.9. Statistical Analysis
All experimental procedures for the extraction, identification, and quantification of AFM1 were performed in triplicate. The data were expressed as means ± standard deviations. Variations in AFM1 concentrations among the CM were evaluated using one-way analysis of variance, followed by Tukey’s test to discern statistically significant differences between individual samples. A significance threshold of p < 0.05 was established as statistically significant. All statistical analyses were executed using SPSS software, version 25.0 (IBM® Corp, Chicago, IL, USA).
3. Results and Discussion
3.1. Sample Origin and Overview of AFM1 Contaminatión
The geographical sources of the 23 CM samples underscore the extensive distribution and integration of the dairy market across Mexico. The CM available in Hidalgo is sourced from nine distinct states: Aguascalientes (one sample), Durango (six), Guanajuato (one), Hidalgo (two), Jalisco (one), Mexico City (five), Nuevo León (two), Puebla (one), and the State of Mexico (four) (Table S1), situated in the central and northern regions, thereby indicating substantial interregional supply chain interconnectivity. The average concentration of AFM1 detected for each CM sample of different state allowed a more precise visualization and identification of regional differences in contamination levels of this mycotoxin (Figure 1). This scenario carries significant implications for food safety management, as contamination issues, particularly concerning AFM1, cannot be solely attributed to the state where the product is sold; instead, they may also reflect production and storage practices in other regions of origin. Regulatory monitoring programs should therefore concentrate on local retail establishments and encompass the entirety of the dairy supply chain, from primary production on the farm to post-harvest handling and industrial processing, particularly in producing regions including Durango and the State of Mexico. In Section 3.3 details the identification and quantification of AFM1 in the collected CM samples.
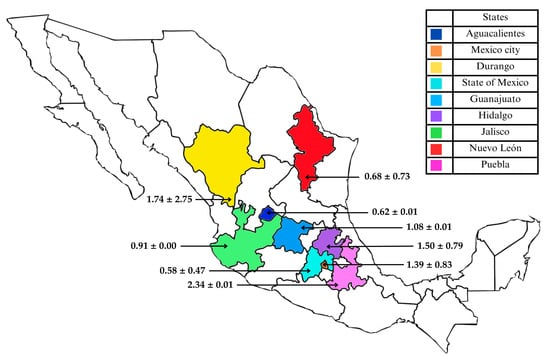
Figure 1.
Geographical distribution of AFM1 concentrations (μg/L) in commercial CM samples collected in Mexico. Data is presented as mean ± standard deviation.
3.2. Reliability of the Method
The LLE analytical method, which has been adapted from previously published procedures, offers a dependable alternative for extracting AFM1 from milk, achieving a recovery rate exceeding 80% [39,40]. This method is particularly advantageous when access to immunoaffinity columns is restricted or when high CM sample yields are required. The analytical method underwent evaluation to ascertain its reliability and suitability for detecting trace levels in dairy matrices. The calibration curve illustrated linearity within the concentration range of 0.01 to 0.5 μg/L, with an R2 value of 0.9982, and a retention time of 9.16 ± 0.06 min (Figures S1 and S2). Triple analyses of various CM samples, which were processed under uniform extraction conditions, substantiated the method’s selectivity. No interference peaks were detected during the retention time of AFM1. The calculated LOD value of 0.002 μg/L and the LOQ value of 0.008 μg/L were adequate for identifying levels beneath the regulatory maximum limits established by European Union and Mexican standards [28,45]. Furthermore, the method’s selectivity was confirmed through chromatographic analysis of blank and fortified CM samples that were processed using the identical LLE protocol.
Figure S3 shows representative chromatograms: a CM at a known concentration of AFM1 labeled as blank (a), a CM sample enriched with 1.0 μg/L of AFM1 (b), and a commercial CM with the highest concentration of AFM1 identified in this study (c). All chromatograms were obtained under identical HPLC-FLD conditions and exhibited consistent retention times with no interfering peaks observed, thereby affirming the method’s specificity and matrix applicability. The recovery of the enriched CM was 81.6%, which falls within the acceptable range for mycotoxin analysis in complex food matrices, typically between 70% and 120%, as stipulated by international criteria [46]. The performance parameters obtained in this study are comparable to those cited in previous work utilizing solvent-based extraction methods and immunoaffinity column cleaning procedures, thereby confirming the validity of the analytical approach despite employing a more accessible LLE protocol [19,39]. Although the immunoaffinity column is commonly regarded as the reference standard due to its high specificity, it frequently incurs higher costs and single-use limitations [47]. Similarly, solid phase extraction provides good reproducibility and the potential for automation but necessitates meticulous method development to minimize matrix effects [48,49]. QuEChERS-based protocols have also been employed to detect multiple mycotoxins; however, they may lack the selectivity necessary to detect AFM1 at trace levels [50,51]. In this context, the results indicate that the combination of liquid–liquid extraction represents a valid and practical alternative for determining a single analyte, particularly in resource-limited environments. Moreover, the absence of interference peaks corroborated the method’s selectivity, and the intraday reproducibility (relative standard deviation < 5%) underpinned the accuracy in quantifying AFM1.
3.3. Identification and Quantification of Aflatoxin M1
All 23 commercial CM samples analyzed contained detectable AFM1 levels, with an average concentration of 1.64 µg/L. Notably, 73.91% of the CM exceeded the maximum permissible limits established by Mexican regulations (0.5 µg/L) and European regulations (0.05 µg/L) [28,45]. Sample B exhibited the highest concentration at 7.62 µg/L, significantly surpassing the concentrations found in the other CM samples. This particular CM originated from a nationally distributed milk brand processed in Durango, Mexico, a region characterized by a semi-arid climate, with low rainfall (less than 500 mm) and extreme temperatures [52]. In conjunction with suboptimal agricultural and storage practices, these climatic conditions may facilitate the proliferation of aflatoxin-producing fungi such as Aspergillus spp. in crops utilized as dairy cattle feed, including maize and sorghum [53,54]. Furthermore, the application of silage in dairy operations presents additional risks if storage conditions are not meticulously controlled, thereby heightening the likelihood of aflatoxin formation [55]. Inadequate storage infrastructure in regions supplying feed ingredients may also contribute to heightened AFM1 levels [56], as evidenced by the findings in sample B.
Mycotoxin contamination may occur at various stages of animal feed production, encompassing pre-harvest, drying, and storage processes [57]. Insufficient agricultural practices, inadequate management, and adverse environmental conditions contribute to the formation of mycotoxins, which can disseminate throughout fungal colonies, contaminating spores, hyphae, and the surrounding substrate [58,59]. Consuming these contaminated foods remains the primary route of exposure to mycotoxins in dairy cattle, particularly in semi-arid regions [59,60,61].
The remaining 26.8% of CM, which included A, I, J, L, M, and O, remained compliant with legal limits, demonstrating an average AFM1 concentration of 0.18 µg/L (Figure 2). The present study’s findings align with prior research conducted across various regions. Maggira et al. (2021) identified fluctuations in AFM1 levels in raw milk obtained from distinct locations within Greece, indicating that geographical factors and management practices may significantly affect contamination levels [18]. Similarly, Kolarič and Šimko (2023) substantiated the efficacy of analytical methods for detecting AFM1 in dairy products in Slovakia, emphasizing the necessity of reliable techniques for monitoring this mycotoxin [19]. Furthermore, the research conducted by Buzás et al. (2023) in Hungary highlighted the urgent need for continuous monitoring to assess exposure to AFM1 among the general population [20]. In Mexico, there are limited studies evaluating the incidence of AFM1 in milk intended for human consumption. The most recent report documented a concentration of 0.03 µg/L in CM, which remains well within national legal thresholds [22,28]. The presence of AFM1 in milk primarily reflects the contamination of dairy cattle feed with AFB1, which is commonly found in cereals, oilseeds, flours, and by-products utilized in feed formulation. Seasonal factors may also impact the concentration of AFM1 in milk [62,63]. Elevated levels have been reported during the autumn–winter period compared to the spring–summer period [64]. This trend correlates with a decreased availability of fresh forage and an increased reliance on dry stored feed, which is more susceptible to fungal contamination under moisture conditions and inadequate storage [64]. Given that the CM samples in this study were collected during the winter, the heightened AFM1 concentrations observed in 80% of the CM may be partially attributed to this seasonal vulnerability.
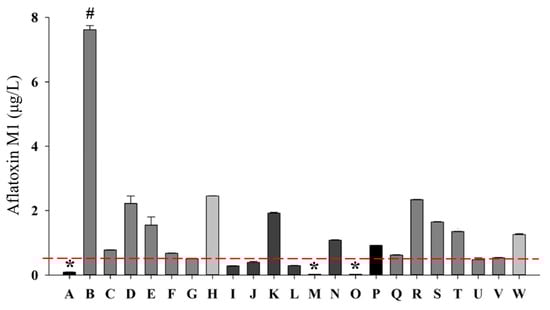
Figure 2.
Quantification and identification of AFM1 by liquid chromatography in commercial milk. AFM1 μg/L: micrograms per liter of aflatoxin M1; A–W: cow’s milk; # indicates a statistically higher value compared to samples analyzed; * indicates a statistically lowest value compared to the samples. The red horizontal line indicates the maximum limit set by the Mexican standard NOM-243-SSA1-2010 (0.5 μg/L).
3.4. Carcinogenic Risk Assessment of Aflatoxin M1 Exposure
To enhance the assessment of carcinogenic risk associated with chronic exposure to AFM1 through CM, an MCS involving 10,000 iterations was conducted. The simulation utilized a triangular distribution characterized by the minimum (0.02 μg/L), mean (1.26 μg/L), and maximum (7.62 μg/L) concentrations of AFM1 observed in the CM. The findings indicated that all age demographics exhibited significant values for the CRI, with the highest mean CRI noted in children aged 1–2 years (7.92 × 10³) and 3–4 years (5.07 × 10³). The P95 values surpassed the internationally recognized threshold of 1 × 10⁴ across all age groups, suggesting that a considerable segment of the population may encounter an elevated cancer risk throughout their lifetime due to chronic exposure to AFM1 via CM consumption. The comprehensive results, encompassing mean, P95, and maximum CRI values for each demographic group, are illustrated in Table 2.
Table 2.
Carcinogenic risk index.
Incorporating probabilistic modeling via MCS enhanced the authenticity of the risk analysis by considering inherent variability and uncertainty in both contaminant exposure and population attributes. This methodology is consistent with contemporary guidelines from the EFSA (2020) and other global organizations endorsing distribution-based risk assessment models for evaluating carcinogenic mycotoxins [10]. The finding that children under five presented CRI values far exceeding the reference threshold (1 × 10⁴) is particularly concerning. Additionally, even adult and elderly groups showed elevated CRI levels, though to a lesser extent, indicating that this issue affects the population more broadly.
This analysis employed a CSF of 0.04 µg/kg bw/day, as proposed by Kuiper-Goodman (1990) and subsequently reaffirmed by the EFSA (2020) [10,38]. Given the structural and toxicological similarity of AFM1 to AFB1, this parameter was essential for estimating lifetime cancer risk [3]. The CRI values derived from this study are congruent with earlier research that has evaluated the cancer risks associated with AFM1 [65,66,67,68]. A probabilistic analysis in Hungary estimated chronic exposure to AFM1 in toddlers using a two-dimensional MCS [69]. The results indicated exposure levels of up to 3.79 × 10³ µg/kg bw/day at the 97.5 percentile, accompanied by a hazard index >1, which signifies a non-negligible health risk for this age demographic. Similarly, a study conducted in Monterrey, Mexico, identified AFM1 in 100% of breast CM, with average concentrations measuring 1.70 × 10² µg/L. The estimated daily intake for infants varied from 1.09 × 10³ to 2.02 × 10² µg/kg bw/day, which exceeded tolerable intake levels and underscored a considerable carcinogenic risk, especially for children aged 0 to 24 months [70]. The aforementioned external findings substantiate the data acquired in this study, particularly concerning CRI values among pediatric populations. Moreover, these findings underscore the pervasive nature of exposure to AFM1 and its significant implications for public health. The continual exceedance of established risk thresholds across diverse populations and nations further accentuates the necessity for enhanced surveillance, effective risk communication, and robust preventive measures to safeguard vulnerable consumers, especially infants and young children [10,71,72].
3.5. Classification of Milk Samples Through Dendrogram Analysis of Contaminants and Product Attributes
The hierarchical clustering analysis elucidated distinct groups among CM samples based on similarities in AFM1 concentration, retail price, thermal processing, and organic labeling. As illustrated in Figure 3, the CM samples are systematically organized along the X-axis. At the same time, the vertical Y-axis denotes the Euclidean distance to the square, thereby reflecting the degree of similarity among them. The groups formed at shorter distances signify CM with more comparable profiles. The B sample exhibited the highest level of AFM1, and appeared to be isolated or to establish a separate branch, indicating a distinct contamination or production profile. This pattern may represent specific regional practices, supply chain conditions, or feed quality associated with that CM. To investigate contamination patterns in commercial CM, a hierarchical cluster analysis was performed using four variables: AFM1 concentration (μg/L), price per liter (MXN), milk classification (regular or organic), and thermal treatment (pasteurized or UHT).
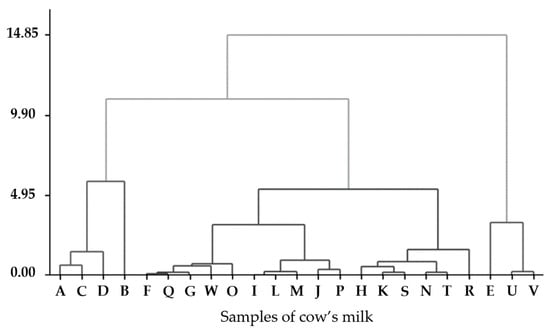
Figure 3.
Dendrogram of commercial milk samples based on hierarchical cluster analysis. The X-axis represents individual milk samples, while the Y-axis indicates group distance, reflecting the similarity between samples based on AFM1 concentration, price per liter, milk classification (regular or organic), and heat treatment method (pasteurized or UHT).
The generated dendrogram (Figure 3) identified three primary clusters illustrating variations in AFM1 levels and product characteristics. The first cluster included milks with low AFM1 levels (<0.5 μg/L), featuring several UHT-treated and/or organic CM samples, such as U and V. The second cluster consisted of CM with moderate AFM1 values (0.5–2.0 μg/L). In contrast, the third group contained the most contaminated CM, including sample B (7.62 μg/L), an outlier due to its concentration significantly exceeding international safety limits. The groupings above indicate that heat treatment and classification significantly influence pollution profiles. Prior research has suggested that UHT treatment may yield lower levels of AFM1 [73,74].
Nevertheless, AFM1 is widely acknowledged for its heat resistance [72,75], implying that such variations are more likely to be related to CM sample processing rather than to the degradation of the toxin. This highlights the necessity for standardized analytical procedures when comparing CM subjected to diverse heat treatments. Furthermore, the analysis has demonstrated that elevated prices do not inherently correlate with superior microbiological quality concerning AFM1 contamination. This observation aligns with prior reports indicating that brand reputation and perceived value frequently influence pricing instead of objective quality assessment [76,77]. Interestingly, organic CM tended to group within the low-risk category; nevertheless, regular CM in the same group indicate that organic labeling alone fails to serve as a sufficient predictor of reduced contamination [78,79,80]. The levels of AFM1 are predominantly influenced by factors such as feed quality, storage conditions, and climate [81,82]. However, the observed trend aligns with the notion that organic dairy systems may implement more stringent feed sourcing practices. A more extensive sampling process is required to validate this association.
4. Conclusions
This study investigated the levels of AFM1 in various brands of CM available in Mexico and assessed the carcinogenic risk index across different age groups. AFM1 was detected in all CM samples analyzed, with 80% exceeding the maximum limits established by Mexican and European regulations, which raises significant public health concerns. Notably, the products under analysis are distributed nationwide and accessible to consumers across all socio-economic strata, thereby emphasizing a widespread risk of exposure throughout the country.
Cancer risk estimates derived from EDI and IRC have identified a significantly elevated susceptibility among children aged 1 to 4 during this crucial developmental phase. Monte Carlo simulations have corroborated these findings by encompassing various exposure scenarios and confirming that peak risk levels disproportionately impact younger demographics.
The findings underscore the urgent necessity to augment national surveillance, particularly regarding dairy products consumed by children. Regulatory authorities should prioritize the implementation of AFM1 limits, enhance on-farm feed management and storage protocols, and establish thorough risk-based surveillance strategies that extend beyond average exposure assessments. Future research should expand the geographic and seasonal scope of sampling and examine biomarker-based exposure evaluations, particularly within vulnerable populations.
Supplementary Materials
The following supporting information can be downloaded at: https://www.mdpi.com/article/10.3390/app15116106/s1, Table S1. Characteristics of the collected samples; Figure S1. The calibration curve for AFM1 was obtained through HPLC-FLD within the range of 0.01 to 0.5 μg/L; Figure S2. HPLC-FLD chromatograms of the AFM1 standard solutions calibration curve at ascending concentrations. µg/L: micrograms per liter; min: minutes; mV: millivolt; Figure S3. Chromatograms demonstrating AFM1 in milk samples processed through liquid–liquid extraction for method selectivity, analyzed by HPLC-FLD: (a) initial concentration of AFM1 in the unfortified sample; (b) standard concentration enriched with 1.0 μg/L of AFM1; (c) sample B.
Author Contributions
Conceptualization, A.M.-A., G.M.R.-S. and S.R.T.-S.; methodology, A.S.J.-O. and C.J.-P.; software, A.M.-A. and C.J.-P.; validation, G.M.R.-S. and C.J.-P.; formal analysis, G.M.R.-S.; investigation, A.M.-A.; resources, A.C.-O.; data curation, A.C.-O.; writing—original draft preparation, A.M.-A.; writing—review and editing, S.R.T.-S.; visualization, A.S.J.-O., C.J.-P. and S.R.T.-S.; supervision, G.M.R.-S. and N.d.S.C.-C.; project administration, G.M.R.-S. and N.d.S.C.-C.; funding acquisition, G.M.R.-S. and N.d.S.C.-C. All authors have read and agreed to the published version of the manuscript.
Funding
This research received no external funding.
Institutional Review Board Statement
Not applicable.
Informed Consent Statement
Not applicable.
Data Availability Statement
The original contributions presented in this study are included in the article. Further inquiries can be directed to the corresponding author.
Acknowledgments
The authors express their sincere gratitude to the Departamento de Biotecnologia of the Universidad Autónoma Metropolitana Unidad Iztapalapa for granting permission to utilize its facilities and equipment for the measurements conducted in this research.
Conflicts of Interest
The authors declare no conflicts of interest.
Abbreviations
The following abbreviations are used in this manuscript:
| AFM1 | Aflatoxin M1 |
| AFB1 | Aflatoxin B1 |
| CM | Cow’s milk |
| HPLC-FLD | High-performance liquid chromatography with fluorescence detection |
| EDI | Estimated daily intake |
| CRI | Carcinogenic risk index |
| MCS | Monte Carlo simulations |
| UHT | Ultra-high temperature |
| IARC | International Agency for Research on Cancer |
| ACN | Acetonitrile |
| LLE | Liquid–liquid extraction |
| LOD | Limit of detection |
| LOQ | Limit of quantification |
| IR | Daily milk intake |
| BW | The average body weight of the exposed individual |
| ENSANUT | Encuesta Nacional de Salud y Nutrición |
| EFSA | European Food Safety Authority |
References
- Food and Agriculture Organization of the United Nations (FAO). Milk and Dairy Products in Human Nutrition. 2023. Available online: https://www.fao.org/publications (accessed on 10 February 2025).
- Alais, C. Ciencia de la Leche: Principios de Técnica Lechera, 4th ed.; Reverté: Barcelona, Spain, 2022. [Google Scholar]
- International Agency for Research on Cancer (IARC). Mycotoxins as Human Carcinogens-the IARC Monographs Classification. 2022. Available online: https://monographs.iarc.who.int/ (accessed on 20 November 2024).
- Klingelhöfer, D.; Braun, M.; Brüggmann, D.; Groneberg, D.A. Aflatoxin: A global burden. Food Control 2018, 221, 823–831. [Google Scholar] [CrossRef]
- Pitt, J.I. Toxigenic fungi: Which are important? Med. Mycol. 2000, 38, 17–22. [Google Scholar] [CrossRef]
- Benkerroum, N. Aflatoxins: Producing-molds, structure, health issues and incidence in Southeast Asian and Sub-Saharan African countries. Int. J. Environ. Res. Public Health 2020, 17, 1215. [Google Scholar] [CrossRef]
- Gonçalves, L.; Dalla, R.A.; Gonzales, S.L.; Feltes, M.C.; Badiale-Furlong, E.; Dors, G.C. Incidence of aflatoxin M1 in fresh milk from small farms. Food Sci. Technol. 2017, 37, 11–15. [Google Scholar] [CrossRef]
- Pichardo-Matamoros, D.J.; Elizondo-Salazar, J.A. Persistence of aflatoxins during milk processing. Food Addit. Contam. 2020, 37, 1498–1505. [Google Scholar] [CrossRef]
- Marchese, S.; Polo, A.; Ariano, A.; Velotto, S.; Costantini, S.; Severino, L. Aflatoxin B1 and M1: Biological properties and their involvement in cancer development. Toxins 2018, 10, 214. [Google Scholar] [CrossRef]
- EFSA Panel on Contaminants in the Food Chain (CONTAM); Schrenk, D.; Bignami, M.; Bodin, L.; Chipman, J.K.; del Mazo, J. Risk assessment of aflatoxins in food. EFSA J. 2020, 18, e06040. [Google Scholar] [CrossRef]
- Andrews-Trevino, J.Y.; Webb, P.; Shively, G.; Kablan, A.; Baral, K.; Davis, D.; Ghosh, S. Aflatoxin exposure and child nutrition: Measuring anthropometric and long-bone growth over time in Nepal. Am. J. Clin. Nutr. 2021, 113, 874–883. [Google Scholar] [CrossRef]
- Andrade, P.D.; Gomes da Silva, J.L.; Caldas, E.D. Risk assessment of aflatoxin M1 in milk consumed in Brazil. Food Control 2013, 29, 55–59. [Google Scholar] [CrossRef]
- Turner, P.C.; Moore, S.E.; Hall, A.J.; Prentice, A.M.; Wild, C.P. Modification of immune function through exposure to dietary aflatoxin in Gambian children. Environ. Health Perspect. 2003, 111, 217–220. [Google Scholar] [CrossRef]
- Leroy, J.L.; Sununtnasuk, C.; García-Guerra, A.; Wang, J.S. Low level aflatoxin exposure associated with greater linear growth in southern Mexico: A longitudinal study. Matern. Child Nutr. 2018, 14, e12619. [Google Scholar] [CrossRef] [PubMed]
- Matchado, A.; Smith, J.W.; Schulze, K.J.; Groopman, J.D.; Kortekangas, E.; Chaima, D.; Stewart, C.P. Child aflatoxin exposure is associated with poor child growth outcomes: A prospective cohort study in rural Malawi. Curr. Dev. Nutr. 2023, 7, 101962. [Google Scholar] [CrossRef]
- Ashraf, W.; Rehman, A.; Rabbani, M.; Aamir, K.; Wang, J.S. Assessing the risk and consequences of naturally occurring aflatoxins on liver and kidney health in children: A cross-sectional analysis in Lahore, Pakistan. Public Health Toxicol. 2024, 4, 1–12. [Google Scholar] [CrossRef]
- Mahfuz, M.; Hossain, M.S.; Alam, M.A.; Gazi, M.A.; Fahim, S.M.; Nahar, B.; Ahmed, T. Chronic aflatoxin exposure and cognitive and language development in young children of Bangladesh: A longitudinal study. Toxins 2022, 14, 855. [Google Scholar] [CrossRef] [PubMed]
- Maggira, M.; Ioannidou, M.; Sakaridis, I.; Samouris, G. Determination of aflatoxin m1 in raw milk using an HPLC-FL method in comparison with commercial elisa kits—Application in raw milk samples from various regions of Greece. Vet. Sci. 2021, 8, 46. [Google Scholar] [CrossRef]
- Kolarič, L.; Šimko, P. Development and validation of HPLC-FLD method for aflatoxin M1 determination in milk and dairy products. Acta Chim. Slovaca 2023, 16, 99–108. [Google Scholar] [CrossRef]
- Buzás, H.; Szabó-Sárvári, L.C.; Szabó, K.; Nagy-Kovács, K.; Bukovics, S.; Süle, J.; Kovács, A.J. Aflatoxin M1 detection in raw milk and drinking milk in Hungary by ELISA− A one-year survey. J. Food Compos. Anal. 2023, 121, 105368. [Google Scholar] [CrossRef]
- Quevedo-Garza, P.A.; Amador-Espejo, G.G.; Cantú-Martínez, P.C.; Trujillo-Mesa, J.A. Aflatoxin M1 occurrence in fluid milk commercialized in Monterrey, Mexico. J. Food Saf. 2018, 38, e12507. [Google Scholar] [CrossRef]
- Álvarez-Días, F.; Torres-Parga, B.; Valdivia-Flores, A.G.; Quezada-Tristán, T.; Alejos-De La Fuente, J.I.; Sosa-Ramírez, J.; Rangel-Muñoz, E.J. Aspergillus flavus and total aflatoxins occurrence in dairy feed and aflatoxin M1 in bovine milk in Aguascalientes, México. Toxins 2022, 14, 292. [Google Scholar] [CrossRef]
- Hernández-Falcón, T.A.; Monter-Arciniega, A.; Cruz-Cansino, N.S. Alanís-García, E.; Rodríguez-Serrano, G.M.; Castañeda-Ovando, A. Effect of thermoultrasound on aflatoxin M1 levels, physicochemical and microbiological properties of milk during storage. Ultrason. Sonochem. 2018, 48, 396–403. [Google Scholar] [CrossRef]
- Quevedo-Garza, P.A.; Amador-Espejo, G.G.; Salas-García, R.; Ramos-Peña, E.G.; Trujillo, A.J. Aflatoxin M1 Determination in infant formulae distributed in Monterrey, Mexico. Toxins 2020, 12, 100. [Google Scholar] [CrossRef] [PubMed]
- Patricia, L.; Noa, M.; López, Y.; González, D.G.; Noa, E.; Real, M. Aflatoxin M1 levels in raw and pasteurized milk produced in Guadalajara, Mexico. Rev. Salud Anim. 2012, 34, 40–45. [Google Scholar]
- Pérez, J.; Gutiérrez, R.; Vega, S.; Díaz, G.; Urbán, G.; Coronado, M.; Escobar, A. Occurrence of aflatoxin M1 in raw, ultra pasteurized and organic milks produced and marketed in Mexico. Rev. Salud Anim. 2008, 30, 103–109. [Google Scholar]
- Carvajal, M.; Bolaños, A.; Rojo, F.; Méndez, I. Aflatoxin M1 in pasteurized and ultrapasteurized milk with different fat content in Mexico. J. Food Prot. 2003, 66, 1885–1892. [Google Scholar] [CrossRef] [PubMed]
- Norma Oficial Mexicana. NOM-243-SSA1-2010; Leche, Fórmula Láctea, Producto Lácteo y Derivados Lácteos. Disposiciones y Aplicaciones Sanitarias; Métodos de Prueba. Secretaria de Salud: Mexico City, México, 2010; Available online: https://dof.gob.mx/normasOficiales/4156/salud2a/salud2a.htm (accessed on 2 March 2025).
- Rahimzadeh-Barzoki, H.; Faraji, H.; Beirami, S.; Keramati, F.Z.; Nayik, G.A.; Izadi-Yazdanaabadi, Z.; Mozaffari-Nejad, A.S. Seasonal study of aflatoxin M1 contamination in cow milk on the retail dairy market in Gorgan, Iran. Dairy 2023, 4, 571–580. [Google Scholar] [CrossRef]
- Kortei, N.K.; Annan, T.; Kyei-Baffour, V.; Essuman, E.K.; Boakye, A.A.; Tettey, C.O.; Boadi, N.O. Exposure assessment and cancer risk characterization of aflatoxin M1 (AFM1) through ingestion of raw cow milk in southern Ghana. Toxicol. Rep. 2022, 9, 1189–1197. [Google Scholar] [CrossRef]
- Kafle, S.; Paudel, M.; Shrestha, C.; Kathayat, K.B.; Sapkota, R.C.; Tiwari, A.; Subedi, D. Aflatoxin M1 Contamination in dairy milk in kathmandu, Nepal. Toxins 2024, 16, 468. [Google Scholar] [CrossRef]
- Min, L.; Tong, X.; Sun, H.; Ding, D.; Xu, B.; Chen, W.; Li, D. Aflatoxin M1 contamination in raw milk and its association with herd types in the ten provinces of Southern China. Ital. J. Anim. Sci. 2021, 20, 1562–1567. [Google Scholar] [CrossRef]
- Foerster, C.; Monsalve, L.; Ríos-Gajardo, G. Occurrence of aflatoxin M1 in milk and exposure estimation for its consumption in the Chilean population. Food Control 2023, 148, 109677. [Google Scholar] [CrossRef]
- Iqbal, S.Z.; Asi, M.R.; Jinap, S. Assessment of aflatoxins in milk and feed samples and impact of UHT processing on aflatoxins. Food Control 2017, 2, 81–86. [Google Scholar] [CrossRef]
- Vagef, R.; Mahmoudi, R. Occurrence of Aflatoxin M1 in raw and pasteurized milk produced in west region of Iran (during summer and winter). Int. Food Res. J. 2013, 20, 1421. [Google Scholar]
- Wang, J.; Liu, J.; Li, Y. Aflatoxin M1 in milk and dairy products in China. Food Control 2012, 23, 198–204. [Google Scholar] [CrossRef]
- De Girolamo, A.; Cervato, G.; Pascale, M. Recent advances in aflatoxin M1 detection by chromatographic and biosensing methods. Toxins 2022, 14, 179. [Google Scholar] [CrossRef]
- Kuiper-Goodman, T. Approaches to the risk assessment of mycotoxins in food. J. Physiol. Pharmacol. 1990, 7, 497–513. [Google Scholar] [CrossRef]
- Biancardi, A.; Piro, R.; Dall’asta, C.; Galaverna, G. A simple and reliable liquid chromatography-tandem mass spectrometry method for the determination of aflatoxin M1 in milk. Food Addit. Contam. Part A 2013, 30, 381–388. [Google Scholar] [CrossRef] [PubMed]
- Campone, L.; Piccinelli, A.L.; Celano, R.; Pagano, I.; Russo, M.; Rastrelli, L. Rapid and automated analysis of aflatoxin M1 in milk and dairy products by online solid phase extraction coupled to ultra-high-pressure-liquid-chromatography tandem mass spectrometry. J. Chromatogr. A 2016, 1428, 212–219. [Google Scholar] [CrossRef]
- International Conference on Harmonisation (ICH). Validation of Analytical Procedures: Text and Methodology Q2(R1). ICH Harmonised Tripartite Guideline. 2005. Available online: https://database.ich.org (accessed on 15 May 2025).
- Encuesta Nacional de Salud y Nutrición (ENSANUT). La Encuesta Nacional de Salud y Nutrición. Salud Publica Mexico. 2022. Available online: https://www.saludpublica.mx/index.php/spm/article/view/15087 (accessed on 28 February 2025).
- Norma Oficial Mexicana. NOM-031-SSA2-1999; Para la Atención a la Salud del Niño. Secretaria de Salud: Acapulco, México, 1999; Available online: https://www.cndh.org.mx/DocTR/2016/JUR/A70/01/JUR-20170331-NOR12.pdf (accessed on 10 December 2024).
- World Health Organization (WHO). Child Growth Standards. 2023. Available online: https://www.who.int/tools/child-growth-standards/standards (accessed on 20 November 2024).
- European Commission (EC). 466/2001; Setting Maximum Levels for Certain in Foodstuffs. Official Journal of the European Union. 2006. Available online: https://eur-lex.europa.eu/eli/reg/2001/466/oj/eng (accessed on 4 November 2024).
- European Commission (EC). 2002/657/EC; Implementing Council Directive 96/23/EC Concerning the Performance of Analytical Methods and the Interpretation of Results. Official Journal of the European Union. 2001. Available online: https://eur-lex.europa.eu/eli/dec/2002/657/oj/eng (accessed on 19 May 2024).
- Stella, R.; Bovo, D.; Noviello, S.; Contiero, L.; Barberio, A.; Angeletti, R.; Biancotto, G. Fate of aflatoxin M1 from milk to typical Italian cheeses: Validation of an HPLC method based on aqueous buffer extraction and immune-affinity clean up with limited use of organic solvents. Food Control 2024, 157, 110149. [Google Scholar] [CrossRef]
- Wang, Y.; Liu, X.; Xiao, C.; Wang, Z.; Wang, J.; Xiao, H.; Yue, T. HPLC determination of aflatoxin M1 in liquid milk and milk powder using solid phase extraction on OASIS HLB. Food Control 2012, 28, 131–134. [Google Scholar] [CrossRef]
- Van Camp, C.; Van Hassel, W.H.R.; Abdallah, M.F.; Masquelier, J. Simultaneous detection and quantification of aflatoxin M1, eight microcystin congeners and nodularin in dairy milk by LC-MS/MS. Chemosensors 2023, 11, 511. [Google Scholar] [CrossRef]
- Miró-Abella, E.; Herrero, P.; Canela, N.; Arola, L.; Borrull, F.; Ras, R.; Fontanals, N. Determination of mycotoxins in plant-based beverages using QuEChERS and liquid chromatography–tandem mass spectrometry. Food Chem. 2017, 229, 366–372. [Google Scholar] [CrossRef]
- Sartori, A.V.; de Moraes, M.H.P.; dos Santos, R.P.; Souza, Y.P.; Candido, F.S.; da Nóbrega, A.W. Determination of Aflatoxins M1, M2, B1, B2, G1, G2 and ochratoxin A in infant formulas from Brazil using a modified QuEChERS method and UHPLC-MS/MS. Food Anal. Methods 2023, 16, 841–849. [Google Scholar] [CrossRef]
- Comisión Nacional del Agua (CONAGUA). Sistema de Información Climatológica para México. 2023. Available online: https://smn.conagua.gob.mx (accessed on 14 May 2025).
- Daou, R.; Joubrane, K.; Maroun, R.G.; Khabbaz, L.R.; Ismail, A.; El Khoury, A. Mycotoxins: Factors influencing production and control strategies. AIMS Agric. Food. 2021, 6, 416–447. [Google Scholar] [CrossRef]
- Wu, L.X.; Ding, X.X.; Li, P.W.; Du, X.H.; Zhou, H.Y.; Bai, Y.Z.; Zhang, L.X. Aflatoxin contamination of peanuts at harvest in China from 2010 to 2013 and its relationship with climatic conditions. Food Control 2016, 60, 117–123. [Google Scholar] [CrossRef]
- Gruber-Dorninger, C.; Jenkins, T.; Schatzmayr, G. Global mycotoxin occurrence in feed: A ten-year survey. Toxins 2019, 11, 375. [Google Scholar] [CrossRef] [PubMed]
- Tousignant, N. Residual unprotection: Aflatoxin research and regulation in Senegal’s postcolonial peanut infrastructures. Globalizations 2023, 20, 932–949. [Google Scholar] [CrossRef]
- Mahuku, G.; Nzioki, H.S.; Mutegi, C.; Kanampiu, F.; Narrod, C.; Makumbi, D. Pre-harvest management is a critical practice for minimizing aflatoxin contamination of maize. Food Control 2019, 96, 219–226. [Google Scholar] [CrossRef]
- Zhang, W.; Lv, Y.; Yang, H.; Wei, S.; Zhang, S.; Li, N.; Hu, Y. Sub3 inhibits mycelia growth and aflatoxin production of Aspergillus flavus. Food Biophys. 2022, 17, 248–259. [Google Scholar] [CrossRef]
- Raghu, D.; Senthilkumar, R.P.; Srinivasan, M.R.; Jaikanth, C.M.; Sarathchandra, G. Assessment of the occurrence of mycotoxins in livestock feeds and feed ingredients. Indian J. Vet. Anim. Sci. Res. 2021, 50, 32–44. [Google Scholar]
- Zhu, Z.; Cheng, H.; Wang, J.; Ma, J.; Wang, J.; Wang, H.; Yang, J. Occurrence of co-contamination and interaction of multi-mycotoxins in dairy cow feed in China. Toxins 2025, 17, 137. [Google Scholar] [CrossRef]
- Minooeianhaghighi, M.H.; Marvi-Moghadam, A.; Taghavi, M. Investigation of feedstuff contaminated with aflatoxigenic fungi species in the semi-arid region in northeast of Iran. Environ. Monit. Assess. 2021, 193, 214. [Google Scholar] [CrossRef]
- Tsakiris, I.N.; Tzatzarakis, M.N.; Alegakis, A.K.; Vlachou, M.; Renieri, E.A.; Tsatsakis, A.M. Risk assessment scenarios of children’s exposure to aflatoxin M1 residues in different milk types in Greece. Food Chem. Toxicol. 2013, 56, 261–265. [Google Scholar] [CrossRef]
- Alahlah, Y.; Al-Dmoor, H.; Al-Dmoor, R.; Al-Dmoor, M. Aflatoxin M1 levels in raw and pasteurized cow’s milk in Jordan. J. Food Saf. 2020, 40, e12819. [Google Scholar] [CrossRef]
- Ismail, A.; Akhtar, S.; Levin, R.E.; Ismail, T.; Riaz, M.; Amir, M. Aflatoxin M1: Prevalence and decontamination strategies in milk and milk products. Crit. Rev. Microbiol. 2017, 42, 418–437. [Google Scholar] [CrossRef] [PubMed]
- Serraino, A.; Bonilauri, P.; Kerekes, K.; Farkas, Z.; Giacometti, F.; Canever, A.; Ambrus, Á. Occurrence of aflatoxin M1 in raw milk marketed in Italy: Exposure assessment and risk characterization. Front. Microbiol. 2019, 10, 2516. [Google Scholar] [CrossRef]
- Hooshfar, S.; Khosrokhavar, R.; Yazdanpanah, H.; Eslamizad, S.; Kobarfard, F.; Nazari, F.; Tsatsakis, A. Health risk assessment of aflatoxin M1 in infant formula milk in IR Iran. Food Chem. Toxicol. 2020, 142, 111455. [Google Scholar] [CrossRef]
- Kaur, S.; Bedi, J.S.; Dhaka, P.; Vijay, D.; Aulakh, R.S. Exposure assessment and risk characterization of aflatoxin M1 through consumption of market milk and milk products in Ludhiana, Punjab. Food Control 2021, 126, 107991. [Google Scholar] [CrossRef]
- Ghaffarian-Bahraman, A.; Mohammadi, S.; Dini, A. Occurrence and risk characterization of aflatoxin M1 in milk samples from southeastern Iran using the margin of exposure approach. Food Sci. Nutr. 2023, 11, 7100–7108. [Google Scholar] [CrossRef]
- Farkas, Z.; Kerekes, K.; Ambrus, Á.; Süth, M.; Peles, F.; Pusztahelyi, T.; Jóźwiak, Á.B. Probabilistic modeling and risk characterization of the chronic aflatoxin M1 exposure of Hungarian consumers. Front. Microbiol. 2022, 13, 1000688. [Google Scholar] [CrossRef]
- Salas, R.; Acosta, N.; Garza, A.D.J.; Tijerina, A.; Dávila, R.; Jiménez-Salas, Z.; Trujillo, A.J. Levels of aflatoxin M1 in breast Milk of lactating mothers in Monterrey, Mexico: Exposure and health risk assessment of newborns. Toxins 2022, 14, 194. [Google Scholar] [CrossRef]
- Prietto, L.; Moraes, P.S.; Kraus, R.B.; Meneghetti, V.; Fagundes, C.A.A.; Furlong, E.B. Post-harvest operations and aflatoxin levels in rice (Oryza sativa). Crop Prot. 2015, 78, 172–177. [Google Scholar] [CrossRef]
- International Agency for Research on Cancer (IARC). Monographs on the Evaluation of Carcinogenic Risks to Humans: Aflatoxins. 2022. Available online: https://monographs.iarc.who.int/ (accessed on 17 December 2024).
- Nishimwe, K.; Bowers, E.L.; Dieu-Ayabagabo, J.; Habimana, R.; Mutiga, S.; Maier, D.E. Preliminary sampling of aflatoxin M1 contamination in raw milk from dairy farms using feed ingredients from Rwanda. Mycotoxin Res. 2022, 38, 107–115. [Google Scholar] [CrossRef] [PubMed]
- Poapolathep, S.; Klangkaew, N.; Phaochoosak, N.; Jawjaroensri, W.; Sroynum, A.; Saipinta, D.; Poapolathep, A. Occurrence and potential health risk of aflatoxin M1 in raw, pasteurized, and UHT milk in Thailand. World Mycotoxin J. 2024, 17, 85–94. [Google Scholar] [CrossRef]
- Prandini, A.; Tansini, G.; Sigolo, S.; Filippi, L.; Laporta, M.; Piva, G. On the occurrence of aflatoxin M1 in milk and dairy products. Food Chem. Toxicol. 2009, 47, 984–991. [Google Scholar] [CrossRef] [PubMed]
- Simões, A.R.P.; Bánkuti, F.I.; Borges, J.A.R.; Roschel, M.S.; Nicholson, C.F. Dairy farmers’ satisfaction with the price paid by processors in competitive markets. J. Dairy. Sci. 2025, 108, 2315–2323. [Google Scholar] [CrossRef]
- Sudirjo, F.; Kespandiar, T.; Nurofik, A.; Utami, M.P. The influence of price, product quality and promotion on customers purchase intention of pasteurized milk products. J. Ekon. Manaj. Akunt. 2023, 9, 650–654. [Google Scholar] [CrossRef]
- Gutiérrez, R.; Vega, S.; Pérez, J.J.; Ruiz, J.L.; Yamazaki, A.; Rivera, J.G.; Escobar, A. Evaluación de aflatoxina M1 en leche orgánica producida en Tecpatán, Chiapas, México. Rev. Salud Anim. 2013, 35, 33–37. [Google Scholar]
- Armorini, S.; Altafini, A.; Zaghini, A.; Roncada, P. Occurrence of aflatoxin M1 in conventional and organic milk offered for sale in Italy. Mycotoxin Res. 2016, 32, 237–246. [Google Scholar] [CrossRef]
- Tosun, H.; Ayyıldız, T. Occurrence of aflatoxin M1 in organic dairy products. Qual. Assur. Saf. Crops Foods 2013, 5, 215–219. [Google Scholar] [CrossRef]
- Yang, X.; Liu, B.; Zhang, L.; Wang, X.; Xie, J.; Liang, J. Spatial distribution and dietary risk assessment of aflatoxins in raw milk and dairy feedstuff samples from different climate zones in China. Toxins 2025, 17, 41. [Google Scholar] [CrossRef]
- Mozafari, S.; Mohsenzadeh, M.; Mehrzad, J. Seasonally feed-related aflatoxins B1 and M1 spread in semiarid industrial dairy herd and its deteriorating impacts on food and immunity. J. Food Qual. 2017, 1, 4067989. [Google Scholar] [CrossRef]
Disclaimer/Publisher’s Note: The statements, opinions and data contained in all publications are solely those of the individual author(s) and contributor(s) and not of MDPI and/or the editor(s). MDPI and/or the editor(s) disclaim responsibility for any injury to people or property resulting from any ideas, methods, instructions or products referred to in the content. |
© 2025 by the authors. Licensee MDPI, Basel, Switzerland. This article is an open access article distributed under the terms and conditions of the Creative Commons Attribution (CC BY) license (https://creativecommons.org/licenses/by/4.0/).