
Studies and Rejection of Intercrystal Crosstalk on FPGA in a High-Energy Photon-Counting System


Abstract
1. Introduction
2. Methodology
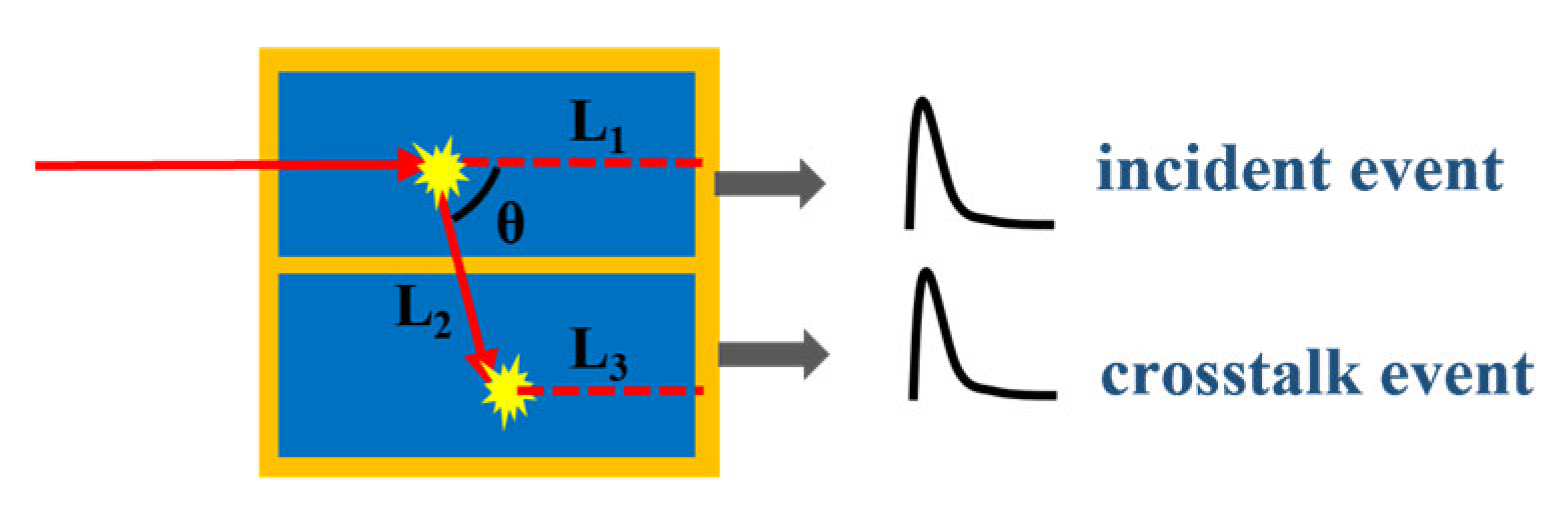
2.1. Intercrystal Scattering Simulation Model
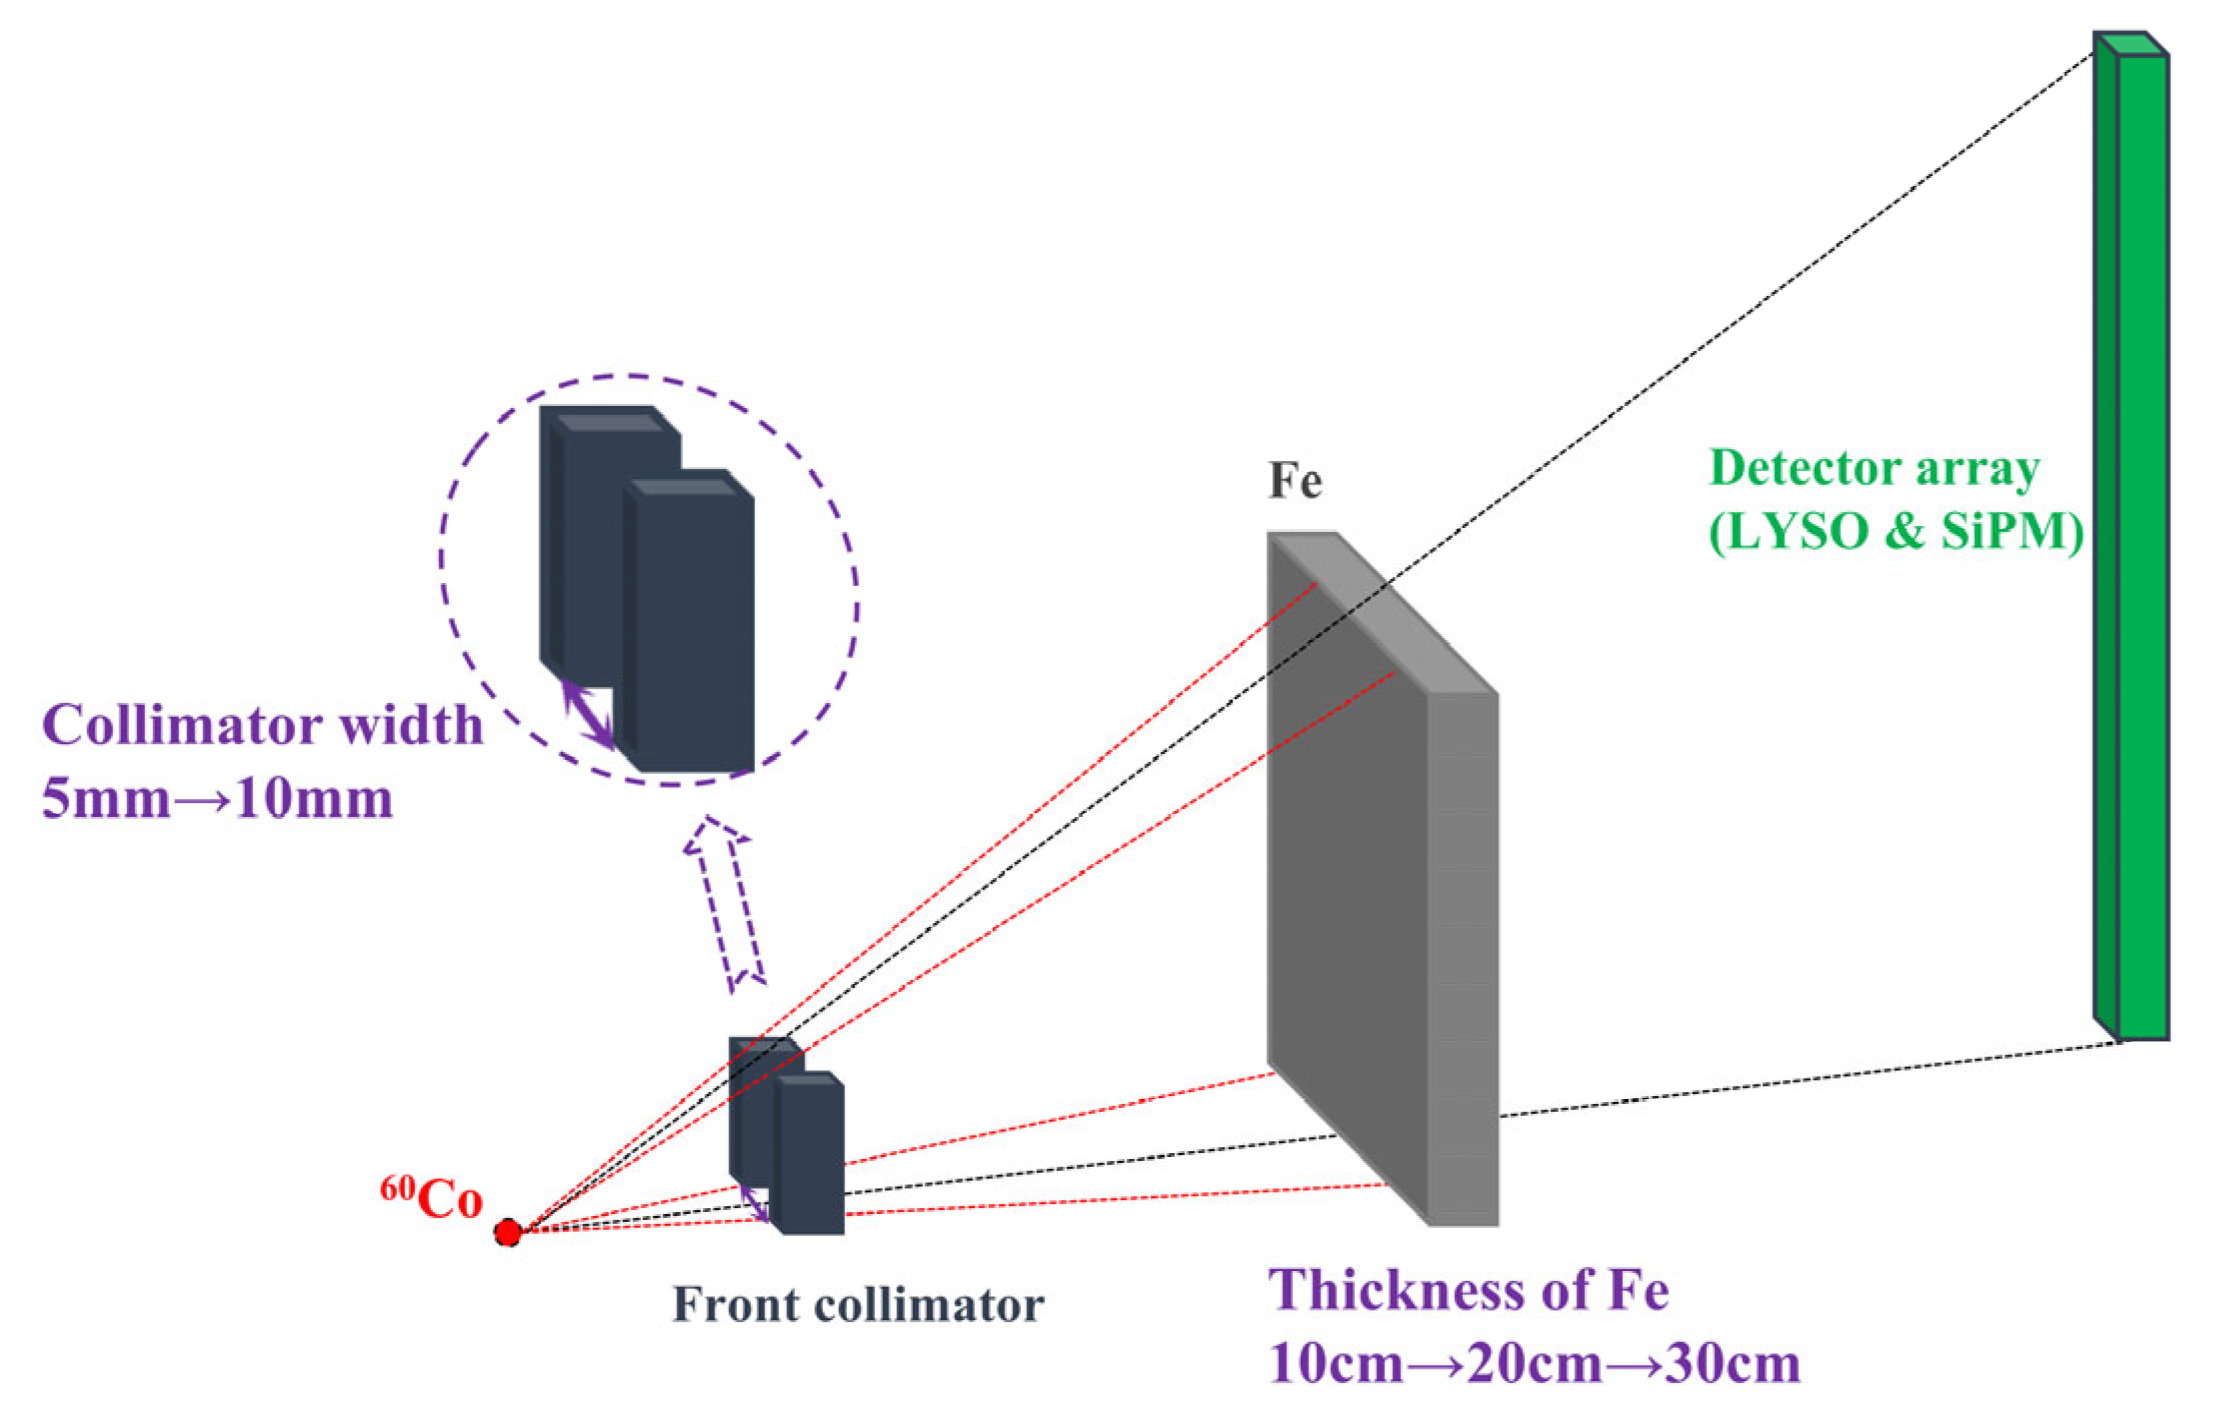
2.2. Steel Penetration (SP) Simulation Model
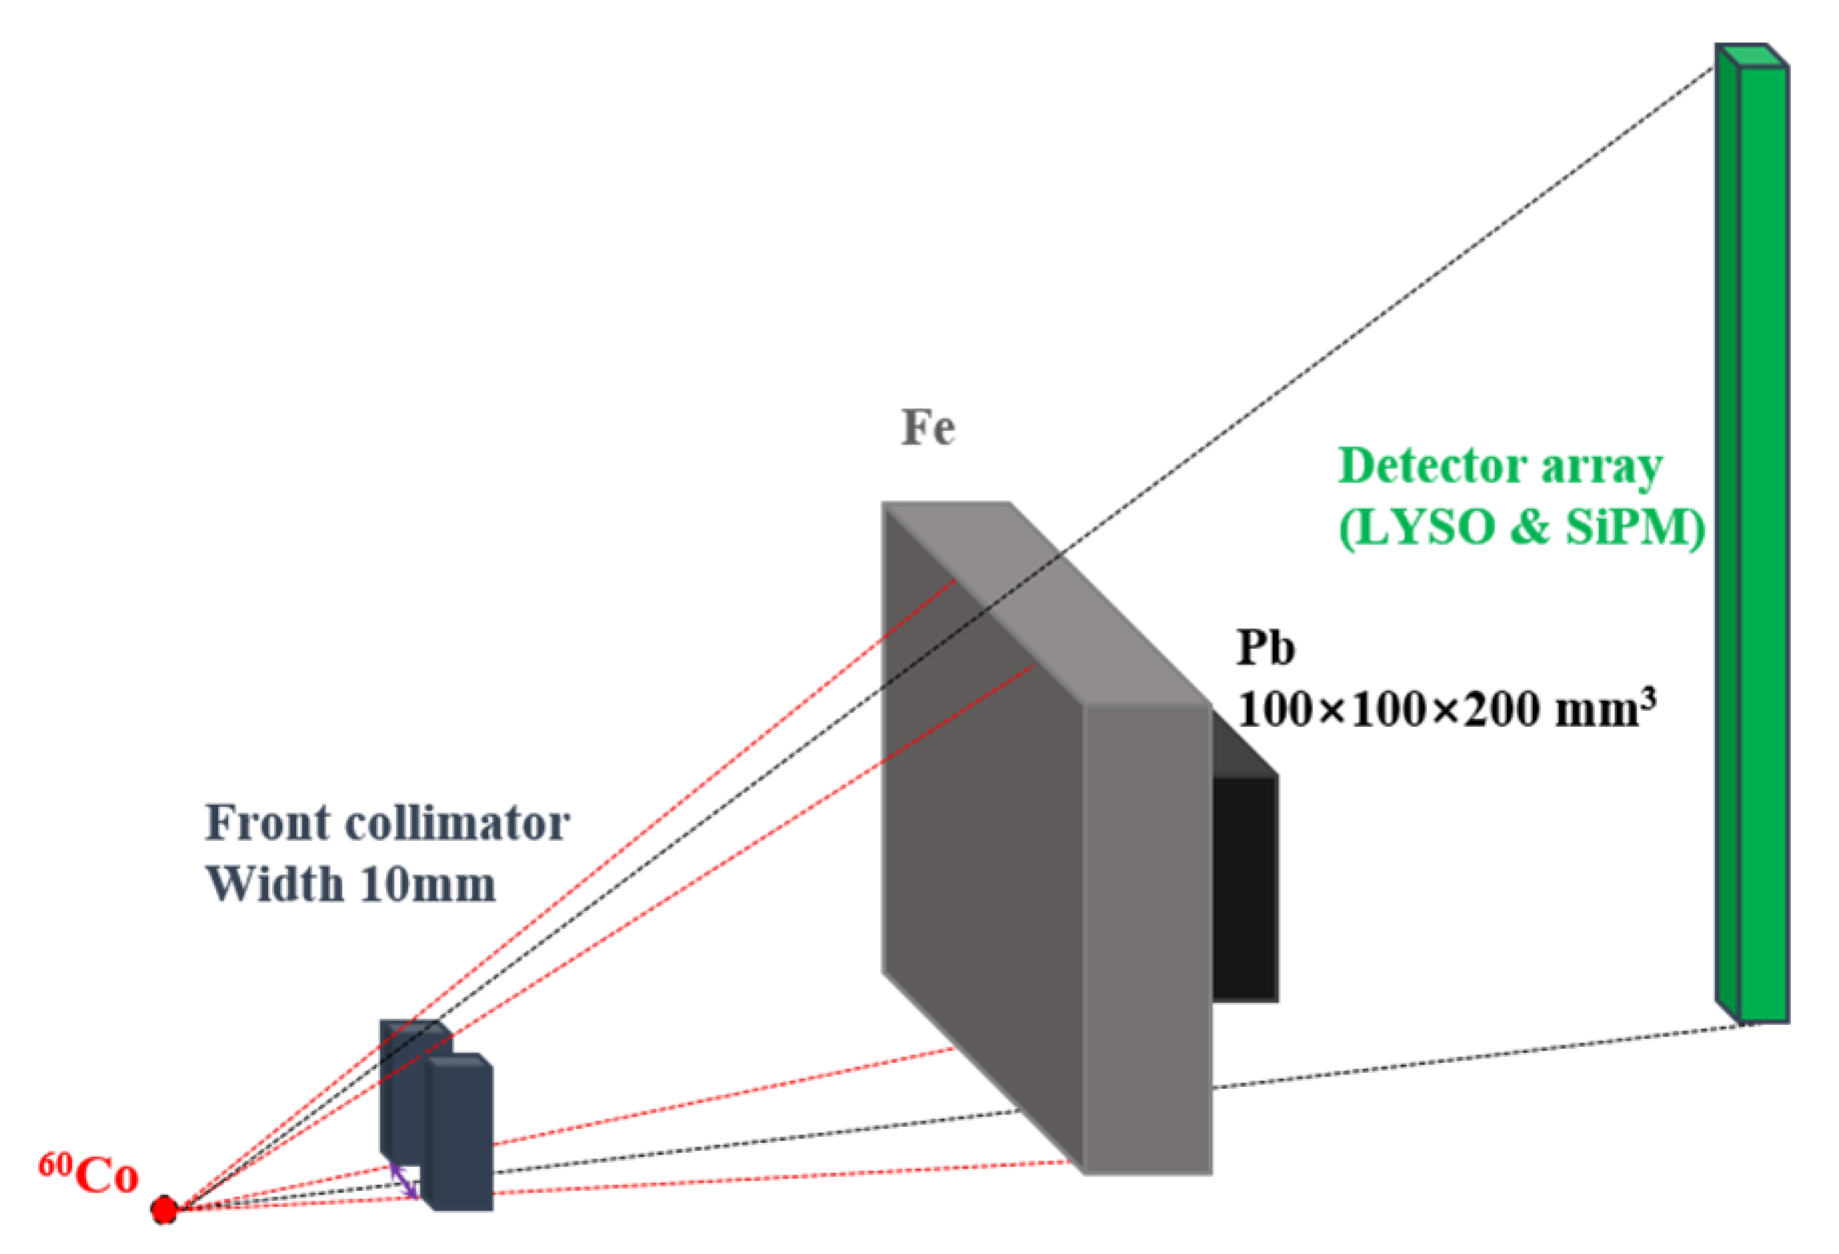
2.3. SP Test Platform
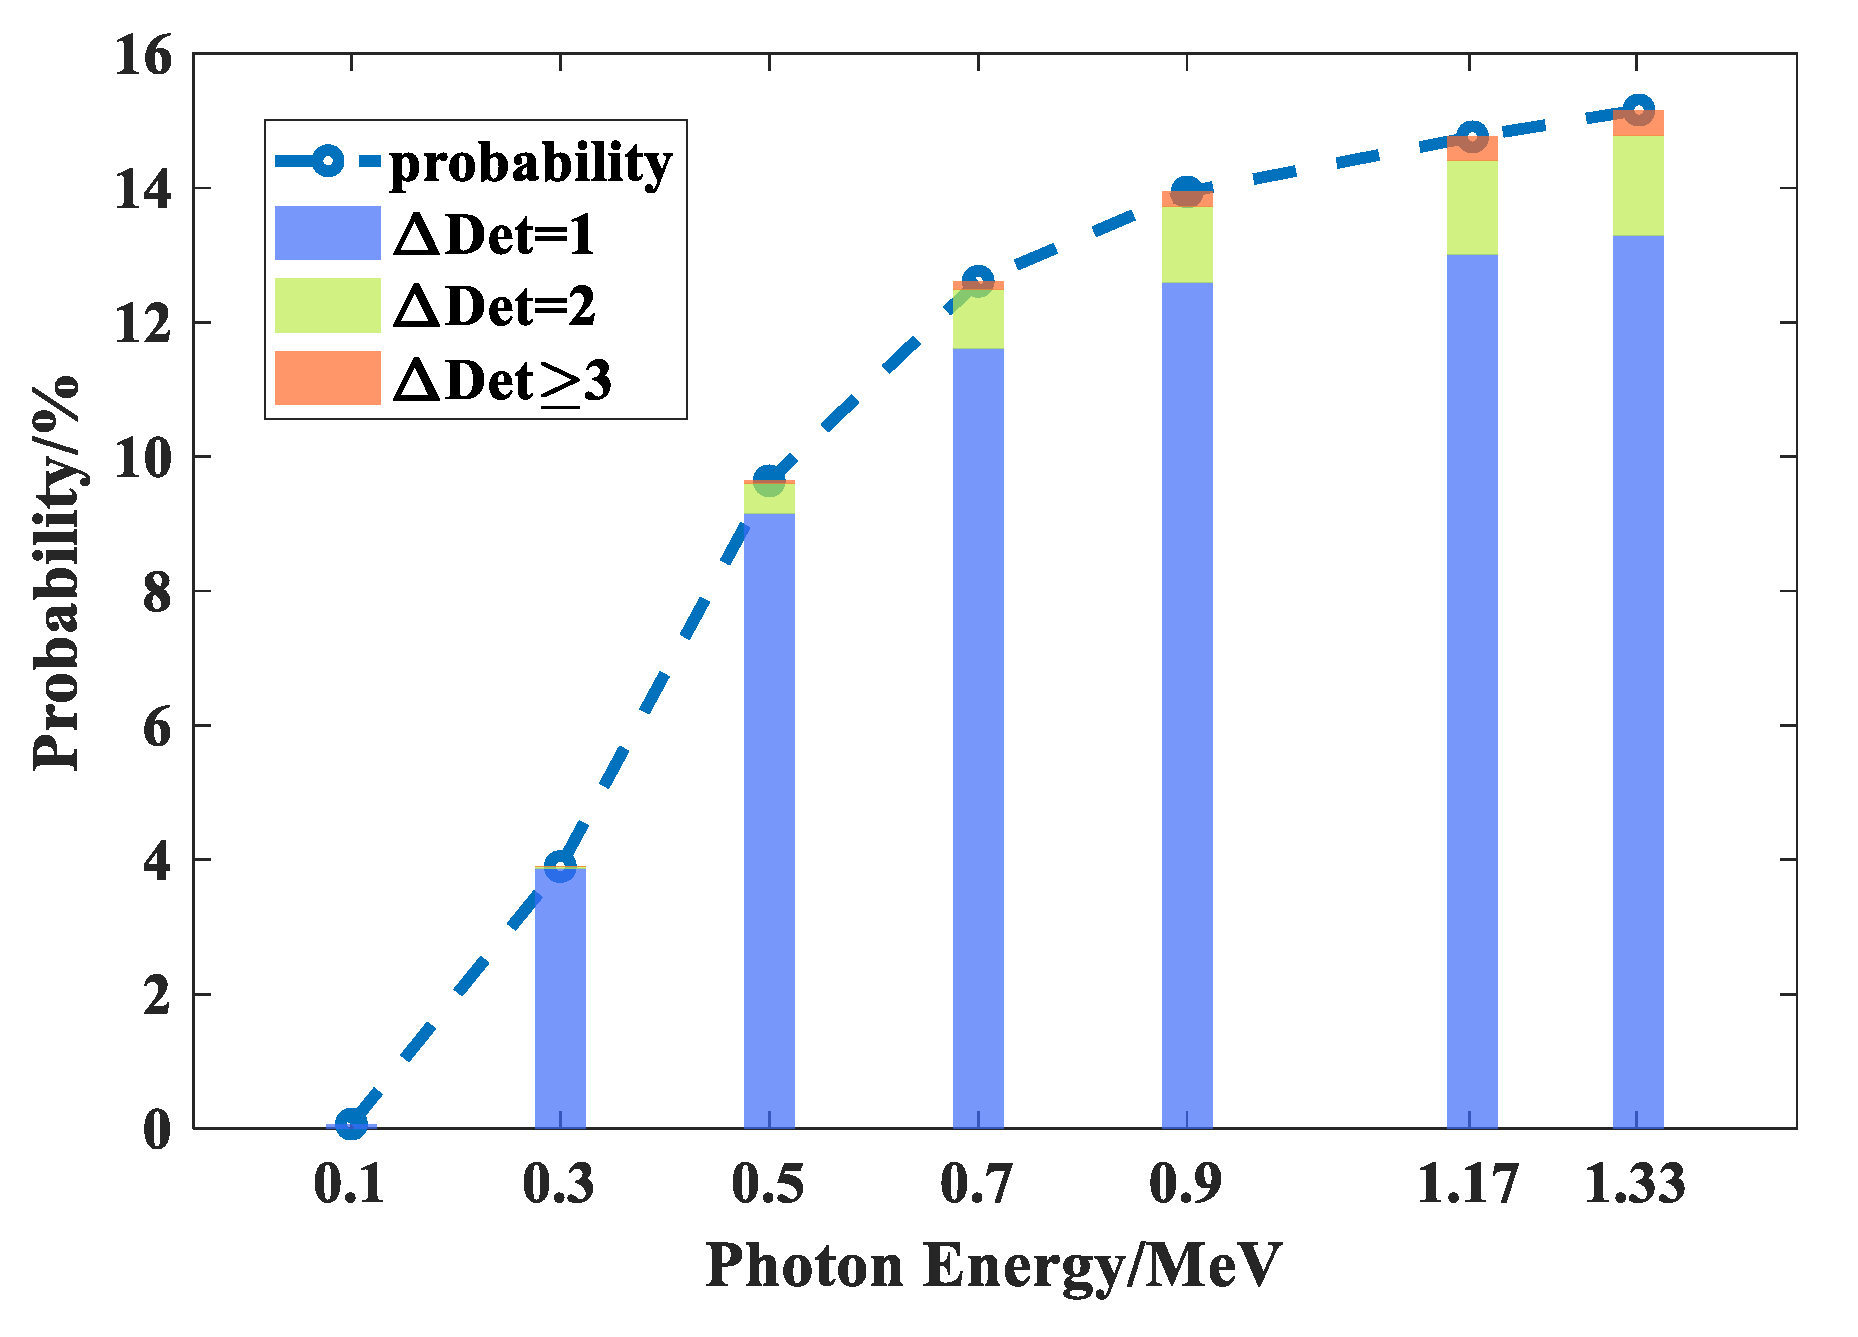
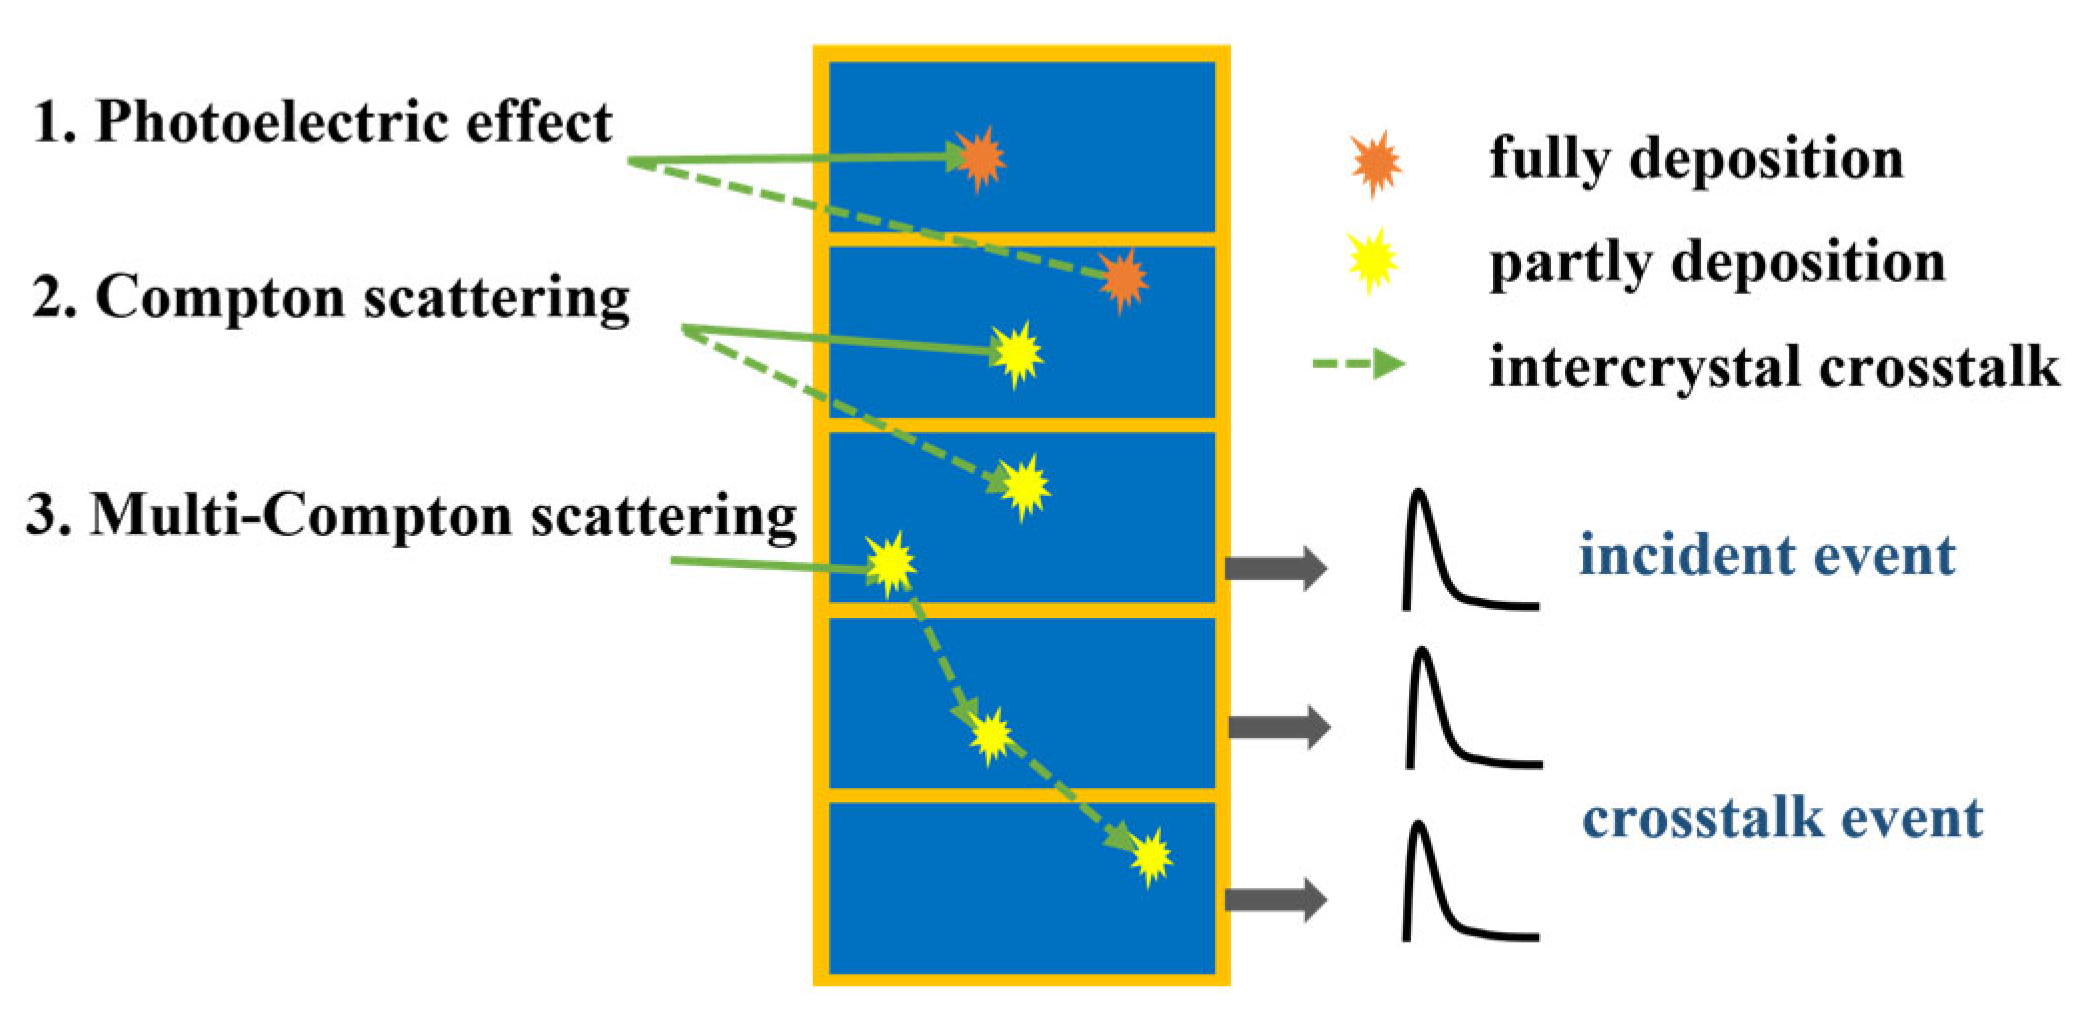
3. Studies of Intercrystal Scatter
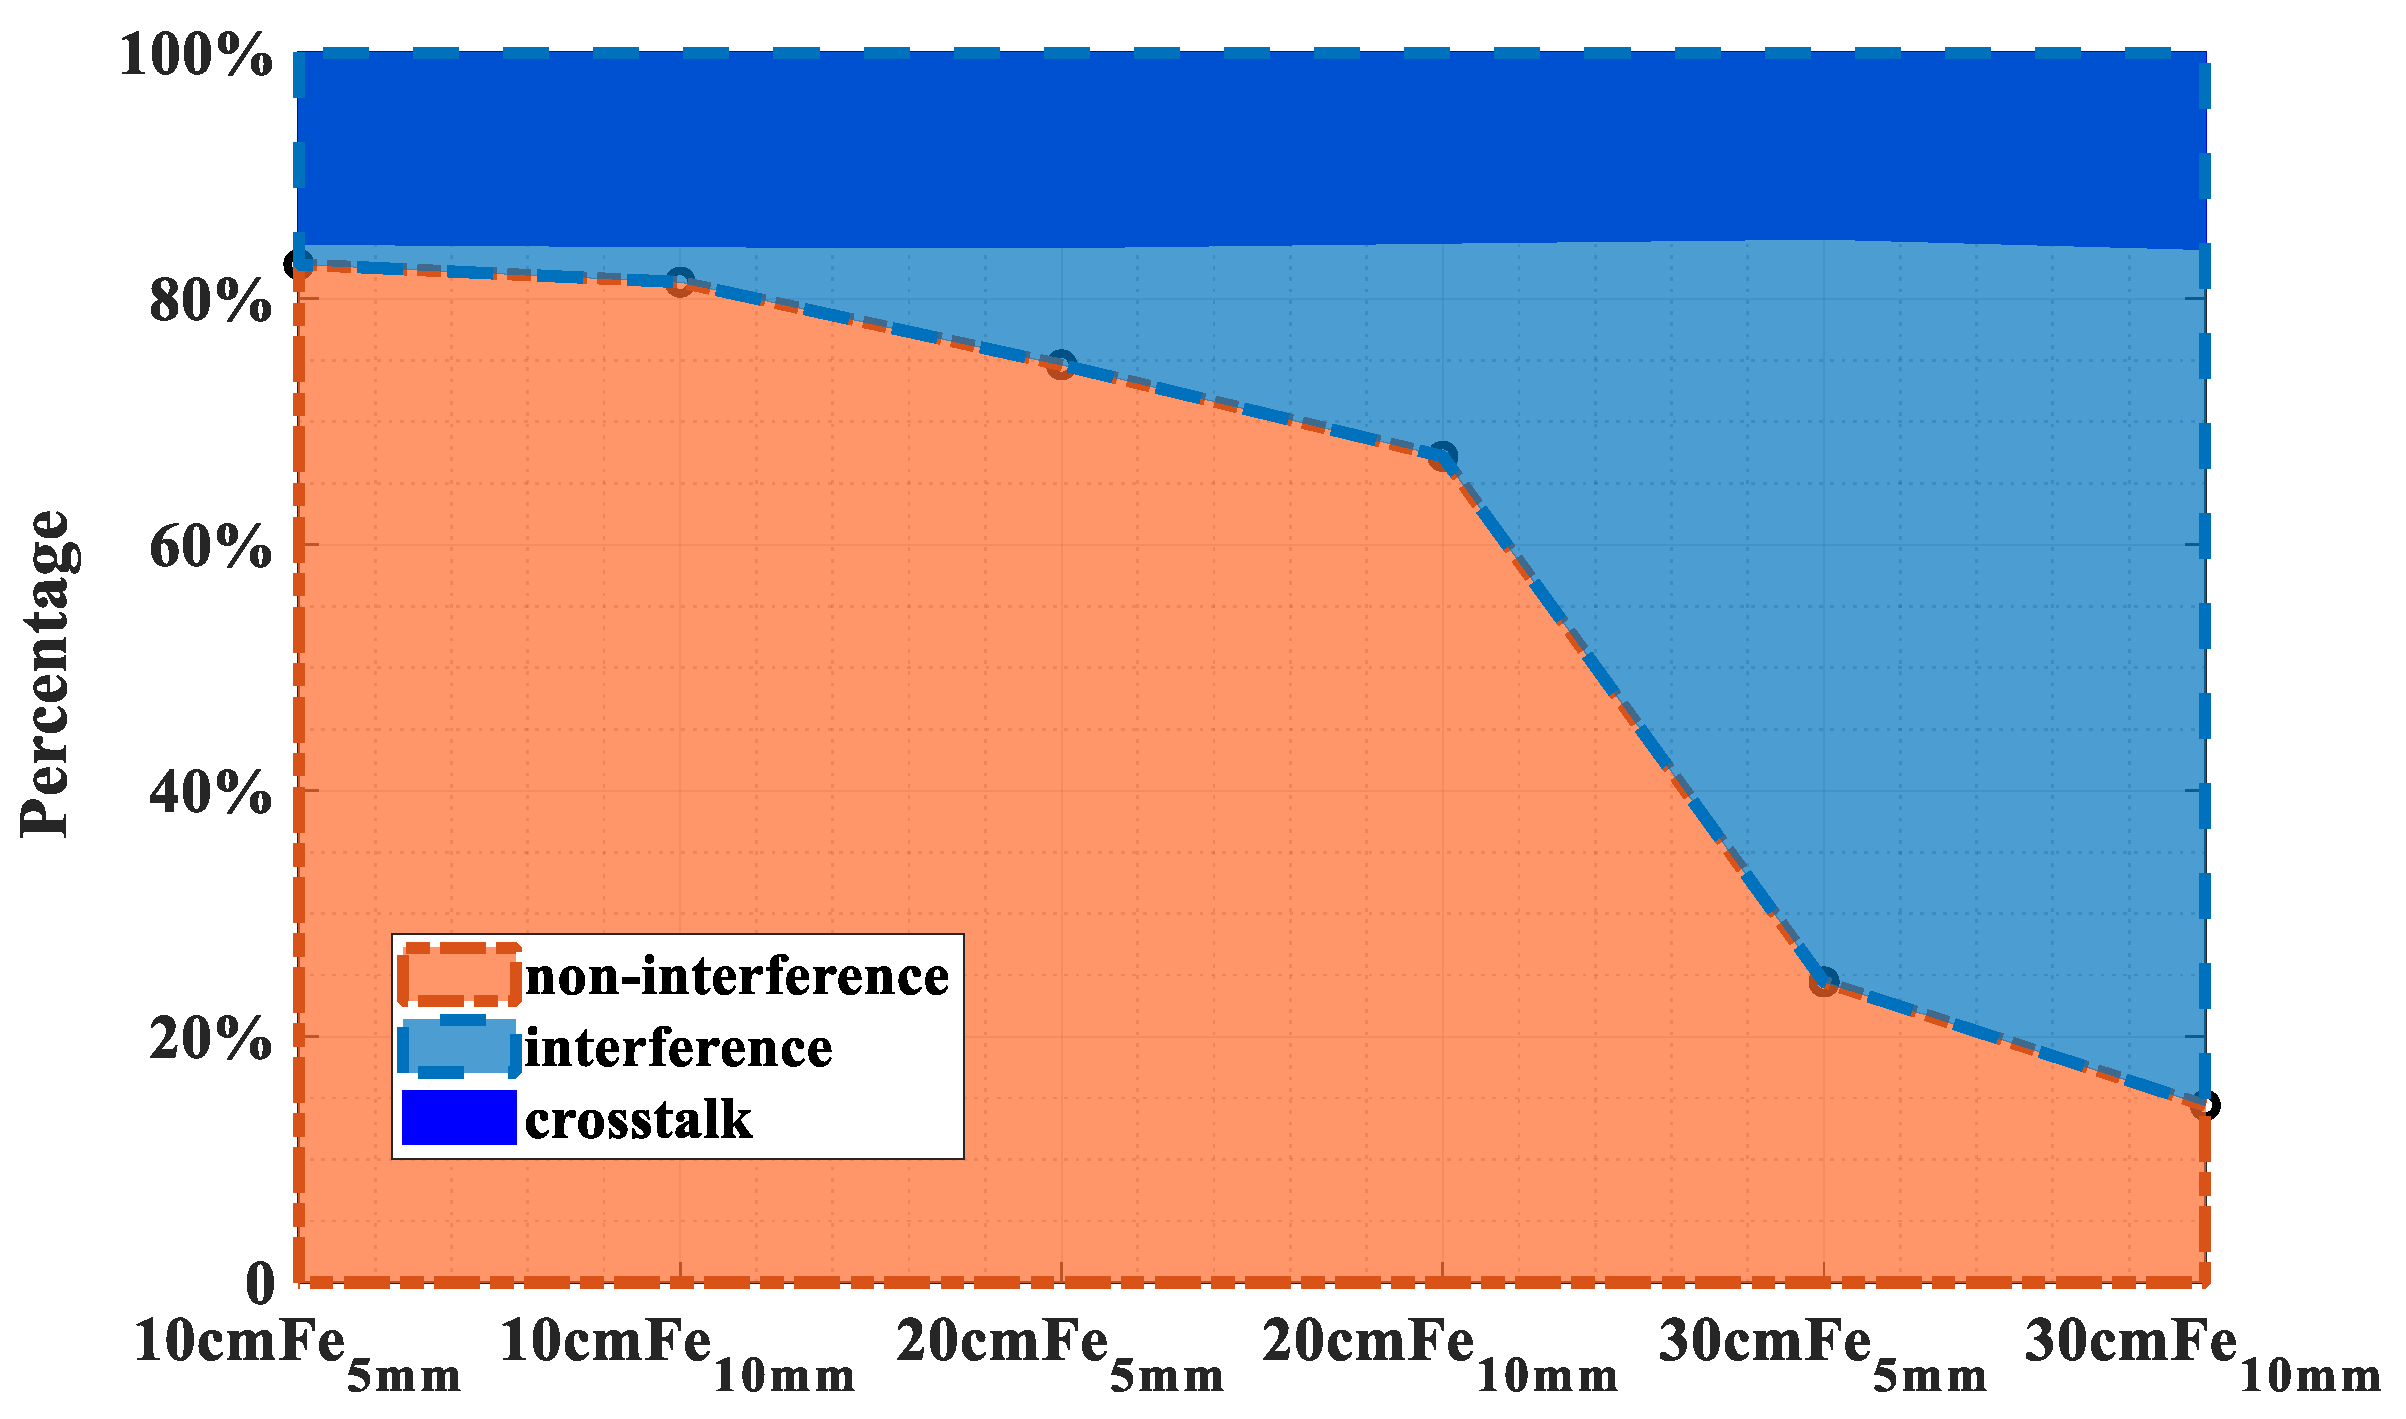
3.1. Proportion and Effect
3.2. Characters
3.2.1. Energy
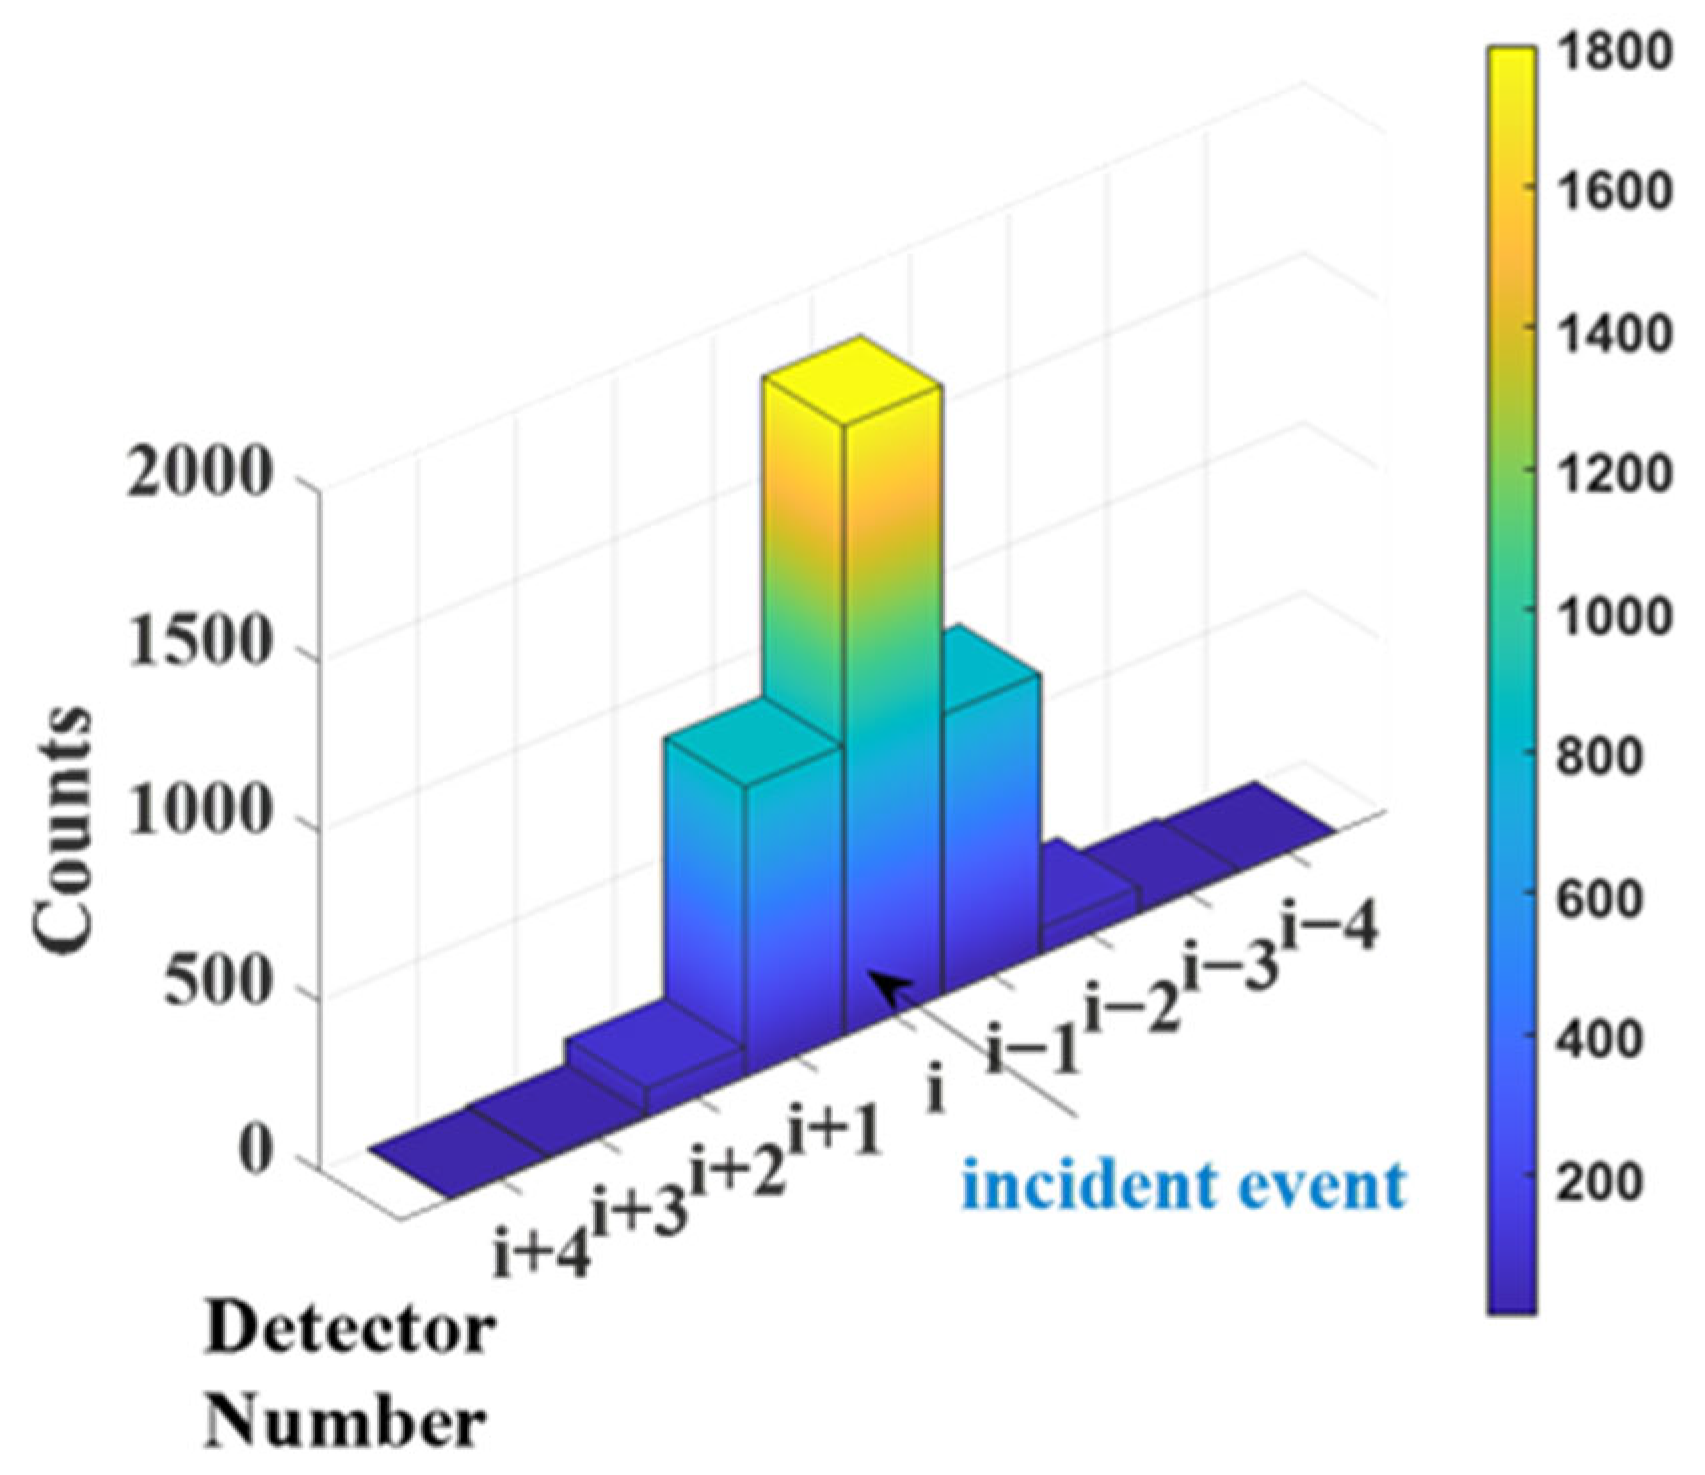
3.2.2. Position
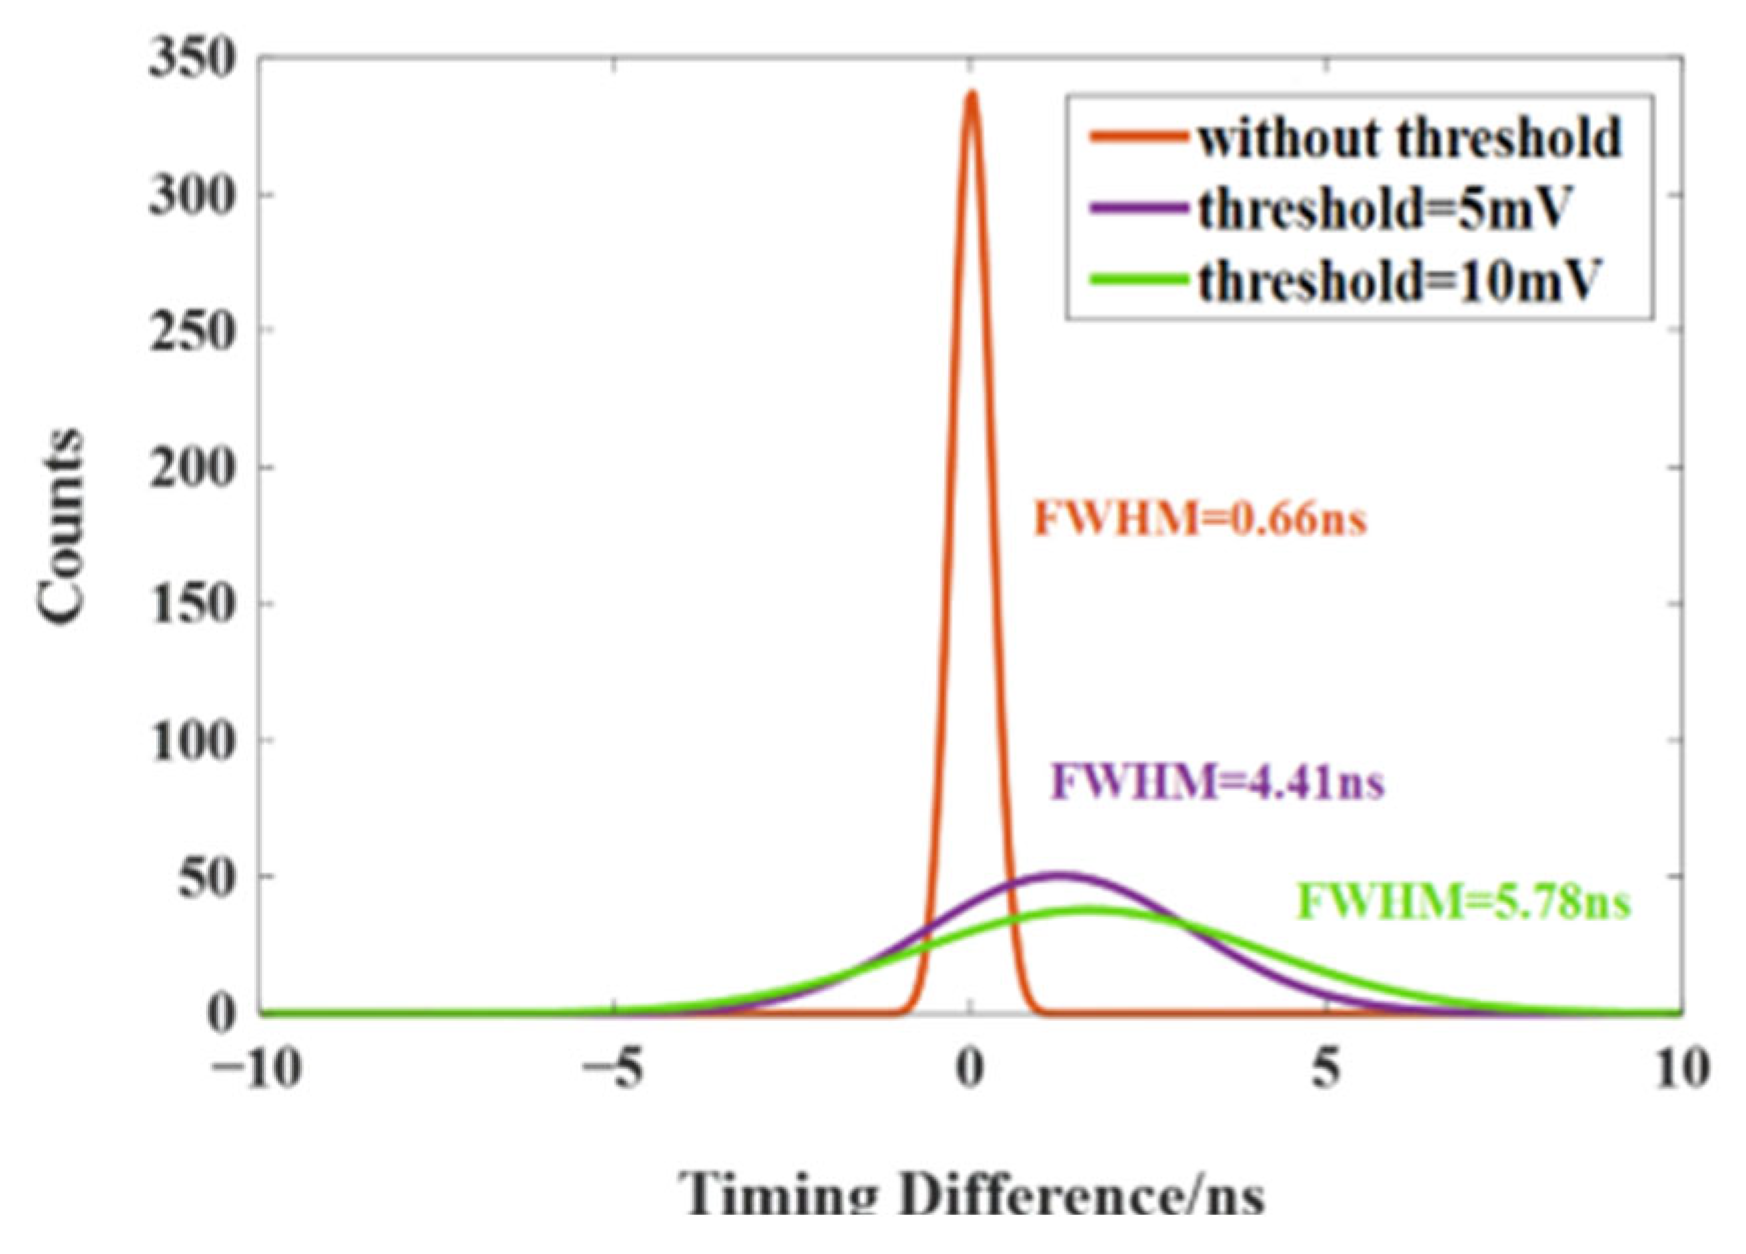
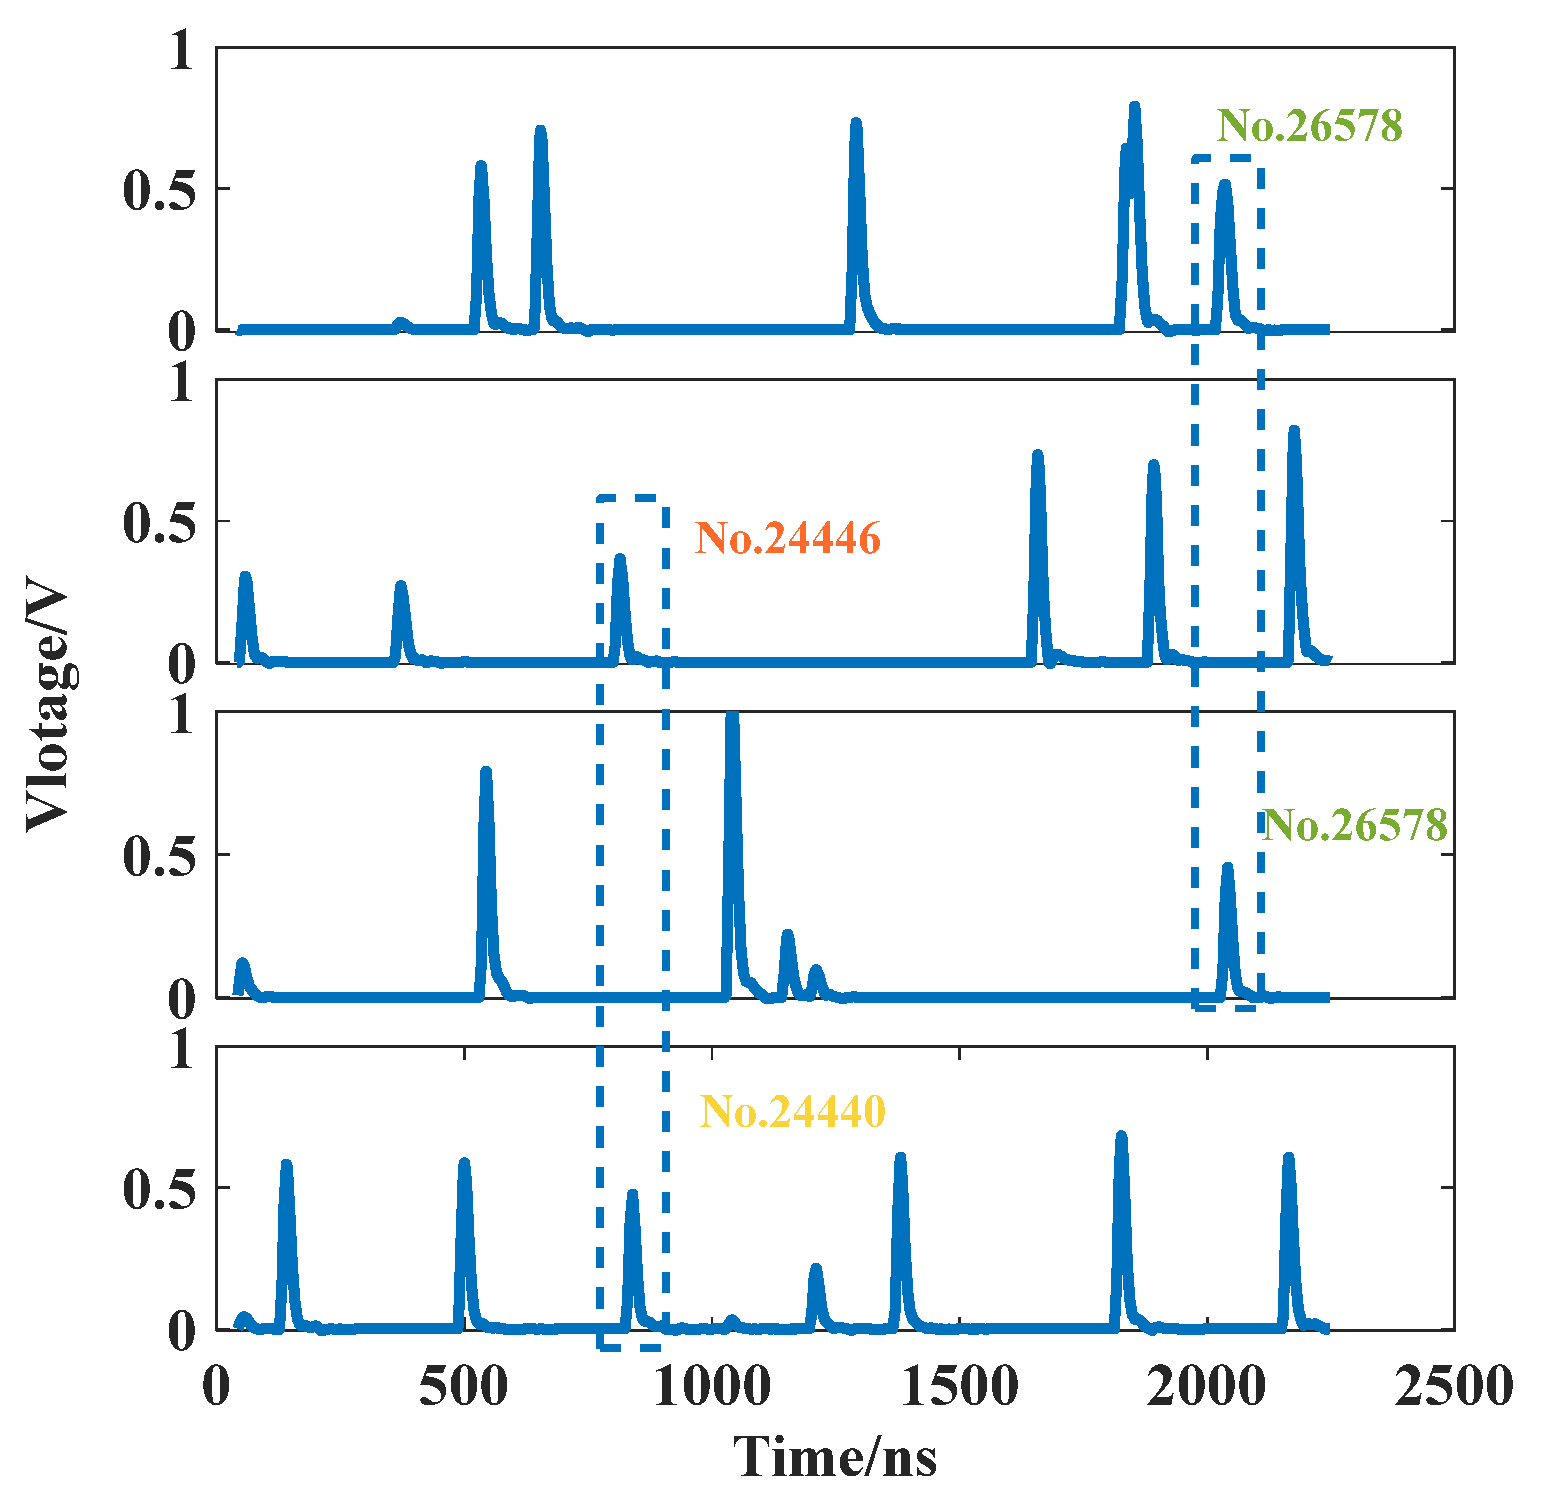
3.2.3. Time
4. Intercrystal Scattering Rejection Algorithm
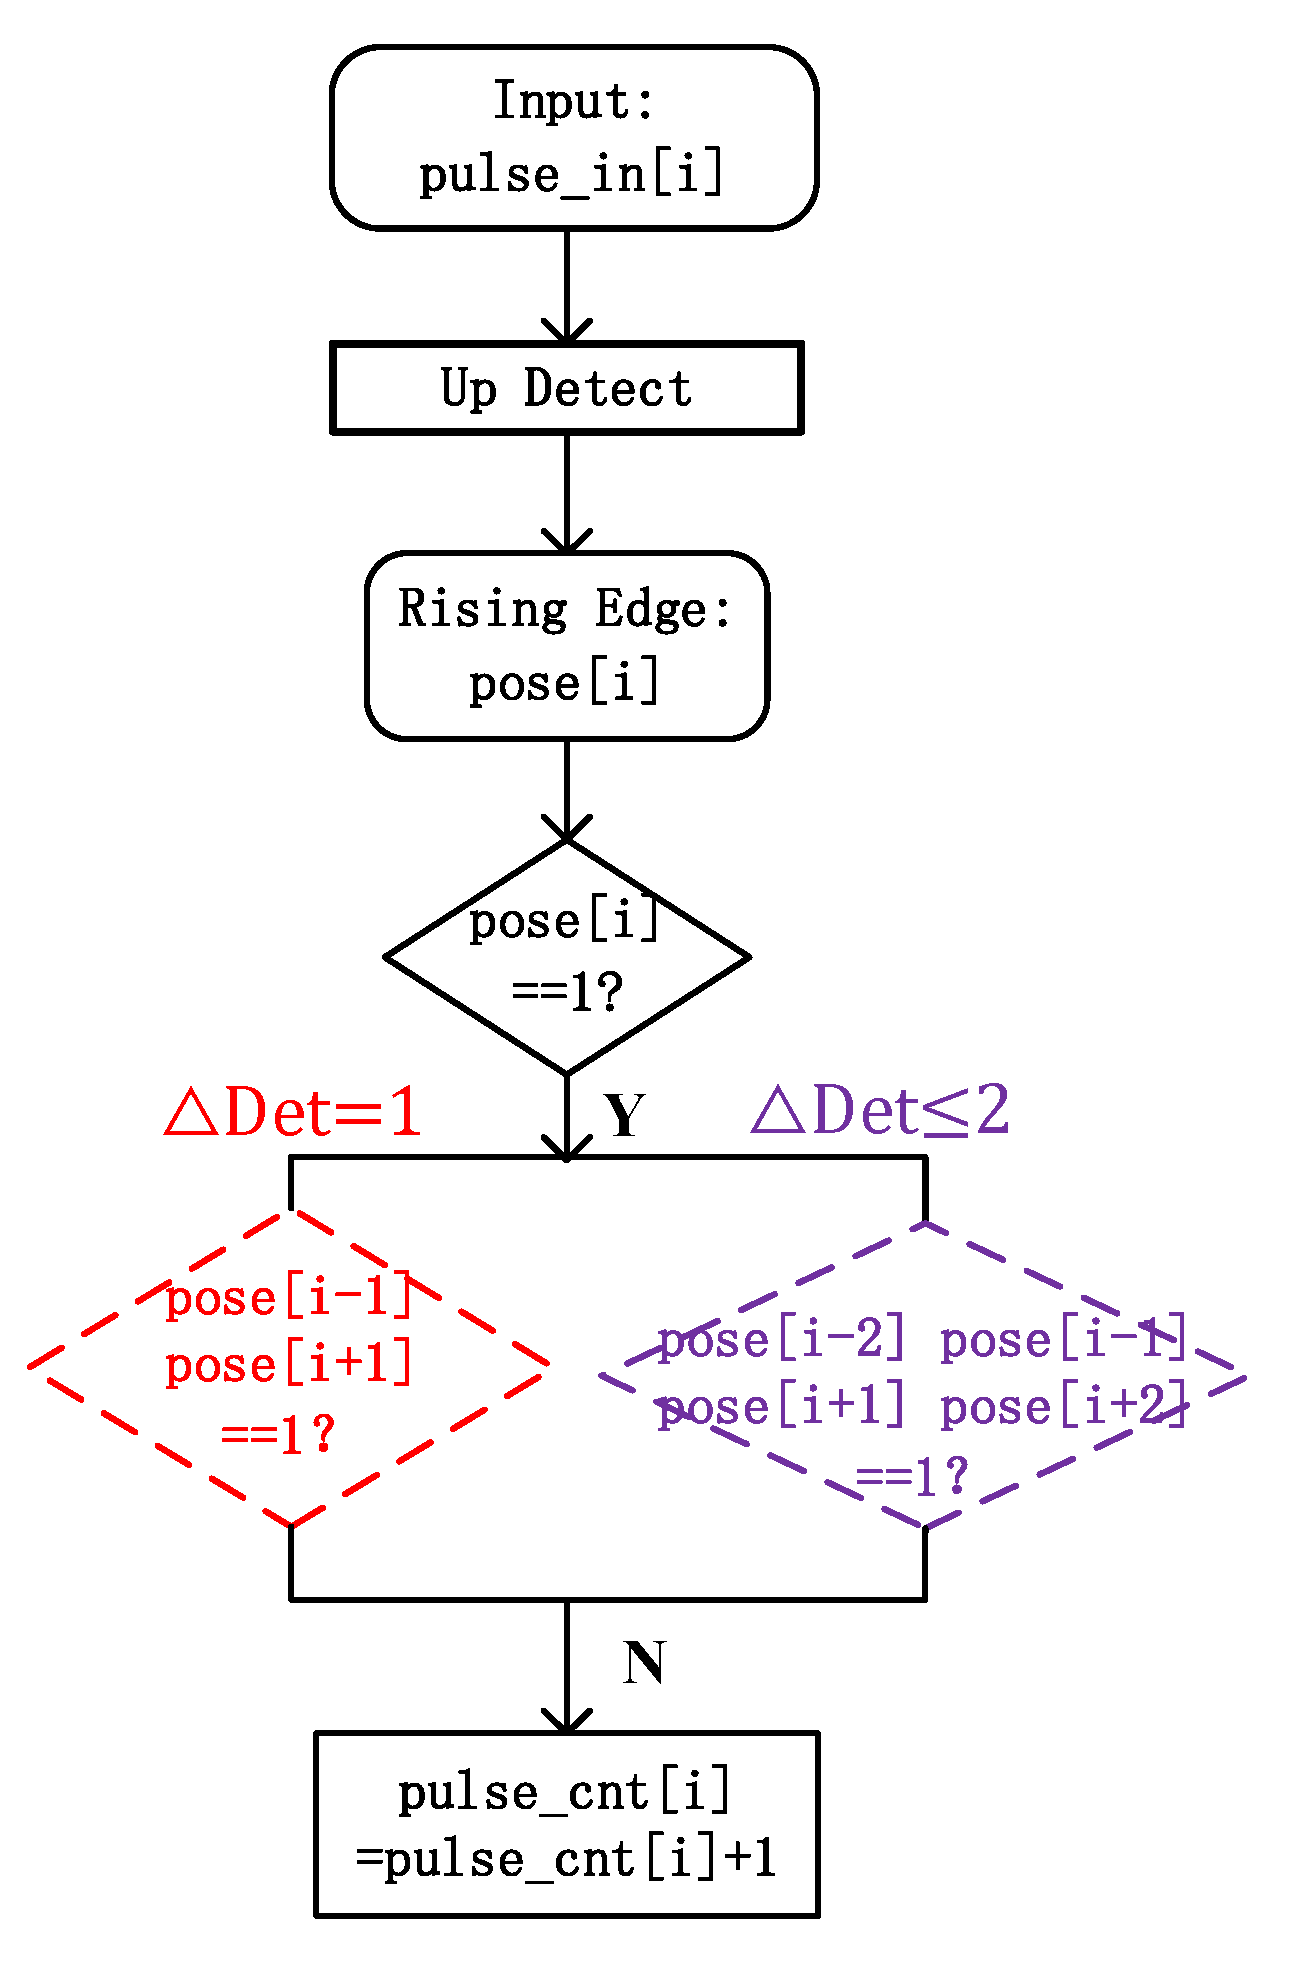
4.1. Determination of Time Window
4.2. Selection of Detector Window
4.3. Realization on FPGA Chip
5. Imaging Performance Validation Results
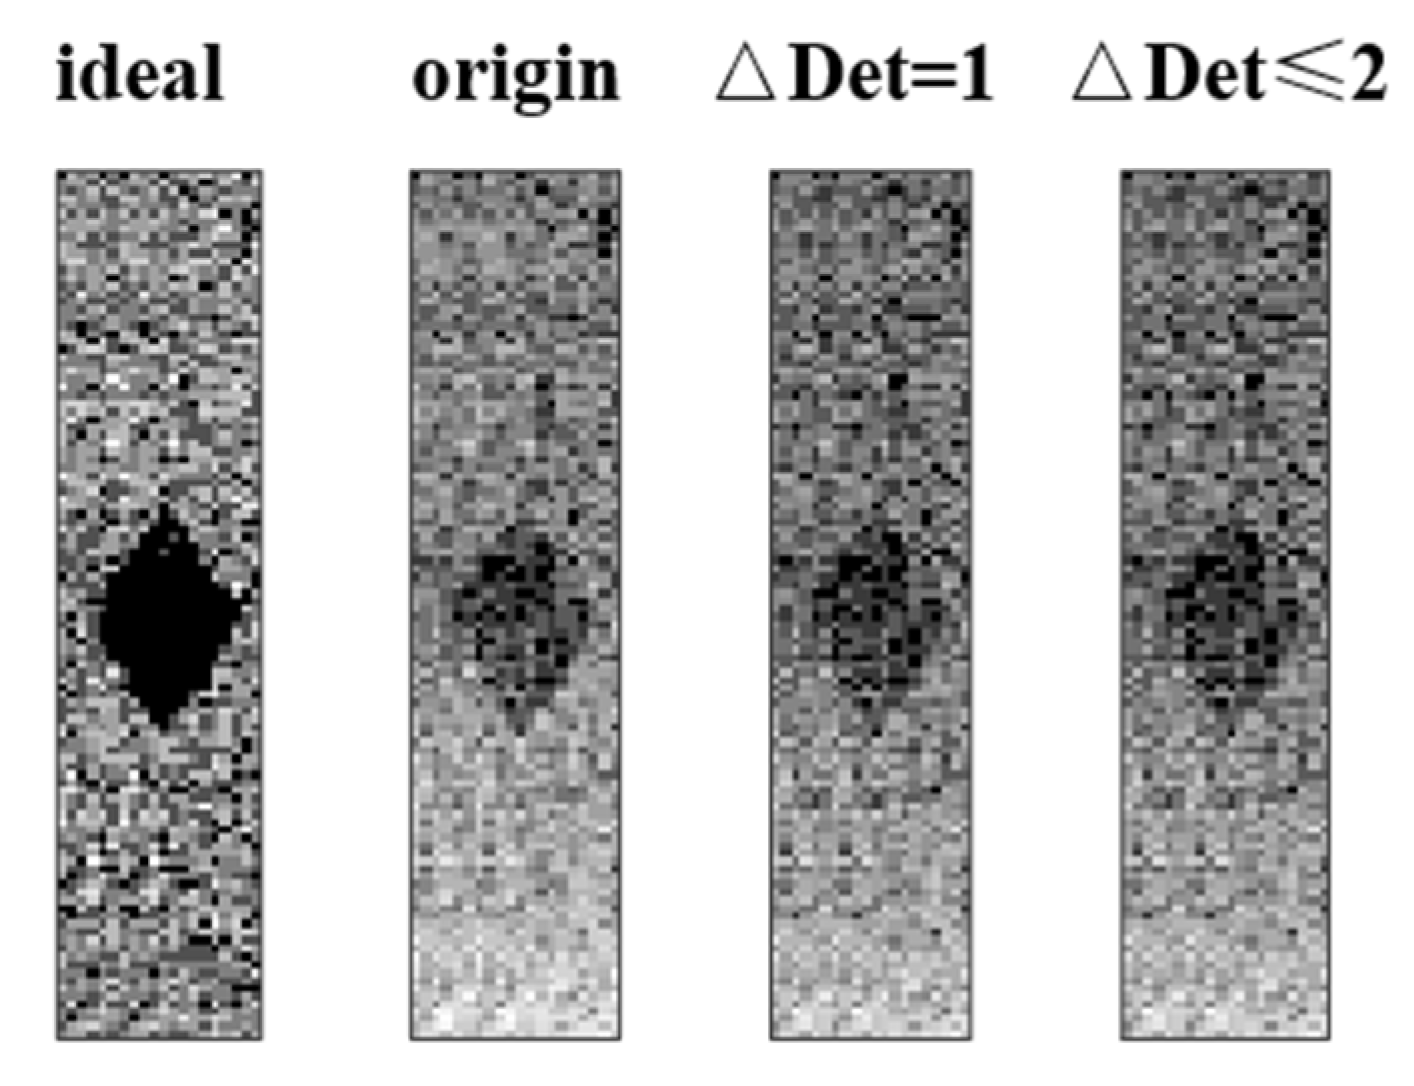
5.1. Simulation Validation Results
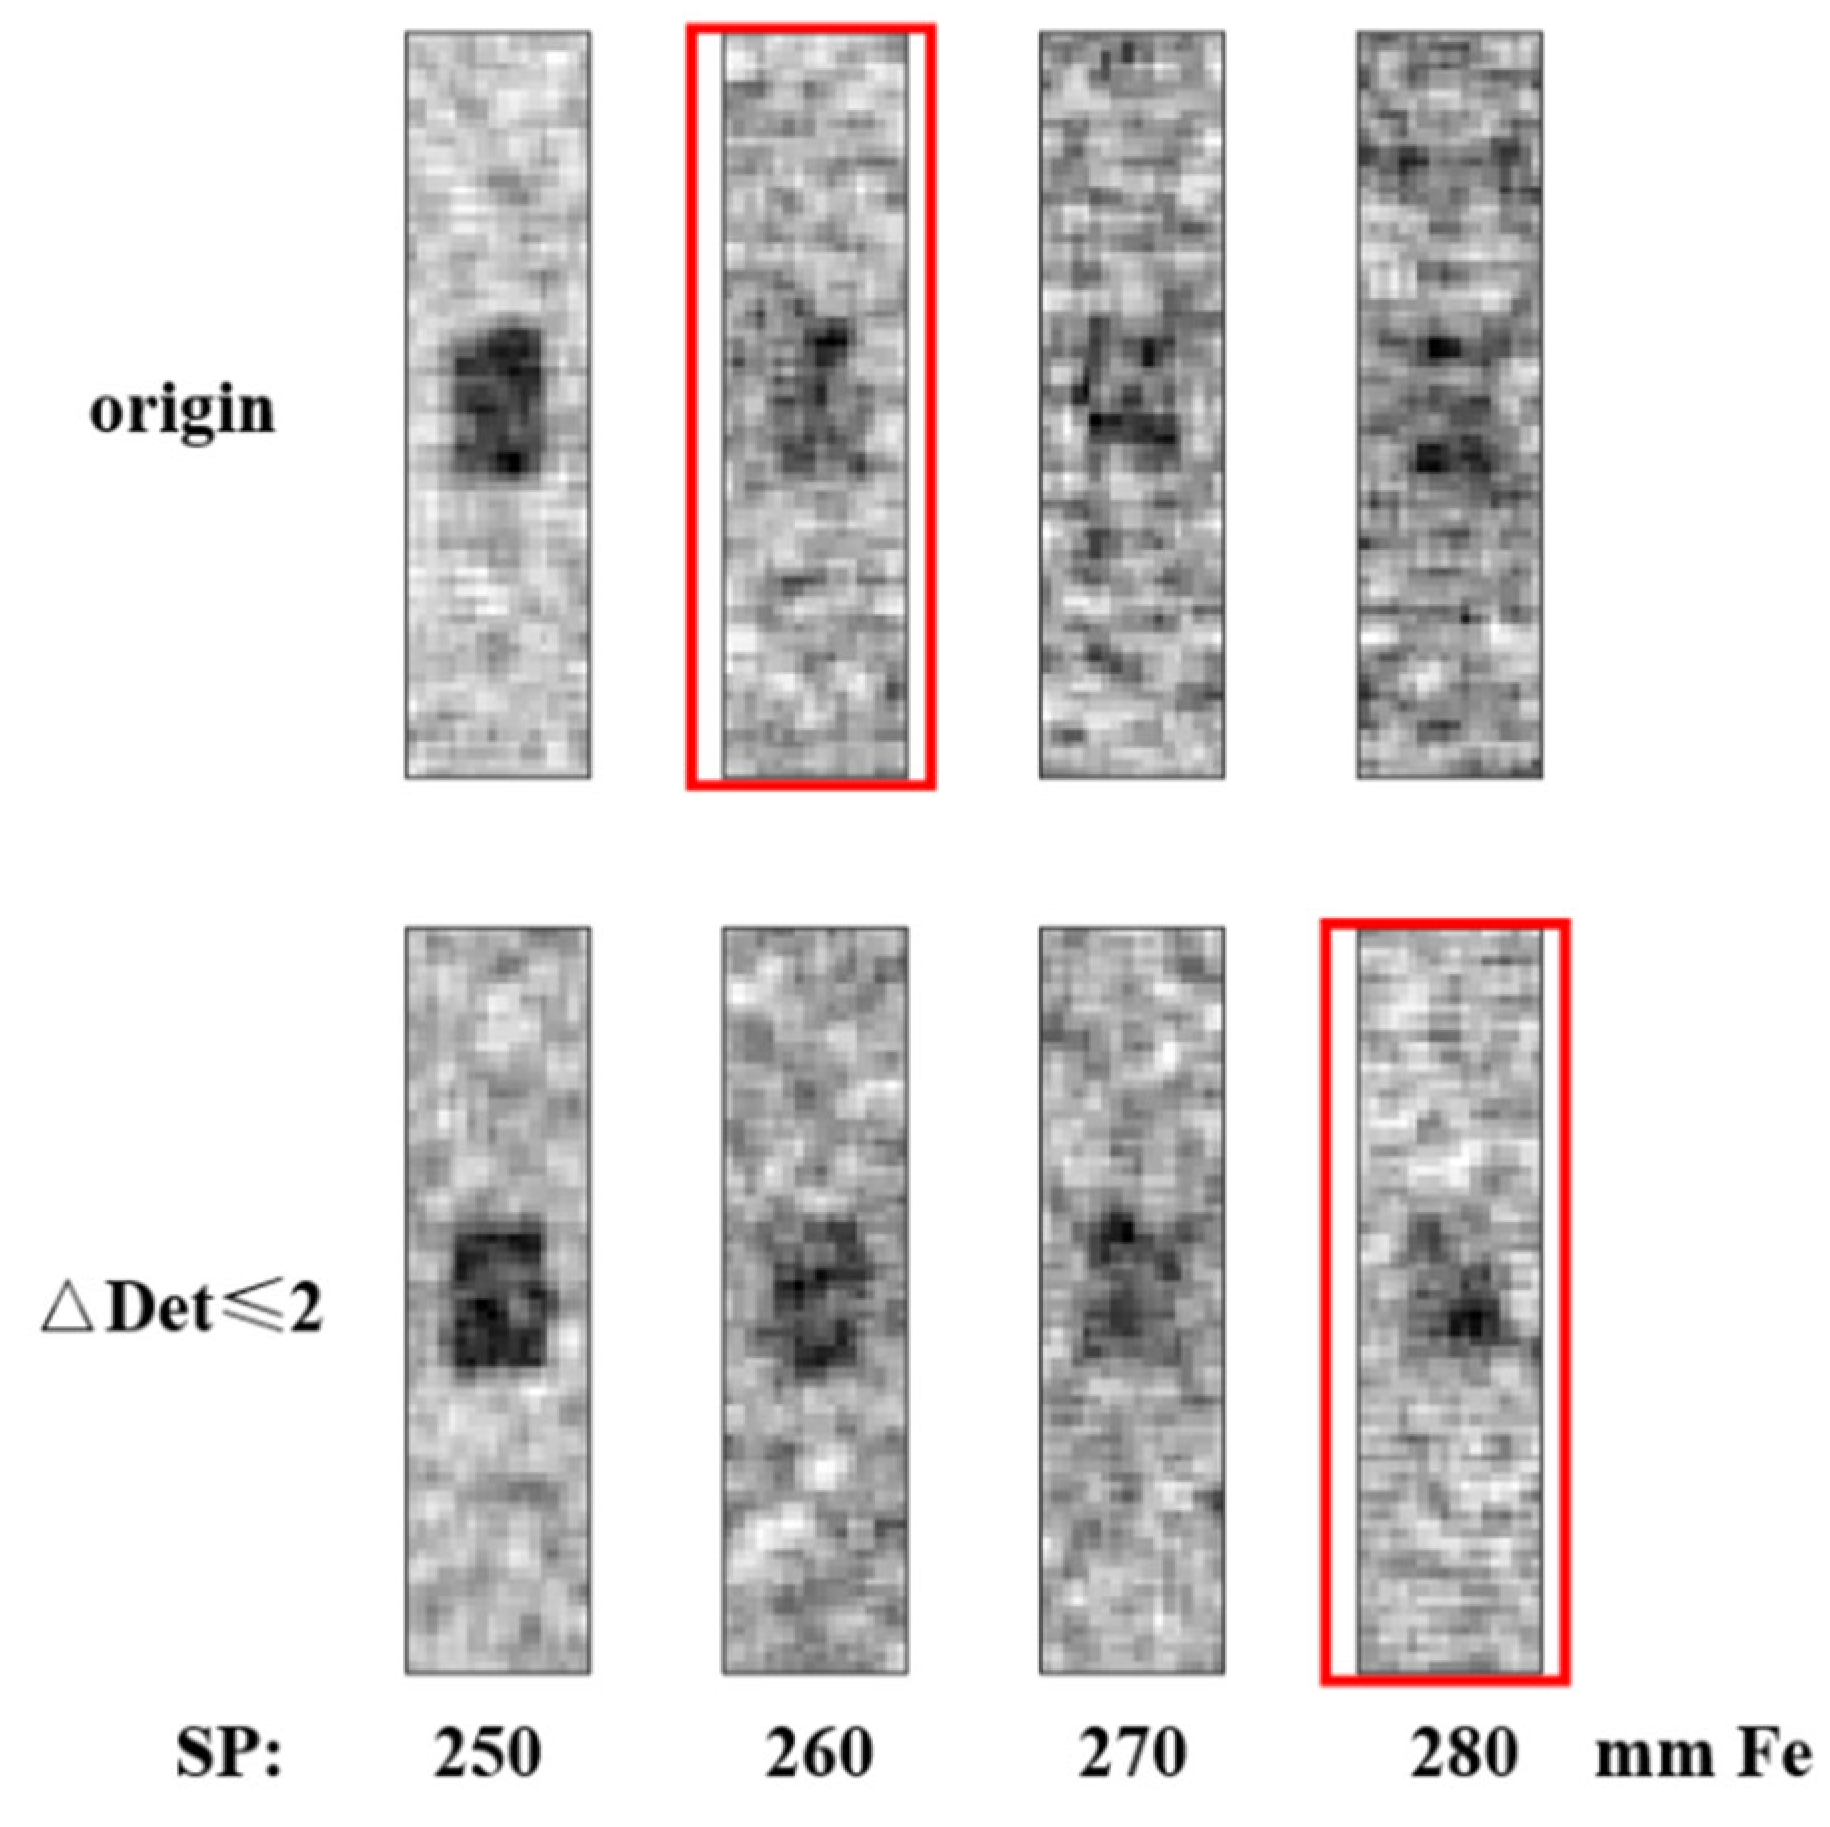
5.2. Actual Test Results
6. Conclusions
Author Contributions
Funding
Institutional Review Board Statement
Informed Consent Statement
Data Availability Statement
Conflicts of Interest
References
- Kreisler, B. Photon Counting Detectors: Concept, Technical Challenges, and Clinical Outlook. Eur. J. Radiol. 2022, 149, 110229. [Google Scholar] [CrossRef] [PubMed]
- Greffier, J.; Viry, A.; Robert, A.; Khorsi, M.; Si-Mohamed, S. Photon-Counting CT Systems: A Technical Review of Current Clinical Possibilities. Diagn. Interv. Imaging 2025, 106, 53–59. [Google Scholar] [CrossRef] [PubMed]
- Zhou, Y.; Fei, C.; Uddin, M.A.; Zhao, L.; Ni, Z.; Huang, J. Self-Powered Perovskite Photon-Counting Detectors. Nature 2023, 616, 712–718. [Google Scholar] [CrossRef] [PubMed]
- Trigila, C.; Kratochwil, N.; Mehadji, B.; Ariño-Estrada, G.; Roncali, E. Intercrystal Optical Crosstalk in Radiation Detectors: Monte Carlo Modeling and Experimental Validation. IEEE Trans. Radiat. Plasma Med. Sci. 2024, 8, 734–742. [Google Scholar] [CrossRef]
- Bentourkia, M.; Msaki, P.; Cadorette, J.; Lecomte, R. Object and Detector Scatter-Function Dependence on Energy and Position in High Resolution PET. IEEE Trans. Nucl. Sci. 1995, 42, 1162–1167. [Google Scholar] [CrossRef]
- Levin, C.S.; Tornai, M.P.; Cherry, S.R.; MacDonald, L.R.; Hoffman, E.J. Compton Scatter and X-Ray Crosstalk and the Use of Very Thin Intercrystal Septa in High-Resolution PET Detectors. IEEE Trans. Nucl. Sci. 1997, 44, 218–224. [Google Scholar] [CrossRef]
- Gu, Z.; Prout, D.L.; Silverman, R.W.; Herman, H.; Dooraghi, A.; Chatziioannou, A.F. A DOI Detector with Crystal Scatter Identification Capability for High Sensitivity and High Spatial Resolution PET Imaging. IEEE Trans. Nucl. Sci. 2015, 62, 740–747. [Google Scholar] [CrossRef]
- Degenhardt, C.; Fiedler, K.; Frach, T.; Rutten, W.; Solf, T.; Thon, A. Impact of Intercrystal Crosstalk on Depth-of-Interaction Information in PET Detectors. IEEE Trans. Nucl. Sci. 2007, 54, 427–432. [Google Scholar] [CrossRef]
- Stickel, J.R.; Cherry, S.R. High-Resolution PET Detector Design: Modelling Components of Intrinsic Spatial Resolution. Phys. Med. Biol. 2004, 50, 179. [Google Scholar] [CrossRef]
- Rafecas, M.; Böning, G.; Pichler, B.J.; Lorenz, E.; Schwaiger, M.; Ziegler, S.I. Inter-Crystal Scatter in a Dual Layer, High Resolution LSO-APD Positron Emission Tomograph. Phys. Med. Biol. 2003, 48, 821–848. [Google Scholar] [CrossRef]
- Vaska, P.; Stoll, S.P.; Woody, C.L.; Schlyer, D.J.; Shokouhi, S. Effects of Intercrystal Crosstalk on Multielement LSO/APD PET Detectors. IEEE Trans. Nucl. Sci. 2003, 50, 362–366. [Google Scholar] [CrossRef]
- Zeraatkar, N.; Ay, M.R.; Sarkar, S.; Geramifar, P.; Rahmim, A. Quantitative Investigation of Inter-Crystal Scatter and Penetration in the GE Discovery RX PET/CT Scanner Using Monte Carlo Simulations. In Proceedings of the IEEE Nuclear Science Symposium & Medical Imaging Conference, Knoxville, TN, USA, 30 October–6 November 2010; pp. 2403–2408. [Google Scholar]
- Kang, H.G.; Nishikido, F.; Yamaya, T. A Staggered 3-Layer DOI PET Detector Using BaSO4 Reflector for Enhanced Crystal Identification and Inter-Crystal Scattering Event Discrimination Capability. Biomed. Phys. Eng. Express 2021, 7, 035018. [Google Scholar] [CrossRef] [PubMed]
- Teimoorisichani, M.; Goertzen, A.L. A Study of Inter-Crystal Scatter in Dual-Layer Offset Scintillator Arrays for Brain-Dedicated PET Scanners. Phys. Med. Biol. 2019, 64, 115007. [Google Scholar] [CrossRef]
- Park, S.-J.; Rogers, W.L.; Clinthorne, N.H. Effect of Intercrystal Compton Scatter on Efficiency and Image Noise in Small Animal PET Module. In Proceedings of the 2003 IEEE Nuclear Science Symposium. Conference Record, Portland, OR, USA, 19–25 October 2003; Volume 4, pp. 2272–2277. [Google Scholar]
- Rafecas, M.; Boning, G.; Pichler, B.J.; Lorenz, E.; Schwaiger, M.; Ziegler, S.I. Characterization and Processing of Inter-Crystal Scatter in a Dual Layer, High Resolution LSO-APD-PET. In Proceedings of the 2001 IEEE Nuclear Science Symposium Conference Record (Cat. No.01CH37310), San Diego, CA, USA, 4–10 November 2001; Volume 2, pp. 1128–1132. [Google Scholar]
- Xu, H.; Lenz, M.; Caldeira, L.; Ma, B.; Pietrzyk, U.; Lerche, C.; Shah, N.J.; Scheins, J. Resolution Modeling in Projection Space Using a Factorized Multi-Block Detector Response Function for PET Image Reconstruction. Phys. Med. Biol. 2019, 64, 145012. [Google Scholar] [CrossRef]
- Gross-Weege, N.; Schug, D.; Hallen, P.; Schulz, V. Maximum Likelihood Positioning Algorithm for High-Resolution PET Scanners. Med. Phys. 2016, 43, 3049–3061. [Google Scholar] [CrossRef]
- Yoshida, E.; Obata, F.; Yamaya, T. Optical Crosstalk of Protective Cover on MPPC Array for TOF PET Detector. Phys. Med. Biol. 2024, 69, 125012. [Google Scholar] [CrossRef]
- Dong, T.; Zhang, H.; Wu, Z. Physical Design of Photon-Counting Mode γ-Ray Large Object Radiation Imaging System. J. X-ray Sci. Technol. 2022, 30, 789–804. [Google Scholar] [CrossRef]
- Yi, Y.; Guan, X.; Song, Z.; Tan, X.; Gao, S.; Han, H.; Lu, Y.; Li, G.; Zhang, K.; Liu, J. High-Dose Rate Detection System for Gamma and X Radiation Using Scattered Gamma Rays. Radiat. Meas. 2023, 162, 106912. [Google Scholar] [CrossRef]
- Ni, M.; Li, G.; Wang, Z. Study on Scattering Correction of the 60Co Gantry-Movable Dual-Projection Digital Radiography Inspection System. In Proceedings of the 2020 International Conference on Nuclear Engineering collocated with the ASME 2020 Power Conference, Virtual, 4–5 August 2020. [Google Scholar]
- Thien, T.C.; Nemallapudi, M.V. Determination of Lutetium Density in LYSO Crystals: Methodology and PET Detector Applications. Phys. Med. Biol. 2024, 69, 075024. [Google Scholar] [CrossRef]
- Allison, J.; Amako, K.; Apostolakis, J.; Arce, P.; Asai, M.; Aso, T.; Bagli, E.; Bagulya, A.; Banerjee, S.; Barrand, G.; et al. Recent Developments in GEANT4. Nucl. Instrum. Methods Phys. Res. A 2016, 835, 186–225. [Google Scholar] [CrossRef]
- Zhang, H.; Sun, Y.; Chen, Z.; Wu, Z. Design of a Nanosecond Voltage Comparator with PECL Logic for a Photon-Counting Radiation Imaging System Application. Sci. Technol. Nucl. Install. 2023, 2023, 6810882. [Google Scholar] [CrossRef]
- An, J.; Wu, Z.; Zhou, L.; Liu, Y.; Xiang, X.; Wang, L.; Wu, H. Isotope Radiography for Container Inspection. In Isotope Production and Applications in the 21st Century; World Scientific: Singapore, Singapore, 2000; pp. 150–152. ISBN 978-981-02-4200-8. [Google Scholar]
- Dennison, M.; Seavers, C.; Chu, T.; Kenderian, S.; Adams, P.M.; Gregorian, A. Image Quality Indicator Localization Using Mask R-CNN. Mater. Eval. 2025, 83, 32–42. [Google Scholar] [CrossRef]
- David Hsu, F.C.; David Freese, L.; Derek Innes, R.; Craig Levin, S. Intercrystal Scatter Studies for a Clinical PET System with 1mm3 Resolution 3D Position Sensitive Scintillation Detectors. In Proceedings of the 2017 IEEE Nuclear Science Symposium and Medical Imaging Conference (NSS/MIC), Atlanta, GA, USA, 21–28 October 2017; pp. 1–3. [Google Scholar]


| Energy | μph:μc 1 |
|---|---|
| 500 keV | 1:2.14 |
| 1 MeV | 1:6.97 |
| 1.25 MeV | 1:9.59 |
| Source Intensity N0 | No-Load Count Rate/Unit N | P (n ≥ 2) | |||
|---|---|---|---|---|---|
| t = 2 ns | t = 5 ns | t = 7 ns | t = 10 ns | ||
| 30 Ci | 3.44 × 10⁵/s | 0% | 0% | 0% | 0.01% |
| 50 Ci | 5.73 × 10⁵/s | 0% | 0% | 0.01% | 0.01% |
| 100 Ci | 1.15 × 10⁶/s | 0% | 0.01% | 0.03% | 0.06% |
| 300 Ci | 3.44 × 10⁶/s | 0.02% | 0.13% | 0.25% | 0.50% |
| Ideal | Origin | ΔDet = 1 | ΔDet ≤ 2 | |
|---|---|---|---|---|
| RMSE | / | 4.328 | 3.322 | 3.273 |
| Interference Removed % | 100% | / | 24.09% | 25.46% |
| Non-interference Misremoved % | 0 | / | 14.38% | 15.70% |
Disclaimer/Publisher’s Note: The statements, opinions and data contained in all publications are solely those of the individual author(s) and contributor(s) and not of MDPI and/or the editor(s). MDPI and/or the editor(s) disclaim responsibility for any injury to people or property resulting from any ideas, methods, instructions or products referred to in the content. |
© 2025 by the authors. Licensee MDPI, Basel, Switzerland. This article is an open access article distributed under the terms and conditions of the Creative Commons Attribution (CC BY) license (https://creativecommons.org/licenses/by/4.0/).
Share and Cite
Chang, J.; Zhang, H.; Jiang, S.; Wu, Z.; Xu, S. Studies and Rejection of Intercrystal Crosstalk on FPGA in a High-Energy Photon-Counting System. Appl. Sci. 2025, 15, 6050. https://doi.org/10.3390/app15116050
Chang J, Zhang H, Jiang S, Wu Z, Xu S. Studies and Rejection of Intercrystal Crosstalk on FPGA in a High-Energy Photon-Counting System. Applied Sciences. 2025; 15(11):6050. https://doi.org/10.3390/app15116050
Chicago/Turabian StyleChang, Jiahao, Huaxia Zhang, Shibo Jiang, Zhifang Wu, and Shuo Xu. 2025. "Studies and Rejection of Intercrystal Crosstalk on FPGA in a High-Energy Photon-Counting System" Applied Sciences 15, no. 11: 6050. https://doi.org/10.3390/app15116050
APA StyleChang, J., Zhang, H., Jiang, S., Wu, Z., & Xu, S. (2025). Studies and Rejection of Intercrystal Crosstalk on FPGA in a High-Energy Photon-Counting System. Applied Sciences, 15(11), 6050. https://doi.org/10.3390/app15116050