Article

The Relationship Between Age and the Propofol Dose for Anesthesia Induction: A Single-Center Retrospective Study Utilizing Neural Network Model Simulation

1
Department of Anesthesiology, KKR Sapporo Medical Center, Sapporo 062-0931, Japan
2
Department of Diagnostic Imaging, Faculty of Medicine, Hokkaido University, Sapporo 060-8638, Japan
3
Department of Nuclear Medicine, Hokkaido University Hospital, Sapporo 060-8638, Japan
4
Division of Medical AI Education and Research, Faculty of Medicine, Hokkaido University, Sapporo 062-0931, Japan
5
Department of Anesthesiology, Hokkaido University Hospital, Sapporo 060-8638, Japan
*
Author to whom correspondence should be addressed.
Appl. Sci. 2025, 15(11), 6052; https://doi.org/10.3390/app15116052
Submission received: 27 April 2025 / Revised: 22 May 2025 / Accepted: 26 May 2025 / Published: 28 May 2025
(This article belongs to the Special Issue Artificial Intelligence (AI) Technologies in Biomedicine)

Abstract

Propofol is commonly used for anesthetic induction, but its dose-dependent hypotensive effect remains a concern. Although the required dose for loss of consciousness decreases with age, the optimal induction dose in older individuals is not well established. This retrospective study aimed to construct a neural network model to predict the propofol induction dose and to quantify the relationship between age and the propofol induction dose through model-based simulations. We analyzed data from 405 patients who underwent elective non-cardiac surgery. A multilayer perceptron model (“model N”) was developed to predict the required induction dose based on clinical parameters. Its predictive performance was compared with that of “model P”, a previously published regression equation derived from multivariable analysis, using the RMSE and MAE. Model N showed significantly better accuracy than model P (RMSE: 17.6 vs. 25.8; MAE: 13.0 vs. 16.7; p < 0.001). Simulation utilizing model N revealed that the induction dose of propofol per body weight decreased by approximately 0.1 mg/kg for every 10-year increase in age. These findings suggest that our proposed model may help determine more accurate and safer dosing strategies for elderly patients undergoing general anesthesia.

1. Introduction

Propofol is a widely utilized agent for anesthetic induction owing to its rapid onset and smooth recovery profile, making it a cornerstone of modern anesthesia practice (Figure 1) [1]. Propofol causes central nervous system depression by enhancing inhibition via GABAA receptors, resulting in sedation, hypnosis, and anesthesia [2]. However, its dose-dependent adverse effect of hypotension remains a significant concern, especially in vulnerable populations, such as older individuals and those with heart disease [3,4]. Intraoperative hypotension has been linked to severe complications, such as postoperative stroke, acute kidney injury, myocardial injury after non-cardiac surgery, and increased 30-day mortality [5,6,7]. Therefore, it is crucial to determine the correct propofol dose for anesthetic induction, and to mitigate this issue, dose adjustments must be made by thoroughly considering the individual patient’s risks.
Older patients require lower propofol doses for anesthesia induction [8]. They are also more prone to dose-dependent hypotension, because propofol administration can cause a decrease in systemic vascular resistance due to arterial dilation, making age-adjusted dose adjustments crucial [9,10]. For example, a study comparing young adults aged 25–39 years with older adults aged 66–80 years found that the induction dose, the dose needed to initiate anesthesia, was approximately 2.2 mg/kg for young adults and 1.7 mg/kg for older individuals [11].
A formula employing structural equation modeling has been proposed for predicting the propofol induction dose, where the prediction equation for model P was defined as follows: propofol dose (mg) = [2.374 − 0.0113 × age (years) − 0.0788 (if ASA-PS 3 or 4) + 0.057 (if female) + 0.1087 × fentanyl dose (μg/kg)] × body weight (kg) [12]. However, there are no studies utilizing neural networks. Considering the possibility that the relationship between the propofol dose and age may be nonlinear, a neural network model, as one type of machine learning model, was developed to predict propofol induction doses and its performance was evaluated.
Utilizing this novel model, we simulated the predicted propofol dose for all the analyzed cases, setting the patient age to a hypothetical value of 20 years and repeating the simulation at 10-year increments up to 90 years. The simulation of the age-related changes in the propofol induction doses provided valuable insights into appropriate age-adjusted dosing strategies. Traditionally, the dose of anesthetic drugs was determined empirically based on patient factors such as age, weight, and medical history, including ischemic heart disease [12]. However, through this quantification via simulation, anesthesiologists can adjust the propofol dose swiftly and objectively based on the patient’s age. The insights gained from this study may help reduce the risk of adverse effects due to over- or under-dosing, such as hypertension or pain caused by insufficient dosing, and hypotension or bradycardia caused by excessive dosing, thereby contributing to improved patient safety.
This article is a revised and expanded version of a paper titled “Quantification of the Relationship between Aging and Propofol Induction Dose Using Neural Network Model Simulation: A Single-Center Retrospective Observational Study”, which was presented in Japanese at the 71st Annual Meeting of the Japanese Society of Anesthesiologists, Kobe Portopia Hotel, Kobe, Japan, 6–8 June 2024 [13]. More than 50% of the content in this manuscript is newly added, including detailed discussions and expanded analyses that were not part of the original presentation.

2. Materials and Methods

2.1. Patient Population and Ethics

Among the patients who underwent scheduled non-cardiac surgery at KKR Sapporo Medical Center between November 2022 and May 2023, the inclusion criteria comprised individuals aged 18 years or older, men or non-pregnant women who received general anesthesia, endotracheal intubation, anesthesia induction with propofol bolus injection, and no continuous administration of vasopressors during induction.

2.2. Clinical Data

All the data were obtained from computerized anesthesia records (Nihon Kohden Corporation, Tokyo, Japan). The patient monitoring system and anesthesia machine data were automatically recorded in the anesthesia record and the drug doses were manually registered. No patients received preanesthetic medication. In the operating room, patients were placed on the operating table in the supine position. Baseline data, including electrocardiogram, noninvasive blood pressure, and pulse oximetry, were obtained from the standard monitor recordings.

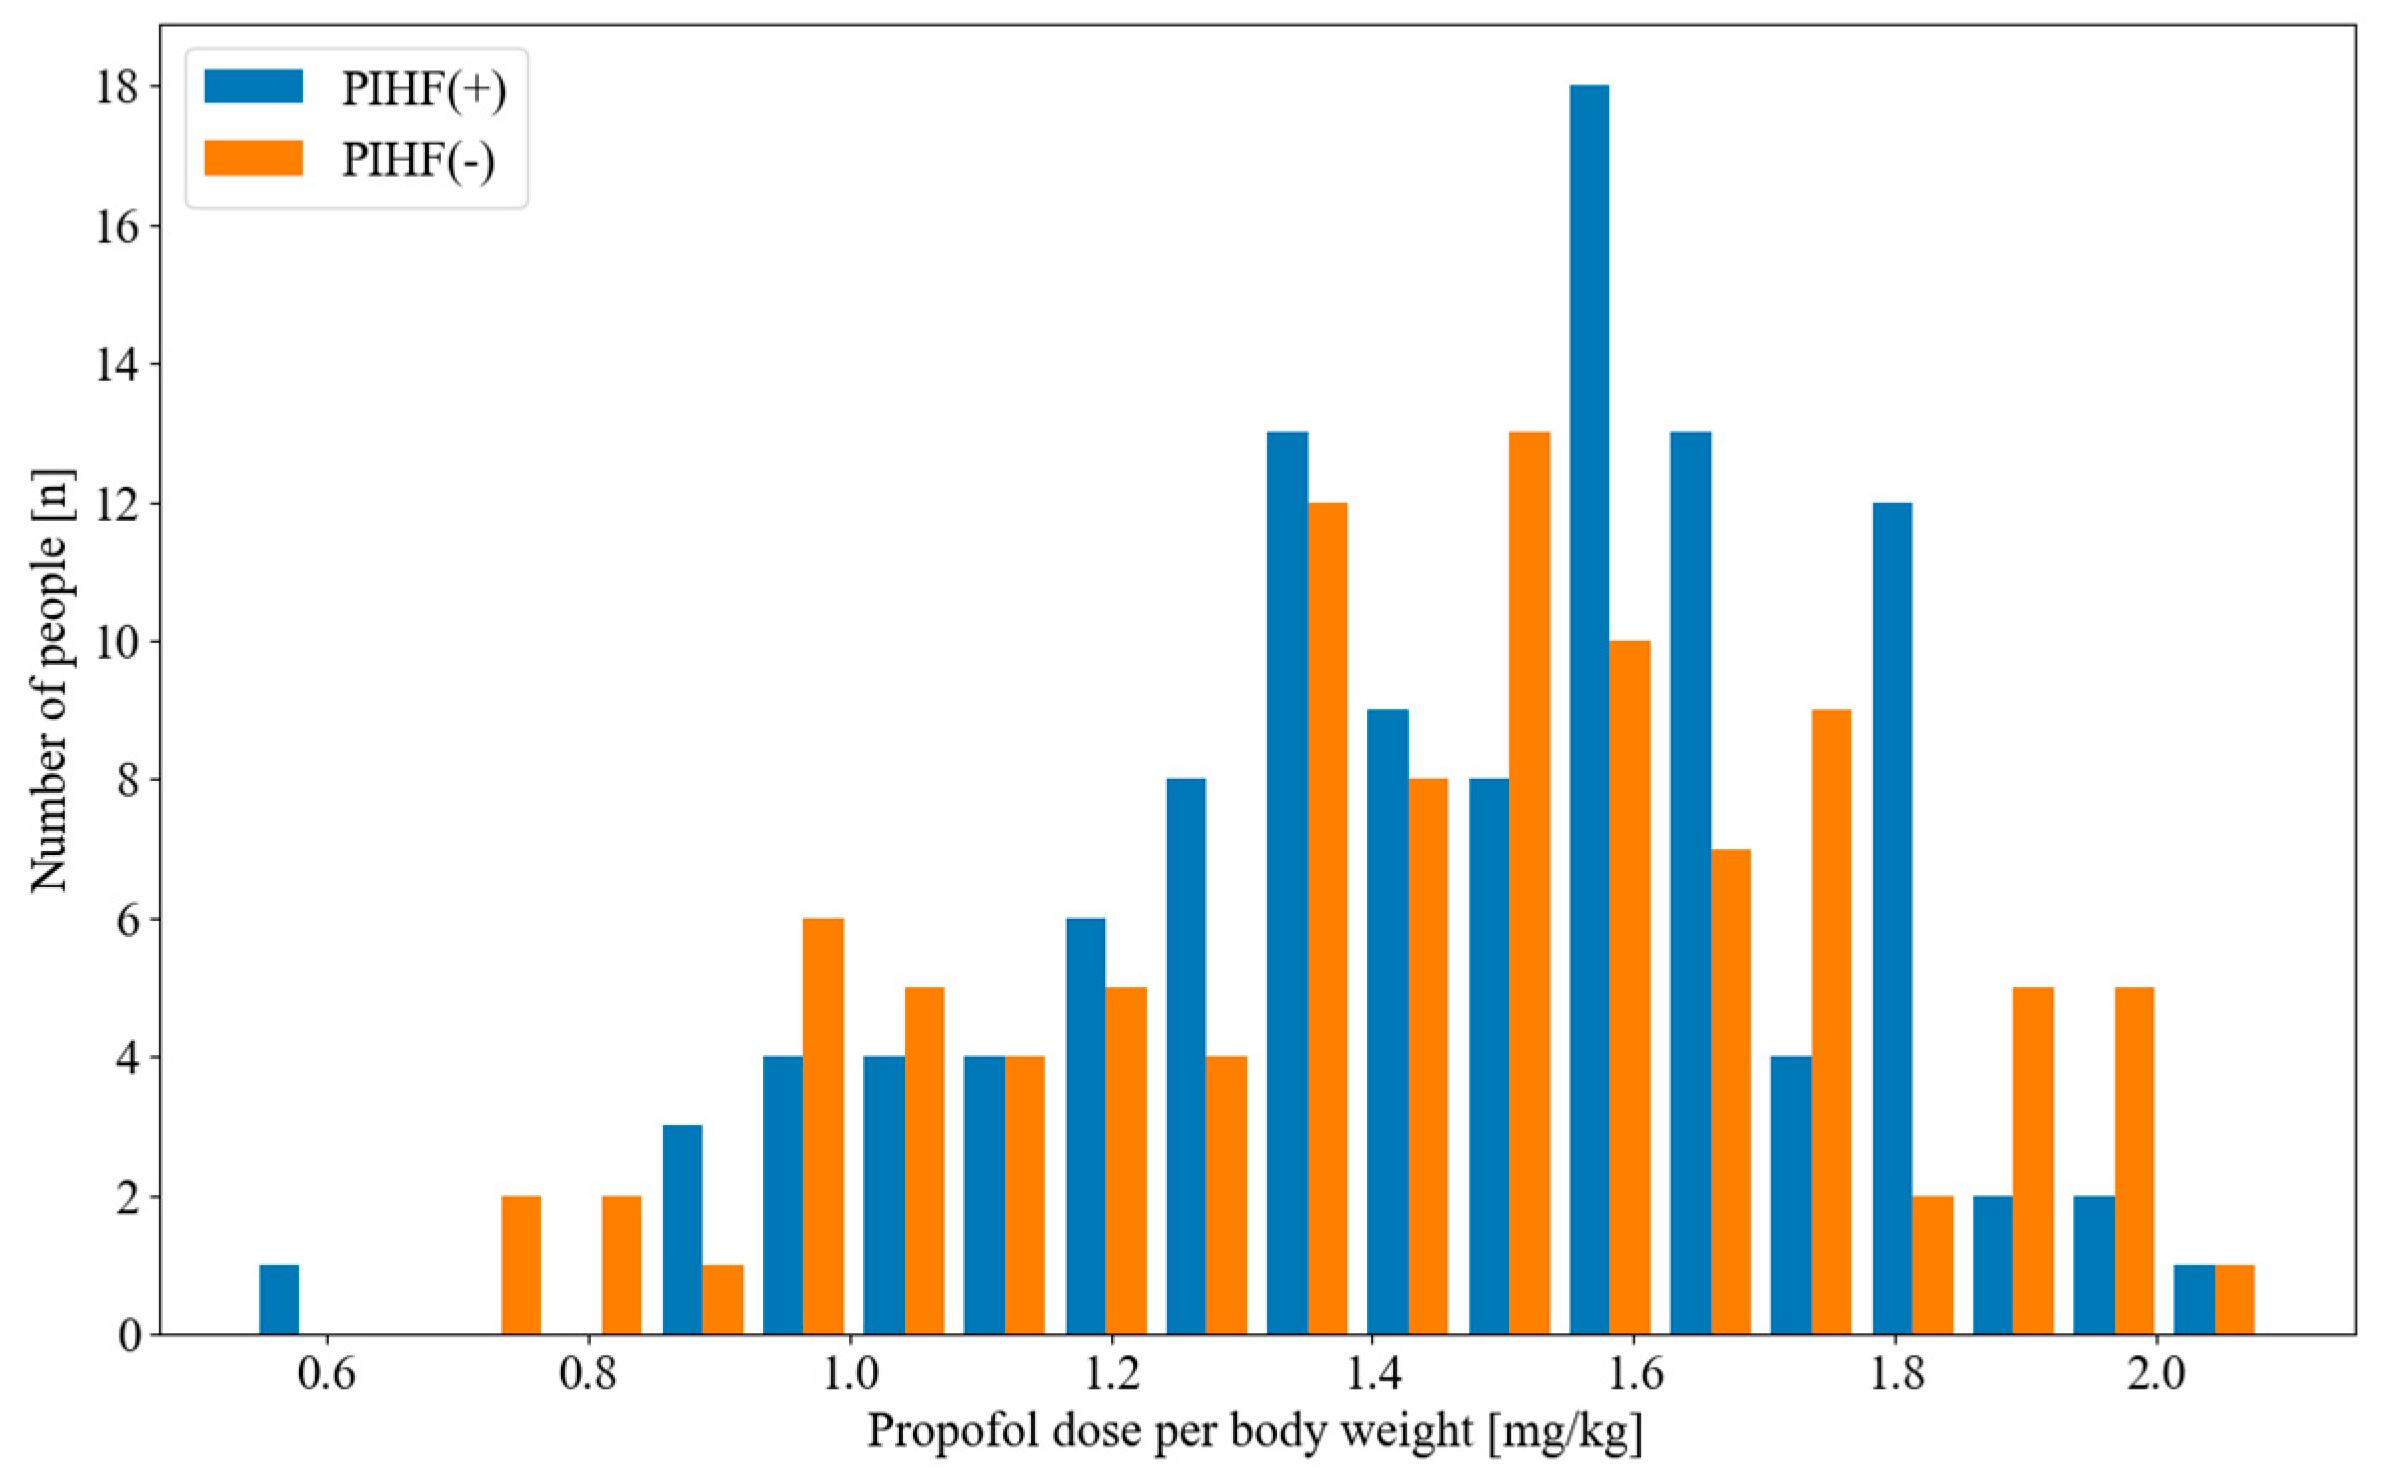
2.3. Propofol Induction Dose and Post-Induction Hemodynamic Fluctuations

Propofol, fentanyl, remifentanil, and rocuronium were used for the induction of general anesthesia. The choice of induction drugs and doses depended on the clinical judgment of the anesthesiologist based on the patient’s medical condition.
The baseline arterial blood pressure in the pre-induction state was defined as the first measurement in the operating room in the awake state. The post-induction blood pressure was measured within 5 min after tracheal intubation. Several definitions of post-induction hemodynamic fluctuations (PIHFs) have been published. Goldman et al. reported that postoperative cardiac death was significantly associated with an intraoperative systolic blood pressure (SBP) drop of at least 33% from baseline lasting at least 10 min [14]. Although some reports used the mean arterial blood pressure (MAP) as the standard [5], our anesthesia records did not document the MAP by noninvasive intermittent arterial tonometry. Therefore, we defined PIHF as an increase or decrease in SBP of 33% or more within 5 min after tracheal intubation.

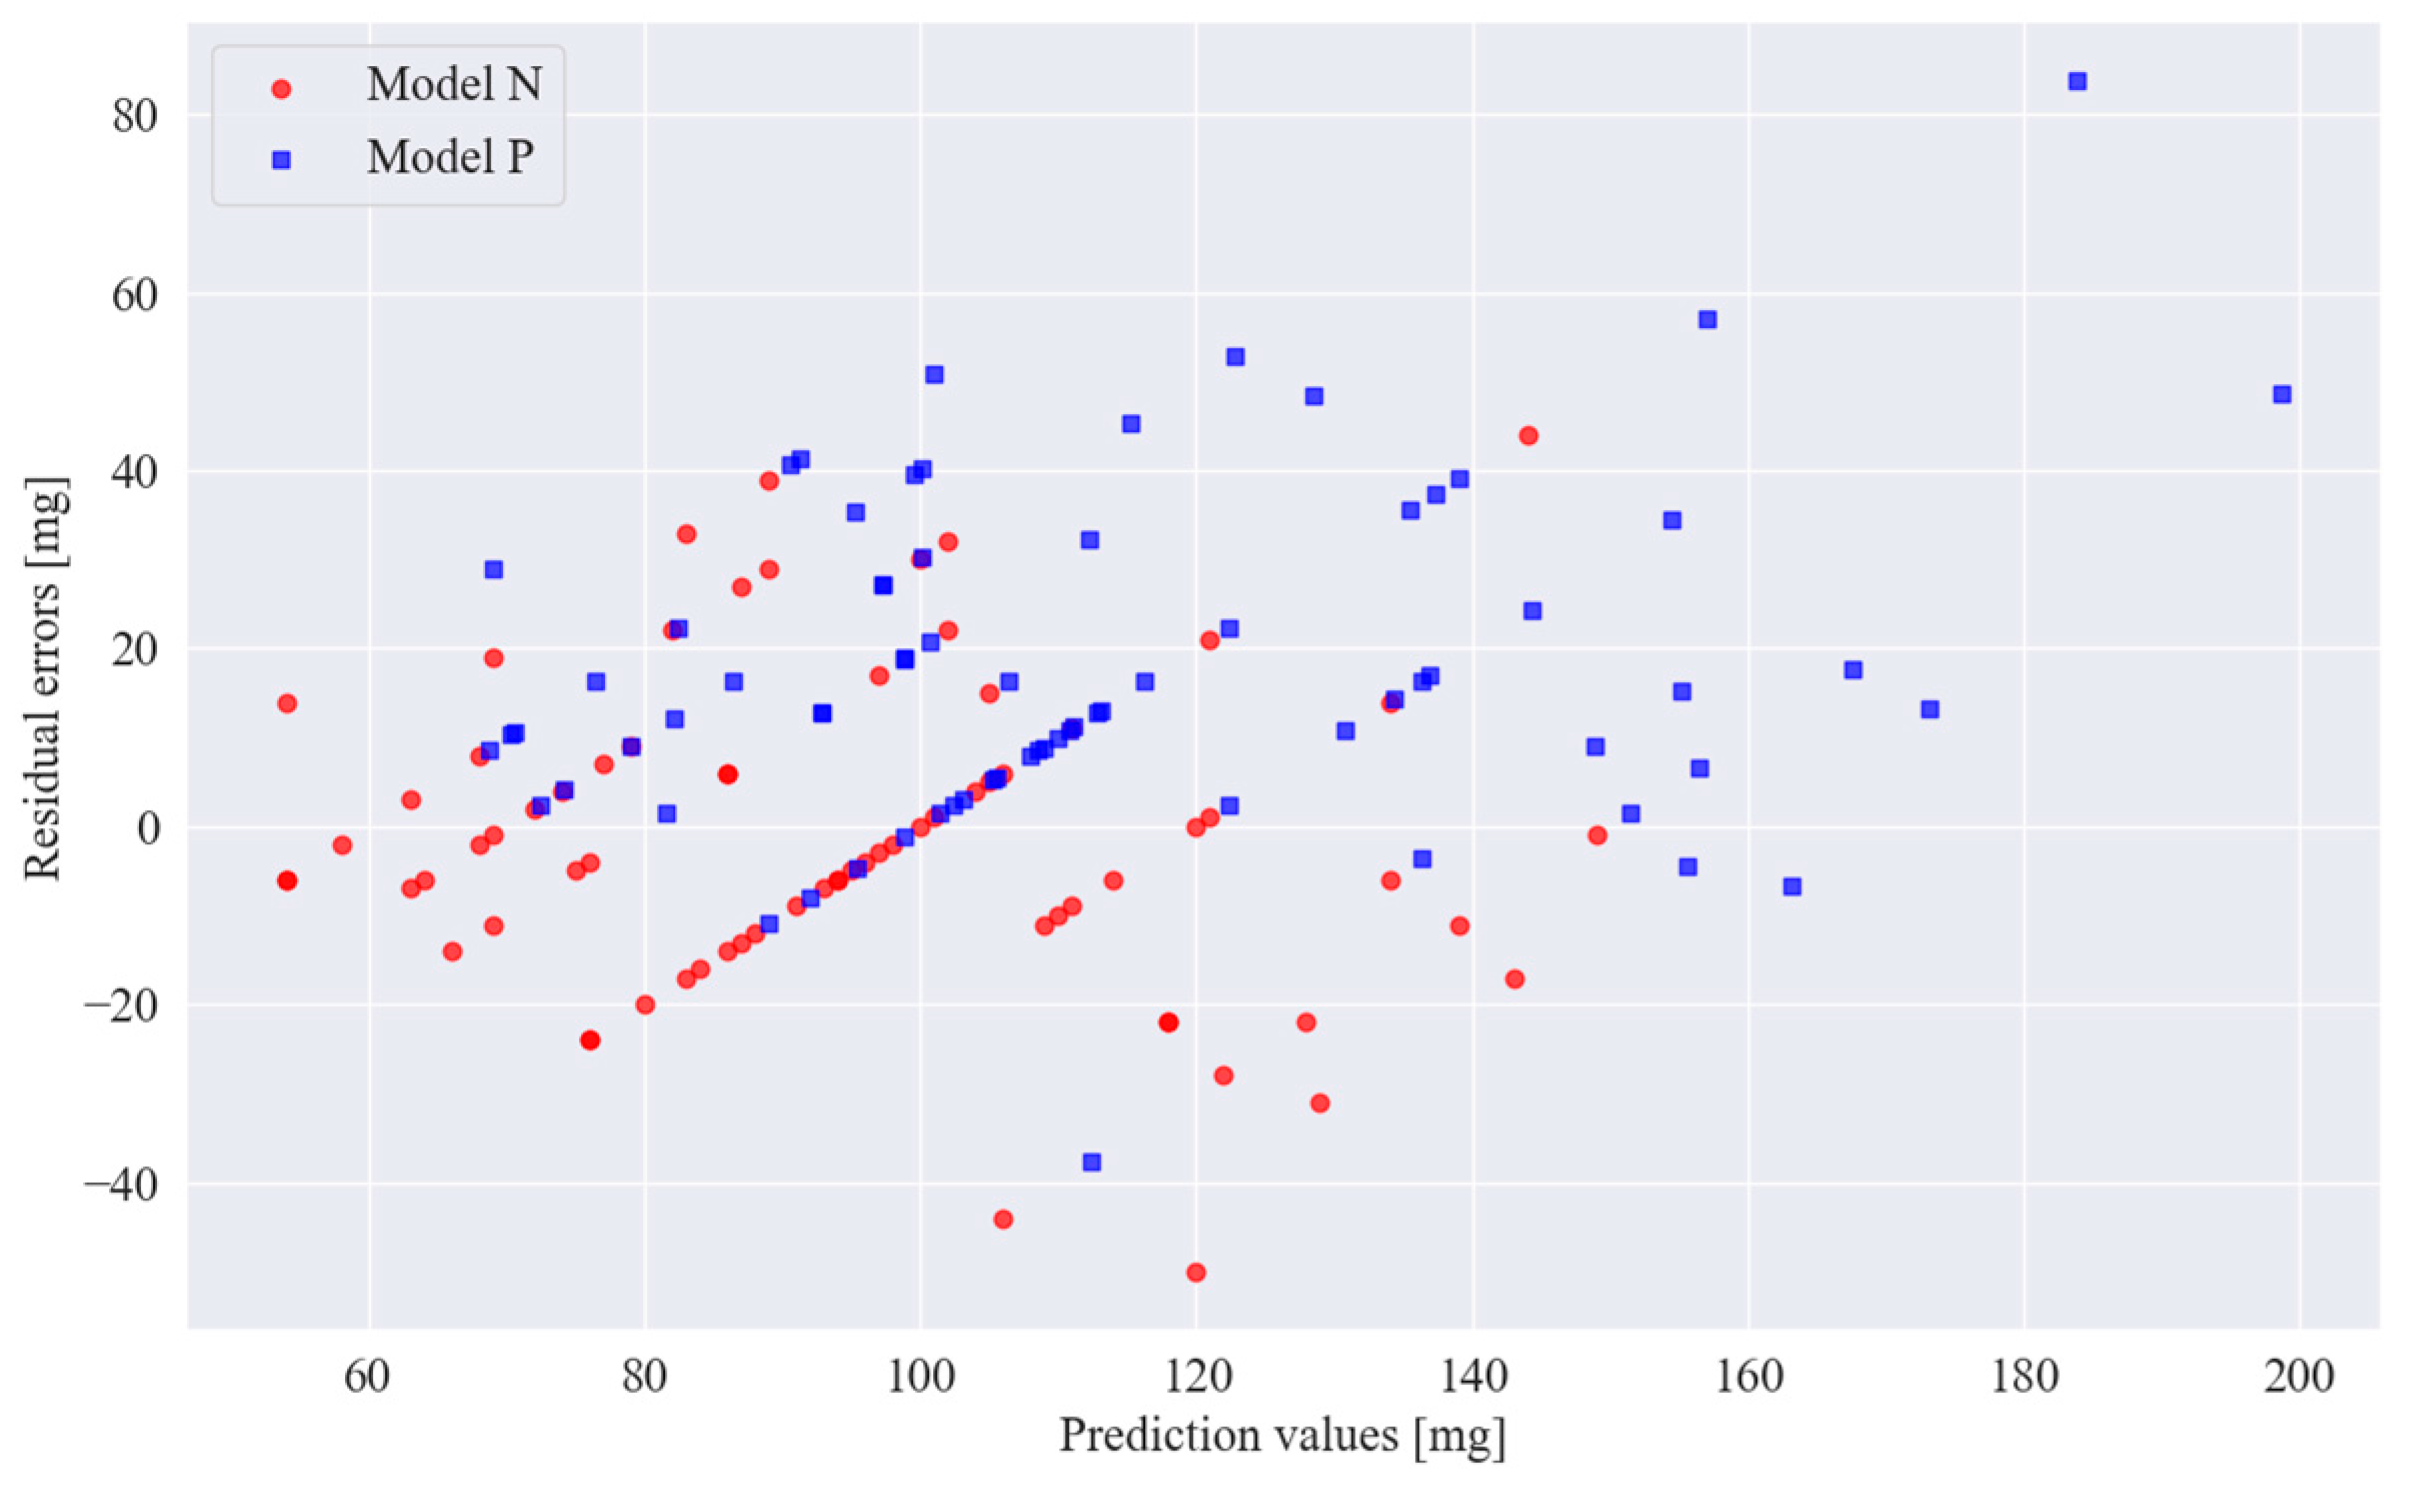
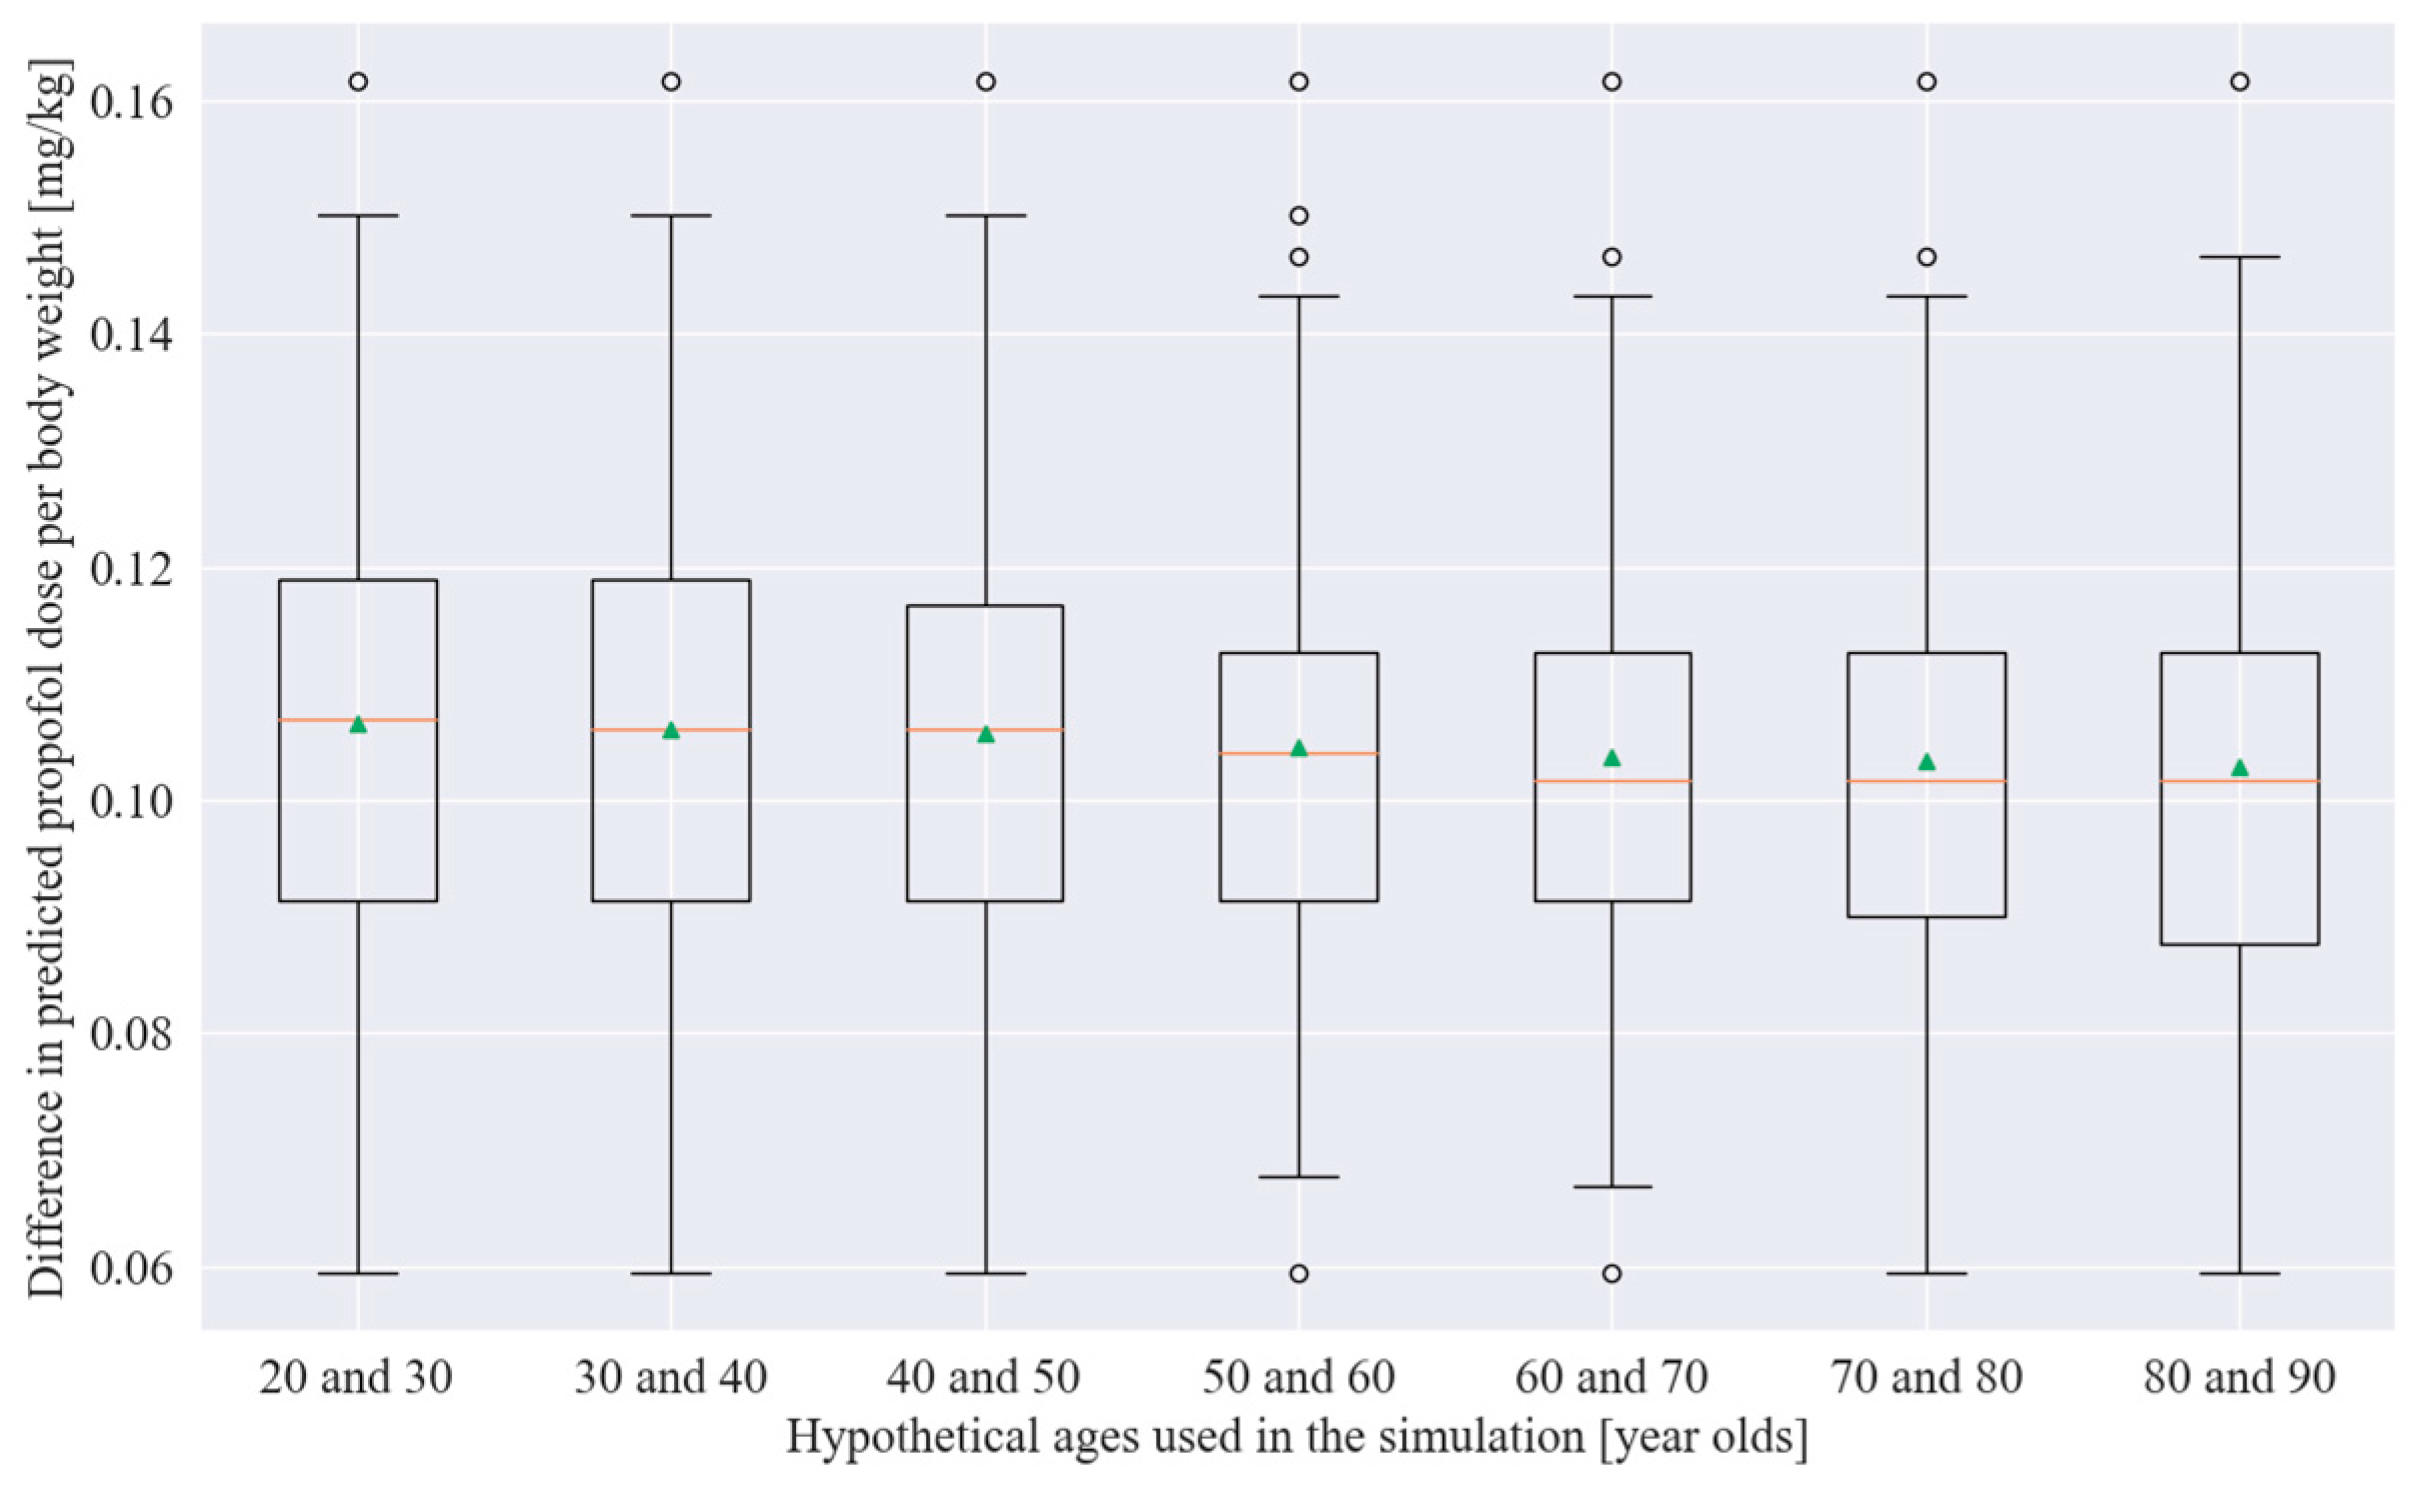
2.4. Statistical Analysis and Model Training and Simulation

The patient background of the collected data was tabulated. Groups were classified into those in which PIHF occurred and those in which it did not, and the age and propofol dose were compared using t-tests. The significance level was set at 0.05.
Of the analyzed cases, 80% were randomly assigned to the training dataset, with 20% allocated to the test dataset. The model creation data were further randomly divided into a training set (80%) and a test set (20%). A fully connected neural network model was developed using the training and validation data to predict the propofol induction dose. The input variables included the age, sex, height, weight, American Society of Anesthesiologists physical status (ASA-PS) scale, systolic blood pressure (SBP), diastolic blood pressure (DBP), and heart rate (HR) before anesthesia induction, as well as the induction dose of fentanyl. The output variable was the induction dose of propofol. The model comprised three layers: input, intermediate, and output layers, with 9–7–1 units, respectively (Figure 2). The Adam optimizer was used for model training. The hyperparameters—batch size, learning rate, and number of epochs—were manually tuned to achieve optimal performance. The proposed model is called “model N”.
The performance of both the neural network model and the previously reported prediction equation (“model P”) was evaluated using the RMSE and MAE calculated based on the test data. To estimate the 95% confidence intervals (CIs) for these metrics, a bootstrap resampling method was employed. Specifically, the bootstrap procedure involved generating 1000 random samples with replacement from the test dataset, maintaining the same sample size as the original test data. For each resampled dataset, the RMSE and MAE were recalculated. The 95% CIs were then derived by determining the 2.5th and 97.5th percentiles of the bootstrapped distribution of each metric. The prediction equation for model P was defined as follows: propofol dose (mg) = [2.374 − 0.0113 × age (years) − 0.0788 (if ASA-PS 3 or 4) + 0.057 (if female) + 0.1087 × fentanyl dose (μg/kg)] × body weight (kg) [12].
According to the study that proposed model P, it is reported that if the residual error difference between the doses predicted by model P and the actual doses is large, PIHF is likely to occur. Therefore, a chi-square test was used to compare the frequency of PIHF between the groups with large and small residual errors, divided into doses of ≥5 mg and <5 mg. The significance level was set at 0.05.
Furthermore, utilizing the developed model, simulations were conducted to predict the changes in the propofol induction dose based on age. In each case, the predicted value of the propofol dose was calculated by model N using a hypothetical age range of 10 years, from 20 to 90 years old. After calculating the propofol dose per body weight at each age, we simulated the change in the dose for each 10 years of aging. Specifically, we simulated the changes in the doses with aging, starting at ages 20 and 30 and continuing at every 10 years until ages 80 and 90.
All the statistical analyses were conducted using Python (version 3.9) and the scikit-learn library (version 1.3.0), while the model construction and training were performed using PyTorch (version 2.0.1).

3. Results

A flowchart illustrating this process is presented in Figure 3. Out of the 405 cases initially considered, 365 were analyzed in this study, with 40 excluded owing to missing data. The patient background data are detailed in Table 1.
The term “PIHF” is a combined concept of post-induction hypertension and hypotension. In the data collected in this study, among the 157 patients with PIHF, only 1 had post-induction hypertension. Therefore, PIHFs in the present study are almost synonymous with post-induction hemodynamic hypotension.
Histograms of the propofol doses per body weight and histograms of the age are shown in Figure 4 and Figure 5. The patients were divided into two groups according to the presence or absence of PIHF: red indicates the group with PIHF and blue indicates the group without PIHF. The t-tests showed that an older age was a significant predictor of the occurrence of PIHF (p < 0.001). However, the propofol dose did not predict the occurrence of PIHF in patients older than 65 years (p = 0.67).
Among the 365 cases, 80% (n = 292) were randomly allocated to the model building, while the remaining 20% (n = 73) constituted the testing data. The data for model building was further split into the training (n = 233, 80%) and validation data (n = 58, 20%). Through manual hyperparameter tuning, the following values were determined: a batch size of 20, a learning rate of 0.08, and 26 epochs.
Figure 6 plots the predictions made by the models on the horizontal axis and the residual errors on the vertical axis. Model P tended to have larger predictions than model N, and the residual errors are often positive. Model P exhibited RMSE and MAE values of 25.8 (95%CI: 21.3–30.7) and 16.7 (95%CI: 16.4–23.8), respectively, which were higher than those of model N, showing 17.6 (95%CI: 14.4–20.9) and 13.0 (95%CI: 10.3–15.9) (p < 0.001). The coefficients of determination were 0.66 for model N and 0.27 for model P.
Table 2 shows the frequency of PIHF in the groups with large and small residual errors between the predictions by model P and the true values. A chi-square test was used to compare the frequency of PIHF in the two groups, but no significant difference was observed (p = 0.6).
Subsequently, model N was utilized to simulate the changes in the induction dose of propofol concerning age. The results of the simulations revealed that the induction dose of propofol per body weight decreased by an average of 0.1 mg/kg with every 10-year increase in age, as illustrated in Figure 7.

4. Discussion

The results of the present study can be summarized as follows. First, the propofol dose was not associated with PIHF in older individuals. Second, our proposal model (“model N”) was more accurate than the previously reported model (“model P”). Third, the propofol dose at induction of anesthesia decreased by 0.1 mg/kg for every 10 years of aging. This is the first study to focus on quantifying the relationship between aging and the propofol dose utilizing a neural network model.
PIHFs are more likely to occur with aging, and propofol has the adverse effect of dose-dependent hypotension [15,16,17]. However, the effect of higher or lower propofol doses on the frequency of hypotension after the induction of anesthesia in older patients has not been determined, with one report suggesting an increase in the frequency of hypotension [18] and another suggesting no change [19]. Since propofol theoretically causes hypotension in a dose-dependent manner, it is reported that the reason the frequency of hypotension did not change with higher or lower doses is that anesthesiologists adjust the propofol doses according to the frailty of older patients and not just their age [19]. In the data collected in this study, the propofol doses were compared between groups of older patients aged 65 years or older who developed PIHF and those who did not, but there was no significant difference. These results suggest that the anesthesiologists at our hospital adjust the propofol dose according to the apparent vigor of older individuals and their frailty, including ADL, as mentioned earlier. According to previous reports, the induction of anesthesia with propofol using target-controlled infusion (TCI) instead of manual induction increases the induction time, but post-induction hypotension is less frequent [20]. It has also been reported that remimazolam is less likely to cause hypotension than propofol [21]. In cases where hypotension is expected to occur, TCI or remimazolam is a better choice. However, it is difficult to accurately predict whether hypotension will occur after the induction of anesthesia. Although several methods have been reported to predict hypotension after the induction of anesthesia [22,23], and patients with cardiac disease are prone to hypotension [24], there are no absolute indicators. A comprehensive judgment must be made by the anesthesiologist, including the history, laboratory findings, and patient frailty.
The model N developed in this study was more accurate in predicting the propofol dose than the previously reported model P. In contrast, the model P article reported that PIHFs were likely to occur when the actual propofol dose administered had an error of 5 mg or higher from the model P prediction [12]. To exclude the possibility that the propofol dose in our hospital may likely produce PIHF, we performed the following validation. The data from our hospital were divided into two groups, those with residual errors of ≥5 mg and those with residual errors of <5 mg from the model P prediction, and the proportions of PIHF were compared using a chi-square test. The results were not significantly different, indicating that the propofol dose at our hospital was not likely to cause PIHF. We believe that the main reason why model N, which was created using a smaller number of cases than model P, had better prediction accuracy was that the models were compared using data from our hospital. Conversely, if model N was tested on data from another hospital, we would expect its accuracy to be lower. Because each hospital has different patient backgrounds and each anesthesiologist administers propofol at slightly different doses, the propofol dose prediction model may be valid only for the hospital where it was created.
Although it has been reported that the dose of propofol required to induce the loss of consciousness with anesthesia induction decreases with age, this is the first study to quantify this relationship utilizing a neural network model. In the present simulation with model N, the induction propofol dose was decreased by 0.1 mg/kg for every 10 years of aging. This result is consistent with the results of simulations with model P and may be widely adaptable.
Some limitations exist in terms of this study. First, this is a single-center, backward-looking cohort study; therefore, sampling bias may exist in the data collected. A multi-center study is a future challenge. Second, the propofol doses were given at the discretion of the anesthesiologist so that the dose was sufficient to cause loss of consciousness, but it was not necessarily the minimum required. The retrospective nature of this study has limited the data collection. To more accurately examine the propofol doses that result in the loss of consciousness, BIS should be used, as previously reported [25]. Third, there may be confounding factors not measured in this study. Patients with cardiac disease or other comorbidities are more likely to develop hypotension after the induction of anesthesia [24]; therefore, anesthesiologists may reduce the dose of propofol. However, since we use midazolam in high-risk cases of heart disease at our hospital, high-risk cases were not included in this study, and we believe that the influence of confounding factors regarding heart disease has been avoided. Fourth, the MAE of model N was about 10 mg, a non-negligible error. We believe that the error was caused by the fact that the propofol dose administered varied from anesthesiologist to anesthesiologist, even for the same patient. There may be several reasons for the variation, but the major reason may be that the propofol dose required to achieve the loss of consciousness varies from patient to patient [26]; therefore, the dose cannot be determined exactly. Titration of the propofol dose based on the patient’s response is also considered necessary in actual clinical practice.

5. Conclusions

We developed an artificial intelligence model to predict the propofol dose based on clinical parameters. The new model demonstrated better predictive accuracy than the previous one (RMSE: 17.6 vs. 25.8; MAE: 13.0 vs. 16.7), although its generalizability requires cautious interpretation. This study highlights a universal relationship between age and the propofol dose, suggesting that for every 10 years of aging, the required dose may decrease by approximately 0.1 mg/kg.

Author Contributions

Conceptualization, K.N.; data curation, K.N.; methodology, K.H.; supervision, Y.M.; writing—original draft, K.N. and K.H.; writing—review and editing, K.H., F.N. and A.W. All authors have read and agreed to the published version of the manuscript.

Funding

This research received no external funding.

Institutional Review Board Statement

This study was conducted in accordance with the Declaration of Helsinki, and it was approved by the Institutional Review Board of KKR Sapporo Medical Center (protocol code 2023-36, date of approval: 27 October 2023).

Informed Consent Statement

The data that support the findings of this study are not publicly available due to privacy restrictions, as they contain sensitive patient information. The trained parameters (weights and biases) and the Python codes for the model can be provided upon request from readers. In addition, the code used for constructing the neural network model is also available for sharing. However, due to restrictions imposed by the ethics committee, the clinical data used in this study will not be shared as a general rule.

Data Availability Statement

The data that support the findings of this study are not publicly available due to privacy restrictions, as they contain sensitive patient information.

Conflicts of Interest

The authors declare no conflicts of interest.

Abbreviations

The following abbreviations are used in this manuscript:
RMSERoot mean squared error
MAEMean absolute error
IRBInstitutional review board
PIHFPost-induction hemodynamic fluctuations
SBPSystolic blood pressure
MAPMean arterial blood pressure
ASA-PSAmerican Society of Anesthesiologists physical status
DBPDiastolic blood pressure
HRHeart rate
CIsConfidence intervals
TCITarget-controlled infusion

References

  1. Degtyarenko, K.; de Matos, P.; Ennis, M.; Hastings, J.; Zbinden, M.; McNaught, A.; Alcántara, R.; Darsow, M.; Guedj, M.; Ashburner, M. ChEBI: A Database and Ontology for Chemical Entities of Biological Interest. Nucleic Acids Res. 2008, 36, D344–D350. [Google Scholar] [CrossRef] [PubMed]
  2. Trapani, G.; Altomare, C.; Liso, G.; Sanna, E.; Biggio, G. Propofol in Anesthesia. Mechanism of Action, Structure-Activity Relationships, and Drug Delivery. Curr. Med. Chem. 2000, 7, 249–271. [Google Scholar] [CrossRef] [PubMed]
  3. Hug, C.C.; McLeskey, C.H.; Nahrwold, M.L.; Roizen, M.F.; Stanley, T.H.; Thisted, R.A.; Walawander, C.A.; White, P.F.; Apfelbaum, J.L.; Grasela, T.H. Hemodynamic Effects of Propofol: Data from over 25,000 Patients. Anesth. Analg. 1993, 77, S21–S29. [Google Scholar] [PubMed]
  4. Hojo, T.; Kimura, Y.; Shibuya, M.; Fujisawa, T. Predictors of Hypotension during Anesthesia Induction in Patients with Hypertension on Medication: A Retrospective Observational Study. BMC Anesthesiol. 2022, 22, 343. [Google Scholar] [CrossRef]
  5. Bijker, J.B.; Persoon, S.; Peelen, L.M.; Moons, K.G.M.; Kalkman, C.J.; Kappelle, L.J.; van Klei, W.A. Intraoperative Hypotension and Perioperative Ischemic Stroke after General Surgery: A Nested Case-Control Study. Anesthesiology 2012, 116, 658–664. [Google Scholar] [CrossRef]
  6. Walsh, M.; Devereaux, P.J.; Garg, A.X.; Kurz, A.; Turan, A.; Rodseth, R.N.; Cywinski, J.; Thabane, L.; Sessler, D.I. Relationship between Intraoperative Mean Arterial Pressure and Clinical Outcomes after Noncardiac Surgery: Toward an Empirical Definition of Hypotension. Anesthesiology 2013, 119, 507–515. [Google Scholar] [CrossRef]
  7. Monk, T.G.; Bronsert, M.R.; Henderson, W.G.; Mangione, M.P.; Sum-Ping, S.T.J.; Bentt, D.R.; Nguyen, J.D.; Richman, J.S.; Meguid, R.A.; Hammermeister, K.E. Association between Intraoperative Hypotension and Hypertension and 30-Day Postoperative Mortality in Noncardiac Surgery. Anesthesiology 2015, 123, 307–319. [Google Scholar] [CrossRef]
  8. Schnider, T.W.; Minto, C.F.; Shafer, S.L.; Gambus, P.L.; Andresen, C.; Goodale, D.B.; Youngs, E.J. The Influence of Age on Propofol Pharmacodynamics. Anesthesiology 1999, 90, 1502–1516. [Google Scholar] [CrossRef]
  9. Saugel, B.; Bebert, E.-J.; Briesenick, L.; Hoppe, P.; Greiwe, G.; Yang, D.; Ma, C.; Mascha, E.J.; Sessler, D.I.; Rogge, D.E. Mechanisms Contributing to Hypotension after Anesthetic Induction with Sufentanil, Propofol, and Rocuronium: A Prospective Observational Study. J. Clin. Monit. Comput. 2022, 36, 341–347. [Google Scholar] [CrossRef]
  10. Schonberger, R.B.; Dai, F.; Michel, G.; Vaughn, M.T.; Burg, M.M.; Mathis, M.; Kheterpal, S.; Akhtar, S.; Shah, N.; Bardia, A. Association of Propofol Induction Dose and Severe Pre-Incision Hypotension among Surgical Patients over Age 65. J. Clin. Anesth. 2022, 80, 110846. [Google Scholar] [CrossRef]
  11. Shafer, S.L. The Pharmacology of Anesthetic Drugs in Elderly Patients. Anesthesiol. Clin. N. Am. 2000, 18, 1–29. [Google Scholar] [CrossRef] [PubMed]
  12. Kawasaki, S.; Kiyohara, C.; Tokunaga, S.; Hoka, S. Prediction of Hemodynamic Fluctuations after Induction of General Anesthesia Using Propofol in Non-Cardiac Surgery: A Retrospective Cohort Study. BMC Anesthesiol. 2018, 18, 167. [Google Scholar] [CrossRef] [PubMed]
  13. Nishimura, K.; Hirata, K.; Fujita, N.; Watabe, A.; Morimoto, Y. Quantification of the Relationship between Aging and Propofol Induction Dose Using Neural Network Model Simulation: A Single-Center Retrospective Observational Study. In Proceedings of the 71st Annual Meeting of the Japanese Society of Anesthesiologists, Kobe, Japan, 6–8 June 2024. [Google Scholar]
  14. Goldman, L.; Caldera, D.L.; Southwick, F.S.; Nussbaum, S.R.; Murray, B.; O’Malley, T.A.; Goroll, A.H.; Caplan, C.H.; Nolan, J.; Burke, D.S.; et al. Cardiac Risk Factors and Complications in Non-Cardiac Surgery. Medicine 1978, 57, 357–370. [Google Scholar] [CrossRef]
  15. Reich, D.L.; Hossain, S.; Krol, M.; Baez, B.; Patel, P.; Bernstein, A.; Bodian, C.A. Predictors of Hypotension after Induction of General Anesthesia. Anesth. Analg. 2005, 101, 622–628. [Google Scholar] [CrossRef]
  16. Südfeld, S.; Brechnitz, S.; Wagner, J.Y.; Reese, P.C.; Pinnschmidt, H.O.; Reuter, D.A.; Saugel, B. Post-Induction Hypotension and Early Intraoperative Hypotension Associated with General Anaesthesia. Br. J. Anaesth. 2017, 119, 57–64. [Google Scholar] [CrossRef]
  17. Jor, O.; Maca, J.; Koutna, J.; Gemrotova, M.; Vymazal, T.; Litschmannova, M.; Sevcik, P.; Reimer, P.; Mikulova, V.; Trlicova, M.; et al. Hypotension after Induction of General Anesthesia: Occurrence, Risk Factors, and Therapy. A Prospective Multicentre Observational Study. J. Anesth. 2018, 32, 673–680. [Google Scholar] [CrossRef]
  18. Phillips, A.T.; Deiner, S.; Mo Lin, H.; Andreopoulos, E.; Silverstein, J.; Levin, M.A. Propofol Use in the Elderly Population: Prevalence of Overdose and Association With 30-Day Mortality. Clin. Ther. 2015, 37, 2676–2685. [Google Scholar] [CrossRef] [PubMed]
  19. Chen, E.Y.; Michel, G.; Zhou, B.; Dai, F.; Akhtar, S.; Schonberger, R.B. An Analysis of Anesthesia Induction Dosing in Female Older Adults. Drugs Aging 2020, 37, 435–446. [Google Scholar] [CrossRef]
  20. Yildirim, S.A.; Dogan, L.; Sarikaya, Z.T.; Ulugol, H.; Gucyetmez, B.; Toraman, F. Hypotension after Anesthesia Induction: Target-Controlled Infusion Versus Manual Anesthesia Induction of Propofol. J. Clin. Med. 2023, 12, 5280. [Google Scholar] [CrossRef]
  21. Huang, Y.; Yan, T.; Lu, G.; Luo, H.; Lai, Z.; Zhang, L. Efficacy and Safety of Remimazolam Compared with Propofol in Hypertensive Patients Undergoing Breast Cancer Surgery: A Single-Center, Randomized, Controlled Study. BMC Anesthesiol. 2023, 23, 409. [Google Scholar] [CrossRef]
  22. Sharma, V.; Sharma, A.; Sethi, A.; Pathania, J. Diagnostic Accuracy of Left Ventricular Outflow Tract Velocity Time Integral versus Inferior Vena Cava Collapsibility Index in Predicting Post-Induction Hypotension during General Anesthesia: An Observational Study. Acute Crit. Care 2024, 39, 117–126. [Google Scholar] [CrossRef] [PubMed]
  23. Fathy, M.M.; Wahdan, R.A.; Salah, A.A.A.; Elnakera, A.M. Inferior Vena Cava Collapsibility Index as a Predictor of Hypotension after Induction of General Anesthesia in Hypertensive Patients. BMC Anesthesiol. 2023, 23, 420. [Google Scholar] [CrossRef] [PubMed]
  24. Tarao, K.; Daimon, M.; Son, K.; Nakanishi, K.; Nakao, T.; Suwazono, Y.; Isono, S. Risk Factors Including Preoperative Echocardiographic Parameters for Post-Induction Hypotension in General Anesthesia. J. Cardiol. 2021, 78, 230–236. [Google Scholar] [CrossRef] [PubMed]
  25. Xu, G.; Qiao, N.; Pan, Y.; Simayi, A.; Chen, N. The Appropriate Dose of Propofol for Anesthesia Induction in Morbidly Obese Patients. Ann. Palliat. Med. 2020, 9, 1921–1927. [Google Scholar] [CrossRef]
  26. Iwakiri, H.; Nishihara, N.; Nagata, O.; Matsukawa, T.; Ozaki, M.; Sessler, D.I. Individual Effect-Site Concentrations of Propofol Are Similar at Loss of Consciousness and at Awakening. Anesth. Analg. 2005, 100, 107–110. [Google Scholar] [CrossRef]
Figure 1. Chemical structure of propofol (IUPAC name: 2,6-diisopropylphenol). Source: ChEBI, EMBL-EBI (ChEBI ID: 44915), accessed 20 May 2025.
Applsci 15 06052 g001
Figure 2. Structure of the neural network. The input layer consists of nine clinical parameters: age, sex, height, weight, ASA-PS status, systolic blood pressure (SBP), diastolic blood pressure (DBP), heart rate (HR) before induction, and induction dose of fentanyl. The intermediate layer represents a fully connected hidden layer. The output layer provides the predicted propofol induction dose (mg).
Applsci 15 06052 g002
Figure 3. Flowchart of the participant selection and dataset splitting. A total of 405 participants were screened, and 365 were analyzed after excluding 40 with missing data. The dataset was randomly split into training (n = 234), validation (n = 58), and test (n = 73) sets.
Applsci 15 06052 g003
Figure 4. Histograms of the propofol dose and post-induction hemodynamic fluctuations (PIHFs) in the elderly. Blue bars represent patients who experienced PIHF (PIHF [+]); orange bars represent those who did not (PIHF [−]). The x-axis indicates the propofol dose per body weight [mg/kg], and the y-axis shows the number of patients.
Applsci 15 06052 g004
Figure 5. Histograms of the age and post-induction hemodynamic fluctuations (PIHFs). Blue bars represent patients who experienced PIHF (PIHF [+]); orange bars represent those who did not (PIHF [−]). The x-axis represents the age grouped in 5-year intervals, and the y-axis indicates the number of patients.
Applsci 15 06052 g005
Figure 6. Residual plots for each model. The x-axis represents the predicted propofol dose (mg), and the y-axis shows the residual errors (mg). Each point indicates the residual for a single prediction. Red circles correspond to model N, and blue squares correspond to model P.
Applsci 15 06052 g006
Figure 7. Simulation utilizing model N: pairwise decadal change in the propofol dose per kilogram. Each boxplot represents the distribution of the dose differences (mg/kg) between two adjacent hypothetical ages (e.g., 20 and 30, 30 and 40, …, up to 80 and 90 years). The x-axis indicates the paired hypothetical ages used in the simulation, and the y-axis shows the difference in the predicted propofol dose per body weight. Boxes represent interquartile ranges; red horizontal lines indicate medians; green triangles indicate means; whiskers denote 1.5 × IQR; and circles represent outliers.
Applsci 15 06052 g007
Table 1. Background characteristics of the patients.
Variables
Age (years), mean (range)63.8 (18–95)
Female sex, n (%)209 (57.3)
Height (cm), mean (95% CI)160.4 (159.4–161.4)
Weight (kg), mean (95% CI)61.7 (60.4–63.1)
ASA-PS, n (%)
154 (14.8)
2265 (72.6)
345 (12.3)
SBP before induction (mmHg), mean (range)139.5 (79–203)
DBP before induction (mmHg), mean (range)76.8 (45–121)
HR before induction (bpm), mean (range)73.5 (34–144)
Induction propofol dose (mg), mean (range)98.5 (20–200)
Induction fentanyl dose (μg), mean (range)93.4 (0–200)
Induction remifentanil dose (μg/kg/min), mean (range)0.2 (0.0–0.5)
Note: Continuous variables are presented as the mean (range) or mean (95% confidence interval), as appropriate. Categorical variables are presented as the number (percentage). ASA-PS: American Society of Anesthesiologists physical status; SBP: Systolic blood pressure; DBP: Diastolic blood pressure; HR: Heart rate.
Table 2. The frequency of PIHFs (post-induction hemodynamic fluctuations) in the groups with large and small residual errors.
PIHF(+)PIHF (−)
Residual error < 5 mg97
Residual error ≥ 5 mg3621
Note: The residual error was defined as the absolute difference between the predicted and actual induction dose of propofol. Patients were grouped into those with a residual error of <5 mg and those with a residual error of ≥5 mg. The table shows the number of patients with and without PIHF in each group.
Disclaimer/Publisher’s Note: The statements, opinions and data contained in all publications are solely those of the individual author(s) and contributor(s) and not of MDPI and/or the editor(s). MDPI and/or the editor(s) disclaim responsibility for any injury to people or property resulting from any ideas, methods, instructions or products referred to in the content.

