Abstract
To address the challenge of dynamic monitoring during grouting operations in coal mine fault zones under pressurized mining, this study proposes the Borehole–Tunnel Joint Resistivity Method (BTJRM). By integrating three-dimensional (3D) electrode arrays in both tunnels and boreholes with 3D resistivity inversion technology, this approach enables fully automated underground data acquisition and real-time processing, facilitating comprehensive dynamic monitoring of grout propagation. A case study was conducted on a coal mine fault grouting project, where tunnel and borehole survey lines were deployed to construct a 3D cross-monitoring network, overcoming the limitations of traditional 2D data acquisition. Finite volume method and quasi-Gauss–Newton inversion algorithms were employed to analyze dynamic resistivity variations, enhancing spatial resolution for detailed characterization of grout migration. Key findings include: (1) Grout diffusion reduced resistivity by 10%, aligning with electrical response patterns during fracture-filling stages; (2) 3D inversion reveals that grout propagates along the principal stress axis, forming a “Y”-shaped low-resistivity anomaly zone that penetrates the fault structural block and extends into roadway areas. The maximum planar and vertical displacements of grout reach 100 m and 40 m, respectively. Thirty days post-grouting, resistivity recovers by up to 22%, reflecting the electrical signature of grout consolidation; (3) This method enables 3D reconstruction of grout diffusion pathways, extends the time window for early warning of water-conducting channel development, and enhances pre-warning capabilities for grout migration. It provides a robust framework for real-time sealing control of fault strata, offering a novel dynamic monitoring technology for mine water inrush prevention. The technology can provide reliable grouting evaluation for mine disaster control engineering.
1. Introduction
With the acceleration of global urbanization and the surging demand for underground space development, the construction scale of mining tunnels, underground caverns, and similar engineering projects continues to expand. However, safety hazards in complex geological environments—such as fault fracture zones, water-rich karst regions, and weak surrounding rock—have become increasingly prominent. Frequent geological disasters, including water inrushes, mud outbursts, and rock mass instability, pose severe threats to mine safety and infrastructure longevity. Grouting technology, as an efficient method for stratum reinforcement and seepage control, has emerged as a cornerstone for disaster prevention in underground mining engineering.
In China’s North China-type coalfields, karst water disasters in coal seam floor strata pose particularly severe challenges [1]. Grouting treatment has emerged as the predominant technical solution for preventing and controlling pressurized karst water hazards in these geological formations. The fundamental principle involves transforming water-conducting and water-bearing strata through targeted grouting reinforcement, effectively converting them into impermeable barriers. This engineered modification achieves three critical objectives: (1) enhancing the structural integrity and thickness of the aquiclude stratum, (2) improving the composite water-resistance capacity of the rock layers, and (3) mitigating the risk of sudden water inrushes from underlying karst aquifers.
Advanced regional grouting technology has now become extensively implemented in hydraulic hazard prevention systems for coalfield foundations [2,3]. As a sophisticated technical approach combining strata consolidation and seepage control, this methodology utilizes controlled injection of cementitious grouts to achieve three-dimensional fracture filling [4], mechanical strengthening of rock masses [5], and permeability reduction. Its implementation represents a paradigm shift in disaster prevention strategies for underground mining engineering, standing as one of the cornerstone technologies in modern geotechnical hazard management.
Despite its widespread application, grouting effectiveness evaluation and process monitoring remain significant challenges [6]. Conventional detection methods, such as core drilling, water pressure testing, and acoustic wave detection, suffer from inherent limitations:
Destructiveness: Core drilling damages 12–25% of grouted structures [7], potentially compromising reinforcement efficacy.
Time lag: Assessments are restricted to post-grouting stages [8], lacking real-time feedback on grout diffusion dynamics [9,10].
Localized data: Single-point measurements fail to characterize the spatial distribution of grouted bodies [11].
High costs: Repeated drilling and testing escalate project expenses and timelines.
In recent years, geophysical prospecting technologies have emerged as a research frontier in grouting monitoring due to their non-destructive nature, operational efficiency, and large-scale coverage. Notably, cement-based grouts exhibit a 3–5 increase in resistivity after solidification compared to host rocks [7], while flowing grouts—rich in free water—show 40–60% lower resistivity [12]. This stark electrical contrast provides a robust physical foundation for dynamic monitoring.
Internationally, resistivity-based methods have achieved maturity in grouting monitoring, with pioneering research institutions and scholars developing cutting-edge technologies and data processing methodologies to explore their potential across diverse grouting scenarios. Jiang Chunlu et al. [13] experimentally demonstrated a three-stage evolution of apparent resistivity (“gradual decline → sharp drop → stabilization”) during chemical grouting in porous rocks, revealing significant variations in resistivity amplitude that effectively map grout migration paths. Liu Xinming et al. [14] innovated a smoothness-constrained 3D inversion algorithm, systematically investigating how horizontal/vertical grid partitioning impacts inversion accuracy. Their numerical and field validations confirmed the reliability of inter-borehole resistivity systems in grout detection. Sun Qinghua et al. [15] identified that sodium silicate additives reduce grout resistivity more effectively than fly ash, with resistivity decreasing proportionally to fracture dip angles. Chen Juntao et al. [16] established a hybrid AHP-CRITIC weighting model integrated with TOPSIS-RSR methods, creating a comprehensive grouting effect evaluation system proven effective in engineering practice. Yuan Shichong et al. [17] developed a “grout–rock” seepage instability model for mining-induced environments using fiber-optic and microseismic monitoring, while Yaoguang Huang et al. [5] formulated a unidirectional coupling model linking excavation-induced stress to plastic failure and grout diffusion. Lee H. et al. [18] independently validated resistivity monitoring for detecting grout penetration and evaluating long-term rock–grout composite stability. Optical fiber monitoring technology also demonstrates potential. Feng S. et al. [19] constructed a “grout–rock” interface slip early-warning model based on distributed optical fiber strain monitoring. Suzuki K. et al. [20] successfully monitored the penetration of cement milk grout using direct current and controlled-source audio-frequency magnetotelluric measurements. Australian scholars Farooq M. et al. [21] studied grouting effects through combined resistivity–microseismic inversion imaging, achieving dynamic updates of the permeability coefficient of grouting curtains. In the context of multi-parameter sensor fusion monitoring methods, Belhadj A. et al. [22] proposed a multi-sensor data fusion (MDF) approach combined with radial basis function neural network (RBFN) to monitor the settlement of the Kerrada rockfill dam in Algeria.
Although geophysical techniques offer non-destructive advantages, existing single-tunnel or borehole monitoring systems (such as traditional electrical resistivity tomography (ERT) and borehole televiewer (BT)) still have significant limitations: 2D survey lines cannot capture the 3D diffusion characteristics of grout, insufficient inter-borehole resolution leads to path inversion distortion, and most systems rely on manual intervention with a lack of real-time capability, see Table 1.

Table 1.
Bottlenecks of existing dynamic monitoring technologies and the positioning of this study.
In the modern research of mining technology digitization, intelligent controllers have made remarkable progress in drill string dynamic monitoring. For example, Landar et al. [23] developed a drill string vibration monitoring system based on a Smart 4 controller, which was first verified in an industrial environment for its real-time evaluation capability of downhole vibration loads. Similarly, Saadeldin et al. [24] used machine learning models to analyze surface drilling rig data, achieving high-precision prediction of three vibration types in horizontal drilling.
The electrical resistivity method can detect the diffusion range of grout around boreholes, but due to technological limitations, it only collects data before and after grouting, qualitatively analyzing grouting effects. It lacks real-time monitoring of the entire grouting process and thus cannot obtain the electrical property data of the strata throughout the grouting process, making it difficult to accurately evaluate grouting effects. This study for the first time realizes the 3D dynamic reconstruction of grout diffusion paths and the time-series tracking of resistivity during the consolidation process. Using a roadway-borehole combined electrical resistivity monitoring system, a 3D cross-monitoring network is constructed through the 3D collaborative deployment of roadway and borehole electrodes, breaking through the limitations of traditional 2D survey lines. In terms of inversion algorithms, the finite volume method and quasi-Gauss–Newton inversion algorithm are used to achieve 3D data inversion, improving spatial resolution. In terms of real-time monitoring capabilities, it can realize unmanned data acquisition and real-time data processing in underground systems, dynamically capturing the electrical property data of the strata throughout the grouting process. This breaks through the limitations of traditional methods, achieves multi-dimensional data fusion and captures the dynamic grouting process, tracks the grout diffusion paths and ranges, significantly improves spatial resolution, and provides a new monitoring paradigm with high spatio-temporal resolution and engineering economy for mine water inrush prevention.
2. The Background of the Study Area
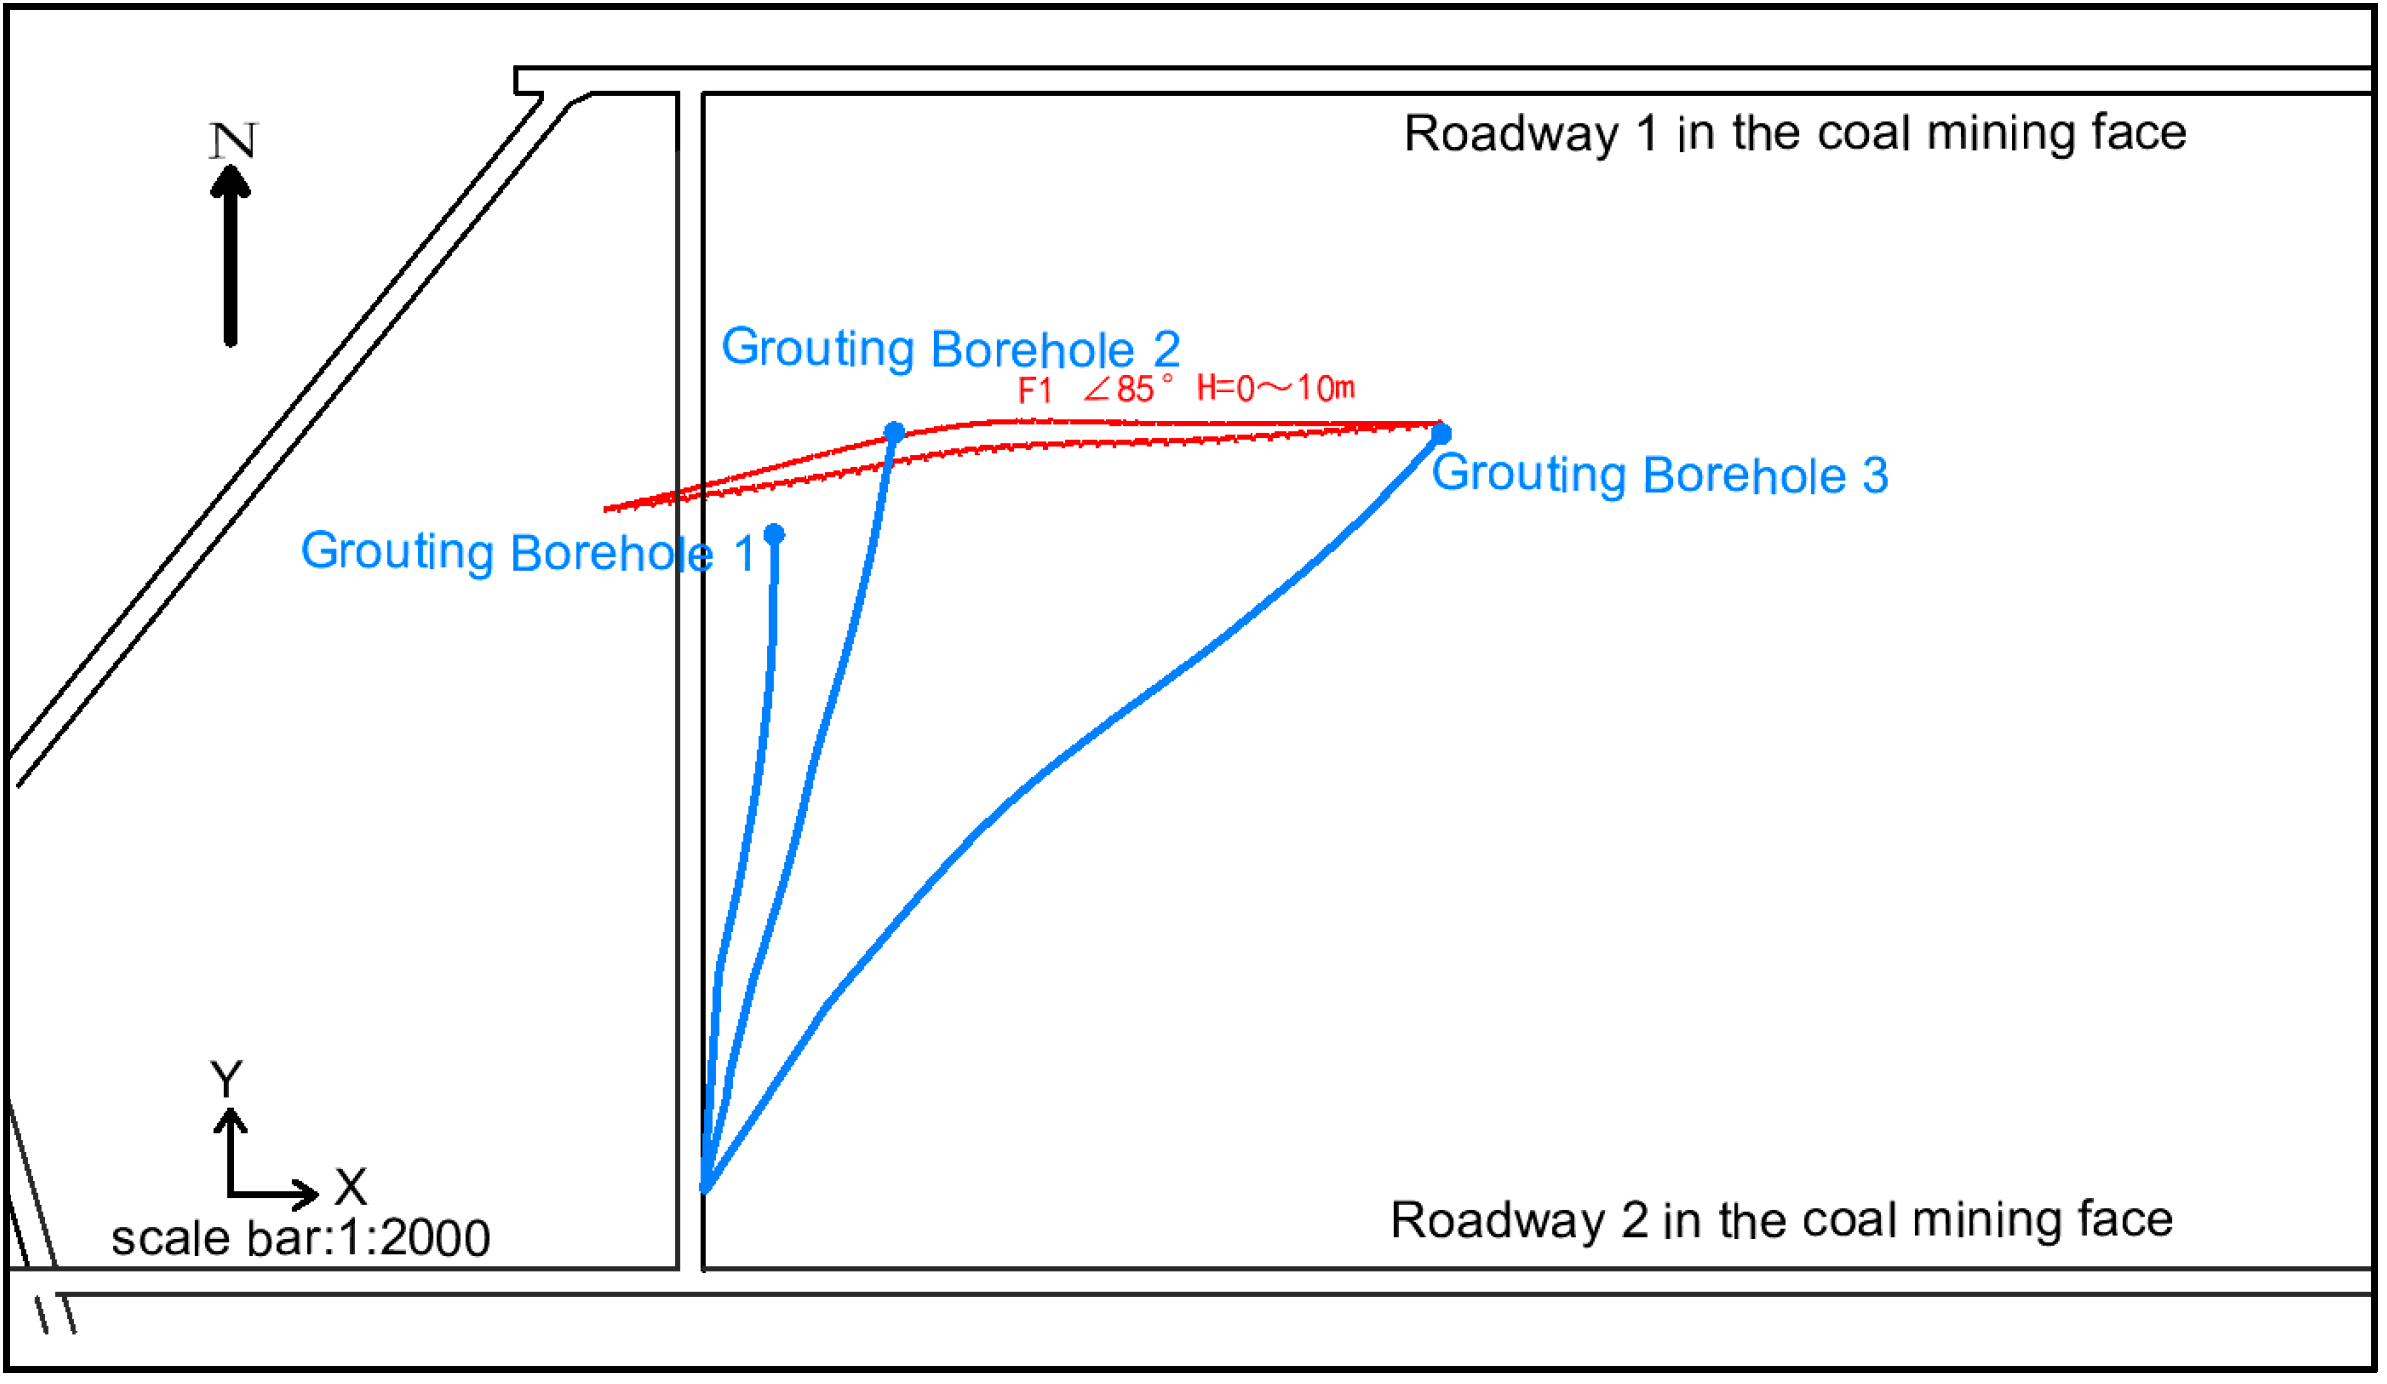
In a coal mine in Ordos, Inner Mongolia Autonomous Region, China, the coal seam floor elevation of a working face lies 80 m below the water table of the Ordovician limestone aquifer, subjecting the floor to 0.8 MPa hydraulic pressure—characterizing it as pressure mining. Geological surveys and tunnel exposures revealed the presence of the F1 fault (dip angle < 85°, vertical displacement 0–10 m), which risked connecting the underlying aquifer and triggering water inrush hazards. To mitigate this risk, grouting reinforcement was implemented near the fault. The grouting horizon is located approximately 30 m below the coal seam floor, where a stable sandstone layer occurs with an average thickness of 10–15 m. This horizon is bounded by distinct top and bottom interfaces, which facilitates the control of grout diffusion. It lies outside the range of coal seam mining-induced disturbance, meeting the requirements of the water inrush coefficient and ensuring that mining activities will not damage the treated strata.
Grouting Design Parameters
Borehole layout: Three grouting holes (see Figure 1) were vertically positioned approximately 30 m below the coal seam working face tunnels.
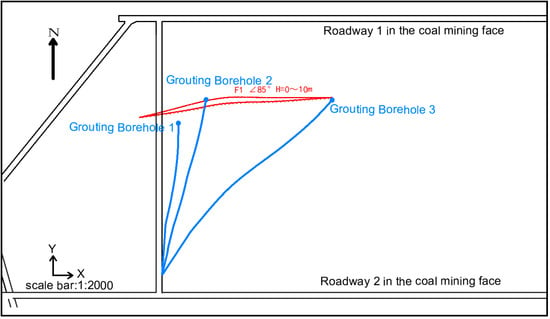
Figure 1.
Schematic diagram of the drilling and grouting layout for faults in a coal mining face.
Grout composition: The grout mixture primarily consisted of cement (15–30%) and fly ash (70–85%), with a water–cement ratio of 2:1.
Operational details: Drilling orientations and grout volumes are summarized in Table 2.
Table 2.
Grouting parameters.
To evaluate grouting efficacy, real-time monitoring of grout diffusion patterns was conducted during the drilling–grouting process, ensuring precise control over fracture sealing and hydraulic isolation.
3. Resistivity Monitoring
During the stratum grouting process, the variation in resistivity exhibits distinct stage-specific patterns: in the initial stage, when grout rich in free water is injected into fractures, it introduces high ion-concentration conductive pathways into the rock strata, thereby causing a significant decrease in resistivity and forming low-resistivity conductive channels. As the grout diffuses, resistivity gradually decreases along the fracture strike, revealing anisotropic characteristics. During the solidification phase, water expulsion and gel structure densification drive a slow resistivity rebound. Upon complete consolidation, resistivity stabilizes at values 3–5 times higher than the original rock, forming high-resistivity anomalies. Under special conditions, such as fractured strata or high-pressure grouting, secondary resistivity fluctuations may occur, necessitating dynamic monitoring to identify abnormal responses. These patterns provide critical electrical criteria for evaluating grouting efficacy and issuing early warnings for potential water-conducting channels.
3.1. Introduction to Resistivity Monitoring System
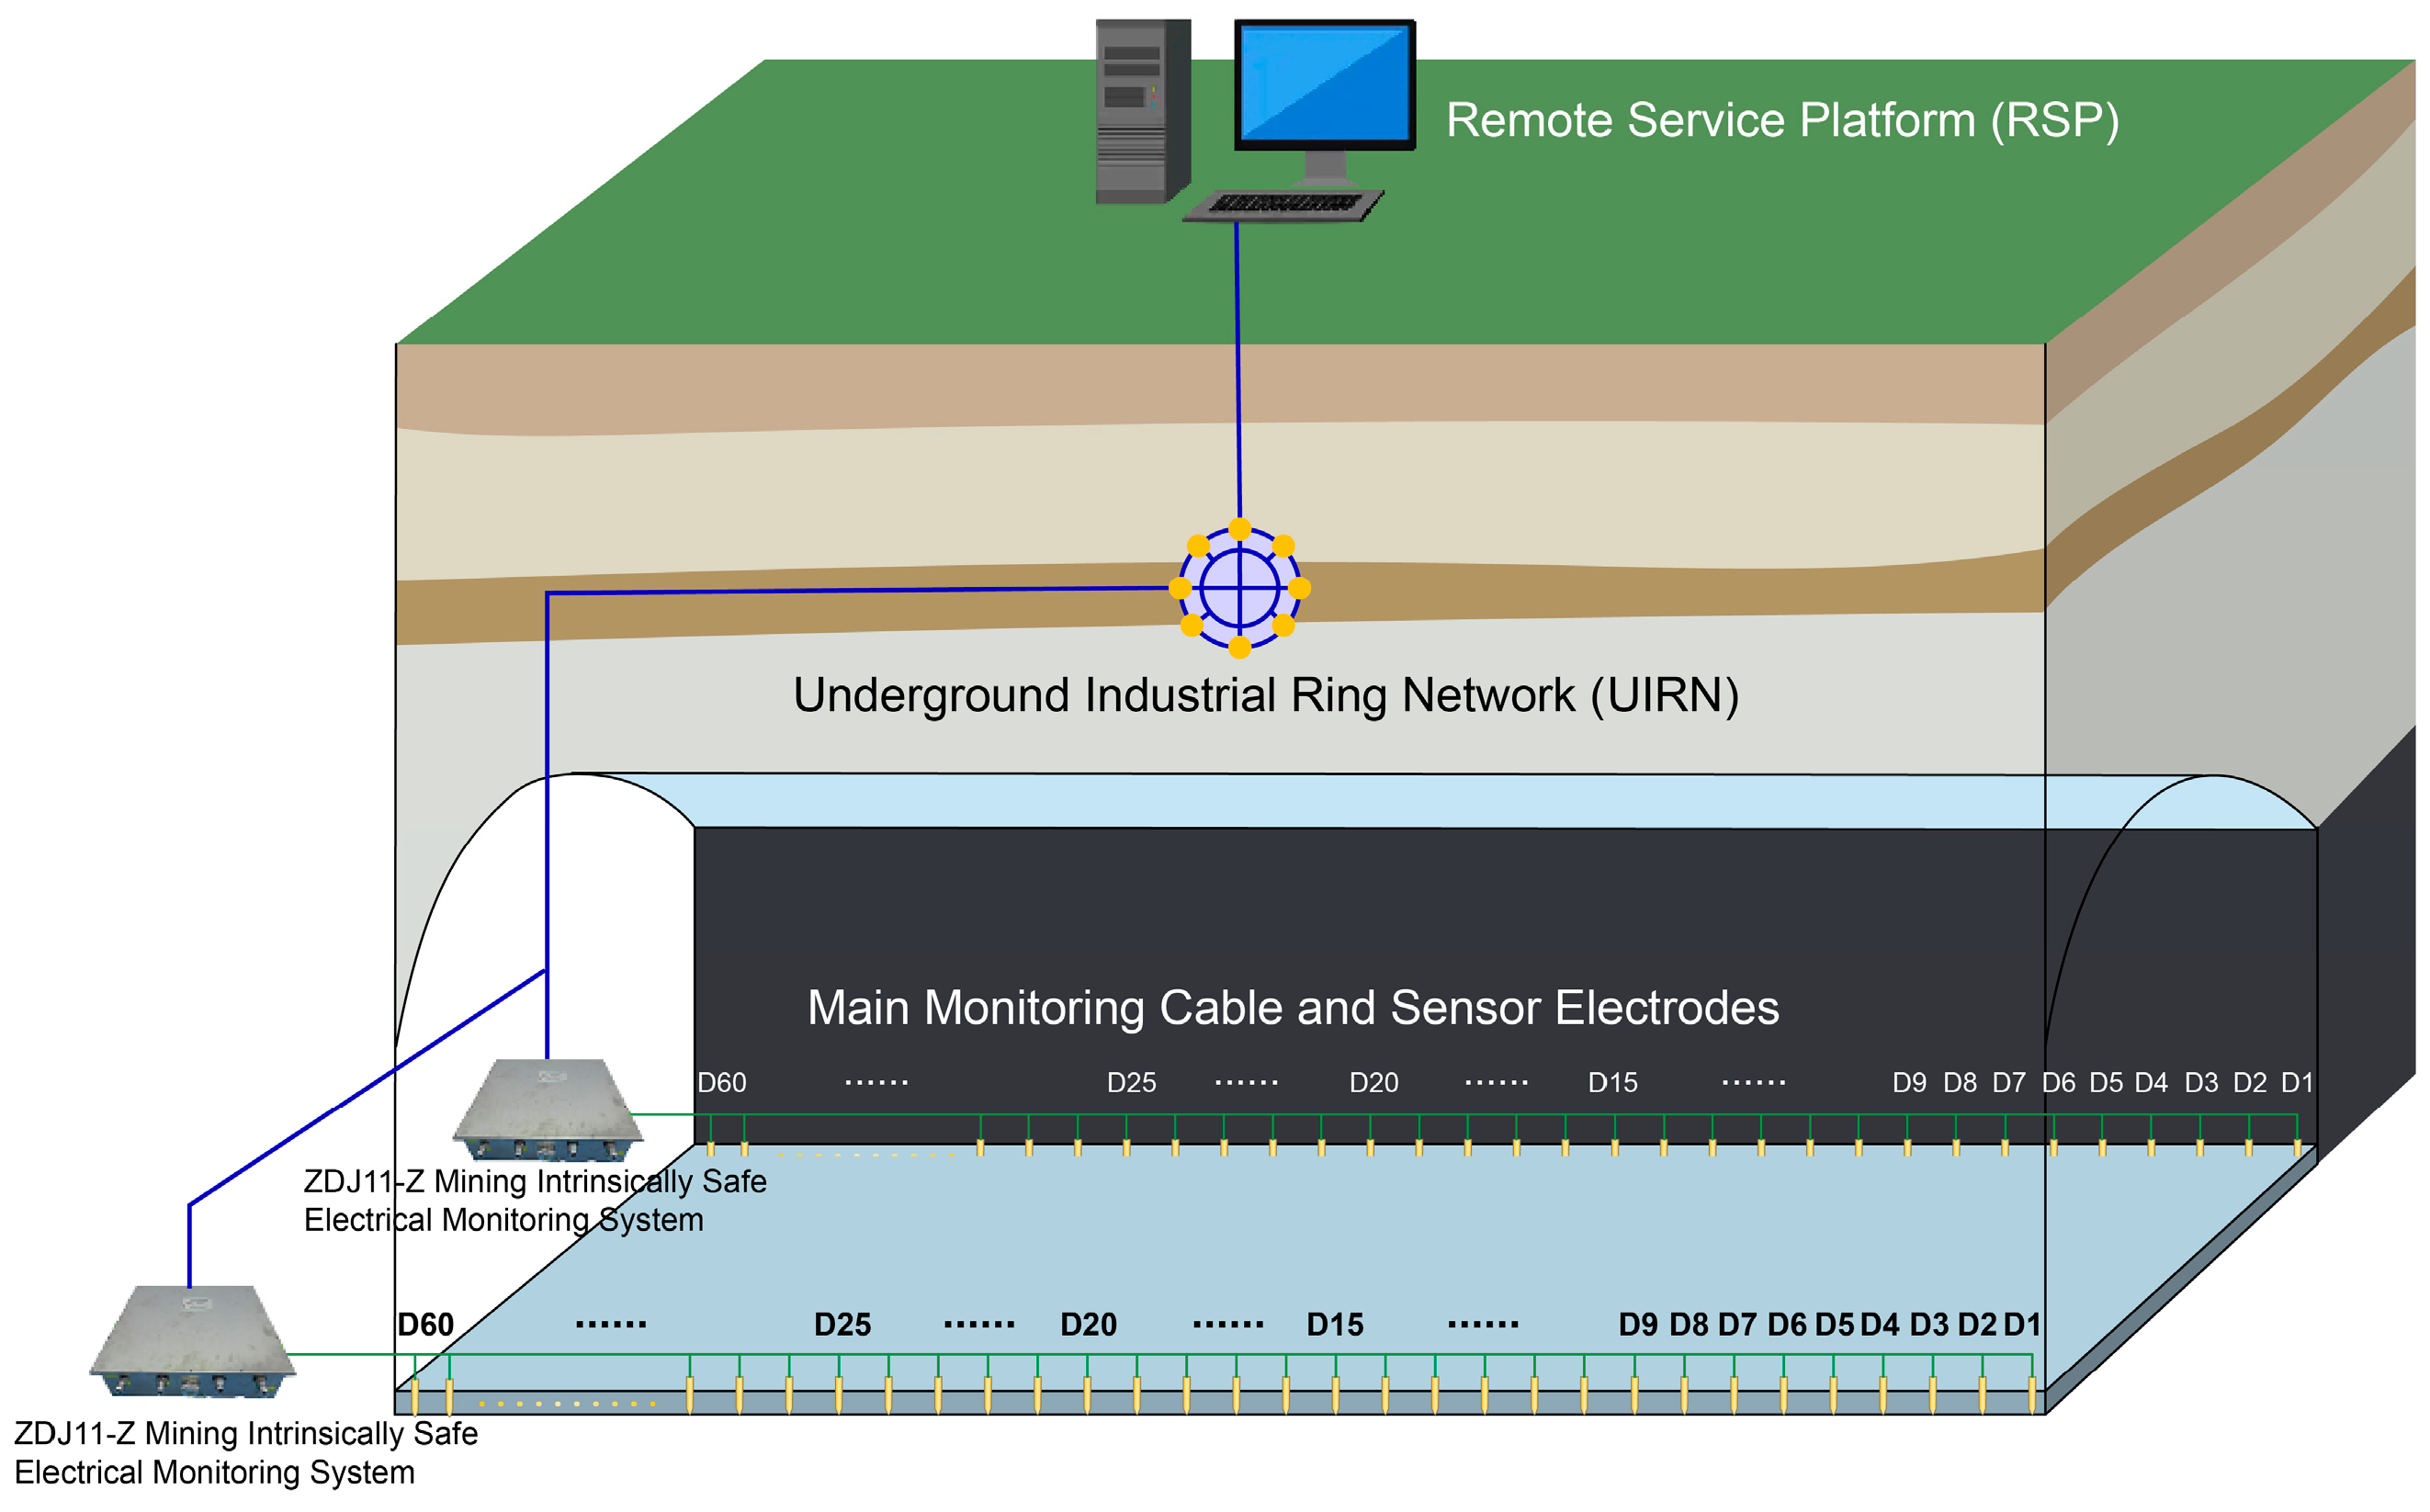
The coal mine working face resistivity monitoring system is widely employed for dynamic monitoring of electrical properties in coal seam strata. As illustrated in Figure 2, the system operates as follows: Electrodes and cables are embedded in the roadways on both sides of the fully mechanized mining face, with the monitoring host unit positioned at the entrance of the two roadways. The host unit is connected via optical transceivers to the surface control server, enabling remote control and data acquisition through specialized software (ZDJ11). Upon transmission to the surface server, the data undergo automated inversion and imaging via processing software, with seamless interaction between the acquisition database and the processing system, eliminating the need for manual intervention. This achieves unmanned data collection and preliminary analysis underground [25].
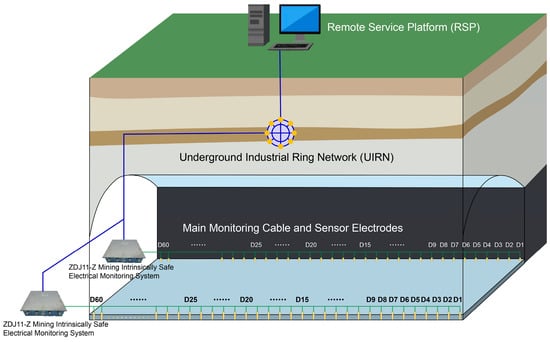
Figure 2.
Schematic diagram of the coal mine working face resistivity monitoring system.
Key system specifications include:
Maximum output voltage: 105 V.
Maximum output current: 60 mA.
Frequency range: 1–128 Hz.
Minimum signal resolution: 5 μV.
Recorded parameters: Output current and received voltage signals.
After the electrode array is deployed, calibration tests, including electrode array integrity verification and electromagnetic noise suppression, are performed to ensure the normal operation of system installation. The data processing software supports automated interaction with the development database to enable real-time data processing, preprocesses the received voltage signals using techniques such as wavelet analysis, and conducts three-dimensional inversion and imaging via the quasi-Gauss–Newton method. The entire system is composed of the independently developed ZDJ11 mine electrical prospecting monitoring device, monitoring control software, and data processing and interpretation software.
3.2. Borehole–Tunnel 3D Cross-Array Layout
The borehole electrode spacing was determined through 3D numerical simulations and field calibration tests, taking into account the electric field gradient error and computational time consumption. A uniform spacing of 20 m was ultimately adopted.
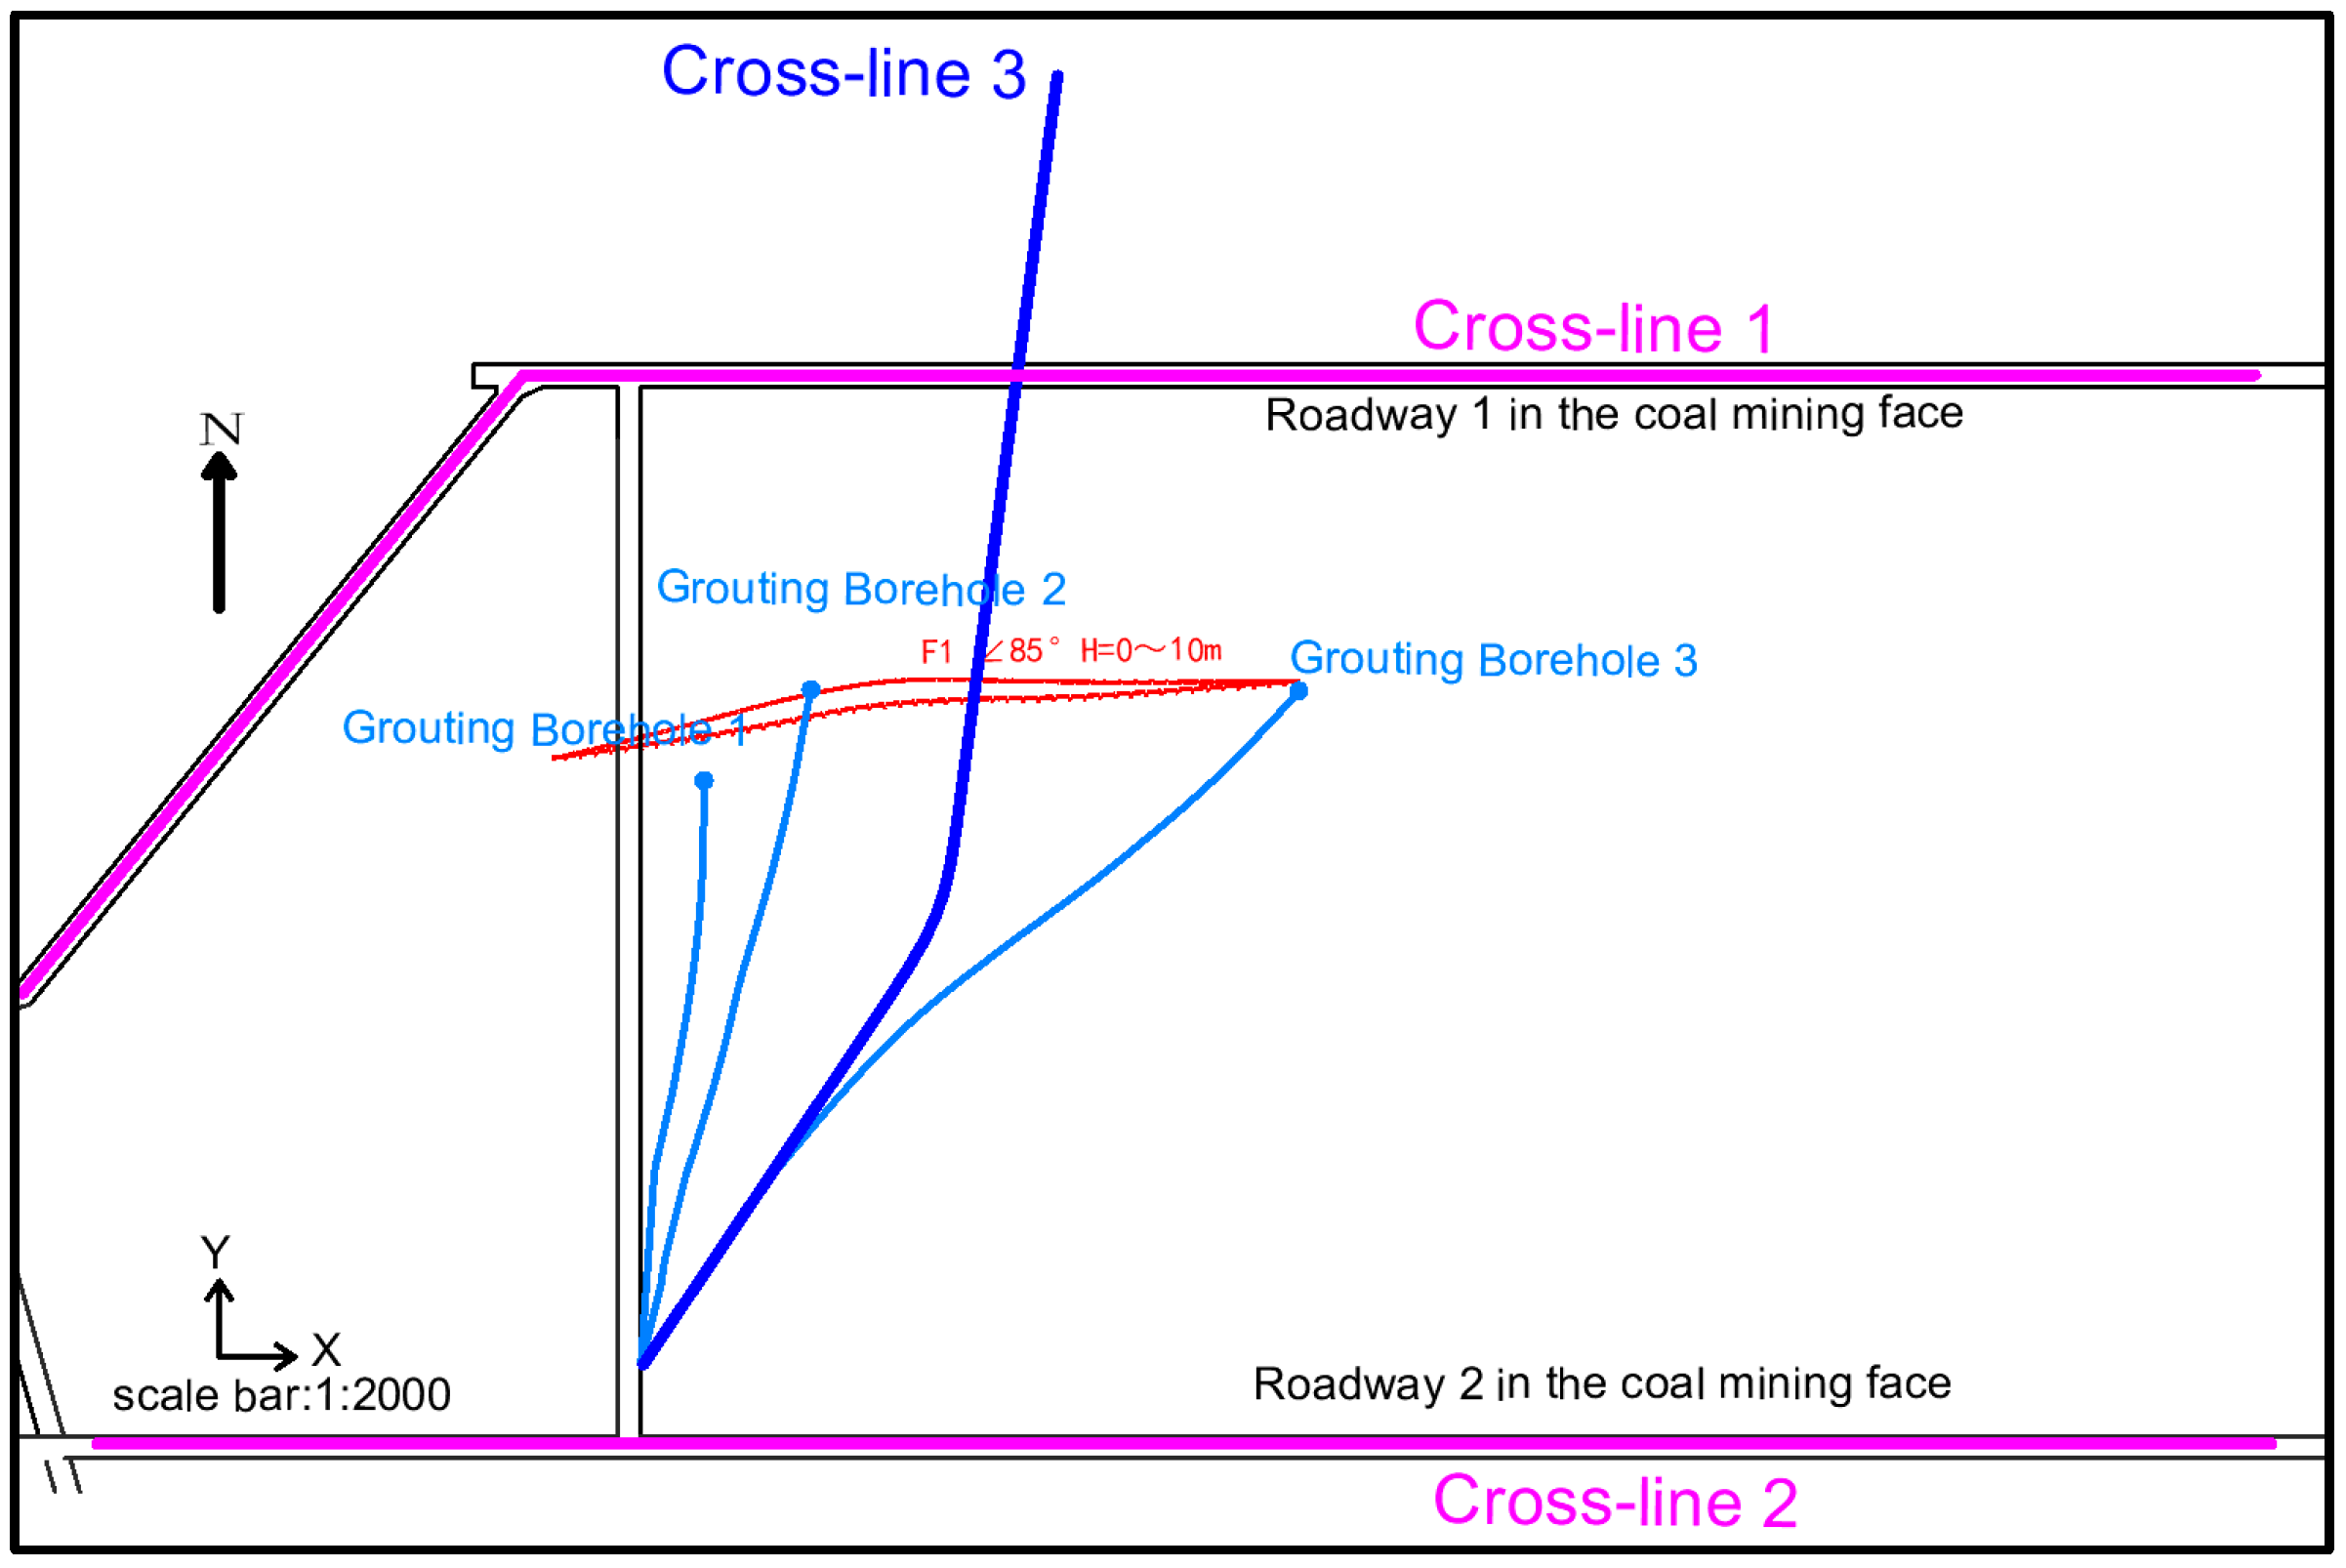
The monitoring focused on the F1 fault grouting zone. Two planar monitoring lines (Lines 1 and 2) were established in the coal face roadways to form a two-dimensional monitoring network. Line 1, deployed in Roadway 1, included 38 electrodes with 20 m spacing, spanning 1000 m. Line 2, in Roadway 2, consisted of 32 electrodes spaced 20 m apart over 640 m. To capture the three-dimensional diffusion of grout within fracture networks—unattainable with 2D configurations—a borehole monitoring line (Line 3) was added. Line 3, coupled to the borehole wall via drilling mud, incorporated 17 electrodes at 20 m intervals, covering 340 m. The hybrid 2D–3D system layout is illustrated in Figure 3.
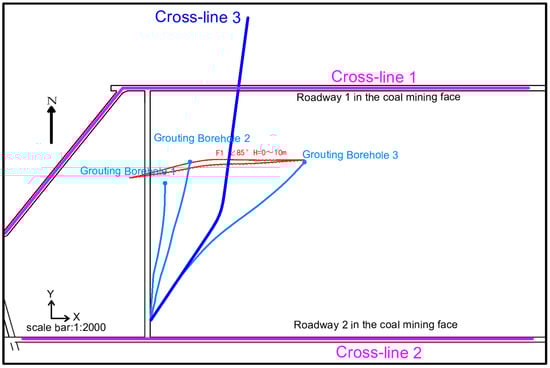
Figure 3.
Schematic diagram of the tunnel–borehole 3D cross-line layout.
A three-tiered acquisition system was employed: Line 1 served as the transmitter while Lines 2 and 3 acted as receivers, enabling cross-transmission data collection to enhance spatial resolution and fracture characterization.
The monitoring electrodes are strategically deployed in Working Face Entries 1 and 2. To optimize monitoring efficacy, steel electrodes must be driven into the floor strata. Electrode installation follows these specifications:
- (1)
- Spatial configuration: Positioned along the retreating side of entries, commencing from the face line towards the portal direction.
- (2)
- Geometric parameters: 30 cm length electrodes spaced at 20 m intervals, achieving ≥0.2 m embedment depth while maintaining ≥0.1 m protrusion above floor surface (Figure 4).
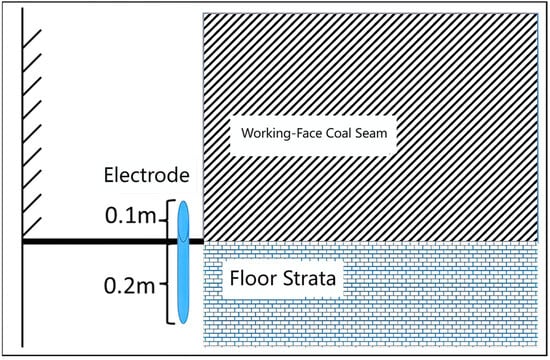 Figure 4. Cross-sectional schematic of entry electrode array.
When deploying cables in boreholes, the process involves three key technical considerations:
- (1)
- Electrode Configuration
The first step is to determine the connection method of the electrode string within the borehole. Exposed copper cylinders (with diameters larger than the cable’s outer diameter) can be installed at fixed intervals along a multi-core cable to serve as grounding media. Coupling with the borehole wall is achieved through water or mud injection.
- (2)
- Cable Parameter Optimization
Critical parameters—such as cable length, diameter, and spacing between electrodes—must balance detection range, data density, and deployment feasibility. Simulations and field tests indicate that an electrode spacing of 10–20 m optimizes data resolution and material efficiency, avoiding excessive core counts while maintaining detection accuracy.
- (3)
- Performance Requirements
The borehole cable must meet stringent specifications for pressure resistance, waterproofing, and tensile strength to withstand deployment challenges. A schematic of the borehole monitoring cable is illustrated in Figure 5.
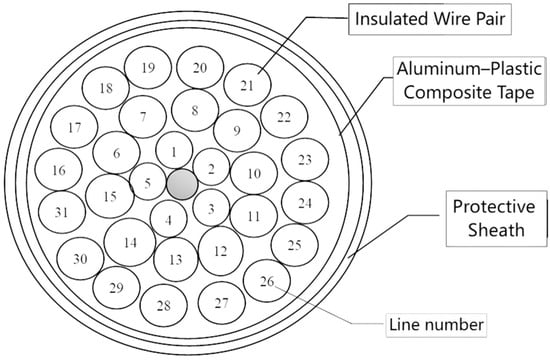
Figure 5.
Schematic cross-section of borehole electrode string.
The key challenge in downhole electrical monitoring technology lies in effectively deploying multi-core cables within deep boreholes. Current directional boreholes in coal mine roofs and floors typically have significant depths ranging from 300 to 800 m, rendering conventional manual shallow-hole pushing methods impractical and necessitating the development of specialized cable deployment techniques capable of reaching over 500 m. Drawing from existing long-hole cable installation technologies, the hydraulic propulsion system used in wireline coring demonstrates particular suitability. This optimized solution employs φ73 mm large-bore flush-joint drill pipes as delivery channels with modified auxiliary equipment, incorporating three critical innovations: The flush-joint wireline coring drill pipes enable hydraulic conveyors to maintain pressure integrity while minimizing frictional resistance within the drill pipes, thereby enhancing propulsion efficiency; specially designed coring bits ensure continuous advancement even through minor borehole collapses; a suspension mechanism guarantees secure fixation of the large-diameter cable at the borehole bottom post-deployment, preventing unintended cable retraction during drill pipe withdrawal. Additionally, specialized hydraulic adapters maintain stable water pressure throughout the entire cable installation process, ensuring consistent operational parameters. This integrated system engineering approach effectively addresses the technical constraints of ultra-long distance cable deployment in complex geological conditions, significantly advancing the practical application of downhole electrical monitoring in deep mining operations.
3.3. 3D Resistivity Inversion Algorithm
The acquired monitoring data undergo three-dimensional resistivity inversion imaging. The forward modeling component employs the finite volume method to discretize partial differential equations (PDEs), solved using a preconditioned biconjugate gradient stabilized (BiCGSTAB) algorithm [25]. The governing PDE for the forward problem is expressed as:
where represents the medium’s conductivity, is the electric potential, denotes the input current, and , are the positions of the positive and negative current sources, respectively. The Dirac delta function is defined as:
Rewriting Equation (1) in matrix form yields:
Here, D and G represent the three-dimensional divergence and gradient operators, respectively. is a diagonal matrix containing conductivity values, is the potential vector, is the forward operator, and q is the source vector encoding the positions of the positive and negative current sources. The potential u encompasses the electric potential values at every point within the entire 3D domain. However, the inversion process requires only a subset of u. To extract the necessary data points for inversion, a projection matrix Q is defined, leading to the final formulation of the forward problem:
For the inversion process, a quasi-Gauss–Newton method optimizes model fitting, with model updates computed via a preconditioned conjugate gradient (PCG) algorithm. Tikhonov regularization incorporates prior information to stabilize the ill-posed problem [26,27]. The objective function is formulated as:
Here, represents the measured data, specifically the observed voltage divided by the input current. denotes the simulated data obtained by forward modeling a given conductivity model. The second term in the equation is the Tikhonov regularization term, which incorporates prior information about the solution. The parameter acts as the regularization parameter, balancing the influence of data misfit and model regularization during minimization. W is the model regularization matrix, m is the inversion model parameterized as (where is conductivity), and is the reference model. The first term of the objective function ensures that the inverted model matches the observed data, while the second term imposes prior constraints (e.g., shape, structural continuity) on the final model.
The database of the monitoring system establishes an automated interaction with the processing software, enabling fully autonomous processing and interpretation without manual intervention. For 3D inversion using the processing software, users must input mesh generation parameters and an initial model. The grid size is typically determined by the electrode spacing, while the initial model is preferably a homogeneous model constructed from surrounding rock resistivity. Prior geological information about the inversion target and model weighting factors can be configured via input files, with default values set to 1 for both parameters. Error terms embedded in the data files enhance the software’s noise immunity. Additionally, inversion parameters, such as regularization coefficients (β), maximum iteration times (1–10), and convergence criteria, can be customized in the main program interface.
Extensive model simulations indicate that the selection of regularization parameter β and model weight W significantly influences inversion accuracy. Through empirical validation, β was uniformly set to 10 for the monitored area. Considering the attenuation of electric fields with depth, model weights were defined as W = 1/z, where z denotes the vertical distance from grid points to the coal seam floor (in meters).
Inversion computations are performed on an Intel Xeon Silver 4316 server (64 GB RAM; Intel Corporation, Santa Clara, CA, USA), with a full dataset requiring 30 min for completion and peak memory usage reaching 45 GB.
4. Results and Discussion
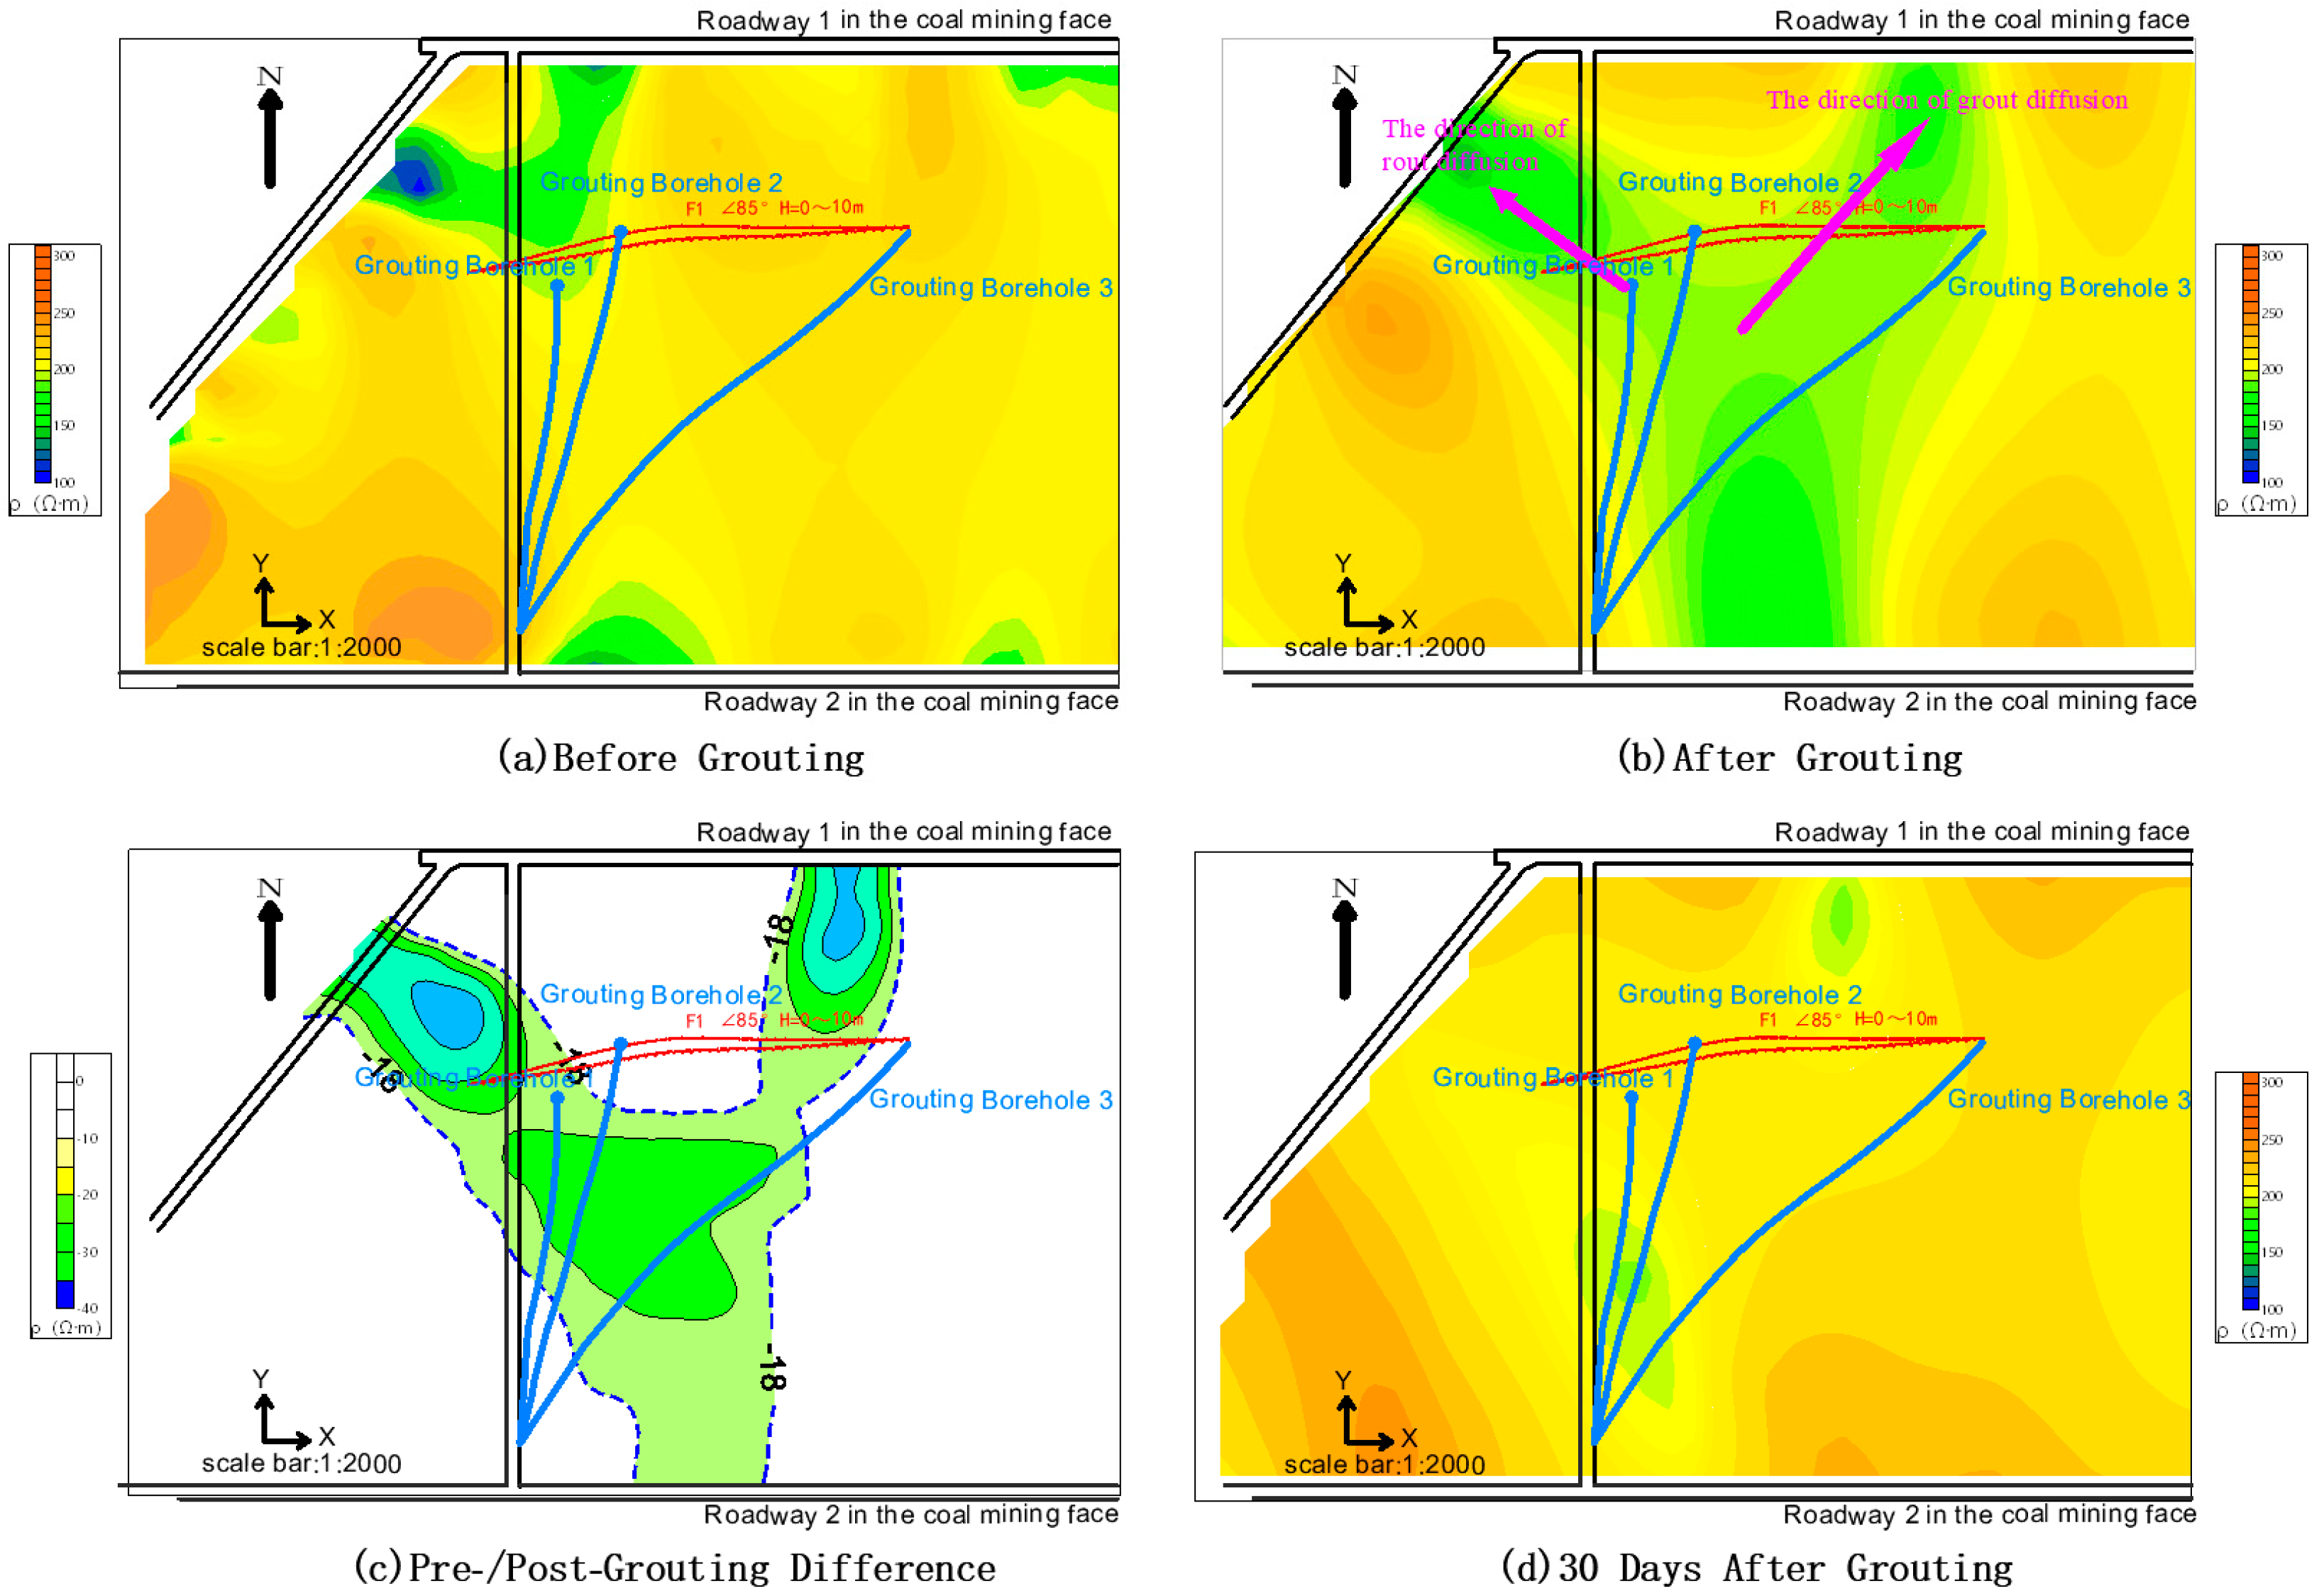
The grouting horizons of Boreholes 1, 2, and 3 are located 30 m below the tunnel. A grouting horizon plane was selected for analysis, as shown in Figure 4. Prior to grouting, the grouting horizon exhibited only minor low-resistivity anomalies near the tunnel, likely attributable to inherent differences in the formation’s electrical properties. After injecting 783 tons, 1515 tons, and 593 tons of grout into Boreholes 1, 2, and 3, respectively, post-grouting monitoring (Figure 6b) revealed a distinct Y-shaped low-resistivity anomaly near the boreholes. The injected grout, rich in free water during fracture filling, exhibited significantly lower resistivity compared to the surrounding rock. This process created interconnected conductive pathways through fracture networks, causing a rapid resistivity decline. Comparative inversion results show that the average resistivity of the grouting horizon dropped from a background value of 200 Ω·m to 180 Ω·m (approximately a 10% reduction), reflecting differential fracture development along the F1 fault. Under pressure-driven diffusion, the grout migrated preferentially along dominant fracture pathways, resulting in extensive resistivity reduction. Arrows in Figure 6b indicate high-connectivity fractures that facilitated grout propagation.
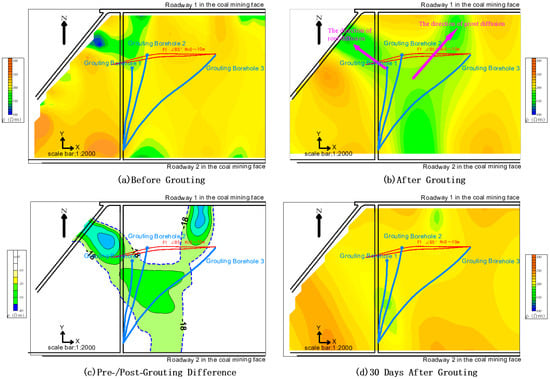
Figure 6.
Resistivity plan view of grouting horizons (30 m below tunnel) for Boreholes 1 and 2.
To clarify grout diffusion pathways and coverage, resistivity difference maps were generated by subtracting pre- and post-grouting inversion results (Figure 6c). Analysis reveals that grout from Borehole 1 likely propagated from the mid-section toward the borehole base, diffusing bilaterally with a left-upward bias. For Boreholes 2 and 3, grout migrated from the mid-sections (where basal fractures were underdeveloped), spreading laterally and concentrating between the two boreholes. The grout breached the structural block of the F1 fault and extended to Tunnel 1. Grout diffusion predominantly aligned with the maximum principal stress axis, forming angles of 15° and −20° relative to the tunnel axis, consistent with anisotropic fracture-controlled grout behavior.
Post-grouting resistivity recovery was observed over time (Figure 6d). As free water dissipated and cement hydration products formed denser structures, conductive pathways degraded, leading to gradual resistivity rebound. Thirty days after grouting, the average resistivity rose from a minimum of 180 Ω·m to approximately 220 Ω·m. However, recovery exhibited spatial heterogeneity: most areas (Y-shaped zone) returned to background or slightly higher resistivity due to complete grout solidification, while residual unset grout in marginal zones or areas influenced by adjacent boreholes maintained lower resistivity.
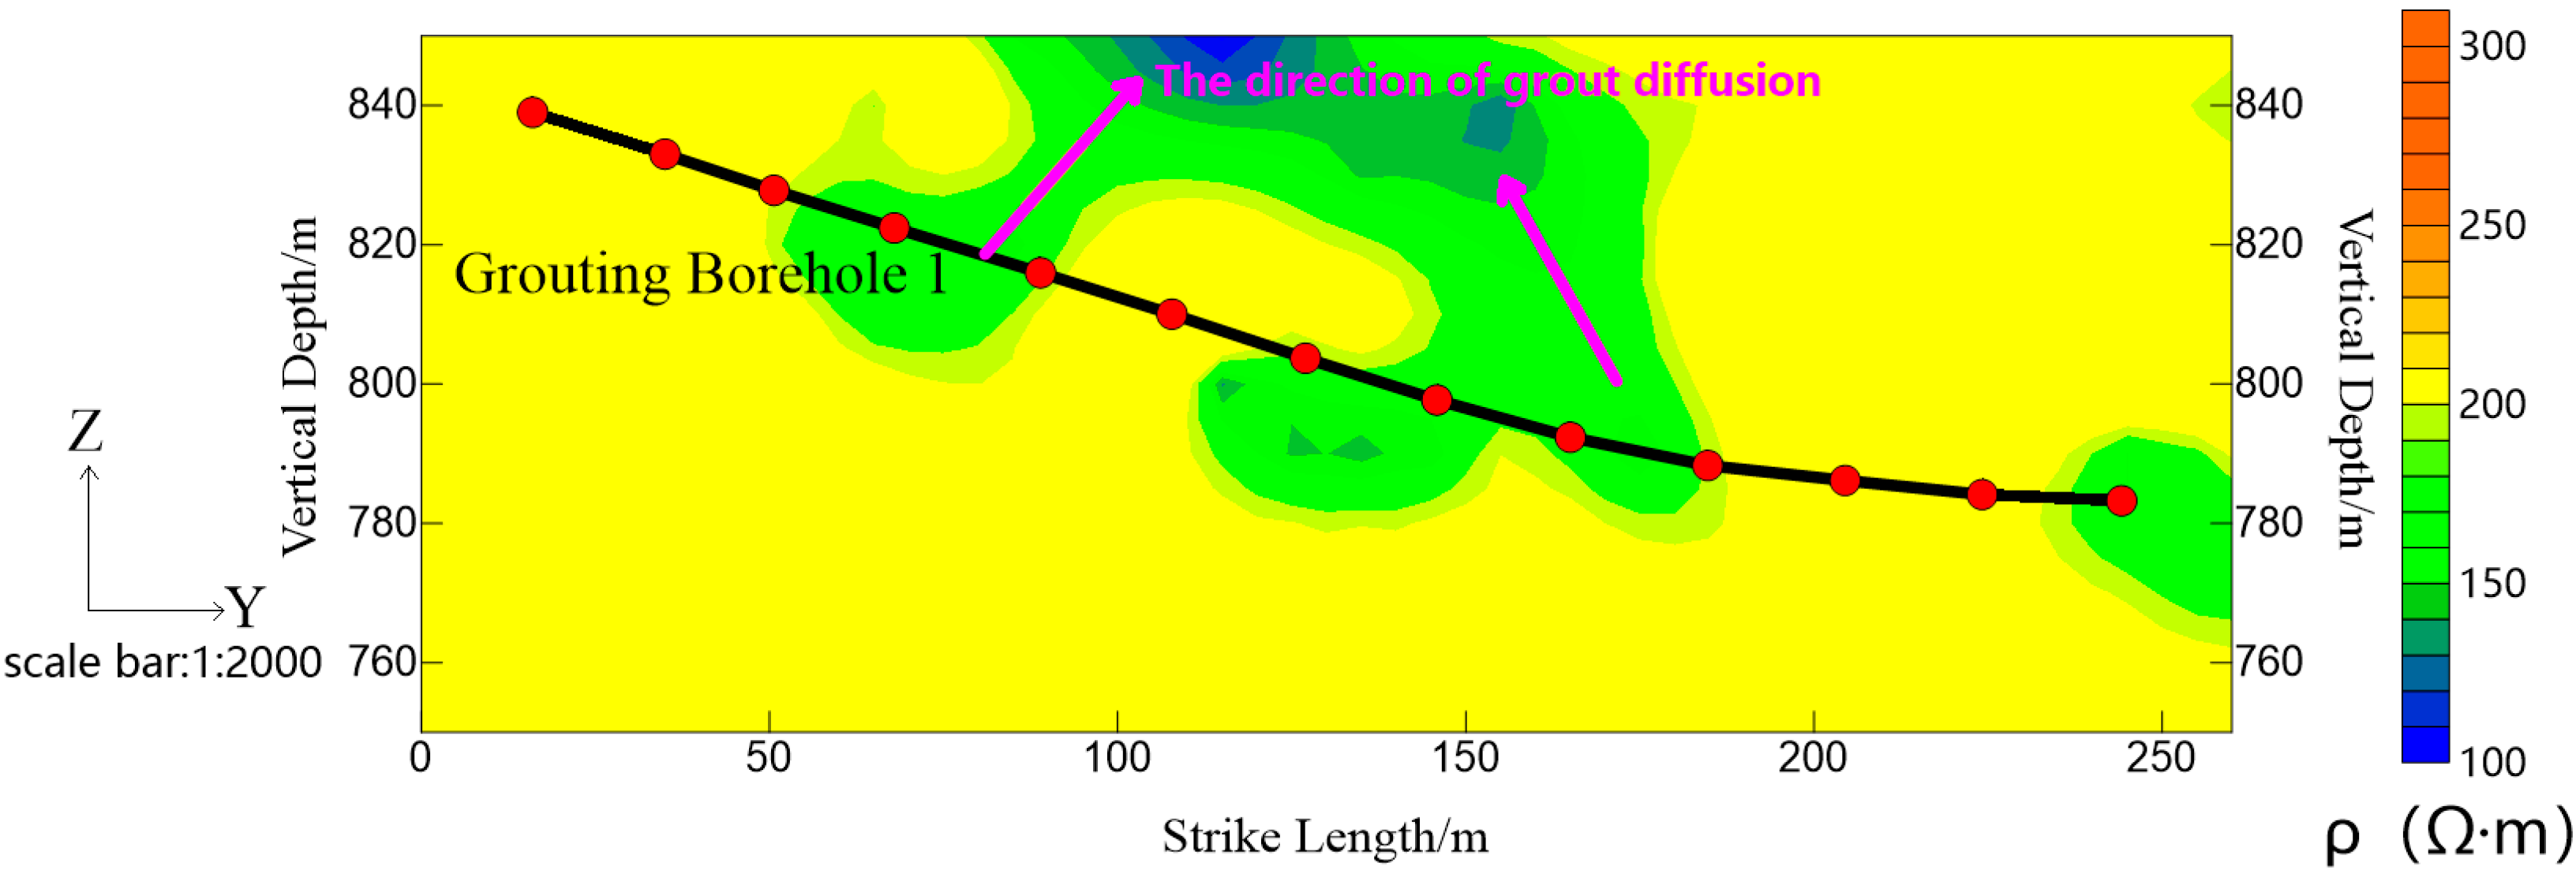
Real-time monitoring data from Tunnel Survey Lines 1 and 2 provided insights into lateral grout diffusion but lacked vertical resolution. The newly deployed tunnel–borehole 3D cross-line survey (Figure 7) addresses this gap. Revised analysis shows grout from Borehole 1 primarily diffused from the mid-section (50–180 m depth), accumulating minimally at the borehole base and migrating upward. This suggests fault-induced fractures are shallow, with no connectivity to deeper aquifers, see Table 3.
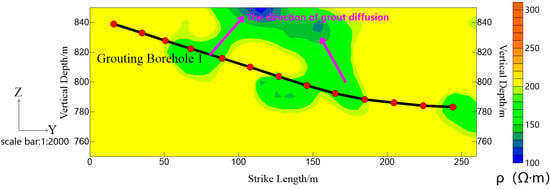
Figure 7.
Resistivity profile of grout diffusion distribution.
Table 3.
Changes in resistivity and diffusion range during grouting monitoring.
5. Conclusions
In the field of coal mine grouting engineering, we have innovatively developed a tunnel–borehole 3D cross-line monitoring system to achieve precise, comprehensive oversight of grouting processes. By strategically deploying survey lines in tunnels and boreholes, this system constructs a multi-layered, spatially integrated observation network. Coupled with real-time 3D resistivity inversion technology, it dynamically visualizes grout diffusion patterns and trajectories in subsurface spaces. This combination breaks through the temporal and spatial limitations of traditional grouting detection, successfully achieving full-dimensional transparent monitoring of the coal mine grouting process. The transition from 2D profiles to 3D datasets enhances vertical resolution, allowing accurate delineation of grout spatial distribution. When suitable horizontal directional drilling survey lines are unavailable, the vertical accuracy may decrease. Meanwhile, integrating this technology with microseismic monitoring to enhance inter-borehole resolution represents a promising future research direction.
Real-time dynamic monitoring shows that during the grouting of the F1 fault, the grout diffused along the principal stress axis, forming a “Y”-shaped low-resistivity anomaly zone and breaking through the fault structural block to create a continuous water-resisting barrier. The spatial displacement of grout expansion monitored by this technology, combined with parameters, such as grouting pressure and grout injection volume, provides a quantitative basis for dynamic regulation of grouting pressure. After more than 30 days of continuous monitoring, it was captured that water gradually separated from the grout, cement hydration products formed a dense structure, conductive pathways were disrupted, and resistivity increased. No new low-resistivity anomaly zones were detected, providing a basis for grouting evaluation.
This technology provides a novel solution for evaluating grouting reinforcement effectiveness and preventing water inrush disasters under complex geological conditions. Additionally, it can be applied to the monitoring of roof and floor strata failure during coal mining, as well as grouting monitoring in engineering projects, such as highways and railways.
Author Contributions
Conceptualization, methodology, C.W.; writing—review and editing, L.Z.; project administration, L.Y.; software, B.L. All authors have read and agreed to the published version of the manuscript.
Funding
This study was funded by the National Natural Science Foundation of China (42274103).
Institutional Review Board Statement
Not applicable.
Informed Consent Statement
Not applicable.
Data Availability Statement
The original contributions presented in this study are included in the article. Further inquiries can be directed to the corresponding author.
Conflicts of Interest
Authors Cheng Wang and Bofan Li were employed by the company CCTEG Xi’an Research Institute (Group) Co., Ltd. The remaining authors declare that the research was conducted in the absence of any commercial or financial relationships that could be construed as a potential conflict of interest.
References
- Hu, W.Y. Current Status and Research Directions of Geological Safety Assurance Technologies for Deep Coal Mining. Coal Sci. Technol. 2013, 41, 1–5+14. [Google Scholar]
- Yin, S.X.; Wang, Y.; Yin, H.C.; Xu, B.; Wang, T.; Yang, J.; Tian, W.; Xu, W.; Cao, M. Water Inrush Mechanism and Integrated Spatio-temporal Prevention Technology for Deep Floor Ordovician Limestone Aquifer in Coal Mines. J. China Coal Soc. 2020, 45, 1855–1864. [Google Scholar]
- Dong, S.N.; Fan, M.; Guo, X.M.; Liu, Y.; Guo, K.; Ji, Z.; Li, C.; Xue, X. Characteristics and Control Technologies of Typical Water Disaster Hazards in Shaanxi Province Coal Mines. J. China Coal Soc. 2024, 49, 902–916. [Google Scholar]
- Cui, Y.; Zou, D.H. Numerical simulation of attenuation and group velocity of guided ultrasonic wave in grouted rock bolts. J. Appl. Geophys. 2006, 59, 337–344. [Google Scholar] [CrossRef]
- Huang, Y.; Yang, W.; Li, Y.; Guo, W. Spatial distribution characteristics of plastic failure and grouting diffusion within deep roadway surrounding rock under three-dimensional unequal ground stress and its application. Minerals 2022, 12, 296. [Google Scholar] [CrossRef]
- Li, J.; Xuan, D.; Xu, J.; Dong, Z.; Wang, C. Compaction response of mining-induced rock masses to longwall overburden isolated grouting. Minerals 2023, 13, 633. [Google Scholar] [CrossRef]
- Wang, R.; Zan, Z.H. Research on testing method for grouting effect in karst caves based on drilling coring and high-density electrical method. Chin. J. Undergr. Space Eng. 2024, 20, 2054–2059. [Google Scholar]
- Mu, X.R.; Huang, X.G. Study on ultrasonic detection of grouting effect. J. China Coal Soc. 1995, 20, 298–303. [Google Scholar]
- Li, Y.; Li, B.; Yao, S.; Yao, B.H. Quantitative study on grouting plugging effect of loaded fractured coal sample based on CT scanning. J. Mine Autom. 2022, 48, 53–59. [Google Scholar]
- Ren, S.T. Inspection method for grouting effect of leakage points in surface area treatment of coal mines. Coal Chem. Ind. 2022, 45, 76–79. [Google Scholar]
- Gao, H.K.; Wang, Q.; Li, S.C.; Wang, Y.; Jiang, Z.H.; Jiang, B. Experimental study on in-drilling evaluation of grouted rock mass strength. J. Min. Saf. Eng. 2021, 38, 326–333. [Google Scholar]
- Hu, S.Y.; Liu, Q.S.; Li, S.H. Advance and review on grouting critical problems in fractured rock mass. Coal Sci. Technol. 2022, 50, 112–126. [Google Scholar]
- Jiang, C.L.; Jiang, Z.Q.; Liu, S.D.; Sun, Q.; Yang, C. Experimental study on apparent resistivity variation during chemical grouting in porous rocks. J. Cent. South Univ. 2013, 4, 4202–4207. [Google Scholar]
- Liu, X.M.; Liu, S.C.; Jiang, Z.H.; Jiang, X.F.; Yang, G. Effects of weighted smoothing factor in 3D resistivity inversion and application in grouting detection. J. China Univ. Min. Technol. 2013, 42, 88–92. [Google Scholar]
- Sun, Q.H.; Lou, J.; Hu, X.; Gu, C.; Sun, Q.; Zhang, W.Q. Study on grouting effect of fly ash in fractured rock mass based on resistivity response. China Coal 2024, 50, 33–39. [Google Scholar]
- Chen, J.T.; Li, W.X.; Xue, F.; Wang, K.; Zhang, C.; Song, T. Comprehensive evaluation of TOPSIS-RSR grouting effect based on subjective and objective combined weights. Coal Sci. Technol. 2023, 51, 191–199. [Google Scholar]
- Yuan, S.C.; Zhang, G.L.; Sun, B.T.; Han, G.L.; Wang, Z.X. Mining effects of grouted-rock composite of grout curtains based on optical fiber and microseismic monitoring systems: A case study of the Maoping lead-zinc mine in Northeast Yunnan, China. J. China Univ. Min. Technol. 2024, 53, 1022–1036. [Google Scholar]
- Lee, H.; Oh, T.M.; Lee, J.W. Evaluation of grout penetration in single rock fracture using electrical resistivity. Geomech. Eng. 2021, 24, 1–14. [Google Scholar]
- Feng, S.; Zhao, Y.; Wang, Y.; Wang, S.; Cao, R. A comprehensive approach to karst identification and groutability evaluation—A case study of the Dehou reservoir, SW China. Eng. Geol. 2020, 269, 105529. [Google Scholar]
- Suzuki, K.; Oyama, T.; Kawashima, F.; Tsukada, T.; Jyomori, A. Monitoring of grout material injected under a reservoir using electrical and electromagnetic surveys. Explor. Geophys. 2010, 41, 69–79. [Google Scholar] [CrossRef]
- Farooq, M.; Park, S.; Song, Y.S.; Kim, J.H.; Sabir, M.A.; Umar, M. Application of electrical resistivity method to evaluate the extent of mortar infiltration in subsurface cavities. Arab. J. Sci. Eng. 2013, 38, 111–120. [Google Scholar] [CrossRef]
- Belhadj, A.; Chouicha, K.; Kahlouche, S.; Gourine, B. Multi-sensor data fusion with AI-RBFN in settlement surveillance of embankment dams: Application to a rockfill dam in Algeria. J. Civ. Struct. Health Monit. 2023, 13, 1151–1170. [Google Scholar] [CrossRef]
- Landar, S.; Velychkovych, A.; Ropyak, L.; Andrusyak, A. A Method for Applying the Use of a Smart 4 Controller for the Assessment of Drill String Bottom-Part Vibrations and Shock Loads. Vibration 2024, 7, 802–828. [Google Scholar] [CrossRef]
- Saadeldin, R.; Gamal, H.; Elkatatny, S. Detecting downhole vibrations through drilling horizontal sections: Machine learning study. Sci. Rep. 2023, 13, 6204. [Google Scholar] [CrossRef]
- Jin, D.W.; Zhao, C.H.; Duan, J.H.; Qiao, W.; Lu, J.; Li, P.; Zhou, Z.; Li, D. Research on 3D monitoring and intelligent early warning system for water hazard of coal seam floor. J. China Coal Soc. 2020, 45, 2256–2264. [Google Scholar]
- Lu, J.J.; Wang, B.C.; Li, D.S.; Duan, J. Application of mine-used resistivity monitoring system in working face water disaster control. Coal Geol. Explor. 2022, 50, 36–44. [Google Scholar]
- Lu, J.J. 3D electrical resistivity inversion and imaging technology for coal mine water-containing/water-conductive structures. J. China Coal Soc. 2016, 41, 687–695. [Google Scholar]


Disclaimer/Publisher’s Note: The statements, opinions and data contained in all publications are solely those of the individual author(s) and contributor(s) and not of MDPI and/or the editor(s). MDPI and/or the editor(s) disclaim responsibility for any injury to people or property resulting from any ideas, methods, instructions or products referred to in the content. |
© 2025 by the authors. Licensee MDPI, Basel, Switzerland. This article is an open access article distributed under the terms and conditions of the Creative Commons Attribution (CC BY) license (https://creativecommons.org/licenses/by/4.0/).