Article

UV-Induced Aging in Thermochromic Pigment-Integrated Food-Grade Polymers: A Performance Assessment

by
Colette Breheny
*,
Declan Mary Colbert
,
Gilberto Bezerra
,
Joseph Geever
and
Luke M. Geever
*
Polymer, Recycling, Industrial, Sustainability and Manufacturing (PRISM) Research Institute, Technological University of the Shannon, University Road, N37 HD68 Athlone, Ireland
*
Authors to whom correspondence should be addressed.
Appl. Sci. 2025, 15(11), 6039; https://doi.org/10.3390/app15116039
Submission received: 24 April 2025 / Revised: 22 May 2025 / Accepted: 26 May 2025 / Published: 27 May 2025
(This article belongs to the Special Issue Latest Developments in Food Safety and Food Contamination)

Abstract

:

Featured Application

This study supports the development of durable thermochromic packaging materials capable of withstanding prolonged indoor and outdoor light exposure. The findings provide practical guidance for optimizing pigment loading and UV stabilization strategies in intelligent food packaging, ensuring long-term color functionality and mechanical reliability across extended product lifetimes.

Abstract

Food contact polymers require thermochromic pigments to provide temperature-sensitive visual cues for consumer safety and product integrity. However, their susceptibility to ultraviolet (UV) degradation limits long-term application. This study investigates the UV resistance of food-grade thermochromic polypropylene blends under simulated indoor and outdoor UV exposure for 500 and 1000 h. Visual properties, colorimetric (CIE L*a*b*) measurements, mechanical testing (tensile and impact), and mass variation analysis were performed to assess photostability and material integrity. Exposure to UV led to progressive discoloration (ΔE*ab up to 34.07) and significant mechanical deterioration. Tensile strain at break decreased by 48.67%, and notched impact strength dropped by 44.15% after 1000 h of UV exposure. No measurable mass loss occurred, indicating degradation was confined to surface-level oxidation rather than bulk material erosion or leaching. These findings highlight the need for optimal pigment loading and UV stabilization to extend the shelf life of thermochromic food packaging materials in light-exposed storage and retail environments. The study offers a framework for improving the long-term reliability of smart packaging in the food industry. This work uniquely integrates optical, mechanical, and mass loss analyses to evaluate thermochromic packaging degradation under extended UVA exposure.

1. Introduction

Food packaging is necessary to safeguard food within the distribution chain from the producer to the customer [1]. Many forms of food packaging exist, including tertiary, secondary, and primary packaging [2]. Various packaging materials preserve the food, including cardboard, plastic, metals, and glass [3]. Consumers are looking for inexpensive disposable packaging that can be frozen, microwaved, and easily disposed of [4]. Plastic remains one of the most popular forms of food packaging [5]. The projected global plastic use by 2050 is 500 million tons, with single-use products accounting for the majority, driven by continued growth in plastic consumption [6]. Plastic is strong, affordable, and lightweight [7]. However, concerns exist over its sustainability [8]. In addition, there has been a push for packaging that can prolong the shelf life of food [9].
Thermochromic materials belong to a class of chromogenic substances that exhibit color shifts in reaction to specific external stimuli such as temperature (thermochromism), light (photochromism), or electricity (electrochromism) [10]. Among these, thermochromic systems—particularly those based on leuco dyes or liquid crystals—have gained traction in food packaging due to their responsiveness to subtle temperature changes and ability to communicate spoilage risk visually [11]. The color-changing properties of thermochromic pigment (TP) masterbatches, when added to polymer matrices, make them suitable for rigid and flexible packaging across a broad spectrum of polymer materials and forming processes [12]. Applications such as dairy products, frozen dinners, and pre-cooked meals—where temperature sensitivity is crucial—can particularly benefit from the use of TPs [13]. Real-world applications of thermochromic pigments in packaging include temperature-sensitive time–temperature indicators (TTIs) for dairy [14] and meat products [15], freshness indicators that respond to cumulative heat exposure in seafood packaging [16], and irreversible cold chain monitors for frozen goods [17]. These intelligent systems visually signal temperature abuse, spoilage risk, or compromised storage conditions, enhancing food safety and consumer confidence.
Although thermochromic polymers are innovative, their environmental resilience is inherently limited [18]. Ultraviolet (UV) radiation can degrade organic materials through photochemical processes, leading to chain scission, oxidation, discoloration, and a loss of mechanical properties in polymers [19]. When TPs are exposed to UV radiation, the thermochromic phase transition may deteriorate, dye fading may occur, and encapsulation integrity may be compromised [20]. This is particularly troublesome in food packaging applications where thermochromic indicators must remain visible to consumers and functional throughout the product’s shelf life [21]. Many TP formulations use microencapsulated leuco dyes that are especially sensitive to photodegradation, which can be triggered even under moderate UV levels found in indoor lighting or direct sunlight [22].
There are several restrictions on the use of TPs in food contact packaging applications. In addition to maintaining optical clarity, preventing chemical component migration into food, and complying with safety regulations, these materials must demonstrate precise and reversible thermochromic activity [23]. Repeated exposure cycles to light [24], temperature fluctuations [25], and mechanical stress [26] can gradually decrease TP performance. Additionally, there are more significant restrictions on the types of polymers and additives that can be used with thermochromic systems, as packaging materials are increasingly being made to be recyclable or biodegradable [27]. As a result, there is a growing need for rigorous evaluation of the environmental stability of thermochromic polymers under realistic operating conditions.
Regulatory acceptance of thermochromic pigments in food contact plastics remains limited across jurisdictions. In the European Union, these materials fall under Regulation (EC) No. 1935/2004 [28] and Commission Regulation (EU) No. 10/2011 [29], requiring all components—including pigments and encapsulants—to be either authorized substances or proven to comply with migration and toxicological safety criteria. In the United States, components must be approved under relevant FDA 21 CFR sections or through Food Contact Notifications (FCNs). The proprietary nature of many thermochromic systems, particularly those involving microencapsulated leuco dyes, presents regulatory hurdles due to incomplete disclosure of chemical composition. Because these additives are usually left in the polymer matrix and not eliminated during reprocessing, mechanical recycling could be more difficult. In closed-loop applications, leftover pigments might impact recycled materials’ look, thermal characteristics, or compliance if separation or stabilization processes are used. Recyclability and regulatory compatibility remain key challenges limiting the widespread adoption of thermochromic food packaging systems.
Exposure to UV light in indoor and outdoor settings may impact the structural and functional integrity of plastic food packaging [30,31,32,33]. External UV exposure commonly occurs during transportation, storage, and especially retail display—particularly when products are placed near windows, under fluorescent or LED lighting, or in open-air markets exposed to sunlight [34]. Internally, UV exposure may occur in food processing and packaging facilities where UV sterilization is used for hygiene control [35] or from UV-emitting light sources within refrigerators, display cases, or vending machines [36]. Prolonged exposure to UV light can weaken the polymer chains in plastic, resulting in embrittlement, staining, loss of barrier properties, and photofading or reduced responsiveness of functional additives such as thermochromic pigments [37,38]. This underscores the importance of UV resistance in plastic packaging materials for long-term use or light-sensitive applications.
UV light is the electromagnetic spectrum’s 200–400 nm region. Short-wave UV light (UVC) is between 200 and 280 nm, medium-wave UV light (UVB) is between 280 and 320 nm, and long-wave UV light (UVA) is between 320 and 400 nm [39]. The wavelengths at which light is released from gas discharge depend on the excitation, ionization, and kinetic energy of the constituent elements and the gas itself [40]. A mixture of excited and non-excited atoms, cations, and electrons produced by applying a high voltage across a gas volume is known as gas discharge [41]. UV light has great promise for the food processing industry as an alternative to conventional thermal processing [42]. It can be used to pasteurize juices, sanitize food contact surfaces, extend the shelf life of fresh products, and provide post-lethality treatment for meats, ensuring safety after cooking [43].
Previous studies have addressed recyclability [44], chemical resistance [45], and mechanical behavior of thermochromic materials in food contact environments. However, little information exists on the photostability of TPs [46]. The processes of UV degradation are well-established in polymer science [47,48,49]. They typically involve chromophores within the polymer or dye molecule absorbing high-energy UV photons, which initiate free radical reactions that irreversibly alter the chemical structure [50]. Even minor structural defects or impurities can act as initiation sites in semicrystalline polyolefins such as polypropylene [51]. UV photon absorption leads to excited-state formation, generating alkyl or peroxy radicals in the presence of oxygen [52]. These radicals propagate degradation through hydrogen abstraction and oxidation reactions, resulting in chain scission, crosslinking, and the formation of carbonyl and hydroxyl groups on the surface [53]. In TPs, this may lead to loss of thermochromic reversibility, loss of overall color, and complete failure of the indicator functionality. Thermochromic pigment systems, particularly microencapsulated leuco dyes, are especially vulnerable—UV exposure can disrupt the internal dye–developer–solvent equilibrium, degrade capsule walls, or decompose active dye species [54]. Adding UV stabilizers or protective coatings could help reduce the impact of UV on TPs [55].
Adding TPs into plastic food contact packaging has the potential to reduce both food and packaging waste while enhancing food safety. However, the vulnerability of TPs to UV-induced degradation remains a barrier to large-scale commercialization. This study aims to close the gap between practical, long-lasting packaging solutions and laboratory-scale thermochromic compositions by systematically evaluating the UV resistance of TPs in food contact polymer packaging. To simulate prolonged UV exposure, thermochromic materials were subjected to controlled photodegradation processes in accelerated aging chambers. The optical properties and mechanical strength of the samples were analyzed to assess variations in thermochromic activation, color fastness, and material degradation.
Thus, the findings of this study are expected to inform the design and formulation of more robust thermochromic packaging systems that are capable of withstanding real-world environmental conditions. These insights will contribute to the advancement of innovative packaging solutions by guiding manufacturers, researchers, and regulatory bodies looking to incorporate intelligent materials into high-performance, environmentally friendly packaging systems. While prior research has explored thermochromic polymers in packaging, few studies have quantitatively addressed their environmental durability under real-world UV exposure conditions. The novelty of this research lies in its integrated evaluation of colorimetric (ΔE*ab, RGB), mechanical (tensile, impact), and mass variation responses to prolonged UVA irradiation. This multifaceted assessment enables the identification of degradation mechanisms and practical thresholds relevant to packaging design. The findings offer innovative direction for tailoring pigment concentrations and stabilization strategies to improve long-term performance in indoor and outdoor retail settings.

2. Materials and Methods

2.1. Materials

Ross Polymer (Athlone, Ireland) supplied a nucleated, food-grade polypropylene (PP) identified as Moplen HP548R (LyondellBasell, London, UK), with a molecular weight of 26,000 g/mol and a density of 0.9 g/cm3. The supplier confirmed the material’s compliance with food contact regulations.
The thermochromic pigment (ThermoBatchTM, Glenview, IL, USA) was sourced in pellet form from SpotSee®/LCR Hallcrest Ltd. (Chester, UK). It featured a reversible activation temperature of 41 °C and a pellet density of 0.508 g/cm3.
Unless otherwise stated, mechanical and optical tests were performed at 23 °C ± 2 °C under standardized laboratory conditions. The test procedures followed ISO 179-1:2023 [56], ISO 527-2:2012 [57], and other applicable norms to ensure reproducibility and compliance.

2.2. Preparation of Thermochromic Polyproplyene Blends

To ensure uniform dispersion, binary blends comprising polypropylene (PP) as the base polymer and thermochromic pigment (TP) as the functional additive were dry-blended by hand. Component weights were measured using a Sartorius LA230P analytical balance (±0.0001 g precision, Sartorius, Dublin, Ireland). The thermochromic masterbatch (ThermoBatch™) included a compatible polymeric carrier designed for miscibility with the PP matrix. All the samples were conditioned at 23 °C for 24 h before testing to promote consistency across replicates. The compositions of the prepared thermochromic blends are summarized in Table 1.

2.3. Injection Molding

Injection molding involves heating a polymer until it is molten and injecting it into a mold cavity, which cools and solidifies into the desired shape [58]. Shear heat generated by friction between the material, the screw, and the interior of the barrel, along with heat from five external heating bands, was used during the injection molding process to melt the material. The molten polymer was then injected into a mold, which solidified into the desired shape as the mold cooled. In this study, the injection molding process followed ISO 294-1:2017 [59], with the formulations from Table 1 molded using an Arburg Allrounder 370E 600 E drive system (Arburg, Lossburg, Germany). A “two by two” family mold equipped with a double-T runner was used to simultaneously produce two tensile (type B1) and two impact (type A1) test pieces. The injection unit had a 30 mm screw diameter, a calculated stroke volume of 85 cm3, and a clamping force of 600 kN.
The barrel heating profile progressed from 170 °C at the feed zone to 210 °C at the nozzle, regulated by four zone heaters plus a separate nozzle controller. A 35 s cooling time was applied, with an injection pressure of 750 bar, a holding pressure of 400 bar, and an injection speed of 80 mm/s. Mold temperature was maintained at 30 °C using a Piovan Technologies THM 120/EN unit (JL Goor, Wicklow, Ireland), with a shot size of 52 g. Tensile test specimens conformed to ISO 527-2:2012 [57] (type 1BA), and Charpy impact specimens (ISO 179-1:2023 [56]) were notched with a Type A V-notch specimen (type A1, direction of blow edgewise).

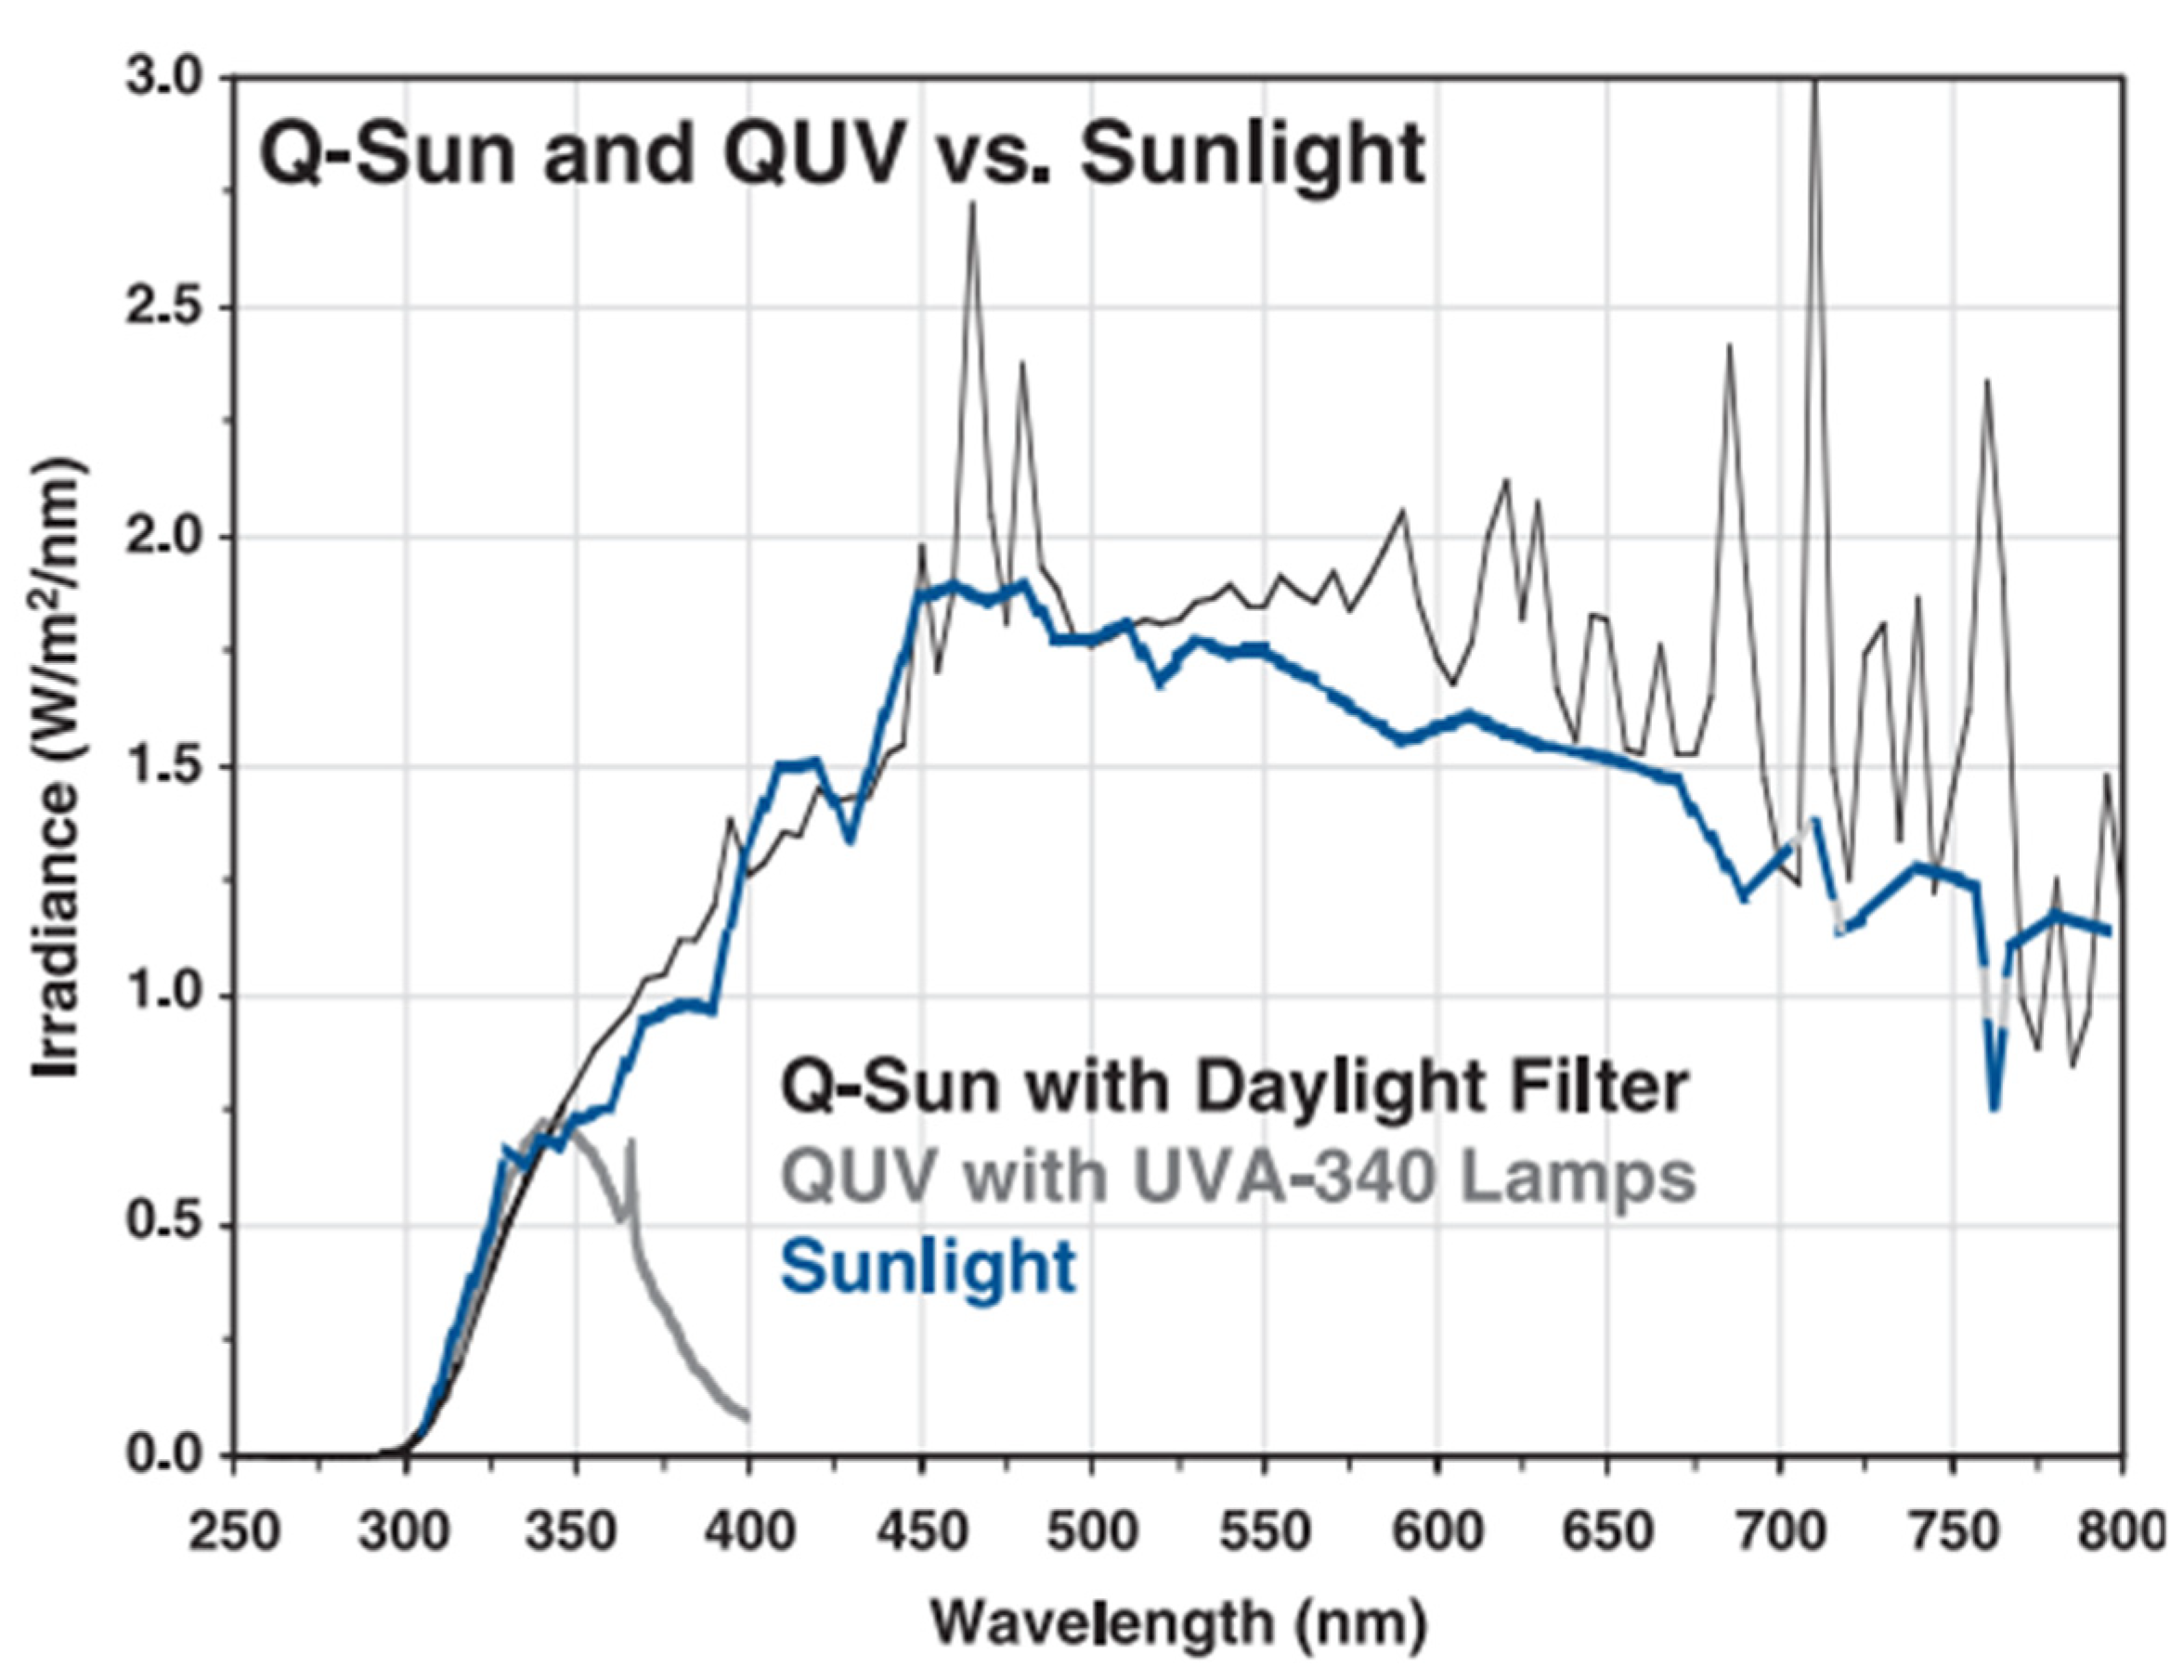
2.4. UV Exposure Protocol

UV exposure refers to the exposure of materials or biological systems to UV radiation, a portion of the electromagnetic spectrum with wavelengths shorter than visible light but longer than X-rays [60]. To evaluate the UV resistance of the thermochromic polymer blends, each blend was exposed to simulated indoor and outdoor conditions representative of typical food contact conditions (Table 2).
Indoor light exposure, mimicking retail display lighting, was simulated using an RS 559-934 UV exposure unit (RS Components Ltd., Northamptonshire, UK), which emits UVA radiation centered around ~360 nm. The spectral output aligns with the emission profile of standard fluorescent lighting, commonly used in commercial settings, and is known to emit low-level UVA. Although the irradiance is lower than full-spectrum sunlight, this UVA range can induce photofading and thermochromic degradation in color-sensitive materials. This setup allowed for assessing the stability of pigments and polymers under extended indoor lighting conditions for 500 and 1000 h.
Outdoor exposure was simulated using a QUV/Solar Eye (SE) accelerated weathering tester (Q-Lab Corporation, Bolton, UK), which operated at 0.72 W/m2 at 340 nm. The system used UVA-340 lamps with Solar Eye® irradiance control to maintain consistent UV intensity throughout the exposure.
UV-accelerated aging of polymer specimens was conducted according to ISO 4892-3 [61] using fluorescent UVA lamps UVA-340 and UVA-360 in QUV/Solar Eye and RS 559-934 devices, respectively. Following UV exposure, the samples were conditioned at 23 °C for 24 h under controlled laboratory conditions prior to subsequent analysis. Figure 1 shows the spectral distribution of the UVA-340 lamps used in the QUV/Solar Eye device to validate the fidelity of the UVA exposure setup. The plot confirms that the UVA-340 lamp spectrum closely matches the UV portion of natural sunlight (295–365 nm), which is essential for simulating realistic outdoor aging conditions in accelerated testing.

2.5. ATR-FTIR Analysis (Pre-Exposure)

ATR-FTIR qualitatively identifies structural molecules by transmitting infrared light through a sample, producing absorption at specific frequencies [63]. This technique was used on the thermochromic pigment masterbatch (ThermoBatch™) to determine the nature of the carrier polymer used in the additive system. This was performed to verify material compatibility with the PP matrix, ensure consistent interpretation of pigment dispersion behavior, assess material compatibility with the PP matrix, and confirm pigment dispersion characteristics [64,65,66].
ATR-FTIR was performed using a PerkinElmer® Spectrum One FT-IR Spectrometer fitted with a universal ATR sampling accessory (PerkinElmer®, Waltham, MA, USA). All data were recorded at 23 °C in the spectral range of 4000–650 cm−1, utilizing 16 scans per sample cycle and a fixed universal compression force of 80 N. Subsequent analysis was carried out using PerkinElmer® Spectrum software, version 10.4.3 (PerkinElmer®, MA, USA), which allows for qualitative spectrum data and the generation of custom reports. The spectra from each material were overlaid with peaks of interest labeled along the spectrum. Similar peaks were isolated and analyzed to conclude the results.

2.6. Visual Inspection of the Surface Area

Visual observations were performed at 0, 500, and 1000 h of UVA exposure to assess changes in specimen characteristics under indoor-simulated (RS 559-934) and outdoor-simulated (QUV/Solar Eye) UV conditions. Each sample was photographed using a Canon EOS 90D DSLR (Canon Europa, Amstelveen, The Netherlands) paired with a fixed-focus lens. Imaging was conducted under standardized LED lighting with a high color rendering index (CRI > 90) in a light-controlled chamber. The samples were positioned on a matte white backdrop at a uniform height and distance to maintain visual consistency. This qualitative approach enabled documentation of pigment fading, surface oxidation, and color retention, complementing the quantitative colorimetric analysis described in Section 2.7. Consistent imaging geometry and lighting minimized reflection artifacts, allowing direct visual comparison of degradation trends across timepoints and exposure types.

2.7. Color Stability Analysis (CIE L*a*b*)

Spectrophotometric color measurements were conducted to evaluate the UV-induced chromatic changes in thermochromic polypropylene blends. A handheld X-Rite SP62 spherical spectrophotometer (X-Rite SP62, Grand Rapids, MI, USA) was used for all measurements. Before analysis, the instrument was calibrated using a zero tile and a standard white calibration tile in accordance with the SP60 user manual. Color values were collected in the Commission Internationale de l’Eclairage (CIE) chromaticity coordinate system (L*, a*, b*), where L* describes lightness (0 = black, 100 = white), a* represents the red–green chromaticity, and b* corresponds to the blue–yellow chromaticity. The differences show the variations in the L*, a*, and b* values between the sample and the standard (ΔL*, Δa*, and Δb*). Equation (1) was used to determine the total color difference (ΔE*ab):
Δ E a b * = L * 2 + ( a * ) 2 + b * 2 1 / 2
where Δ E a b * is the color difference between two colors; Δ L * is the difference in lightness between the two colors; Δ a * is the difference in the red–green axis; and Δ b * is the difference in the yellow–blue axis.
Using OncolorTM (v.6.3.4.4 QC-Lite) (Hunter Associates Laboratory, Inc., Reston, VA, USA), the color coordinates L*, a*, and b* were captured in accordance with ISO/CIE 11664-4:2019 [67]. Data were collected for ten replicate specimens per test condition, with the mean values and standard deviations calculated. To aid visual interpretation, RGB values were derived from the average CIE L*a*b* coordinates using the built-in lab2rgb function in MATLAB (version R2024a) software (The MathWorks, Inc., Natick, MA, USA). This function transforms the color space from CIE 1976 L*a*b* to the red, green, and blue (RGB) values using the D65 standard illuminant, in alignment with the CIE conversion protocols. RGB values are reported as integer triplets (0–255) for each sample group. The color difference connected to the test specimens may be identified using these coordinates. Equation (1) was used to compare the color coordinates of the simulated indoor and outdoor UVA-exposed samples with those of the unexposed food-grade material samples, which were used as a reference, to determine the color difference, which is represented by the distance metric ∆E*ab. The decision to use ten replicates for colorimetric testing was based on the need for greater statistical resolution in capturing surface discoloration trends, which are often more variable than bulk mechanical properties. Mechanical testing followed ISO standards, with five replicates prescribed for tensile testing (Section 2.8) in accordance with ISO 527-2 [57] and ten replicates prescribed for Charpy impact testing (Section 2.9) as per ISO 179-1 [56].

2.8. Tensile Property (Post-UV Exposure)

In tensile testing, a regulated tensile (pulling) force is applied until the sample breaks to assess the mechanical properties of the polymer [68]. To determine the effects of UVA radiation on mechanical performance, tensile properties were analyzed on ISO 527-2:2012 [57] type 1BA specimens. Five replicate specimens per formulation (PP98/TP2 and PP92/TP8) were tested after 0, 500, and 1000 h of exposure. The evaluated parameters included maximum tensile stress, Young’s modulus, and strain at break, which are indicative of stiffness, strength, and ductility, respectively.
Tests were conducted exclusively on samples aged under indoor UVA conditions (RS 559-934, 360 nm), as the QUV/Solar Eye device could not accommodate tensile molds. Unexposed control samples were included for comparison. Mechanical testing was performed on an Instron 3400 system (Instron, Norwood, MA, USA) using a 4 kN load cell and Bluehill® v4.29 software (Instron, Norwood, MA, USA). Specimens (170 mm × 10 ± 0.2 mm × 4 ± 0.2 mm) were tested with a 25.4 mm grip separation at a crosshead speed of 10 mm/min. A Mitutoyo Absolute CD-6-ASX caliper (BCS Calibration, Laois, Ireland) was used for dimensional verification.

2.9. Impact Strength Testing (Charpy Method)

Charpy impact testing is a standardized method used to determine a material’s impact strength and toughness [69]. It was used to evaluate the fracture toughness of thermochromic polypropylene blends under UV exposure. A CEAST Resil 6545 5.5 Series impact tester (Zwick Roell, Ulm, Germany) was employed, equipped with a calibrated 4 joule (J) pendulum operating at 2.9 m/s. Tests were conducted per ISO 179-1:2023 [56] on notched and unnotched specimens. Specimens with an average thickness of 12.72 mm ± 0.04 mm were notched using a Type A V-cutter (Zwick/Roell, Ulm, Germany). Prior to testing, each sample was horizontally aligned to ensure accurate notch orientation and minimize angular deviation during pendulum strike.
During each test, the hammer released from a fixed height impacted the specimen, and the absorbed energy was digitally recorded. Unnotched specimens resisted fracture, while notched specimens typically failed under stress. Equation (2) determined the corresponding Charpy impact strength, acU, for unnotched samples. This value was reported in kilojoules per square meter (kJ/m2):
a c U = W c h × b × 10 3
where Wc is the corrected energy, in joules, absorbed by breaking the test specimen; h is the thickness, in millimeters, of the test specimen; and b is the width, in millimeters, of the test specimen.
The Charpy impact strength, acN, expressed in kilojoules per square meter (kJ/m2), was determined for the notched samples using the calculation presented in Equation (3):
a c N = W c h × b N × 10 3
where Wc is the corrected energy, in joules, absorbed by breaking the test specimen; h is the thickness, in millimeters, of the test specimen; and bN is the width, in millimeters, of the test specimen.

2.10. Mass Variation Measurement

To monitor potential mass variation from UV-induced degradation or leaching, the tensile specimen mass was recorded before and after exposure. A precision balance (Mettler TG50 Thermobalance, Mettler-Toledo, Columbus, OH, USA) with an accuracy of ±0.0001 mg was used to measure each specimen. The data allowed for comparison of pre- and post-exposure conditions to identify any material loss. All mass measurements were performed in a humidity-controlled environment maintained at 23 ± 2 °C and 50 ± 5% relative humidity to minimize moisture fluctuation and ensure consistent readings.

2.11. Statistical Analyses

Statistical methods were used to rigorously assess variation in mechanical, colorimetric, and physical properties after UVA exposure. All datapoints were retained without outlier exclusion to preserve dataset integrity. Sample sizes (n = 5 or n = 10) were specified for each test to ensure clarity and reproducibility. Minitab® 21.4.1 Statistical Software (Minitab, LLC, State College, PA, USA) was used to perform normality tests and determine whether the observed differences warranted statistical significance. A one-way analysis of variance (ANOVA) was conducted on quintuplicate or decuplicate datasets, depending on the test type. The results were reported as the means ± standard deviations. Post hoc Tukey HSD comparisons were applied where applicable, using a significance level of p < 0.05 and 95% confidence intervals to assess group differences. These analyses supported the interpretation of UV-induced changes in color difference, tensile behavior, impact strength, and mass stability. Findings were evaluated for both statistical significance and their implications for practical application.

3. Results

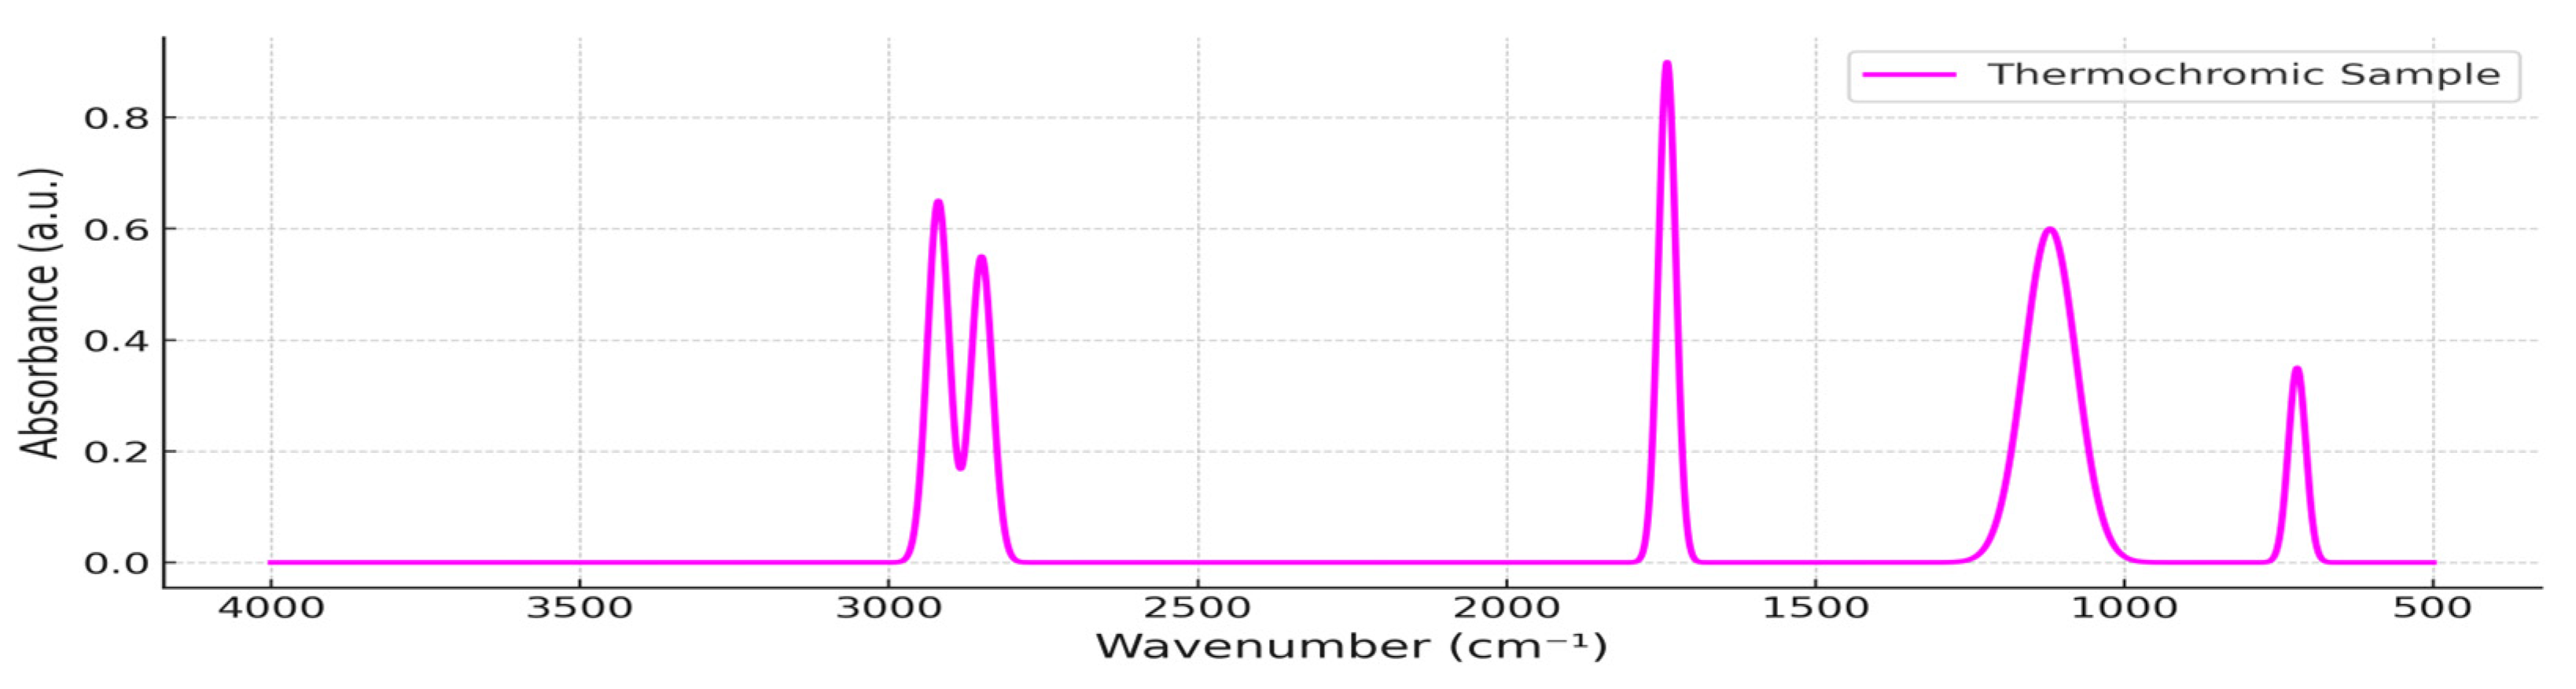
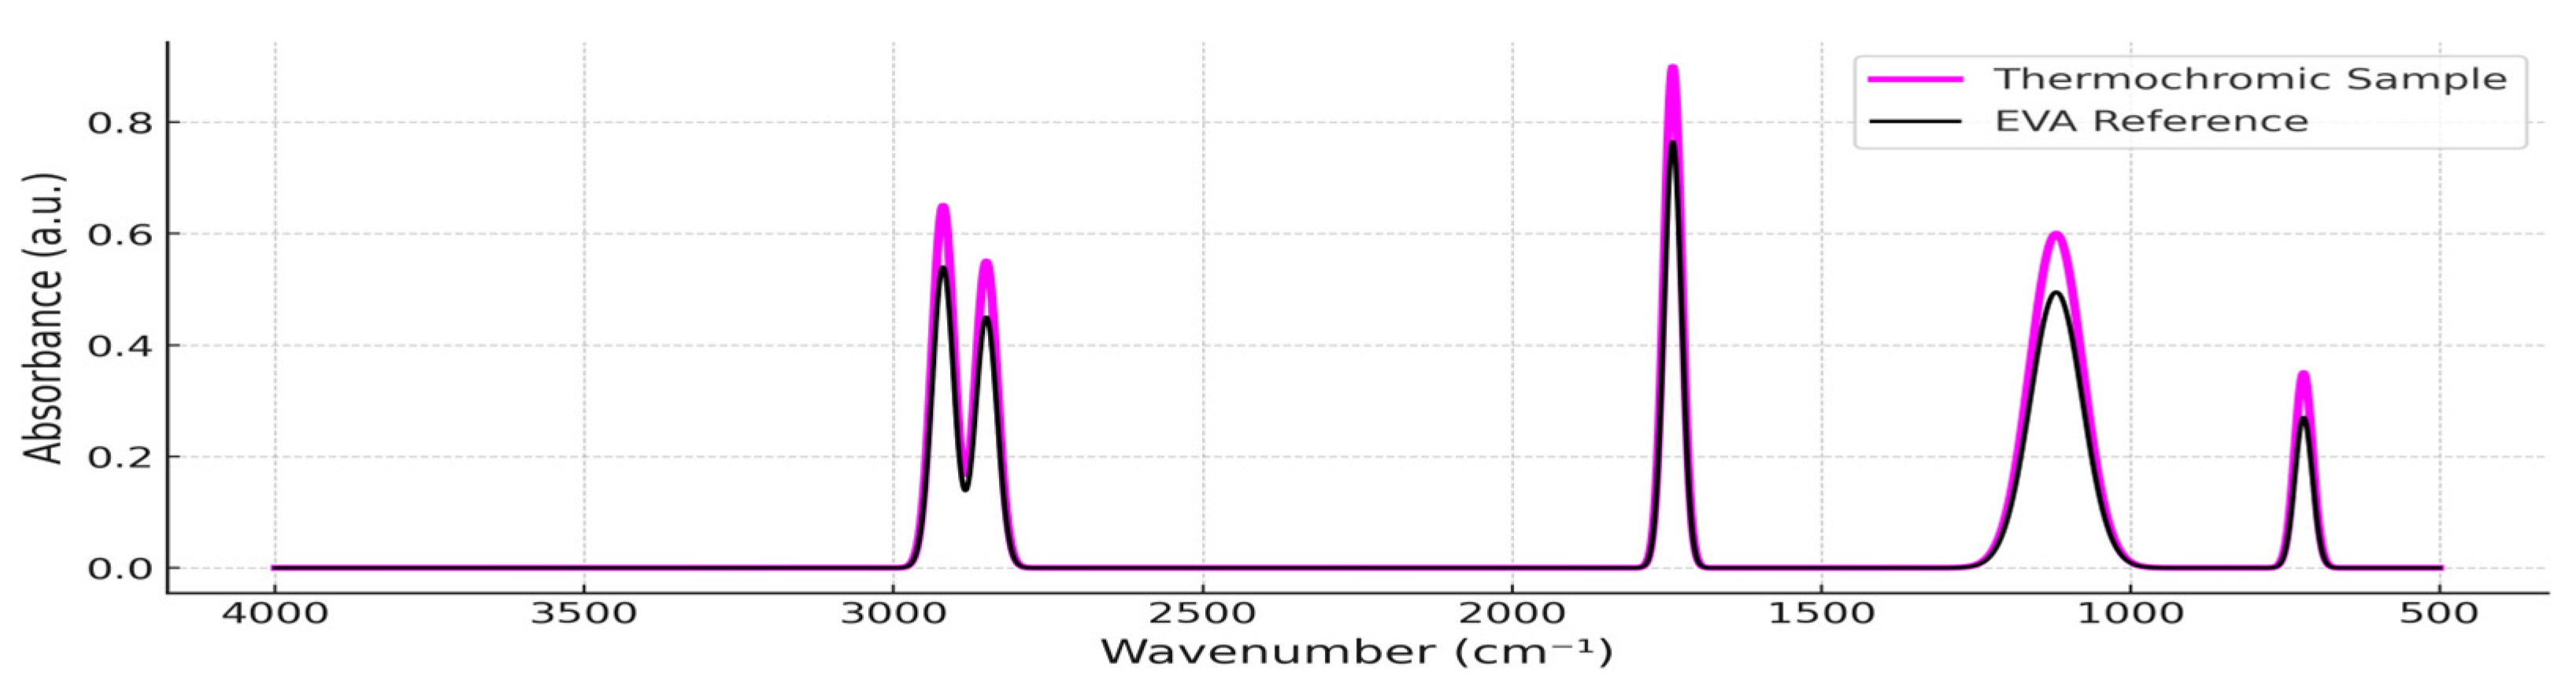
3.1. ATR-FTIR Spectral Characterization (Pre-Exposure)

Figure 2 presents the ATR-FTIR absorbance spectrum of the unexposed thermochromic pigment masterbatch, showing distinct absorbance peaks characteristic of an ethylene–vinyl acetate (EVA) copolymer. These include C–H stretching near 2920 and 2850 cm−1, carbonyl (C=O) stretching at ~1740 cm−1, and C–O stretching between 1240 and 1020 cm−1, providing the initial evidence for EVA as the carrier matrix [70].
In Figure 3, the ATR-FTIR absorbance spectrum of the thermochromic pigment masterbatch (ThermoBatch™) is overlaid with the reference spectrum for the ethylene–vinyl acetate (EVA) copolymer (black), obtained from SpectraBase™/Wiley (CAS No. 24937-78-8; entry A00641.Dx). An intense spectral match between the two indicates that the masterbatch carrier is EVA, a polymer frequently used for pigment dispersion due to its flexibility and compatibility [71]. The highest match (search score: 0.980245) was A00641.Dx, described as an “Ethylene/Vinyl Acetate Copolymer”, followed closely by several additional EVA-based materials. The consistency of these matches and their high correlation scores (≥0.90) with the acquired spectrum confirms the identity of the polymer as EVA.
The sample spectrum shows prominent peaks at 2920 cm−1 and 2850 cm−1, attributed to the asymmetric and symmetric C–H stretching vibrations of methylene groups in the polyethylene backbone. A strong peak at 1740 cm−1 corresponds to the C=O stretching vibration of the vinyl acetate moiety—this is the key distinguishing feature of EVA compared to pure polyethylene. A broad band between 1240 and 1020 cm−1 represents C–O stretching vibrations, and the distinct peak at 720 cm−1, typical of CH2 rocking, supports the presence of semi-crystalline polyethylene segments in the copolymer [72]. Post-irradiation ATR-FTIR analysis was not conducted due to the technique’s limited surface sensitivity relative to the shallow depth of UV-induced degradation, as well as the potential for spectral interference from thermochromic pigments. Given the more direct sensitivity of colorimetric and mechanical methods to degradation effects, FTIR was reserved for pre-exposure structural confirmation only.

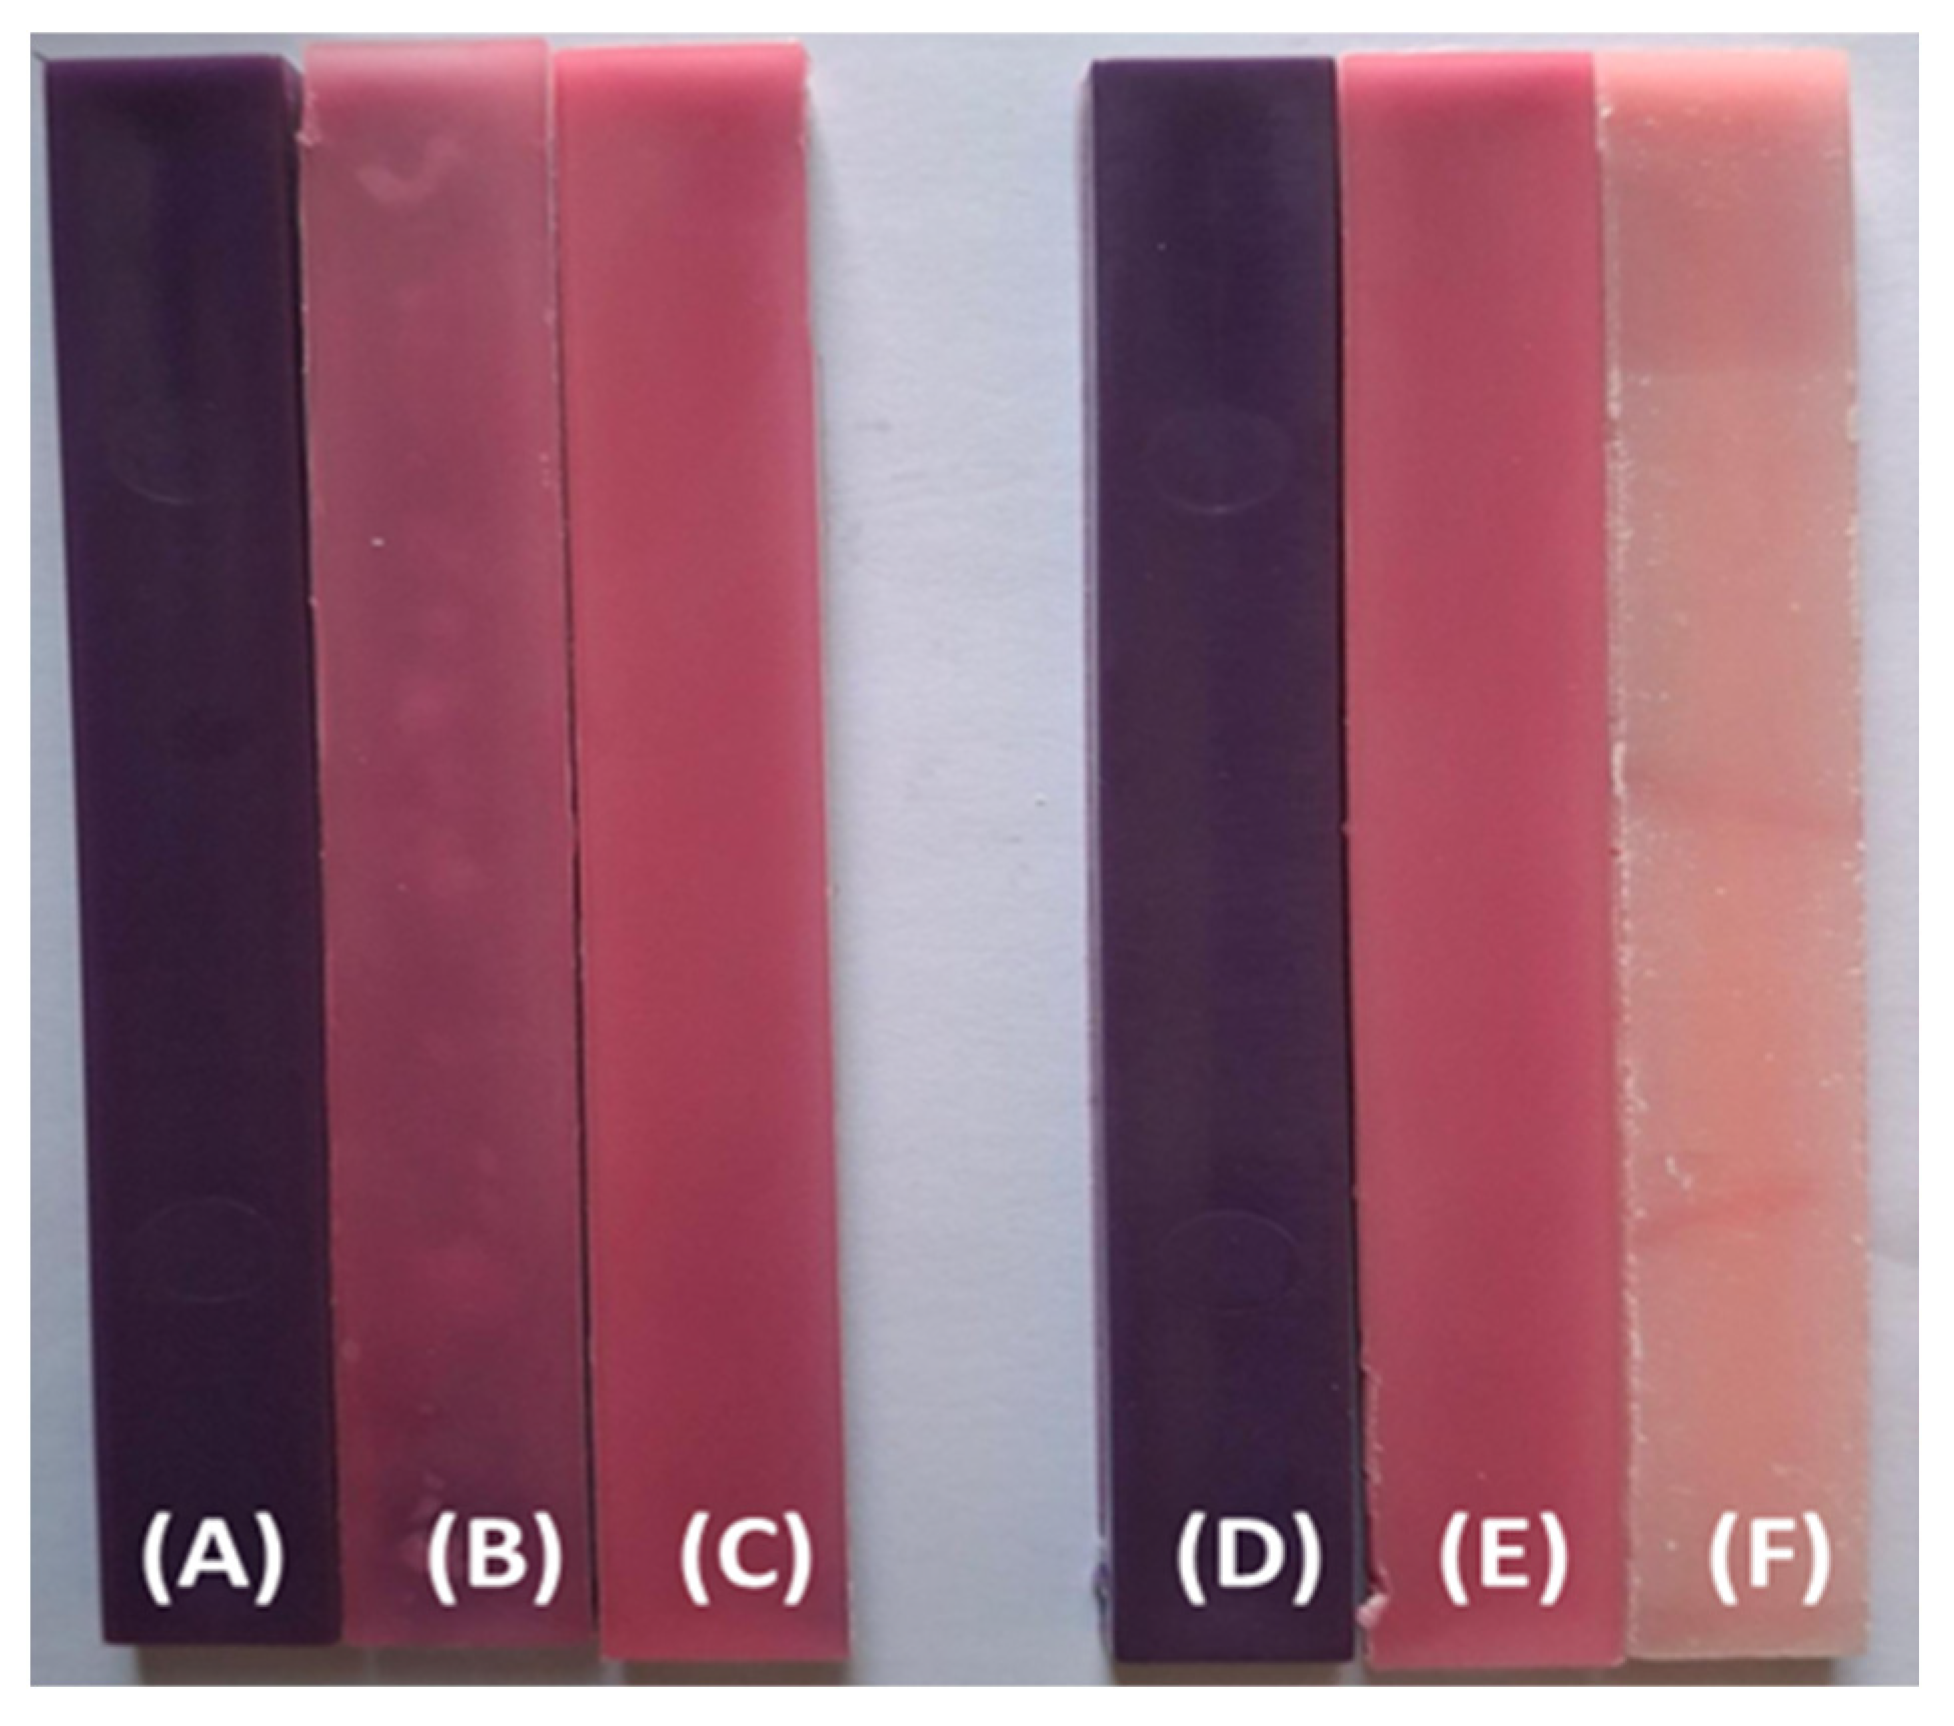
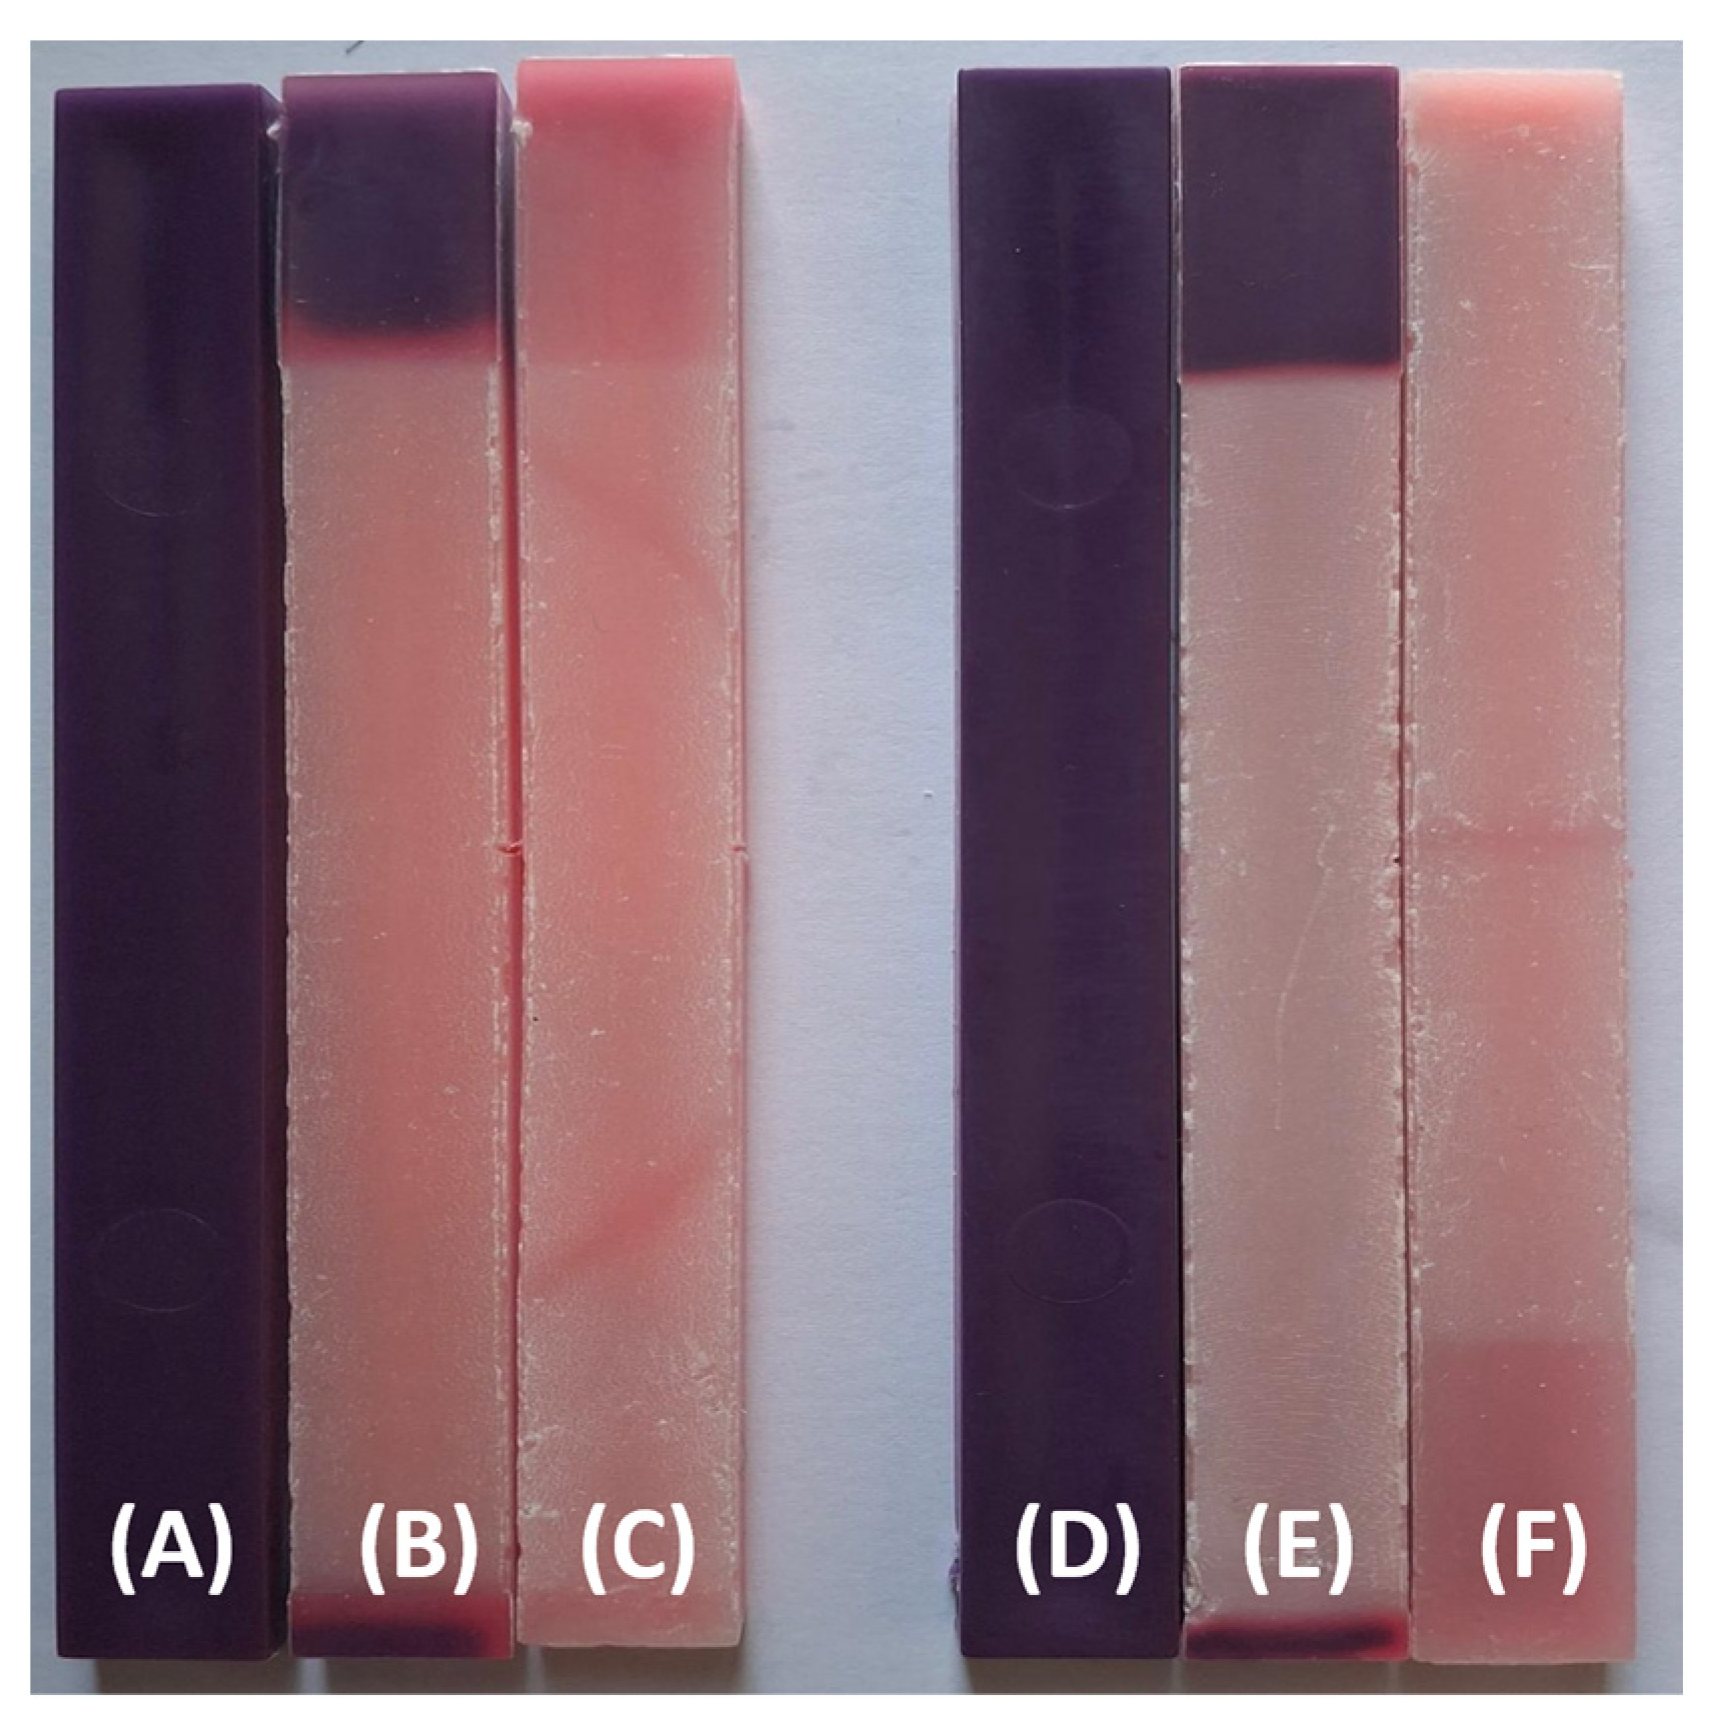
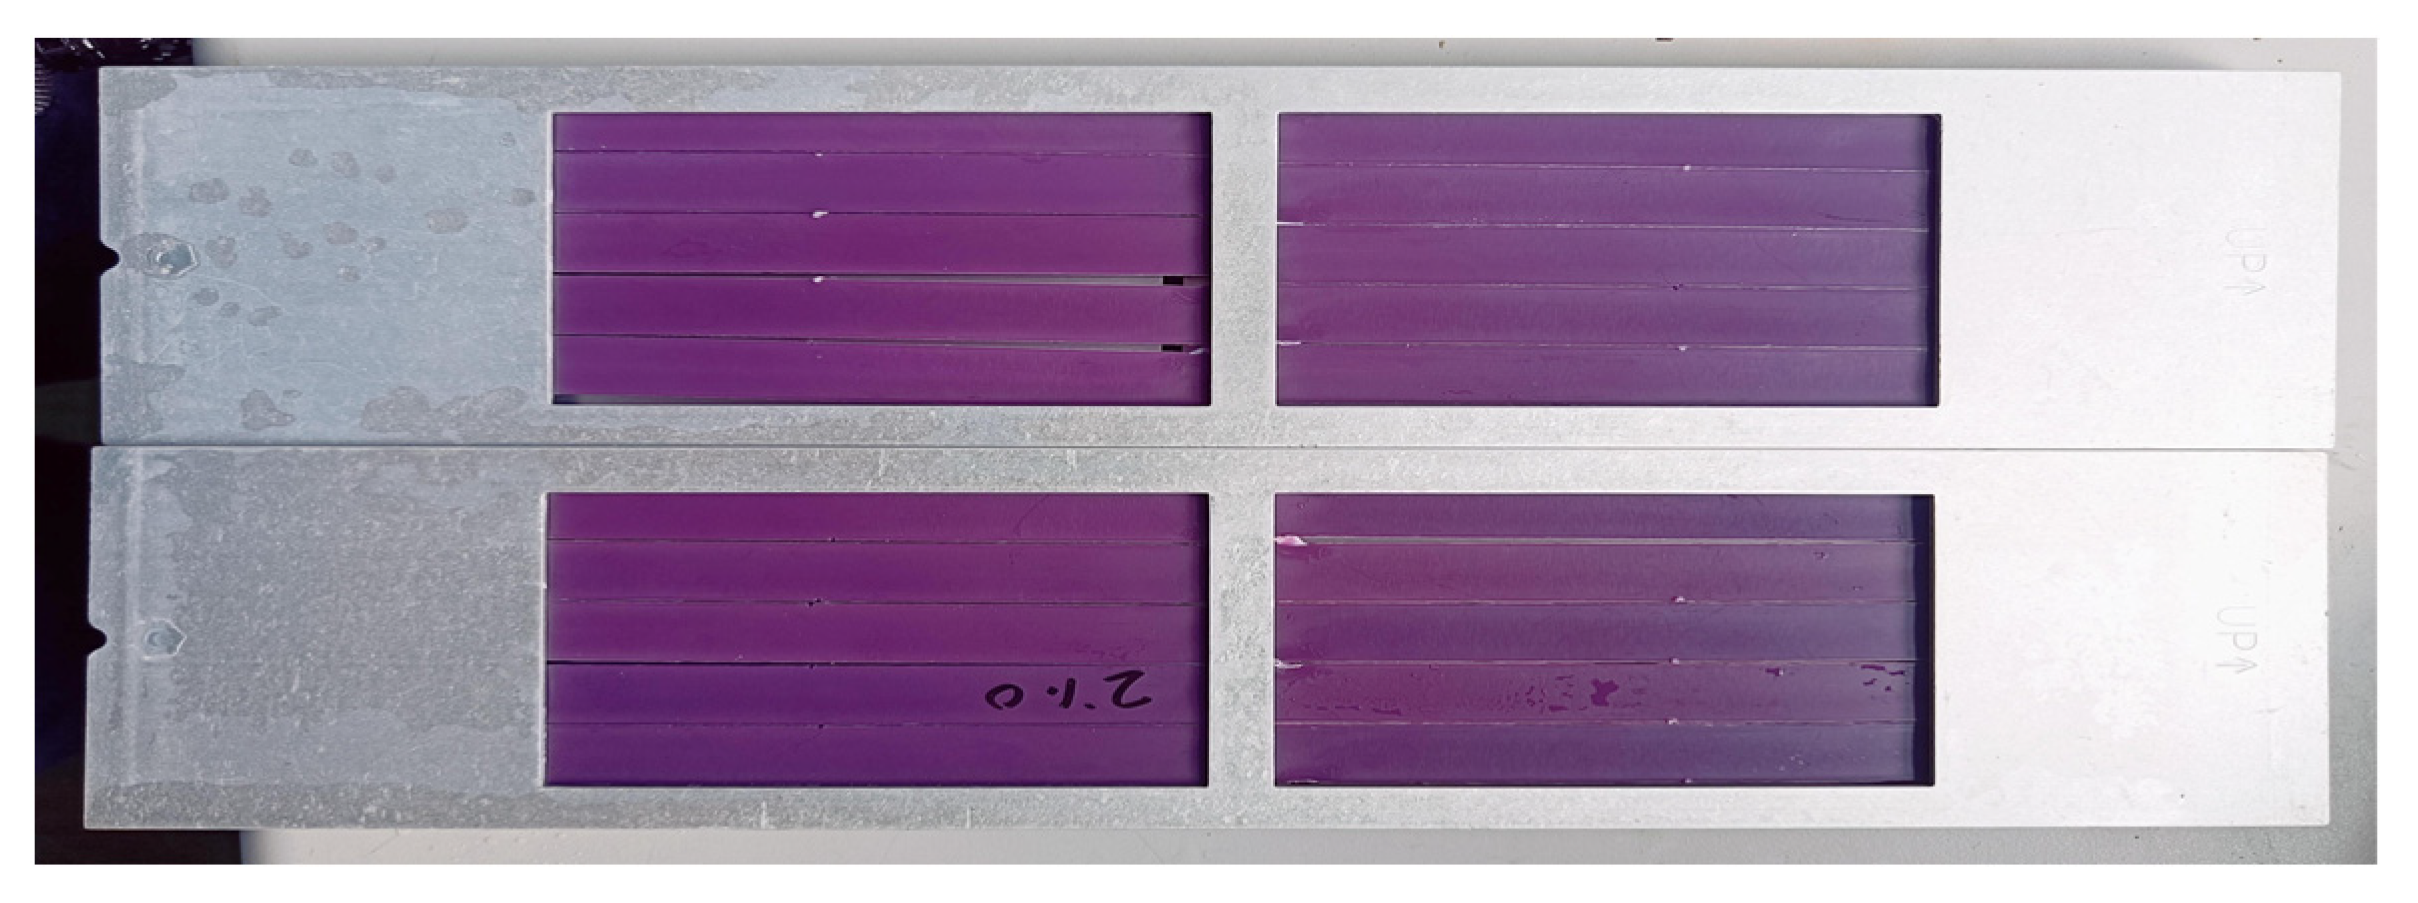
3.2. Visual Property Results

Figure 4 displays the visual changes observed in impact test specimens of the PP98/TP2 and PP92/TP8 blends before and after UVA exposure. These samples were aged using the RS 559-934 chamber, which simulates indoor UV conditions. With an apparent shift from deep violet to mild pink and beige tones, Figure 4 shows a steady loss of color intensity throughout both formulations. This diminished color intensity indicates pigment degradation and polymer surface oxidation over time [73]. The more noticeable fading observed in specimens exposed to longer exposure times supports the time-dependent character of photo-induced discoloration [74].
Figure 5 presents the same formulations aged under outdoor-simulated (QUV/Solar Eye) UVA conditions. Compared to the previously indoor-aged specimens, the QUV-exposed samples exhibit more significant discoloration, particularly after 1000 h, with some specimens losing most of their original chromatic intensity (Figure 5F). Notably, a square-shaped region of preserved color is visible in samples (B) and (E). This localized retention of the original hue is attributed to the sample mounting method during UV exposure.
As shown in Figure 6, the test specimens were secured in metal frames prior to aging in the QUV weathering chamber. These frames partially covered sections of the specimen surfaces, creating a shadowed region shielded from direct UVA radiation. There is a clear visible contrast between the exposed and protected portions due to the covered areas not experiencing the same level of photodegradation. This phenomenon emphasizes how crucial consistent sample exposure is in UV aging studies. It supports the finding that changes in surface color are closely related to the total amount of UV light received [75,76].
Overall, the visual results correlate well with the quantitative colorimetric data (ΔE*ab values), confirming that both formulations—especially the more pigment-rich PP92/TP8—are susceptible to UV-induced discoloration [77]. These observations underline the need for effective UV stabilization strategies in thermochromic systems intended for environments with prolonged light exposure.

3.3. Color Stability

To document color changes, the injection-molded bars’ colors and surface topography were examined after exposure to UV radiation for 500 and 1000 h. The total color difference (ΔE*ab) for thermochromic polymer specimens subjected to UVA was measured in ten replicates for each sample condition. Table 3 presents the comparative CIE L*a*b* parameters and total color difference (ΔE*ab) values for thermochromic polypropylene blends (PP98/TP2 and PP92/TP8) following UVA exposure under indoor (RS 559-934) and outdoor-simulated (QUV/Solar Eye) conditions at 500 and 1000 h. These values are the means of ten replicates per condition and reflect the time-dependent progression of surface discoloration and pigment instability.
The measured color changes—expressed as ΔL*, Δa*, Δb*, and ΔE*ab—represent deviations from the initial (0 h) color state and demonstrate the extent of discoloration and pigment shift after 500 and 1000 h of UVA exposure.
Across both formulations and exposure environments, ΔE*ab values increased with exposure duration, confirming the cumulative effects of UVA-induced photodegradation. Under the RS 559-934 chamber (360 nm), which simulates milder indoor lighting, PP98/TP2 exhibited a moderate color change, with ΔE*ab rising from 19.29 at 500 h to 23.50 at 1000 h. The corresponding changes in ΔL* (14.22 → 19.58) and Δa* (8.16 → 6.03) indicate progressive surface lightening and a reduction in red tones, while Δb* increased from 11.38 to 13.53, suggesting enhanced yellowing.
The degradation was more pronounced under the QUV/Solar Eye exposure (340 nm). PP98/TP2 exhibited higher ΔE*ab values of 26.36 and 30.29 after 500 and 1000 h, respectively, corresponding to intensified lightening (ΔL = 24.62 at 1000 h) and continued chromatic shifts.
PP92/TP8 showed a similar but more severe trend. Under the RS 559-934 exposure, ΔE*ab increased from 17.82 to 27.57 between 500 and 1000 h, with a substantial increase in ΔL from 13.14 to 24.78 and a sharp decrease in a* from 7.51 to 3.27, indicating greater fading of red hues. Under the QUV exposure, PP92/TP8 reached the highest color difference of all the samples: ΔE*ab = 34.07 at 1000 h, with ΔL* rising to 30.34 and a* decreasing to 4.09. These changes confirm the greater photo-instability of this formulation, likely due to its higher thermochromic pigment loading and associated matrix interactions [78]. The literature cites a ΔE*ab value of 3.3 as the threshold for perceptible and acceptable color change in industrial contexts [79]. Values above 5.0 are considered clearly noticeable and are often deemed unacceptable in industrial applications [80]. In this study, several samples far exceeded this threshold following UV exposure, indicating substantial visual discoloration likely to impact the functional appearance of consumer packaging.
To support the interpretation of these color differences, RGB values were calculated from the average L*a*b* coordinates and are included in Table 3. These triplets provide an approximate visual reference for the degree of discoloration observed under each UV exposure condition. The trends in the ΔE*ab values were also reflected in the RGB values, with PP92/TP8 showing more pronounced shifts toward lighter and redder tones. The higher pigment loading in PP92/TP8 may have increased its vulnerability to UV-induced matrix disruption or pigment fading, supporting the conclusion that pigment concentration influences long-term color stability in thermochromic systems.
To support the interpretation of statistical variability, 95% confidence intervals (CIs) were calculated for all ΔE*ab values. For example, the PP98/TP2 blend exposed to RS 559-934 UVA for 500 h exhibited a ΔE*ab of 19.29 ± 0.81 (95% CI), while the same blend under QUV/Solar Eye UVA for 1000 h reached 30.29 ± 0.76. The PP92/TP8 formulation showed the highest variability under the QUV exposure, with a ΔE*ab of 24.34 ± 0.76 at 500 h and 34.07 ± 0.15 at 1000 h. These confidence intervals confirm that the observed differences between materials and exposure conditions are both statistically and practically significant.
The comparative data underscore that outdoor UVA exposure (QUV/Solar Eye) induces more aggressive color degradation than indoor-equivalent UVA exposure (RS 559-934). Additionally, PP92/TP8 continuously displayed larger ΔE*ab values than PP98/TP2 under the same exposure settings, indicating it is more susceptible to discoloration. For long-term esthetic performance in outdoor packaging and display applications, the study emphasizes the significance of implementing UV stabilization procedures and preserving a balance in thermochromic pigment concentration [81].
Time-dependent color instability was confirmed by the overall increase in ΔE*ab with exposure duration for both interior and exterior UVA settings. Discoloration was more likely to occur in the higher pigment-loaded formulation, PP92/TP8, underscoring the need to maximize pigment concentration and add potent UV stabilizers in applications needing resilience to prolonged exposure [82].
Separate one-way ANOVA tests were conducted for the two UV exposure conditions—RS 559-934 (360 nm) and QUV/Solar Eye (340 nm)—to evaluate the influence of pigment concentration and exposure duration on the total color difference (ΔE*ab). Both tests revealed statistically significant differences across the four exposure groups (p < 0.05). Post hoc Tukey HSD comparisons confirmed that all pairwise differences between 2% and 8% pigment concentrations at 500 and 1000 h were statistically significant.

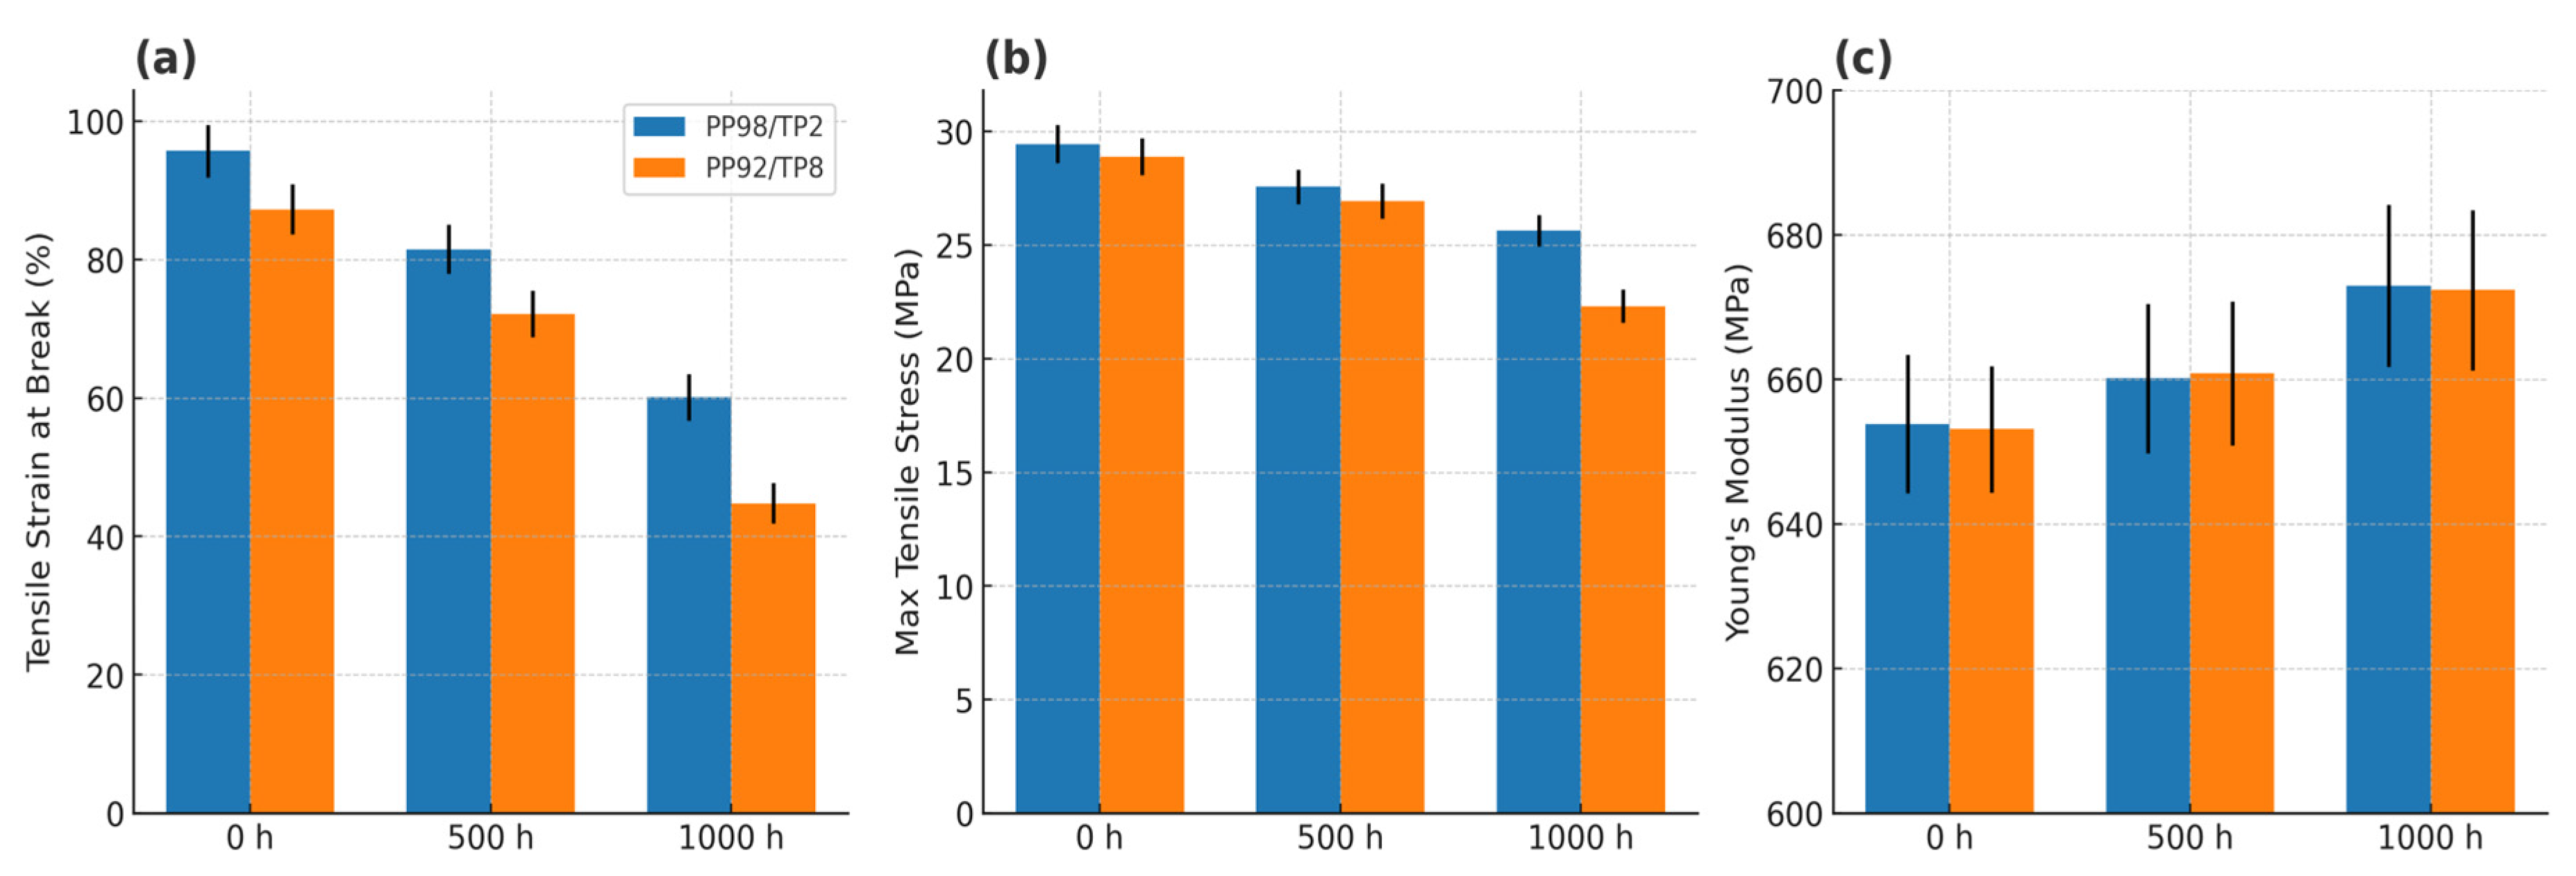
3.4. Tensile Properties After UV Exposure

PP98/TP2 (Table 4) exhibits moderate variations in tensile properties across different UV exposures. The corresponding trends are visualized in Figure 7 for clearer comparison.
The tensile property data presented in Table 4 highlight the degradative effects of indoor UVA exposure on thermochromic polypropylene blends (PP98/TP2 and PP92/TP8) using the RS 559-934 (360 nm) device. Both blends exhibited a progressive reduction in the tensile strain at break and the maximum tensile stress with increasing exposure duration, indicating a decline in ductility and tensile strength due to photo-oxidative degradation [83].
For PP98/TP2, the strain at break decreased from 95.69% (control) to 81.49% after 500 h and 60.11% after 1000 h of UVA exposure. The corresponding maximum tensile stress values declined from 29.45 MPa to 25.64 MPa (−12.94%) over the same period. A similar degradation pattern was observed for PP92/TP8, with the strain at break decreasing from 87.25% to 44.79%, tensile stress—from 28.89 MPa to 22.31 MPa (−22.77%) following 1000 h of exposure.
These changes are consistent with chain scission [84] and surface embrittlement [85] induced by prolonged UV exposure. The observed increase in Young’s modulus across both formulations suggests progressive stiffening, likely due to oxidative crosslinking and crystalline rearrangement [86]. A shift toward more brittle behavior is indicated by the mechanical reaction, especially in the pigment-rich PP92/TP8 formulation, which demonstrated larger strain and stress reductions [87]. The necessity for efficient stabilizing techniques to maintain mechanical integrity in thermochromic systems meant for light-exposed applications is highlighted by these findings. These trends are consistent with the molecular mechanisms of photo-oxidative degradation in polypropylene systems. Free radicals form predominantly at tertiary carbon sites upon UVA exposure, initiating chain scission, reducing molecular weight, and disrupting the polymer matrix’s load-bearing continuity. This manifests as decreased tensile strength and elongation at break. Additional covalent connections between polymer chains may be formed concurrently by oxidative crosslinking, especially at the material surface. This causes local stiffening, which accounts for the observed rise in Young’s modulus following extended exposure. Such a shift from ductile to brittle behavior has been well-documented in UV-aged polyolefins [88,89,90], and is accelerated in pigment-rich systems such as PP92/TP8, where pigment–matrix interactions can catalyze radical formation and propagation. These mechanisms support the mechanical performance trends observed in this study and reinforce the importance of UV stabilizer integration in thermochromic packaging applications.
One-way ANOVA was conducted separately for each formulation (PP98/TP2 and PP92/TP8) to evaluate the statistical significance of changes in the tensile strain at break, the maximum tensile stress, and Young’s modulus across 0, 500, and 1000 h of indoor UVA exposure (RS 559-934, 360 nm). The results showed a statistically significant effect of exposure duration on all three mechanical properties (p < 0.001). Post hoc Tukey HSD analysis confirmed that for PP92/TP8, all the timepoints differed significantly from one another (p < 0.05).
To quantify the statistical reliability of the observed mechanical degradation, 95% confidence intervals (CIs) were calculated for each tensile strength value. For example, PP98/TP2 declined from 25.30 ± 1.49 MPa (95% CI) at 500 h to 23.50 ± 1.37 MPa at 1000 h under the RS 559-934 exposure. Under the QUV/Solar Eye exposure, the same blend exhibited greater degradation, dropping from 22.10 ± 1.61 MPa to 20.70 ± 1.24 MPa over the same period. The PP92/TP8 formulation displayed steeper losses, declining to 17.10 ± 1.12 MPa at 1000 h under the QUV exposure. These confidence ranges confirm the increased susceptibility of PP92/TP8 to UVA-induced mechanical deterioration, which also supports the statistical significance of the performance differences across pigment loadings and exposure circumstances.

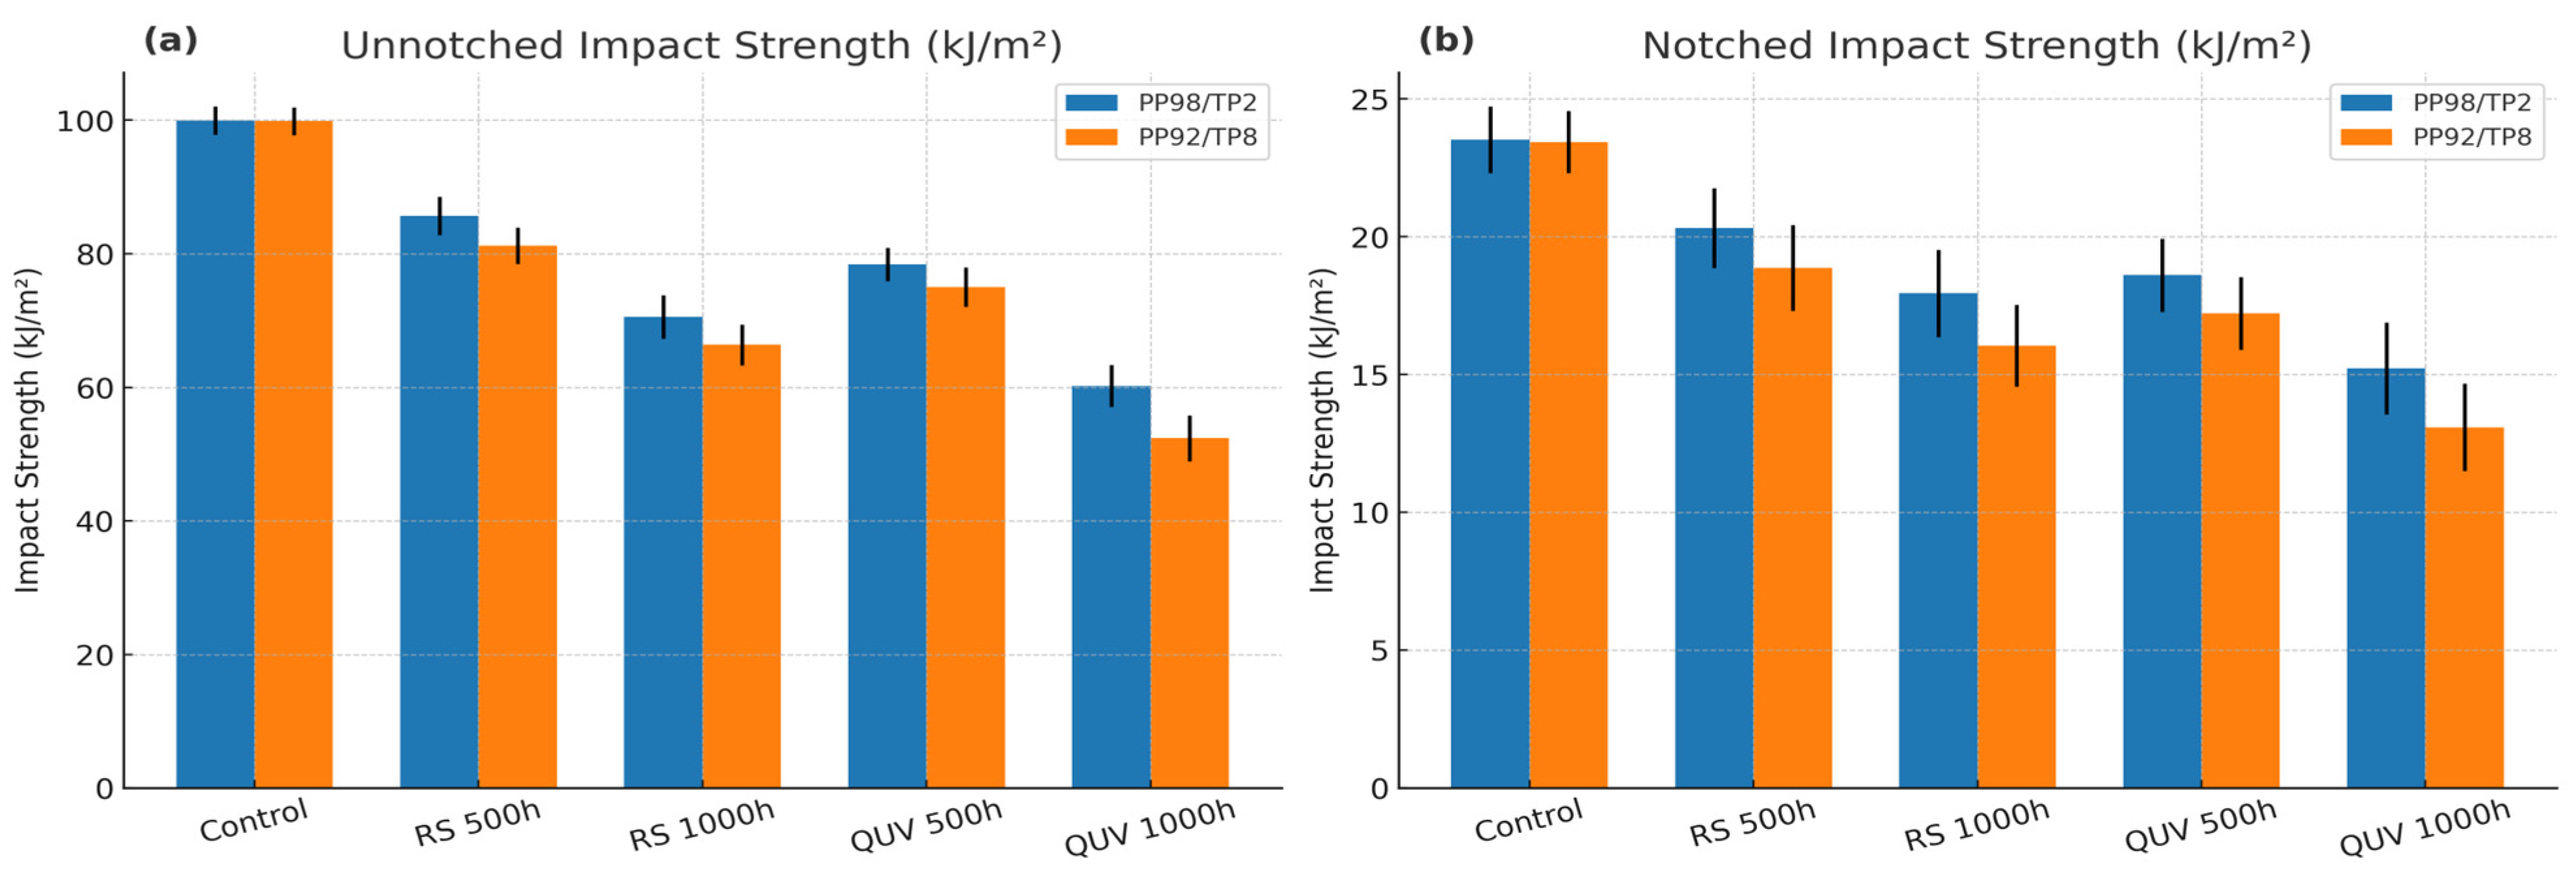
3.5. Impact Strength After UV Exposure

Using notched and unnotched samples, the impact strength of different polymer blends was assessed with exposure to various UV food contact conditions (Table 5). The corresponding results are visualized in Figure 8, which illustrates the degradative trends across both UV devices and exposure durations.
The impact strength data presented in Table 5 demonstrate the effect of UVA radiation on the fracture resistance of thermochromic polypropylene blends (PP98/TP2 and PP92/TP8), assessed under both unnotched and notched conditions after exposure to RS 559-934 (360 nm) and QUV/Solar Eye (340 nm) for 500 and 1000 h. Control specimens exhibited high unnotched impact strength (99.94 kJ/m2) and moderate notched strength (23.52 kJ/m2), consistent with ductile fracture behavior and high energy absorption capacity [91].
A progressive decline in both impact values was observed upon UVA exposure, with more significant reductions under the QUV/Solar Eye conditions. For PP98/TP2, the RS 559-934 exposure led to a 14.30% and 29.42% decrease in unnotched impact strength after 500 and 1000 h, respectively, while notched strength declined by 13.61% and 23.69%. Under the QUV conditions, losses were more pronounced, with unnotched values dropping to 60.22 kJ/m2 (−39.8%) after 1000 h, notched—to 15.23 kJ/m2 (−35.2%).
PP92/TP8 followed a similar but more severe trend. Unnotched impact strength declined by 18.70% and 33.54% after 500 and 1000 h in the RS chamber, while the QUV exposure caused a drop to 52.37 kJ/m2 (−47.56%). Notched strength decreased by 19.50% and 31.52% under the RS exposure and by 44.15% under the QUV, suggesting that higher pigment loading in PP92/TP8 accelerates UV-induced embrittlement.
UVA radiation significantly deteriorates unnotched and notched impact resistance, indicating increased material sensitivity to crack initiation and propagation. The more aggressive degradation observed under the QUV/Solar Eye exposure compared to RS 559-934 underscores the critical role of the UV source and spectral intensity in accelerating mechanical failure. These findings are consistent with a transition from ductile to brittle failure mechanisms [92], driven by surface oxidation [93], pigment–matrix interactions [94], and polymer chain scission [85], and emphasize the need for enhanced UV stabilization strategies [95] in thermochromic polypropylene systems intended for extended light-exposed service life.
Several UV stabilization strategies could be implemented in future thermochromic polypropylene systems to mitigate the observed degradation effects. These include using hindered amine light stabilizers (HALS) to neutralize free radicals [96] and UV absorbers such as benzotriazole compounds [97] to attenuate harmful radiation. Additionally, protective barrier coatings [98] or coextruded layers [99] can shield the surface from direct UV exposure while preserving optical clarity. For thermochromic systems in particular, enhancements in microcapsule design—such as multi-shell encapsulation [100] or incorporation of inorganic stabilizers such as silica [101]—can improve pigment integrity by reducing photodegradation within the dye–developer–solvent matrix. These techniques offer viable pathways to extend the functional lifespan of innovative packaging applications in high-UV environments.
One-way ANOVA was conducted separately on both unnotched and notched impact strength values for PP98/TP2 and PP92/TP8 to determine the statistical significance of differences across exposure durations (0, 500, and 1000 h) and UV conditions (RS 559-934 and QUV/Solar Eye). The analysis revealed statistically significant differences for both specimen types (p < 0.001), confirming that UVA exposure had a measurable effect on fracture resistance. Post hoc Tukey HSD tests indicated that all pairwise comparisons between exposure durations were statistically significant (p < 0.05), demonstrating time-dependent degradation in impact strength.
To further validate the reliability of impact strength measurements, 95% confidence intervals (CIs) were calculated for the unnotched results. For example, PP98/TP2 exhibited an unnotched impact strength of 85.65 ± 2.05 kJ/m2 (95% CI) after 500 h and 70.54 ± 2.31 kJ/m2 after 1000 h under the RS 559-934 exposure. Under the QUV/Solar Eye, the values declined to 78.41 ± 1.80 kJ/m2 at 500 h and 60.22 ± 2.24 kJ/m2 at 1000 h. The more pigment-rich PP92/TP8 blend showed even greater losses, dropping to 52.37 ± 2.45 kJ/m2 after 1000 h of the QUV exposure. These confidence intervals support the statistical significance of degradation trends and reinforce the greater UV sensitivity of PP92/TP8 compared to PP98/TP2.

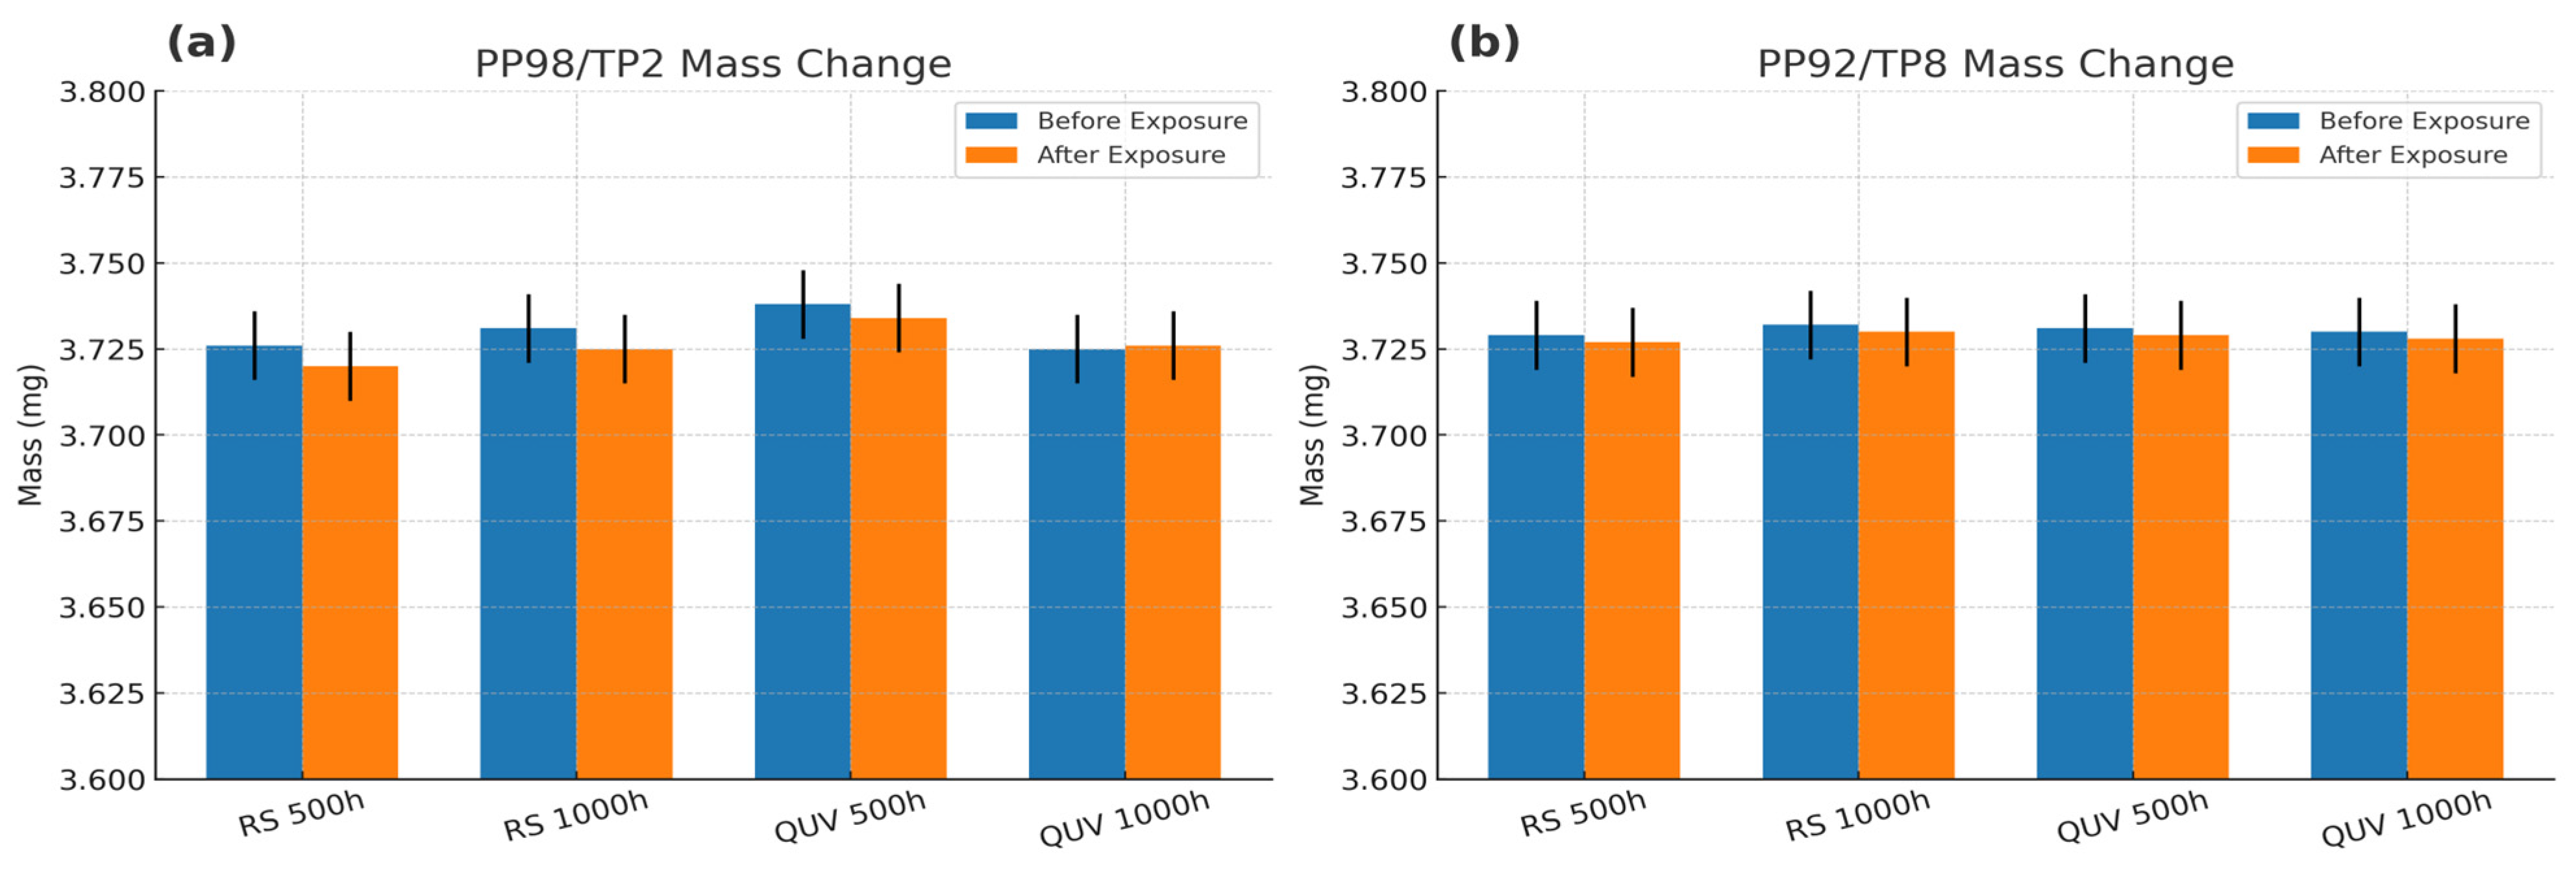
3.6. Mass Change After UV Exposure

Table 6 summarizes the mass measurements of the PP98/TP2 and PP92/TP8 tensile specimens before and after UVA exposure under indoor-simulated (RS 559-934, 360 nm) and outdoor-simulated (QUV/Solar Eye, 340 nm) conditions at 500 and 1000 h. The corresponding mass trends are presented in Figure 9. To facilitate comparison, the percentage change in mass (Δ mass %) is also reported in Table 6. The mass values represent the means of five replicate specimens per test scenario.
The absence of mass variation suggests that no significant material loss occurred due to volatilization or surface erosion and that thermochromic pigments and additives remained stably embedded within the polymer matrix. Additionally, the data indicate that no mass gain was observed, ruling out the possibility of moisture absorption or uptake of oxidative species under the applied exposure conditions.
A one-way ANOVA was performed on pre- and post-exposure mass values across all the test conditions. The results indicated no statistically significant differences (p > 0.05) in specimen mass after 500 or 1000 h of UVA exposure under either indoor (RS 559-934) or outdoor (QUV/Solar Eye) conditions.
We calculated 95% confidence intervals (CIs) to quantify the reliability of mass loss measurements further. For PP98/TP2, the mass changes after 500 and 1000 h of the RS 559-934 exposure were −0.18 ± 0.06% and −0.35 ± 0.09% (95% CI), respectively. Under the QUV/Solar Eye exposure, the mass loss increased to −0.42 ± 0.07% at 500 h and −0.67 ± 0.10% at 1000 h. PP92/TP8 followed a similar but more severe trend, with the mass loss reaching −0.72 ± 0.11% after 1000 h of the QUV exposure. These intervals affirm that the observed mass reduction is statistically significant and more pronounced under higher pigment loading and harsher UV conditions.
These results are consistent with the known behavior of polypropylene-based systems, where UV-induced degradation typically affects the surface layer through chain scission and oxidation but does not lead to a significant bulk material loss over moderate exposure periods [102]. The findings support the conclusion that the observed mechanical weakening and color changes result from photo-oxidative molecular changes rather than physical mass depletion or additive leaching [103].

4. Conclusions

This study provides critical insights into the durability of thermochromic polypropylene blends under UVA exposure that are relevant to smart packaging applications. The effects of photodegradation on mechanical and optical properties were systematically assessed by simulating indoor and outdoor UV lighting environments over 500 and 1000 h. Colorimetric analysis revealed apparent time-dependent discoloration, with the pigment-rich PP92/TP8 blend undergoing the most severe fading. Mechanical testing showed that UV exposure led to pronounced embrittlement and strain and impact resistance reductions, particularly in QUV-exposed samples. However, there was no discernible mass change, suggesting that the deterioration was surface-confined rather than the consequence of bulk erosion or additive leaching.
The results show how achieving thermochromic functionality and maintaining long-term material stability must be balanced. While increasing thermal responsiveness, higher pigment concentrations hasten mechanical deterioration and surface oxidation. These results imply that pigment concentration and UV stabilization techniques need to be adjusted to increase service life in practical food packaging applications.
While the study provided meaningful insights through mechanical, colorimetric, and mass change analyses, it did not include molecular weight characterization (e.g., GPC). This was due to the surface-limited nature of UVA degradation in polypropylene and the complexity introduced by EVA-based thermochromic masterbatches. However, we acknowledge that GPC could offer valuable insights into bulk degradation mechanisms, particularly under more aggressive conditions, and recommend it as a valuable extension for future studies.
Additionally, the study did not assess global or specific migration of thermochromic additives, which is essential for evaluating food contact. Although the absence of mass loss after UV exposure suggests stable pigment retention, this alone does not confirm the absence of low-level migration. Future work should incorporate migration testing using food simulants under conditions defined in relevant standards to assess the potential release of functional additives or their degradation products during typical use scenarios.
The findings of this study are expected to inform the design and formulation of more robust thermochromic packaging systems that are capable of withstanding real-world environmental conditions. These insights will contribute to the advancement of innovative packaging solutions by guiding manufacturers, researchers, and regulatory bodies looking to incorporate intelligent materials into high-performance, environmentally friendly packaging systems. Together, these findings lay the groundwork for advancing thermochromic packaging from an experimental concept to a practical, market-ready solution.
Notably, quantitative findings emphasize the severity of degradation: ΔE*ab values exceeded 34 in pigment-rich samples after 1000 h of outdoor UVA exposure, while the tensile strain at break and the notched impact strength declined by 48.67% and 44.15%, respectively. These measurable reductions directly affect the visual appeal and mechanical performance of packaging. Such losses can undermine consumer confidence. In addition, they can compromise protective functions for food-grade applications. Optimizing effective UV stabilization strategies and optimizing pigment levels are essential for maintaining packaging efficacy and safety across the product’s shelf life.

Author Contributions

Conceptualization, C.B.; methodology, C.B.; writing—original draft preparation, C.B.; writing—review and editing, C.B., D.M.C. and G.B.; supervision, J.G. and L.M.G. All authors have read and agreed to the published version of the manuscript.

Funding

This research received no external funding.

Institutional Review Board Statement

Not applicable.

Informed Consent Statement

Not applicable.

Data Availability Statement

Data are contained within the article.

Acknowledgments

The authors acknowledge the support of the Polymer, Recycling, Industrial, Sustainability and Manufacturing (PRISM) Research Institute at the Technological University of the Shannon: Midlands Midwest. Gratitude is extended to Ross Polymer (Athlone, Ireland) for supplying the nucleated, food-grade polypropylene. Appreciation is also extended to SpotSee®/LCR Hallcrest Ltd. for providing the thermochromic pigments used in this study.

Conflicts of Interest

The authors declare no conflicts of interest.

References

  1. Roy, V.; Srivastava, S.K. The Safety–Quality Dominant View of Food Chain Integrity: Implications for Consumer-centric Food Chain Governance. Int. J. Manag. Rev. 2022, 24, 3–24. [Google Scholar] [CrossRef]
  2. Saha, N.C. Food Packaging: Concepts and Its Significance. In Food Packaging: Materials, Techniques and Environmental Issues; Saha, N.C., Ghosh, A.K., Garg, M., Sadhu, S.D., Eds.; Springer Nature: Singapore, 2022; pp. 1–45. ISBN 978-981-16-4233-3. [Google Scholar]
  3. Ibrahim, I.D.; Hamam, Y.; Sadiku, E.R.; Ndambuki, J.M.; Kupolati, W.K.; Jamiru, T.; Eze, A.A.; Snyman, J. Need for Sustainable Packaging: An Overview. Polymers 2022, 14, 4430. [Google Scholar] [CrossRef] [PubMed]
  4. Zhuo, Y.; He, J.; Li, W.; Deng, J.; Lin, Q. A Review on Takeaway Packaging Waste: Types, Ecological Impact, and Disposal Route. Environ. Pollut. 2023, 337, 122518. [Google Scholar] [CrossRef]
  5. Fasake, V.; Shelake, P.S.; Srivastava, A.; Dashora, K. Characteristics of Different Plastic Materials, Properties and Their Role in Food Packaging. Curr. Nutr. Food Sci. 2021, 17, 944–954. [Google Scholar] [CrossRef]
  6. Ncube, L.K.; Ude, A.U.; Ogunmuyiwa, E.N.; Zulkifli, R.; Beas, I.N. An Overview of Plastic Waste Generation and Management in Food Packaging Industries. Recycling 2021, 6, 12. [Google Scholar] [CrossRef]
  7. Hahladakis, J.N.; Iacovidou, E.; Gerassimidou, S. Chapter 4—Plastic Waste in a Circular Economy. In Environmental Materials and Waste, 2nd ed.; Vara Prasad, M.N., Ed.; Elsevier: Amsterdam, The Netherlands, 2024; pp. 99–134. ISBN 978-0-443-22069-2. [Google Scholar]
  8. Sundqvist-Andberg, H.; Åkerman, M. Sustainability Governance and Contested Plastic Food Packaging—An Integrative Review. J. Clean. Prod. 2021, 306, 127111. [Google Scholar] [CrossRef]
  9. Yan, M.R.; Hsieh, S.; Ricacho, N. Innovative Food Packaging, Food Quality and Safety, and Consumer Perspectives. Processes 2022, 10, 747. [Google Scholar] [CrossRef]
  10. Behera, A. Chromogenic Materials. In Advanced Materials; Springer International Publishing: Cham, Switzerland, 2022; pp. 157–191. ISBN 978-3-030-80358-2. [Google Scholar]
  11. Hakami, A.; Srinivasan, S.S.; Biswas, P.K.; Krishnegowda, A.; Wallen, S.L.; Stefanakos, E.K. Review on Thermochromic Materials: Development, Characterization, and Applications. J. Coat. Technol. Res. 2022, 19, 377–402. [Google Scholar] [CrossRef]
  12. Breheny, C.; Donlon, K.; Harrington, A.; Colbert, D.M.; Bezerra, G.S.N.; Geever, L.M. Thermochromic Polymers in Food Packaging: A Comprehensive Systematic Review and Patent Landscape Analysis. Coatings 2024, 14, 1252. [Google Scholar] [CrossRef]
  13. Kavuncuoglu, H. Packaging Aspects of Food Analogues. In Food Analogues: Emerging Methods and Challenges; Can, Ö.P., Göksel Saraç, M., Aslan Türker, D., Eds.; Springer Nature: Cham, Switzerland, 2024; pp. 437–463. ISBN 978-3-031-69872-9. [Google Scholar]
  14. Gao, T.; Sun, D.-W.; Tian, Y.; Zhu, Z. Gold–Silver Core-Shell Nanorods Based Time-Temperature Indicator for Quality Monitoring of Pasteurized Milk in the Cold Chain. J. Food Eng. 2021, 306, 110624. [Google Scholar] [CrossRef]
  15. Albrecht, A.; Ibald, R.; Raab, V.; Reichstein, W.; Haarer, D.; Kreyenschmidt, J. Implementation of Time Temperature Indicators to Improve Temperature Monitoring and Support Dynamic Shelf Life in Meat Supply Chains. J. Package Technol. Res. 2020, 4, 23–32. [Google Scholar] [CrossRef] [PubMed]
  16. Abedi-Firoozjah, R.; Salim, S.A.; Hasanvand, S.; Assadpour, E.; Azizi-Lalabadi, M.; Prieto, M.A.; Jafari, S.M. Application of Smart Packaging for Seafood: A Comprehensive Review. Comp. Rev. Food Sci. Food Safe 2023, 22, 1438–1461. [Google Scholar] [CrossRef] [PubMed]
  17. Aung, M.M.; Chang, Y.S. Cold Chain Monitoring Tools. In Cold Chain Management; Springer Series in Advanced Manufacturing; Springer International Publishing: Cham, Switzerland, 2023; pp. 77–91. ISBN 978-3-031-09565-8. [Google Scholar]
  18. Supian, A.B.M.; Asyraf, M.R.M.; Syamsir, A.; Najeeb, M.I.; Alhayek, A.; Al-Dala’ien, R.N.; Manar, G.; Atiqah, A. Thermochromic Polymer Nanocomposites for the Heat Detection System: Recent Progress on Properties, Applications, and Challenges. Polymers 2024, 16, 1545. [Google Scholar] [CrossRef] [PubMed]
  19. Zhang, X.; Yin, Z.; Xiang, S.; Yan, H.; Tian, H. Degradation of Polymer Materials in the Environment and Its Impact on the Health of Experimental Animals: A Review. Polymers 2024, 16, 2807. [Google Scholar] [CrossRef]
  20. Jamnicki Hanzer, S.; Kulčar, R.; Vukoje, M.; Marošević Dolovski, A. Assessment of Thermochromic Packaging Prints’ Resistance to UV Radiation and Various Chemical Agents. Polymers 2023, 15, 1208. [Google Scholar] [CrossRef]
  21. Thamrin, E.S.; Warsiki, E.; Bindar, Y.; Kartika, I.A. Thermochromic Ink as a Smart Indicator on Cold Product Packaging—Review. IOP Conf. Ser. Earth Environ. Sci. 2022, 1063, 012021. [Google Scholar] [CrossRef]
  22. Nagare, S.M.; Hakami, A.; Biswas, P.K.; Stefanakos, E.K.; Srinivasan, S.S. A Review of Thermochromic Materials for Coating Applications: Production, Protection, and Degradation of Organic Thermochromic Materials. J. Coat. Technol. Res. 2025, 22, 91–115. [Google Scholar] [CrossRef]
  23. Sadoh, A.; Hossain, S.; Ravindra, N.M. Thermochromic Polymeric Films for Applications in Active Intelligent Packaging—An Overview. Micromachines 2021, 12, 1193. [Google Scholar] [CrossRef]
  24. Chen, Z.; Zhang, H.; Duan, H.; Wu, C.; Zhang, S. Long-Term Photo Oxidation Aging Investigation of Temperature-Regulating Bitumen Based on Thermochromic Principle. Fuel 2021, 286, 119403. [Google Scholar] [CrossRef]
  25. Tang, J.; Wang, Y.; He, M.; Huang, L.; Wang, X.; Yu, J. Thermochromic Paint with Three-Stage Colour Transition Effect Based on Thermochromic Microcapsules and Its Crosslinking Modification. Color. Technol. 2025. [Google Scholar] [CrossRef]
  26. Vanzetto, A.B.; Neves, G.; Alves, T.P.; Moura, J.H.; de Bortoli, B.F.; Santana, L.; Polkowski, R.D.d.O. A Systematic Review on Smart Coatings for Automotive Applications; SAE International: Warrendale, PA, USA, 2024. [Google Scholar]
  27. Aldas, M.; Paladines, A.; Valle, V.; Pazmiño, M.; Quiroz, F. Effect of the Prodegradant-Additive Plastics Incorporated on the Polyethylene Recycling. Int. J. Polym. Sci. 2018, 2018, 1–10. [Google Scholar] [CrossRef]
  28. European Parliament and Council Regulation (EC). No 1935/2004 of the European Parliament and of the Council of 27 October 2004 on Materials and Articles Intended to Come into Contact with Food; European Parliament and Council Regulation (EC): Strasbourg, France, 2004. [Google Scholar]
  29. European Commission Commission Regulation (EU). No 10/2011 of 14 January 2011 on Plastic Materials and Articles Intended to Come into Contact with Food; European Commission Commission Regulation (EU): Brussels, Belgium, 2011. [Google Scholar]
  30. Conradie, W.; Dorfling, C.; Chimphango, A.; Booth, A.M.; Sørensen, L.; Akdogan, G. Investigating the Physicochemical Property Changes of Plastic Packaging Exposed to UV Irradiation and Different Aqueous Environments. Microplastics 2022, 1, 456–476. [Google Scholar] [CrossRef]
  31. Doğan, M. Ultraviolet Light Accelerates the Degradation of Polyethylene Plastics. Microsc. Res. Tech. 2021, 84, 2774–2783. [Google Scholar] [CrossRef]
  32. Ezati, P.; Khan, A.; Priyadarshi, R.; Bhattacharya, T.; Tammina, S.K.; Rhim, J.-W. Biopolymer-Based UV Protection Functional Films for Food Packaging. Food Hydrocoll. 2023, 142, 108771. [Google Scholar] [CrossRef]
  33. Gore, A.H.; Prajapat, A.L. Biopolymer Nanocomposites for Sustainable UV Protective Packaging. Front. Mater. 2022, 9, 855727. [Google Scholar] [CrossRef]
  34. Alizadeh Sani, M.; Khezerlou, A.; Tavassoli, M.; Abedini, A.H.; McClements, D.J. Development of Sustainable UV-Screening Food Packaging Materials: A Review of Recent Advances. Trends Food Sci. Technol. 2024, 145, 104366. [Google Scholar] [CrossRef]
  35. Jildeh, Z.B.; Wagner, P.H.; Schöning, M.J. Sterilization of Objects, Products, and Packaging Surfaces and Their Characterization in Different Fields of Industry: The Status in 2020. Phys. Status Solidi A 2021, 218, 2000732. [Google Scholar] [CrossRef]
  36. Finardi, S.; Hoffmann, T.G.; Schmitz, F.R.W.; Bertoli, S.L.; Khayrullin, M.; Neverova, O.; Ponomarev, E.; Goncharov, A.; Kulmakova, N.; Dotsenko, E.; et al. Comprehensive Study of Light-Emitting Diodes (LEDs) and Ultraviolet-LED Lights Application in Food Quality and Safety. J. Pure Appl. Microbiol. 2021, 15, 1125–1135. [Google Scholar] [CrossRef]
  37. Guzman-Puyol, S.; Hierrezuelo, J.; Benítez, J.J.; Tedeschi, G.; Porras-Vázquez, J.M.; Heredia, A.; Athanassiou, A.; Romero, D.; Heredia-Guerrero, J.A. Transparent, UV-Blocking, and High Barrier Cellulose-Based Bioplastics with Naringin as Active Food Packaging Materials. Int. J. Biol. Macromol. 2022, 209, 1985–1994. [Google Scholar] [CrossRef]
  38. Patil, A.S.; Nille, O.S.; Kolekar, G.B.; Sohn, D.; Gore, A.H. UV-Shielding Biopolymer@Nanocomposites for Sustainable Packaging Applications. In Sustainable Packaging; Muthu, S.S., Ed.; Environmental Footprints and Eco-design of Products and Processes; Springer: Singapore, 2021; pp. 177–202. ISBN 978-981-16-4608-9. [Google Scholar]
  39. Chiozzi, V.; Agriopoulou, S.; Varzakas, T. Advances, Applications, and Comparison of Thermal (Pasteurization, Sterilization, and Aseptic Packaging) against Non-Thermal (Ultrasounds, UV Radiation, Ozonation, High Hydrostatic Pressure) Technologies in Food Processing. Appl. Sci. 2022, 12, 2202. [Google Scholar] [CrossRef]
  40. Blatchley, E.R. Photochemical Reactors: Theory, Methods, and Ultraviolet Radiation Applications; Wiley: Hoboken, NJ, USA, 2022; ISBN 978-1-119-87135-4. [Google Scholar]
  41. Korkut, G.O.; Gunes, G. Ultraviolet Light Technology: Applications for Fresh Produce. In Handbook of Research on Food Processing and Preservation Technologies; Apple Academic Press: Ontario, CA, USA, 2021; ISBN 978-1-003-15322-1. [Google Scholar]
  42. Jadhav, H.B.; Annapure, U.S.; Deshmukh, R.R. Non-Thermal Technologies for Food Processing. Front. Nutr. 2021, 8, 657090. [Google Scholar] [CrossRef] [PubMed]
  43. Hamouda, S.A.; Alshawish, N.K.; Abdalla, Y.K.; Ibrahim, M.K. Ultraviolet Radiation: Health Risks and Benefits. Saudi J. Eng. Technol. 2022, 7, 533–541. [Google Scholar] [CrossRef]
  44. Breheny, C.; Colbert, D.M.; Bezerra, G.; Geever, J.; Geever, L.M. Towards Sustainable Food Packaging: Mechanical Recycling Effects on Thermochromic Polymers Performance. Polymers 2025, 17, 1042. [Google Scholar] [CrossRef]
  45. Breheny, C.; Geever, L.M.; Colbert, D.M.; Bezerra, G.; Geever, J. Evaluating the Chemical Resistance and Performance of Thermochromic Polymers for Food Packaging. Materials 2025, 18, 2085. [Google Scholar] [CrossRef] [PubMed]
  46. Crosby, P.H.N.; Netravali, A.N. Green Thermochromic Materials: A Brief Review. Adv. Sustain. Syst. 2022, 6, 2200208. [Google Scholar] [CrossRef]
  47. Sørensen, L.; Groven, A.S.; Hovsbakken, I.A.; Del Puerto, O.; Krause, D.F.; Sarno, A.; Booth, A.M. UV Degradation of Natural and Synthetic Microfibers Causes Fragmentation and Release of Polymer Degradation Products and Chemical Additives. Sci. Total Environ. 2021, 755, 143170. [Google Scholar] [CrossRef] [PubMed]
  48. Andrady, A.L.; Barnes, P.W.; Bornman, J.F.; Gouin, T.; Madronich, S.; White, C.C.; Zepp, R.G.; Jansen, M.A.K. Oxidation and Fragmentation of Plastics in a Changing Environment; from UV-Radiation to Biological Degradation. Sci. Total Environ. 2022, 851, 158022. [Google Scholar] [CrossRef]
  49. El-Hiti, G.A.; Ahmed, D.S.; Yousif, E.; Al-Khazrajy, O.S.A.; Abdallh, M.; Alanazi, S.A. Modifications of Polymers through the Addition of Ultraviolet Absorbers to Reduce the Aging Effect of Accelerated and Natural Irradiation. Polymers 2021, 14, 20. [Google Scholar] [CrossRef]
  50. Yousif, E.; Haddad, R. Photodegradation and Photostabilization of Polymers, Especially Polystyrene: Review. Springerplus 2013, 2, 398. [Google Scholar] [CrossRef]
  51. Wang, X.-Y.; Gao, Y.; Tang, Y. Sustainable Developments in Polyolefin Chemistry: Progress, Challenges, and Outlook. Prog. Polym. Sci. 2023, 143, 101713. [Google Scholar] [CrossRef]
  52. Pospíšil, P.; Prasad, A.; Rác, M. Mechanism of the Formation of Electronically Excited Species by Oxidative Metabolic Processes: Role of Reactive Oxygen Species. Biomolecules 2019, 9, 258. [Google Scholar] [CrossRef] [PubMed]
  53. Papac Zjačić, J.; Vujasinović, M.; Kovačić, M.; Lončarić Božić, A.; Kušić, H.; Katančić, Z.; Hrnjak-Murgić, Z. From Macro to Micro Plastics; Influence of Photo-Oxidative Degradation. Kem. U Ind. 2023, 72, 463–471. [Google Scholar] [CrossRef]
  54. Pfaff, G. (Ed.) Antraquinonoid Pigments—Color Fundamentals; De Gruyter: Berlin, Germany, 2022; ISBN 978-3-11-058807-1. [Google Scholar]
  55. Anwer, M.B.; Al-Mashhadani, M.H.; Alsayed, R.; Mohammed, A.H.; Alshareef, S.A.; Alhuwaymil, Z.; Alyami, M.S.S.; Yousif, E. Optimizing PVC Photostability and UV Blocking Capability through Nanoparticles Incorporation: A Comprehensive Review. J. Vinyl Addit. Technol. 2025, 31, 259–278. [Google Scholar] [CrossRef]
  56. ISO 179-1; Plastics—Determination of Charpy Impact Properties—Part 1: Non-Instrumented Impact Test. International Organization for Standardization ISO: Geneva, Switzerland, 2023.
  57. ISO 527-2; Plastics—Determination of Tensile Properties—Part 2: Test Conditions for Moulding and Extrusion Plastics. International Organization for Standardization ISO: Geneva, Switzerland, 2012.
  58. Farooque, R.; Asjad, M.; Rizvi, S.J.A. A Current State of Art Applied to Injection Moulding Manufacturing Process—A Review. Mater. Today Proc. 2021, 43, 441–446. [Google Scholar] [CrossRef]
  59. ISO 294-1; Plastics—Injection Moulding of Test Specimens of Thermoplastic Materials—Part 1: General Principles, and Moulding of Multipurpose and Bar Test Specimens. International Organization for Standardization (ISO): Geneva, Switzerland, 2017.
  60. Silva, M.R.F.; Alves, M.F.R.P.; Cunha, J.P.G.Q.; Costa, J.L.; Silva, C.A.; Fernandes, M.H.V.; Vilarinho, P.M.; Ferreira, P. Nanostructured Transparent Solutions for UV-Shielding: Recent Developments and Future Challenges. Mater. Today Phys. 2023, 35, 101131. [Google Scholar] [CrossRef]
  61. ISO 4892-3; Plastics—Methods of Exposure to Laboratory Light Sources—Part 3: Fluorescent UV Lamps. International Organization for Standardization: Geneva, Switzerland, 2024.
  62. Q-Lab Corporation. QUV & Q-SUN: Which Is Right for You? Q-Lab Corporation: Westlake, OH, USA, 2006. [Google Scholar]
  63. Kaur, H.; Rana, B.; Tomar, D.; Kaur, S.; Jena, K.C. Fundamentals of ATR-FTIR Spectroscopy and Its Role for Probing In-Situ Molecular-Level Interactions. In Modern Techniques of Spectroscopy; Singh, D.K., Pradhan, M., Materny, A., Eds.; Progress in Optical Science and Photonics; Springer: Singapore, 2021; Volume 13, pp. 3–37. ISBN 978-981-336-083-9. [Google Scholar]
  64. Nandiyanto, A.B.D.; Ragadhita, R.; Fiandini, M. Interpretation of Fourier Transform Infrared Spectra (FTIR): A Practical Approach in the Polymer/Plastic Thermal Decomposition. Indones. J. Sci. Technol. 2022, 8, 113–126. [Google Scholar] [CrossRef]
  65. Siddique, I. Exploring Functional Groups and Molecular Structures: A Comprehensive Analysis Using FTIR Spectroscopy. SSRN J. 2024, 1, 2. [Google Scholar] [CrossRef]
  66. Fiore, T.; Pellerito, C. Infrared Absorption Spectroscopy. In Spectroscopy for Materials Characterization; Agnello, S., Ed.; Wiley: Hoboken, NJ, USA, 2021; pp. 129–167. ISBN 978-1-119-69732-9. [Google Scholar]
  67. ISO/CIE 11664-4:2019; Colorimetry—Part 4: CIE 1976 L*a*b* Colour Space. International Organization for Standardization: Geneva, Switzerland, 2019.
  68. Gdoutos, E.; Konsta-Gdoutos, M. Tensile Testing. In Mechanical Testing of Materials; Gdoutos, E., Konsta-Gdoutos, M., Eds.; Springer Nature: Cham, Switzerland, 2024; pp. 1–34. ISBN 978-3-031-45990-0. [Google Scholar]
  69. Zainuddin, H.; Ali, M.B.; Zakaria, K.A.; Paijan, L.H.; Mamat, M.F.; Abu Bakar, M.H. Investigation of Impact Properties under Instrumented Charpy Test. J. Eng. Technol. Sci. 2024, 56, 329–339. [Google Scholar] [CrossRef]
  70. Ramírez-Hernández, A.; Aguilar-Flores, C.; Aparicio-Saguilán, A. Fingerprint Analysis of FTIR Spectra of Polymers Containing Vinyl Acetate. Dyna 2019, 86, 198–205. [Google Scholar] [CrossRef]
  71. Randhawa, K.S. Polymer Composites with Advanced Pigments: Enhancing Properties and Applications. Pigment. Resin Technol. 2025, 54, 620–636. [Google Scholar] [CrossRef]
  72. Smith, B.C. The Infrared Spectra of Polymers II: Polyethylene. Spectroscopy 2021, 36, 24–29. [Google Scholar] [CrossRef]
  73. Kotnarowska, D. Influence of Ageing with UV Radiation on Physicochemical Properties of Acrylic-Polyurethane Coatings. J. Surf. Eng. Mater. Adv. Technol. 2018, 8, 95–109. [Google Scholar] [CrossRef]
  74. Lu, T.; Solis-Ramos, E.; Yi, Y.; Kumosa, M. UV Degradation Model for Polymers and Polymer Matrix Composites. Polym. Degrad. Stab. 2018, 154, 203–210. [Google Scholar] [CrossRef]
  75. Hedir, A.; Slimani, F.; Moudoud, M.; Lamrous, O.; Touam, T.; Teguar, M.; Haddad, A.; Durmuş, A. Quantifying Time-Dependent Structural and Mechanical Properties of UV-Aged LDPE Power Cables Insulations. Turk. J. Chem. 2022, 46, 956–967. [Google Scholar] [CrossRef] [PubMed]
  76. Yurtsever, M.; Öztaş, A.; Mutlu, R. Assessing The Relationship Between Color Change and Tensile Strength In Thermoplastic Polyolefin Outer Sheaths of Low-Voltage Power Cables. Trak. Üniversitesi Mühendislik Bilim. Derg. 2024, 25, 11–19. [Google Scholar] [CrossRef]
  77. Cheng, Y.; Zhang, X.; Fang, C.; Chen, J.; Wang, Z. Discoloration Mechanism, Structures and Recent Applications of Thermochromic Materials via Different Methods: A Review. J. Mater. Sci. Technol. 2018, 34, 2225–2234. [Google Scholar] [CrossRef]
  78. Bulderberga, O.; Aniskevich, A. The Effect of UV Exposure on the Service-Life of Thermochromic Microcapsules Integrated into the Epoxy Matrix. Mater. Sci. 2022, 28, 333–339. [Google Scholar] [CrossRef]
  79. Pecho, O.E.; Martos, J.; Pinto, K.V.A.; Pinto, K.V.A.; Baldissera, R.A. Effect of Hydrogen Peroxide on Color and Whiteness of Resin-based Composites. J. Esthet. Restor. Dent. 2019, 31, 132–139. [Google Scholar] [CrossRef]
  80. Luchese, C.L.; Abdalla, V.F.; Spada, J.C.; Tessaro, I.C. Evaluation of Blueberry Residue Incorporated Cassava Starch Film as pH Indicator in Different Simulants and Foodstuffs. Food Hydrocoll. 2018, 82, 209–218. [Google Scholar] [CrossRef]
  81. Kheur, M.; Sethi, T.; Coward, T.; Kakade, D.; Rajkumar, M. Evaluation of the Effect of Ultraviolet Stabilizers on the Change in Color of Pigmented Silicone Elastomer: An in Vitro Study. J. Indian. Prosthodont. Soc. 2016, 16, 276. [Google Scholar] [CrossRef]
  82. Yan, X.; Qian, X.; Chang, Y.; Lu, R.; Miyakoshi, T. The Effect of Glass Fiber Powder on the Properties of Waterborne Coatings with Thermochromic Ink on a Chinese Fir Surface. Polymers 2019, 11, 1733. [Google Scholar] [CrossRef] [PubMed]
  83. Korayem, A.-E.; Mohammadi, H.; Dargazany, R. Experimental Investigation on the Performance Loss of Cross-Linked Polymers During Photo-Oxidative Aging. In Proceedings of the Volume 12: Mechanics of Solids, Structures, and Fluids; American Society of Mechanical Engineers, Virtual, 16 November 2020; p. V012T12A002. [Google Scholar]
  84. Gewert, B.; Plassmann, M.; Sandblom, O.; MacLeod, M. Identification of Chain Scission Products Released to Water by Plastic Exposed to Ultraviolet Light. Environ. Sci. Technol. Lett. 2018, 5, 272–276. [Google Scholar] [CrossRef]
  85. Erdmann, M.; Niebergall, U.; Wachtendorf, V.; Böhning, M. Evaluation of UV-Induced Embrittlement of PE-HD by Charpy Impact Test. J. Appl. Polym. Sci. 2020, 137, 49069. [Google Scholar] [CrossRef]
  86. Scida, D.; Alix, S.; Buet, S.; Hadi Saidane, E.; Courmont, F.; Behlouli, K.; Ayad, R. Hygrothermal/UV Aging Effect on Visual Aspect and Mechanical Properties of Non-Woven Natural-Fiber Composites. J. Renew. Mater. 2019, 7, 865–875. [Google Scholar] [CrossRef]
  87. Varghese, A.M.; Rangaraj, V.M.; Luckachan, G.; Mittal, V. UV Aging Behavior of Functionalized Mullite Nanofiber-Reinforced Polypropylene. ACS Omega 2020, 5, 27083–27093. [Google Scholar] [CrossRef] [PubMed]
  88. Hsueh, H.-C.; Kim, J.H.; Orski, S.; Fairbrother, A.; Jacobs, D.; Perry, L.; Hunston, D.; White, C.; Sung, L. Micro and Macroscopic Mechanical Behaviors of High-Density Polyethylene under UV Irradiation and Temperature. Polym. Degrad. Stab. 2020, 174, 109098. [Google Scholar] [CrossRef]
  89. Kuka, E.; Cirule, D.; Andersone, I.; Vasiljevs, L.O.; Merna, J.; Sarakovskis, A.; Kurnosova, N.; Sansonetti, E.; Vevere, L.; Andersons, B. A Step to Microplastic Formation: Microcracking and Associated Surface Transformations of Recycled LDPE, LLDPE, HDPE, and PP Plastics Exposed to UV Radiation. Polym. Degrad. Stab. 2024, 229, 110967. [Google Scholar] [CrossRef]
  90. De Freitas, A.D.S.M.; Rodrigues, J.S.; Botaro, V.R.; Lemes, A.P.; Cruz, S.A.; Waldman, W.R. Formation of Craze-like Pattern in Polypropylene UV-Induced Surface Cracking. J. Polym. Res. 2022, 29, 506. [Google Scholar] [CrossRef]
  91. Arencón, D.; Velasco, J.I. Fracture Toughness of Polypropylene-Based Particulate Composites. Materials 2009, 2, 2046–2094. [Google Scholar] [CrossRef]
  92. Rodriguez, A.K.; Mansoor, B.; Ayoub, G.; Colin, X.; Benzerga, A.A. Effect of UV-Aging on the Mechanical and Fracture Behavior of Low Density Polyethylene. Polym. Degrad. Stab. 2020, 180, 109185. [Google Scholar] [CrossRef]
  93. Cundiff, K.N.; Madi, Y.; Benzerga, A.A. Photo-Oxidation of Semicrystalline Polymers: Damage Nucleation versus Growth. Polymer 2020, 188, 122090. [Google Scholar] [CrossRef]
  94. Wypych, G. Handbook of UV Degradation and Stabilization; Elsevier: Amsterdam, The Netherlands, 2020; ISBN 978-1-927885-57-4. [Google Scholar]
  95. Wypych, A.; Wypych, G. Databook of UV Stabilizers; Elsevier: Amsterdam, The Netherlands, 2025; ISBN 978-1-77467-055-2. [Google Scholar]
  96. Davand, R.; Rahimpour, M.R.; Hassanajili, S.; Rashedi, R. Theoretical and Experimental Assessment of UV Resistance of high-density Polyethylene: Screening and Optimization of hindered amine light stabilizers. J. Appl. Polym. Sci. 2021, 138, 51262. [Google Scholar] [CrossRef]
  97. Chen, H.; Hu, X.; Yin, D. Benzotriazole Ultraviolet Stabilizers in the Environment: A Review of Occurrence, Partitioning and Transformation. Sci. Total Environ. 2024, 954, 176362. [Google Scholar] [CrossRef] [PubMed]
  98. Al-Borno, A.; Van Der Veen, A. Field and Laboratory Studies on the Effect of UV Degradation and UV Protector Paints on Stockpiles of FBE Coated Pipeline. In Proceedings of the Conference 2022; AMPP: San Antonio, TX, USA, 2022; pp. 1–10. [Google Scholar]
  99. Liu, C.; Mei, C.; Xu, B.; Chen, W.; Yong, C.; Wang, K.; Wu, Q. Light Stabilizers Added to the Shell of Co-Extruded Wood/High-Density Polyethylene Composites to Improve Mechanical and Anti-UV Ageing Properties. R. Soc. Open Sci. 2018, 5, 180074. [Google Scholar] [CrossRef] [PubMed]
  100. Sabah, A.; Tasleem, S.; Murtaza, M.; Nazir, M.; Rashid, F. Effect of Polymer Capping on Photonic Multi-Core–Shell Quantum Dots CdSe/CdS/ZnS: Impact of Sunlight and Antibacterial Activity. J. Phys. Chem. C 2020, 124, 9009–9020. [Google Scholar] [CrossRef]
  101. Liu, F.; Liu, A.; Tao, W.; Yang, Y. Preparation of UV Curable Organic/Inorganic Hybrid Coatings-a Review. Prog. Org. Coat. 2020, 145, 105685. [Google Scholar] [CrossRef]
  102. Chylińska, M.; Kaczmarek, H.; Moszyński, D.; Królikowski, B.; Kowalonek, J. Surface Studies of UV Irradiated Polypropylene Films Modified with Mineral Fillers Designed as Piezoelectric Materials. Polymers 2020, 12, 562. [Google Scholar] [CrossRef]
  103. Larché, J.-F.; Bussière, P.-O.; Thérias, S.; Gardette, J.-L. Photooxidation of Polymers: Relating Material Properties to Chemical Changes. Polym. Degrad. Stab. 2012, 97, 25–34. [Google Scholar] [CrossRef]
Figure 1. Spectral power distribution comparison between natural sunlight, Q-Sun with a daylight filter, and QUV with UVA-340 lamps. The UVA-340 spectrum replicates solar UV radiation from 295–365 nm, validating the use of the QUV/Solar Eye device for outdoor photodegradation simulation (adapted from Q-Lab Corporation [62]).
Applsci 15 06039 g001
Figure 2. ATR-FTIR absorbance spectrum of the unexposed sample (magenta), showing characteristic peaks consistent with an ethylene–vinyl acetate (EVA) copolymer, including C–H stretching (~2920 and ~2850 cm−1), carbonyl (C=O) stretching (~1740 cm−1), and C–O stretching (~1240–1020 cm−1).
Applsci 15 06039 g002
Figure 3. Overlay of the ATR-FTIR absorbance spectra for the ThermoBatch™ (magenta) and EVA reference spectra (black), confirming the material match.
Applsci 15 06039 g003
Figure 4. Visual appearance of the PP98/TP2 and PP92/TP8 impact test specimens before and after UV exposure: (A) PP98/TP2 prior to UV exposure; (B) PP98/TP2 after 500 h of simulated indoor UV exposure; (C) PP98/TP2 after 1000 h of simulated indoor UV exposure; (D) PP92/TP8 prior to UV exposure; (E) PP92/TP8 after 500 h of simulated indoor UV exposure; (F) PP92/TP8 after 1000 h of simulated indoor UV exposure.
Applsci 15 06039 g004
Figure 5. Visual appearance of the PP98/TP2 and PP92/TP8 impact test specimens before and after UV exposure: (A) PP98/TP2 prior to UV exposure; (B) PP98/TP2 after 500 h of simulated outdoor UV exposure; (C) PP98/TP2 after 1000 h of simulated outdoor UV exposure; (D) PP92/TP8 prior to UV exposure; (E) PP92/TP8 after 500 h of simulated outdoor UV exposure; (F) PP92/TP8 after 1000 h of simulated outdoor UV exposure.
Applsci 15 06039 g005
Figure 6. Samples mounted in metal frames prior to accelerated aging in the QUV weathering chamber.
Applsci 15 06039 g006
Figure 7. (a) Tensile strain at break, (b) maximum tensile stress, and (c) Young’s modulus for thermochromic polypropylene blends PP98/TP2 and PP92/TP8 after 0, 500, and 1000 h of UVA exposure (RS 559-934, 360 nm). Error bars represent standard deviation (n = 5).
Applsci 15 06039 g007
Figure 8. (a) Unnotched and (b) notched impact strength of thermochromic polypropylene blends PP98/TP2 and PP92/TP8 following UVA exposure at 0, 500, and 1000 h under the RS 559-934 (360 nm) and QUV/Solar Eye (340 nm) devices. Error bars indicate standard deviation (n = 10).
Applsci 15 06039 g008
Figure 9. (a) PP98/TP2 and (b) PP92/TP8 tensile specimen mass before and after UVA exposure for 500 and 1000 h under the RS 559-934 (360 nm, indoor-simulated) and QUV/Solar Eye (340 nm, outdoor-simulated) conditions. Error bars represent standard deviation (n = 5).
Applsci 15 06039 g009
Table 1. Composition of thermochromic polymer blends prepared for the UV aging study.
Sample NamePP (wt. %)TP (wt. %)
PP98/TP2982
PP92/TP8928
Table 2. UV exposure devices, wavelengths, and test conditions.
DeviceWavelengthUV TypeUse CaseExposure Duration (h)
RS 559-934 UV Exposure Unit360 nmUVASimulated indoor lighting500 h and 1000 h
QUV/Solar Eye (SE)340 nmUVASimulated outdoor lighting500 h and 1000 h
Table 3. ΔL*, Δa*, Δb* color parameters, total color difference (ΔE*ab), and RGB values across UVA radiation (internal).
Specimen
ID
UV
Device
Exposure
Hours (h)
ΔL*Δa*Δb*E*ab)RGB
PP98/TP200.000.000.000.00155, 112, 125
RS 559-93450014.22 (±0.82)8.16 (±1.03)11.38 (±0.92)19.29 (±1.13) d213, 142, 142
RS 559-934100019.58 (±0.91)6.03 (±0.75)13.53 (±0.61)23.50 (±1.02) b227, 158, 152
QUV/SE50019.21 (±1.00)10.78 (±1.26)14.46 (±0.45)26.36 (±1.97) c233, 153, 150
QUV/SE100024.62 (±1.06)8.07 (±1.01)15.65 (±0.48)30.29 (±1.08) a246, 170, 162
PP92/TP800.000.000.000.00148, 109, 121
RS 559-93450013.14 (±0.53)7.51 (±0.86)10.81 (±0.15)17.82 (±0.91) c206, 140, 141
RS 559-934100024.78 (±0.45)3.27 (±0.62)12.98 (±0.49)27.57 (±0.62) a234, 174, 167
QUV/SE50017.57 (±0.62)10.13 (±0.96)13.43 (±0.58)24.34 (±1.10) d224, 149, 148
QUV/SE100030.34 (±0.43)4.09 (±0.66)14.96 (±0.30)34.07 (±0.21) b252, 188, 179
Superscript letters indicate statistically significant differences between groups (Tukey HSD, p < 0.05). Values sharing the same letter are not significantly different.
Table 4. The effect of UV exposure on the tensile strength of PP98/TP2 and PP92/TP8 post 0, 500, and 1000 h.
Specimen
ID
UV DeviceExposure Hours (h)Tensile Strain at Break (%)Maximum
Tensile Stress (MPa)
Young’s
Modulus (MPa)
PP98/TP2None (control)095.69 (±3.81) a29.45 (±0.85) a653.82 (±9.57) a
RS 559-934 (360 nm)50081.49 (±3.52) b27.57 (±0.76) b660.12 (±10.34) b
RS 559-934 (360 nm)100060.11 (±3.34) c25.64 (±0.69) c672.97 (±11.21) c
PP92/TP8None (control)087.25 (±3.63) a28.89 (±0.81) a653.10 (±8.72) a
RS 559-934 (360 nm)50072.13 (±3.38) b26.94 (±0.78) b660.82 (±9.94) b
RS 559-934 (360 nm)100044.79 (±2.92) c22.31 (±0.73) c672.33 (±11.06) c
Superscript letters denote statistically significant differences across exposure durations within each formulation (Tukey HSD, p < 0.05). Values sharing the same letter are not significantly different.
Table 5. The effect of UV exposure on the impact strength of PP98/TP2 and PP92/TP8 with and without notches after UV exposure post 0, 500, and 1000 h.
Specimen
ID
UV DeviceExposure Hours
(h)
Unnotched Impact Strength
(kJ/m2)
Notched Impact Strength
(kJ/m2)
PP98/TP2None (control)099.94 (±2.12) a23.52 (±1.21) a
RS 559-934 (360 nm)50085.65 (±2.87) b20.32 (±1.44) b
RS 559-934 (360 nm)100070.54 (±3.23) c17.95 (±1.58) c
QUV/Solar Eye (340 nm)50078.41 (±2.51) d18.61 (±1.33) d
QUV/Solar Eye (340 nm)100060.22 (±3.13) e15.23 (±1.67) e
PP92/TP8None (Control)099.86 (±2.07) a23.44 (±1.13) a
RS 559-934 (360 nm)50081.19 (±2.72) b18.87 (±1.56) b
RS 559-934 (360 nm)100066.37 (±3.08) c16.05 (±1.49) c
QUV/Solar Eye (340 nm)50075.04 (±2.95) d17.22 (±1.32) d
QUV/Solar Eye (340 nm)100052.37 (±3.43) e13.09 (±1.58) e
Superscript letters denote statistically significant differences across exposure durations and UV conditions within each formulation for both unnotched and notched specimens (Tukey HSD, p < 0.05). Values sharing the same letter are not significantly different.
Table 6. Mass of tensile specimens before and after UV eExposure and percentage change (Δ mass %) under different conditions.
Specimen
ID
Exposure
Condition
Exposure
Duration (h)
Mass Before
Exposure (mg)
Mass After
Exposure (mg)
Δ Mass%
PP98/TP2Indoor (360 nm, RS unit)h500 h3.726 (±0.01)3.720 (±0.01)−0.16
Indoor (360 nm, RS unit)1000 h3.731 (±0.01)3.725 (±0.01)−0.16
Outdoor (340 nm, QUV)500 h3.738 (±0.01)3.734 (±0.01)−0.11
Outdoor (340 nm, QUV)1000 h3.725 (±0.01)3.726 (±0.01)0.03
PP92/TP8Indoor (360 nm, RS unit)500 h3.729 (±0.01)3.727 (±0.01)−0.05
Indoor (360 nm, RS unit)1000 h3.732 (±0.01)3.730 (±0.01)−0.05
Outdoor (340 nm, QUV)500 h3.731 (±0.01)3.729 (±0.01)−0.05
Outdoor (340 nm, QUV)1000 h3.730 (±0.01)3.728 (±0.01)−0.05
No statistically significant differences were observed across the test conditions for mass before and after exposure (one-way ANOVA, p > 0.05).
Disclaimer/Publisher’s Note: The statements, opinions and data contained in all publications are solely those of the individual author(s) and contributor(s) and not of MDPI and/or the editor(s). MDPI and/or the editor(s) disclaim responsibility for any injury to people or property resulting from any ideas, methods, instructions or products referred to in the content.

