
A Construction and Representation Learning Method for a Traffic Accident Knowledge Graph Based on the Enhanced TransD Model

Abstract
1. Introduction
2. Related Works
- (1)
- Traditional Statistical Analysis Methods
- (2)
- Machine Learning Methods
- (3)
- Knowledge Graph Methods
3. Construction Methodology of the Traffic Accident Knowledge Graph
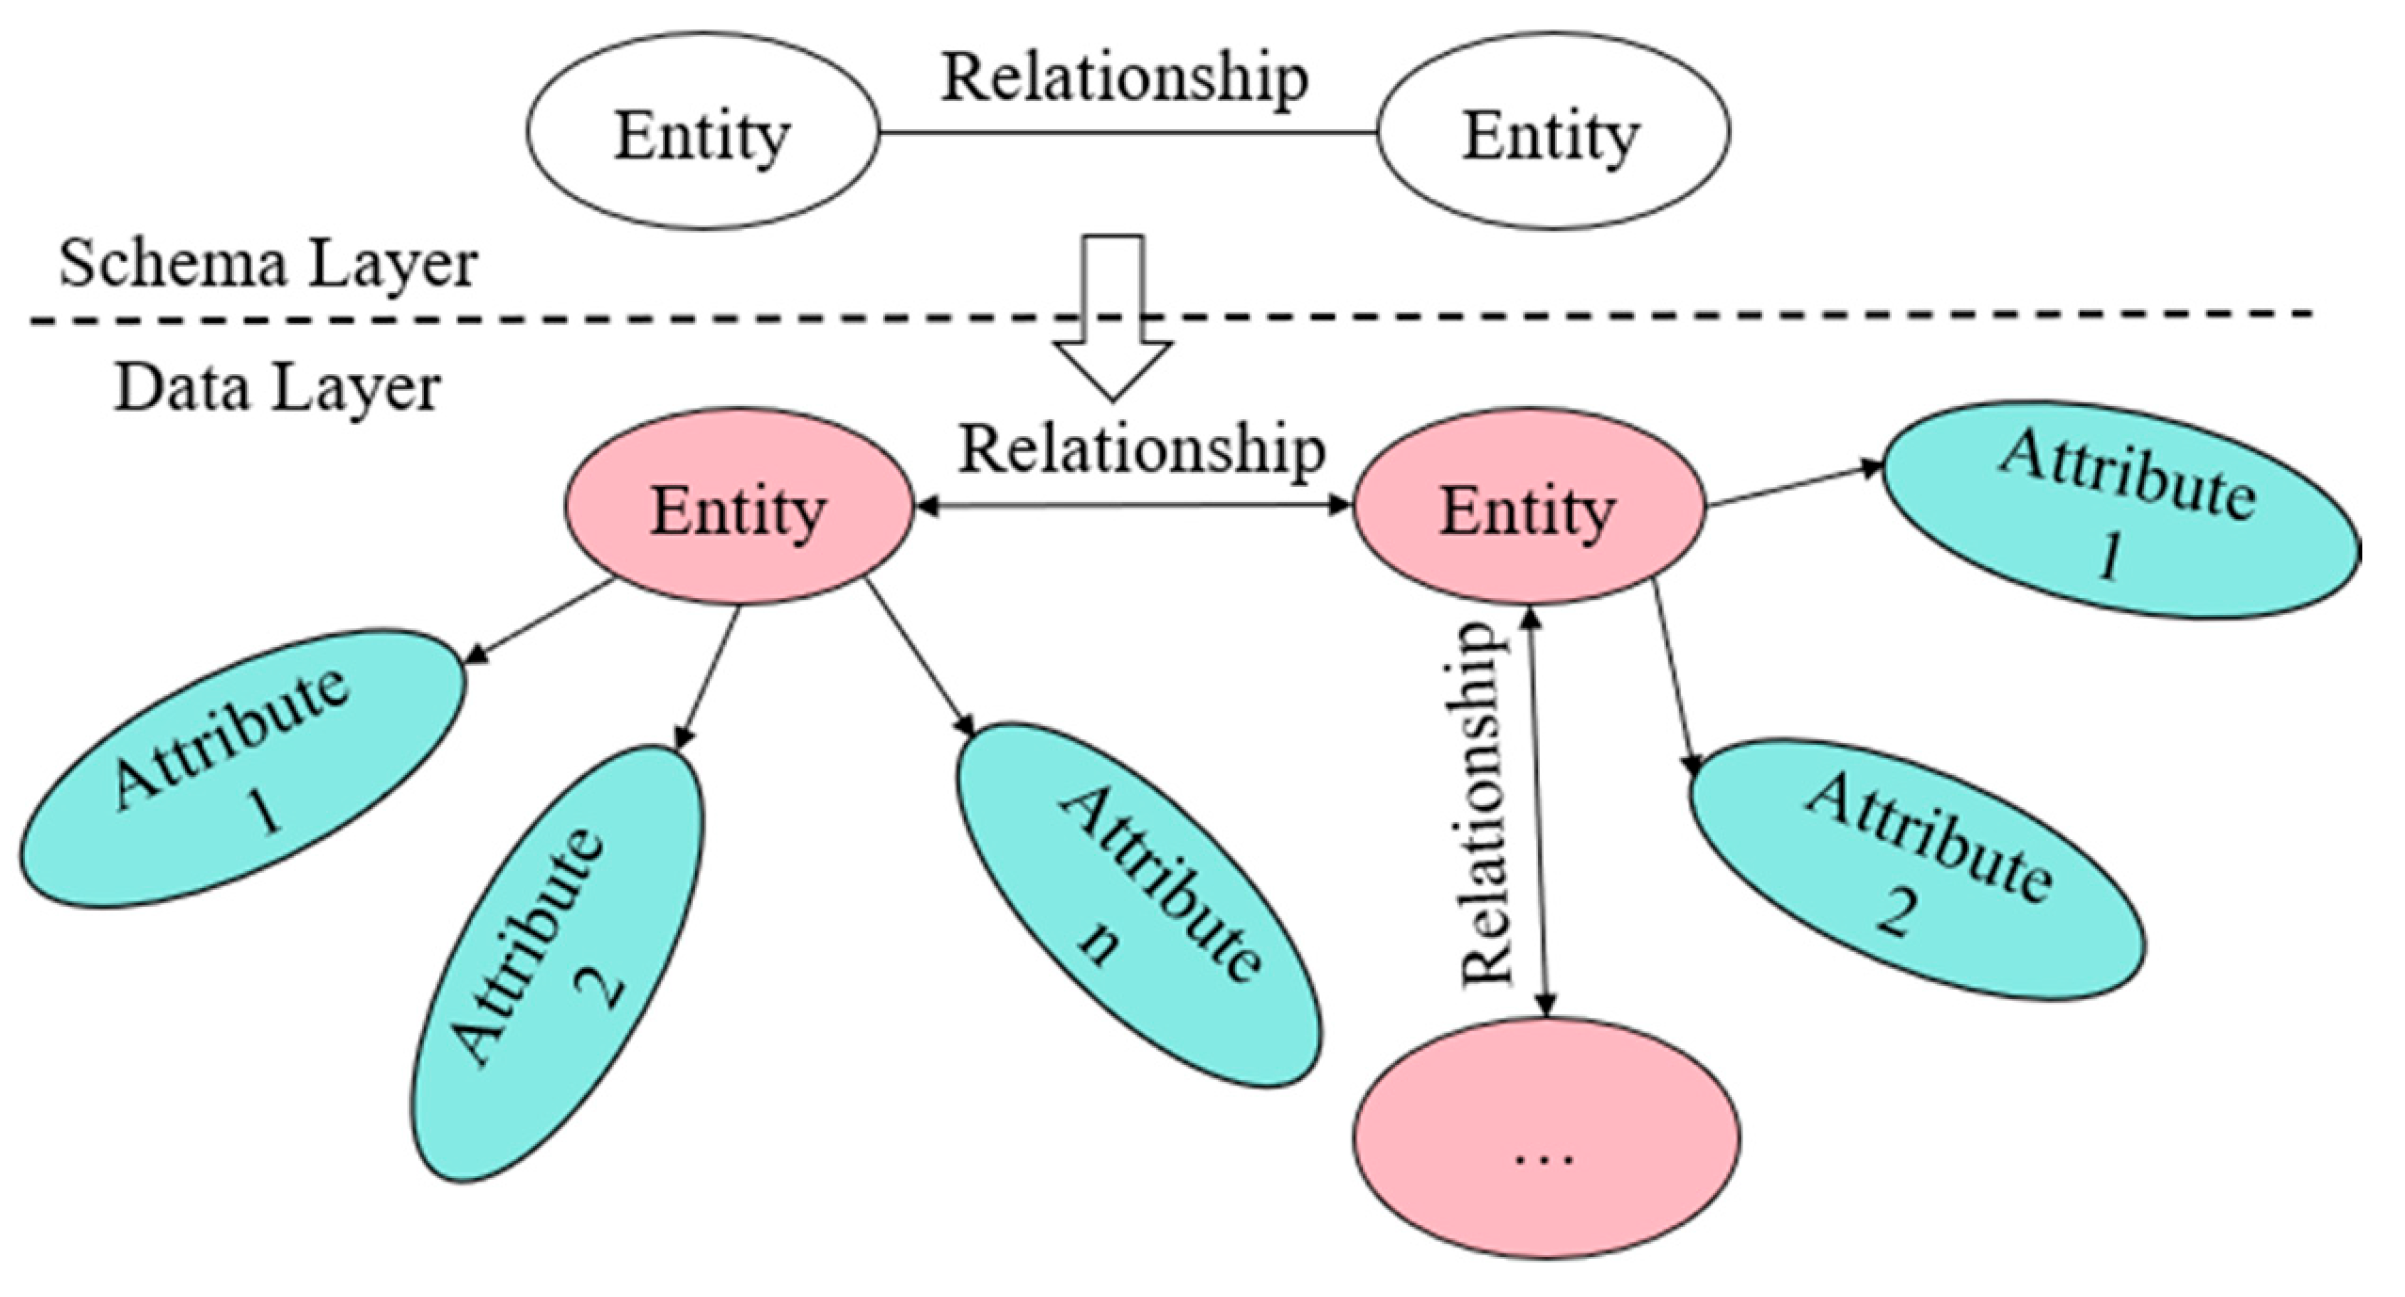
3.1. Structure of the Traffic Accident Knowledge Graph
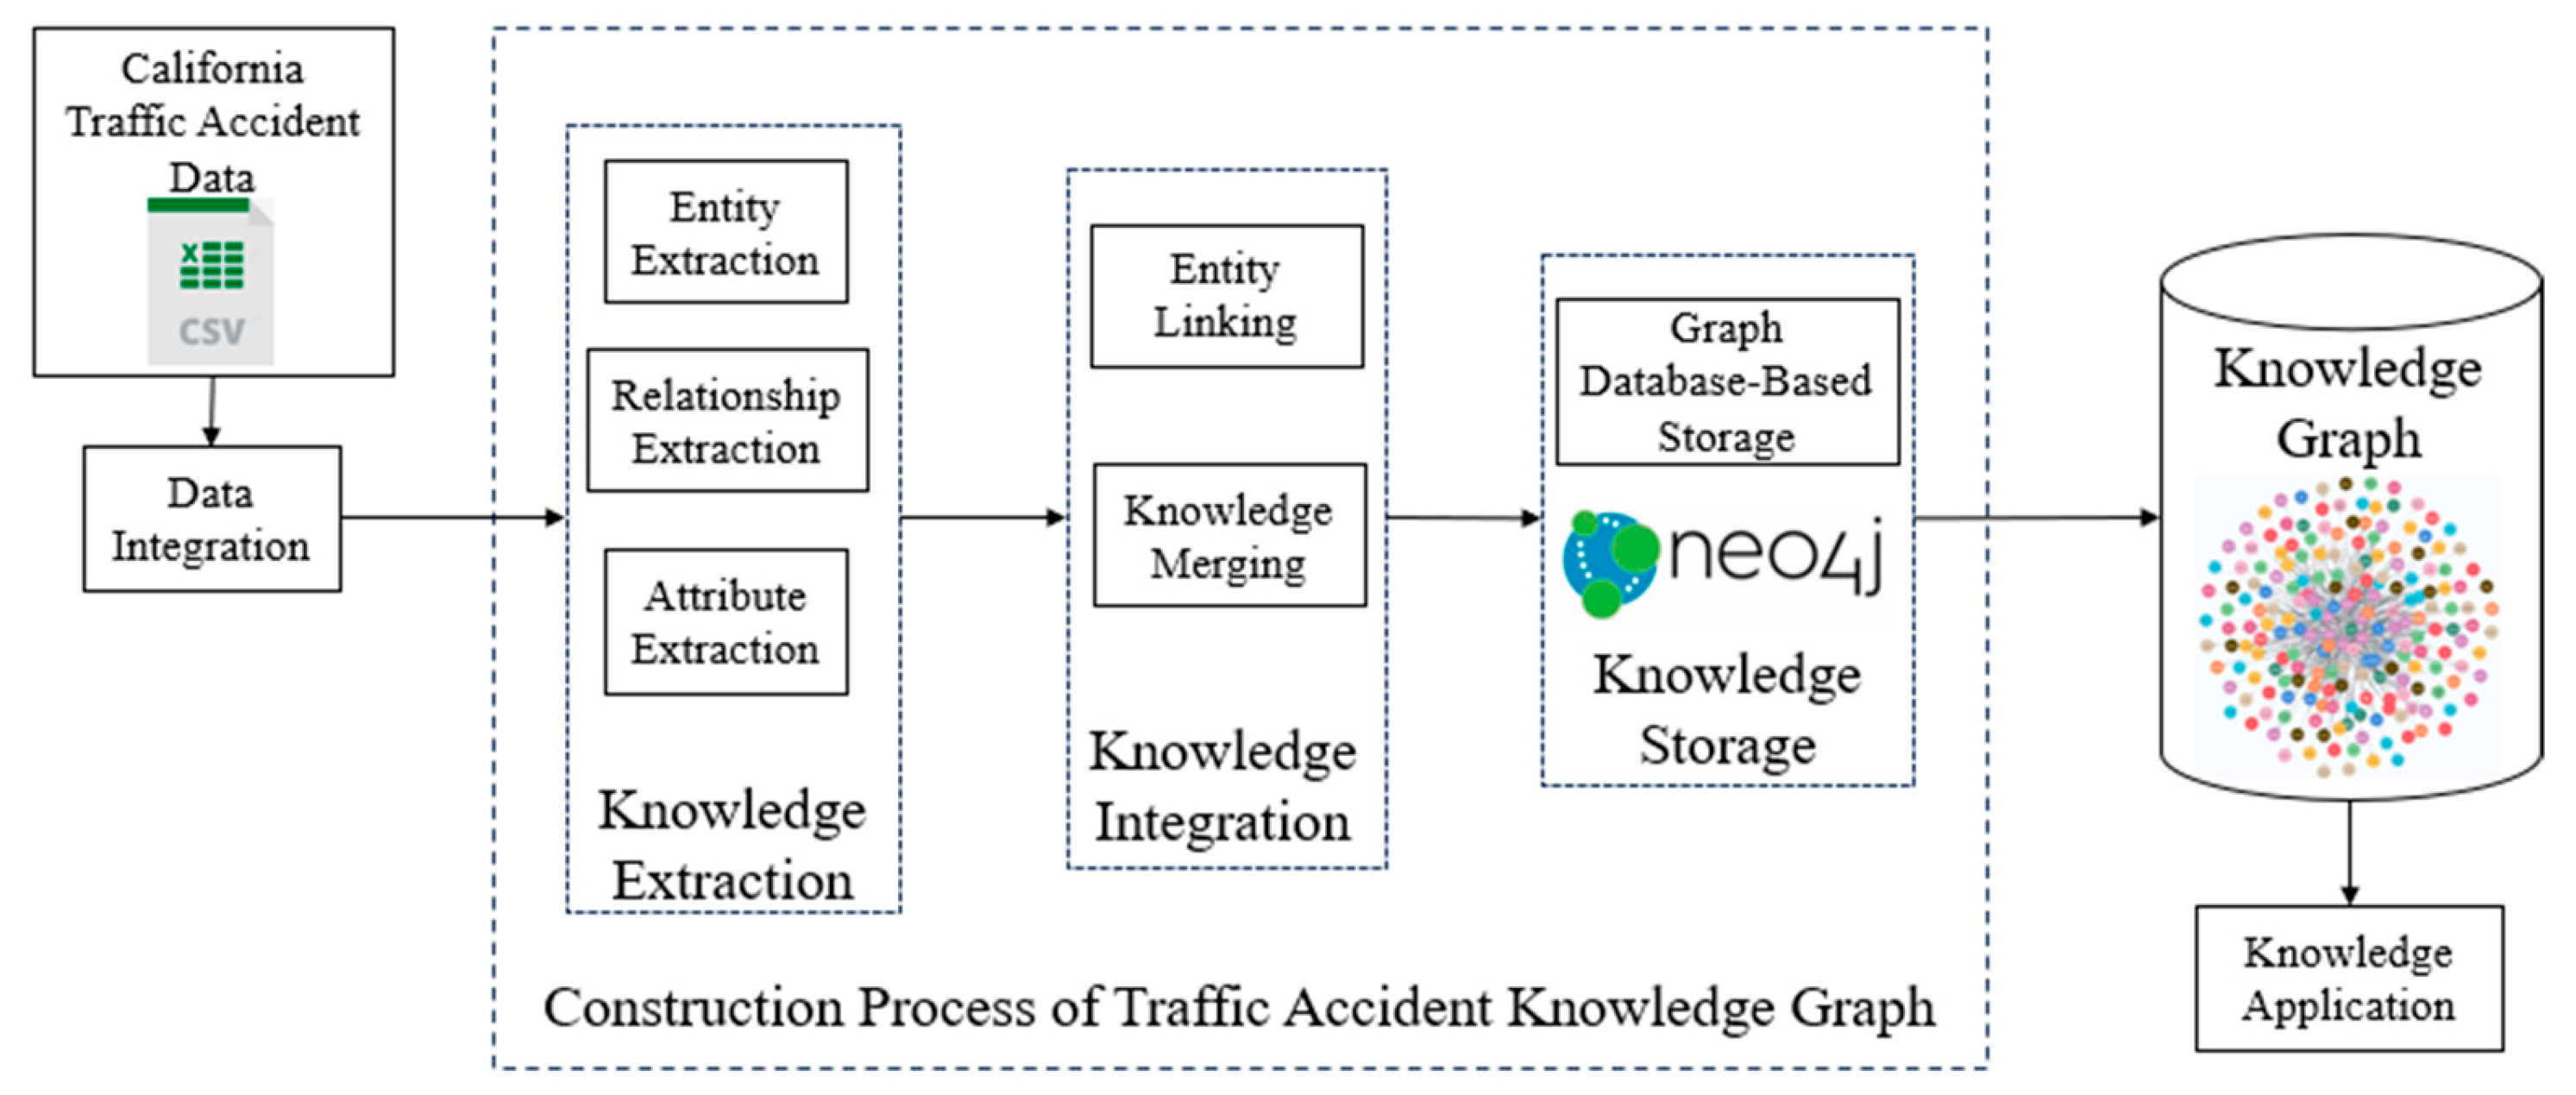
3.2. Construction of the Traffic Accident Knowledge Graph
- (1)
- Data Sources
- (2)
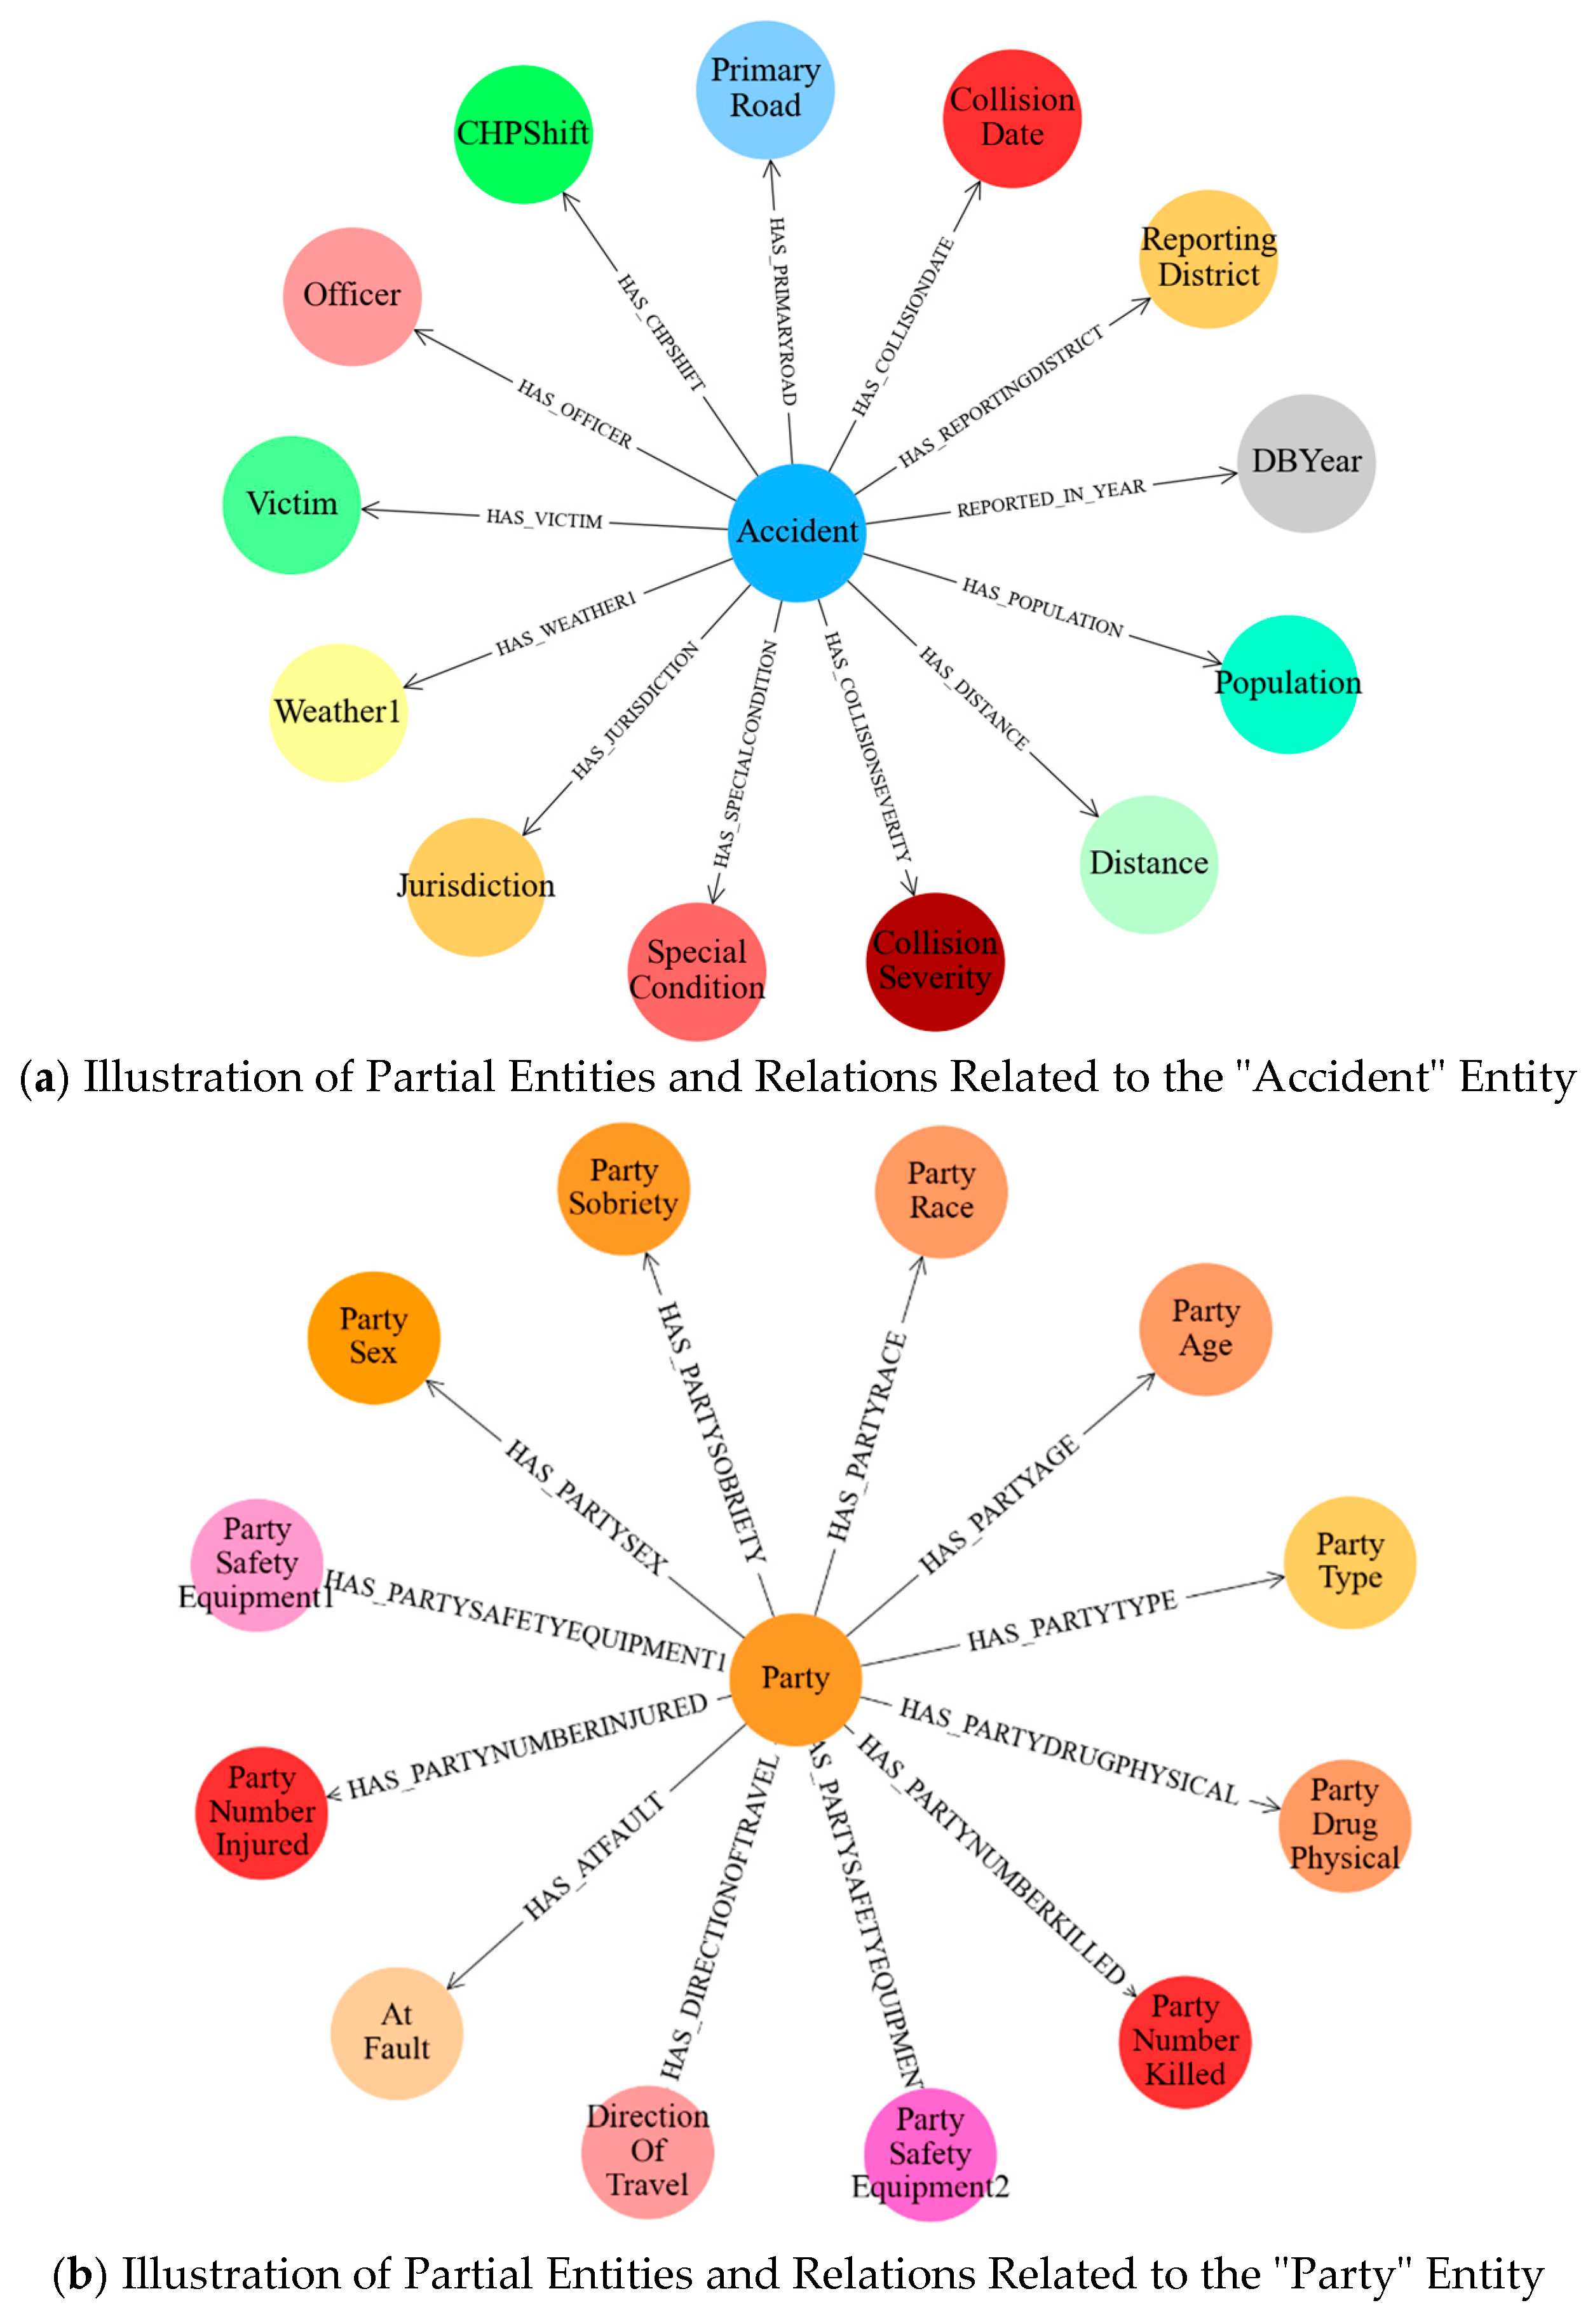
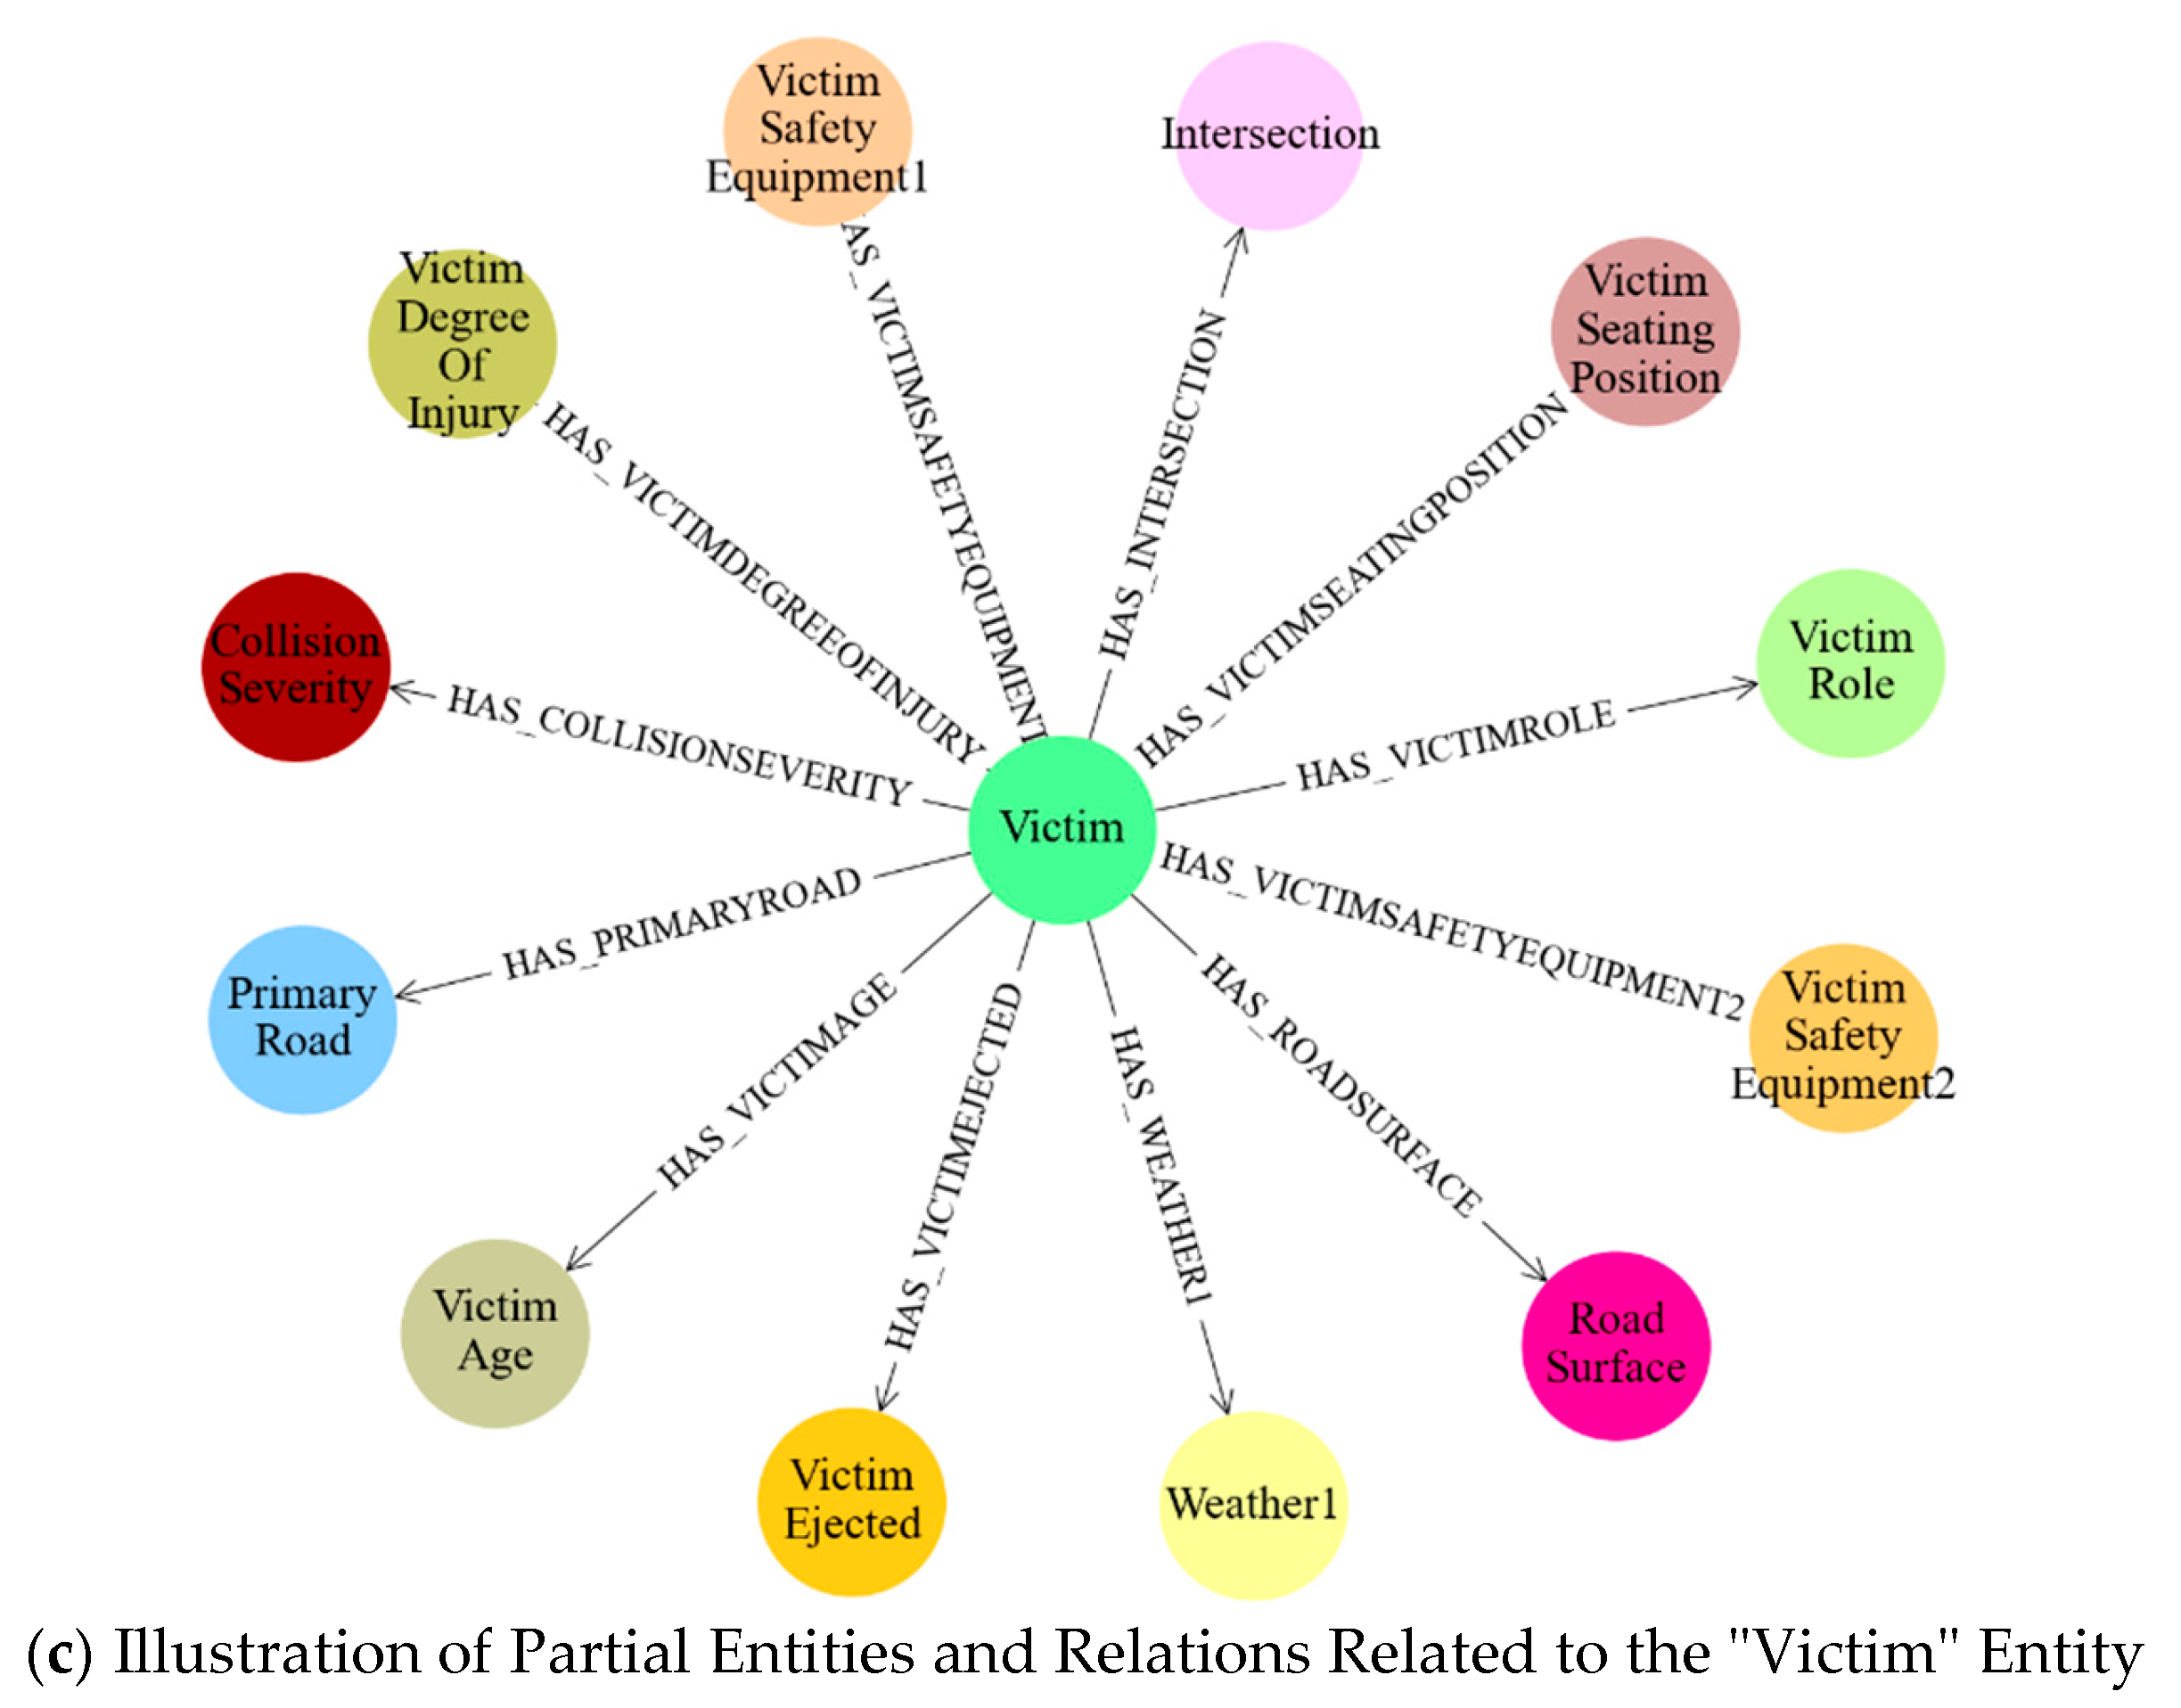
- Knowledge Graph Construction
4. Representation Learning Methods for Traffic Accident Knowledge Graphs
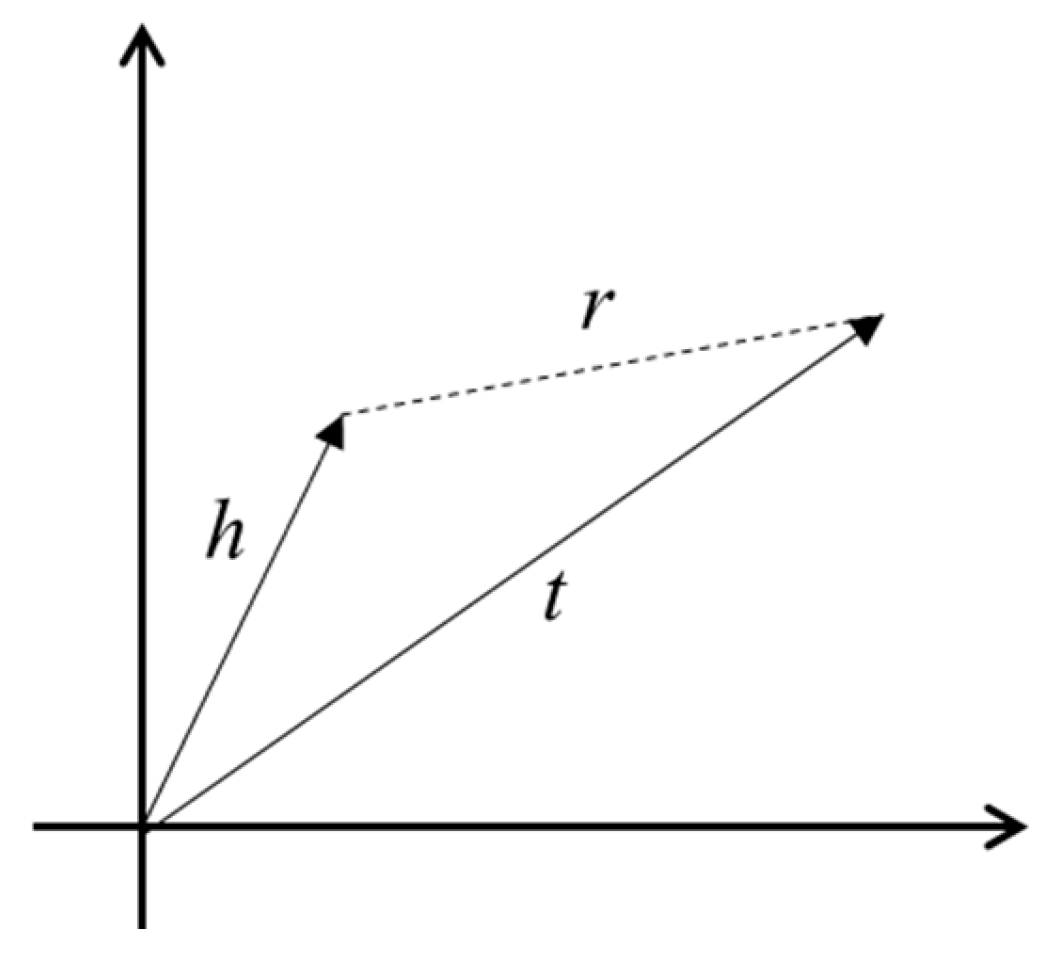
4.1. Translation-Based Embedding Methods
4.2. Representation Learning of the Traffic Accident Knowledge Graph Based on the Improved TransD Model
- (1)
- Entity and Relation Representation
- (2)
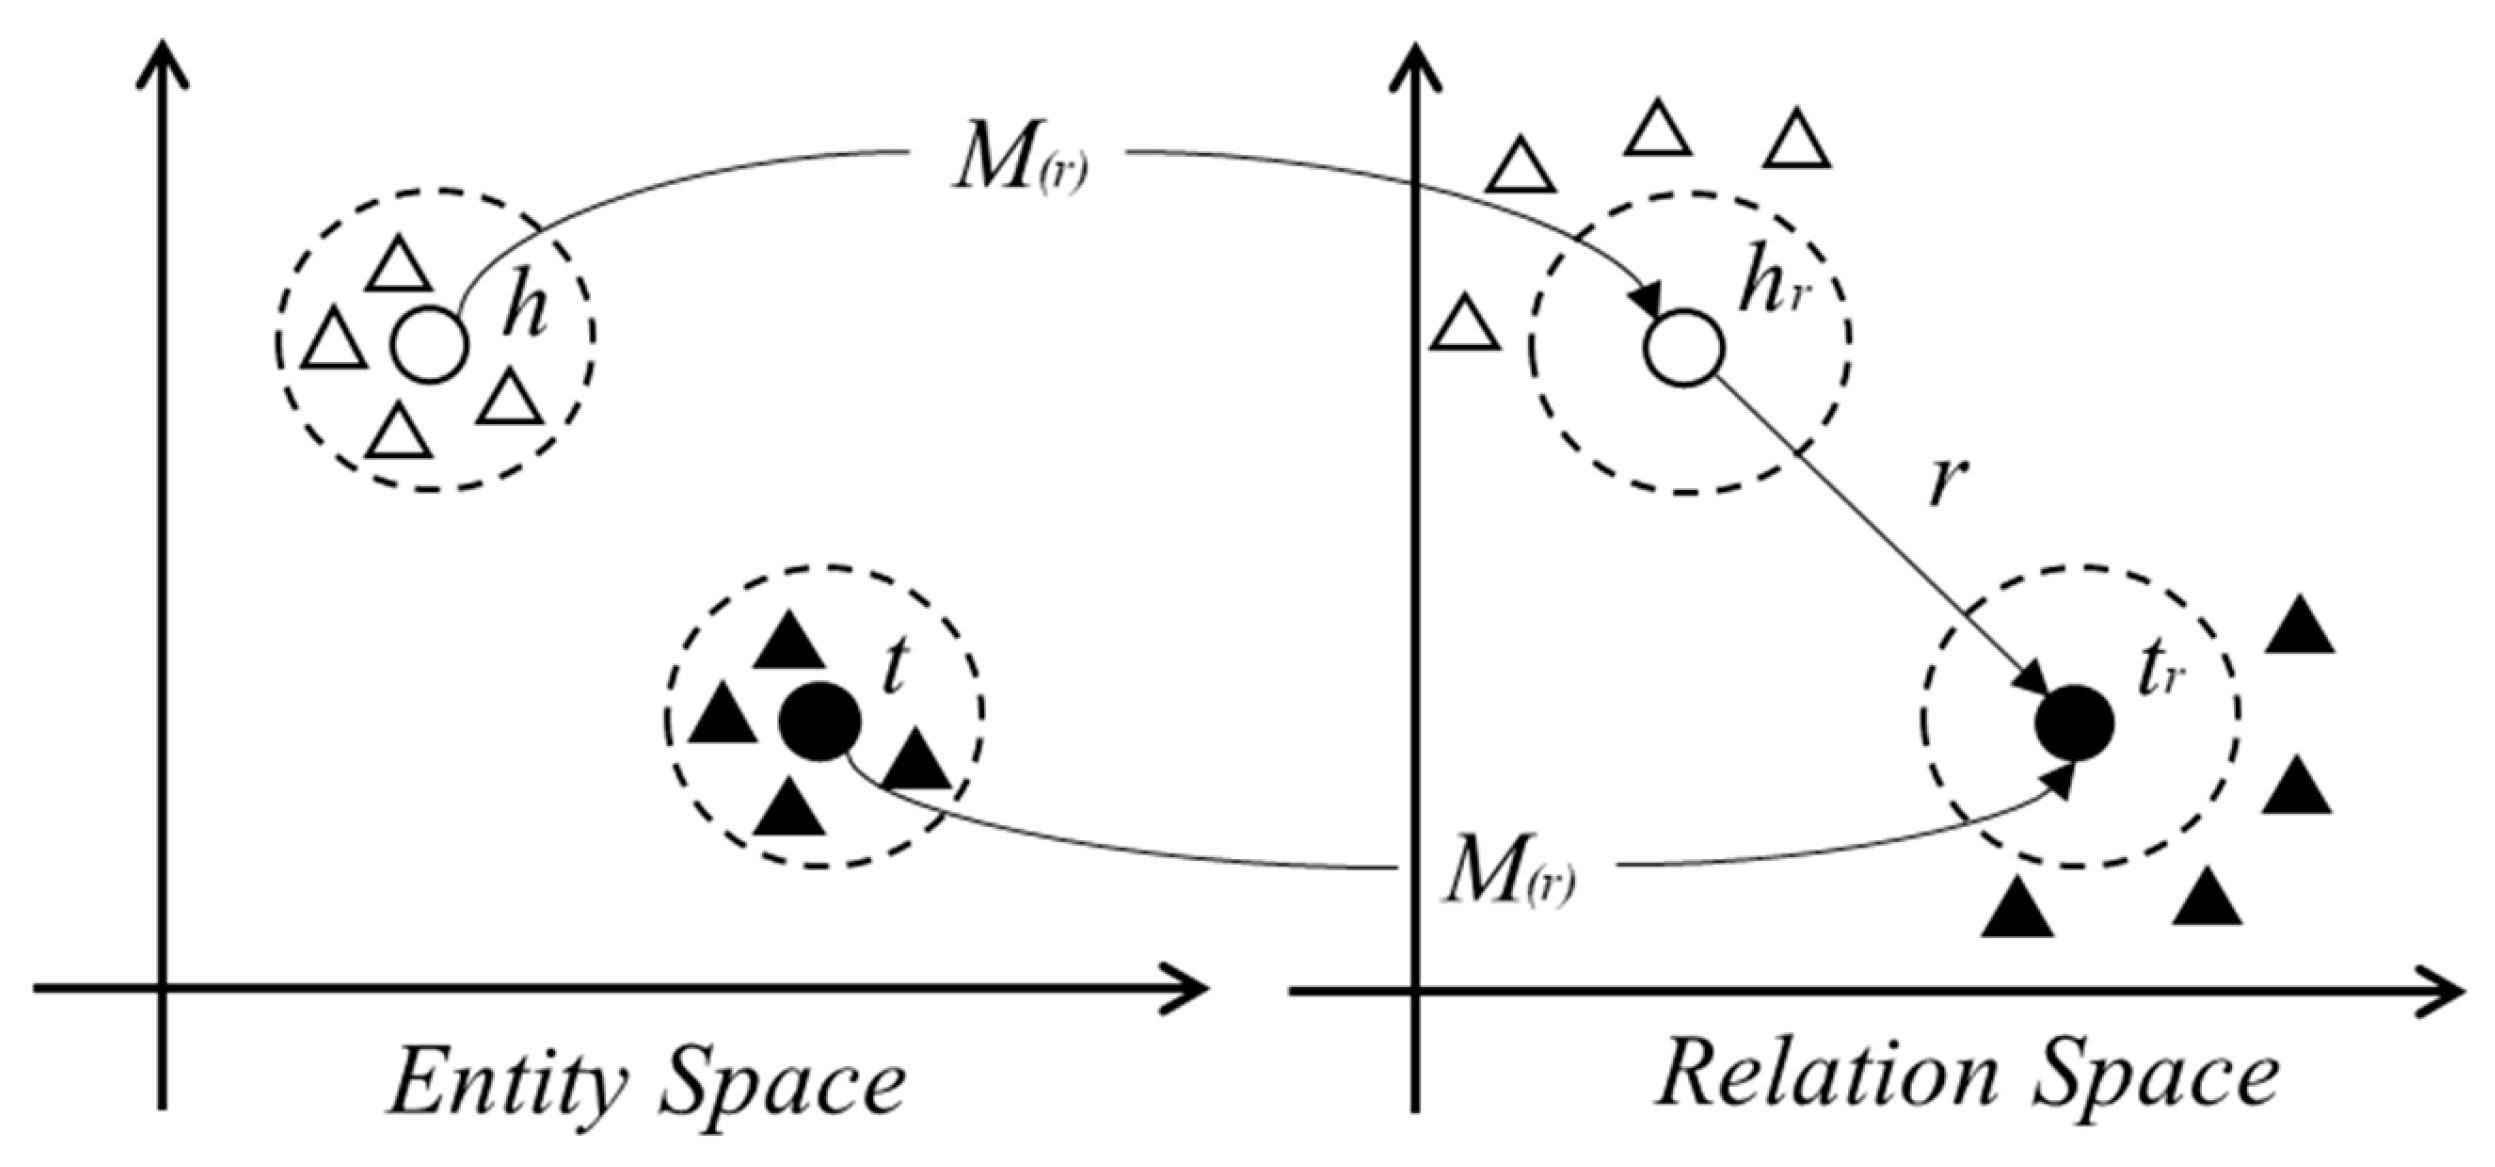
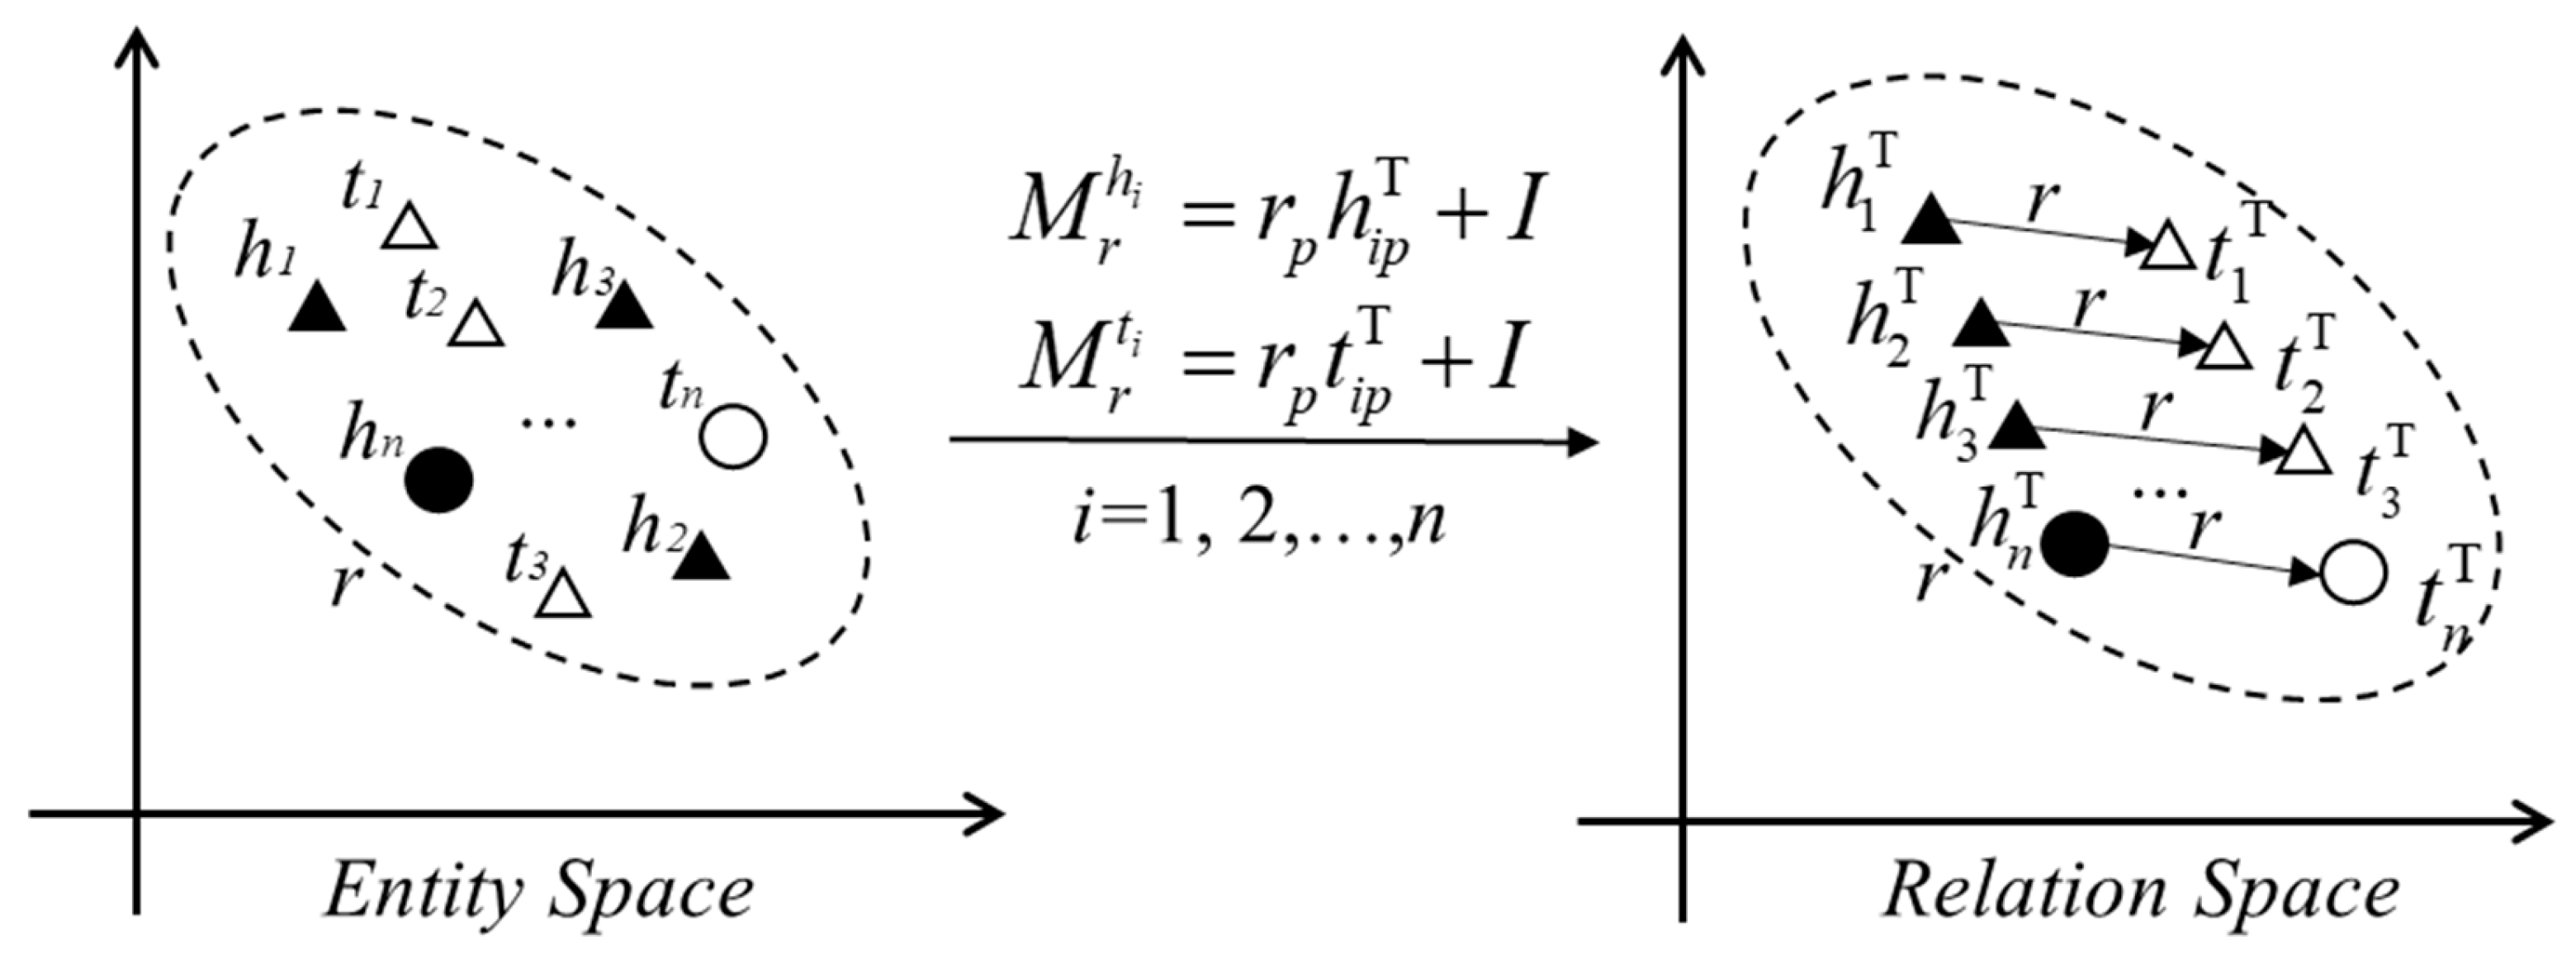
- Construction of Dynamic Mapping Matrices
- (3)
- Projected Entity Representations and Scoring Function
- (4)
- Loss Function and Training Objective
5. Experiments
5.1. Model Validation
5.2. Model Application
6. Discussion
- (1)
- The attribute projection vector enhances sensitivity to semantic differences by explicitly encoding domain attributes;
- (2)
- The dual-limit scoring loss independently constrains positive and negative sample boundaries, improving recall and classification accuracy;
- (3)
- Their combined use achieves a balanced optimization of representational capacity and discriminative power;
- (4)
- Embedding dimensionality and hyperparameter settings critically affect model generalization and must be tuned in accordance with dataset characteristics.
7. Conclusions
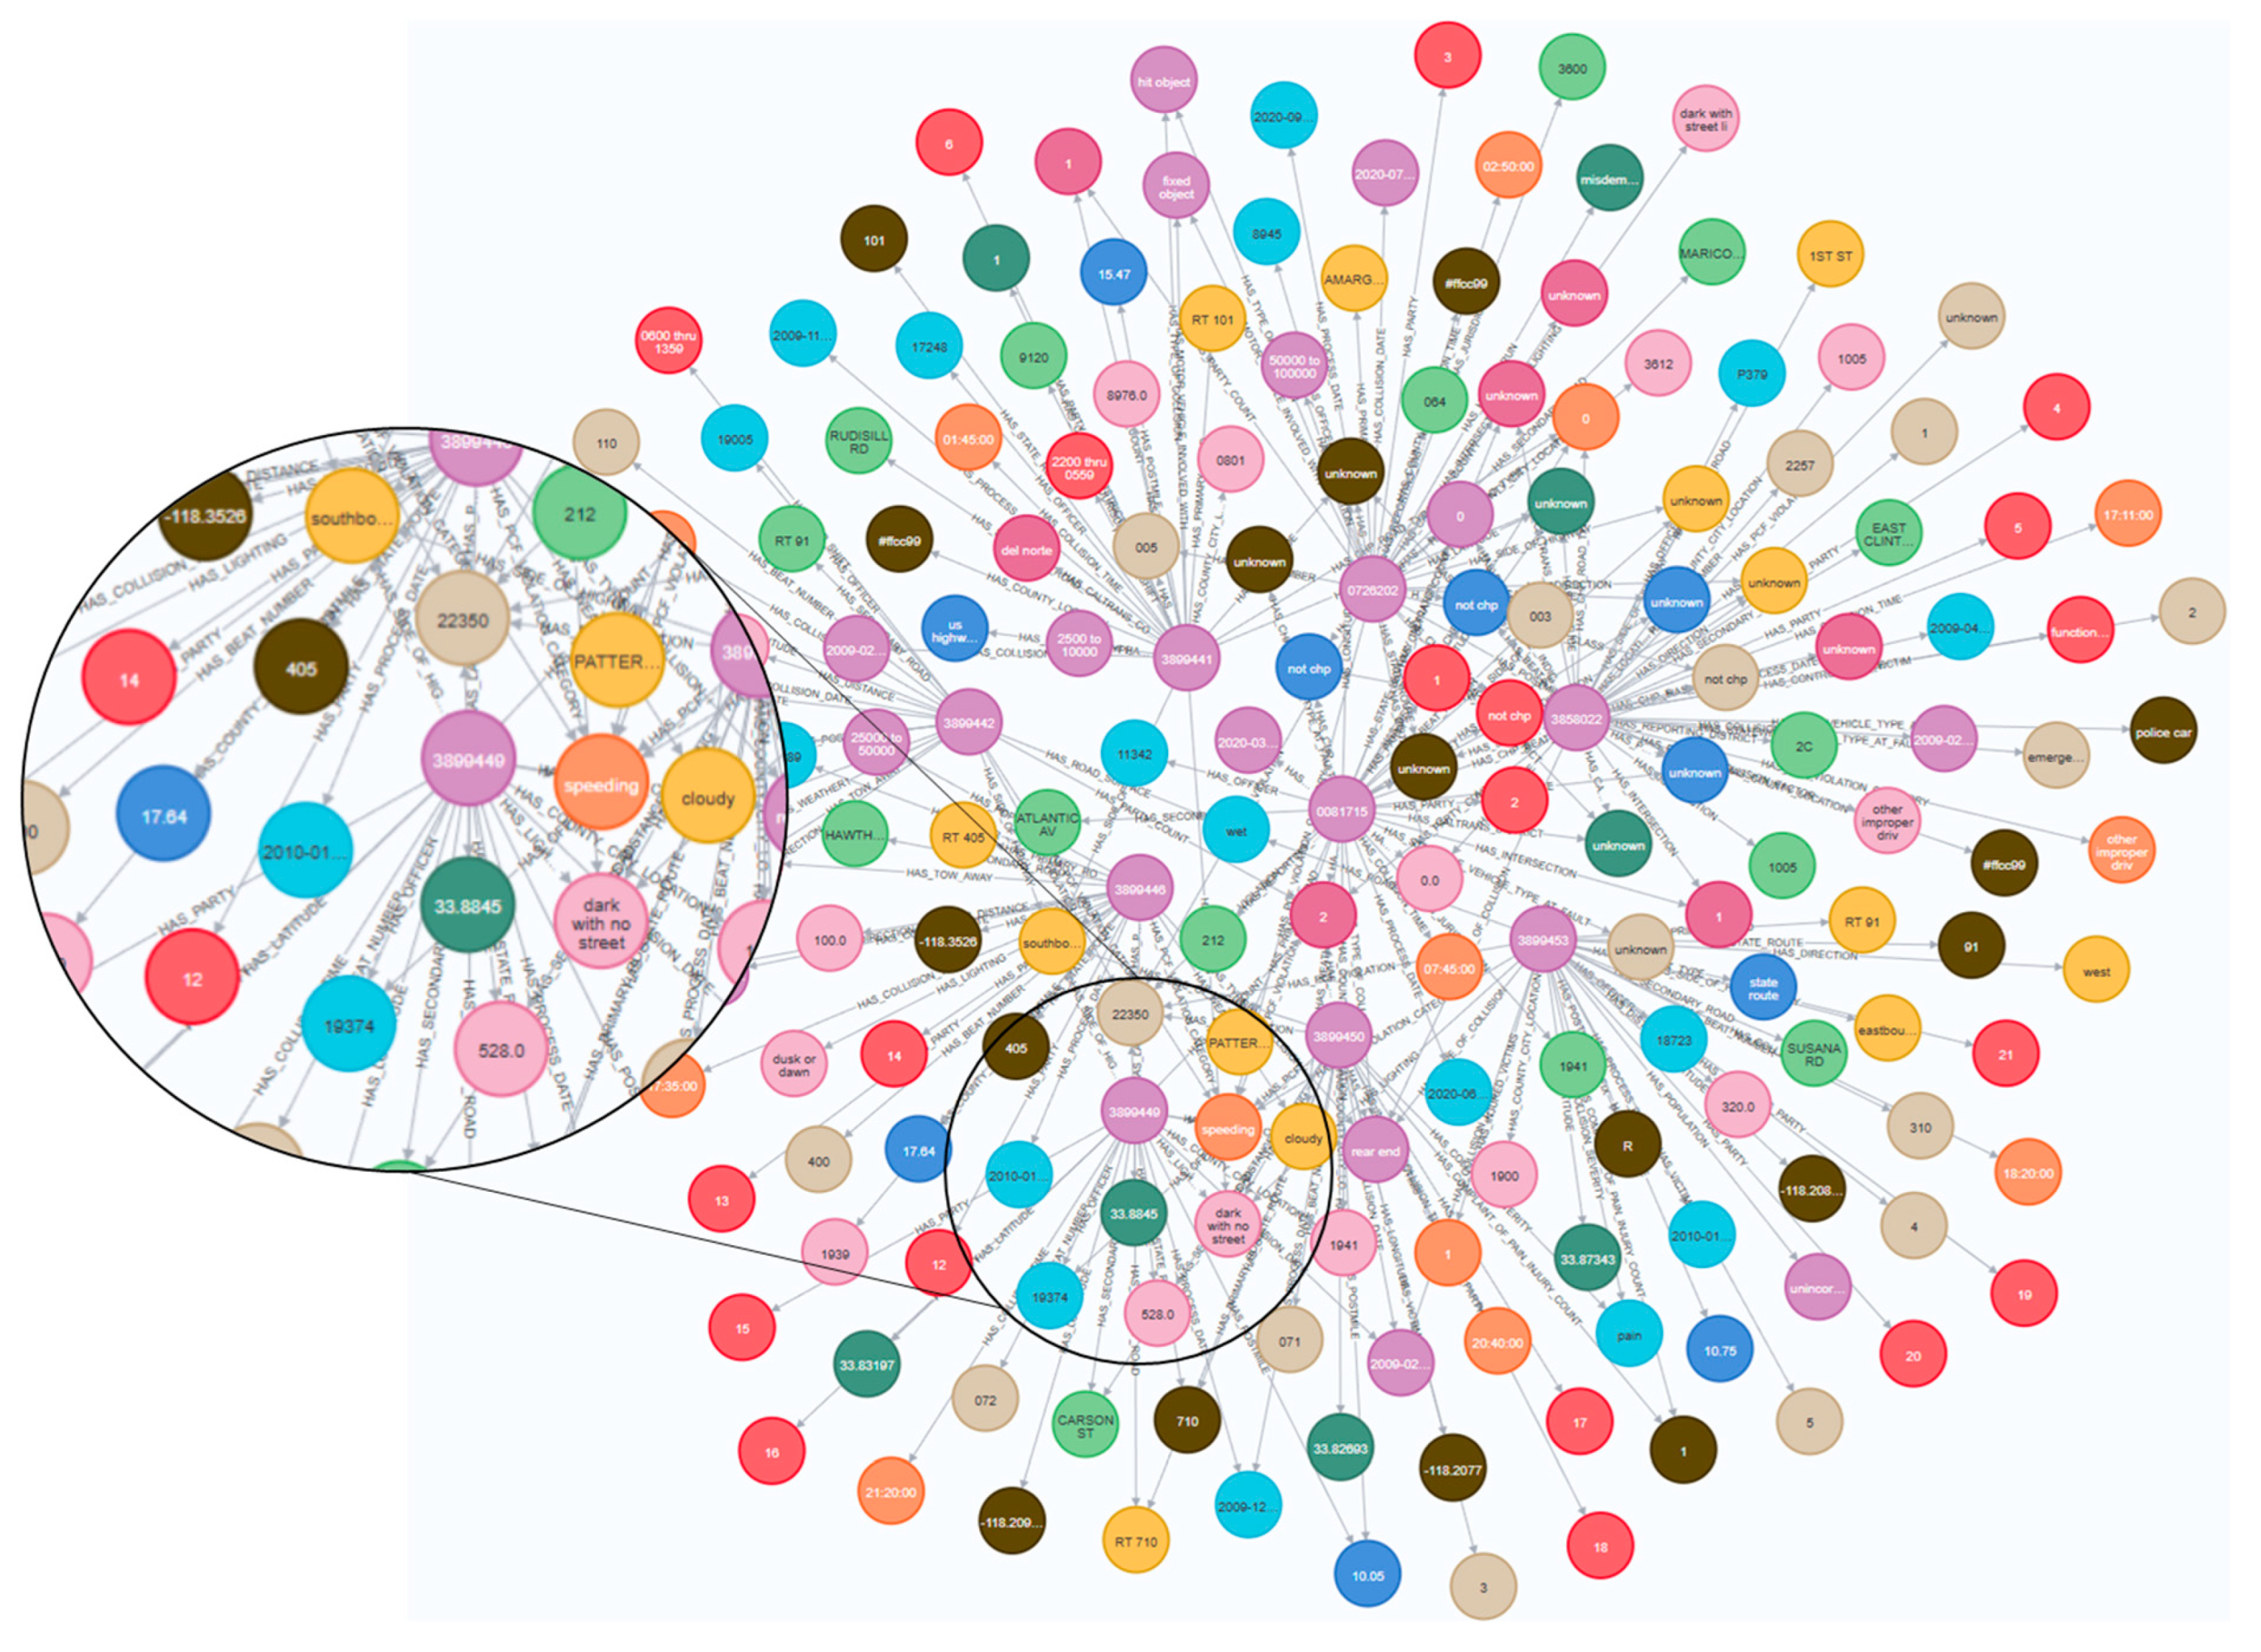
- Knowledge Graph Construction: Guided by a top-down ontology design principle, we constructed a multi-layered traffic accident knowledge graph that integrates entities such as accident events, involved parties, victims, and environmental factors. This graph efficiently consolidates over 120 accident attributes and supports intuitive visualization, thereby providing a unified data platform for causal relationship mining and risk prediction.
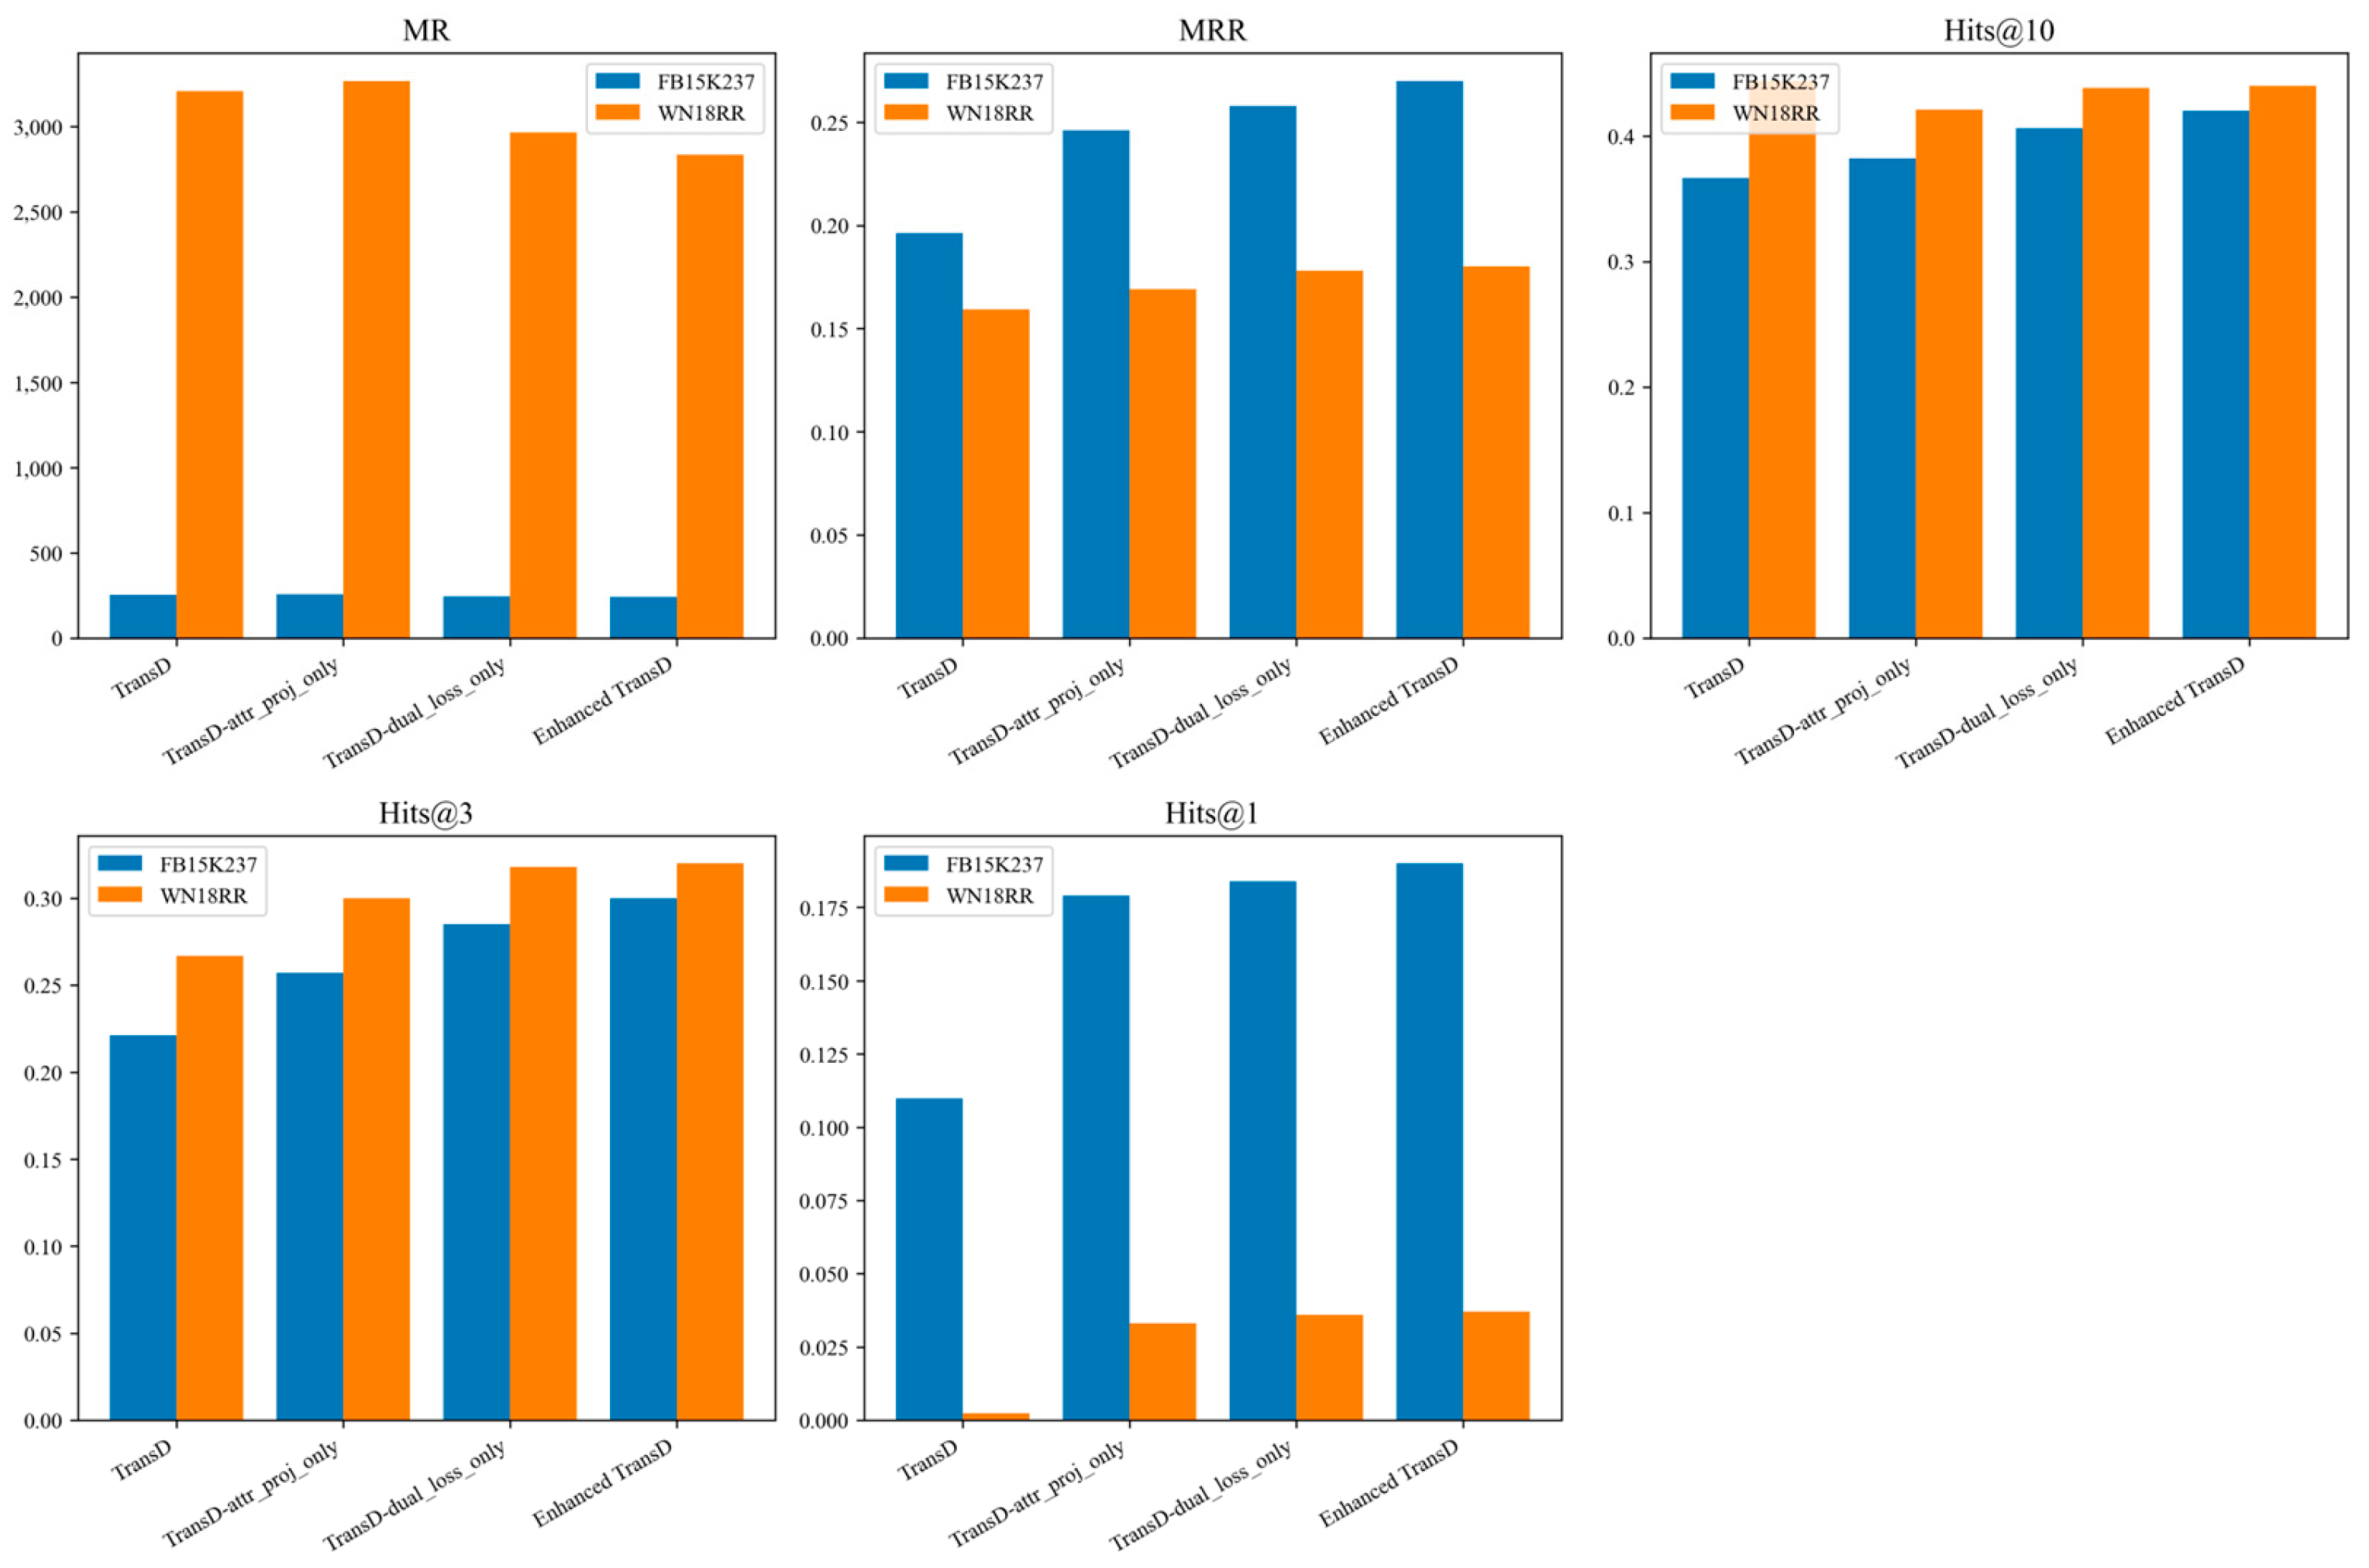
- Improved TransD Model: By introducing attribute projection vectors, domain-specific features—such as “accident severity” and “road slipperiness”—are explicitly encoded into the dynamic mapping matrices. Furthermore, a dual-limit scoring loss enforces clearer separation between positive and negative samples in the embedding space. This enhancement balances representational expressiveness with parameter efficiency and overcomes performance bottlenecks in complex mapping scenarios.
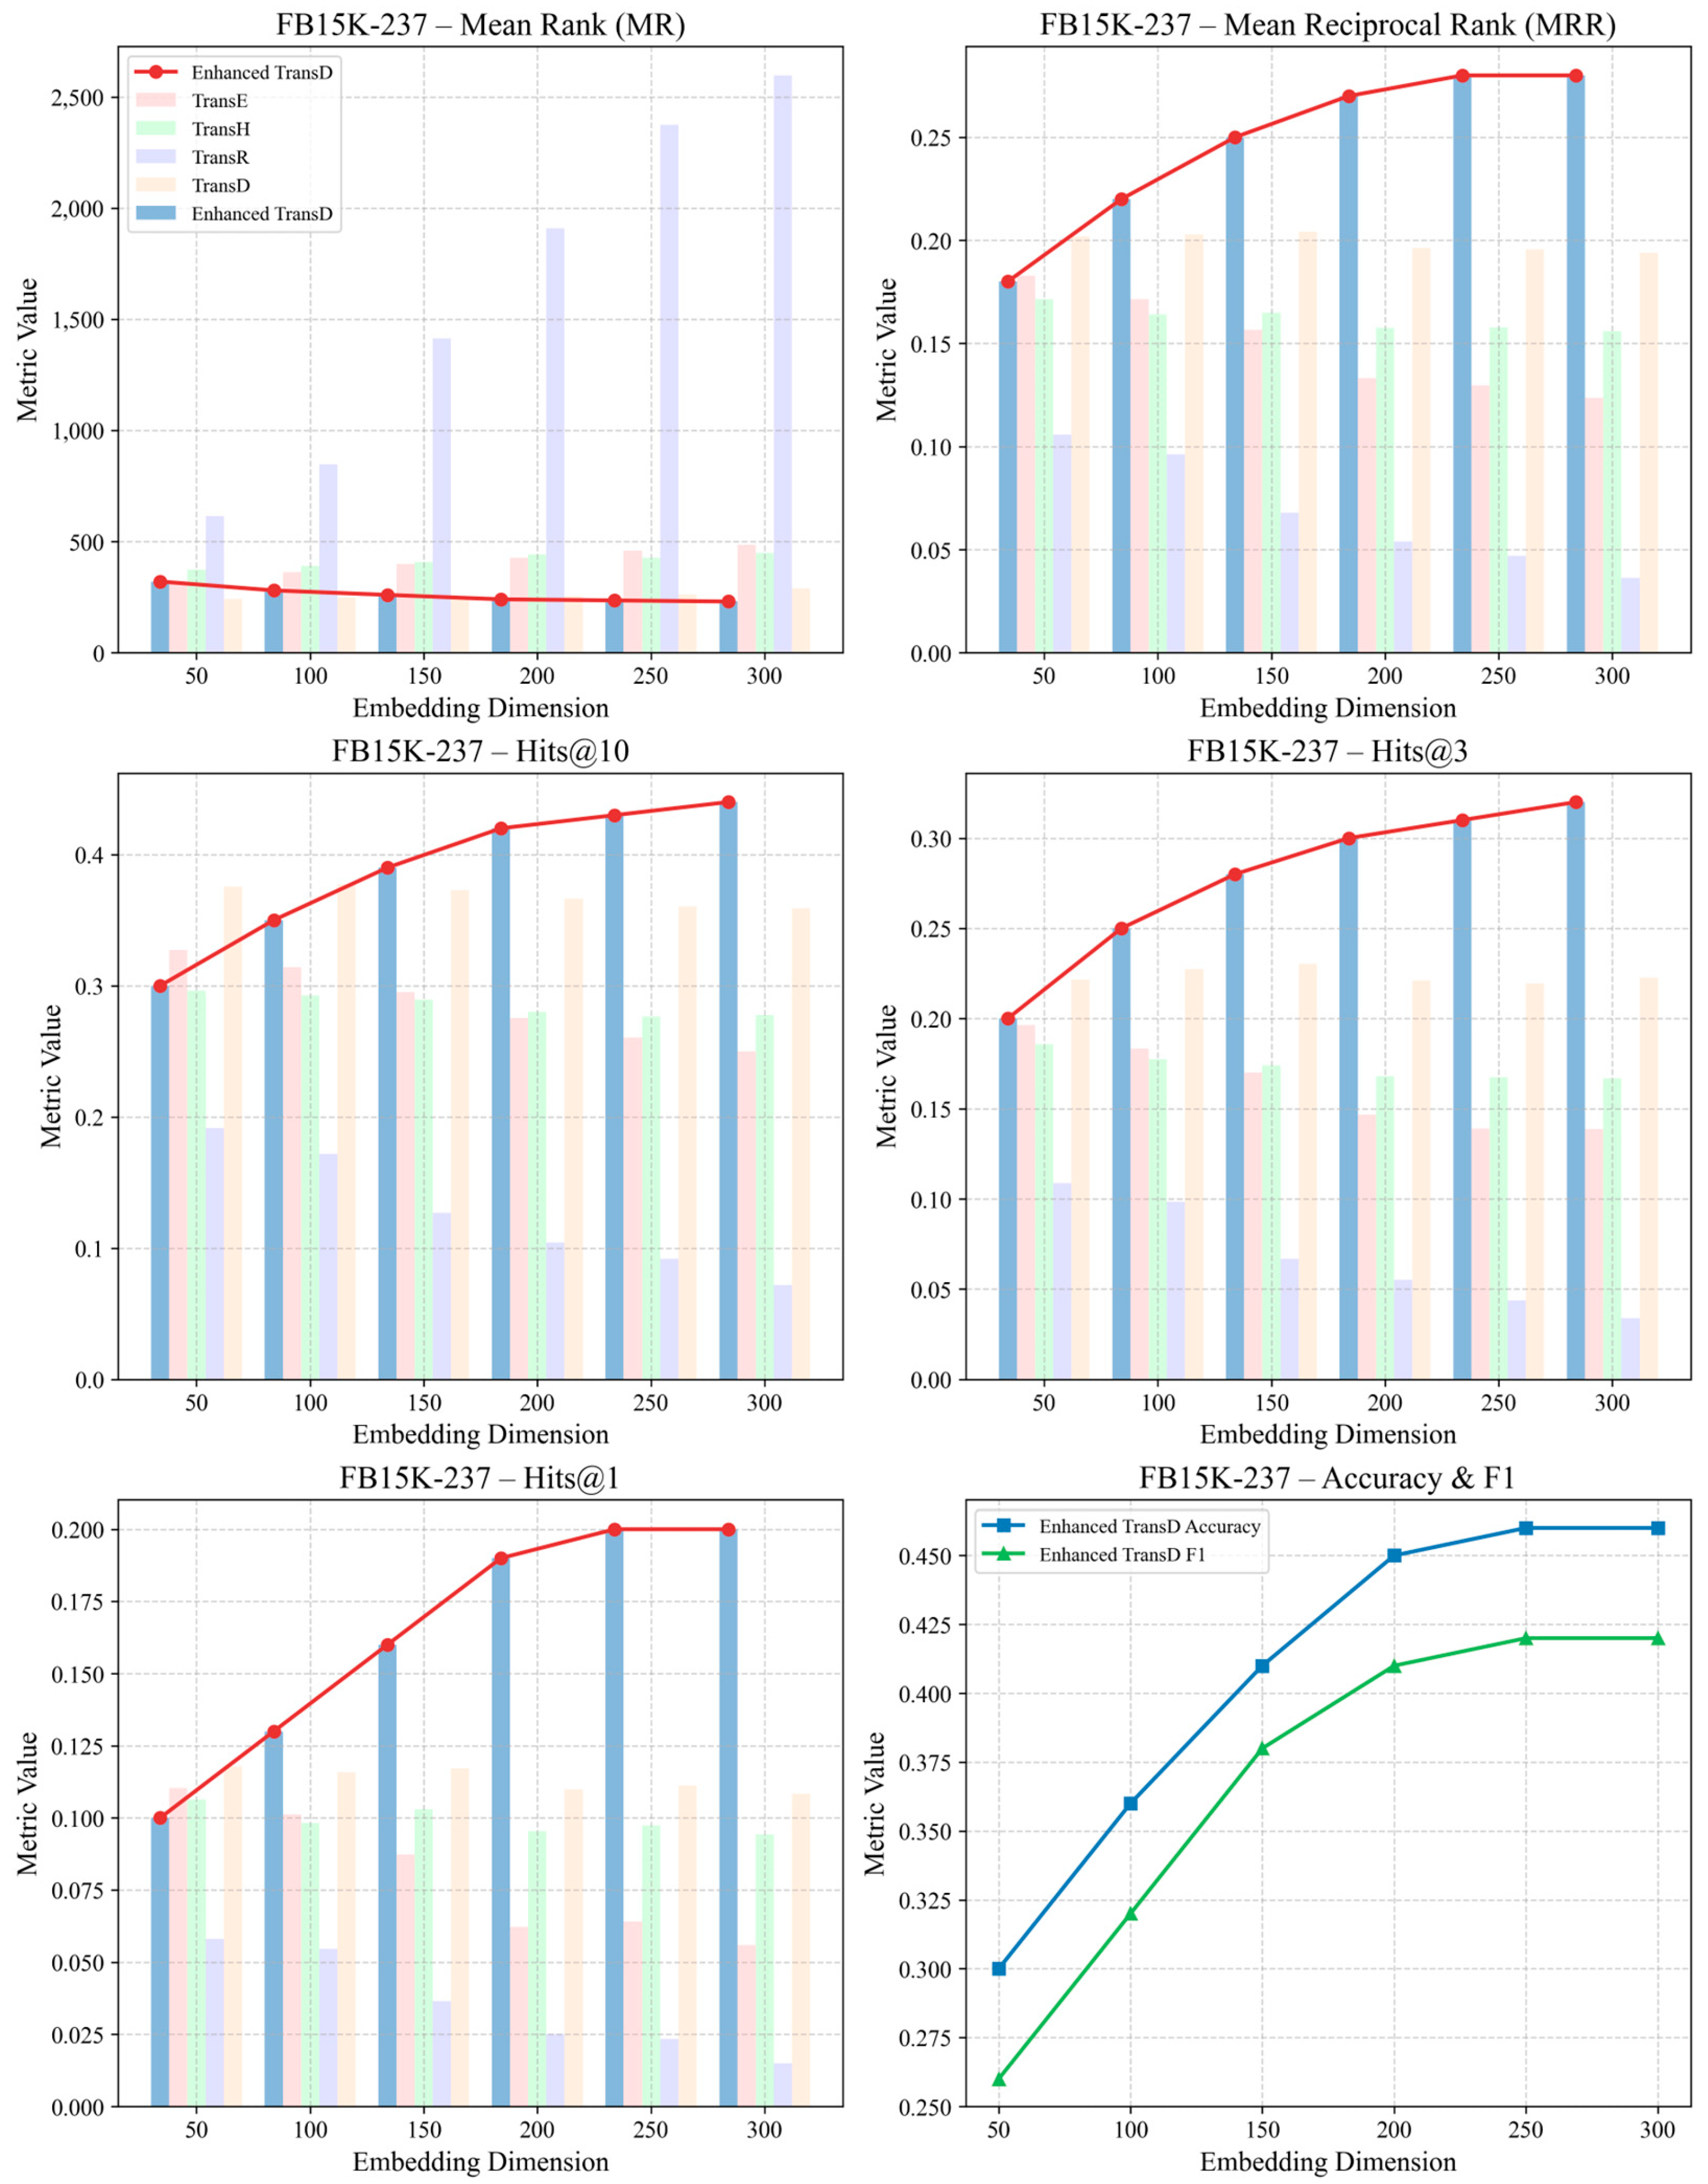
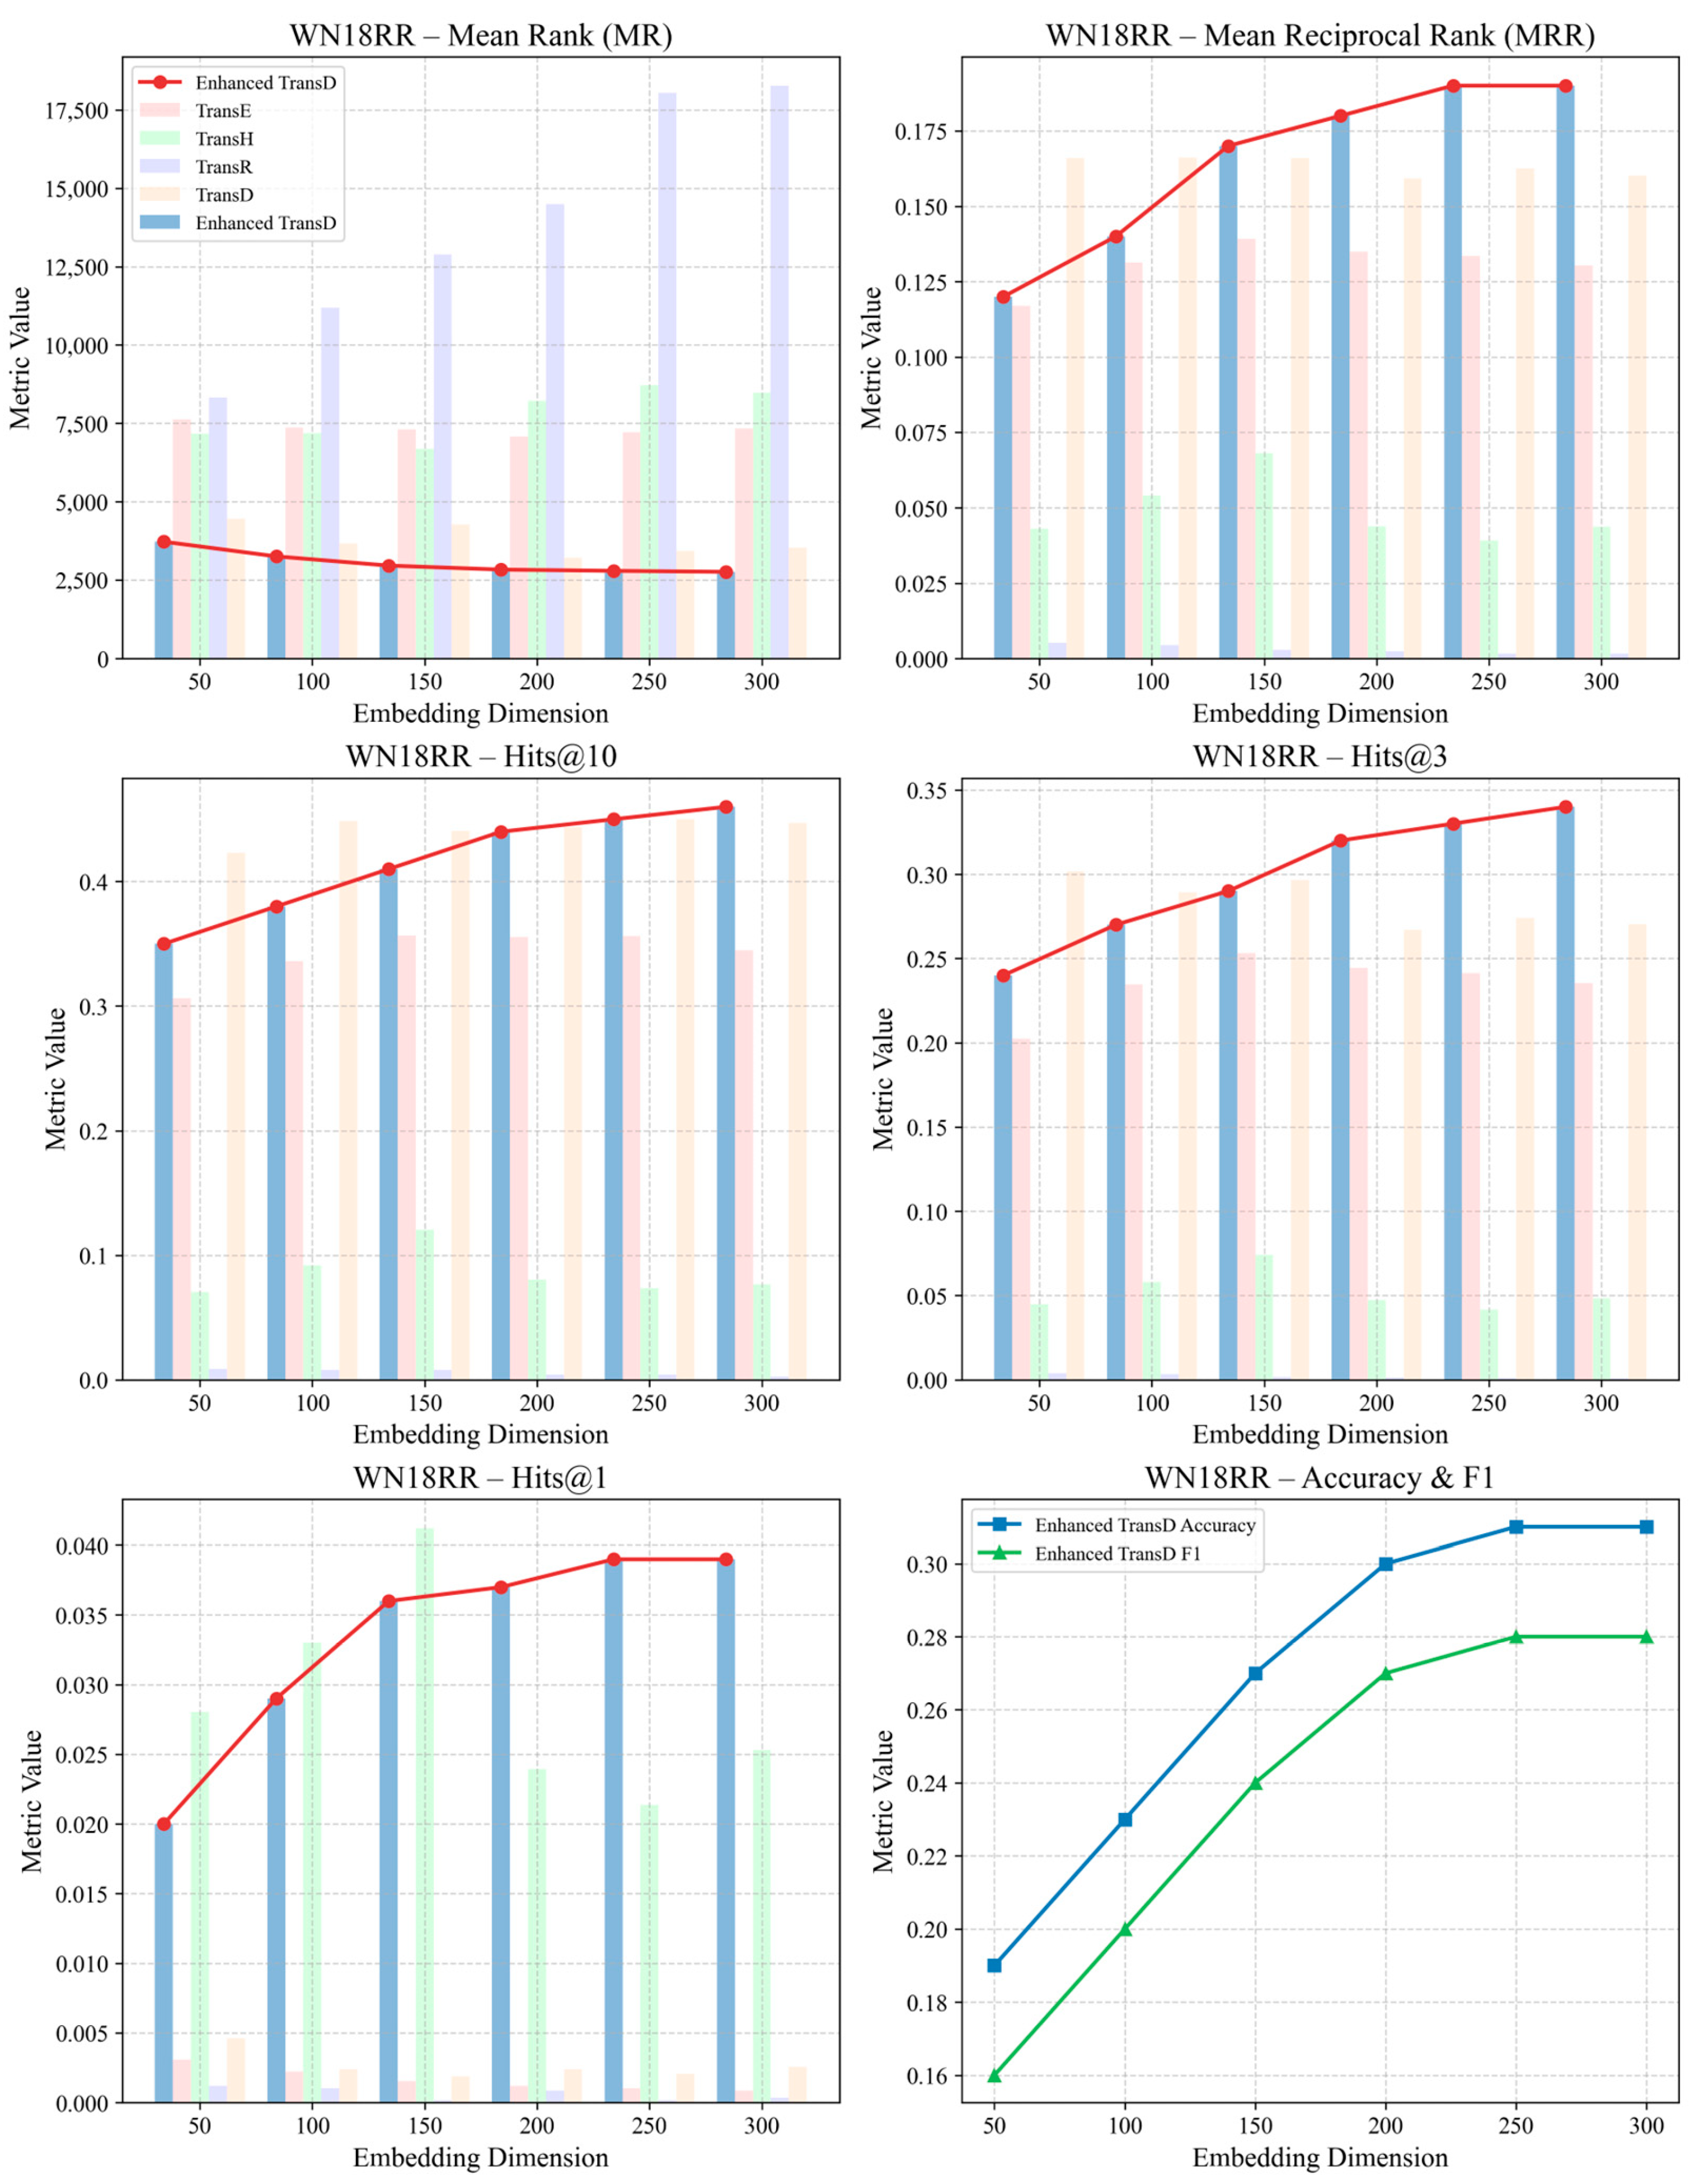
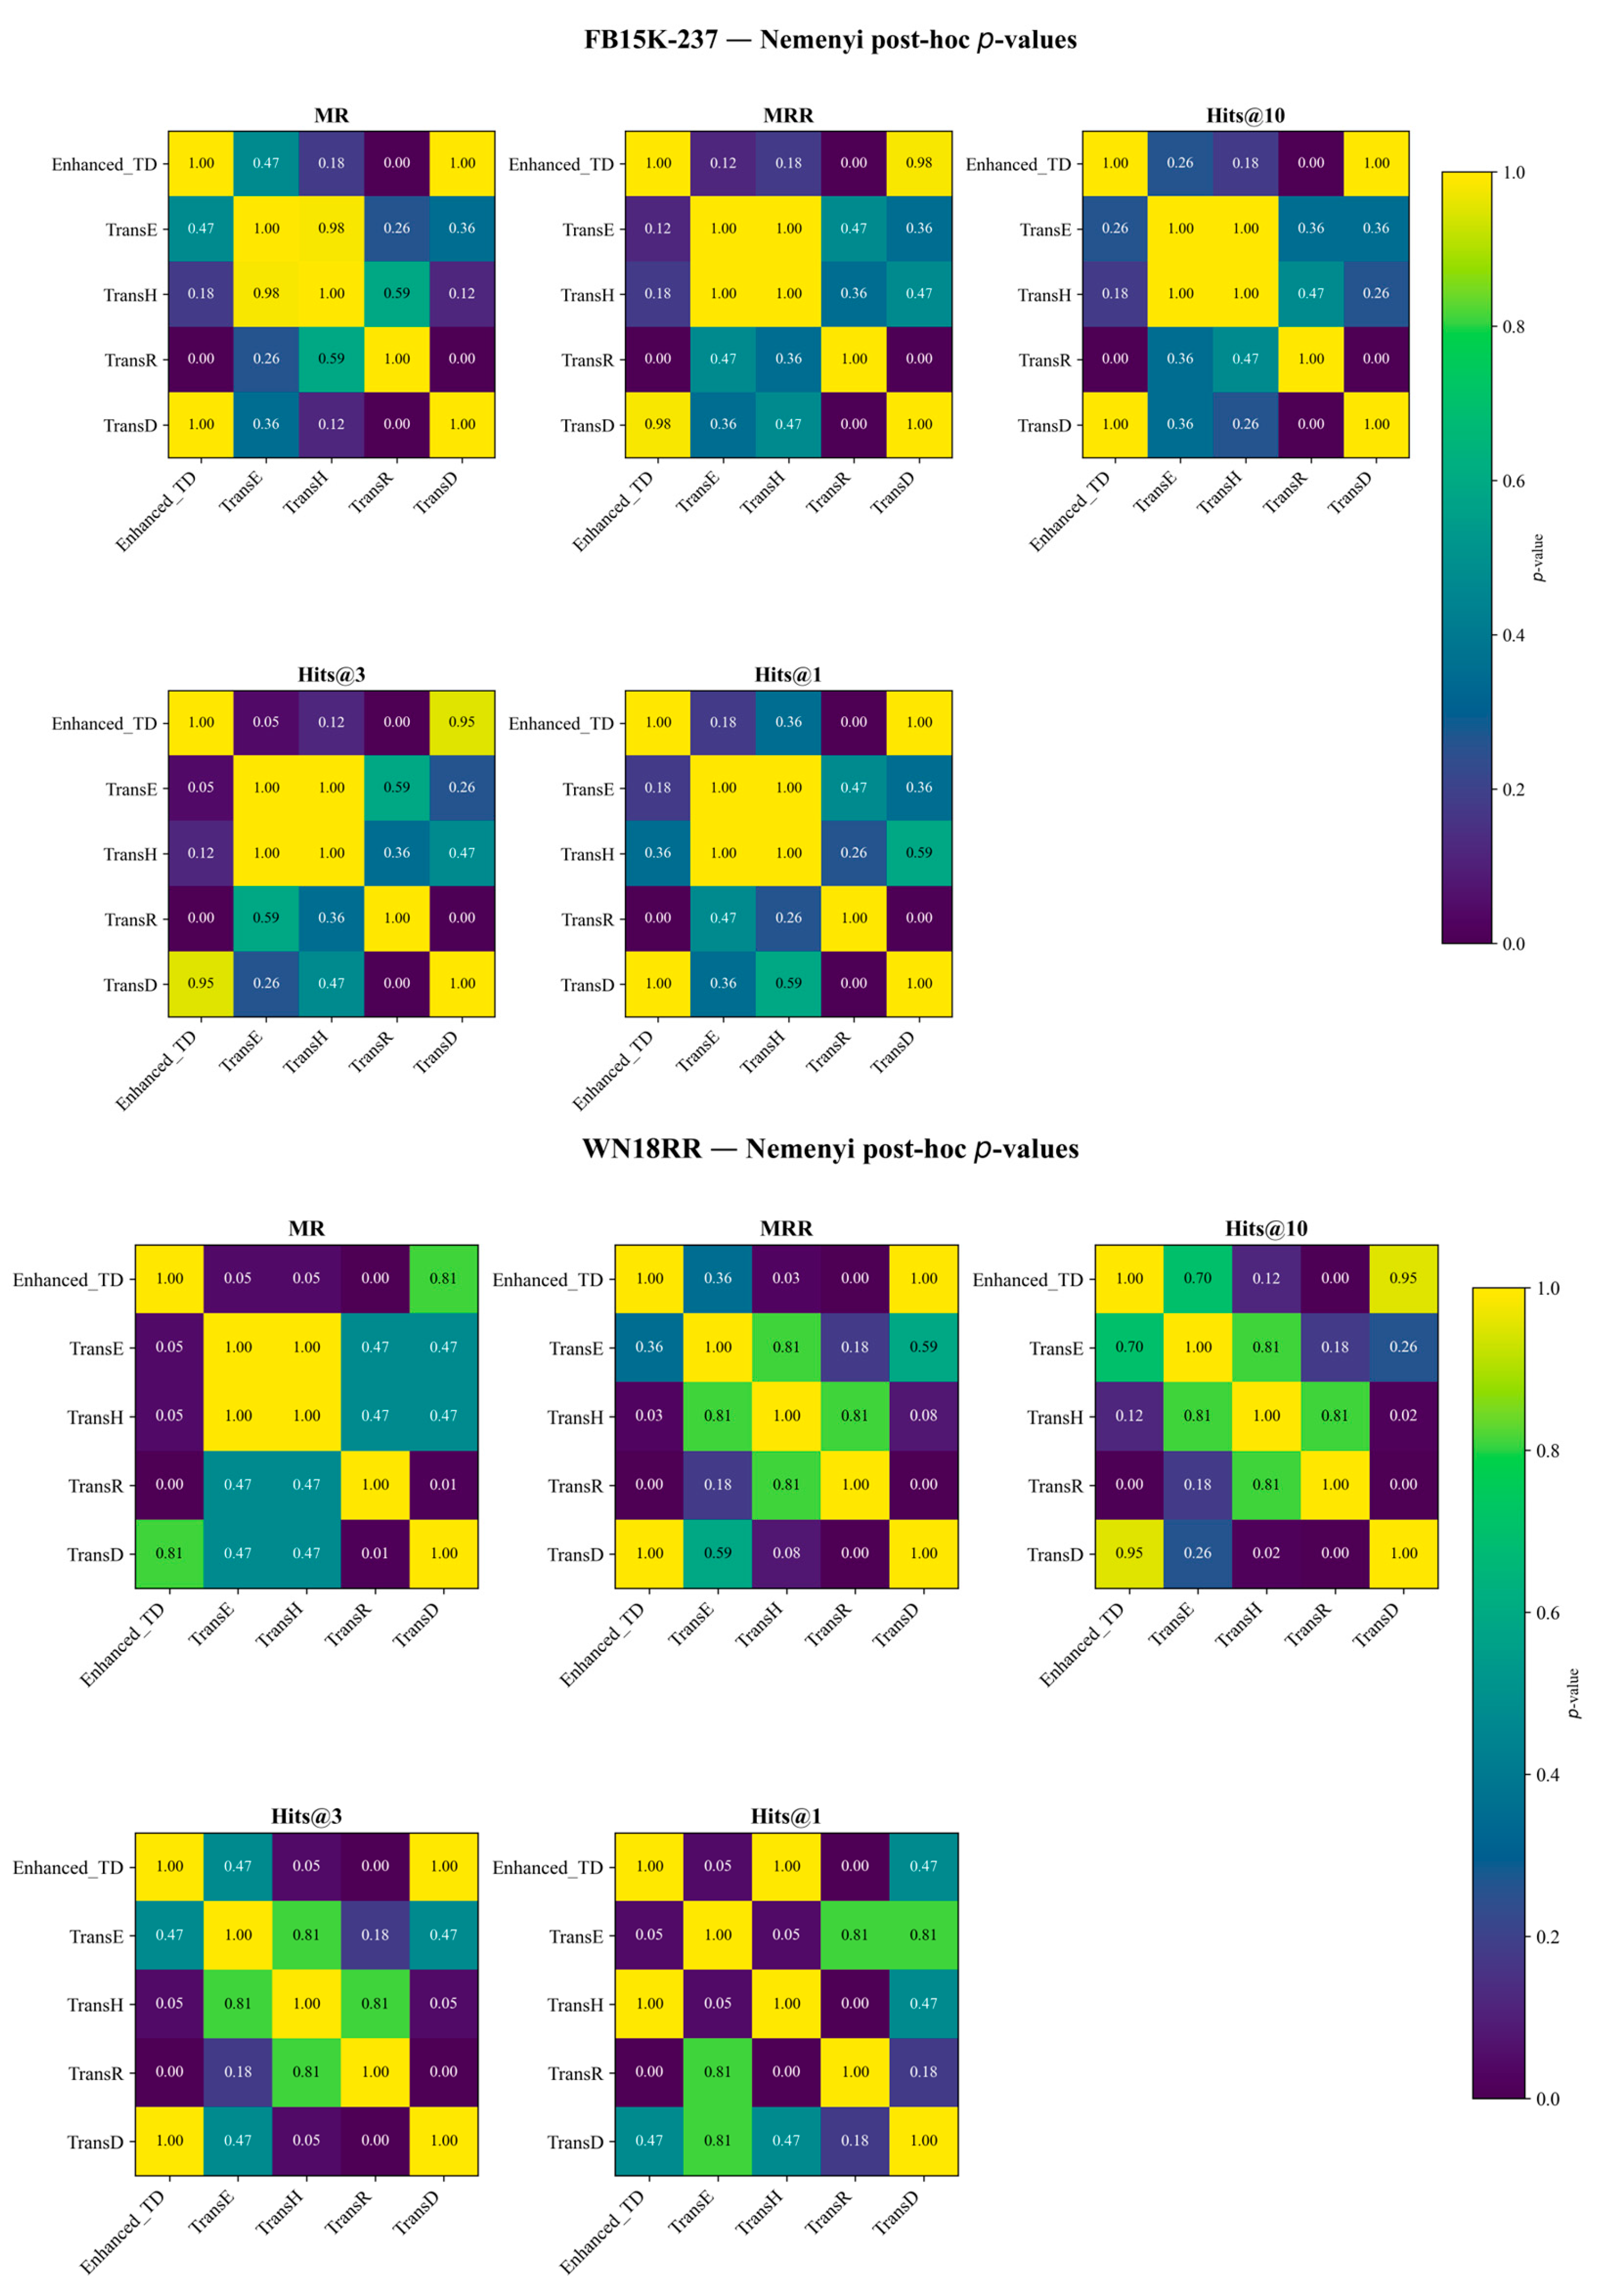
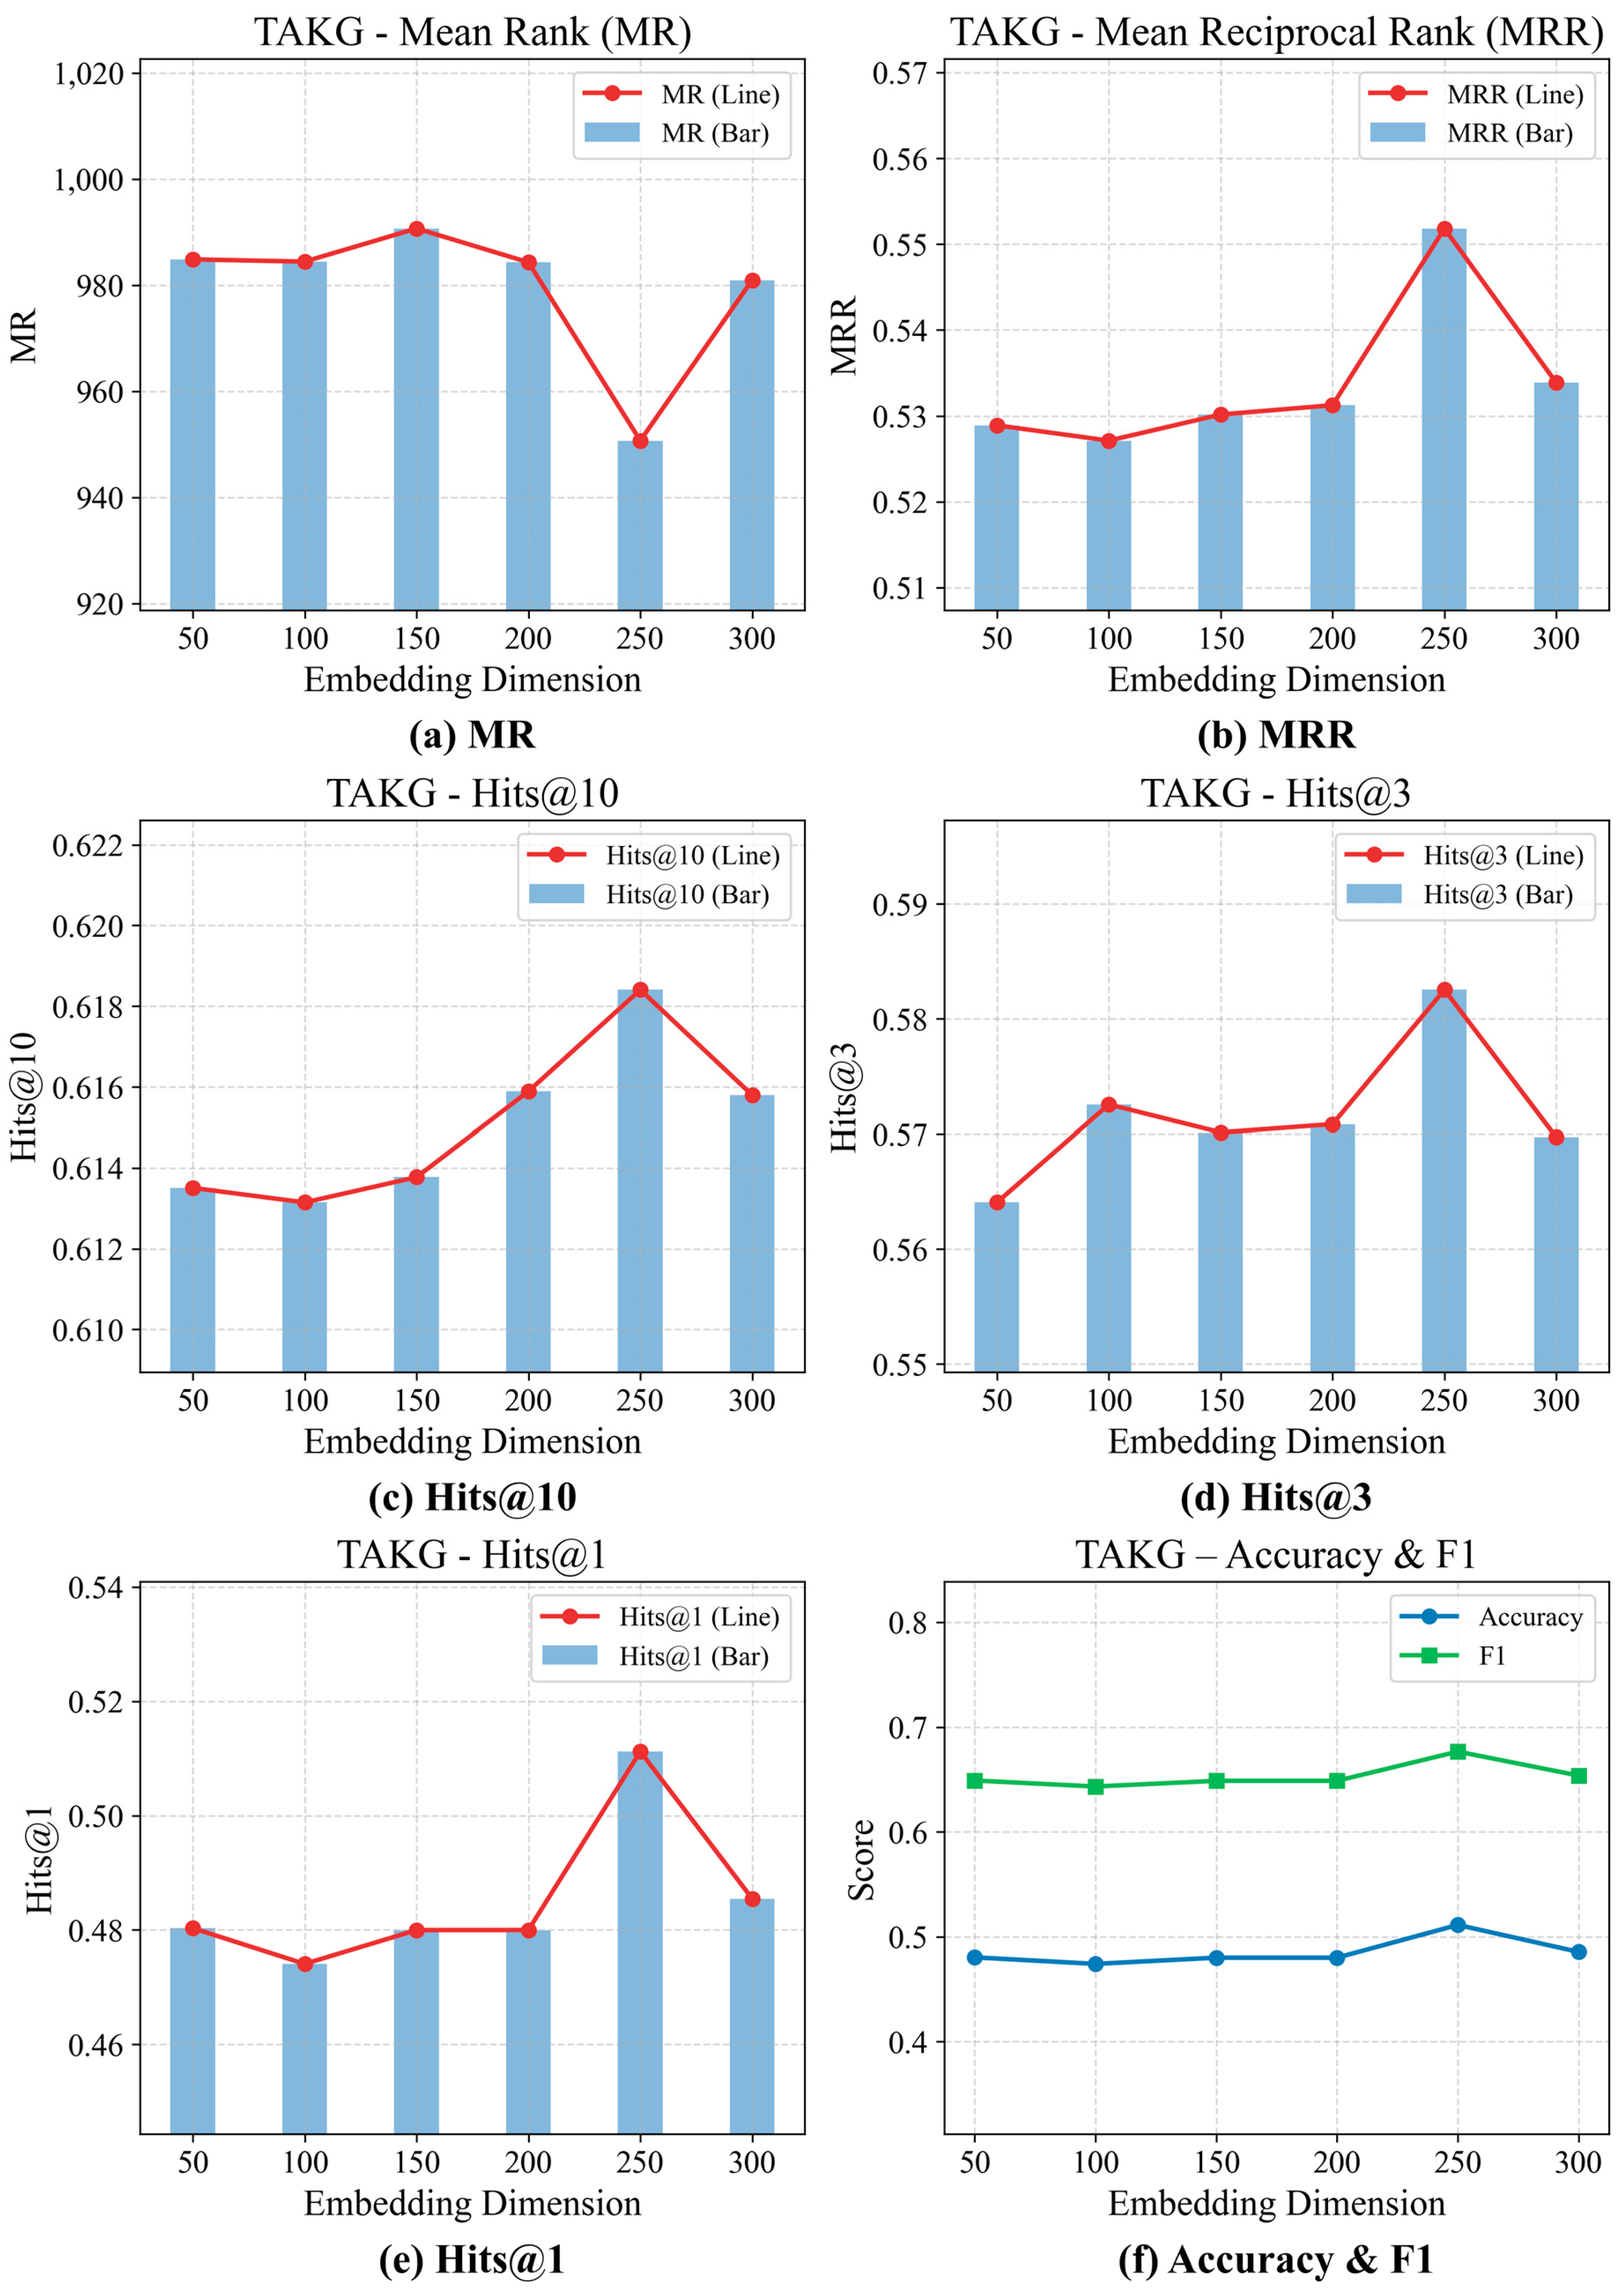
- Experimental Validation: Experimental validation was conducted on the FB15K-237 and WN18RR benchmarks, including comparative evaluations, statistical significance testing, and ablation studies, to comprehensively assess the performance of the enhanced TransD model. Upon application to our self-constructed California Traffic Accident Knowledge Graph (TAKG), Enhanced TransD achieved optimal performance across all evaluation metrics under medium-to-high embedding dimensions, markedly improving entity ranking and classification accuracy and confirming the synergistic benefits of attribute projection and dual-limit loss. These results demonstrate that the proposed approach possesses strong generalization and discrimination capabilities in multi-source heterogeneous knowledge graph representation learning.
Author Contributions
Funding
Institutional Review Board Statement
Informed Consent Statement
Data Availability Statement
Acknowledgments
Conflicts of Interest
References
- Depaire, B.; Wets, G.; Vanhoof, K. Traffic Accident Segmentation by Means of Latent Class Clustering. Accid. Anal. Prev. 2008, 40, 1257–1266. [Google Scholar] [CrossRef] [PubMed]
- Fan, Z.; Liu, C.; Cai, D.; Yue, S. Research on Black Spot Identification of Safety in Urban Traffic Accidents Based on Machine Learning Method. Saf. Sci. 2019, 118, 607–616. [Google Scholar] [CrossRef]
- Yu, X. Analysis of injury and death characteristics of residents in Haidian District, Beijing, 2010–2015. Dis. Surveill. 2019, 34, 166–170. [Google Scholar]
- Mao, Y.-P.; Yu, F.-Q.; Sun, Y.-Y.; Tang, Z.-G. Road traffic accident data mining and its application research. Traffic Transp. 2020, 33, 106–111. [Google Scholar]
- Xu, P.; Jiang, K.; Wang, Z.-H.; Zhu, Z. Significant analysis of objective factors of road traffic accidents based on rough set. J. East. China Jiaotong Univ. 2017, 34, 66–71. [Google Scholar]
- Zhi, Y.; Wang, D.-S.; Cong, H.-Z.; Rao, Z.-B. Deep Data Mining Technology and Application of Road Traffic Accident Data: A Case Study of Shenzhen. Urban. Transp. China 2018, 16, 28–32,61. [Google Scholar]
- Ma, Z.; Mei, G.; Cuomo, S. An Analytic Framework Using Deep Learning for Prediction of Traffic Accident Injury Severity Based on Contributing Factors. Accid. Anal. Prev. 2021, 160, 106322. [Google Scholar] [CrossRef]
- Hadjidimitriou, N.S.; Lippi, M.; Dell’Amico, M.; Skiera, A. Machine Learning for Severity Classification of Accidents Involving Powered Two Wheelers. IEEE Trans. Intell. Transp. Syst. 2020, 21, 4308–4317. [Google Scholar] [CrossRef]
- Peng, C.; Xia, F.; Naseriparsa, M.; Osborne, F. Knowledge Graphs: Opportunities and Challenges. Artif. Intell. Rev. 2023, 56, 13071–13102. [Google Scholar] [CrossRef]
- Fu, L.-J.; Cao, Y.; Bai, Y.; Leng, J.-W. Development Status and Prospects of Knowledge Graphs in Domestic Vertical Domains. Comput. Appl. Res. 2021, 38, 3201–3214. [Google Scholar]
- Zhang, Z.-J.; Ni, Z.-N.; Liu, Z.-H.; Xia, S.-D. Research on Dynamic Relation Prediction Method for Financial Knowledge Graphs. Data Anal. Knowl. Discov. 2023, 7, 39–50. [Google Scholar] [CrossRef]
- Pu, T.-J.; Tan, Y.-P.; Peng, G.-Z.; Xu, H.-F.; Zhang, Z.-H. Construction and Application of Knowledge Graph in the Power Domain. Power Syst. Technol. 2021, 45, 2080–2091. [Google Scholar]
- Wang, C.-Y.; Zheng, Z.-L.; Cai, X.-Q.; Huang, J.-H.; Su, Q.-M. A Review of the Application of Knowledge Graphs in the Medical Field. J. Biomed. Eng. 2023, 40, 1040–1044. [Google Scholar]
- Lin, J.; Zhao, Y.; Huang, W.; Liu, C.; Pu, H. Domain Knowledge Graph-Based Research Progress of Knowledge Representation. Neural Comput. Appl. 2021, 33, 681–690. [Google Scholar] [CrossRef]
- Zhang, Z.; Li, Z.; Liu, H.; Xiong, N.N. Multi-Scale Dynamic Convolutional Network for Knowledge Graph Embedding. IEEE Trans. Knowl. Data Eng. 2022, 34, 2335–2347. [Google Scholar] [CrossRef]
- Qiu, C.; Xu, H.; Bao, Y. Modified-DBSCAN Clustering for Identifying Traffic Accident Prone Locations. In Proceedings of the Intelligent Data Engineering and Automated Learning–IDEAL 2016, Yangzhou, China, 12–14 October 2016; Yin, H., Gao, Y., Li, B., Zhang, D., Yang, M., Li, Y., Klawonn, F., Tallón-Ballesteros, A.J., Eds.; Springer International Publishing: Cham, Switzerland, 2016; pp. 99–105. [Google Scholar]
- Li, J.; He, J.; Liu, Z.; Zhang, H.; Zhang, C. Traffic Accident Analysis Based on C4.5 Algorithm in WEKA. MATEC Web Conf. 2019, 272, 01035. [Google Scholar] [CrossRef]
- Lv, Y.; Tang, S.; Zhao, H.; Li, S. Real-Time Highway Accident Prediction Based on Support Vector Machines. In Proceedings of the 2009 Chinese Control and Decision Conference, Guilin, China, 17–19 June 2009; pp. 4403–4407. [Google Scholar]
- Hu, Z.; Zhou, J.; Zhang, E. Improving Traffic Safety through Traffic Accident Risk Assessment. Sustainability 2023, 15, 3748. [Google Scholar] [CrossRef]
- Shokry, S.; Rashwan, N.K.; Hemdan, S.; Alrashidi, A.; Wahaballa, A.M. Characterization of Traffic Accidents Based on Long-Horizon Aggregated and Disaggregated Data. Sustainability 2023, 15, 1483. [Google Scholar] [CrossRef]
- Wang, S.; Yan, C.; Shao, Y. LSTM Road Traffic Accident Prediction Model Based on Attention Mechanism. In Proceedings of the 2023 8th International Conference on Cloud Computing and Big Data Analytics (ICCCBDA), Chengdu, China, 26–28 April 2023; pp. 215–219. [Google Scholar]
- Wang, H.; Liang, G. Association Rules Between Urban Road Traffic Accidents and Violations Considering Temporal and Spatial Constraints: A Case Study of Beijing. Sustainability 2025, 17, 1680. [Google Scholar] [CrossRef]
- Wang, Y.; Zhai, H.; Cao, X.; Geng, X. Cause Analysis and Accident Classification of Road Traffic Accidents Based on Complex Networks. Appl. Sci. 2023, 13, 12963. [Google Scholar] [CrossRef]
- Zhang, L.; Zhang, M.; Tang, J.; Ma, J.; Duan, X.; Sun, J.; Hu, X.; Xu, S. Analysis of Traffic Accident Based on Knowledge Graph. J. Adv. Transp. 2022, 2022, 3915467. [Google Scholar] [CrossRef]
- Wang, C.-H.; Ji, Y.-T.-S.; Ruan, L.; Luhwago, J.; Saw, Y.-X.; Kim, S.; Ruan, T.; Xiao, L.-M.; Zhou, R.-J. Multisource Accident Datasets-Driven Deep Learning-Based Traffic Accident Portrait for Accident Reasoning. J. Adv. Transp. 2024, 2024, 8831914. [Google Scholar] [CrossRef]
- Zhu, X.; Li, Z.; Wang, X.; Jiang, X.; Sun, P.; Wang, X.; Xiao, Y.; Yuan, N.J. Multi-Modal Knowledge Graph Construction and Application: A Survey. IEEE Trans. Knowl. Data Eng. 2024, 36, 715–735. [Google Scholar] [CrossRef]
- Zhu, J.; Han, X.; Deng, H.; Tao, C.; Zhao, L.; Wang, P.; Lin, T.; Li, H. KST-GCN: A Knowledge-Driven Spatial-Temporal Graph Convolutional Network for Traffic Forecasting. IEEE Trans. Intell. Transp. Syst. 2022, 23, 15055–15065. [Google Scholar] [CrossRef]
- Nickel, M.; Murphy, K.; Tresp, V.; Gabrilovich, E. A Review of Relational Machine Learning for Knowledge Graphs. Proc. IEEE 2016, 104, 11–33. [Google Scholar] [CrossRef]
- Zhu, H.; Xu, D.; Huang, Y.; Jin, Z.; Ding, W.; Tong, J.; Chong, G. Graph Structure Enhanced Pre-Training Language Model for Knowledge Graph Completion. IEEE Trans. Emerg. Top. Comput. Intell. 2024, 8, 2697–2708. [Google Scholar] [CrossRef]
- Zhang, Z.-H.; Qian, Y.-R.; Xing, Y.-N.; Zhao, X. A Review of Representation Learning Methods Based on TransE. Comput. Appl. Res. 2021, 38, 656–663. [Google Scholar]
- Bordes, A.; Usunier, N.; Garcia-Durán, A.; Weston, J.; Yakhnenko, O. Translating Embeddings for Modeling Multi-Relational Data. In Proceedings of the 27th International Conference on Neural Information Processing Systems—Volume 2, Lake Tahoe, NV, USA, 5–10 December 2013; Curran Associates, Inc.: New York, NY, USA, 2013; pp. 2787–2795. [Google Scholar]
- Chang, P.; Cao, Y. Research on Improved TransH Model in Knowledge Representation and Reasoning. J. Guangxi Univ. 2020, 45, 321–327. [Google Scholar]
- Zhang, Z.; Jia, J.; Wan, Y.; Zhou, Y.; Kong, Y.; Qian, Y.; Long, J. TransR*: Representation Learning Model by Flexible Translation and Relation Matrix Projection. IFS 2021, 40, 10251–10259. [Google Scholar] [CrossRef]
- Li, Z.; Huang, R.; Zhang, Y.; Zhu, J.; Hu, B. Two Flexible Translation-Based Models for Knowledge Graph Embedding. IFS 2023, 44, 3093–3105. [Google Scholar] [CrossRef]
- Ji, G.; He, S.; Xu, L.; Liu, K.; Zhao, J. Knowledge Graph Embedding via Dynamic Mapping Matrix. In Proceedings of the 53rd Annual Meeting of the Association for Computational Linguistics and the 7th International Joint Conference on Natural Language Processing (Volume 1: Long Papers), Beijing, China, 26–31 July 2015; Zong, C., Strube, M., Eds.; Association for Computational Linguistics: Beijing, China, 2015; pp. 687–696. [Google Scholar]
- Zhou, X.; Niu, L.; Zhu, Q.; Zhu, X.; Liu, P.; Tan, J.; Guo, L. Knowledge Graph Embedding by Double Limit Scoring Loss. IEEE Trans. Knowl. Data Eng. 2022, 34, 5825–5839. [Google Scholar] [CrossRef]


| Method Category | Representative Works | Main Methods | Advantages | Disadvantages |
|---|---|---|---|---|
| Traditional Statistical Methods | [1,16,17] | Improved DBSCAN clustering; Decision tree analysis; Aggregate clustering and injury-severity analysis | Strong interpretability and causal inference capability; Well-established parameter estimation frameworks | Poor scalability to high-dimensional, heterogeneous data; Limited ability to model complex nonlinear relationships |
| Machine Learning Methods | [18,19,20,21,22,23] | SVM classification; ConvLSTM + BCDU-Net for spatiotemporal feature extraction; k-means clustering; Time-series ensemble forecasting; FP-growth association mining; Complex-network topology analysis | Excellent at capturing nonlinear patterns; High predictive accuracy on large feature sets; Flexible to different data modalities | Model interpretability often low; Requires careful hyperparameter tuning; Risk of overfitting without sufficient data or regularization |
| Knowledge Graph Methods | [24,25] | Semantic network construction and visualization; Bi-LSTM + Bi-CRF and PCNN for entity/relation extraction; Rule-based and embedding-based relation inference | Deep integration of multi-source heterogeneous data; Explicit modeling of semantic relationships; Enables graph-based reasoning and explainability | Knowledge engineering overhead (ontology design, data curation); Computationally intensive for large graphs; Performance sensitive to quality of extracted triples |
| Type | Field Name | Description and Example |
|---|---|---|
| Entity | Accident.case_id | Unique identifier for the accident case; e.g., 21900517 |
| Relationship | REPORTED_IN_YEAR | Relation linking an Accident to its reporting year; e.g., 21900517 REPORTED_IN_YEAR 2019 |
| Entity | DBYear.year | Year when the accident was reported; e.g., 2019 |
| Relationship | HAS_JURISDICTION | Connects Accident to Jurisdiction; e.g., 21900517 HAS_JURISDICTION Los Angeles |
| Entity | Jurisdiction.value | Name of the legal jurisdiction; e.g., Los Angeles |
| Relationship | HAS_SPECIAL_CONDITION | Links Accident to special road condition; e.g., 21900517 HAS_SPECIAL_CONDITION Vista Point or Rest Area |
| Entity | SpecialCondition.condition | Description of special condition; e.g., Vista Point or Rest Area |
| Relationship | HAS_PRIMARY_ROAD | Links Accident to primary road; e.g., 21900517 HAS_PRIMARY_ROAD US 101 |
| Entity | PrimaryRoad.name | Name or designation of primary road; e.g., US 101 |
| Relationship | HAS_DISTANCE | Associates Accident with distance off road; e.g., 21900517 HAS_DISTANCE 0.5 |
| Entity | Distance.value | Distance from reference point (miles); e.g., 0.5 |
| Relationship | HAS_DIRECTION | Links Accident to traffic direction; e.g., 21900517 HAS_DIRECTION Northbound |
| Entity | Direction.value | Traffic direction at accident location; e.g., Northbound |
| Relationship | HAS_WEATHER1 | Connects Accident to primary weather condition; e.g., 21900517 HAS_WEATHER1 Clear |
| Entity | Weather1.condition | Primary weather during accident; e.g., Clear |
| Relationship | HAS_LIGHTING | Associates Accident with lighting condition; e.g., 21900517 HAS_LIGHTING Daylight |
| Entity | Lighting.condition | Lighting at time of accident; e.g., Daylight |
| Relationship | HAS_KILLED_VICTIMS | Links Accident to count of fatalities; e.g., 21900517 HAS_KILLED_VICTIMS 0 |
| Entity | KilledVictims.count | Number of people killed; e.g., 0 |
| Relationship | HAS_INJURED_VICTIMS | Links Accident to count of injuries; e.g., 21900517 HAS_INJURED_VICTIMS 2 |
| Entity | InjuredVictims.count | Number of people injured; e.g., 2 |
| Relationship | HAS_PRIMARY_COLLISION_FACTOR | Associates Accident with primary collision factor; e.g., 21900517 HAS_PRIMARY_COLLISION_FACTOR Unspecified |
| Entity | PrimaryCollisionFactor.factor | Description of the primary collision factor; e.g., Unspecified |
| Relationship | HAS_TYPE_OF_COLLISION | Links Accident to collision type; e.g., 21900517 HAS_TYPE_OF_COLLISION Sideswipe |
| Entity | TypeOfCollision.type | Type of collision; e.g., Sideswipe |
| Data Set | Number of Entities | Number of Relationships | Size of Training Set | Size of Validation Set | Size of Test Set |
|---|---|---|---|---|---|
| FB15K-237 | 14,541 | 237 | 272,115 | 17,535 | 20,466 |
| WN18RR | 40,943 | 11 | 86,835 | 3034 | 3134 |
| Data Set | Number of Entities | Number of Relationships | Size of Training Set | Size of Validation Set | Size of Test Set |
|---|---|---|---|---|---|
| TAKG | 33,755 | 115 | 460,005 | 57,495 | 57,500 |
| dim | MR | MRR | H@1 | H@3 | H@10 | Acc | F1 |
|---|---|---|---|---|---|---|---|
| 50 | 984.8603 | 0.528903 | 0.480301 | 0.564064 | 0.613507 | 0.480301 | 0.648924 |
| 100 | 984.4376 | 0.527122 | 0.474052 | 0.572557 | 0.613148 | 0.474052 | 0.643196 |
| 150 | 990.6853 | 0.530165 | 0.479965 | 0.570133 | 0.613774 | 0.479965 | 0.648617 |
| 200 | 984.3071 | 0.53125 | 0.479977 | 0.570846 | 0.61589 | 0.479977 | 0.648627 |
| 250 | 950.6806 | 0.551829 | 0.511194 | 0.582533 | 0.618406 | 0.511194 | 0.676543 |
| 300 | 980.9584 | 0.533855 | 0.485461 | 0.569704 | 0.615797 | 0.485461 | 0.653617 |
Disclaimer/Publisher’s Note: The statements, opinions and data contained in all publications are solely those of the individual author(s) and contributor(s) and not of MDPI and/or the editor(s). MDPI and/or the editor(s) disclaim responsibility for any injury to people or property resulting from any ideas, methods, instructions or products referred to in the content. |
© 2025 by the authors. Licensee MDPI, Basel, Switzerland. This article is an open access article distributed under the terms and conditions of the Creative Commons Attribution (CC BY) license (https://creativecommons.org/licenses/by/4.0/).
Share and Cite
Liu, X.; Wu, H.; Yu, D.; Chen, Y.; Wu, H. A Construction and Representation Learning Method for a Traffic Accident Knowledge Graph Based on the Enhanced TransD Model. Appl. Sci. 2025, 15, 6031. https://doi.org/10.3390/app15116031
Liu X, Wu H, Yu D, Chen Y, Wu H. A Construction and Representation Learning Method for a Traffic Accident Knowledge Graph Based on the Enhanced TransD Model. Applied Sciences. 2025; 15(11):6031. https://doi.org/10.3390/app15116031
Chicago/Turabian StyleLiu, Xiaojia, Haopeng Wu, Dexin Yu, Yunjie Chen, and Hao Wu. 2025. "A Construction and Representation Learning Method for a Traffic Accident Knowledge Graph Based on the Enhanced TransD Model" Applied Sciences 15, no. 11: 6031. https://doi.org/10.3390/app15116031
APA StyleLiu, X., Wu, H., Yu, D., Chen, Y., & Wu, H. (2025). A Construction and Representation Learning Method for a Traffic Accident Knowledge Graph Based on the Enhanced TransD Model. Applied Sciences, 15(11), 6031. https://doi.org/10.3390/app15116031