
Miniaturized Near-Infrared Analyzer for Quantitative Detection of Trace Water in Ethylene Glycol


Abstract
1. Introduction
2. Materials and Methods
2.1. Experimental Materials and Instruments
- Materials: ethylene glycol (analytical grade, purity ≥99.8%, National Pharmaceutical Group Chemical Reagent Co., Ltd., Nanjing, China) and mineral water (Hangzhou Wahaha Group Co., Ltd., Hangzhou, China).
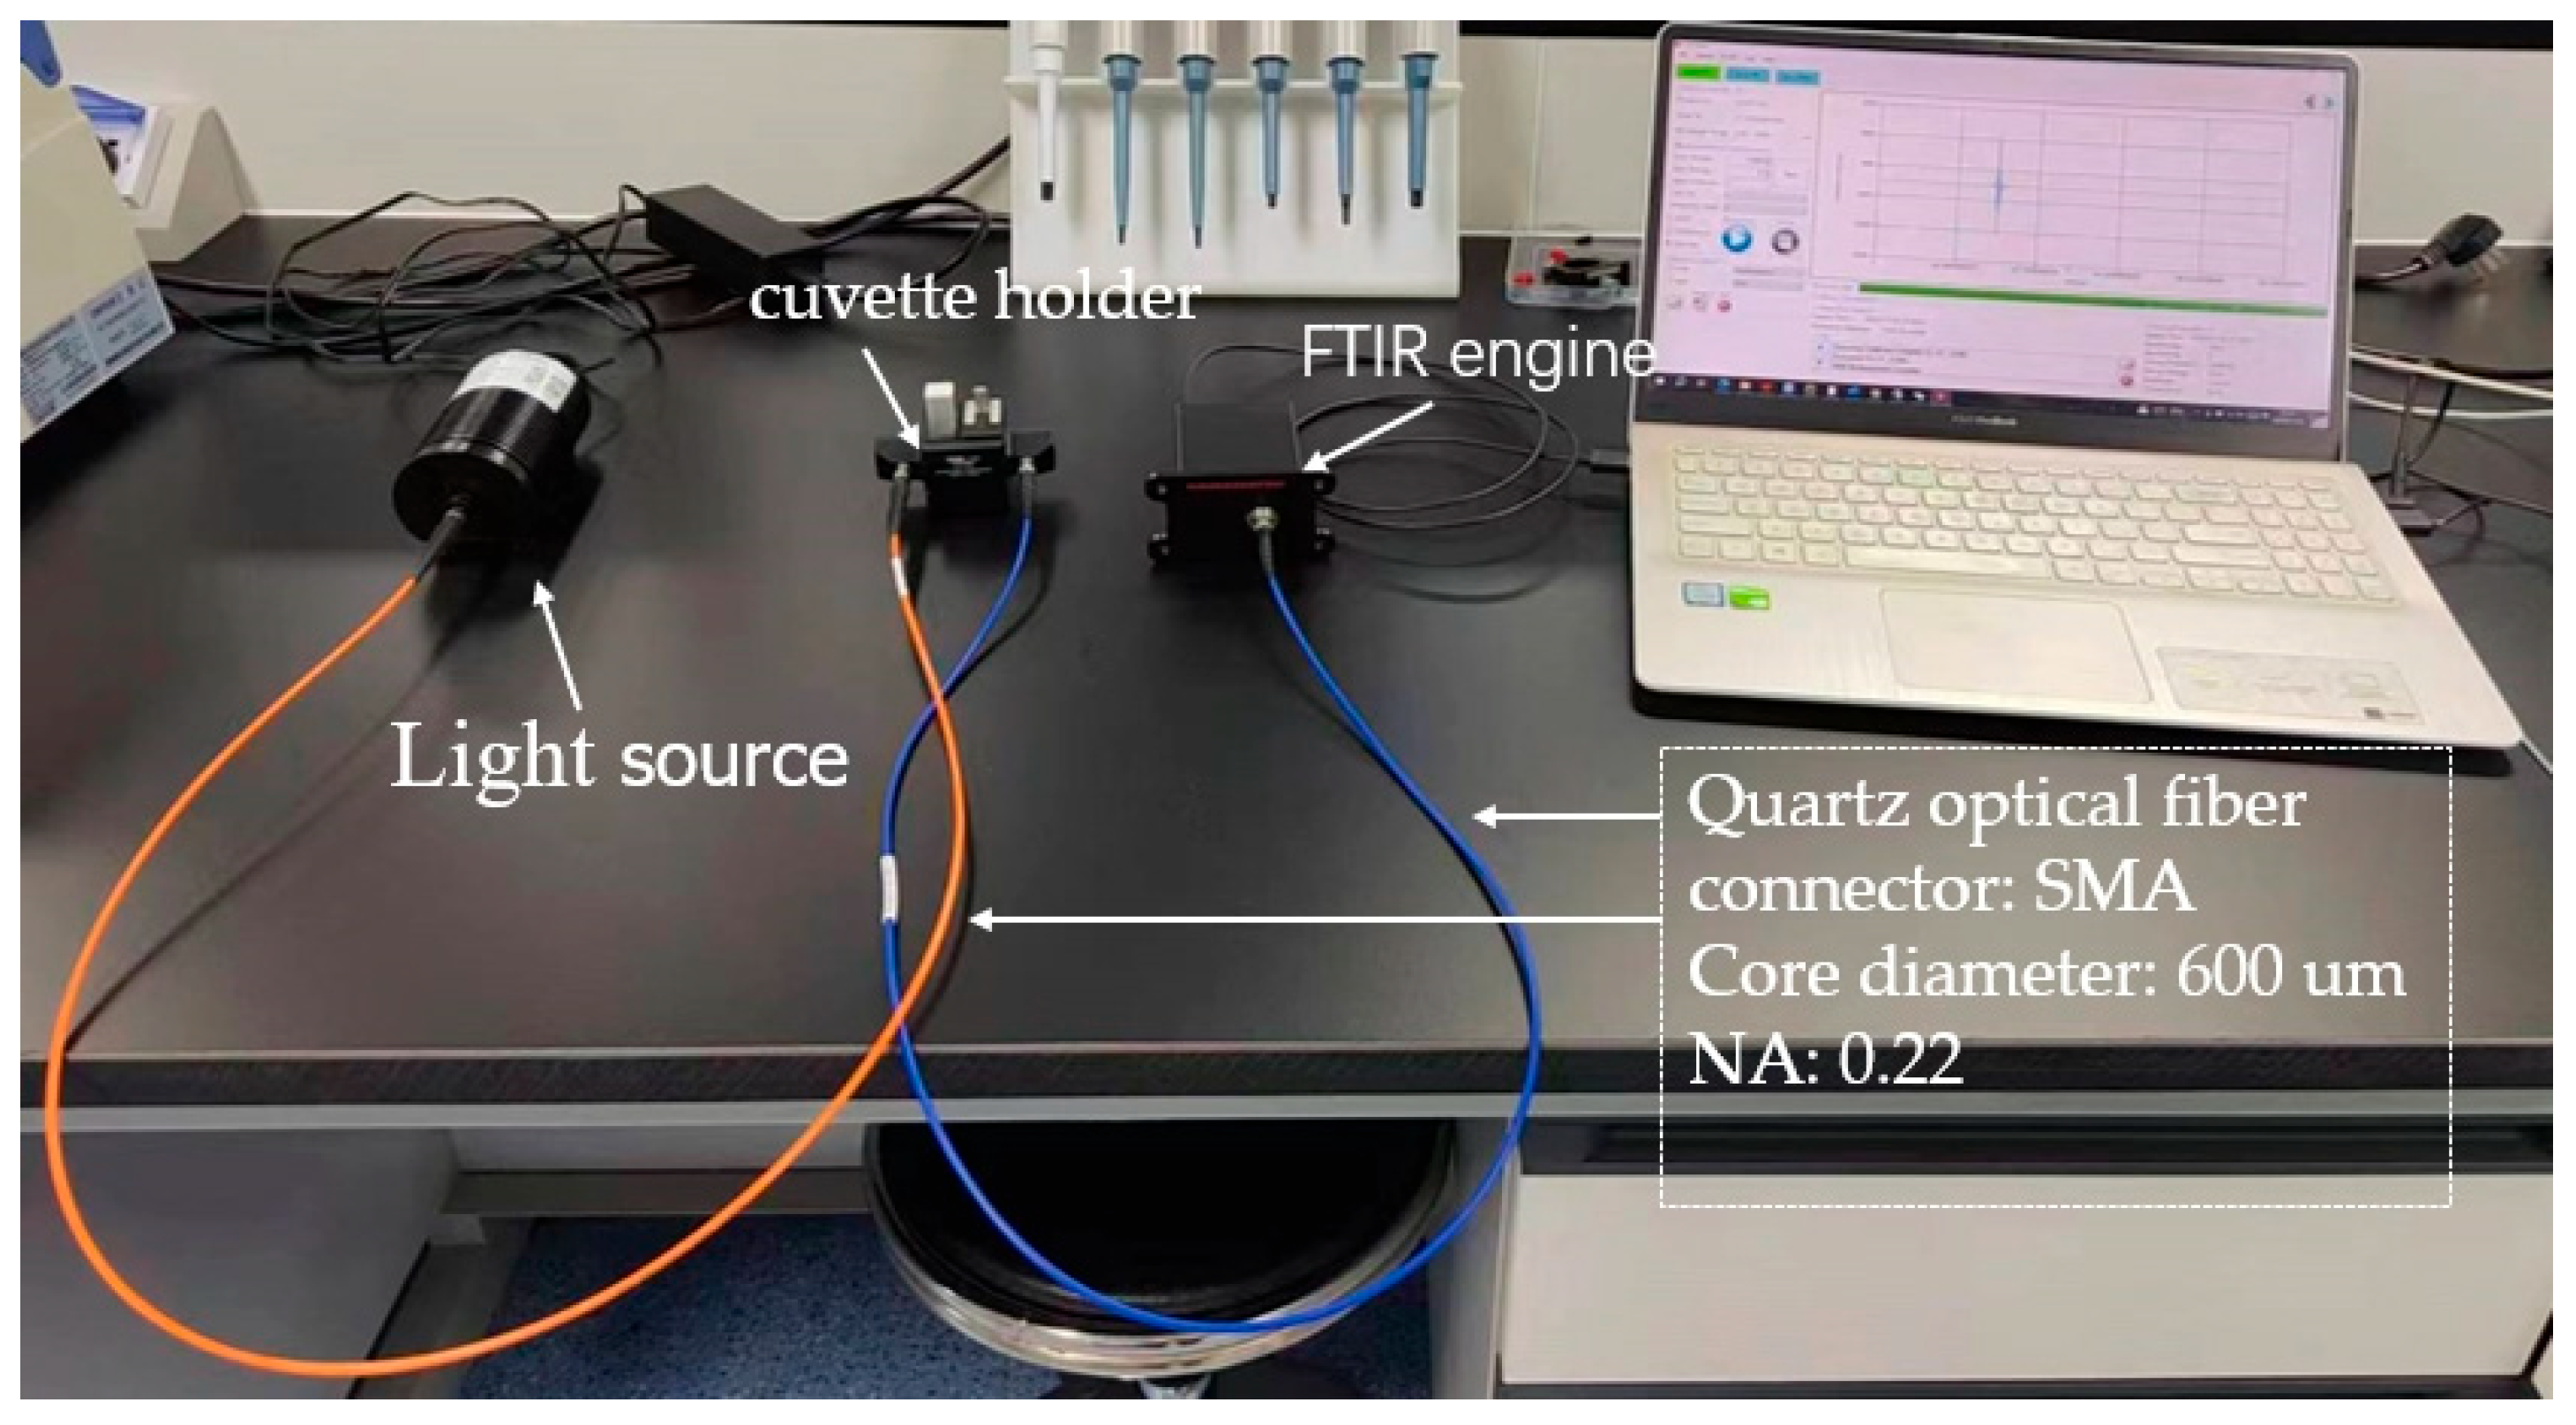
- Instruments: A C15511-01 Fourier-transform near-infrared spectrometer utilizing MEMS technology (Hamamatsu Corporation, San Jose, CA, USA) was employed, with a spectral range of 1100 to 2500 nm and a resolution of 25 cm−1. The specific parameters of the spectrometer are shown in Table 1. Other equipment included a halogen light source (fiber-optic output) and a quartz cuvette with a path length of 10 mm.
2.2. Sample Preparation
2.3. Near-Infrared Spectral Acquisition
2.4. Near-Infrared Modeling Methods
2.4.1. Spectral Data Preprocessing
2.4.2. Model Establishment and Analysis
2.4.3. Limit of Detection (LOD)
3. Results and Discussion
3.1. Division of Sample Sets
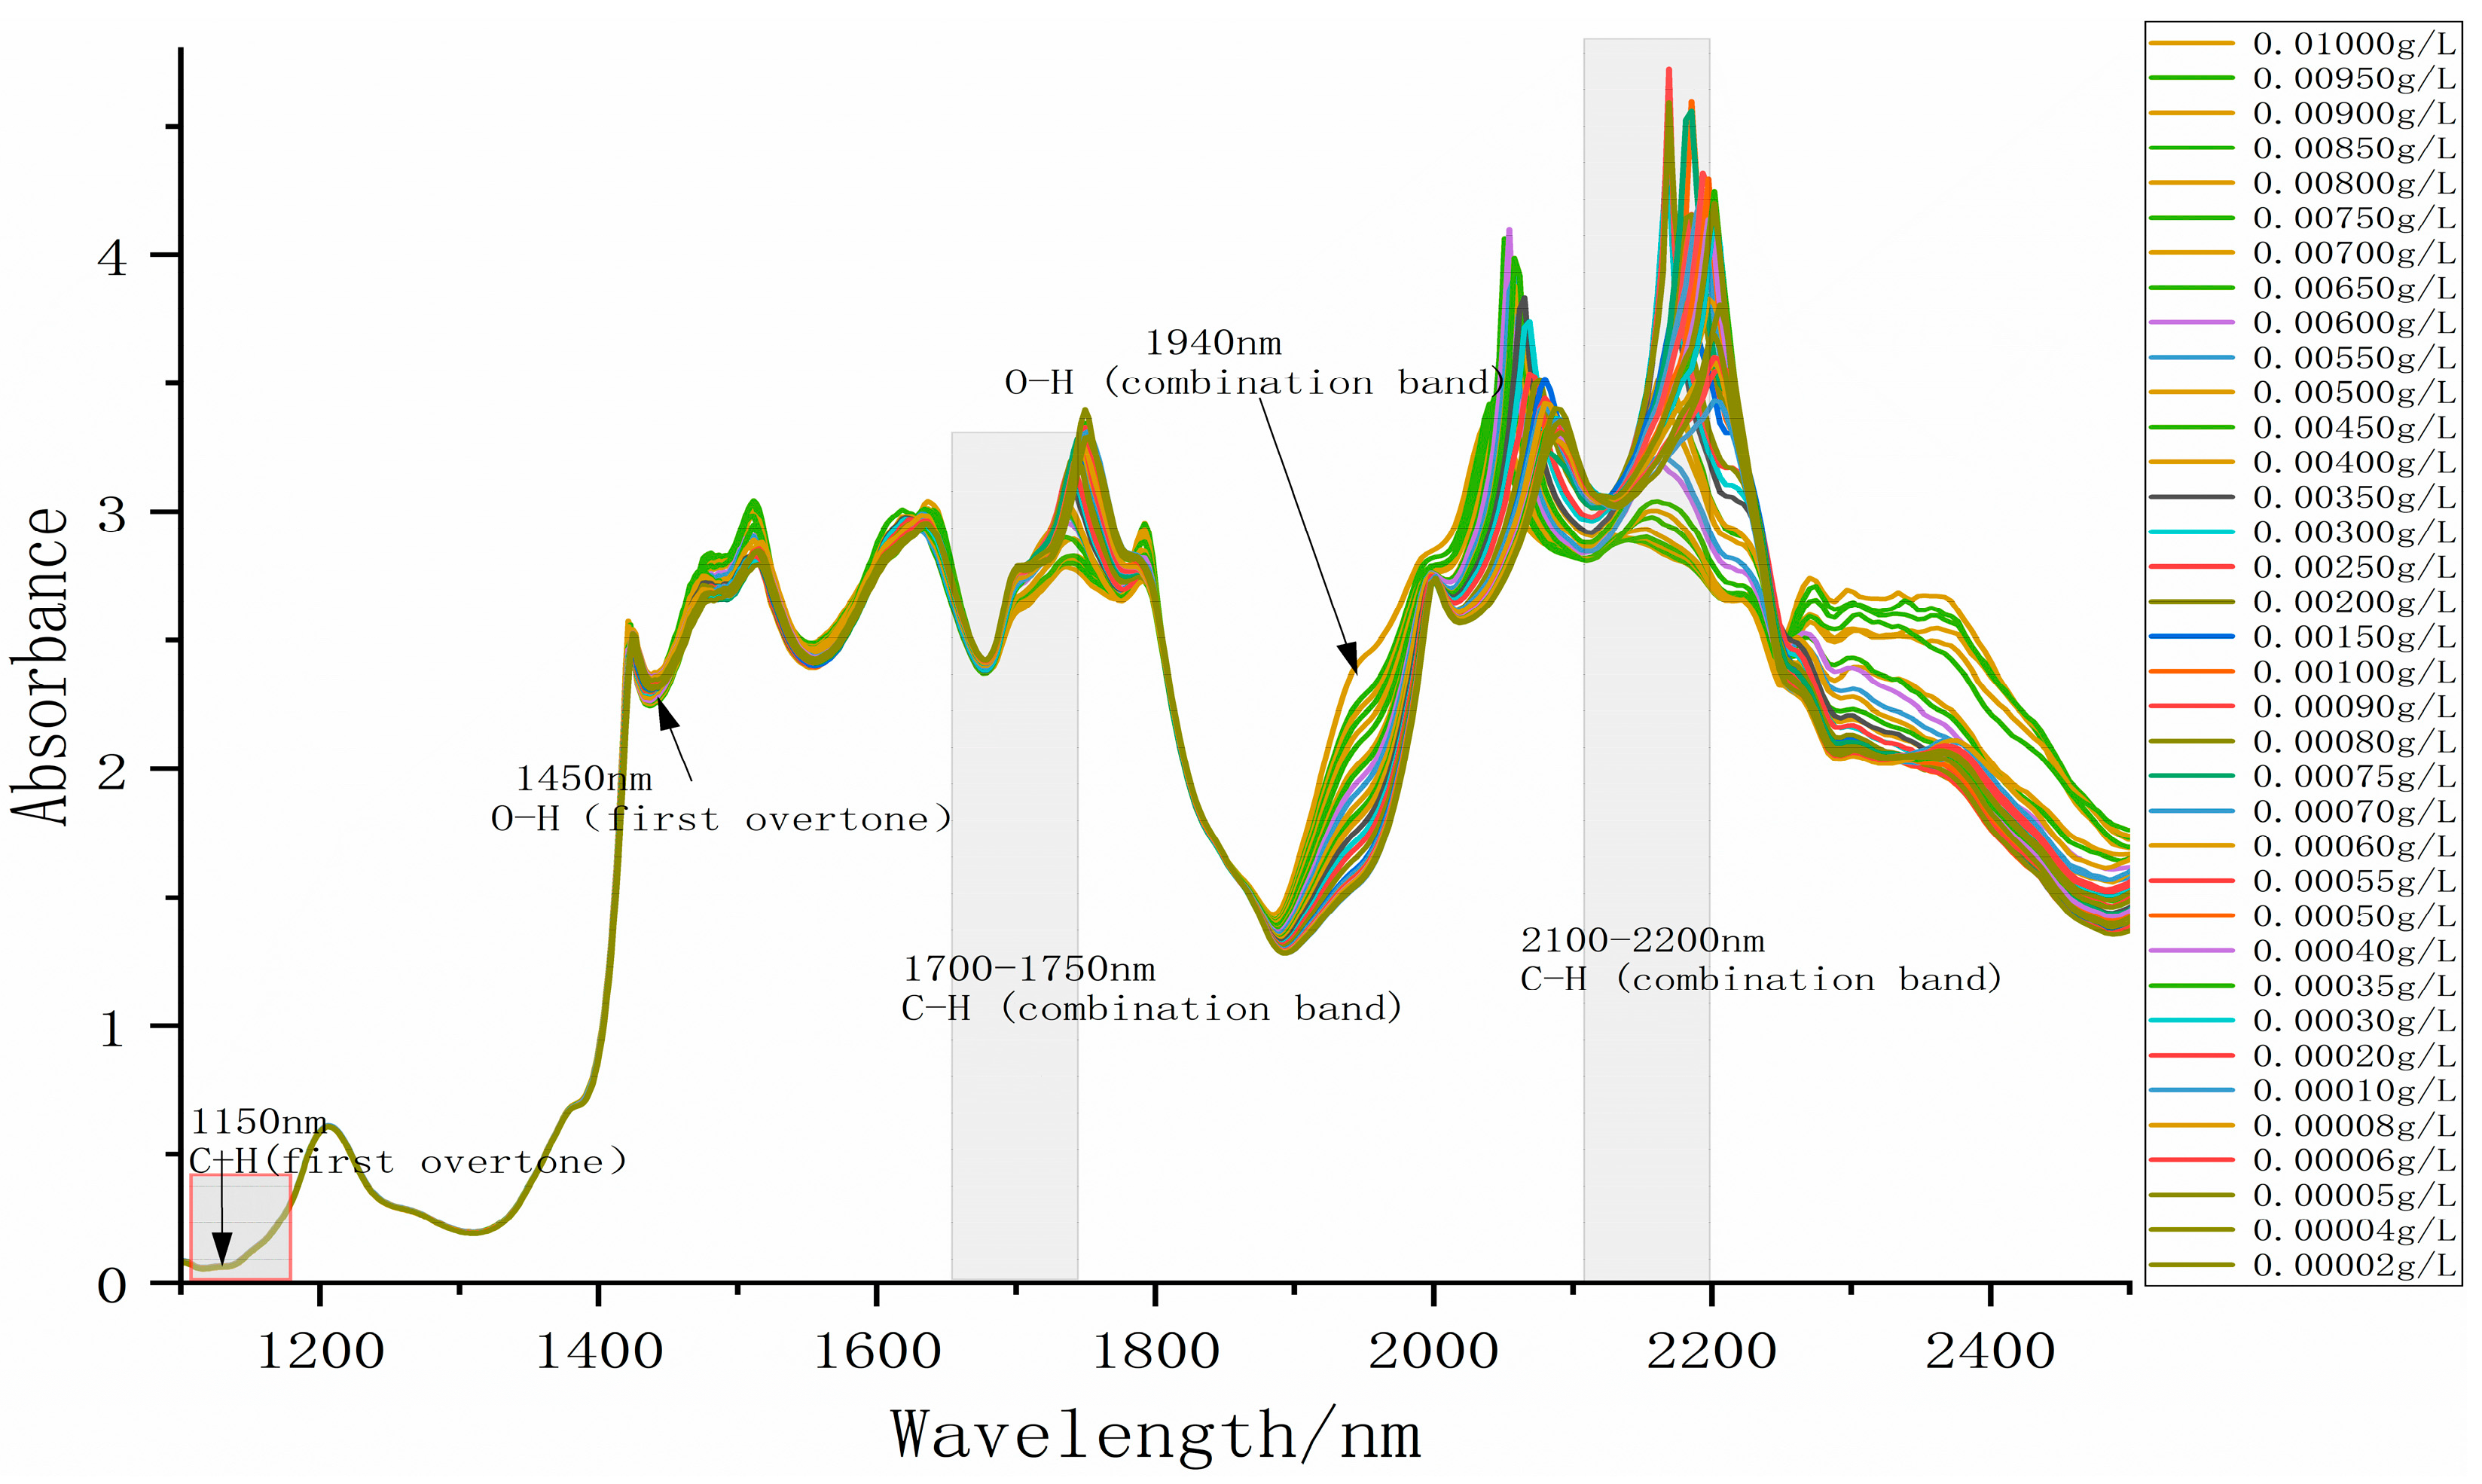
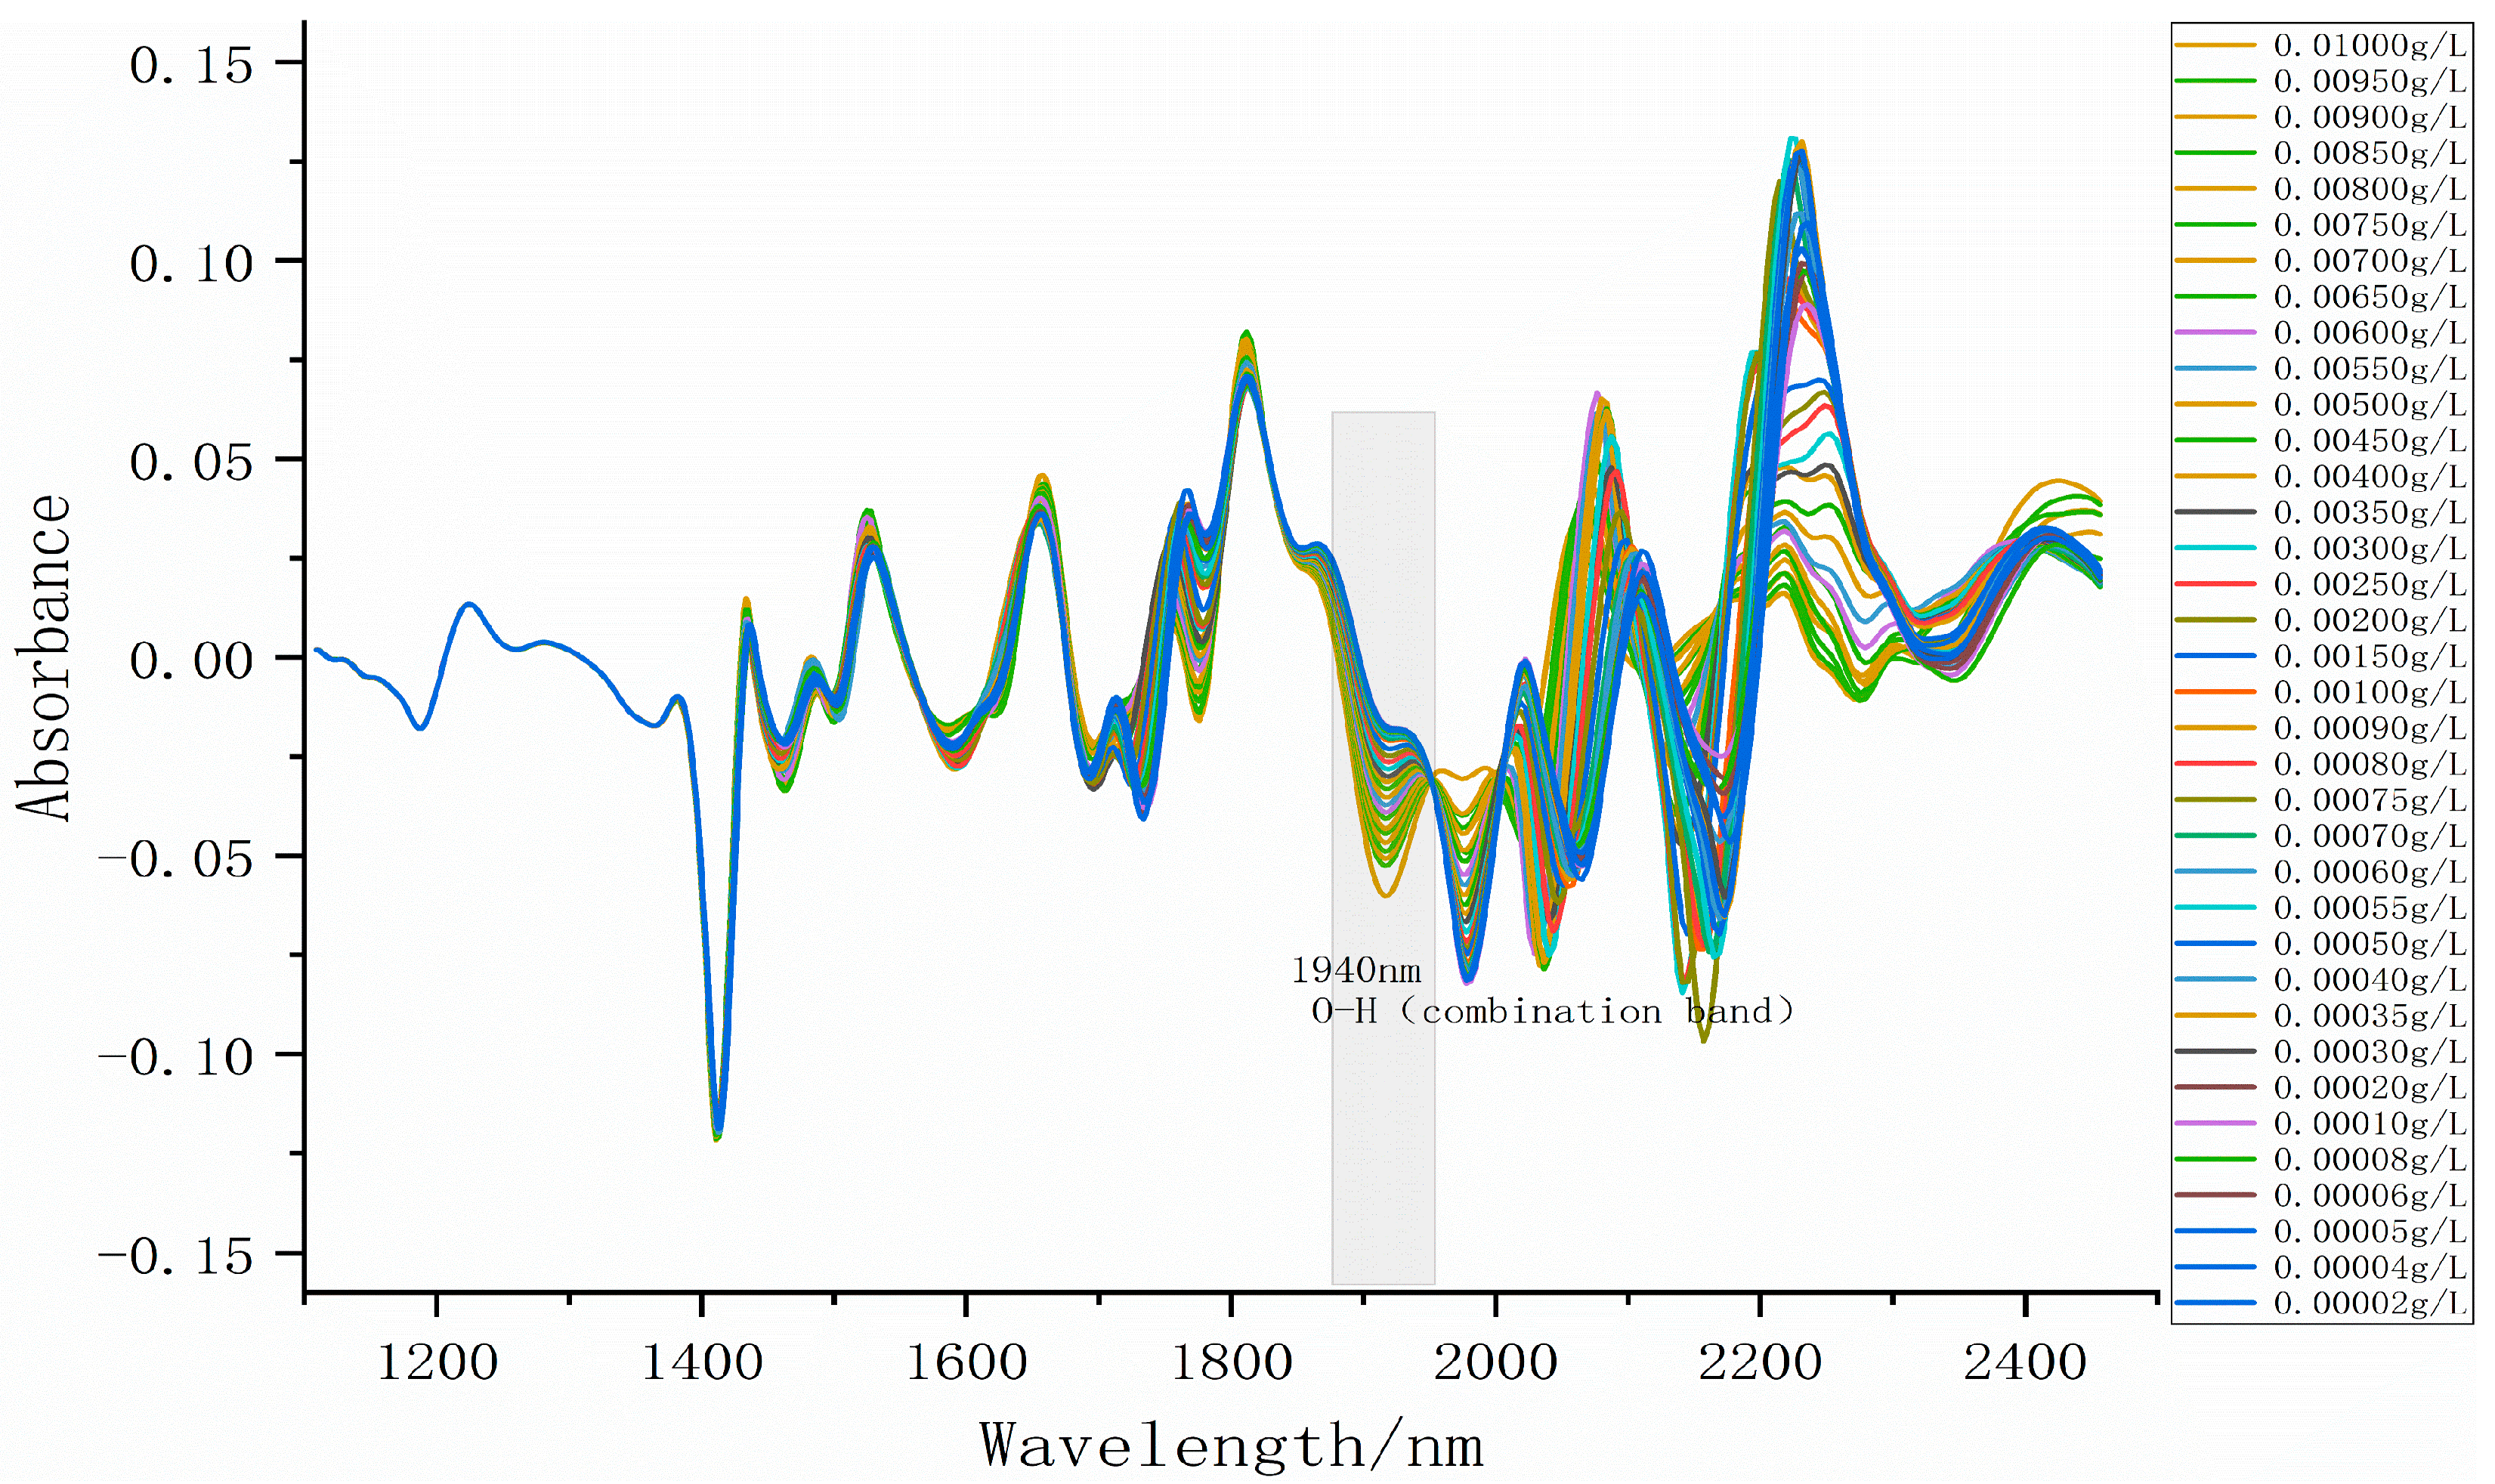
3.2. Absorption Fingerprint Analysis
3.3. Establishment and Optimization of Water Content Prediction Models
3.3.1. Comparison of Different Models
3.3.2. Comparison of Different Pretreatment Methods
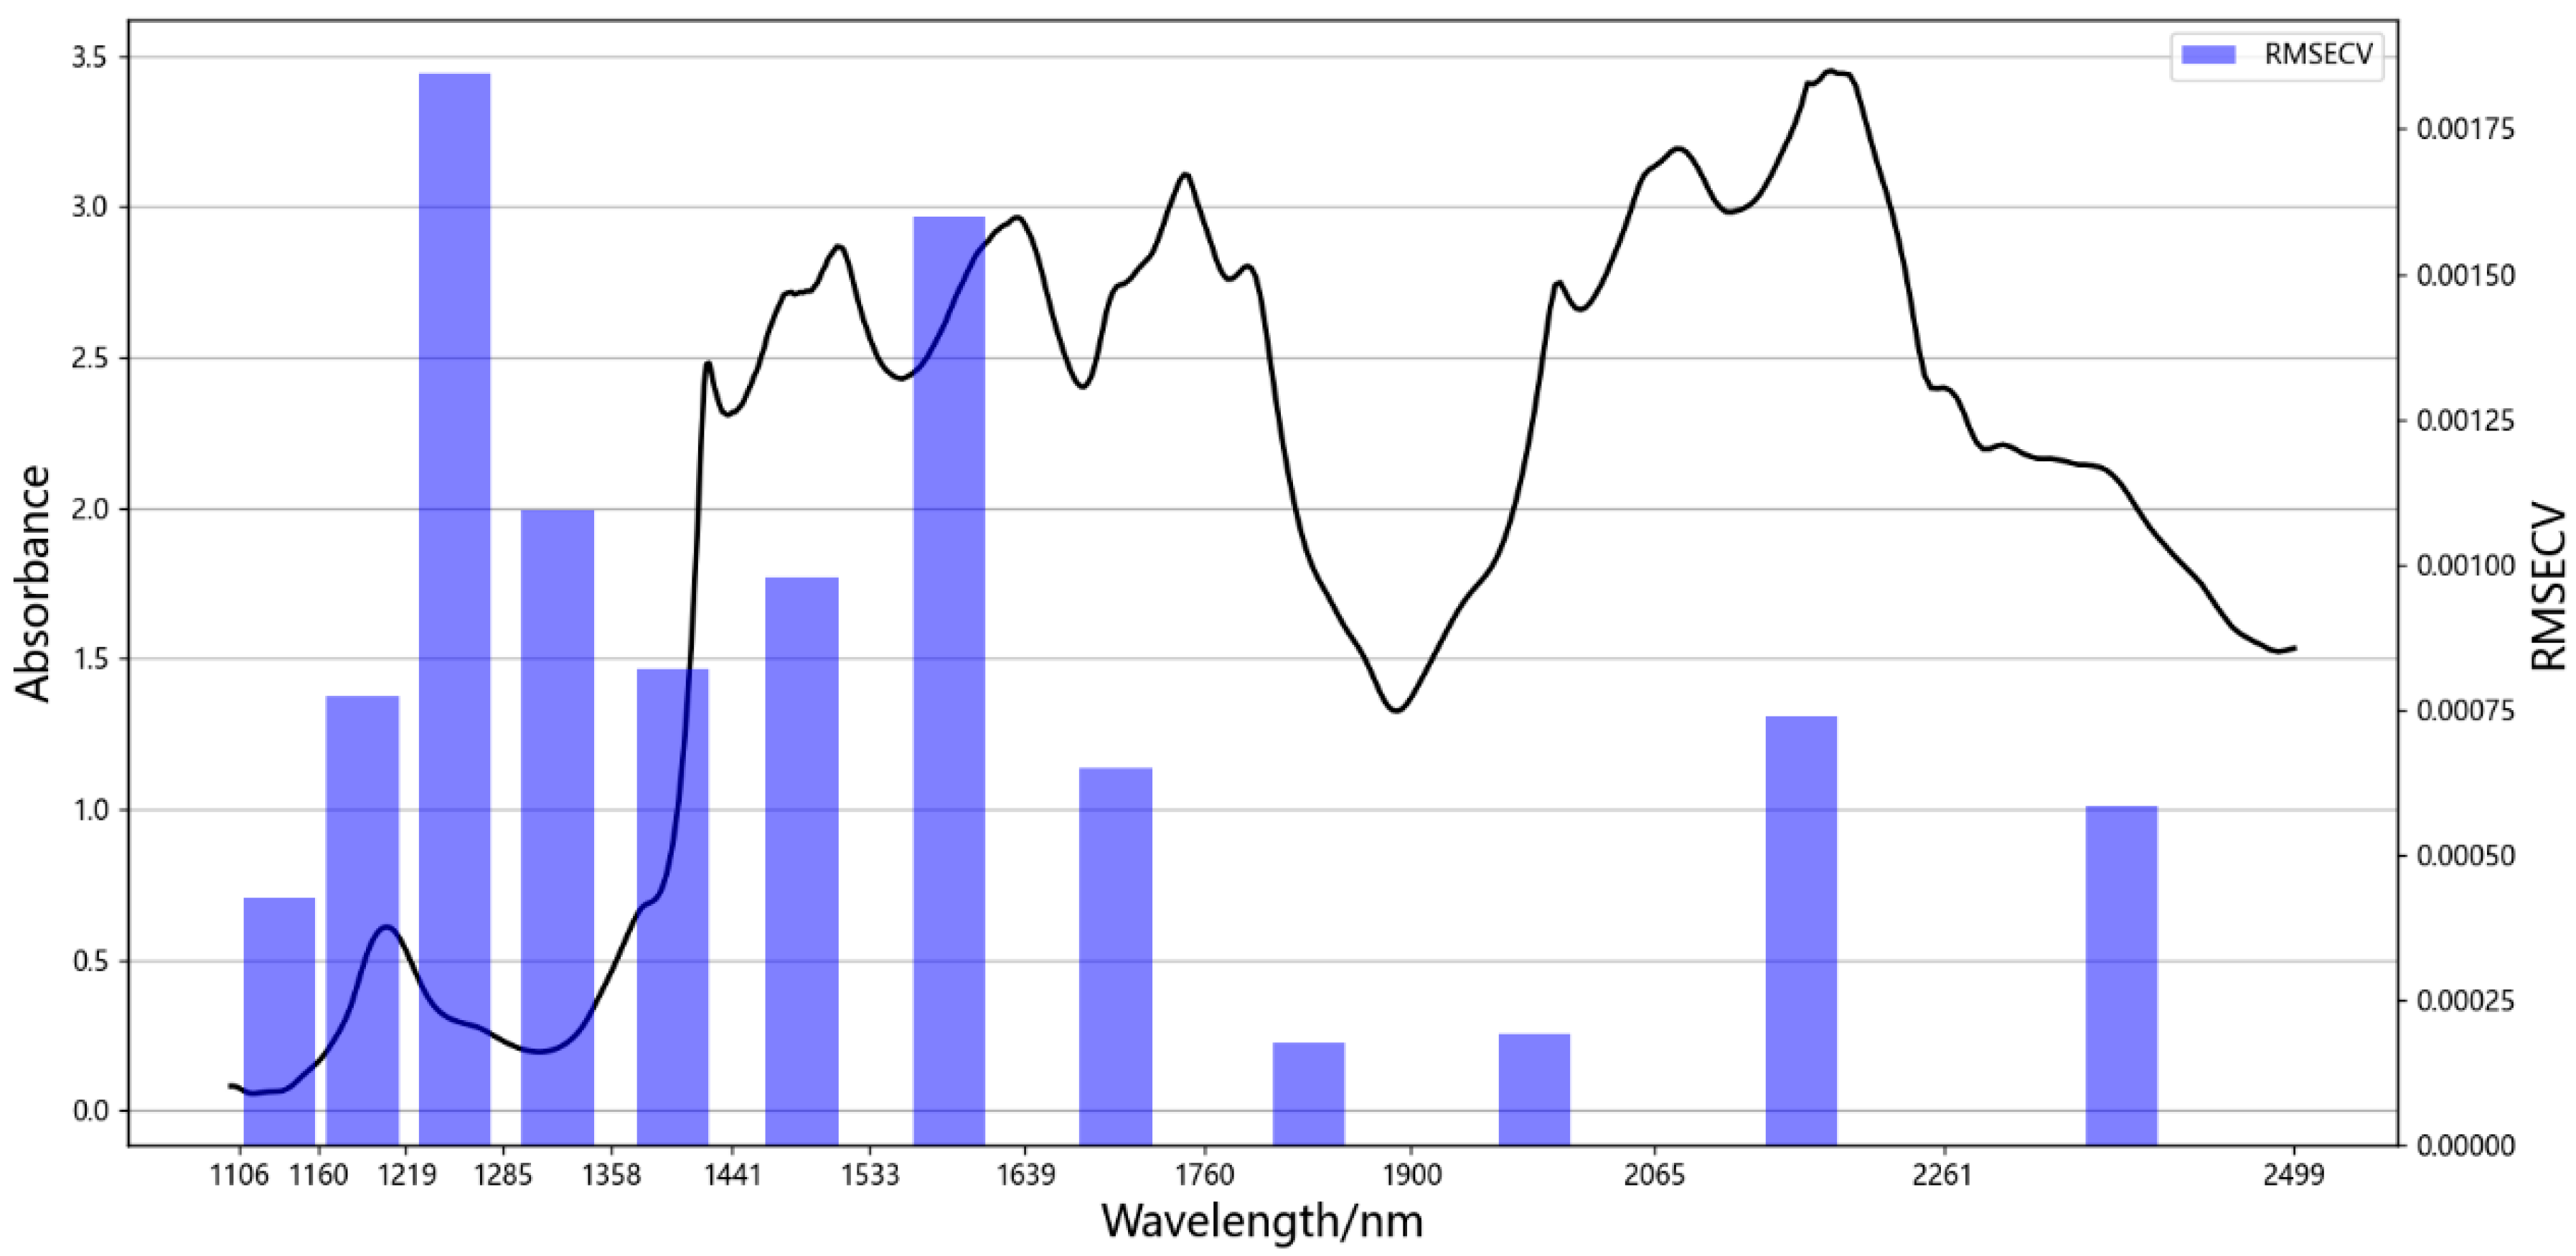
3.4. Selection of Feature Bands
3.5. Model Development and Evaluation for Full-Spectrum and Feature Bands
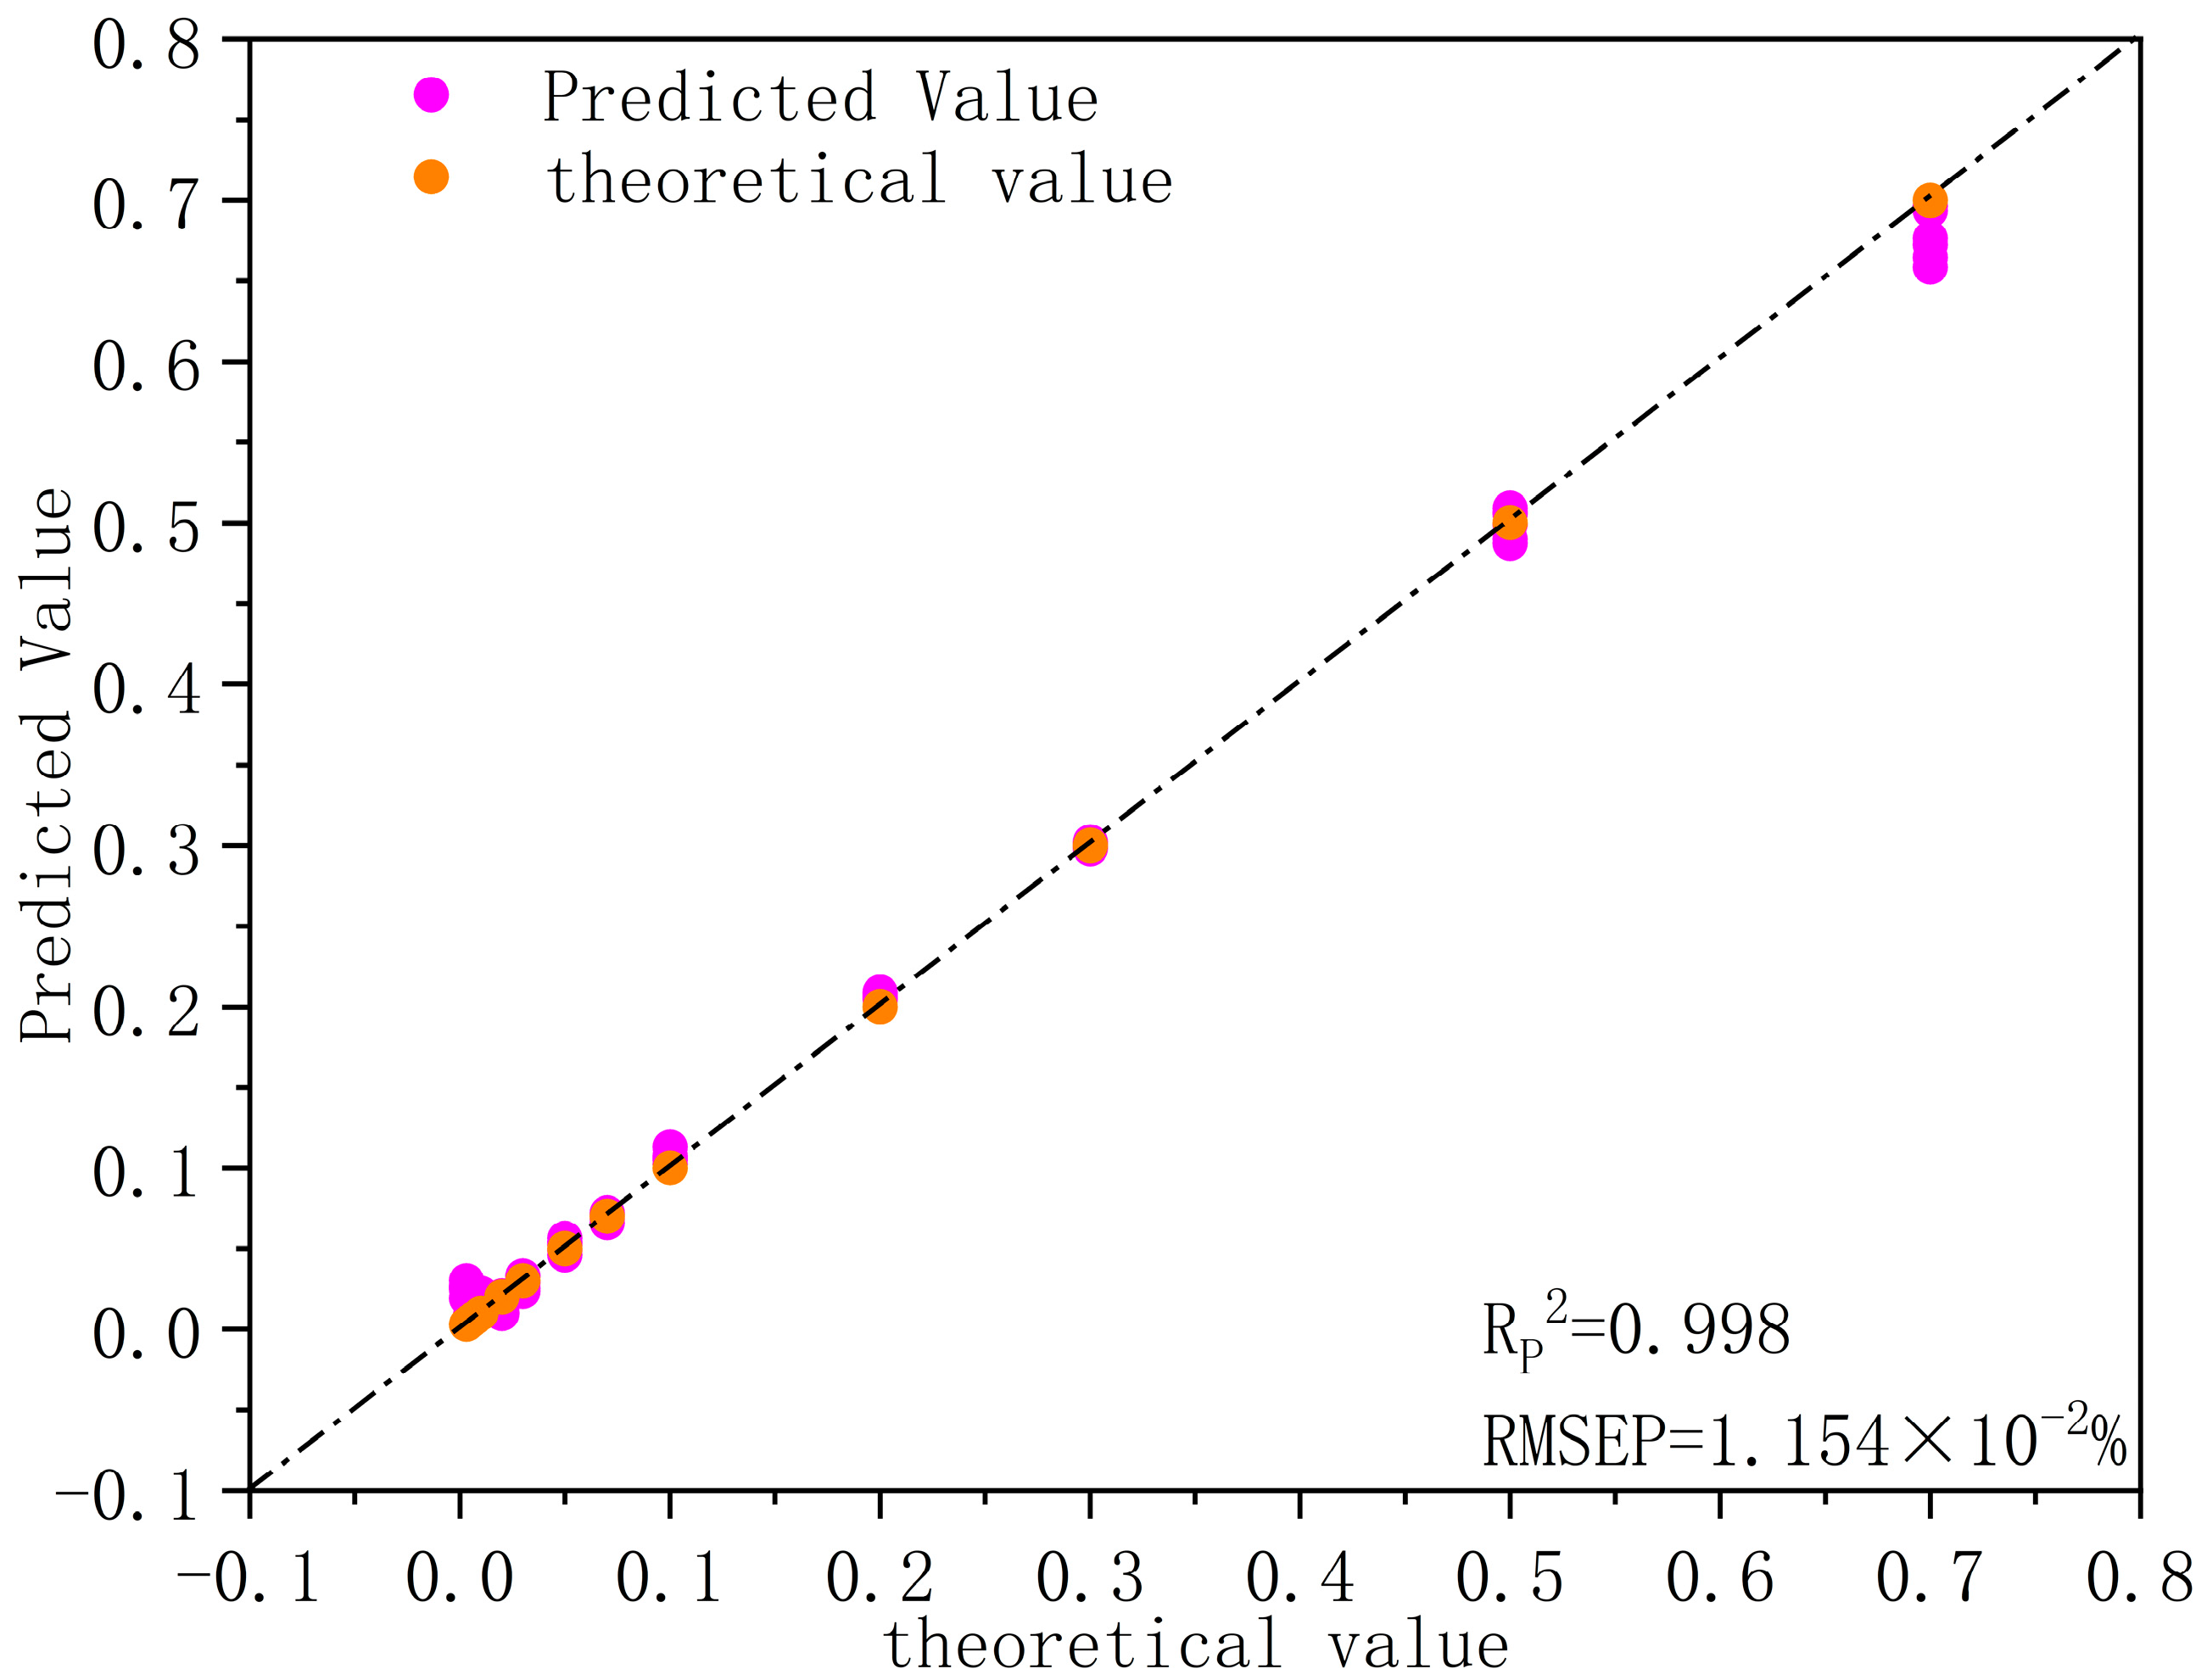
3.6. Model Validation
3.7. Calculation of the Limit of Detection (LOD)
- Confidence level: = 0.05 (95% confidence);
- External validation dataset: n = 13 samples;
- Number of latent variables: p = 3, resulting in degrees of freedom df = n − p = 10;
- Critical t-value: ≈ 2.228 (determined using Python’s SciPy library);
- Root Mean Square Error of Prediction (RMSEP): 1.154 ∙ 10−4;
- Slope of the calibration curve: 0.997.
4. Conclusions
Author Contributions
Funding
Institutional Review Board Statement
Informed Consent Statement
Data Availability Statement
Conflicts of Interest
References
- Yang, Q.; Yang, Q.; Xu, S.; Zhu, S.; Zhang, D. Technoeconomic and environmental analysis of ethylene glycol production from coal and natural gas compared with oil-based production. J. Clean. Prod. 2020, 273, 123120. [Google Scholar] [CrossRef]
- Yang, H.B. Determination and Exploration of Water Content in the EG Products Process. Guangzhou Chem. Ind. 2012, 40, 127–128. [Google Scholar] [CrossRef]
- Rivera-Quintero, P.; Patience, G.S.; Patience, N.A.; Boffito, D.C.; Banquy, X.; Schieppati, D. Experimental Methods in Chemical Engineering: Karl Fischer Titration. Can. J. Chem. Eng. 2024, 102, 2980–2997. [Google Scholar] [CrossRef]
- Kestens, V.; Conneely, P.; Bernreuther, A. Vaporisation coulometric Karl Fischer titration: A perfect tool for water content determination of difficult matrix reference materials. Food Chem. 2008, 106, 1454–1459. [Google Scholar] [CrossRef]
- Liu, J.X. Practical Near-Infrared Spectroscopy Analysis Technology; Science Press: Beijing, China, 2008. [Google Scholar]
- Pyper, J.W. The determination of moisture in solids: A Selected Review. Anal. Chim. Acta 1985, 170, 159–175. [Google Scholar] [CrossRef]
- Wang, S.; Altaner, C.; Feng, L.; Liu, P.; Song, Z.; Li, L.; Gui, A.; Wang, X.; Ning, J.; Zheng, P. A Review: Integration of NIRS and Chemometric Methods for Tea Quality Control—Principles, Spectral Preprocessing Methods, Machine Learning Algorithms, Research Progress, and Future Directions. Food Res. Int. 2025, 205, 115870. [Google Scholar] [CrossRef]
- Lu, W.Z. Modern Near-Infrared Spectroscopy Analysis Technology, 2nd ed.; China Petrochemical Press: Beijing, China, 2007; Volume 36. [Google Scholar]
- Alamar, P.D.; Carames, E.T.S.; Poppi, R.J.; Pallone, J.A.L. Quality evaluation of frozen guava and yellow passion fruit pulps by NIR spectroscopy and chemometrics. Food Res. Int. 2016, 85, 209–214. [Google Scholar] [CrossRef]
- Baranwal, Y.; Roman-Ospino, A.D.; Keyvan, G.; Ha, J.M.; Hong, E.P.; Muzzio, F.J.; Ramachandran, R. Prediction of Dissolution Profiles by Non-Destructive NIR Spectroscopy in Bilayer Tablets. Int. J. Pharm. 2019, 565, 419–436. [Google Scholar] [CrossRef]
- Bittner, M.; Krahmer, A.; Schenk, R.; Springer, A.; Gudi, G.; Melzig, M.F. NIR Spectroscopy of Actaea racemosa L. Rhizome—En Route to Fast and Low-Cost Quality Assessment. Planta Med. 2017, 83, 1085–1096. [Google Scholar] [CrossRef]
- Rodionova, O.Y.; Titova, A.V.; Demkin, N.A.; Balyklova, K.S.; Pomerantsev, A.L. Qualitative and quantitative analysis of counterfeit fluconazole capsules: A non-invasive approach using NIR spectroscopy and chemometrics. Talanta 2019, 195, 662–667. [Google Scholar] [CrossRef]
- Liang, J.; Yu, X.; Hong, W.; Cai, Y. Information Extraction of UV-NIR Spectral Data in Waste Water Based on Large Language Model. Spectrochim. Acta Part A Mol. Biomol. Spectrosc. 2024, 318, 124475. [Google Scholar] [CrossRef]
- Wongpromrat, P.; Phuphanutada, J.; Lapcharoensuk, R. Monitoring of Salinity of Water on the THA CHIN River Basin Using Portable Vis-NIR Spectrometer Combined with Machine Learning Algorithms. J. Mol. Struct. 2023, 1287, 135720. [Google Scholar] [CrossRef]
- Czarnecki, M.A.; Beć, K.B.; Grabska, J.; Huck, C.W.; Mazurek, S.; Orzechowski, K. State of Water in Various Environments: Aliphatic Ketones. MIR/NIR Spectroscopic, Dielectric and Theoretical Studies. Spectrochim. Acta Part A Mol. Biomol. Spectrosc. 2023, 302, 123057. [Google Scholar] [CrossRef] [PubMed]
- Lanjewar, M.G.; Parab, J.S.; Kamat, R.K. Machine Learning Based Technique to Predict the Water Adulterant in Milk Using Portable Near Infrared Spectroscopy. J. Food Compos. Anal. 2024, 131, 106270. [Google Scholar] [CrossRef]
- Mallet, A.; Charnier, C.; Latrille, É.; Bendoula, R.; Roger, J.-M.; Steyer, J.-P. Fast and Robust NIRS-Based Characterization of Raw Organic Waste: Using Non-Linear Methods to Handle Water Effects. Water Res. 2022, 227, 119308. [Google Scholar] [CrossRef] [PubMed]
- Cichosz, S.; Masek, A.; Dems-Rudnicka, K. Simple and Effective Mathematical Models for Cellulose Water Content Calculation from Absorbance/Wavenumber Shifts in NIR Spectrum. Polym. Test. 2023, 117, 107874. [Google Scholar] [CrossRef]
- Sheng, X.; Zan, J.; Jiang, Y.; Shen, S.; Li, L.; Yuan, H. Data Fusion Strategy for Rapid Prediction of Moisture Content During Drying of Black Tea Based on Micro-NIR Spectroscopy and Machine Vision. Optik 2023, 276, 170645. [Google Scholar] [CrossRef]
- Lee, C.; Polari, J.J.; Kramer, K.E.; Wang, S.C. Near-infrared (NIR) spectrometry as a fast and reliable tool for fat and moisture analyses in olives. ACS Omega 2018, 3, 16081–16088. [Google Scholar] [CrossRef]
- Karunathilaka, S.R.; Fardin-Kia, A.R.; Roberts, D.; Mossoba, M.M. Determination of water in olive oil: Rapid FT-NIR spectroscopic procedure based on the Karl-Fischer reference method. J. Oleo Sci. 2020, 69, 1373–1380. [Google Scholar] [CrossRef]
- Yue, J.; Zhang, H.; Gao, L.; Tian, W.; Luo, J.; Nie, L.; Li, L.; Wu, A.; Zang, H. Benchtop and Different Miniaturized Near-Infrared Spectrometers Application Study: Calibration Transfer and 2D-COS for In-Situ Analysis of Moisture Content in HPMC. Spectrochim. Acta Part A Mol. Biomol. Spectrosc. 2025, 333, 125889. [Google Scholar] [CrossRef] [PubMed]
- Bec, K.B.; Grabska, J.; Pfeifer, F.; Siesler, H.W.; Huck, C.W. Rapid On-Site Analysis of Soil Microplastics Using Miniaturized NIR Spectrometers: Key Aspect of Instrumental Variation. J. Hazard. Mater. 2024, 480, 135967. [Google Scholar] [CrossRef] [PubMed]
- Shen, X.; Lan, S.; Zhao, Y.; Xiong, Y.; Yang, W.; Du, Y. Characterization of Skin Moisture and Evaluation of Cosmetic Moisturizing Properties Using Miniature Near-Infrared Spectrometer. Infrared Phys. Technol. 2023, 132, 104759. [Google Scholar] [CrossRef]
- Avila, C.R.; Ferré, J.; de Oliveira, R.R.; de Juan, A.; Sinclair, W.E.; Mahdi, F.M.; Hassanpour, A.; Hunter, T.N.; Bourne, R.A.; Muller, F.L. Process Monitoring of Moisture Content and Mass Transfer Rate in a Fluidised Bed with a Low Cost Inline MEMS NIR Sensor. Pharm. Res. 2020, 37, 84. [Google Scholar] [CrossRef]
- Mirghani, M.E.S.; Kabbashi, N.A.; Alam, M.Z.; Qudsieh, I.Y.; Alkatib, M.F.R. Rapid method for the determination of Moisture content in biodiesel using FTIR spectroscopy. J. Am. Oil Chem. Socitey 2011, 88, 1897–1904. [Google Scholar] [CrossRef]
- Zhang, Z.; Ding, Y.; Hu, F.; Liu, Z.; Lin, X.; Fu, J.; Zhang, Q.; Zhang, Z.-H.; Ma, H.; Gao, X. Constructing In-Situ and Real-Time Monitoring Methods During Soy Sauce Production by Miniature Fiber NIR Spectrometers. Food Chem. 2024, 460, 140788. [Google Scholar] [CrossRef]
- Gorla, G.; Ferrer, A.; Giussani, B. Process Understanding and Monitoring: A Glimpse into Data Strategies for Miniaturized NIR Spectrometers. Anal. Chim. Acta 2023, 1281, 341902. [Google Scholar] [CrossRef] [PubMed]
- Jin, X.; Wang, L.; Zheng, W.; Zhang, X.; Liu, L.; Li, S.; Rao, Y.; Xuan, J. Predicting the Nutrition Deficiency of Fresh Pear Leaves with a Miniature Near-Infrared Spectrometer in the Laboratory. Measurement 2022, 188, 110553. [Google Scholar] [CrossRef]
- Zaukuu, J.-L.Z.; Nkansah, A.A.; Mensah, E.T.; Agbolegbe, R.K.; Kovacs, Z. Non-Destructive Authentication of Melon Seed (Cucumeropsis mannii) Powder Using a Pocket-Sized Near-Infrared (NIR) Spectrophotometer with Multiple Spectral Preprocessing. J. Food Compos. Anal. 2024, 134, 106425. [Google Scholar] [CrossRef]
- Yang, Z.; Xiao, H.; Zhang, L.; Feng, D.; Zhang, F.; Jiang, M.; Sui, Q.; Jia, L. Fast Determination of Oxides Content in Cement Raw Meal Using NIR Spectroscopy Combined with Synergy Interval Partial Least Square and Different Preprocessing Methods. Measurement 2020, 149, 106990. [Google Scholar] [CrossRef]
- Ezenarro, J.; Riu, J.; Ahmed, H.J.; Busto, O.; Giussani, B.; Boqué, R. Measurement Errors and Implications for Preprocessing in Miniaturised Near-Infrared Spectrometers: Classification of Sweet and Bitter Almonds as a Case of Study. Talanta 2024, 276, 126271. [Google Scholar] [CrossRef]
- Zhang, M.; Eddy, C.; Deanda, K.; Finkelstein, M.; Picataggio, S. Metabolic engineering of a pentose metabolism pathway in ethanologenic Zymomonas mobilis. Science 1995, 267, 240–243. [Google Scholar] [CrossRef] [PubMed]
- Clua-Palau, G.; Jo, E.; Nikolic, S.; Coello, J.; Maspoch, S. Finding a Reliable Limit of Detection in the NIR Determination of Residual Moisture in a Freeze-Dried Drug Product. J. Pharm. Biomed. Anal. 2020, 183, 113163. [Google Scholar] [CrossRef]
- Wu, Z.; Sui, C.; Xu, B.; Ai, L.; Ma, Q.; Shi, X.; Qiao, Y. Multivariate Detection Limits of On-Line NIR Model for Extraction Process of Chlorogenic Acid from Lonicera japonica. J. Pharm. Biomed. Anal. 2013, 77, 16–20. [Google Scholar] [CrossRef]
- Wu, Z.S.; Ouyang, G.Q.; Shi, X.Y.; Ma, Q.; Wan, G.; Qiao, Y. Absorption and quantitative characteristics of C-H bond and O-H bond of NIR. Opt. Spectrosc. 2014, 117, 703–709. [Google Scholar] [CrossRef]
- Sani, E.; Dell’Oro, A. Optical Constants of Ethylene Glycol Over an Extremely Wide Spectral Range. Opt. Mater. 2014, 37, 36–41. [Google Scholar] [CrossRef]
- Pereira, A.F.C.; Pontes, M.J.C.; Gambarra Neto, F.F.; Santos, S.R.B.; Galvão, R.K.H.; Araújo, M.C.U. NIR Spectrometric Determination of Quality Parameters in Vegetable Oils Using iPLS and Variable Selection. Food Res. Int. 2008, 41, 341–348. [Google Scholar] [CrossRef]
- Xu, Y.; Dong, Y.; Liu, J.; Wang, C.; Li, Z. Combination of Near Infrared Spectroscopy with Characteristic Interval Selection for Rapid Detection of Rice Protein Content. J. Food Compos. Anal. 2025, 137, 106995. [Google Scholar] [CrossRef]
- Nørgaard, L.; Saudland, A.; Wagner, J.; Nielsen, J.P. Interval Partial Least-Squares Regression (iPLS): A Comparative Chemometric Study with an Example from Near-Infrared Spectroscopy. Appl. Spectrosc. 2000, 54, 413–419. [Google Scholar] [CrossRef]

| Model | C15511-01 |
|---|---|
| Optical interferometer | Michelson interferometer |
| Photodetector | InGaAs PIN photodiode |
| Wavelength range | 1100–2500 nm |
| Spectral resolution | 5.7 nm |
| Signal-to-noise ratio (SNR) | >10,000 |
| Spectral acquisition modes | Absorption spectrum/Reflection spectrum |
| Dimensions | 495776 mm |
| Dataset | Number of Samples | Minimum Concentration (%) | Maximum Concentration (%) |
|---|---|---|---|
| Full Dataset | 36 | 0.002 | 1 |
| Training Set | 28 | 0.002 | 1 |
| Validation Set | 8 | 0.005 | 0.85 |
| Dataset | LVs | Training Set | Validation Set | PRESS | ||
|---|---|---|---|---|---|---|
| RC | RMSEC (%) | RP | RMSEP (%) | |||
| PLSR | 3 | 0.994 | 3.024 ∙ 10−2 | 0.991 | 1.873 ∙ 10−2 | 0.713 ∙ 10−4 |
| SVMR | - | 0.986 | 3.624 ∙ 10−2 | 0.985 | 4.924 ∙ 10−2 | 1.477 ∙ 10−4 |
| PCR | 3 | 0.987 | 4.068 ∙ 10−2 | 0.986 | 2.868 ∙ 10−2 | 0.889 ∙ 10−4 |
| Pretreatment Method | Training Set | Validation Set | ||
|---|---|---|---|---|
| RC | RMSEC (%) | RP | RMSEP (%) | |
| Normalization | 0.978 | 1.554 ∙ 10−2 | 0.991 | 1.492 ∙ 10−2 |
| S-G Smoothing | 0.976 | 1.329 ∙ 10−2 | 0.988 | 1.539 ∙ 10−2 |
| SNV | 0.987 | 2.227 ∙ 10−2 | 0.989 | 2.416 ∙ 10−2 |
| FD + Smoothing | 0.989 | 1.414 ∙ 10−2 | 0.992 | 1.451 ∙ 10−2 |
| FD + Normalization | 0.994 | 1.558 ∙ 10−2 | 0.993 | 1.662 ∙ 10−2 |
| Spectral Range (nm) | Training Set | Validation Set | ||
|---|---|---|---|---|
| RC | RMSEC (%) | RP | RMSEP (%) | |
| 1100–2500 | 0.987 | 3.024 ∙ 10−2 | 0.988 | 1.873 ∙ 10−2 |
| 1100–1470 | 0.985 | 3.678 ∙ 10−2 | 0.987 | 4.209 ∙ 10−2 |
| 1800–2050 | 0.991 | 1.074 ∙ 10−2 | 0.994 | 1.212 ∙ 10−2 |
| Sample Number | Theoretical Value (%) | Predicted Value (%) | Relative Error (%) 1 |
|---|---|---|---|
| 1 | 0.700 | 0.683 | 2.46 |
| 2 | 0.500 | 0.489 | 2.23 |
| 3 | 0.300 | 0.283 | 5.85 |
| 4 | 0.200 | 0.209 | 4.57 |
| 5 | 0.100 | 0.094 | 5.91 |
| 6 | 0.070 | 0.076 | 8.42 |
| 7 | 0.050 | 0.054 | 7.75 |
| 8 | 0.030 | 0.032 | 5.91 |
| 9 | 0.020 | 0.021 | 6.78 |
| 10 | 0.010 | 0.011 | 11.46 |
| 11 | 0.007 | 0.010 | 48.73 |
| 12 | 0.005 | 0.008 | 55.32 |
| 13 | 0.003 | 0.014 | 375.63 |
Disclaimer/Publisher’s Note: The statements, opinions and data contained in all publications are solely those of the individual author(s) and contributor(s) and not of MDPI and/or the editor(s). MDPI and/or the editor(s) disclaim responsibility for any injury to people or property resulting from any ideas, methods, instructions or products referred to in the content. |
© 2025 by the authors. Licensee MDPI, Basel, Switzerland. This article is an open access article distributed under the terms and conditions of the Creative Commons Attribution (CC BY) license (https://creativecommons.org/licenses/by/4.0/).
Share and Cite
Luo, Q.; Guo, Z.; Lin, D.; Chang, B.; Ruan, Y. Miniaturized Near-Infrared Analyzer for Quantitative Detection of Trace Water in Ethylene Glycol. Appl. Sci. 2025, 15, 6023. https://doi.org/10.3390/app15116023
Luo Q, Guo Z, Lin D, Chang B, Ruan Y. Miniaturized Near-Infrared Analyzer for Quantitative Detection of Trace Water in Ethylene Glycol. Applied Sciences. 2025; 15(11):6023. https://doi.org/10.3390/app15116023
Chicago/Turabian StyleLuo, Qunling, Zhiqiang Guo, Danping Lin, Boxue Chang, and Yinlan Ruan. 2025. "Miniaturized Near-Infrared Analyzer for Quantitative Detection of Trace Water in Ethylene Glycol" Applied Sciences 15, no. 11: 6023. https://doi.org/10.3390/app15116023
APA StyleLuo, Q., Guo, Z., Lin, D., Chang, B., & Ruan, Y. (2025). Miniaturized Near-Infrared Analyzer for Quantitative Detection of Trace Water in Ethylene Glycol. Applied Sciences, 15(11), 6023. https://doi.org/10.3390/app15116023