Article

Analysis of Vibration Characteristics of the Grading Belt in Wolfberry Sorting Machines

College of Mechanical Engineering, Xi’an University of Science and Technology, Xi’an 710054, China
*
Author to whom correspondence should be addressed.
Appl. Sci. 2025, 15(11), 6022; https://doi.org/10.3390/app15116022
Submission received: 14 March 2025 / Revised: 26 April 2025 / Accepted: 23 May 2025 / Published: 27 May 2025

Abstract

:
The vibration of the belt drive system in fresh wolfberry sorting machines significantly impacts the sorting efficiency of wolfberries. To analyze the vibration changes induced by the belt drive, a simulation model was developed using multi-body dynamics software, Recur Dyn. The lateral vibration characteristics of the grading device’s belt were examined under varying initial tensions, speeds, and deflection angles. Response surface methodology (RSM) was employed to determine the relative influence of these factors on the belt’s vibration characteristics. The analysis indicated the order of influence, from greatest to least, as initial tension, deflection angle, and speed. Aiming to minimize the vibration amplitude at the belt’s midpoint, the optimal parameter combination was determined. The operating conditions yielding the minimum amplitude were found to be an initial tension of 520 N/mm, a drive speed of 60 rpm, and a belt deflection angle of 5°. Concurrently, a transverse vibration modal analysis was conducted to study the system’s natural frequencies and corresponding mode shapes, aiding in the identification of potential resonance issues. Finally, under optimal operating conditions, guided by the results of the belt simulation test, a 10 mm fillet was introduced at the edge of the pulley, effectively mitigating wear and vibration. Specifically, when the effective length of the transmission mechanism is set to 2200 mm and the total length of the fixed device is configured as 1600 mm, the amplitude attenuation rate achieves its peak value. This study demonstrates that the integration of theoretical analysis with simulation techniques provides a robust approach for optimizing the structural design of the grading device.

1. Introduction

In the realm of agricultural product processing, the grading of crops and fruits occupies a central role. With the rapid advancement of agricultural mechanization and intelligent technology, research and application of sorting equipment have emerged as critical areas for enhancing the added value of agricultural products and improving industrial competitiveness. In the field of agricultural sorting equipment, there are primarily four classification types based on their operational mechanisms: size sorters, weight sorters, color sorters, and intelligent sorters. Zhang Yong Zhi [1] has developed an innovative roller nylon brush sorter that integrates both cleaning and grading functions. The roller sorting technology is more advanced compared to traditional mesh sorting equipment, significantly enhancing the adaptability for sorting irregularly shaped potatoes through flexible contact mechanisms. However, due to the relatively small particle size of fresh wolfberries, the accuracy of grading remains comparatively low. The goji berry inertial screening machine, designed by Liu Xiaolan [2], utilizes a crank-link mechanism to facilitate the reciprocating motion of the screen. When the acceleration of the screen meets specific criteria, the goji berry particles experience relative displacement. Particles that conform to the required size specifications are sorted through the openings in the screen. This method is exclusively applicable to dried goji berries. S. Laykin et al. [3] conducted a study on the automatic sorting technology for tomatoes utilizing machine vision, primarily focusing on the collection of color information and the detection of surface defects. Heinemann [4] and El Masry [5] developed an efficient machine vision system designed for real-time detection and sorting of potatoes. However, this method is hindered by its low productivity and high operational costs.
The grading of fresh wolfberries requires both a low damage rate and high accuracy in classification. Unfortunately, none of the previously mentioned research findings can be directly applied to the grading process for fresh wolfberries. In conjunction with the research findings of previous scholars, a novel sorting machine for fresh wolfberries (hereinafter referred to as the classifier) has been proposed for the purpose of particle size screening of fresh wolfberry granules. The operational principle involves conducting particle size classification of fresh wolfberries by regulating the gap size of the grading belt. The transmission mechanism plays a crucial role in influencing all aspects of the overall machine transmission and production processes. Various mechanical vibrations emerge from the differing operational states of the belt, which can directly impact both the stability of the grading belt’s transmission and its grading accuracy. Taking into consideration the transmission structure and its dynamic processes within the classifier, a simulation of the flat belt transmission mechanism for classifying high-freshness wolfberries was conducted to ensure stability. Additionally, the sources of vibration were systematically summarized and analyzed.
Flexible multibody dynamics (FMD) examines the motion characteristics of intricate mechanical systems, primarily focusing on the interplay between forces and deformations in systems composed of both rigid and flexible components throughout the motion process. In recent years, the study of flexible multibody dynamics has gained significant momentum, integrating computer simulations, multi-physical field coupling, and advanced control technologies. Li Junfu [6], in addressing the vibration issue of the intelligent terminal lifting integrated machine of synchronous belt, utilized the multi-body dynamics software Recur Dyn to establish a model of the vertical load synchronous belt transmission system and carried out simulation analysis, exploring the influence patterns of rotational speed and initial tension on the transmission performance such as lateral vibration, angular velocity fluctuation of the driven wheel, and tension fluctuation. By conducting the dynamic characteristic analysis of the timing drive system of a certain diesel engine based on multi-body dynamics, Gou Hongye [7] acquired the dynamic tension of the synchronous belt and pulley force, and expounded the impact of crankshaft speed fluctuation and other excitations on the dynamic characteristics of the synchronous belt. In the simulation and optimization of the fresh wolfberry sorting machine, the principles of flexible multibody dynamics provide essential support for tackling the vibration challenges associated with the transmission mechanism.
Belt transmission is a prevalent mode of mechanical power transmission. Due to its advantages, such as a simple structure, low cost, ease of maintenance, and strong adaptability, it has emerged as a significant method of transmission that is widely utilized across various types of mechanical equipment. With the ongoing evolution of working environments and mechanical equipment, certain transmission belts exhibit variations from conventional standard belts in terms of shape, structure, or function. These belts are characterized by innovative and targeted designs that enhance their adaptability to specific operational conditions [8,9,10]. Currently, the majority of studies on the vibration characteristics of belt drives are based on conventional standard belts like flat belts, V-belts, and synchronous belts, with relatively scarce dynamic analyses of transmission mechanisms involving special-shaped belts [11,12]. This paper takes the fresh wolfberry sorting machine as the research object. Through the dynamic simulation model of the grading belt, the lateral vibration characteristics of the special-shaped belt under different working conditions are discussed, and the optimal combination of working parameters is determined, providing a basis for improving and optimizing the stability of the sorting machine.

2. Materials and Methods

2.1. Structural Optimization Scheme Design

The development of fresh wolfberry sorting machines represents a critical step in enhancing both the processing efficiency and quality of wolfberries. As a core component of screening equipment, the vibration characteristics of the grading device play a decisive role in determining sorting accuracy and equipment stability. This paper investigates the issues of intensified vibration, belt wear, and mechanical damage to fresh wolfberries caused by drive wheel misalignment in traditional sorting machines. By leveraging the theory of flexible multi-body dynamics and dynamic simulation technology, a dynamic model of the belt drive system is developed, followed by comprehensive simulation analysis and rigorous experimental validation. The underlying mechanism of vibration generation is elucidated, and a targeted structural optimization scheme is proposed. The ultimate objective is to achieve high sorting accuracy and enhanced belt stability for effective classification. The main research contents are as follows:
By establishing a three-dimensional model of the fresh wolfberry sorting machine and analyzing its working principle, the issues inherent in the transmission structure are identified and discussed. This paper presents a theoretical analysis of the vibration characteristics of the belt drive model. Subsequently, relevant models were developed and theoretical formulas derived for the transverse vibration theory applied in this study. The results indicate that the primary factors influencing transverse vibration include initial tension, rotational speed, and center distance. The theoretical foundation established herein provides critical support for the simulation of the flexible belt drive system discussed in subsequent sections.
In Recur Dyn software, a virtual prototype model was developed to simulate the operational behavior of the prototype under various influencing factors (initial tension, rotational speed, and deflection angle). Additionally, the analysis focused on evaluating its dynamic characteristics, such as lateral vibration displacement and frequency. The feasibility of the model was verified by combining it with on-site experiments. Subsequently, single-factor experiments were conducted to systematically analyze and discuss the influence patterns of different factors on lateral vibration. Finally, the parameter optimization of the virtual prototype was achieved based on response surface analysis, thereby identifying the optimal working conditions.
ANSYS Workbench 2024 R1 Workbench finite element analysis software was employed to perform modal analysis on the belt drive system of the sorter. This analysis aimed to investigate the natural frequencies and mode shapes of the system, thereby facilitating the identification of potential resonance issues. Based on the optimal working conditions derived from the simulation, the transmission structure was systematically optimized with respect to the pulley structure design and the length of the fixing device.

2.2. Transmission Modeling and Principles

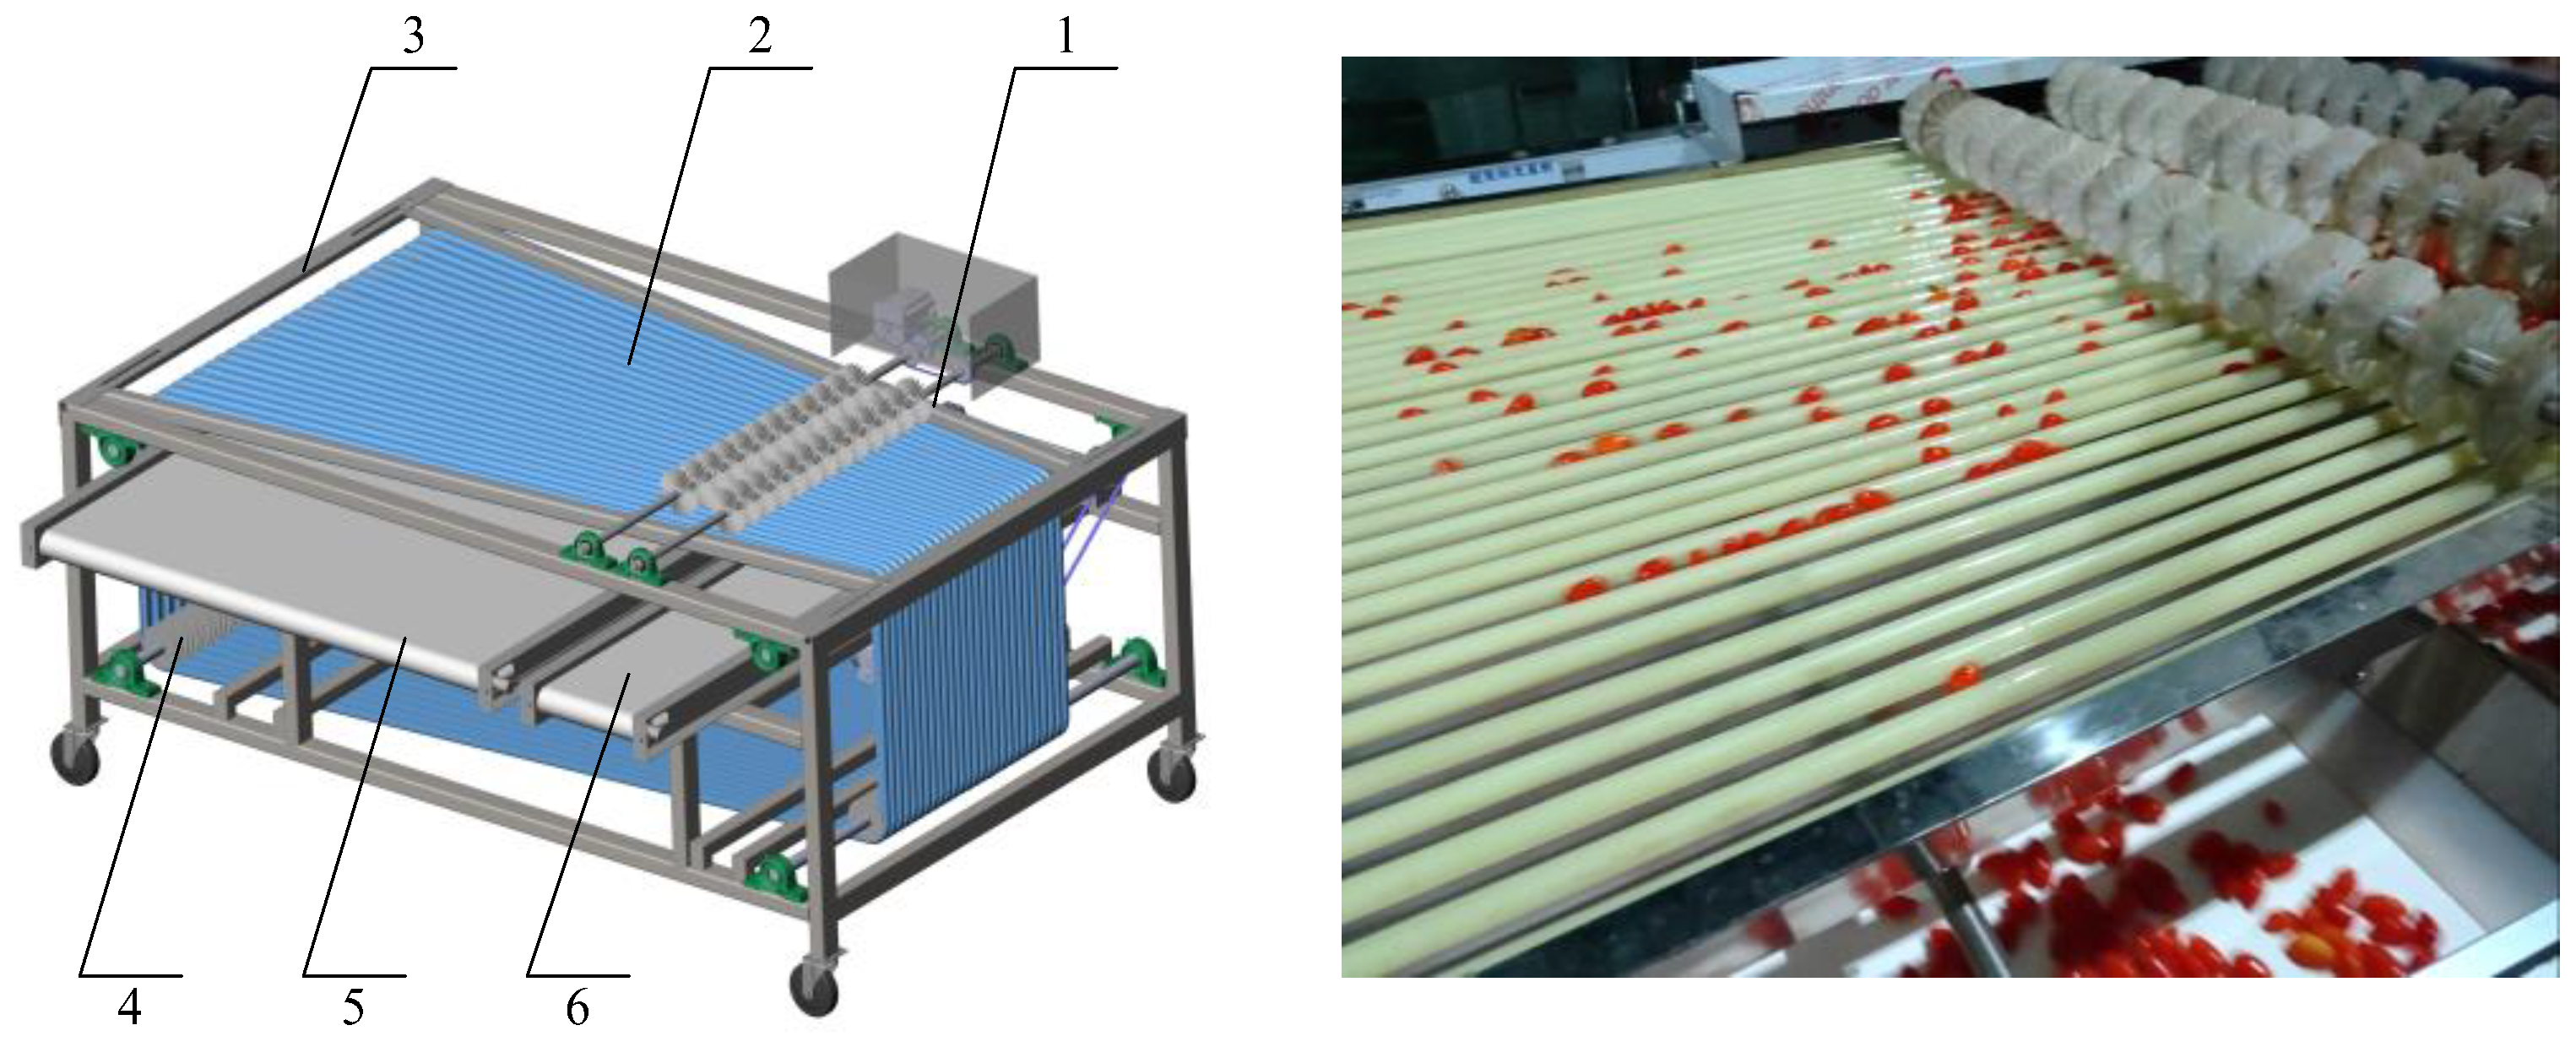
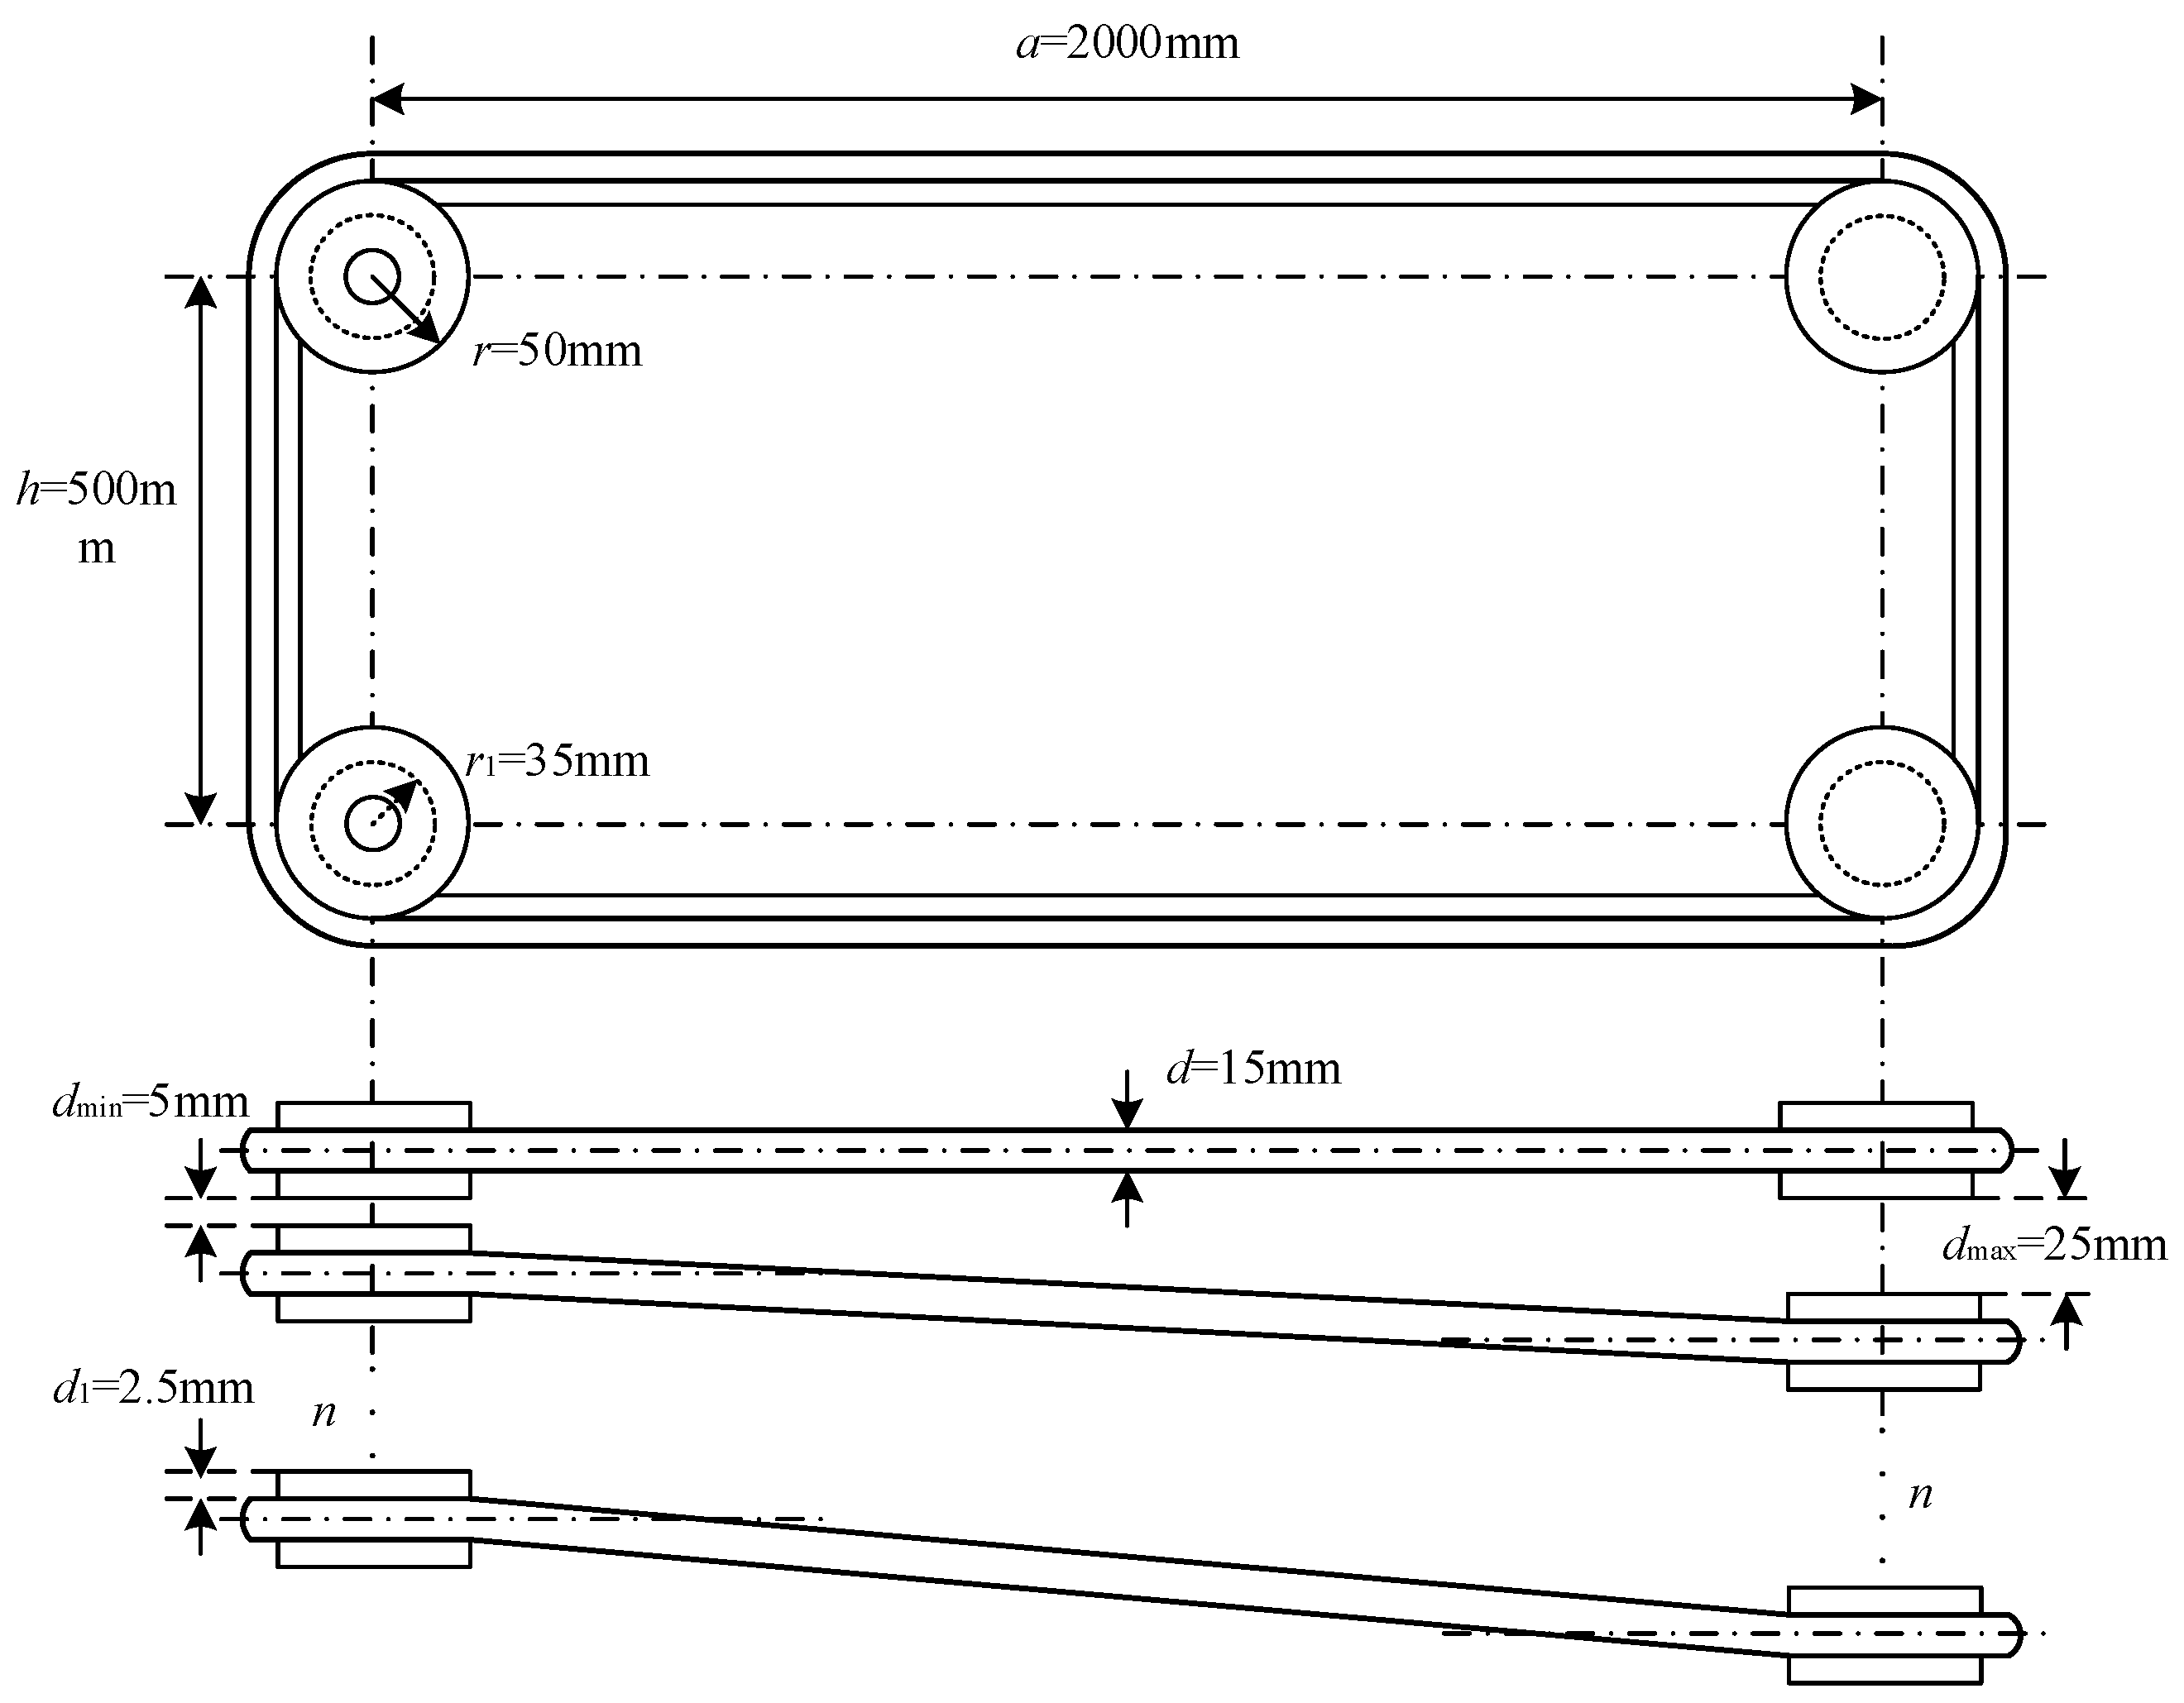
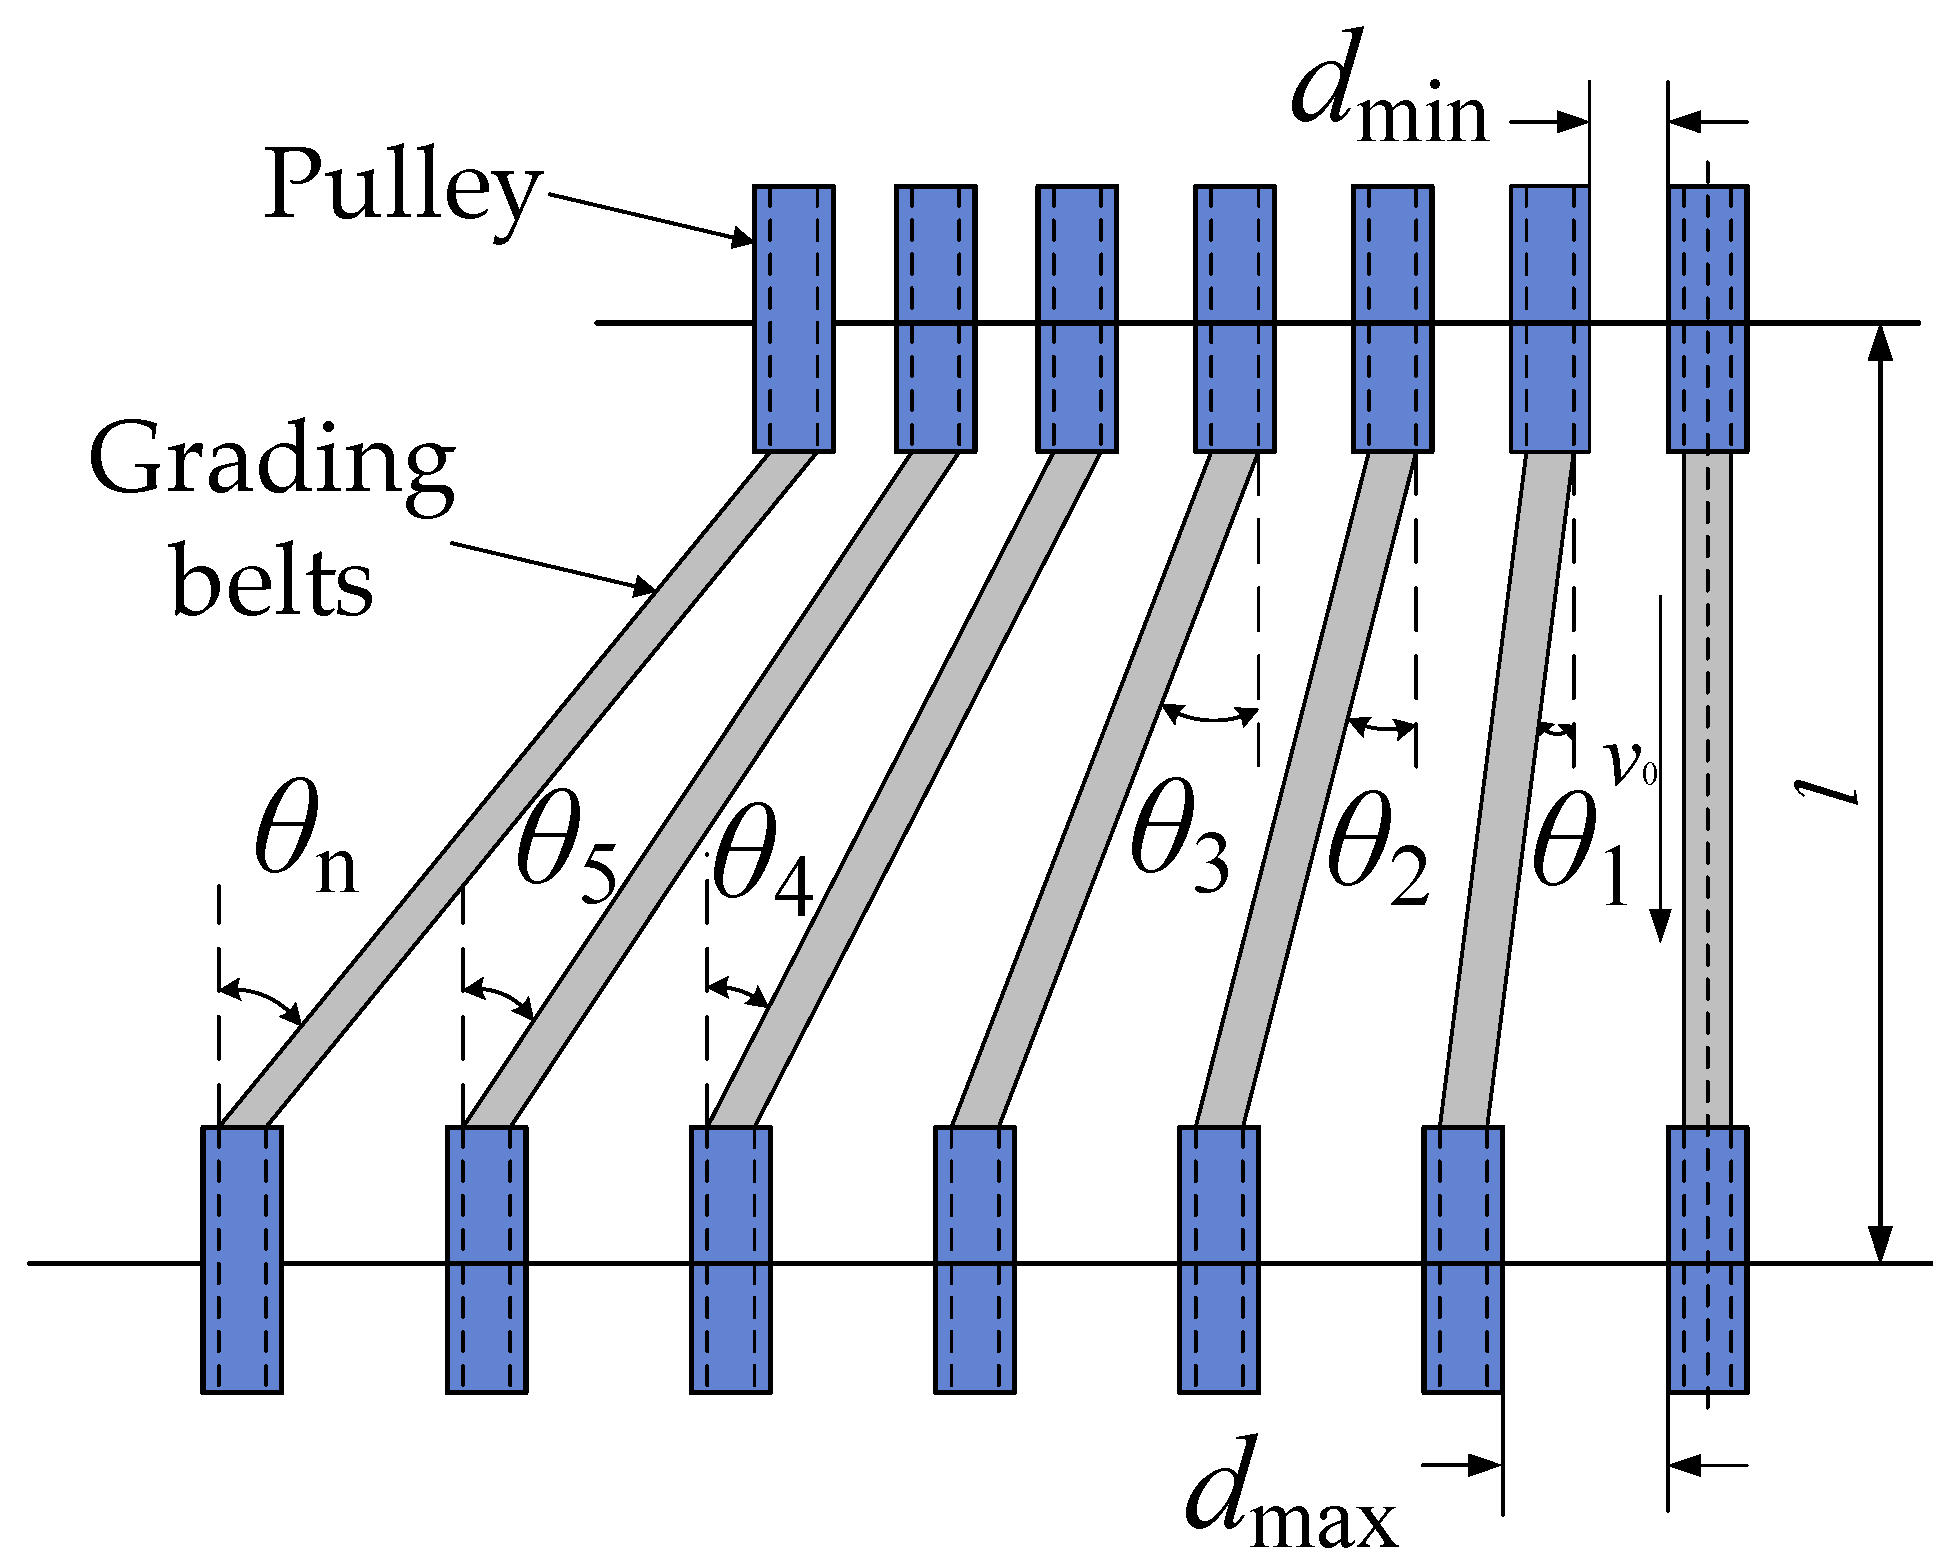
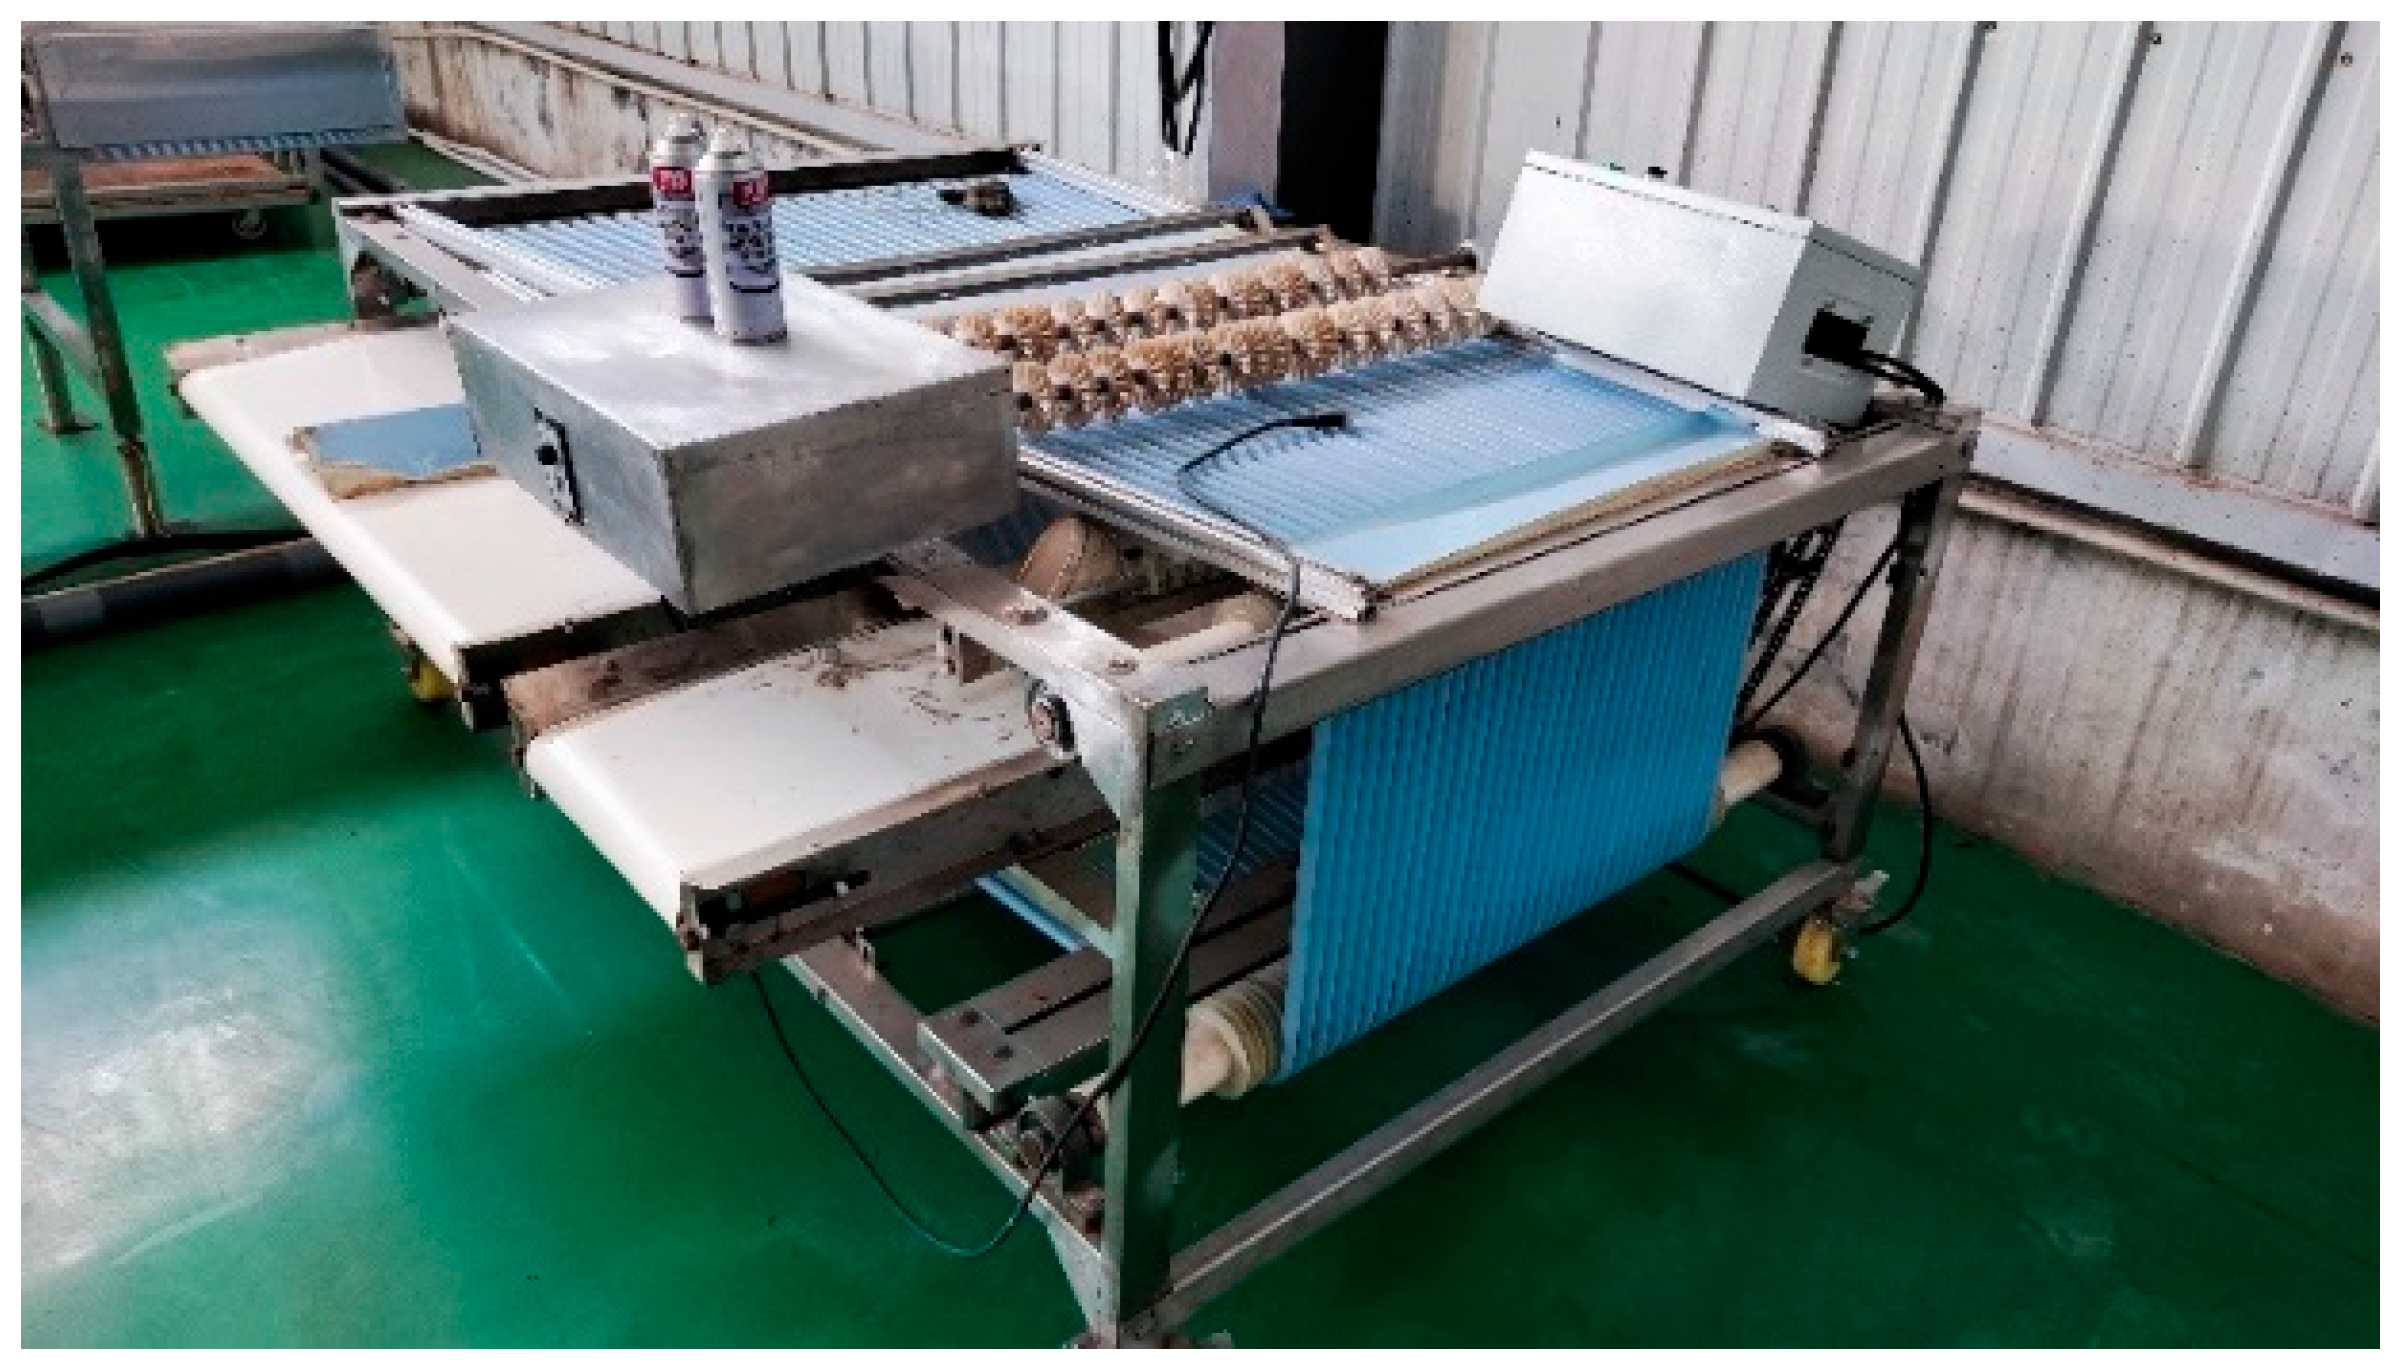
2.2.1. Structural Designs

Owing to the distinct biomechanical characteristics of fresh wolfberries compared with other fruits, the grading equipment must fulfill the following criteria:
(1)
Given the substantial variation in the size of individual fresh wolfberries, the machine must possess a high level of precision.
(2)
Considering the fragile nature of the outer skin of fresh wolfberries, mechanical damage must be minimized during the grading process.
The wolfberry sorting machine feeds fresh wolfberries through a belt conveyor to the screening unit for screening. The grading range of the fresh wolfberry grader is 5 to 20 mm. From the beginning to the end of the grading process, the belt gap gradually expands from 5 mm to 20 mm. The overall structure is depicted in Figure 1. Among them, the flat belt employed for wolfberry particle grading is one of the most crucial structures. The overall material is silicone rubber, without an inner core, and possesses advantages such as safety, no pollution, and high tensile strength. A total of 29 belts can be configured. The alignment unit consists of brushes, motors, and other components. The discharge unit is composed of two belt conveyors. By ensuring the smooth discharge of the belt conveyor, the impact on the wolfberries can be effectively mitigated [13].

2.2.2. Working Principle and Existing Issues

The working principle of this screening device is to sort the fresh wolfberries in terms of their transverse diameter size by controlling the size of the gap of the grading belt. Meanwhile, the overall dimensions of the entire machine need to be determined in accordance with the number of belts on the screening surface. The greater the number of belts, the wider the frame, and the higher the productivity of the classifier, as depicted in Figure 2. From the middle to the two sides, the parallelism deviation of the axes of the front and rear belt pulleys gradually increases and moves along the tracks at different angles, as depicted in Figure 3. Owing to the presence of the skew angle, the belt pulleys of (n − 1) groups are all misaligned, resulting in intense lateral vibration in the transmission system, and this is the primary reason for generating noise and affecting the service life of the flexible belt [14,15]. Lateral vibration exerts a considerable influence on transmission and directly affects the smooth operation of the classifier. In order to eliminate the impact of lateral vibration, the structure of the belt needs to be optimized.
The skew angle of the grading belt is expressed by the following formula:
θ n = tan 1 n ( d max d min ) l
In the formula:
θ n (n = 1, 2, 3…)—The deviation angle of the nth belt from the middle to either side of the belt;
d m a x —Maximum belt gap size, 20 mm;
d m i n —Minimum clearance dimension of the belt, 5 mm;
l—The center distance of the pulley, 2200 mm.
θ n is related to the quantity of belts and the center distance. On the basis of comprehensive consideration to ensure the smooth transmission of belts and the volume of the equipment, the value range of the grading belt is determined as 4° to 6°. Through optimization and experiments, the optimal angle is selected therefrom.

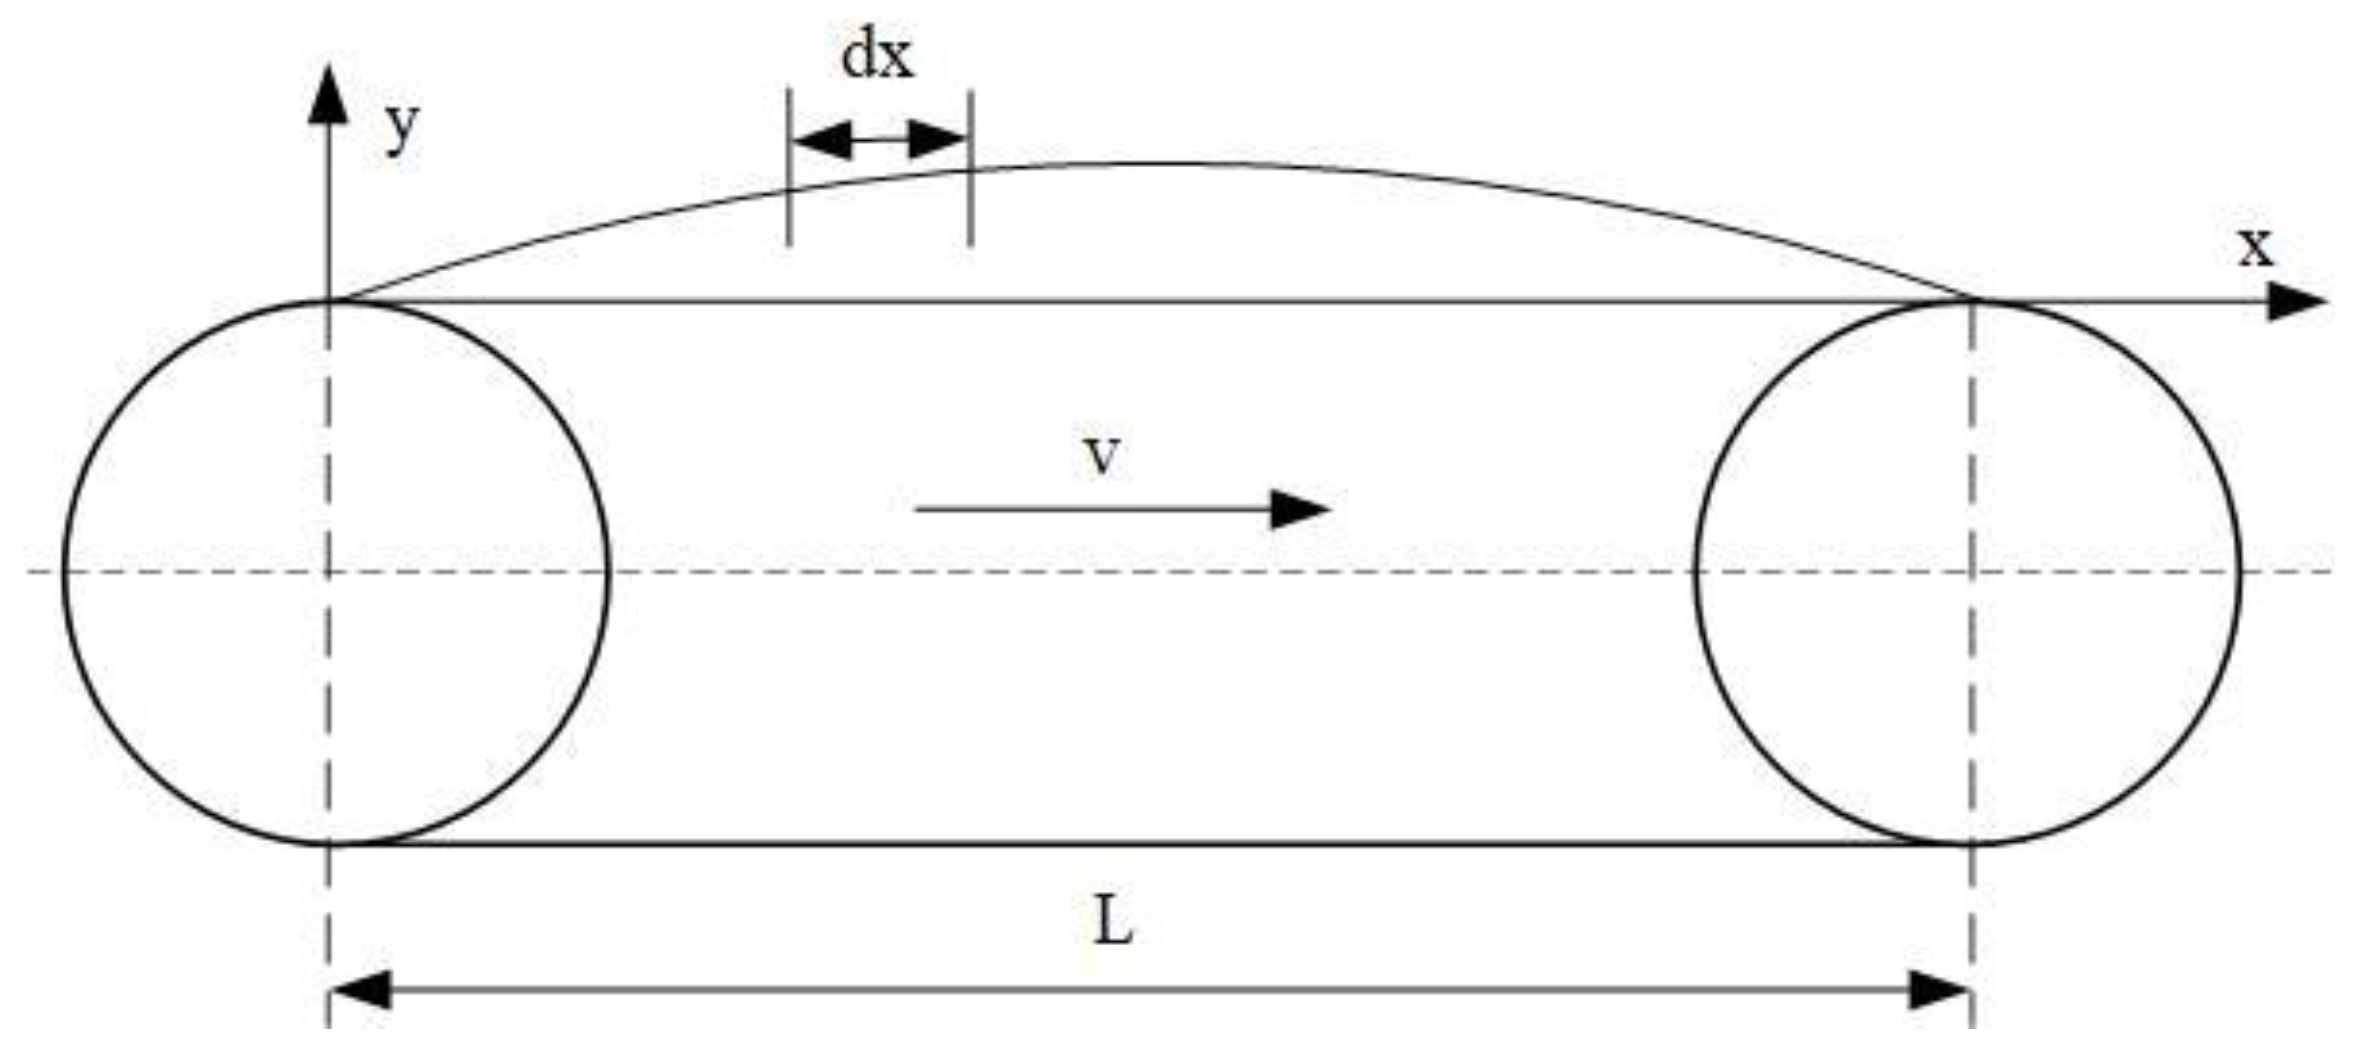
2.3. Mechanical Modeling of Transverse Vibration of a Flat Belt

2.3.1. Analysis of Belt Drive Systems

This transmission mechanism is mainly composed of belts and pulleys, and the size classification of fresh wolfberries is carried out through the gap size of the belts. Figure 4 presents the force analysis of the belt of the fresh wolfberry grading machine. Among them, pulley 1 serves as the driving pulley, while pulleys 2, 3, and 4 act as driven pulleys. In the process of pulley 1 functioning as the driving pulley and moving, pulley 1 conveys power to the entire belt system via friction with the belt. The difference in tension is caused by frictional force, which is related to the torque transmitted by pulley A. According to the tension relationship of classic belt drive, the relationship between the tight side tension F1 and the slack side tension F2 can be expressed by the following formula [16,17]:
F 1 F 2 = e u θ
In the formula:
μ is the coefficient of friction between the belt and the pulley;
θ is the wrap angle of the belt around the driving pulley.
The tension attenuation model based on Euler’s formula offers a theoretical foundation for the tension distribution of belt drives and discloses the relationship between the tension on the tight side and that on the slack side. It can be observed from the figure that the belt tension between pulley 1 and pulley 2 is the minimum, and the greater the possibility of belt vibration.

2.3.2. Transverse Vibration Analysis of Belt Drives

The belt mainly demonstrates three vibration modes during its working process: the transverse vibration perpendicular to the centerline connection of the pulleys, the axial vibration parallel to the centerline, and the torsional vibration rotating around the centerline. In contrast to the impact of lateral vibration on belt vibration, the effects of longitudinal vibration and torsional vibration on belt vibration are relatively minor. Furthermore, longitudinal vibration and torsional vibration are more frequently employed in high-precision equipment. Therefore, this article primarily examines the lateral vibration characteristics of belts during the belt drive process and the impact of different working conditions on them.
To simplify the mathematical model, hypotheses are formulated for the sorting device. In the belt transmission system, the lateral vibration is mainly concentrated on the straight portion between the two pulleys. Since the silicone rubber belt is a nonlinear viscoelastic material with non-negligible stiffness, the belt is simplified to an axially moving beam model [18,19,20,21].
The simplified diagram of the mathematical model for the transverse vibration of the flat belt is shown in Figure 5.
By taking the contact point between the flat belt and the driving pulley as the coordinate origin, a differential element model of length dx located at a distance x from the origin along the belt movement direction is analyzed. This allows for the determination of the force in the y-direction and the moment equilibrium equation on the belt differential element as follows:
Q ( x + d x ) cos θ ( x + d x ) Q ( x ) cos θ ( x ) + F sin θ ( x + d x ) F sin θ ( x ) = ρ A d x a y β y t 3 d x
M = 0 M x = Q
In the equations:
ρ: Belt density (kg/m3); A: Cross-sectional area (m2); ρA: Linear density (kg/m); EI: Bending stiffness (N·m2); T: Axial tension (N); c: Linear damping coefficient (N·s/m); β: Nonlinear damping coefficient (N·s3/m3).
Assuming that the lateral vibration is a small vibration (θ ≪ 1):
sin θ tan θ y x , cos θ 1 , θ ( x + d x ) θ ( x ) + θ x d x
Based on the Euler–Bernoulli beam theory, the relationship between curvature and bending moment is formulated while incorporating the viscoelastic characteristics described by the Kelvin–Voigt model.
M = E I 2 y x 2 η I 3 y x 2 t
By substituting Formula (6) into the torque balance equation, the following result can be derived:
Q x = E L 4 y x 4 η I 5 y x 4 t
By simultaneously solving Equations (5) and (7) and substituting them into the transverse force equilibrium equation, the complete transverse vibration equation for the viscoelastic belt is derived.
ρ A 2 y t 2 + 2 v 2 y x t + v 2 2 y x 2 + E I 4 y x 4 + η I 5 y x 4 t T 2 y x 2 + c y t + β y t 3 = 0
From Equation (8), it can be observed that the lateral vibration amplitude y of the synchronous belt is related to the center distance L between the pulleys, the initial tension T, and the operating speed v [22,23,24].

2.4. Graded Flat-Band Dynamics Analysis

Belt Drive Modeling

The Recur Dyn software, founded on relative coordinate system modeling and recursive algorithms, is capable of solving large-scale multi-body system dynamics issues [25,26,27]. Combining the structural principle and mathematical model of the fresh wolfberry sorter, in the process of establishing the finite element model of the grading belt transmission system, to reduce the calculation amount and error during the simulation of the system model, with the main motion system remaining unchanged as the prerequisite, an appropriate simplification of the grading device was carried out, thereby reducing the number of elements generated during the dynamic characteristic analysis. The following hypotheses are made [28,29]:
  • The vibration of the motor on the transmission device is relatively small and can be disregarded.
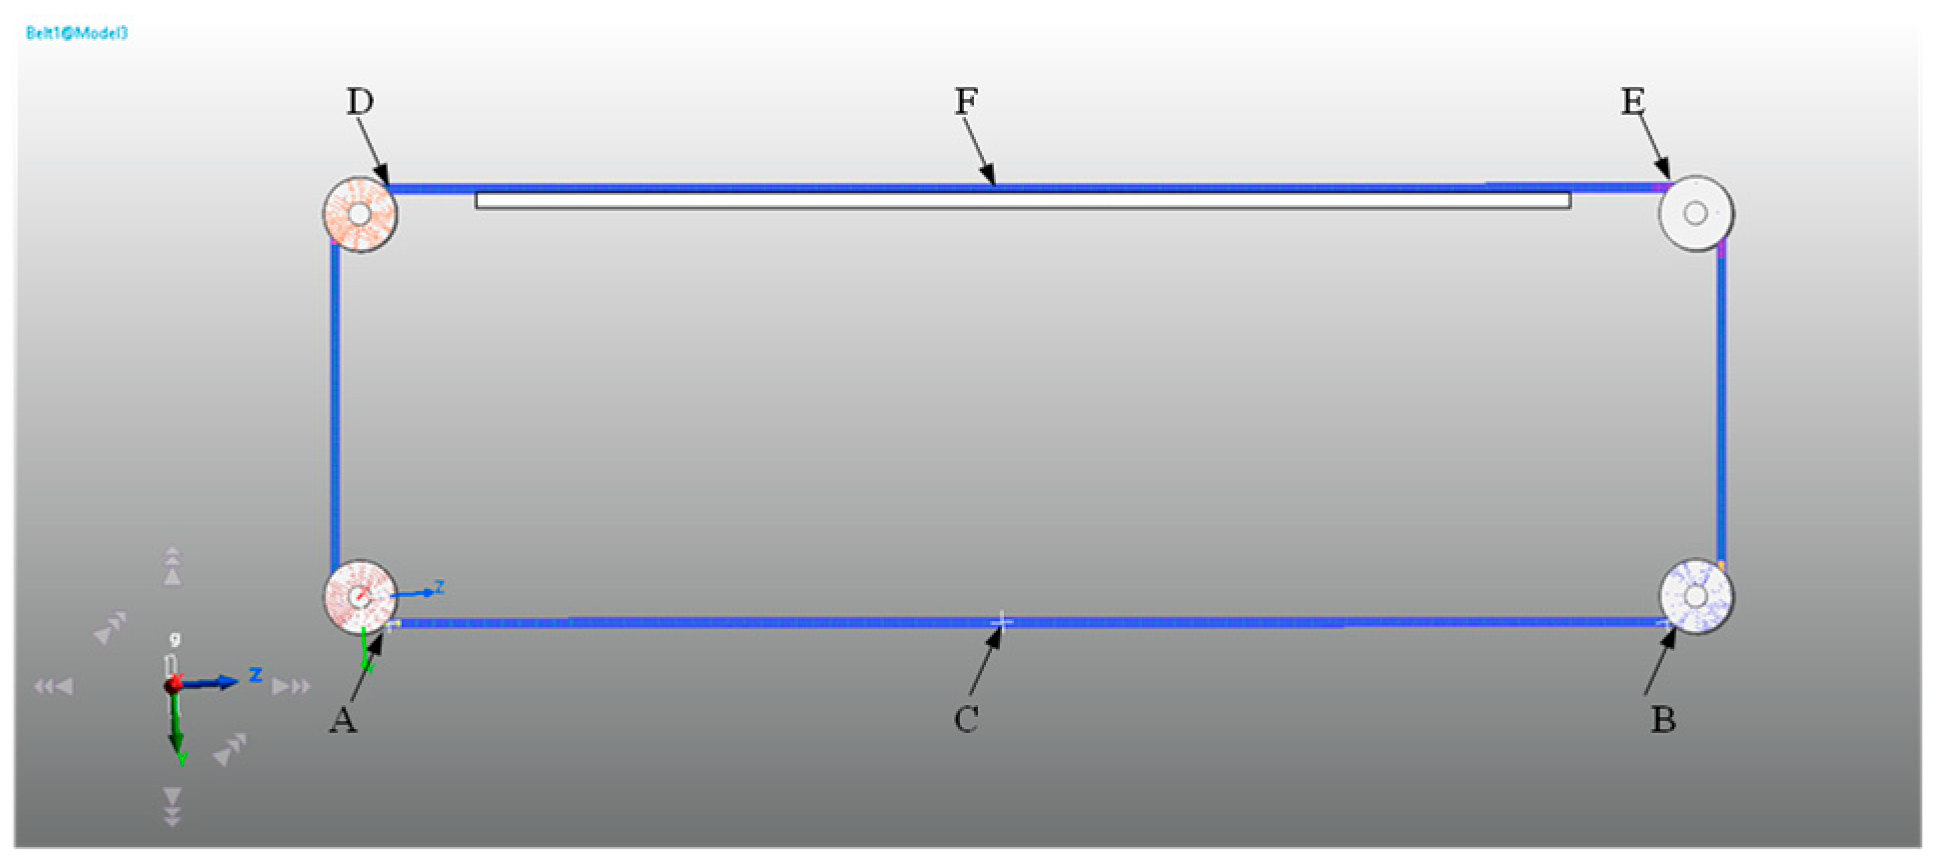
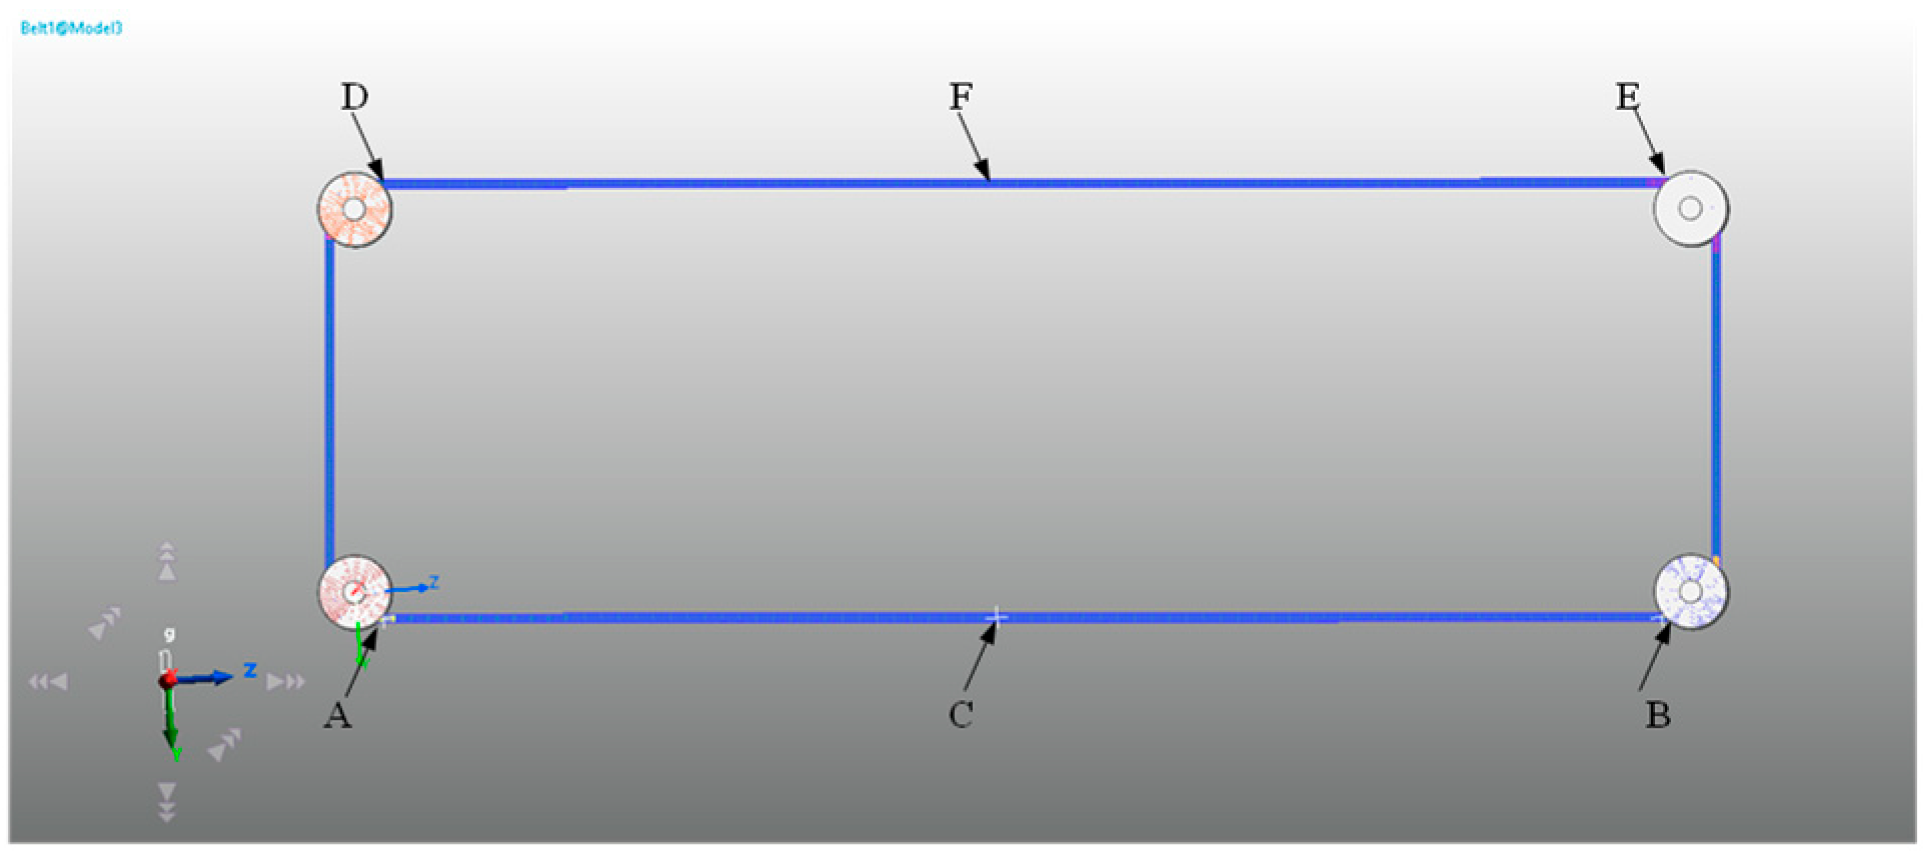
  • The fixed device beneath the flexible belt has a considerable influence on the lateral vibration of the belt. The lateral vibration characteristics of the belt without this device added are mainly considered. It is simplified into two parts, namely, the driving wheel and the transmission belt [30]. The simplified model is shown in Figure 6.
In the establishment of the belt drive model, as the silicone rubber belt is a flexible body, it is necessary to create a finite element flexible body calculation model of the belt. The flexible body creation method based on the geometrical shape of the rigid body component is adopted to discretize the space occupied by the component through finite elements for the creation of the flexible body. The boundary conditions are defined as where no displacement occurs in the RX, RY, and RZ directions; the contact between the flat belt and the transmission shaft is of the type FSurface To Surface Contact; the material properties and main contact parameters are presented in Table 1.
In the dynamic modeling of the flat belt system, revolute joint constraints are applied to both the driving and driven wheels. The rotational speed of the driving wheel is specified within the range of 60 to 180 min−1. An initial tension force ranging from 170 to 570 N is applied to the flat belt, with the maximum allowable deflection angle of the belt set between 4° and 6°. The simulation is conducted for a duration of 1 s, with the step size configured at 1000 steps [31,32]. To analyze the lateral vibration characteristics of the grading belt, three lateral vibration amplitude measurement points were established on both the upper and lower sides of the grading flat belt, as illustrated in Figure 6 and Figure 7. By comparing the displacement amplitudes measured at different positions, the distribution pattern of lateral displacements among the measurement points during the belt transmission process was determined.

2.5. Experimental Validation

The original design model, as well as the optimized model, was selected for field experiments. The experimental equipment includes an offset angle of 5° and 5.5° of the variable pitch fresh wolfberry grading machine for each one; a laser displacement sensor; a signal collector; and a data processing computer, a prototype of which is shown in Figure 8 and Figure 9.
The structural parameters of the variable-spacing fresh goji berry grading machine were adjusted. Once the device operated stably, the vibration data of the outermost flat belt were collected via a laser displacement sensor. Three lateral vibration amplitude measurement points were respectively set on the upper and lower sides of the flat belt.
The collected voltage was subsequently converted into the corresponding vibration displacement values using a digital signal collector. The data were then analyzed through the computer’s image processing model to generate the vibration displacement visualization, and the maximum amplitude of the stabilized curve was recorded.

2.6. Single-Factor Analysis

To optimize the vibration characteristics of the belt transmission system, after removing the fixed devices of the graded belt, the lateral vibration characteristics of the flat belt under various operating conditions were investigated. Owing to the considerable number of belts, the midpoint of the outermost belt with the maximum deflection angle was chosen for the study. Through the previous simulation analysis, the reasonable ranges of each factor were determined.
When the belt length is 2000 mm, the maximum deviation angle is 5.5°, the rotational speed of the driving wheel is 120 min−1, and the initial tension gradually increases from 170 N to 570 N, the lateral vibration displacement amplitudes at the midpoints of sides DE and AB are measured.
When the belt length is 2000 mm, the maximum deflection angle reaches 5.5°, and the initial tension is set to 370 N. The lateral vibration displacement amplitudes at the midpoints of sides DE and AB are measured as the rotational speed of the driving wheel increases gradually from 60 min−1 to 180 min−1.
When the initial tension of the belt is set to 370 N, the rotational speed of the driving pulley is maintained at 120 r·min−1, and the maximum deviation angle of the belt gradually increases from 4° to 6°, the lateral vibration displacement amplitudes at the midpoints of sides DE and AB are measured.

2.7. Response Surface Optimization

Based on the research findings regarding the vibration characteristics of the belt, the initial tension, rotational speed, and deflection angle were chosen as the key variables, and a response surface analysis model with three factors and three levels was established using the Box–Behnken (BBD) experimental design method [33]. BBD is a frequently employed response surface experimental design approach that can achieve a relatively high model accuracy with a reduced number of experimental trials. The experimental factors and levels are shown in Table 2 and Table 3.
To comprehensively characterize the overall vibration characteristics of the grading belt, this study integrates the vibration amplitudes at the midpoints of sides DE and AB of the grading flat belt for evaluation. The comprehensive scoring method based on membership degree is employed to synthesize the two indicators into a unified score.
Given that the vibration amplitude serves as a negative indicator (where smaller values are preferable), the subsequent standardization formula is employed (9):
l i = c max c i c max c m i n
In the formula:
ci represents the measured value of the indicator (e.g., vibration displacement);
cmax is the maximum observed vibration displacement;
cmin is the minimum observed vibration displacement.
Calculate the proportion of each indicator:
p i j = r i j i = 1 17 r i j
Calculate information entropy:
e j = 1 ln ( 17 ) i = 1 17 p i j ln ( p i j )
Calculate the weights:
w j = 1 e j ( 1 e j )
In this experiment, the amplitude at the midpoint of edge DE was designated as the primary indicator, while the amplitude at the midpoint of edge AB served as the secondary indicator. Through calculation, it was determined that w 1 = 0.571 and σ 2 = 0.429 . Based on the formula, the membership degrees of these two indicators were evaluated to derive the comprehensive score for the graded flat band vibration amplitude:
S = w 1 l 1 + w 2 l 2
In the formula:
l1 is the membership degree of the tight-side amplitude;
l2 is the membership degree of the slack-side amplitude;
w1 and w2 are the weighting factors for the tight-side and slack-side amplitudes, respectively.

2.8. Structural Optimization Design

2.8.1. Transverse Vibration Response Analysis

To investigate the vibration response of the grading belt in the transmission of the fresh wolfberry sorting machine, the Harmonic response module of the ANSYS Workbench software was employed to solve the vibration response. On the basis of the prestressed modal analysis results, a finite-element-based harmonic response simulation for the belt drive system was performed. The simulation outcomes from the prestressed finite element modal analysis, together with the associated constraints and boundary conditions, were incorporated into the setup phase of the harmonic response analysis.
The simulation data of the lateral vibration of the fresh wolfberry sorting machine in Recur Dyn under the conditions of an active wheel speed of 600 r/min, a tension force of 570 N, a deflection angle of 5°, and with a fixed device were subjected to Fourier Transform (FFT), and then applied as an external excitation to the measurement points of the corresponding belt.

2.8.2. Belt Pulley Process Optimization

The edges of traditional right-angle pulleys are prone to stress concentration, which can cause sudden changes in pulsating contact forces under misalignment conditions. During the rotation of the pulley, the belt and the right-angle edge present a periodic contact mode of “impact–detachment–re-impact”. The fillet processing of the pulley edge can alleviate stress concentration and modify the contact dynamics, thereby reducing vibration, as depicted in Figure 10 and Figure 11.
According to the critical radius formula, it can be known that:
η = 1 e 0.67 ( R / t ) 1.2
The exponent term (R/t)1.2 quantifies the nonlinear relationship between the fillet radius R and the belt thickness t. As the fillet radius R reaches a specific proportion of the belt thickness t, the stress concentration effect diminishes substantially, and the amplitude attenuation rate η tends toward saturation.
When R/t ranges from 1.2 to 1.8, the reduction is maximal. The effective thickness of the belt is 7.5 mm; thus, 9 ≤ R ≤ 13.5 mm. When the fillet radius R is overly large, there exists a risk of belt misalignment. Therefore, the balance between the amplitude and R needs to be weighed.

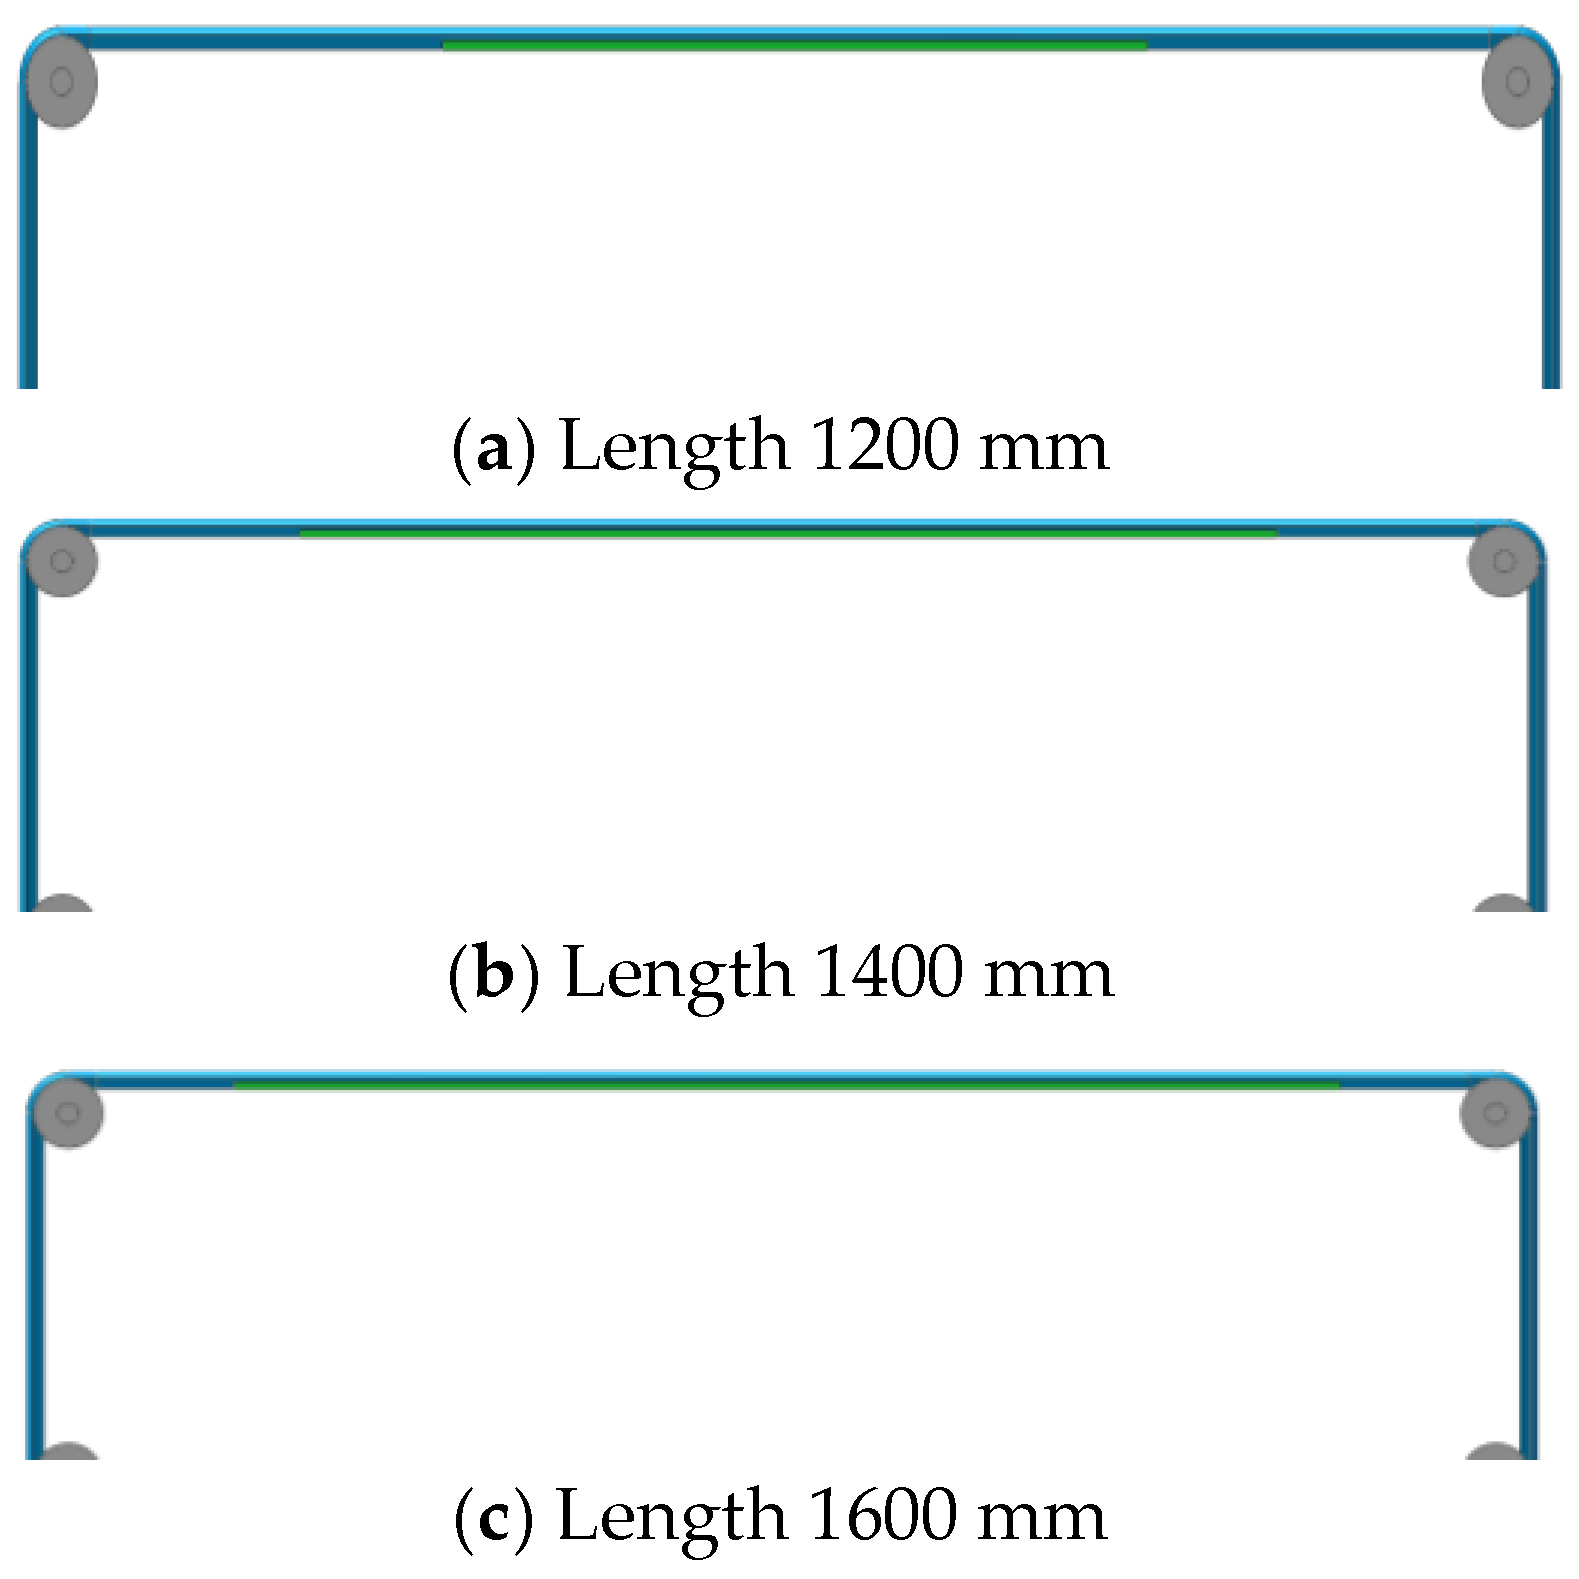
2.8.3. Fixture Length Optimization

The fixed device located beneath the belt plays a crucial role in effectively suppressing the lateral vibration of the belt. The addition of a fixed device beneath the drive belt results in a significant reduction in the amplitude of lateral vibration. The varying lengths of the fixed devices lead to differing levels of vibration suppression in the belt. Five sets of repeated experiments were carried out under the following conditions: an initial tension of 520 N/mm, a transmission shaft speed of 60 min−1, a transmission mechanism deflection angle of 5°, and an overall machine size of the transmission mechanism measuring 2200 mm. The average value was calculated to determine the lateral vibration displacement at the midpoint of the working surface end of the belt drive. Subsequently, the ulation results corresponding to different lengths of the fixed device were compared, as shown in Figure 12.

3. Results and Discussion

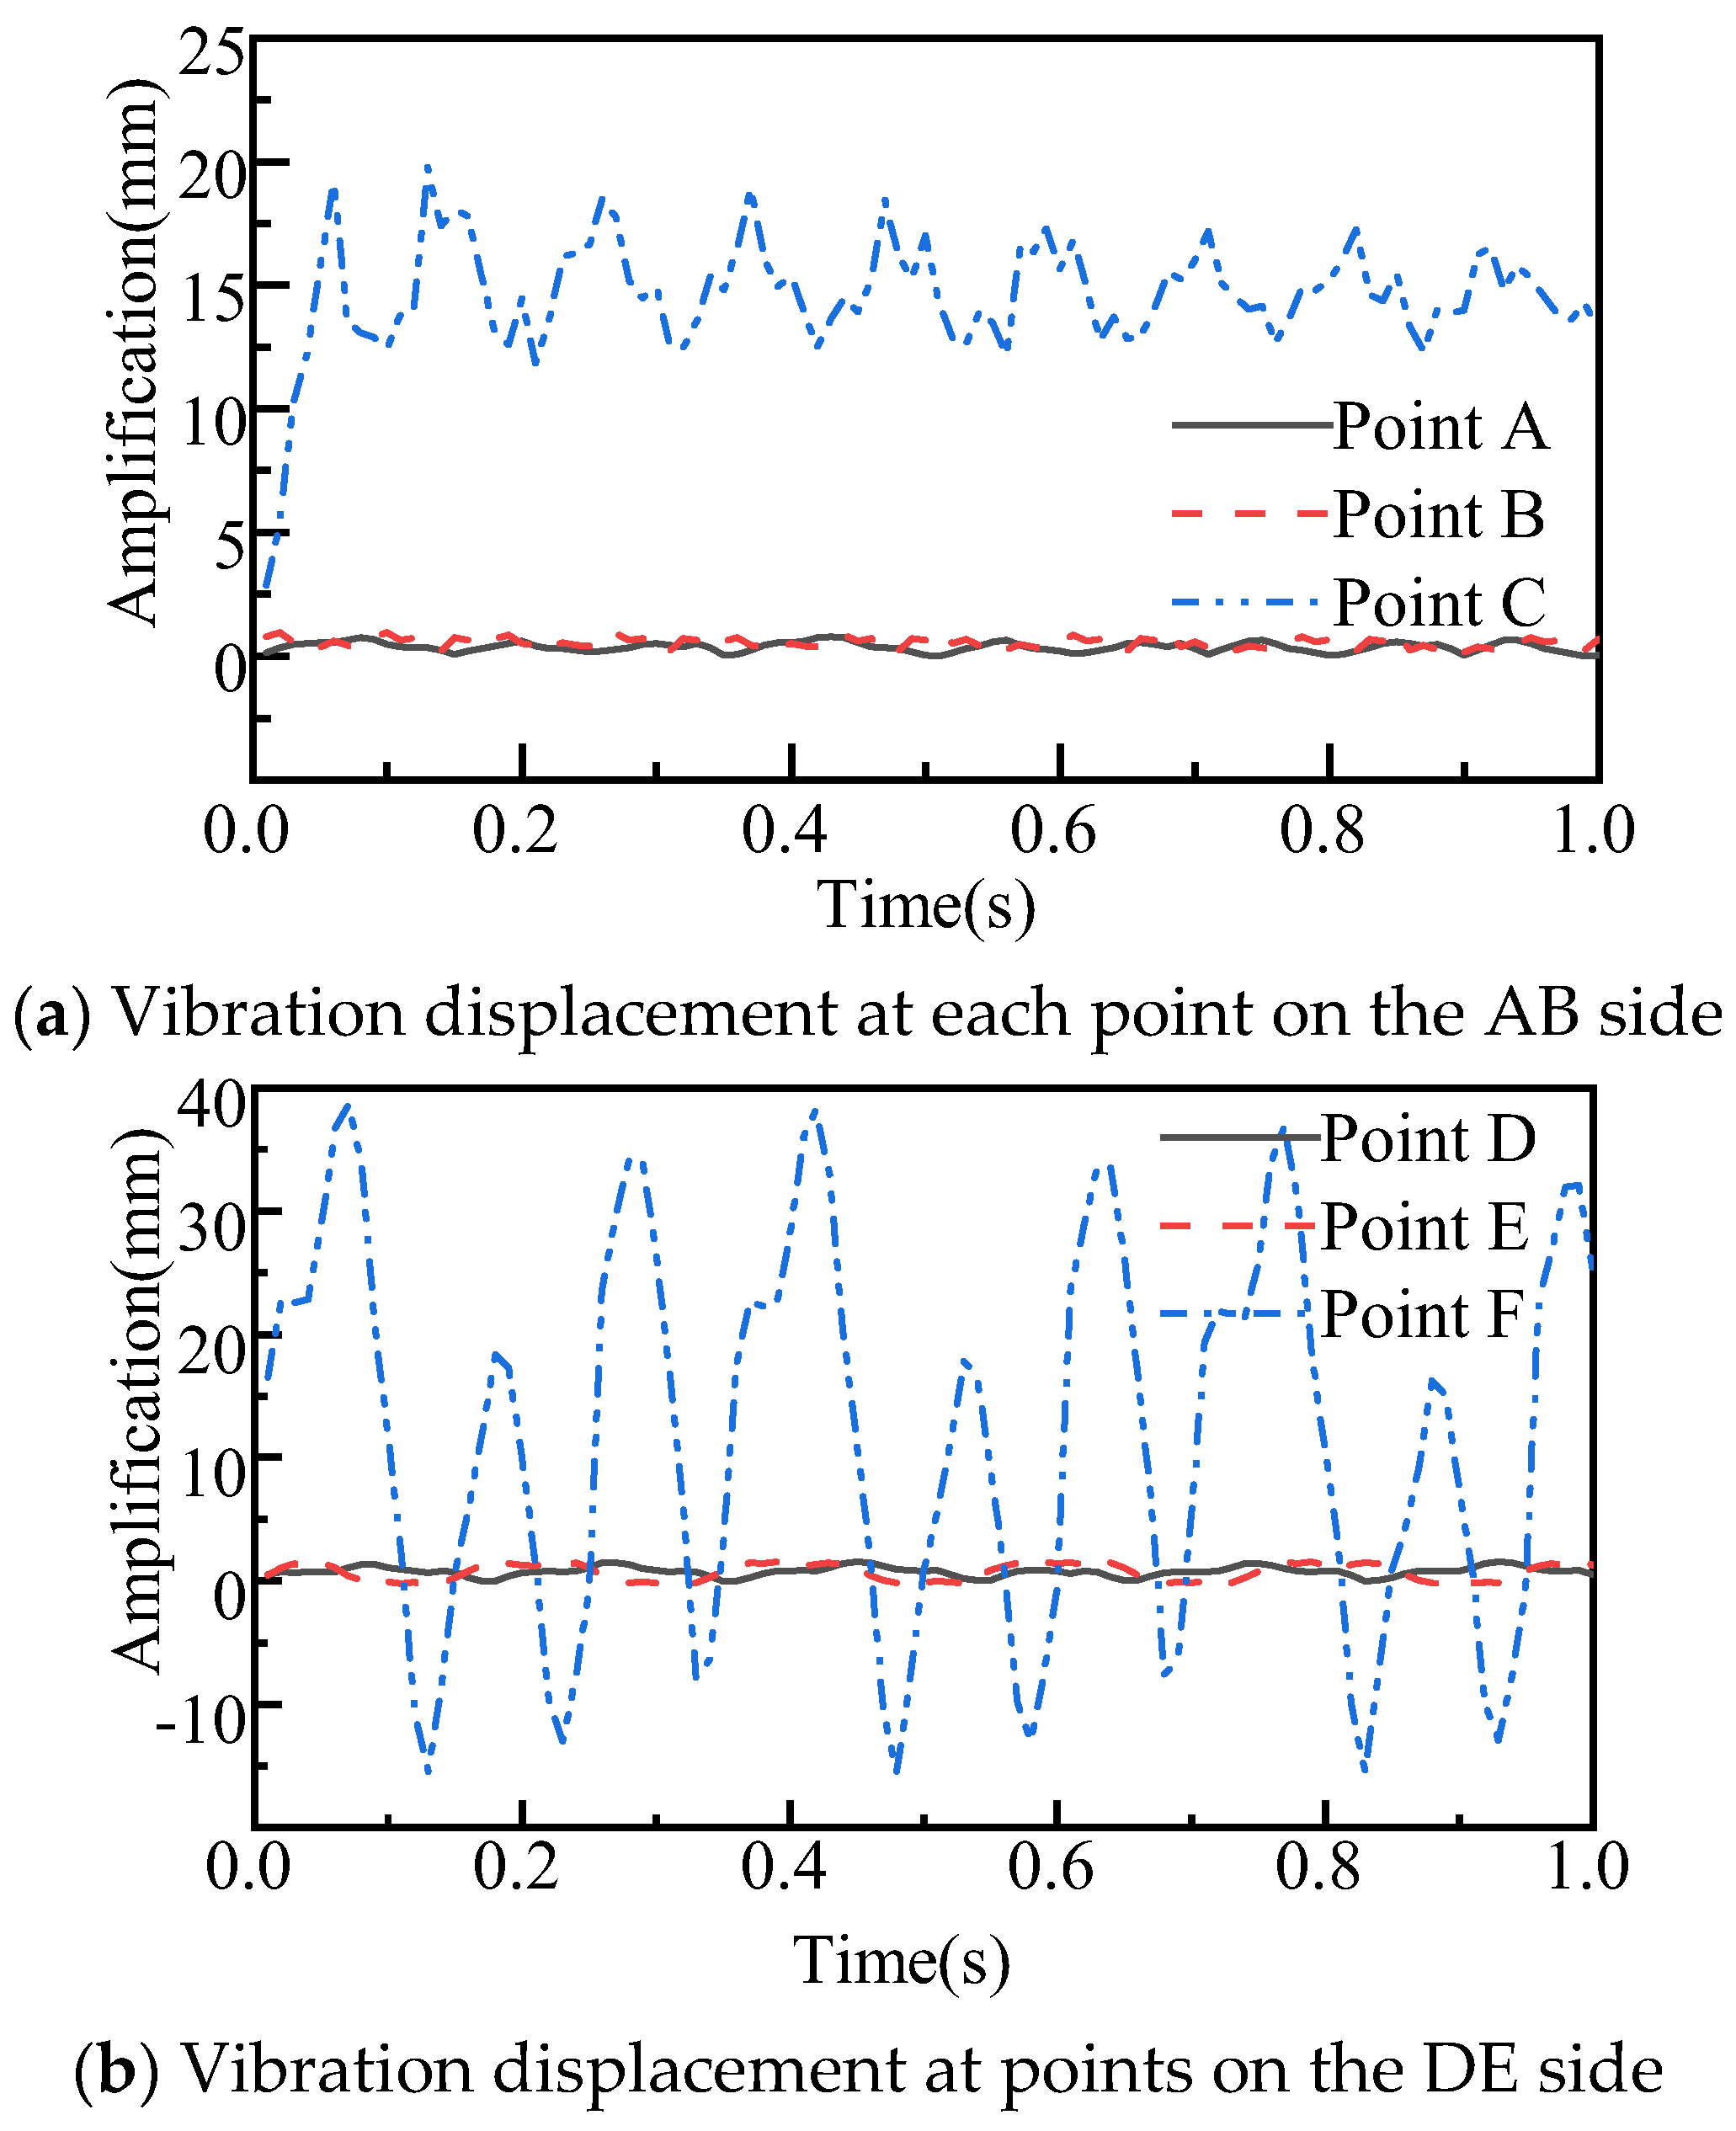
3.1. Belt Drive Simulation

In the original belt drive model, the fixtures of the flexible belt are retained, as depicted in Figure 6. The overall machine dimension is 2000 mm, and the maximum deflection angle of the belt is 5.5°. The rotational speed of the driving pulley is specified as 120 min−1, and an initial tension of 370 N is exerted on the flat belt. Once the simulation commences, the amplitudes of the belt displacements measured at various positions on the outermost belt are collected for analysis.
It can be observed from Figure 13 that during the operation of the dynamic simulation model of the staged flat belt, the lateral vibration displacement at the midpoint of the DE edge of the belt is less than that at the midpoint of the AB edge. This is because there is a fixing device beneath the DE edge, which can constrain the vibration of the belt, resulting in a relatively small vibration amplitude. However, for the AB edge, since there is no fixing device, the vibration amplitude is larger.
It can be discerned from Figure 14 that during the operation of the dynamic simulation model of the graded flat belt without a fixing device, the lateral vibration displacement of the AB side of the belt is commonly smaller than that of the DE side. This is due to the fact that the belt tension on the DE side drops to the minimum, leading to a relatively larger vibration amplitude.
It can be deduced from Figure 13 and Figure 14 that during the operation of the dynamic simulation model for the graded flat belt, the lateral vibration displacements at all positions of the AB and DE ends are substantially smaller than those at the midpoint and display periodic fluctuations. Moreover, the average lateral vibration displacement at the middle position of the belt is significantly larger, with a notably wider fluctuation range. In the model with fixed devices, the maximum vibration displacement at the midpoint of the AB end is 17.4 mm, while that at the midpoint of the DE end is 2.19 mm. In contrast, in the model without fixed devices, the maximum vibration displacement at the midpoint of the AB end increases to 19.18 mm, and the displacement at the midpoint of the DE end rises significantly to 38.64 mm. Compared to the belt with fixed devices, the lateral vibration displacement in the model without fixed devices is markedly greater. Consequently, to identify the optimal parameters of the graded belt, a dynamic simulation of the graded belt without fixed devices was performed, focusing primarily on the lateral vibration characteristics at the midpoint of the DE edge.

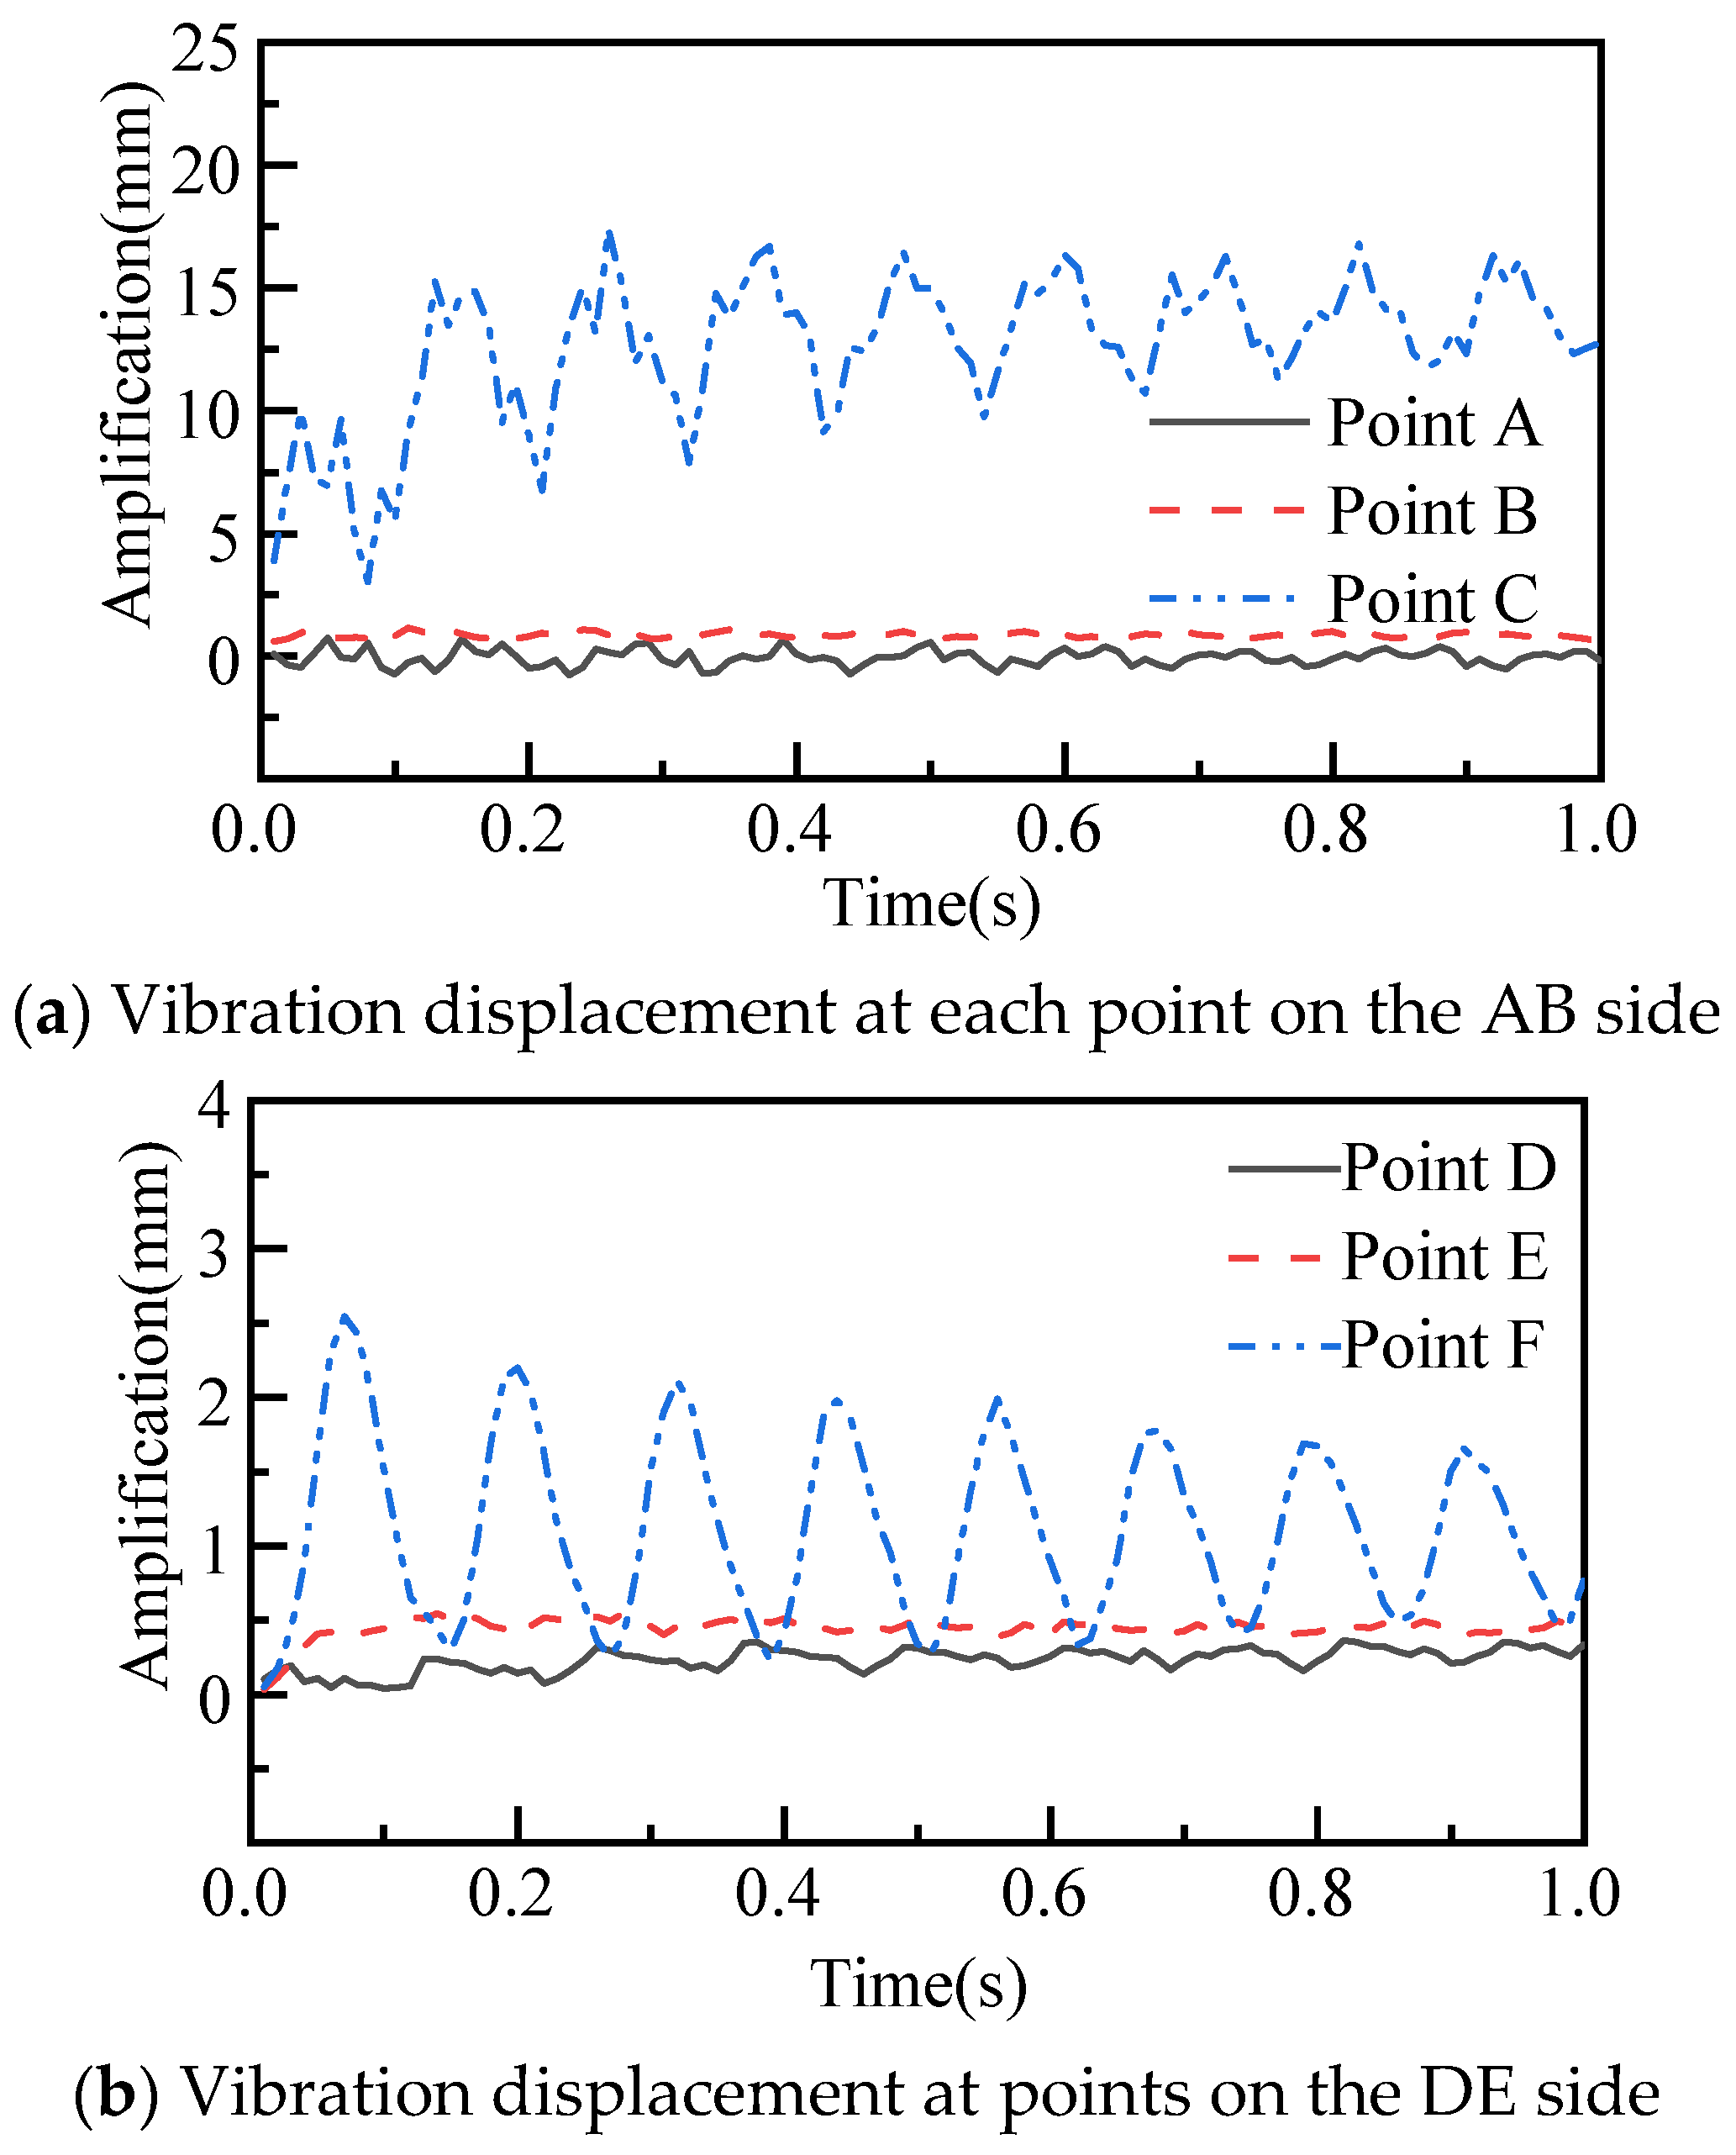
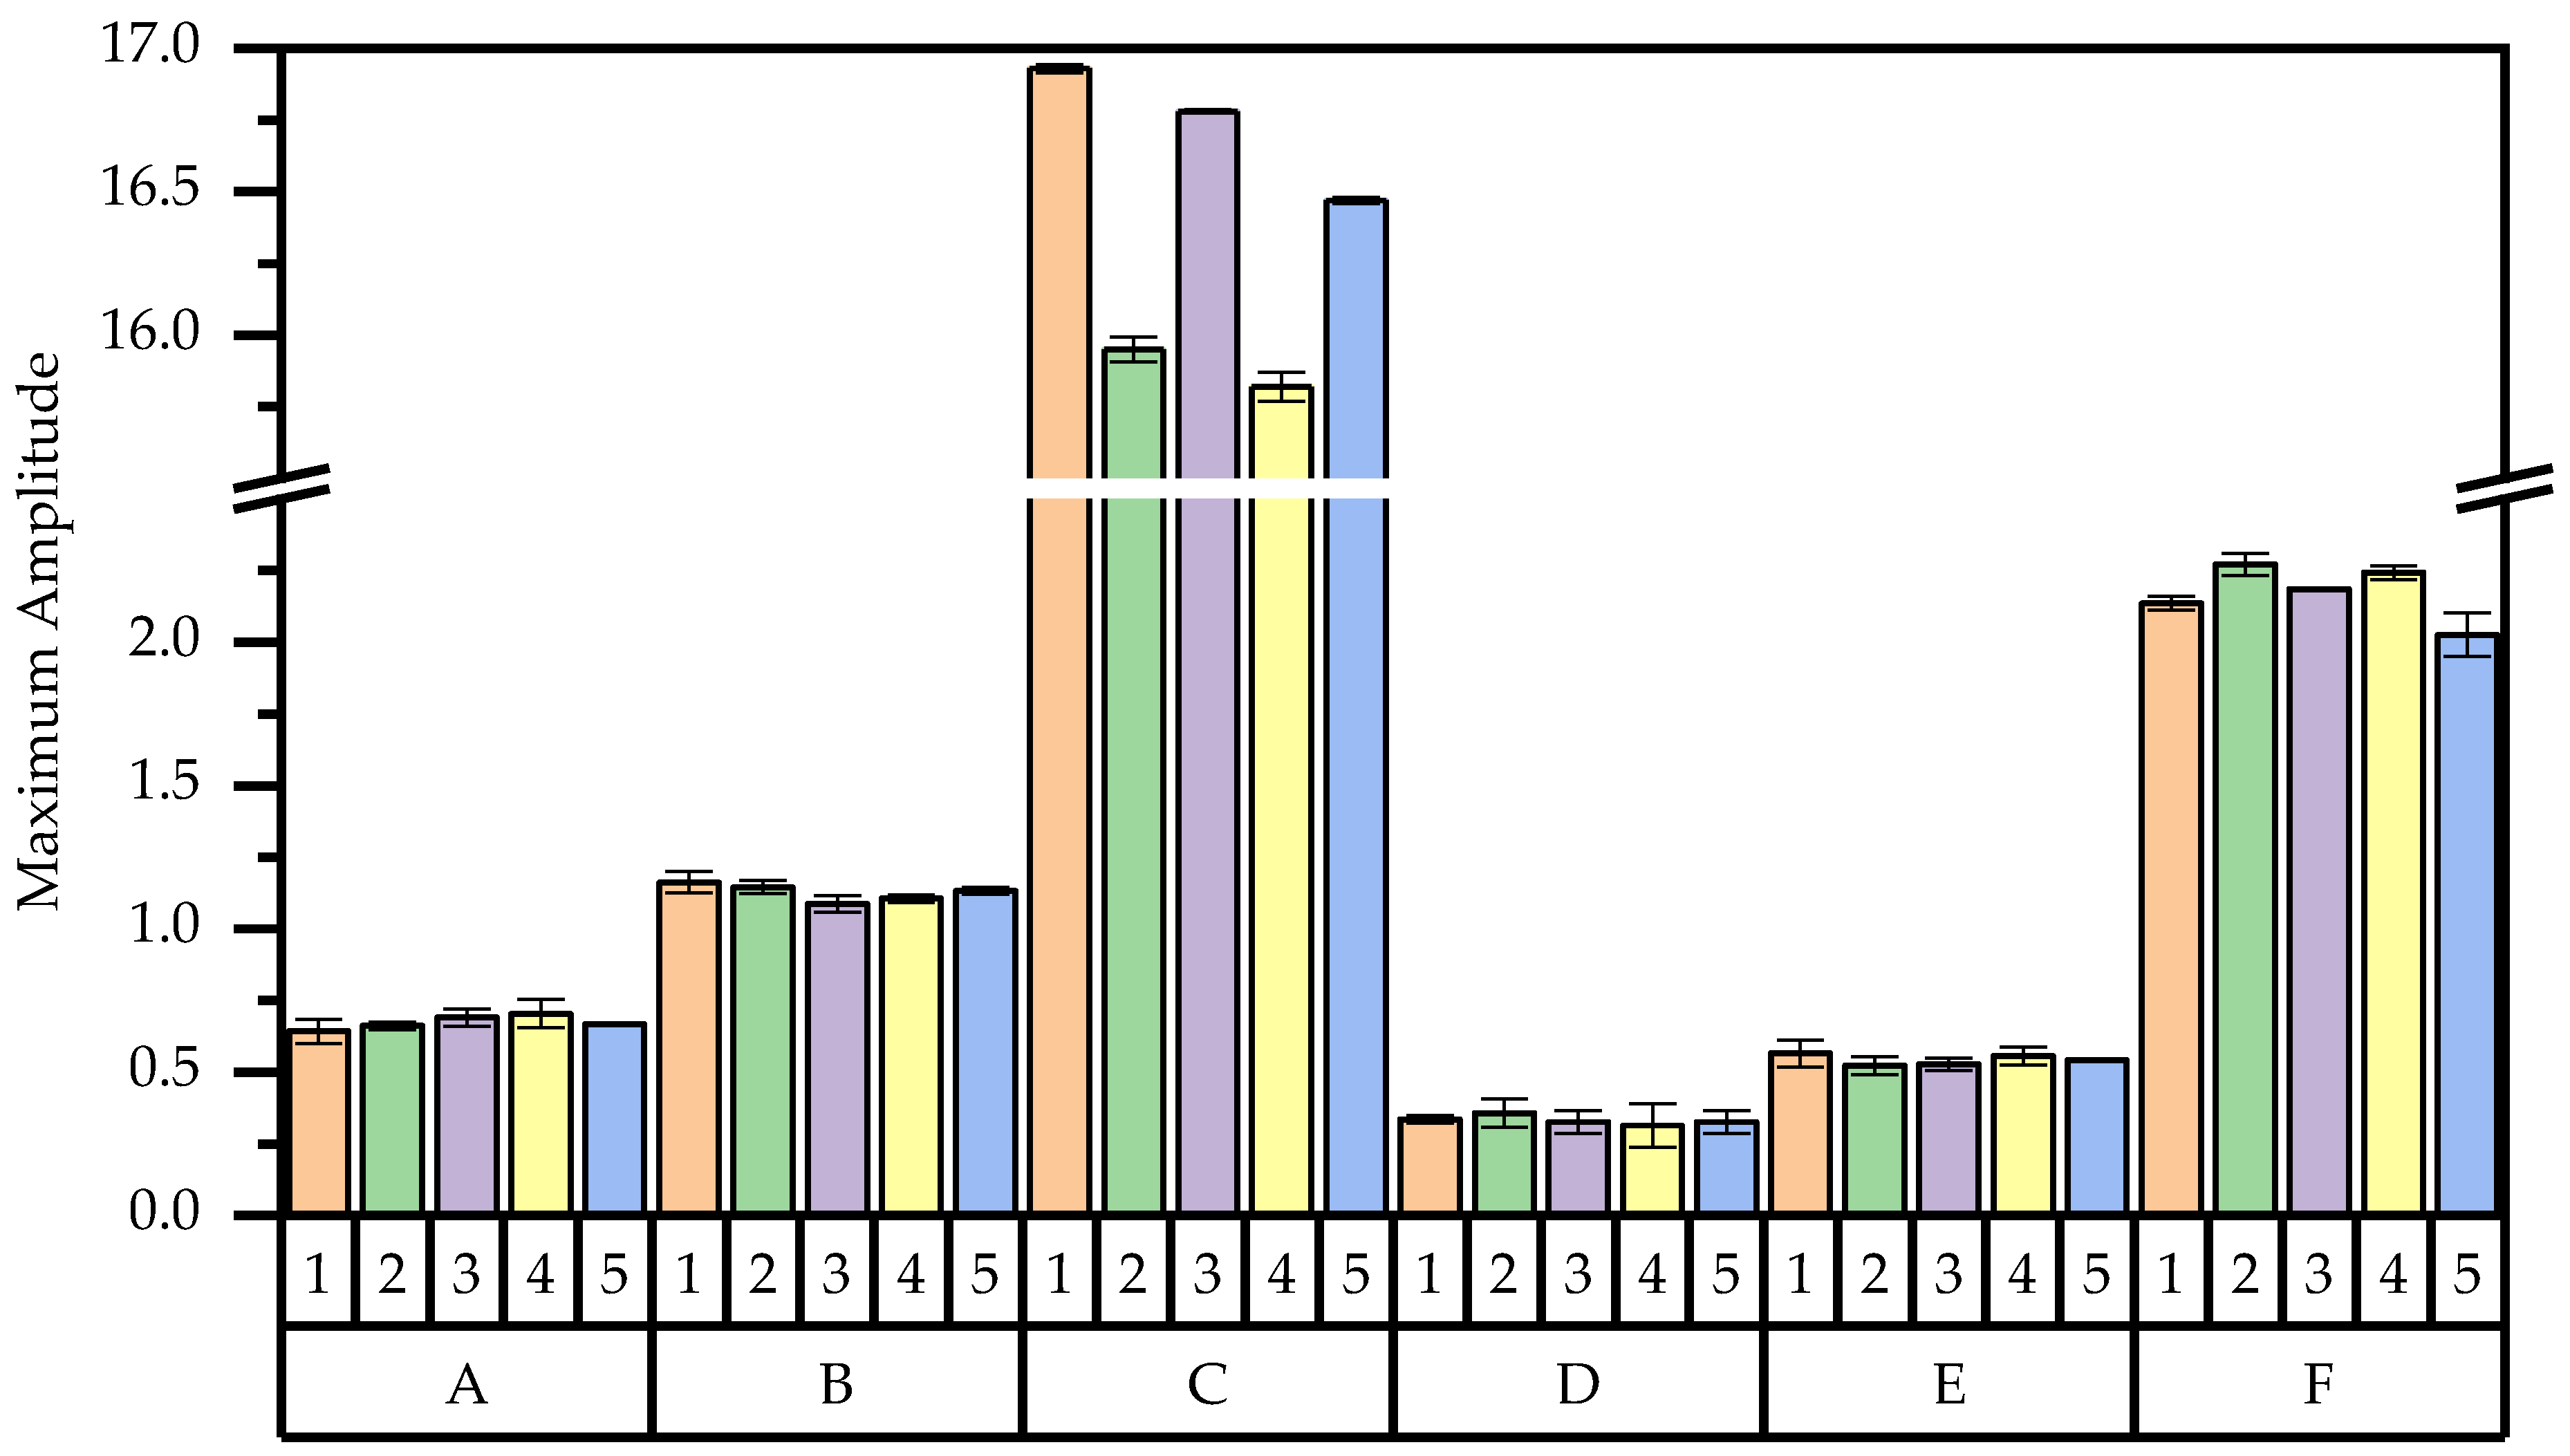
3.2. Experimental Results

Table 4 and Figure 15 summarizes the maximum amplitudes measured at various positions along the belt. Five sets of repeated experiments were performed, and the average values were calculated to determine the lateral vibration displacements at each position of the DE and AB sides of the belt drive. The experimental results were compared with the simulation results of the original belt drive model and analyzed graphically. It was found that the maximum amplitude from the simulation results and the maximum amplitude from the actual measurements were both consistently stable within the same range. As shown in the figure, 93% of the maximum amplitude error values are less than 5%, and the calculated average error is 3%. Based on these results, it can be concluded that the established dynamic model demonstrates high reliability.

3.3. Single-Factor Analysis Results

To optimize the vibration characteristics of the belt transmission system, after removing the fixed devices of the graded belt, the lateral vibration characteristics of the flat belt under various operating conditions were investigated. Owing to the considerable number of belts, the midpoint of the outermost belt with the maximum deflection angle was chosen for the study. Through the previous simulation analysis, the reasonable ranges of each factor were determined.

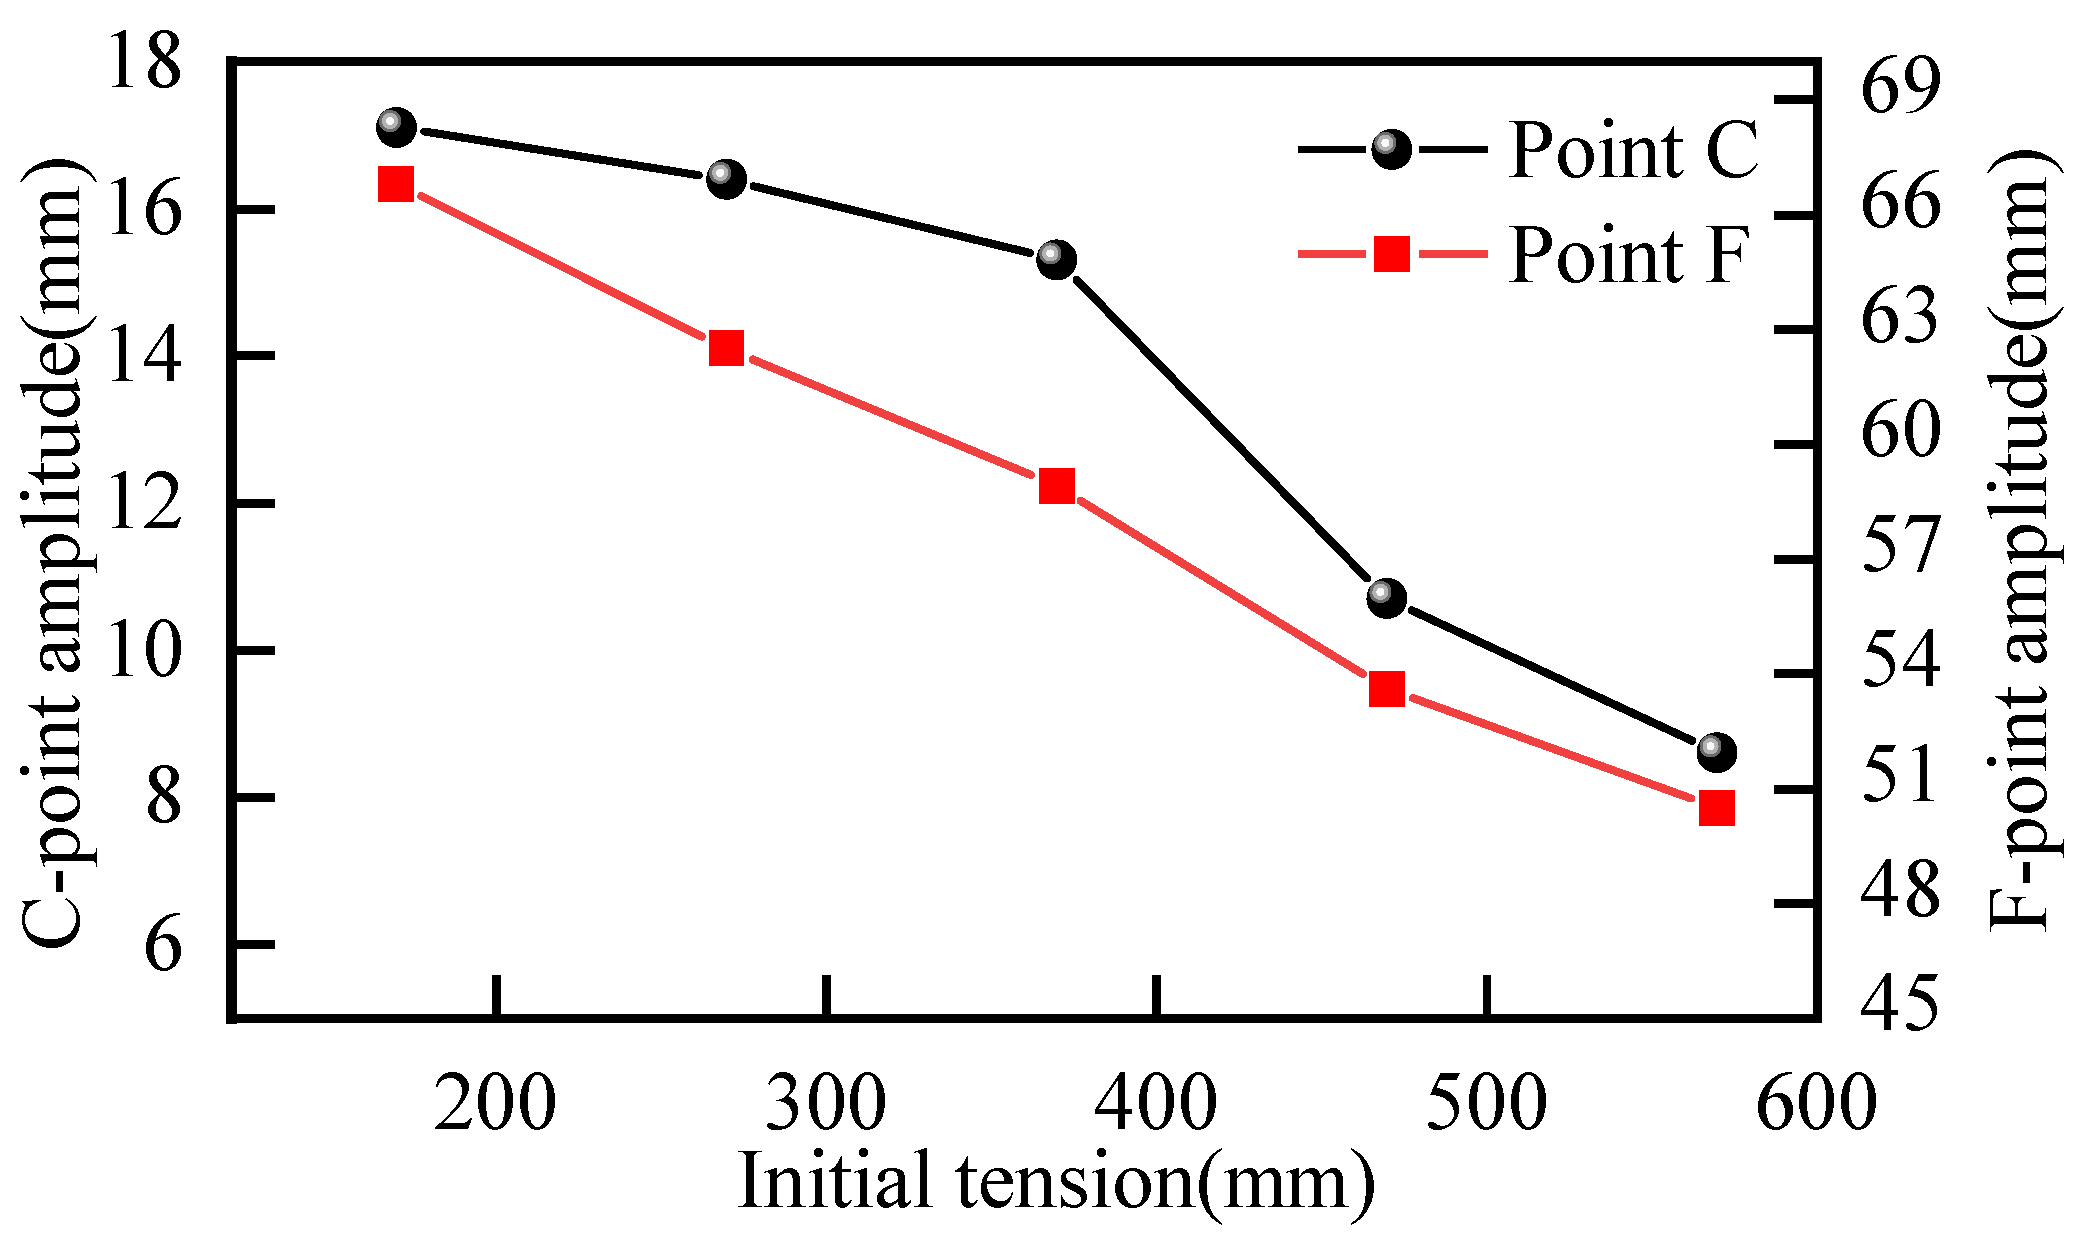
3.3.1. Analysis of Transverse Vibration Displacement Under Various Initial Tension Conditions

Figure 16 depicts the changes in the displacement amplitudes of the midpoint F of side DE and the midpoint C of side AB when the initial tension gradually increases from 170 N to 570 N under the circumstances where the overall machine size is 2000 mm, the maximum deviation angle of the belt is 5.5°, and the rotational speed of the driving wheel is 120 min−1.
It can be observed from the figure that with the increase in the initial tension, the maximum vibration displacements of point F, the midpoint of side DE, and point C, the midpoint of side AB, keep decreasing. When the initial tension is within the range of 370 to 570 N, the maximum vibration displacements of points C and F exhibit a distinct downward trend. Consequently, the initial tension range of the belt is selected to be from 370 to 570 N.

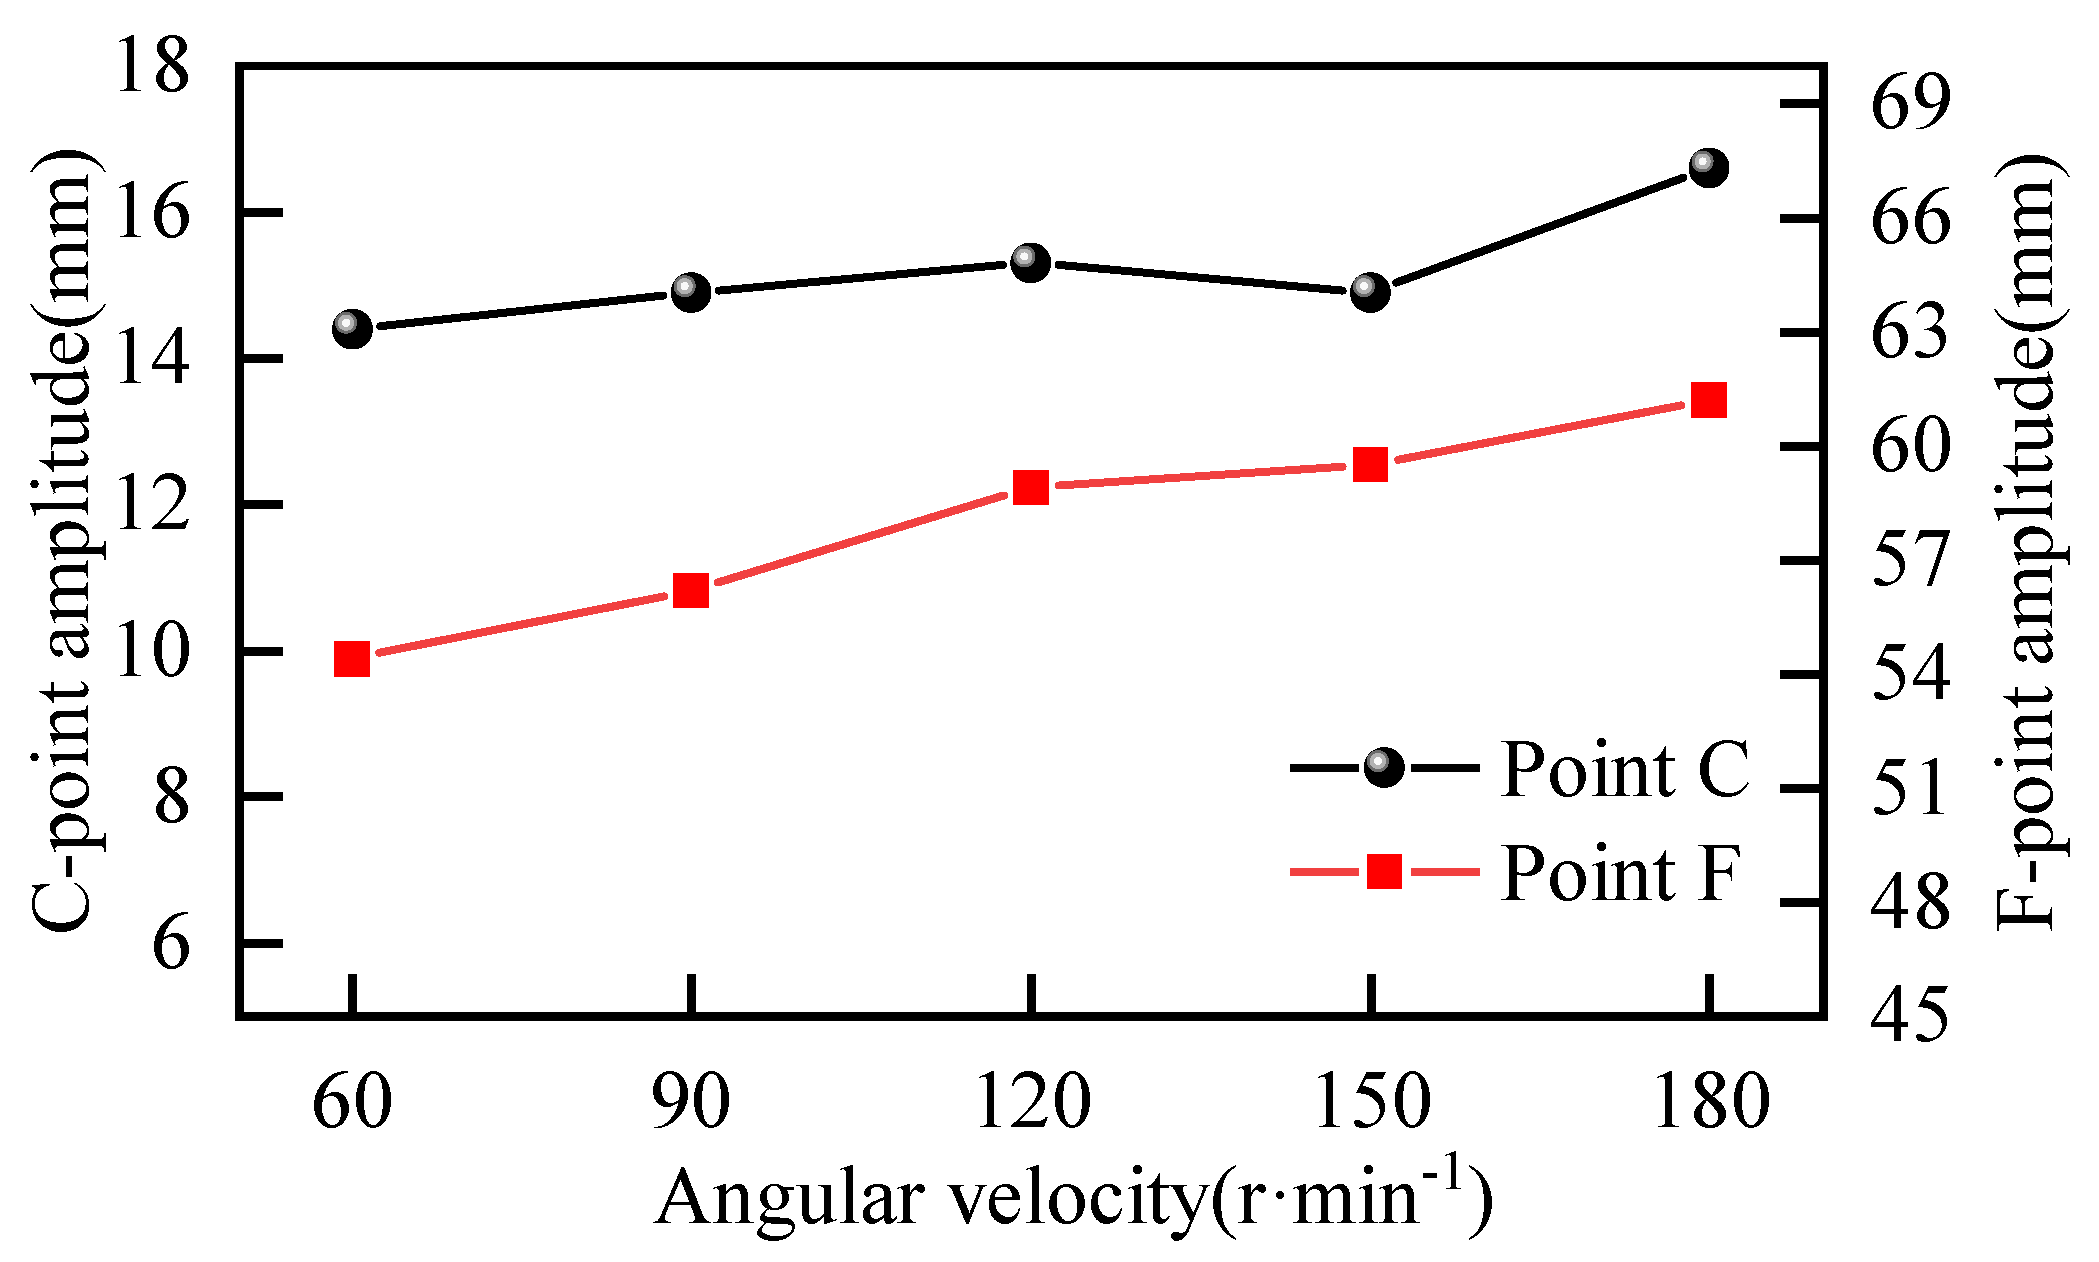
3.3.2. Analysis of Lateral Vibration Displacement Under Different Speed Conditions

Figure 17 presents the changes in the displacement amplitudes at the midpoint F of side DE and the midpoint C of side AB as the rotational speed of the driving wheel gradually rises from 60 min−1 to 180 min−1, under the circumstances where the overall machine size is 2000 mm, the maximum deviation angle of the belt is 5.5°, and the initial tension is 370 N.
It can be observed from the figure that with the increase in rotational speed, the maximum vibration displacement of point F, the midpoint of side DE, and point C, the midpoint of side AB, exhibits an upward tendency. Hence, in combination with the sorting effect of wolfberries, the working range of rotational speed should be no greater than 120 min−1.

3.3.3. Analysis of Lateral Vibration Displacement Under Different Skew Angle Conditions

Figure 18 presents the alterations in the displacement amplitudes of point F, the midpoint of side DE, point C, and the midpoint of side AB, when the maximum deviation angle of the belt escalates from 4° to 6°, under the circumstances where the initial tension is 370 N and the rotational speed of the driving wheel is 120 min−1.
It can be discerned from the figure that with the augmentation of the deviation angle, the maximum vibration displacement of the midpoint F of side DE and the midpoint C of side AB exhibits a trend of initially decreasing and then increasing. When the maximum deviation angle of the belt is 5°, the amplitudes of the midpoint F of side DE and the midpoint C of side AB are at their minimum. Hence, the range of the maximum deviation angle of the belt is selected to be from 4.5° to 5.5°.

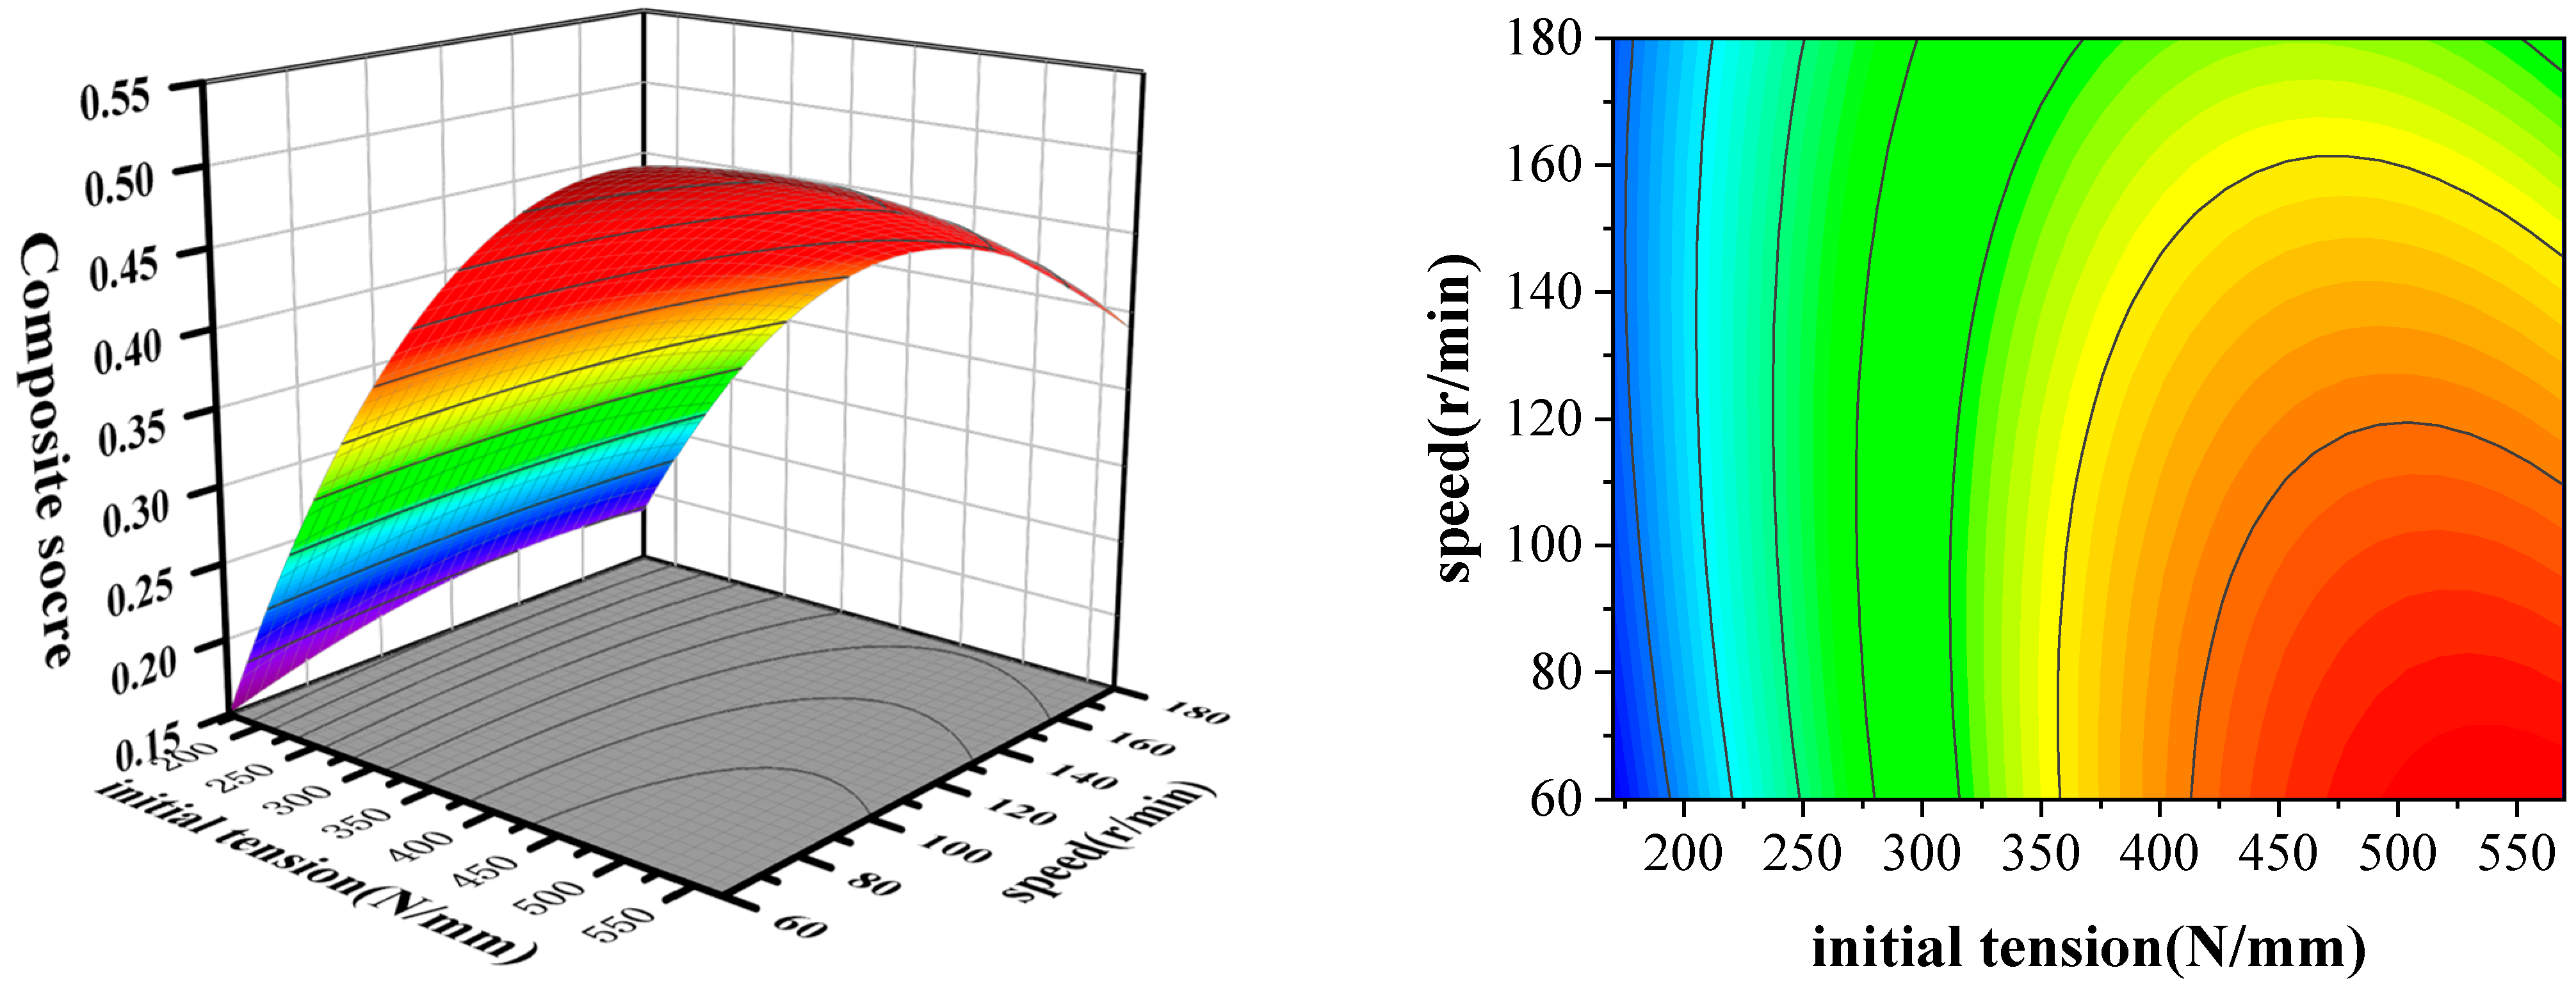
3.4. Response Surface Analysis Results

Using Design Expert 13 software, a quadratic polynomial fitting is performed to obtain the regression model equation [34,35].
G = 10.9 + 9.3 × 10 3 A + 4 × 10 3 B + 3.6 C 4 × 10 6 A B 1.2 × 10 3 A C 3.7 × 10 4 B C 2.8 × 10 6 A 2 4.9 × 10 6 B 2 0.3 C 2
As shown in Table 5, the model has a p value less than 0.01, which is extremely significant, and the lack-of-fit term is not significant, indicating that the model has a good fit. The coefficient of determination R2 is 0.9797, and the adjusted coefficient of determination R2 is 0.9536. The initial tension A has a highly significant effect on the transverse vibration displacement at the midpoint of the loose edge (p < 0.01), and the deflection angle has a significant effect (p < 0.01); its analysis by Design Expert software shows that the working condition conditions for the minimum amplitude of transverse vibration are the initial tension of 520 N/mm, the rotation speed of the drive shaft of 60 min−1, and the deflection angle of the drive mechanism of 5°.
The response surface analysis was conducted using the data processing module of Design-Expert software to evaluate the interaction effects of initial tension (A), rotational speed (B), and bias angle (C) on the comprehensive score of the vibration amplitude of the grading flat belt. The interaction effects of the factors on the comprehensive score are shown in Figure 19, Figure 20 and Figure 21.

3.5. Analysis of the Results of Structural Optimization Design

3.5.1. Response Analysis Results

The harmonic response simulation analysis of the belt drive system in the fresh wolfberry sorting machine was performed using the mode superposition method. Figure 22 presents the frequency–response curve of the lateral vibration for the belt drive system with a fixed classification device within the 0–20 Hz range. Experimental results indicate that an excitation frequency of 4 Hz induces a resonance peak of 0.33 mm, while an excitation frequency of 8 Hz induces a resonance peak of 0.42 mm. This occurs because the excitation frequency approaches the natural frequency of the graded belt. Lateral vibration of the graded belt is significantly intensified only when the excitation frequency couples with its natural frequency. Consequently, severe resonance responses are observed at excitation frequencies of 4 Hz and 8 Hz.

3.5.2. Belt Pulley Optimization Results

Five sets of repeated experiments were performed under the following operating conditions: an initial tension of 520 N/mm, a transmission shaft rotational speed of 60 min−1, a transmission mechanism deflection angle of 5°, and an overall length of the transmission mechanism of 2200 mm. The average lateral vibration displacement at point F of the belt drive was calculated, and the simulation results for the right-angle pulley and the rounded pulley were compared, as shown in Table 6.
It can be known from the experiments that when R = 10 mm, the comprehensive performance is optimal (the simulation reduction is greater than 68% and the deviation amount is less than 0.4 mm). In order to realize the synergy of stress distribution optimization and deviation suppression, a gradient fillet design is employed for the edge of the pulley. At the root of the pulley near the hub side, a larger fillet radius (12 mm) is employed to alleviate contact stress concentration and effectively distribute impact energy. At the top of the pulley near the rim, a smaller fillet radius (10 mm) is employed to limit the lateral displacement of the belt and ensure the stability of the transmission system.

3.5.3. Optimum Fixture Length

Dynamic simulations were conducted under four distinct working conditions of the fixed devices. The lateral vibration amplitudes at each point on the DE side belt for different lengths were compared, aiming to investigate the influence rule of the fixed device length on the belt’s vibration characteristics.
As presented in Table 7, adjusting the length of the fixed device leads to a reduction in the transverse vibration of the belt. Specifically, when the overall size of the transmission mechanism is 2200 mm, the amplitude attenuation rate reaches its maximum value when the total length of the fixed device is set to 1600 mm. In cases where the size of the transmission mechanism varies, it is necessary to conduct a specific analysis to determine the optimal length of the fixed device.

4. Conclusions

(1)
To address the vibration issue of the transmission belt in the fresh wolfberry sorting machine, the lateral vibration theory was employed to develop relevant models and derive theoretical formulas. The analysis revealed that the primary factors influencing lateral vibration are initial tension, rotational speed, and center distance.
(2)
The feasibility of the model was validated through field experiments. The average error between the maximum amplitude in the simulation results and the actual measured maximum amplitude was 3%, indicating that the established dynamic model is reliable.
(3)
Based on the single-factor experiments, the response surface methodology (RSM) was employed to optimize the grading flat belt of the wolfberry sorter. The factors influencing the lateral vibration of the grading flat belt were ranked in descending order of their comprehensive impact as follows: initial tension > bias angle > rotational speed. In this study, a quadratic polynomial regression model to obtain a comprehensive score was established through response surface experiments. The results indicate that the lateral vibration displacement is minimized when the initial tensile force is 520 N/mm, the rotational speed of the transmission shaft is 60 min−1, and the deflection angle of the transmission mechanism is 5°.
(4)
Under the working conditions of an initial tension of 520 N/mm, a transmission shaft speed of 60 r/min, a transmission mechanism deflection angle of 5°, and a belt center distance of 2200 mm, harmonic response analysis was performed using the modal superposition method. Significant resonance responses were observed at excitation frequencies of 4 Hz and 8 Hz. Under these conditions, both the pulley structure and the fixing device were optimized. When the fillet radius of the pulley was set to 10 mm and the length of the fixing device was adjusted to 1600 mm, the lateral vibration of the belt was minimized, thereby reducing the impact of lateral vibration and improving the reliability of the goji berry sorter.
This article presents a dynamic analysis of general transmission systems based on a dynamic simulation model. However, the results obtained from this model still exhibit significant discrepancies compared to real-world conditions. Subsequently, an investigation into the vibration characteristics during the fresh wolfberry screening process will be carried out. This aims to refine the simulation model for better alignment with real-world conditions and enhance the precision of the acquired data. Simultaneously, in partnership with wolfberry processing enterprises, the virtual prototype model will be further refined and enhanced by integrating experimental and field data. Through the iterative optimization approach of “simulation–experimentation–enhancement”, the engineering applicability of the model will be significantly improved, thereby offering more precise theoretical guidance for the design and performance optimization of the transmission system in fresh wolfberry sorting machines.

Author Contributions

Conceptualization, Y.Y. and Z.S.; methodology, Y.Y.; software, Z.S.; validation, Y.Y. and Z.S.; formal analysis, J.Z.; investigation, J.L.; resources, W.Q.; data curation, J.L.; writing—original draft preparation, J.Z.; writing—review and editing, Z.S.; visualization, Z.S.; supervision, W.Q.; project administration, Y.Y. All authors have read and agreed to the published version of the manuscript.

Funding

This research was funded by the Key Research and Development Program of Shaanxi Province (2018GY-077), Shaanxi Province Qin Chuang Yuan Science and Technology Innovation Special Project (2021ZDZX-GY-0006).

Institutional Review Board Statement

Not applicable.

Informed Consent Statement

Not applicable.

Data Availability Statement

Data are contained within the article.

Conflicts of Interest

The authors declare no conflicts of interest.

References

  1. Zhang, Y.; Li, X.; Gao, S. Design and test of roller-type nylon brush potato cleaning and grading machine. Agric. Mech. Res. 2021, 43, 152–155+160. [Google Scholar]
  2. Liu, X. A new type of wolfberry sieving machine based on TRIZ innovation method. Sci. Technol. Innov. Appl. 2018, 15, 30–31. [Google Scholar]
  3. Laykin, S.; Alchanatis, V.; Fallik, E.; Edan, Y. Image–processing algorithms for tomato classification. Trans. ASAE 2002, 45, 851. [Google Scholar] [CrossRef]
  4. Heinemann, P.H.; Pathare, N.P.; Morrow, C.T. An automated inspection station for machine-vision grading of potatoes. Mach. Vis. Appl. 1996, 9, 14–19. [Google Scholar] [CrossRef]
  5. ElMasry, G.; Cubero, S.; Moltó, E.; Blasco, J. In-line sorting of irregular potatoes by using automated computer-based machine vision system. J. Food Eng. 2012, 112, 60–68. [Google Scholar] [CrossRef]
  6. Li, J.; Cao, W. Research and analysis of synchronous belt drive performance of intelligent terminal lifting and lowering integrated machine. Mech. Des. Manuf. Eng. 2023, 52, 115–120. [Google Scholar]
  7. Gou, H.; Yan, H.; Zhao, T.; Ban, X.; Meng, X.; Bao, Y. Dynamic response of high-speed train-track-bridge coupled system under combined wind and snow. Struct. Infrastruct. Eng. 2025, 21, 695–709. [Google Scholar] [CrossRef]
  8. Qin, S.A.; Zhou, P.; Zhou, Y.J.; Jiang, H.Y. Overview of the development status of belt drive industry. Mech. Drive 2020, 44, 8. [Google Scholar]
  9. Zhu, S.M.; Lu, S.M.; Yu, Y.D.; Guo, Y.F. Current status and prospects of belt drive theory and technology. Mech. Drive 2007, 31, 92–96. [Google Scholar]
  10. Wu, Y.Z. Research progress of new products of transmission belt. Mech. Transm. 2013, 37, 4–9. [Google Scholar]
  11. Yu, D.Z.; Yi, X.G.; Xin, C. Study of flat belt drive mechanics. Key Eng. Mater. 2009, 419–420, 265–268. [Google Scholar]
  12. Piotr, K.; Łukasz, W.; Grzegorz, D.; Matijošius, J. Development trends in belt transmissions with V-belt. MATEC Web Conf. 2022, 357, 01003. [Google Scholar]
  13. Yu, Y.; Ren, S.M.; Wei, Y.X.; Zhang, Z.L. Design of variable pitch type fresh wolfberry grader based on EDEM. Arid Reg. Agric. Res. 2023, 41, 266–273. [Google Scholar]
  14. Wei, M.Z. Analysis on skew of flat belts in two-pulley drives. J. Mech. Des. 2011, 133, 111001. [Google Scholar]
  15. Gong, S.M. Experimental Dynamics Analysis of Transverse Vibration of Drive Belt System. Master’s Thesis, Beijing Institute of Technology, Beijing, China, 2014. [Google Scholar]
  16. Xu, L.H. A graphical study of force relations in belt drives. Mech. Drive 2006, 30, 35–36. [Google Scholar]
  17. Li, X.X. Research on Reliability Analysis Method of Belt Drive Vibration Characteristics and Surface Defects. Master’s Thesis, Harbin University of Commerce, Harbin, China, 2022. [Google Scholar]
  18. Kou, B.; Liu, Q.; Li, N. Research on transverse vibration characteristics of rope change device with clamping chain transmission in lifting system. J. Vibroeng. 2017, 19, 894–907. [Google Scholar] [CrossRef]
  19. Zhu, H.; Zhu, W.D.; Fan, W. Dynamic modeling, simulation and experiment of power transmission belt drives: A systematic review. J. Sound Vib. 2021, 491, 115759. [Google Scholar] [CrossRef]
  20. Li, J.F. Research on the Vibration and Noise of Synchronous Belt Drive of Intelligent Terminal Lifting and Lowering Machine. Master’s Thesis, Yancheng Institute of Technology, Yancheng, China, 2023. [Google Scholar]
  21. Piotr, B.; Lech, G.; Robert, K.; Ozdoba, M. Models of transverse vibration in conveyor belt—Investigation and analysis. Energies 2021, 14, 4153. [Google Scholar] [CrossRef]
  22. Li, Z.G.; Chen, G.P.; Shi, Y.C. Experimental study on the smoothness of automotive synchronous belt drive. J. Shaoyang Univ. 2020, 17, 30–36. [Google Scholar]
  23. Zhu, H. Research on Nonlinear Vibration and Parameter Optimisation of Engine Front End Accessory Drive System. Master’s Thesis, Chongqing University, Chongqing, China, 2017. [Google Scholar]
  24. Nie, W.; Zheng, D. An approach of FEM analysis of the influence of pretension on the transverse vibration of belt drive. J. Phys. Conf. Ser. 2019, 1345, 032032. [Google Scholar] [CrossRef]
  25. Fujii, A.; Yonemoto, S.; Miyazaki, K.; Furumata, S.; Okuda, K.; Miyazawa, H. Analysis of the accessory belt lateral vibration in automotive engines. JSAE Rev. 2002, 23, 41–47. [Google Scholar] [CrossRef]
  26. Liu, Y. Recurdy Multibody Dynamics Simulation Basic Application and Improvement; Electronic Industry Press: Beijing, China, 2013. [Google Scholar]
  27. Li, T.T.; Guo, W.; Wang, C.C.; Zhang, X. Simulation and analysis of the dynamics of 2K-V reducer based on Recur Dyn. J. Eng. Res. Rep. 2024, 26, 60–68. [Google Scholar]
  28. Zhou, G.L.; Han, Z.H.; Guo, Y.C. Transverse vibration characteristics of conveyor belt based on Recur Dyn. J. Heilongjiang Univ. Sci. Technol. 2018, 28, 649–654. [Google Scholar]
  29. Sun, X.J.; Zhang, J.; Wang, Y. Dynamic simulation of Recur Dyn flat belt drive. J. Lanzhou Inst. Technol. 2012, 19, 36–39. [Google Scholar]
  30. Andrianov, V.I.; Horssen, V.T.W. On the transversal vibrations of a conveyor belt: Applicability of simplified models. J. Sound Vib. 2007, 313, 822–829. [Google Scholar] [CrossRef]
  31. Ma, D.Y.; Xiong, B.; Fang, F.T.; Pan, R.; Zhang, M. Simulation and analysis of Recur Dyn V-belt drive. Mech. Transm. 2014, 38, 118–122. [Google Scholar]
  32. Chen, N.X. Simulation Analysis and Experimental Research on the Performance of PM-Type Industrial Multiribbed Belt Drive; Changchun University of Science and Technology: Changchun, China, 2016. [Google Scholar]
  33. Xie, J.; Zhao, D.S.; Sha, H.Z.; Liang, J.T. Optimum design of toggle transmission system in double toggle mechanical press using response surface methodology combined with experimental design. Appl. Mech. Mater. 2011, 86, 858–862. [Google Scholar] [CrossRef]
  34. Wei, J.; Wang, E.J.; Wei, M.Q.; Zhang, X.J.; Chen, T.M. Optimisation of low temperature vacuum drying process of wolfberry based on response surface method. China Food Addit. 2024, 35, 138–145. [Google Scholar]
  35. Yu, Y.; Yu, M.Q.; Wang, E.J.; Chen, T. Optimisation and simulation of temperature field of wolfberry drying box. Food Mach. 2024, 40, 101–107+114. [Google Scholar]
Figure 1. Overall Structure of the Fresh Goji Berry Grading Machine: 1. Orientation Device; 2. Grading Belt; 3. Main Frame; 4. Pulley; 5. Large Fruit Discharge Unit; 6. Small Fruit Discharge Unit.
Applsci 15 06022 g001
Figure 2. Schematic diagram of the transmission mechanism.
Applsci 15 06022 g002
Figure 3. Schematic diagram of the belt deflection angle calculation.
Applsci 15 06022 g003
Figure 4. Schematic diagram of belt drive system.
Applsci 15 06022 g004
Figure 5. Vibration mechanical model.
Applsci 15 06022 g005
Figure 6. Schematic diagram of amplitude measurement points with fixtures.
Applsci 15 06022 g006
Figure 7. Schematic diagram of amplitude measurement points without fixtures.
Applsci 15 06022 g007
Figure 8. Variable pitch fresh goji berry grading machine.
Applsci 15 06022 g008
Figure 9. Testing process.
Applsci 15 06022 g009
Figure 10. Right-Angle Pulley.
Applsci 15 06022 g010
Figure 11. Round corner pulley.
Applsci 15 06022 g011
Figure 12. Fixtures of different lengths.
Applsci 15 06022 g012aApplsci 15 06022 g012b
Figure 13. Transverse vibration displacement at points with fixtures.
Applsci 15 06022 g013
Figure 14. Transverse vibration displacement at each point without fixtures.
Applsci 15 06022 g014
Figure 15. Vibration displacement at each position before and after optimization.
Applsci 15 06022 g015
Figure 16. Effect of initial tension on the amplitude of points C and F.
Applsci 15 06022 g016
Figure 17. Influence of rotational speed on the amplitude of points C and F.
Applsci 15 06022 g017
Figure 18. Effect of deflection angle on the amplitude of points C and F.
Applsci 15 06022 g018
Figure 19. Interaction effect of initial pull force and rotational speed on composite score.
Applsci 15 06022 g019
Figure 20. Interaction effect of initial tension and deflection on composite scores.
Applsci 15 06022 g020
Figure 21. Interaction effect of rotational speed and deflection angle on composite scores.
Applsci 15 06022 g021
Figure 22. Frequency-domain response graph.
Applsci 15 06022 g022
Table 1. Material Properties and Exposure Parameters.
NameDensityPoisson’s RatioYoung’s Modulus
Parameters1.15 g/cm30.4822 MPa
Damping coefficientStiffness coefficientDynamic friction coefficientStatic friction coefficient
1 × 10⁻⁴ N·s/mm1000 N/mm0.40.65
Table 2. Response surface test factors and levels.
LevelExperimental Factors
A Initial Pull/
(N)
B Rotation Speed
/(r·min−1)
C Declination
−1170604.5
03701205
15701805.5
Table 3. Box–Behnken test table.
Test NumberABCDE Edge AmplitudeAB Edge AmplitudeOverall Rating
110150.58.60.786
20−1154.414.40.571
311038.016.70.724
400040.319.20.6323
510−150.111.20.703
600036.513.20.766
7−10−189.817.80.199
80−1−159.411.40.600
9−11048.421.80.464
101−1027.814.30.8321
11−1−1044.122.60.421
1201−162.612.10.554
1300035.914.90.727
1401149.511.90.691
1500034.216.30.799
16−10166.817.10.469
1700038.714.10.732
Table 4. Capture point amplitude values.
PositionAmplitude Value (mm)
P0P1P2P3P4P5
A0.670.6420.6610.6900.7030.668
B1.121.1621.1451.0871.1051.133
C16.6716.9315.9516.7815.9316.47
D0.340.3350.3570.3260.3140.326
E0.540.5650.5230.5280.5570.541
F2.192.1352.2722.1862.2432.025
Table 5. Analysis of variance (ANOVA).
SourceSum of SquaresDegree of FreedomMean SquareF-Valuep-ValueSignificance
Mold0.393390.043737.500.0004***
A0.165910.1659142.360.0078***
B0.003210.00322.780.2694
C0.074310.074363.770.0064**
AB0.009110.00917.830.0266
AC0.059310.059350.880.0002**
BC0.000510.00050.41540.5398
A20.050910.050943.720.0003
B20.001310.00131.140.3214
C20.022910.022919.650.0030***
residual0.008270.0042
Misfit term0.005330.00612.520.1972
error term0.028040.0027
Note: “***” indicates highly significant differences (p < 0.01); “**” indicates significant (p < 0.05).
Table 6. Amplitude measurement results.
Radius of a Rounded Corner R (mm)Theoretical Reduction in AmplitudeF-Point Amplitude Simulation Reduced ValueBelt Deflection
00%2.1 mm0.67
958.2%0.9 mm0.45
1061.2%0.84 mm0.38
1165.4%0.78 mm0.59
1269.2%0.71 mm0.56
1372.6%0.67 mm0.58
Table 7. DE Edge Amplitude Measurements.
Serial NumberAmplitude and Decay Rate at Each Point
Point DAttenuation RatePoint FAttenuation RatePoint EAttenuation Rate
Length 1200 mm0.35 2.2 0.49
Length 1400 mm0.2917.1%2.085.5%0.3430.6%
Length 1600 mm0.2334.3%1.7520.45%0.2842.8%
Length 1800 mm0.3014.31.8715%0.3528.6%
Disclaimer/Publisher’s Note: The statements, opinions and data contained in all publications are solely those of the individual author(s) and contributor(s) and not of MDPI and/or the editor(s). MDPI and/or the editor(s) disclaim responsibility for any injury to people or property resulting from any ideas, methods, instructions or products referred to in the content.

